Embed Size (px)
Citation preview

Discussion Papers
Statistics NorwayResearch department
No. 687 •March 2012
Ådne Cappelen and Terje Skjerpen
Immigration to Norway 1969-2010Effects of policies and EEA membership
Discussion Papers No. 687, March 2012 Statistics Norway, Research Department
Ådne Cappelen and Terje Skjerpen
Immigration to Norway 1969-2010 Effects of policies and EEA membership
Abstract: We examine how changes to regulations and the economic conditions have influenced gross immigration to Norway from, in principle, all countries in the world during 1969– 2010. In line with existing studies of immigration we find that economic factors were important for immigration to Norway. Income differences between Norway and other countries have the expected impact, as do changes in income distributions. The labour market situation has also been important in that lower unemployment in Norway has resulted in higher immigration and higher unemployment in the country of origin has led to higher emigration to Norway. We find that immigration policies have largely had the expected effects. One example is the 1975 ‘immigration halt’ that did have a strong and long lasting effect on total immigration to Norway. Further tightening of the immigration regulations that came in 1977 also reduced immigration, while the more liberal policies introduced in 1981 contributed to higher immigration. From 2000 to 2010 several changes linked to the enlargement of EU influenced immigration to Norway. Norway’s membership in the European Economic Area (EEA) in 1994, and in the Schengen-area in 2001 resulted in higher immigration while the 2004 and 2007 EU enlargements also increased labour immigration to Norway substantially.
Keywords: Immigration, Immigration policies, Incentive variables
JEL classification: J11, J15
Acknowledgements: We would like to thank Norwegian Directorate of Immigration (UDI) for financial support, Jørgen Ouren for help with the data and Taryn A. Galloway, Eivind Hoffmann (at the UDI), Arvid Raknerud and Lars Østby for useful comments.
Address: Terje Skjerpen, Statistics Norway, Research Department, P.O. Box 8131, Dep. N-0033 Oslo Norway. E-mail: [email protected]
Ådne Cappelen, Statistics Norway, Research Department, P.O. Box 8131, Dep. N-0033 Oslo Norway. E-mail: [email protected]

Discussion Papers comprise research papers intended for international journals or books. A preprint of a Discussion Paper may be longer and more elaborate than a standard journal article, as it may include intermediate calculations and background material etc.
© Statistics Norway Abstracts with downloadable Discussion Papers in PDF are available on the Internet: http://www.ssb.no http://ideas.repec.org/s/ssb/dispap.html For printed Discussion Papers contact: Statistics Norway Telephone: +47 62 88 55 00 E-mail: [email protected] ISSN 0809-733X Print: Statistics Norway
3
Sammendrag
Innvandringen til Norge har økt gradvis og netto innvandringen har gjennomgående vært positiv og
økende siden 1970. Etter utvidelsen av EU i 2004 har innvandringen skutt fart og har svingt rundt
70 000 i senere år. På 1970-tallet iverksatte myndighetene tiltak for å dempe innvandringen til Norge.
På 1980-tallet var det en viss liberalisering igjen av politikken. Siden 1994 har endringen i innvand-
ringen blitt sterkt påvirket av Norges tilknytning til EU. I denne studien analyserer vi hvordan ulike
politiske tiltak og endringer i økonomiske omstendigheter har påvirket innvandringen til Norge. Tall
for brutto innvandring fra i prinsippet alle land i verden til Norge fra 1969 til 2010 studeres.
I økonomisk forskning om migrasjonsstrømmer finnes det en standardmodell for individers
flyttebeslutninger. Modellen vektlegger økonomiske forhold i hjemlandet sammenliknet med
forholdene dit man vurderer å flytte. Forskjeller i hva man vil tjene spiller en rolle, men også
mulighetene for å få seg arbeid dit man kommer betyr noe. Kostnadene ved å flytte og etablere seg
spiller åpenbart en rolle for om det er verd å flytte. Her kommer kulturelle og språklige forskjeller inn.
I noen sammenhenger har økonomiske forhold liten betydning for beslutningene fordi man flykter av
politiske grunner fra ett land til andre land, eller det kan være familiære bånd som motiverer flytting.
I tråd med mange studier av innvandring finner vi at økonomiske bakgrunnsvariabler har betydning for
innvandring til Norge. Inntektsforskjellene mellom Norge og utlandet inngår med det forventede
fortegnet og også forskjeller i fordelingen av inntekt spiller en rolle. Jo skjevere inntektsfordelingen i
Norge er sammenliknet med i opprinnelseslandet, jo større blir innvandringen. Også arbeidsmarkeds-
situasjonen i Norge har betydning. Er arbeidsløsheten i Norge lav, vil det komme flere til Norge. Vi
har kun data for arbeidsmarkedssituasjonen i noen av landene vi studerer, men for disse viser
resultatene at høyere ledighet i opprinnelseslandet øker innvandringen til Norge.
Vi finner også at mange innvandringspolitiske tiltak har hatt den forventede effekten. Det gjelder for
eksempel innvandringsstoppen som formelt ble innført i 1975. Vi har estimert at dette inngrepet hadde
en stor og langvarig betydning for samlet innvandring til Norge. Også den videre innstramming i
regelverket som skjedde i 1977 har dempet innvandringen, mens liberaliseringen i 1981, som
forventet, bidro til høyere innvandring enn hva vi ellers ville ha fått. I tiden rundt 1990 var det mange
spesielle begivenheter som påvirker innvandringen til Norge. Vi finner at både norsk deltakelse i EØS
i 1994 og Schengen-avtalen fra 2001 bidro til økt innvandring, men særlig utvidelsen av EU i 2004 har
hatt stor betydning for innvandringen til Norge. EU-utvidelsen i 2007 har ytterligere økt
innvandringen til Norge. Innstramming i reglene for familiegjenforening i 2008 har hatt en betydelig
effekt på innvandringen ifølge vår analyse.

4
1. Introduction Immigration to more developed nations has increased significantly for several decades. In Europe the
breakdown of the “iron curtain” affected migration flows, as has EU enlargements, which brought
many former East-European countries into a common labour market. Although Norway is not a
member of the EU, it is part of the European Economic Area (EEA) and consequently part of the
common European labour market. Norway is thus affected by migration flows in Europe just as any
other EU-country and migration to Norway from EU-countries has increased significantly in recent
years. While Norway historically was a country with more emigration than immigration, the opposite
has been the case more recently. Indeed, Norway together with Ireland was one of the countries with
the highest rate of emigration during last decades of the 19th century and the first decade of the 20th
century. This changed with more restrictive immigration policies in the US from the 1920s and the
depression of the 1930s. Until around 1970 net immigration to Norway was negative or small. From
around 1970 net immigration has been positive and gradually increasing, cf. Figure 1. With a total
population of roughly 4.9 million in 2010 net immigration increased the Norwegian population by 0.8
percent that year.
Figure 1. Migration to Norway. 1951−2010
- 10 000
0
10 000
20 000
30 000
40 000
50 000
60 000
70 000
80 000
1951 1955 1959 1963 1967 1971 1975 1979 1983 1987 1991 1995 1999 2003 2007
Immigration
Emigration
Net immigration
Figure 2 shows the reported motives for immigration to Norway since 1990, when the collection of
these statistics started, as defined by reason for the residence permit granted.1 We see that the number
of persons admitted following an application for asylum has varied around a fairly constant level. The
1 From 1 October 2009 non-Nordic citizens of the European Union (except Bulgarians and Romanians) only need to declare the main purpose of the stay when registering with the Norwegian authorities.

5
peak in 1993 is related to the war in Bosnia while the 1999-peak is mostly related to the Kosovo
conflict. Student immigration to Norway has been steadily increasing from a low level. The number of
people who come for work used to be at the same, quite low level, but has increased dramatically since
the expansion of the EU in May 2004. Family reunion has been an important reason for immigration
but is related to the other reasons and in particular to those who come for work or seeking protection.
Note that these statistics do not include immigrants who are citizens of another Nordic country
because they have had free access to Norway since 1957 and do not have to state any reason for
immigrating when registering with the Population register.2 Also, the statistics do not include intended
stays of less than six months.
Figure 2. Immigration to Norway by registered reason for immigration1 1990-2009
0
5 000
10 000
15 000
20 000
25 000
1990 1992 1994 1996 1998 2000 2002 2004 2006 2008 2010
Work
Family
Refugee
Education
1 Does not include citizens of the other Nordic countries (Denmark, Finland, Iceland and Sweden)
From the mid 1970s immigration policy became a new theme in Norwegian politics and attempts at
restricting immigration were put in place by a new law. Later various additional measures have been
introduced, but not all of these have been restrictive. Some have been of a more liberal nature. From
1994 and onwards immigration into Norway has been affected by Norway joining the EEA. In this
paper we study the effects of various immigration policy measures on immigration to Norway from all
countries in the world using a macro data panel from 1969 to 2010. Policies have not been uniform
across countries so we specify and test country specific or region specific policies. In order to do this
we translate various immigration policies into a set of dummies for each policy. We shall return to this
in Section 3 of the paper.
2 Citizens of other countries need a residence or work permit and the basis for granting the permit is registered by UDI.

6
There are many studies that analyse migration based on a single destination country. The study by
Clark et al. (2007) for the United States and by Hatton (2005) for the United Kingdom, both find
evidence for the role of immigration policies. Karemera et al. (2000) study migration to North
American destinations while Mayda (2010) studies migration to 14 OECD countries. See also Massey
et al. (1993) for a description of various theories of migration. A number of variables have been
suggested as driving forces in these migration studies. Some relate to cultural and linguistic factors
while other take on a more economic perspective and focus on differences in economic opportunities
such as income and labour market features. Our main focus is to analyse how changes to Norwegian
immigration policies have influenced migration to Norway during the previous four decades. We
incorporate some of the main ideas in previous studies of migration, and test if migration policies in
Norway can explain some of the changes in immigration flows over time and from particular countries
or groups of countries. Using a panel of 179 countries with statistics from 1969 to 2010 we conclude
that not only do economic variables explain changes in migration to Norway over time but some of the
major policy changes that have taken place are also important in understanding immigration to
Norway.
In the next section we present our modelling framework while the third section discusses the data and
in particular how we have created the policy intervention dummies that are linked to various
immigration policies. The fourth section presents our main results and a number of sensitivity tests.
We conclude in section five.
2. Modelling framework Our basic model dates back to Roy (1951) and is elaborated by Borjas (1987). For a recent application
see Mayda (2010). There are two countries: (o)rigin and (d)estination. The log of wages that an
individual living in the origin country would receive if not migrating (wo) is assumed to be
log( ) ,o o ow μ ε= + where 2~ (0, ).o oNε σ (1)
Here 0μ is interpreted as determined by individual observables such as education, gender etc., while
0ε captures unobservable characteristics with zero mean and a constant variance. For individuals who
immigrate there is a similar wage model in the destination country
log( ) ,d d dw μ ε= + where 2~ (0, ).d dNε σ (2)

7
The error terms are possibly correlated with a correlation coefficient ρ . Hatton (2005) and Clark et
al. (2007) let the 'sμ depend linearly on skill which is also assumed to be distributed normally so that
log( )ow and log( )dw are also normally distributed.
The decision to immigrate or not is determined by the sign of an index I :
( ) ( )log ( ) .d o d o d oI w w c μ μ δ ε ε= + ≈ − − + − (3)
Here c is the level of mobility costs while δ is the wage equivalent mobility cost. Immigration
occurs if the value of the index I is positive. Summing over all individuals in the origin country, the
emigration probability, P , from the origin country is given by
( )( ) ( )( ) ( )( )Pr 1 / / .d o d o d o d oP ε εε ε μ μ δ Φ μ μ δ σ Φ μ μ δ σ= − > − − − = − − + + = − − (4)
Here, εσ is the standard deviation of the difference of the error terms, ,d oε ε ε= − and Φ is the
standard normal cumulative distribution function. Equation (4) captures some important features of
empirical models of immigration. Higher income in the origin country lowers P , while higher income
in the destination country increases P . In addition, the income effects are the same but with opposite
signs. The variance of ε is given by
2 2 2 2 .d o doεσ σ σ σ= + − (5)
If the destination country has a more equal distribution of income than the origin country, and this
would usually be the case when Norway is the destination country, an increase in inequality in the
destination country will lower εσ .3 If the term in the brackets in (4) is negative so that the income in
the destination country is higher than in the origin country adjusted for migration costs, an increase in
destination inequality will increase immigration as argued for by Borjas (1987), Hatton (2005), and
Clark et al. (2007). Borjas (1987) was the first to include the income distribution as a feature affecting
migration. He finds that countries with more income inequality have lower emigration rates. For this
3 Note that ( )d d oε εσ σ σ σ σ∂ ∂ = − when dε and oε are assumed to be perfectly correlated.
8
to be the case there must be a strong positive correlation between earnings for immigrants in the origin
and the destination countries and less income inequality in the destination country. If the mean income
in the destination country is higher than in the origin country – which is a major motive for emigration
in the first place – and inequality increases in the origin country, then high-income persons in that
country will have fewer incentives to emigrate while low-income persons in the origin country are not
affected. Total emigration is then reduced. Thus, changes in the distribution of income in the origin
country select or motivate on average different people to emigrate.4 Mayda (2010) argues for including
also a quadratic term of relative income inequality and finds empirical support for this specification.
Also Hatton (2005) and Clark et al. (2007) find significant effects of variables characterising the
income distribution in their models.
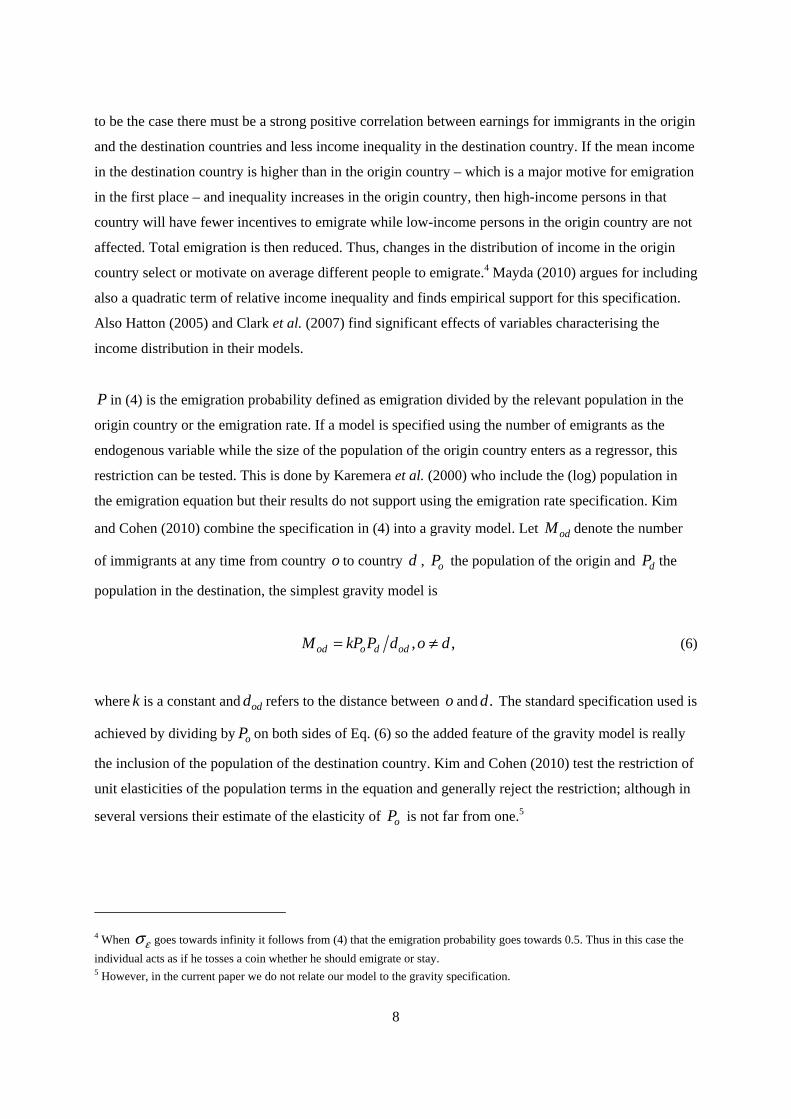
P in (4) is the emigration probability defined as emigration divided by the relevant population in the
origin country or the emigration rate. If a model is specified using the number of emigrants as the
endogenous variable while the size of the population of the origin country enters as a regressor, this
restriction can be tested. This is done by Karemera et al. (2000) who include the (log) population in
the emigration equation but their results do not support using the emigration rate specification. Kim
and Cohen (2010) combine the specification in (4) into a gravity model. Let odM denote the number
of immigrants at any time from country o to country d , oP the population of the origin and dP the
population in the destination, the simplest gravity model is
, ,od o d odM kP P d o d= ≠ (6)
where k is a constant and odd refers to the distance between o and .d The standard specification used is
achieved by dividing by oP on both sides of Eq. (6) so the added feature of the gravity model is really
the inclusion of the population of the destination country. Kim and Cohen (2010) test the restriction of
unit elasticities of the population terms in the equation and generally reject the restriction; although in
several versions their estimate of the elasticity of oP is not far from one.5
4 When εσ goes towards infinity it follows from (4) that the emigration probability goes towards 0.5. Thus in this case the
individual acts as if he tosses a coin whether he should emigrate or stay. 5 However, in the current paper we do not relate our model to the gravity specification.

9
Higher monetary costs of migration relative to income in the destination country reduce migration
according to the model in (4). A theoretical model of the effects of mobility costs is the focus of
Carrington et al. (1996). The idea here is that mobility costs decrease with the number of migrants
already settled in the destination country because they send information about job and housing markets
to friends and family in the origin country and generally provide a network for new entrants. The
empirical specification of mobility costs is a central part of econometric analyses of immigration.
Standard proxies used are language differences, geographical distance, and migration policy
indicators. It is common to include social indicators like crime and corruption indicators of political
systems in order to explain migration flows. Several studies referred to earlier use more or less these
variables in their econometric specifications. We proxy these factors using the number of resident
immigrants by country divided by the Norwegian population as one indicator for migration costs. In
addition our model includes fixed effects for all countries to capture other country specific factors. We
also allow for these factors to change over time by including country specific time trends.
3. Data and specification of immigration policies
Statistics on demographic and economic variables
Statistics for immigration to Norway from every country in the world are readily available in the
statistics database, “Statbank” on the webpage of Statistics Norway.6 We have chosen to model
immigration by country of departure and not citizenship. Statistics on immigrants by citizenship are
available, but that series starts much later and makes the study of immigration policies before 1986
impossible.7 Also it is not entirely clear what to prefer in our context. An Ethiopian who has lived in
Sweden for some time may just as well be motivated by the same factors as a Swede even if the policies
that apply to him/her are different (if (s)he has not acquired Swedish citizenship). Statistics on the stock
of immigrants by country is also found in this database.
For a number of the countries in the world, immigration to Norway does not take place every year. In
fact for some small islands in the Pacific and Caribbean migration to Norway is a rare event. To take
one example: during the period 1969 – 2010 there are four years of recorded immigration to Norway
from Samoa. In these cases we have simply excluded the country from our list. We have also excluded
countries where immigration never reaches 5 persons in any year. For some countries where
6 http://www.ssb.no/english/subjects/00/00/10/innvandring_en/ 7 With one exception noted below the fact that the regulations apply to country of citizenship and not of previous residence is not expected to influence the results.

10
immigration is quite regular, there are also some years with no recorded immigration. These zero
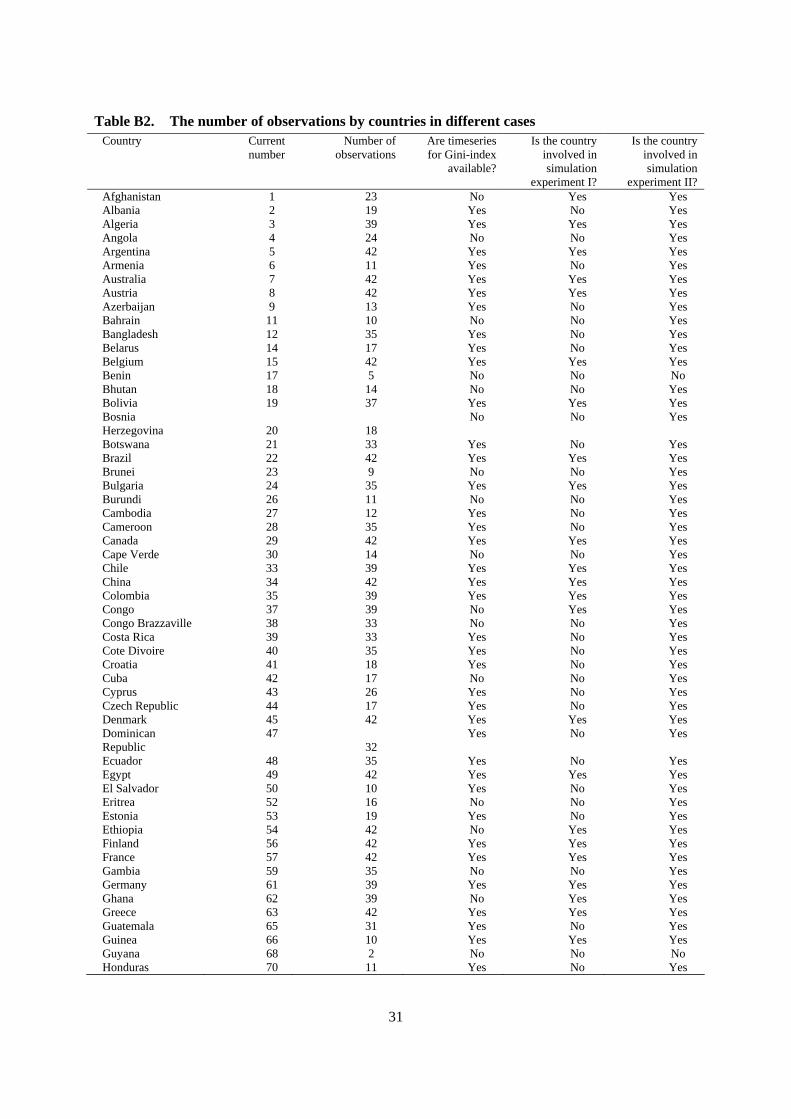
observations have been excluded from the sample in line with Kim and Cohen (2010). Table B2 shows
the number of observations by country included in the sample.8
Population statistics for all countries have been taken from United Nations, Population Division.9 The
statistics for Norway have been taken from the Statbank, as referred to earlier.
For economic statistics we rely on relative income measured by GDP per capita in PPPs and current
US dollars based on Penn World Tables cf. Heston et al. (2011). We use GDP-figures in nominal
terms as it is relative GDP-levels that are used in the model. We have also included the unemployment
rate in Norway.10 These figures are taken from OECD-databases and usually go back to 1970. Income
data are problematic. We have relied on three main sources of information. High quality data,
sometimes even going back before 1970, are generally available for countries taking part in the
Luxembourg Income Study (LIS).11 For most countries however, we rely on the WIDER database.12
For Latin-American countries we also use data from the SEDLAC homepage.13 The WIDER database
indicates data quality by using a scale from 1 to 4. When possible we rely mostly on high quality data
but have tried to make our coverage as complete as possible. In general, data are better and
comparable the more recent they are. For some countries there are comparable figures only for a few
years. These are used to calibrate the level and lower quality data are used to interpolate between these
years. When also these are missing linear interpolation is used.
Immigration policies and legislation in Norway We now turn to how we have translated Norwegian immigration policies into quantitative variables.
First, we emphasise that immigration from the other Nordic countries (Denmark, Finland, Iceland and
Sweden) has not been affected by any policy changes after the establishment of a Nordic passport
union in 1957, which gave Nordic citizens free access to all the Nordic countries without needing
8 In Table B4 we list the countries that are excluded from our analysis. 9 World Population Prospects: The 2008 Revision - Extended CD-ROM Edition.
WPP2008_ASCII_FILES/WPP2008_DB02_POPULATIONS_ANNUAL 10 In some subsample estimations we also exploit the unemployment level in the origin country. For many countries in the sample no reliable unemployment data have been found and the sample where unemployment in the origin country is included is therefore much smaller than the total sample. 11 Data can be found on http://www.lisdatacenter.org/data-access/keyfigures/ 12 Cf. UNU-WIDER World Income Inequality Database, Version 2.0c, May 2008 available at http://www.wider.unu.edu/. LIS data is also included in the WIDER database. 13 http://sedlac.econo.unlp.edu.ar. Database updated by April 2011.

11
passports, resident permits or work permits. It is also possible for Nordic citizens to commute or
immigrate to Norway for short term stays, e.g. to work, without even having to register with the
population register that represents the main source of the immigration statistics used in this study.
Consequently, no changes in immigration policies affect Nordic citizens.
Table 1. An overview of policy dummies and their expected sign in the econometric model DDUM1974 Ban on general work permits. All countries. Negative DUM1977 Residence permits not granted to illegally entrants. All countries. Negative DUM1981 Residence permits for immigrant students and school attendants. They were also
given work permits. More liberal rules for family reunions. All countries. Positive DUM1991 Easier family reunion, work permits given to applicants for residence. All countries.
Positive DUM1994 Norway joins the EEA. EEA-citizens free access. Positive DUM1997 Liberalisation related to the Geneva-convention. Refugees. Positive DUM1998 Liberalisation for refugees. Positive DUM1999 New law on human rights. UN convention on women and children. Positive DUM2000A Easier access for people with specialist competence. Positive DUM2000B Easier access for Iraqis. Positive DUM2001A Schengen-convention. Liberalisation for Schengen member countries (”S”) DUM2001B Schengen-convention may affect immigration from non-Schengen countries (“O”)
negatively DDUM2003 Liberalisation in 1997 tightened in 2003. Affecting mostly people from Afghanistan,
Iraq, Somalia and countries in former Yugoslavia. Negative DDUM2004 Extension of EU included Czech republic, Cyprus, Estonia, Hungary, Latvia,
Lithuania, Malta, Poland, Slovakia and Slovenia. Positive for these countries DUM2005 Easier access for Vietnamese refugees on the Philippines and Iraqis. Positive DUM2006 More restrictive rules for family reunion for immigrants arriving on tourist visa.
Negative for non-EU countries DUM2007EU New EU members: Bulgaria and Romania. Positive for these two countries DUM2007A New EU members from 2004 included in the Schengen area. Positive DUM2007B Residence for certain asylum seekers. Positive DUM2008 Stricter economic demands for family reunion. Negative DUM2009A Temporary and transition rules applying to new (from 2004) EU members lifted.
Positive effect for countries affected by Dummy 2004. DUM2009B Switzerland joins Schengen. Positive
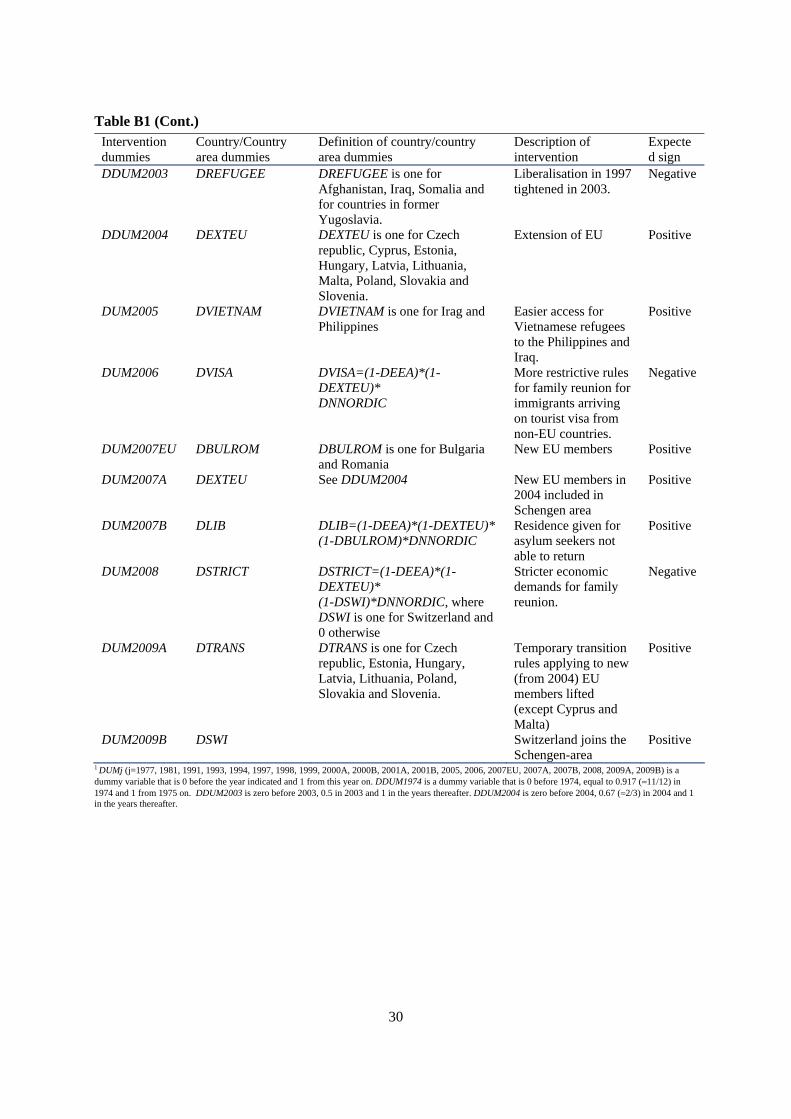
Out of a large number of changes to laws and regulations listed on the home page of the Norwegian
Directorate of Immigration14 we have selected 21 as basis for specifying policy dummies to capture
various aspects of policy changes, where some changes apply to all countries, some to a group of
countries and, sometimes only to very few or even a single country. Since some of the policy changes
are partly overlapping in time, one cannot include too many of the policy dummies in the model
specification. Table 1 summarises the policy variables included in our study. We have included what
we regard as the most important policy changes. We disregard minor changes such as higher visa fees
14 http://www.udi.no/Oversiktsider/Statistikk-og-analyse/FoU---rapporter1/Historisk-oversikt-over-regelverksendringer-/.
12
(which are anyway quite moderate). A certain element of subjectivity must of course be used when
choosing what to include and what to exclude and here we have relied on expert advice from the
immigration authorities in our selection of policy changes. The presentation of the policy changes in
Table 1 gives an idea of the level of detail that we address and implicitly what we have excluded in the
sense that other changes are not judged as being important enough on a priori grounds relative to those
we have included. We refer to Appendix C for a more detailed explanation of the policy dummies. We
should also note by specifying changes as step dummies we cannot be sure that we actually capture a
policy change. The step dummies could in principle capture other changes affecting immigration. We
do try to address this issue to some extent with robustness checks in Section 4.
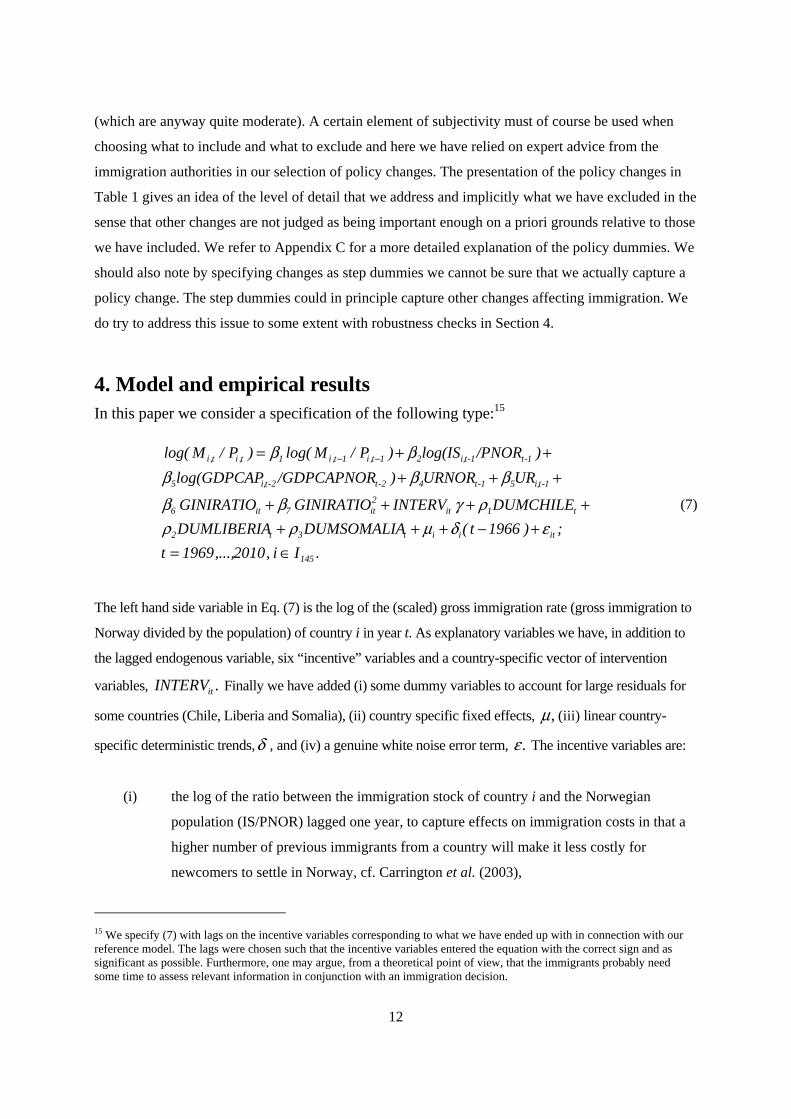
4. Model and empirical results In this paper we consider a specification of the following type:15
.Ii,2010,...,1969t
;)1966t(DUMSOMALIADUMLIBERIA
DUMCHILEINTERVGINIRATIOGINIRATIO
URURNOR)/GDPCAPNORlog(GDPCAP
)/PNORlog(IS)P/Mlog()P/Mlog(
145
itiit3t2
t1it2it7it6
1-ti,51-t42-t2-ti,5
1-t1-ti,21t,i1t,i1t,it,i
∈=+−+++
++++
+++++= −−
εδμρρργββ
βββββ
(7)
The left hand side variable in Eq. (7) is the log of the (scaled) gross immigration rate (gross immigration to
Norway divided by the population) of country i in year t. As explanatory variables we have, in addition to
the lagged endogenous variable, six “incentive” variables and a country-specific vector of intervention
variables, .INTERVit Finally we have added (i) some dummy variables to account for large residuals for
some countries (Chile, Liberia and Somalia), (ii) country specific fixed effects, ,μ (iii) linear country-
specific deterministic trends,δ , and (iv) a genuine white noise error term, .ε The incentive variables are:
(i) the log of the ratio between the immigration stock of country i and the Norwegian
population (IS/PNOR) lagged one year, to capture effects on immigration costs in that a
higher number of previous immigrants from a country will make it less costly for
newcomers to settle in Norway, cf. Carrington et al. (2003),
15 We specify (7) with lags on the incentive variables corresponding to what we have ended up with in connection with our reference model. The lags were chosen such that the incentive variables entered the equation with the correct sign and as significant as possible. Furthermore, one may argue, from a theoretical point of view, that the immigrants probably need some time to assess relevant information in conjunction with an immigration decision.

13
(ii) the log of GDP per capita of country i divided by GDP per capita for Norway lagged two
years, (GDPCAP/GDPCAPNOR) in order to capture the relative income effect,
(iii) the unemployment rate in Norway (URNOR) lagged one year, to capture the effect of
labour market slackness on migration,
(iv) the unemployment rate in the origin country to capture the effects of labour market
condition as a push factor behind emigration,
(v) a second order polynomial in the ratio between the income distribution in the origin
country and the income distribution of Norway to capture a selection mechanism behind
immigration.
The variables contained in the vector with intervention variables, ,INTERV are those occurring in the
text column of Table 2 after the variable DUMSOMALIA. For further information on these variables cf.
Table 1, Table B1 and Appendix C. It is not uncommon to include fixed period effects in panel data
models. However, in the current we have decided not to do so. Since the models already contain various
time dummies that are assumed to influence the vast majority of countries and since all the model
specifications involve the Norwegian unemployment rate, inclusion of year dummies will raise
questions of identification and lead to overparameterized models with unclear interpretation.
145I denotes a set with 145 current country numbers that are listed in Table B2. The panel data set is
unbalanced and Table B2 gives an overview of the effective number of observations for each country in
145I . We have, as noted earlier, omitted some small countries and observations for which the number of
immigrants to Norway in the current and previous year is less than five persons.16
Main Empirical results Since we have information on foreign unemployment and income distribution only for a subset of
countries these variables are not included in our basic model.17 Weighted least squares, with weights
based on population size, is our main estimation method, but we also present estimates based on ordi-
nary least squares.18 We have not tested the assumption of exogenous policy dummies. Heuristically
16 Cappelen et al. (2011), who use the same data material as in the current paper, consider subsample estimation for different geographical areas. Such type of robustness analysis is not undertaken in this paper, but is viewed as a topic for further work. 17 The reference model corresponds to the restricted case in Table 2. 18 All the calculations have been done by means of TSP version 5.0, cf. Hall and Cummins (1995). This software program contains a module for panel data analysis. However, this routine has not been utilized since we (i) consider weighted regression and (ii) incorporate country-specific linear deterministic trend effects. Thus, we have estimated the model using the routine for weighted least squares. This is facilitated by including a large amount of deterministic variables that take care of country specific effects and country specific linear trends. We do not consider random effects models in this paper. Consistent estimation of random effects models with lagged endogenous variables requires instrumental variables. We leave this for future analysis.
14
we do have some arguments in support of exogeneity. All variables in the main model except the un-
employment and the policy dummies rate are trending. It is impossible to argue that the unemployment
rate is correlated with the policy dummies. The first two restrictive dummies were introduced at a time
when the unemployment rate was low by historical standards. The liberalisation in 1981 also took
place at a time of low unemployment although slightly higher than in 1974 and 1977. The dummies
that capture Norway's relationship to the EU are also not related to contemporaneous variables in the
model. The 1994 enlargement affected several countries and Norway's decision not to join might pos-
sibly be related to economic factors (as in 1972 when there also was a no majority in a referendum).
The enlargements in 2004 and 2007 clearly had nothing to do with Norwegian politics.
The main empirical results are reported in Table 2.19 In the left part of this table we consider the
unrestricted case and in the right part a restricted case. The restricted case is mainly obtained by
excluding insignificant variables from the econometric specification.20 However, when economic
variables enter with a correct sign, we have retained them in the models even if the attached estimated
slope parameters are not very significant. The restricted specification cannot be rejected when tested
against the unrestricted specification using an LR-test.21 Hence, in the following we only comment on
the restricted case.
As seen from Table 2 we obtain correct signs of the estimated effects of the lagged endogenous
variable and the incentive variables. The effect of the lagged endogenous variable is large and highly
significant. The lagged stock of immigrants from a specific country relative to the Norwegian
population (log-transformed) enters significantly in the specification and with a positive sign as
expected. GDP per capita relative to the level in Norway (with a two year lag and log-transformed) is
included as suggested by theory, but its estimated slope coefficient only has a t-value of about 1.4 (in
absolute value). The Norwegian unemployment rate enters significantly. An increase in the Norwegian
unemployment rate decreases, ceteris paribus, immigration to Norway.
19We do not report estimates of the country-specific fixed effects and the country-specific linear trend effects in Table 2. 20 All the country-specific fixed effects have been retained, as well as country-specific trend variables with estimates with t-values higher than unity in absolute value. 21 The unrestricted model contains 319 unknown parameters including the variance of the error term and has a log-likelihood value equal to −3,493.99. The corresponding figures for the restricted model are 233 and −3,506.17. Thus using an LR-test statistic the restricted model cannot be rejected against the unrestricted model.

15
Table 2. Empirical analysis of immigration to Norway from the entire world. Unrestricted and restricted specificationa
Unrestricted case Restricted case Variable Estimate t-value Estimate t-value
log(M/P)t-1 0.592 46.940 0.598 49.169 log(IS/PNOR)t-1 0.030 1.590 0.030 2.315 log(GDPCAP/GDPCAPNOR)t-2 -0.038 -0.899 -0.046 -1.413 URNORt-1 -0.060 -6.750 -0.059 -7.071 DUMCHILE 1.466 3.482 1.414 3.407 DUMLIBERIA 2.399 2.701 2.395 2.720 DUMSOMALIA 1.790 2.995 1.814 3.112 DNNORDIC×DDUM1974 -0.105 -3.479 -0.104 -3.694 DNNORDIC×DUM1977 -0.063 -2.186 -0.059 -2.148 DNNORDIC×DUM1981 0.073 2.662 0.075 3.354 DNNORDIC×DUM1991 -0.099 -3.232 -0.096 -3.593 DEEA×DUM1994 0.109 1.603 0.142 2.606 DREFUGEE×DUM1997 0.788 3.637 0.800 4.029 DNNORDIC×DUM1998 0.047 1.277 0.052 1.567 DNNORDIC×DUM1999 -0.190 -4.844 -0.189 -4.900 DUMMYIRAQ×DUM2000B -0.141 -0.408 DNNORDIC×DUM2000A -0.075 -1.952 -0.074 -1.953 DSCHENGEN×DUM2001A 0.123 1.727 0.140 2.059 DNNORDIC×(1-DSCHENGEN)×DUM2001B 0.143 4.572 0.144 4.823 DREFUGEE×DDUM2003 -0.088 -0.415 DEXTEU×DDUM2004 0.885 4.560 0.900 6.271 DVIETNAM×DUM2005 0.147 1.225 0.146 1.243 DVISA×DUM2006 0.009 0.283 DBULROM×DUM2007EU 0.493 2.060 0.502 2.129 DEXTEU×DUM2007A 0.080 0.347 DLIB×DUM2007B 0.062 1.580 0.073 2.487 DSTRICT×DUM2008 -0.190 -5.984 -0.189 -6.145 DTRANS×DUM2009A 0.254 1.058 DSWI×DUM2009B 0.132 0.227 Number of observations 4,220 4,220 R2 0.947 0.946 aLeft hand side variable log(M/P)t. For the definition of the variables in the text column see Table B1.
We find that the majority of the policy intervention variables enter with the correct sign. For some of
the intervention variables we find no significant effects. In Table 3 we give a qualitative overview of
the obtained results. For the immigration regulations introduced in 1974 and 1977, respectively, the
correct negative sign is obtained. The liberalisation introduced in 1981 has as expected a positive
effect. For the liberalization policy launched in 1991 we obtain a significant estimate with the wrong
sign. As explained in Appendix C the policy changes in 1991 consisted of both restrictive measures
and liberalisations so the total estimated effect is perhaps not surprising.

16
Table 3. Expected and estimated sign of coefficients for policy variables. Restricted specificationa
Variable Expected sign Estimated sign DNNORDIC× DDUM1974 Negative Negative DNNORDIC× DUM1977 Negative Negative DNNORDIC×DUM1981 Positive Positive DNNORDIC×DUM1991 Positive Negative DEEA×DUM1994 Positive Positive DREFUGEE×DUM1997 Positive Positive DNNORDIC×DUM1998 Positive Positive DNNORDIC×DUM1999 Positive Negative DNNORDIC×DUM2000A Positive Negative DSCHENGEN×DUM2001A Positive Positive DNNORDIC×(1-DSHENGEN)×DUM2001B Negative Positive DEXTEU×DDUM2004 Positive Positive DVIETNAM×DUM2005 Positive Positive DBULROM×DUM2007EU Positive Positive DLIB×DUM2007B Positive Positive DSTRICT×DUM2008 Negative Negative aLeft hand side variable log(M/P)t. For the definition of the variables in the text column see Table B1.
A liberalization aimed at refugees was introduced in 1997. A correct sign is obtained for the estimated
coefficient attached to this variable, and the estimate is significant. Also for the liberalization launched
in 1998 we obtain the correct sign and a significant estimate. A wrong sign is obtained in connection
with the liberalization in 1999. The Schengen area convention introduced in 2001 is expected to
increase immigration to Norway from countries in the Schengen area but to lead to less immigration
from the countries outside the Schengen area. Let us first consider the Schengen area. For this area we
obtain the right positive sign, but, against intuition, the estimate of the effect for the non Schengen
area is also positive and significant. The absolute value is equal to the estimate for the Schengen area.
In 2003 a stricter regime for family-reunion was introduced. This intervention is restricted to influence
potential immigrants from Afghanistan, Iraq, Somalia and countries in former Yugoslavia. We are
unable to find any negative effect of this intervention variable. In 2004 there was an extension of the
EU/EEA area with some new East-European countries. The consequence was that people from these
new countries obtained easier access to Norway. Hence, the sign of the estimated effect is in
accordance with our a priori expectation. The dummy that captures the positive immigration effect
from Philippines and Iraq to Norway enters with the correct sign, but the effect is not very significant.
In 2007 there was another extension of the EU/EEA area since Bulgaria and Romania were included.
In accordance with our expectations we obtain a positive effect of this extension. The stricter demands
for family reunion introduced in 2008 had, as expected, a significant negative influence.

17
We have also included dummies for Chile, Liberia and Somalia. A look at preliminary estimation results
revealed that the residuals for these three countries were especially large in some years. Hence the dummy
variables DUMCHILE, DUMLIBERIA and DUMSOMALIA are included to account for these large
residuals.22 The estimates of the three attached parameters are all positive and significant.
Table 4. Empirical analysis of immigration to Norway from the entire world. Restricted specifi-cation. Model without incentive variables and model without trend variablesa
Variable Reference (restricted)
Without incentive variables
Without trend variables
Estimate t-value Estimate t-value Estimate t-value log(M/P)t-1 0.598 49.169 0.605 51.447 0.755 72.798 log(IS/PNOR)t-1 0.030 2.315 0.057 5.264 log(GDPCAP/GDPCAPNOR)t-2 -0.046 -1.413 0.264 13.498 URNORt-1 -0.059 -7.071 -0.061 -7.005 DUMCHILE 1.414 3.407 1.466 3.511 1.371 3.126 DUMLIBERIA 2.395 2.720 2.318 2.616 2.206 2.456 DUMSOMALIA 1.814 3.112 1.864 3.178 0.882 1.686 DNNORDIC×DDUM1974 -0.104 -3.694 -0.088 -3.121 -0.082 -2.786 DNNORDIC×DUM1977 -0.059 -2.148 -0.052 -1.904 0.024 0.845 DNNORDIC×DUM1981 0.075 3.354 0.035 1.727 0.134 5.852 DNNORDIC×DUM1991 -0.096 -3.593 -0.222 -12.923 0.015 0.535 DEEADUM1994 0.142 2.606 0.138 2.520 0.082 1.708 DREFUGEE×DUM1997 0.800 4.029 0.848 4.249 0.202 1.673 DNNORDIC×DUM1998 0.052 1.567 0.161 5.482 0.106 3.086 DNNORDIC×DUM1999 -0.189 -4.900 -0.141 -3.675 -0.192 -4.705 DNNORDIC×DUM2000A -0.074 -1.953 -0.073 -1.918 -0.069 -1.735 DSCHENGEN×DUM2001A 0.140 2.059 0.136 1.999 0.249 3.952 DNNORDIC×(1-DSCHENGEN)× DUM2001B
0.144 4.823 0.102 3.505 0.189 6.032
DEXTEU×DDUM2004 0.900 6.271 0.933 6.474 0.714 6.080 DVIETNAM×DUM2005 0.146 1.243 0.121 1.022 0.156 1.669 DBULROM×DUM2007EU 0.502 2.129 0.555 2.340 0.916 4.264 DLIB×DUM2007B 0.073 2.487 0.119 4.134 0.098 3.199 DSTRICT×DUM2008 -0.189 -6.145 -0.149 -4.899 -0.200 -6.164
Number of observations 4,220 4,220 4,220 R2 0.946 0.945 0.936 a Left hand side variable log(M/P)t. For the definition of the variables in the text column see Table B1.
In Table 4 we report estimation results for two special cases of the reference model. In the third column
we report the estimates of a model where the parameters attached to the incentive variables are
constrained to zero. The main impression is that the parameter estimates attached to the policy
intervention variables are not much changed qualitatively by the zero restrictions. The sign of the
22The binary variable DUMCHILE is one in 1987 and 1988 and zero in all other years and affects only Chile. The binary variable DUMLIBERIA is one in 2003 and 2004 and zero in all other years and affects only Liberia. The binary variable DUMSOMALIA is one in the years 1988−2010 and zero in all the years before 1988 and affects only Somalia.

18
estimates are the same as in the reference specification. So the estimates of the effects of the intervention
variables seem to be fairly robust with respect to whether the incentive variables are included or not.
In the column next to the last of Table 4 we report the estimates of a model where all the country specific
trend variables have been omitted. For this case we obtain a higher estimate of the coefficient attached to
the lagged endogenous variable and a positive significant effect of the relative GDP-variable. Thus, the
presence of country specific linear trends seems to be necessary in order to get the right sign of the relative
GDP-effect. The model with omitted country specific linear trend variables contains 170 parameters
(includeing the variance of the error term) and has a log-likelihood value equal to −3774.52. Thus if one
tests this specification against the reference specification using an LR-test one obtains a χ2 value of
561.06. The associated degree of freedom is 65. Hence, the specification without country specific trends is
clearly rejected.
Our main estimation method is weighted least squares with population as weights. The reason for this
is that we are pooling countries that differ substantially in population size. We have also estimated the
reference model with ordinary least squares. The results are reported in Table A1. Even if most of the
estimates retain their sign they differ somewhat from those obtained when using weighted least
squares with population weights and so does the estimation uncertainty. For instance the variable
representing the immigration restrictions launched in 1977 still have the right sign, but the magnitude
of the estimated slope coefficient of this variables has been almost halved and it has now turned
insignificant. Thus, it makes a difference which estimation method that is used.23
In the second column of Table B2 the effective number of observations for each country involved in
the estimation of the main model is reported. For some of the countries the number of effective
observations is rather low. In light of a potential problem of biased estimation stemming from few
observations in the time dimension in dynamic models with fixed effects, cf. Nickell (1981), we have
reestimated the main model after excluding countries with fever than 15 observations. The estimates in
this case are reported in Table A2 and they show there is no substantial change in any of the estimates,
which may imply that there is no “Nickell-bias”.
23 We have also estimated the reference model with weighted least squares using immigration weights. However, some of the results appear rather strange. The estimate of the slope parameter attached to the immigration stock now turns negative and besides the coefficient of the lagged endogenous variable is substantially lower than when weighted least squares is based on population weights. Finally, we have carried out weighted least squares using log population as weights. This variant produced results that resemble those obtained using ordinary least squares.

19
Changes in the income distribution As commented on earlier in the paper changes in the income distribution in both the origin and
destination country may influence immigration. It is relevant to ask whether this effect is important
from an empirical point of view. For 101 of the 145 countries considered when estimating the
reference model we have access to time series for the Gini-coefficient. Using this subsample we
reestimated the reference model after having added a second order polynomial in the ratio between the
Gini-coefficient of the origin country and Norway. Whereas the reference model was estimated using
4,220 observations the augmented model is estimated with 3,083 observations. The results are shown
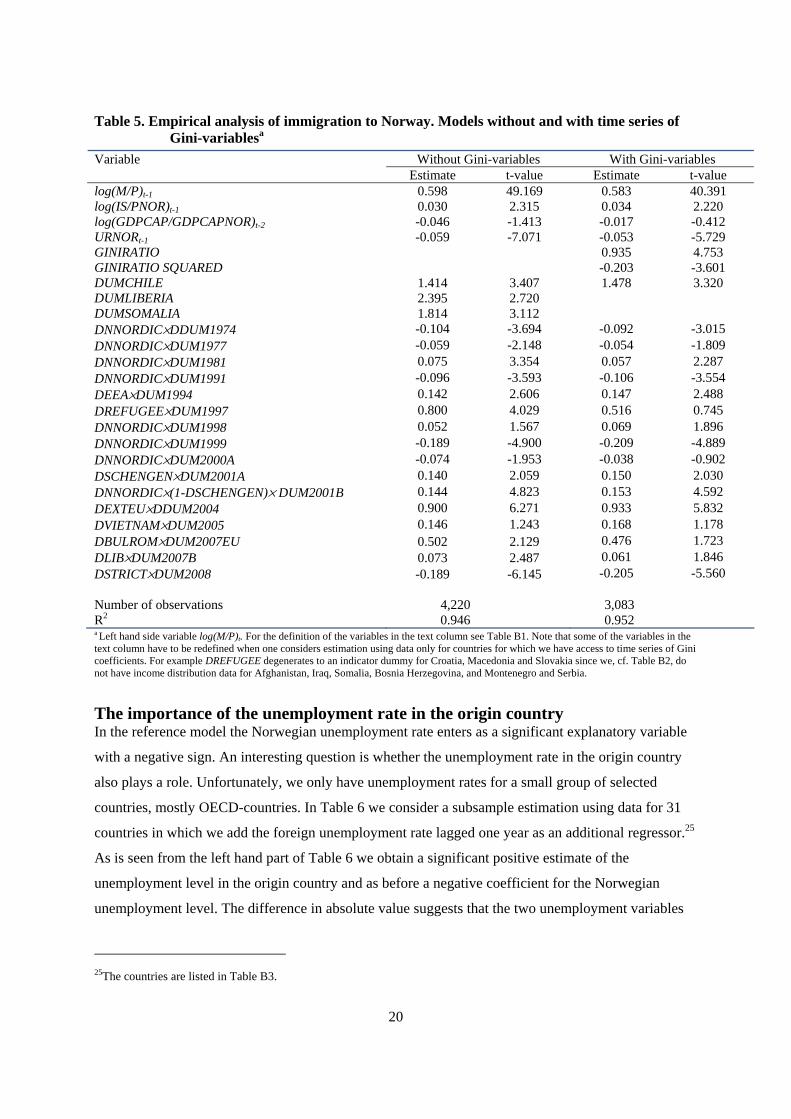
in Table 5. We obtain a significant positive estimate of the first order variable and a significant
negative estimate of the quadratic term.24 Within our sample an increase in the inequality of the
income distribution of the origin leads, mainly, to, an increase in the immigration to Norway. In this
augmented model the estimate of the income ratio is smaller and substantially less significant than in
the reference model, the t-value now being only around 0.4 in absolute value. Generally the estimates
of the common parameters in the augmented and reference model are similar. We now get a smaller
and insignificant estimate of the coefficient attached to the intervention directed towards refugees
from 1997. This is not surprising since some of the countries influenced by this variable are omitted
from the subset of data used in the conjunction with the subsample estimation. However, by and large,
including variables on income inequality for a smaller set of countries with appropriate data, does not
change our conclusions with regard to the qualitative effects of policy interventions.
24 From Eq. (7) we have that GINIRATIOit denotes the ratio between the Gini-coefficient in country i and Norway in year t. In
the estimated regression the effect of the variable is specified as 26 72
ˆ ˆit itGINIRATIO GINIRATIOβ β+ , where
6ˆ 0.935β = and 7
ˆ 0.203β = − . Note that the derivative is given by 6 7ˆ ˆ2 GINIRATIOβ β+ . In our sample GINIRATIO
varies between 0.697 and 2.915. An increase in GINIRATIO yields an increase in the immigration for most of the countries.
However, when evaluating the term 6 7ˆ ˆ2 GINIRATIOβ β+ in the observed data points, we find that it is negative in at least
one year for 24 countries.
20
Table 5. Empirical analysis of immigration to Norway. Models without and with time series of Gini-variablesa
Without Gini-variables With Gini-variables Variable Estimate t-value Estimate t-value
log(M/P)t-1 0.598 49.169 0.583 40.391 log(IS/PNOR)t-1 0.030 2.315 0.034 2.220 log(GDPCAP/GDPCAPNOR)t-2 -0.046 -1.413 -0.017 -0.412 URNORt-1 -0.059 -7.071 -0.053 -5.729 GINIRATIO 0.935 4.753 GINIRATIO SQUARED -0.203 -3.601 DUMCHILE 1.414 3.407 1.478 3.320 DUMLIBERIA 2.395 2.720 DUMSOMALIA 1.814 3.112 DNNORDIC×DDUM1974 -0.104 -3.694 -0.092 -3.015 DNNORDIC×DUM1977 -0.059 -2.148 -0.054 -1.809 DNNORDIC×DUM1981 0.075 3.354 0.057 2.287 DNNORDIC×DUM1991 -0.096 -3.593 -0.106 -3.554 DEEA×DUM1994 0.142 2.606 0.147 2.488 DREFUGEE×DUM1997 0.800 4.029 0.516 0.745 DNNORDIC×DUM1998 0.052 1.567 0.069 1.896 DNNORDIC×DUM1999 -0.189 -4.900 -0.209 -4.889 DNNORDIC×DUM2000A -0.074 -1.953 -0.038 -0.902 DSCHENGEN×DUM2001A 0.140 2.059 0.150 2.030 DNNORDIC×(1-DSCHENGEN)× DUM2001B 0.144 4.823 0.153 4.592 DEXTEU×DDUM2004 0.900 6.271 0.933 5.832 DVIETNAM×DUM2005 0.146 1.243 0.168 1.178 DBULROM×DUM2007EU 0.502 2.129 0.476 1.723 DLIB×DUM2007B 0.073 2.487 0.061 1.846 DSTRICT×DUM2008 -0.189 -6.145 -0.205 -5.560 Number of observations 4,220 3,083 R2 0.946 0.952 a Left hand side variable log(M/P)t. For the definition of the variables in the text column see Table B1. Note that some of the variables in the text column have to be redefined when one considers estimation using data only for countries for which we have access to time series of Gini coefficients. For example DREFUGEE degenerates to an indicator dummy for Croatia, Macedonia and Slovakia since we, cf. Table B2, do not have income distribution data for Afghanistan, Iraq, Somalia, Bosnia Herzegovina, and Montenegro and Serbia.
The importance of the unemployment rate in the origin country In the reference model the Norwegian unemployment rate enters as a significant explanatory variable
with a negative sign. An interesting question is whether the unemployment rate in the origin country
also plays a role. Unfortunately, we only have unemployment rates for a small group of selected
countries, mostly OECD-countries. In Table 6 we consider a subsample estimation using data for 31
countries in which we add the foreign unemployment rate lagged one year as an additional regressor.25
As is seen from the left hand part of Table 6 we obtain a significant positive estimate of the
unemployment level in the origin country and as before a negative coefficient for the Norwegian
unemployment level. The difference in absolute value suggests that the two unemployment variables
25The countries are listed in Table B3.

21
should be specified as two separate variables in the regression. Just using the difference in the
unemployment rates does not seem to be empirically valid. Note that for this subsample we obtain a
significant negative estimate of the relative income variable as expected. However, we still struggle
with some of the signs of the effects of the intervention variables, for instance the effects related to the
two liberalization interventions in 1999 and 2000. In the right hand part of Table 6 we report results
from a specification in which we also have added a second order polynomial in the Gini-coefficient
ratio but the two involved variables are highly insignificant for this subset of countries.
Table 6. Empirical analysis of immigration from countries for which one observes the origin unemployment levela
Without Gini-variables With Gini-variables Variable Estimate t-value Estimate t-value
log(M/P)t-1 0.602 23.194 0.599 22.243 log(IS/PNOR)t-1 0.057 1.741 0.071 1.940 log(GDPCAP/GDPCAPNOR)t-2 -0.182 -2.656 -0.221 -2.853 URNORt-1 -0.041 -4.571 -0.037 -3.907 URt-1 0.009 2.505 0.008 2.153 GINIRATIO 0.002 0.005 GINIRATIO SQUARED -0.007 -0.065 DNNORDIC×DDUM1974 -0.056 -1.719 -0.060 -1.786 DNNORDIC×DUM1977 -0.070 -2.436 -0.073 -2.509 DNNORDIC×DUM1981 -0.042 -1.686 -0.050 -1.916 DNNORDIC×DUM1991 0.093 3.184 0.084 2.786 DEEA×DUM1994 0.058 1.945 0.061 1.985 DNNORDIC×DUM1998 -0.045 -1.245 -0.039 -1.057 DNNORDIC×DUM1999 -0.108 -2.481 -0.106 -2.389 DNNORDIC×DUM2000A -0.116 -2.713 -0.118 -2.684 DSCHENGEN×DUM2001A 0.202 4.410 0.191 4.001 DNNORDIC×(1-DSCHENGEN)× DUM2001B 0.060 1.667 0.048 1.305 DEXTEU×DDUM2004 0.815 6.877 0.794 6.455 DLIB×DUM2007B -0.016 -0.408 -0.015 -0.374 DSTRICT×DUM2008 -0.063 -1.479 -0.016 -0.338 Number of observations 1,052 982 R2 0.983 0.979 a Left hand side variable log(M/P)t. For the countries included in this estimation see Table B4. For the definition of the variables in the text column see Table B1. Note that some of the variables in the text column are redefined when one considers estimation using data only for countries for which one has access to origin unemployment rates. For example DEXTEU is now one for Estonia, Hungary, Poland and Slovakia and zero for all other countries included in the estimation of the econometric relation.
Some counterfactual exercises We now use the estimated model for counterfactual analysis. We will consider two policy changes.
Simulation I tries to answer how immigration to Norway would have changed if the 1973-policy
regime had been maintained in the subsequent years. The second policy analysis (Simulation II)
addresses how Norwegian membership in the European Economic Area (EEA) and the Schengen area
has affected immigration. These analyses are not without problems. First, we are unable to obtain the
“correct” sign of all the estimated parameters related to the intervention dummies, cf. Table 3.

22
Second, we implicitly will have to assume that the estimates of the slope parameters are not affected
by the counterfactual situation. Third, the dataset is, as mentioned earlier, unbalanced, which creates
problem for the dynamic simulation of all the countries in the model. Finally, it is a very partial
exercise in that all other variables of the model are assumed unaffected. If immigration is higher,
several of the right hand side variables might possibly be affected too and these changes are not
included in the simulations. One obvious example is that a change which increases immigration will
most likely also increase the stock of immigrants unless there is a similar increase in emigration. The
latter effect is ignored in these simulations. The countries included in, respectively, Simulation I and
Simulation II are listed in the two last columns of Table B2. The point of departure is the reference
model.
In Simulation I we study the “global” intervention effects and start the dynamic simulations in 1974. As
a reference we simulate a model that corresponds to the restricted case in Table 2. For each year we
deduce the total number of immigrants from the 70 countries indicated in the column next to the last in
Table B2. In the counterfactual simulation we set, cf. Table B1, the following policy variables to zero:
DDUM1974, DUM1977, DUM1981, DUM1997, DUM1998, DUM2007B and DUM2008.26 The
simulation results are reported in Table 7. In the first column we report the reference path, whereas the
counterfactual path is reported in the second column. The two last columns contain the difference in
immigration between the counterfactual and the reference path in absolute and relative terms. In the
1970s we note the impact of the restrictions launched in 1974 and 1977. Our estimate is that immigration
to Norway due to these two policies was reduced by 28 percent by 1980. The effects increase over time
due to the lagged responses of the policies. The 1981-liberalisation reduced the effects of the more
restrictive policies significantly during the first half of the 1980s. The policies of the 1970s and early
1980s thus seem to have reduced total immigration by roughly 16 percent. The liberalisation in 1998
increases immigration further and by early 2000s the total effects of the mentioned policies have reduced
immigration by only 5 percent compared to policies that were in place before 1974.
If we look at the accumulated changes over three decades the total effect on immigration has been
considerable. By 2010 total immigration was reduced by nearly 116 000 persons due to these
immigration policies according to our model. But we should note the partial character of the simulations.
Although some of the immigrants would have emigrated again, the stock of immigrants has been
26 Since the variables DNNORDIC×DUM1991, DNNORDIC×DUM1999, DNNORDIC×DUM200A and
DNNORDIC×(1-DSCHENGEN)×DUM2001B enter with the wrong sign, we include them both in the reference and counterfactual simulations. Thus we refrain from interpreting these variables as intervention variables.

23
negatively affected by the policies. A lower stock of immigrants would have reduced the number of
immigrants further since stocks of immigrants in Norway reduce transaction costs. On the other hand a
higher number of immigrants may have increased unemployment and led later to fewer immigrants.
These arguments simply add up to the need of analysing the issue within a much more complete “model”
of the Norwegian society.
Table 7. Counterfactual analysis of immigration to Norway (70 countries). Simulation Ia
Year Reference path
Counterfactual path
Absolute difference
Difference in perce
nt 1974 16,969 18,066 1,097 6.5 1975 17,626 19,584 1,958 11.1 1976 17,807 20,301 2,494 14.0 1977 17,613 21,167 3,554 20.2 1978 18,023 22,360 4,337 24.1 1979 18,165 22,978 4,813 26.5 1980 18,350 23,497 5,147 28.0 1981 19,953 24,589 4,636 23.2 1982 20,781 25,019 4,238 20.4 1983 20,830 24,730 3,900 18.7 1984 20,147 23,727 3,580 17.8 1985 20,229 23,716 3,487 17.2 1986 21,296 24,907 3,611 17.0 1987 23,660 27,686 4,026 17.0 1988 25,999 30,492 4,493 17.3 1989 24,482 28,636 4,154 17.0 1990 21,929 25,639 3,710 16.9 1991 19,220 22,380 3,160 16.4 1992 17,739 20,613 2,874 16.2 1993 16,776 19,476 2,700 16.1 1994 16,966 19,732 2,766 16.3 1995 17,886 20,831 2,945 16.5 1996 19,298 22,502 3,204 16.6 1997 21,889 25,392 3,503 16.0 1998 25,959 28,992 3,033 11.7 1999 26,463 28,773 2,310 8.7 2000 25,975 27,752 1,777 6.8 2001 28,362 30,083 1,721 6.1 2002 30,417 32,102 1,685 5.5 2003 31,635 33,276 1,641 5.2 2004 32,676 34,344 1,668 5.1 2005 34,633 36,409 1,776 5,1 2006 37,572 39,152 1,580 4,2 2007 47,901 47,908 7 0,0 2008 52,562 55,407 2,845 5,4 2009 55,288 60,296 5,008 9,1 2010 57,657 63,934 6,277 10,9 Sum 960,733 1,076,448 115,715 12,0
aThe reference path corresponds to dynamic simulation starting in 1974 using the estimated parameters reported for the restricted case in Table 2. For the counterfactual path we set the values of the intervention variables DDUM1974, DUM1977, DUM1981, DUM1997, DUM1998, DUM2007B and DUM2008 to zero in all years and perform dynamic simulation. The countries involved are listed in the column next to the last in Table B2.
24
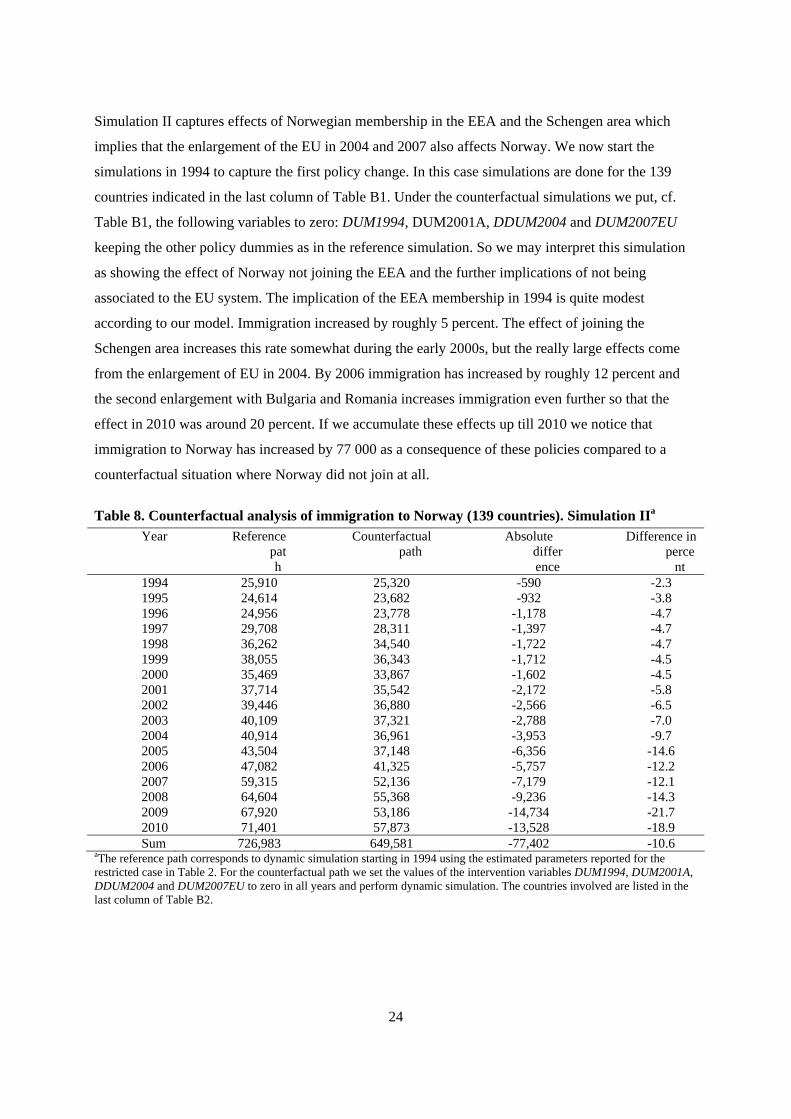
Simulation II captures effects of Norwegian membership in the EEA and the Schengen area which
implies that the enlargement of the EU in 2004 and 2007 also affects Norway. We now start the
simulations in 1994 to capture the first policy change. In this case simulations are done for the 139
countries indicated in the last column of Table B1. Under the counterfactual simulations we put, cf.
Table B1, the following variables to zero: DUM1994, DUM2001A, DDUM2004 and DUM2007EU
keeping the other policy dummies as in the reference simulation. So we may interpret this simulation
as showing the effect of Norway not joining the EEA and the further implications of not being
associated to the EU system. The implication of the EEA membership in 1994 is quite modest
according to our model. Immigration increased by roughly 5 percent. The effect of joining the
Schengen area increases this rate somewhat during the early 2000s, but the really large effects come
from the enlargement of EU in 2004. By 2006 immigration has increased by roughly 12 percent and
the second enlargement with Bulgaria and Romania increases immigration even further so that the
effect in 2010 was around 20 percent. If we accumulate these effects up till 2010 we notice that
immigration to Norway has increased by 77 000 as a consequence of these policies compared to a
counterfactual situation where Norway did not join at all.
Table 8. Counterfactual analysis of immigration to Norway (139 countries). Simulation IIa
Year Reference path
Counterfactual path
Absolute difference
Difference in perce
nt 1994 25,910 25,320 -590 -2.3 1995 24,614 23,682 -932 -3.8 1996 24,956 23,778 -1,178 -4.7 1997 29,708 28,311 -1,397 -4.7 1998 36,262 34,540 -1,722 -4.7 1999 38,055 36,343 -1,712 -4.5 2000 35,469 33,867 -1,602 -4.5 2001 37,714 35,542 -2,172 -5.8 2002 39,446 36,880 -2,566 -6.5 2003 40,109 37,321 -2,788 -7.0 2004 40,914 36,961 -3,953 -9.7 2005 43,504 37,148 -6,356 -14.6 2006 47,082 41,325 -5,757 -12.2 2007 59,315 52,136 -7,179 -12.1 2008 64,604 55,368 -9,236 -14.3 2009 67,920 53,186 -14,734 -21.7 2010 71,401 57,873 -13,528 -18.9 Sum 726,983 649,581 -77,402 -10.6
aThe reference path corresponds to dynamic simulation starting in 1994 using the estimated parameters reported for the restricted case in Table 2. For the counterfactual path we set the values of the intervention variables DUM1994, DUM2001A, DDUM2004 and DUM2007EU to zero in all years and perform dynamic simulation. The countries involved are listed in the last column of Table B2.
25
5. Conclusions Using unbalanced panel data we have modelled immigration to Norway from countries all over the
world during the period 1969−2010. Our main focus has been to assess the effects of immigration
policies on immigration to Norway. Immigration policies have been proxied using a number of time
series dummy variables. These policy intervention variables have been included in a standard
economic model of migration that accounts for the effects of incentive variables such as relative
income, income distribution and labour market features. Unobserved country-specific heterogeneity is
modelled by including country specific fixed effects and country specific linear trends in order to take
into account geographical distance, culture and language differences and other fairly stable effects that
might affect migration from individual countries to Norway.
For the incentive variables we, abstracting from the income distribution variables, obtain estimates
with the expected sign, even if the significance of some of the estimates is rather moderate. Even if
many of the country-specific fixed effects and trend effects are insignificant, the presence of these
variables seems to be important. When the country-specific trend effects are omitted a substantial drop
in fit and less sensible estimates of the effects of the incentive variables are obtained. However, more
parsimonious specifications of unobserved country-specific heterogeneity are a relevant topic for
future research.
The majority of policy intervention variables enter with the a priori expected sign, but for some of
them we obtain counterintuitive results. In a counterfactual exercise we have investigated the effect of
the general immigration policies that have been launched since 1974. As a rough estimate we find that
the accumulated number of immigrations over then period 1974-2010 would have been about 116 000
persons higher without these policies. In relative terms, the immigration would have increased with 12
per cent if one had pursued a policy without the general immigration interventions.
In another experiment we investigated the importance of Norway joining the European Economic
Area in 1994 and the subsequent changes in immigration policy that followed from this step, that is the
membership in the Schengen area and the enlargement of EU. Again as a rough estimate we found that
the accumulated immigration over the time period 1994-2010 would have been 10 per cent lower
without Norwegian involvement in the European Economic Area.

26
References Borjas, G. J. (1987): Self-Selection and the Earnings of Immigrants, American Economic Review, 77, 531−553. Cappelen, Å., J. Ouren and T. Skjerpen (2011): Effects of immigration policies on immigration to Norway 1969-2010, Reports 40/2011, Statistics Norway. Carrington, W. J., E. Detragiache, and T. Vishwanath (1996): Migration with Endogenous Moving Costs, American Economic Review, 86, 909− 930. Clark, X., T. J. Hatton and J. G. Williamson (2007): Explaining U.S. Immigration, 1971−1998, The Review of Economics and Statistics, 89, 359−373. Hall, B.H. and C. Cummins (2005): TSP Reference manual Version 5.0. TSP International. Hatton, T. J. (2005): Explaining trends in UK immigration, Journal of Population Economics, 18, 719−740. Heston, A., R. Summers and B. Aten (2011): Penn World Tables, Version 7.0. Center for International Comparisons of Production, Income and Prices at the University of Pennsylvania. March 2011. Karemera, D., V. I. Oguledo, and B. Davis (2000): A gravity model analysis of international migration to North America, Applied Economics, 32, 1745−1755. Kim, K. and J. E. Cohen (2010): Determinants of International Migration Flows to and from Industrialized Countries: A Panel Data Approach Beyond Gravity, International Migration Review, 44, 899−932. Massey, D. S., J. Arango, G. Hugo, A. Kouaouci, A. Pellegrino and J. E. Taylor (1993): Theories of International Migration: A Review and Appraisal, Population and Development Review, 19, 431− 466. Mayda, A. M. (2010): International Migration: A Panel Data Analysis of the Determinants of Bilateral Flows, Journal of Population Economics 23, 1249−1274. Nickell, S.J. (1981): Biases in Dynamic Models with Fixed Effects. Econometrica, 49, 1417−1426. Roy, A. D. (1951): Some Thoughts on the Distribution of Earnings, Oxford Economic Papers, 3, 135−146.

27
Appendix A: Additional estimation results
Table A1. Empirical analysis of immigration to Norway. Restricted specification. Weighted regression and OLSa
Explanatory variable Weighted regression Unweighted regression Estimate t-value Estimate t-value log(M/P)t-1 0.598 49.169 0.531 42.198 log(IS/PNOR)t-1 0.030 2.315 0.047 3.617 log(GDPCAP/GDPCAPNOR)t-2 -0.046 -1.413 -0.019 -0.586 URNORt-1 -0.059 -7.071 -0.048 -4.695 DUMCHILE 1.414 3.407 1.591 5.522 DUMLIBERIA 2.395 2.720 2.476 7.990 DUMSOMALIA 1.814 3.112 1.854 6.337 DNNORDIC×DDUM1974 -0.104 -3.694 -0.062 -1.480 DNNORDIC×DUM1977 -0.059 -2.148 -0.030 -0.795 DNNORDIC×DUM1981 0.075 3.354 -0.013 -0.441 DNNORDIC×DUM1991 -0.096 -3.593 -0.061 -1.845 DEEA×DUM1994 0.142 2.606 0.129 2.257 DREFUGEE×DUM1997 0.800 4.029 0.458 3.755 DNNORDIC×DUM1998 0.052 1.567 -0.005 -0.106 DNNORDIC×DUM1999 -0.189 -4.900 -0.052 -1.010 DNNORDIC×DUM2000A -0.074 -1.953 -0.113 -2.205 DSCHENGEN×DUM2001A 0.140 2.059 0.111 1.612 DNNORDIC×(1-DSCHENGEN)×DUM2001B 0.144 4.823 0.061 1.484 DEXTEU×DDUM2004 0.900 6.271 0.759 10.113 DVIETNAM×DUM2005 0.146 1.243 0.057 0.323 DBULROM×DUM2007EU 0.502 2.129 0.525 2.932 DLIB×DUM2007B 0.073 2.487 -0.025 -0.602 DSTRICT×DUM2008 -0.189 -6.145 -0.099 -2.259 Number of observations 4,220 4,220 aLeft hand side variable log(M/P)t. For the definition of the variables in the text column see Table B1. Weights based on population size.

28
Table A2. Empirical analysis of immigration to Norway from the entire world. Countries with fewer than 15 observations omitted. Weighted least squares estimatesa
Full sample Countries with more than 14 observations
Explanatory variable
Estimate t-value Estimate t-value log(M/P)t-1 0.598 49.169 0.605 48.569log(IS/PNOR)t-1 0.030 2.315 0.028 2.095 log(GDPCAP/GDPCAPNOR)t- -0.046 -1.413 -0.048 -1.465URNORt-1 -0.059 -7.071 -0.059 -6.948DUMCHILE 1.414 3.407 1.402 3.327DUMLIBERIA 2.395 2.720 2.388 2.670DUMSOMALIA 1.814 3.112 1.794 3.032DNNORDIC×DDUM1974 -0.104 -3.694 -0.105 -3.666DNNORDIC×DUM1977 -0.059 -2.148 -0.057 -2.033DNNORDIC×DUM1981 0.075 3.354 0.074 3.280DNNORDIC×DUM1991 -0.096 -3.593 -0.092 -3.395DEEA×DUM1994 0.142 2.606 0.140 2.518DREFUGEE×DUM1997 0.800 4.029 0.794 3.941DNNORDIC×DUM1998 0.052 1.567 0.053 1.581DNNORDIC×DUM1999 -0.189 -4.900 -0.190 -4.805DNNORDIC×DUM2000A -0.074 -1.953 -0.074 -1.921DSCHENGEN×DUM2001A 0.140 2.059 0.138 2.006DNNORDIC×(1-DSCHENGEN)×DUM2001B
0.144 4.823 0.143 4.681
DEXTEU×DDUM2004 0.900 6.271 0.890 6.101DVIETNAM×DUM2005 0.146 1.243 0.147 1.231DBULROM×DUM2007EU 0.502 2.129 0.502 2.095DLIB×DUM2007B 0.073 2.487 0.075 2.487DSTRICT×DUM2008 -0.189 -6.145 -0.190 -6.013 Number of observations 4,220 3,956 R2 0.946 0.949 aLeft hand side variable log(M/P)t. For the definition of the variables in the text column see Table B1. Note that some of the variables in the text column are redefined when one omits countries with less than 15 observations. For instance since Slovenia is omitted DEXTEU is one for Czech republic, Cyprus, Estonia, Hungary, Latvia, Lithuania, Malta, Poland and Slovakia.

29
Appendix B: Details on data
Table B1. An overview of intervention dummies, the countries that are influenced by the va-rious policy dummies and the expected sign of the effects of the dummy variables1
Intervention dummies
Country/Country area dummies
Definition of country/country area dummies
Description of intervention
Expected sign
DDUM1974 DNNORDIC DNNORDIC is 1 for all countries except Denmark, Finland, Iceland and Sweden.
Ban on general work permits introduced in February 1974. All countries.
Negative
DUM1977 DNNORDIC Residence permits not granted to illegally entrants.
Negative
DUM1981 DNNORDIC Residence permits for immigrant students and school attendants. They were also given work permits. More liberal rules for family reunions.
Positive
DUM1991 DNNORDIC Easier family reunion, work permits given to applicants for residence.
Positive
DUM1994 DEEA DEEA is one for Austria, Belgium, France, Germany, Greece, Ireland, Italy, Luxembourg, Netherlands, Portugal, Spain and United Kingdom
Norway joins the EEA. EEA-citizens free access.
Positive
DUM1997 DREFUGEE DREFUGEE is one for Afghanistan, Iraq, Somalia and for countries in former Yugoslavia.
Liberalisation related to the Geneva-convention. Refugees.
Positive
DUM1998 DNNORDIC Liberalisation for refugees.
Positive
DUM1999 DNNORDIC New law on human rights. UN convention on women and children.
Positive
DUM2000A DNNORDIC Easier access for people with specialist competence.
Positive
DUM2000B DIRAQ DIRAQ is 1 for Iraq Easier access for people from Iraq.
Positive
DUM2001A DSCHENGEN DSCHENGEN is one for Austria, Belgium, France, Germany, Greece, Ireland, Italy, Luxembourg, Netherlands, Portugal and Spain
Schengen-convention. Liberalisation for Schengen member countries.
Positive
DUM2001B (1-DSCHENGEN)* DNNORDIC
Schengen-convention. Possible tigthening for countries outside the Schenger-area.
Negative
30
Table B1 (Cont.) Intervention dummies
Country/Country area dummies
Definition of country/country area dummies
Description of intervention
Expected sign
DDUM2003 DREFUGEE DREFUGEE is one for Afghanistan, Iraq, Somalia and for countries in former Yugoslavia.
Liberalisation in 1997 tightened in 2003.
Negative
DDUM2004 DEXTEU DEXTEU is one for Czech republic, Cyprus, Estonia, Hungary, Latvia, Lithuania, Malta, Poland, Slovakia and Slovenia.
Extension of EU Positive
DUM2005 DVIETNAM DVIETNAM is one for Irag and Philippines
Easier access for Vietnamese refugees to the Philippines and Iraq.
Positive
DUM2006 DVISA DVISA=(1-DEEA)*(1-DEXTEU)* DNNORDIC
More restrictive rules for family reunion for immigrants arriving on tourist visa from non-EU countries.
Negative
DUM2007EU DBULROM DBULROM is one for Bulgaria and Romania
New EU members Positive
DUM2007A DEXTEU See DDUM2004 New EU members in 2004 included in Schengen area
Positive
DUM2007B DLIB DLIB=(1-DEEA)*(1-DEXTEU)* (1-DBULROM)*DNNORDIC
Residence given for asylum seekers not able to return
Positive
DUM2008 DSTRICT DSTRICT=(1-DEEA)*(1-DEXTEU)* (1-DSWI)*DNNORDIC, where DSWI is one for Switzerland and 0 otherwise
Stricter economic demands for family reunion.
Negative
DUM2009A DTRANS DTRANS is one for Czech republic, Estonia, Hungary, Latvia, Lithuania, Poland, Slovakia and Slovenia.
Temporary transition rules applying to new (from 2004) EU members lifted (except Cyprus and Malta)
Positive
DUM2009B DSWI Switzerland joins the Schengen-area
Positive
1 DUMj (j=1977, 1981, 1991, 1993, 1994, 1997, 1998, 1999, 2000A, 2000B, 2001A, 2001B, 2005, 2006, 2007EU, 2007A, 2007B, 2008, 2009A, 2009B) is a dummy variable that is 0 before the year indicated and 1 from this year on. DDUM1974 is a dummy variable that is 0 before 1974, equal to 0.917 (≈11/12) in 1974 and 1 from 1975 on. DDUM2003 is zero before 2003, 0.5 in 2003 and 1 in the years thereafter. DDUM2004 is zero before 2004, 0.67 (≈2/3) in 2004 and 1 in the years thereafter.
31
Table B2. The number of observations by countries in different cases Country Current
number Number of
observations Are timeseries for Gini-index
available?
Is the country involved in simulation
experiment I?
Is the country involved in simulation
experiment II? Afghanistan 1 23 No Yes Yes Albania 2 19 Yes No Yes Algeria 3 39 Yes Yes Yes Angola 4 24 No No Yes Argentina 5 42 Yes Yes Yes Armenia 6 11 Yes No Yes Australia 7 42 Yes Yes Yes Austria 8 42 Yes Yes Yes Azerbaijan 9 13 Yes No Yes Bahrain 11 10 No No Yes Bangladesh 12 35 Yes No Yes Belarus 14 17 Yes No Yes Belgium 15 42 Yes Yes Yes Benin 17 5 No No No Bhutan 18 14 No No Yes Bolivia 19 37 Yes Yes Yes Bosnia Herzegovina 20 18
No No Yes
Botswana 21 33 Yes No Yes Brazil 22 42 Yes Yes Yes Brunei 23 9 No No Yes Bulgaria 24 35 Yes Yes Yes Burundi 26 11 No No Yes Cambodia 27 12 Yes No Yes Cameroon 28 35 Yes No Yes Canada 29 42 Yes Yes Yes Cape Verde 30 14 No No Yes Chile 33 39 Yes Yes Yes China 34 42 Yes Yes Yes Colombia 35 39 Yes Yes Yes Congo 37 39 No Yes Yes Congo Brazzaville 38 33 No No Yes Costa Rica 39 33 Yes No Yes Cote Divoire 40 35 Yes No Yes Croatia 41 18 Yes No Yes Cuba 42 17 No No Yes Cyprus 43 26 Yes No Yes Czech Republic 44 17 Yes No Yes Denmark 45 42 Yes Yes Yes Dominican Republic
47 32
Yes No Yes
Ecuador 48 35 Yes No Yes Egypt 49 42 Yes Yes Yes El Salvador 50 10 Yes No Yes Eritrea 52 16 No No Yes Estonia 53 19 Yes No Yes Ethiopia 54 42 No Yes Yes Finland 56 42 Yes Yes Yes France 57 42 Yes Yes Yes Gambia 59 35 No No Yes Germany 61 39 Yes Yes Yes Ghana 62 39 No Yes Yes Greece 63 42 Yes Yes Yes Guatemala 65 31 Yes No Yes Guinea 66 10 Yes Yes Yes Guyana 68 2 No No No Honduras 70 11 Yes No Yes

32
Table B2 (Continued)
Country Current number
Number of observations
Are timeseries for Gini-index available?
Is the country involved in simulation experiment I?
Is the country involved in simulation experiment II?
Hong Kong 71 42 Yes Yes Yes Hungary 72 39 Yes Yes Yes Iceland 73 42 No Yes Yes India 74 42 Yes Yes Yes Indonesia 75 42 Yes Yes Yes Iran 76 42 Yes Yes Yes Iraq 77 24 No No Yes Ireland 78 42 Yes Yes Yes Israel 79 42 Yes Yes Yes Italy 80 42 Yes Yes Yes Jamaica 81 28 Yes Yes Yes Japan 82 42 Yes Yes Yes Jordan 83 26 Yes Yes Yes Kazakhstan 84 13 Yes No No Kenya 85 42 Yes Yes Yes Kuwait 86 20 No No Yes Kyrgyzstan 87 7 Yes No No Laos 88 12 No No Yes Latvia 89 19 Yes No Yes Lebanon 90 39 No Yes Yes Liberia 92 26 No Yes Yes Libya 93 35 No Yes Yes Lithuania 94 19 Yes No Yes Luxembourg 95 35 Yes No Yes Macao 96 10 No No No Macedonia 97 16 Yes No Yes Madagascar 98 35 Yes No Yes Malawi 99 11 Yes No Yes Malaysia 100 35 Yes No Yes Mali 102 24 Yes No Yes Malta 103 19 No No Yes Mauritius 105 14 Yes No Yes Mexico 106 42 Yes Yes Yes Moldova 108 11 Yes No Yes Mongolia 109 13 No No Yes Morocco 111 39 Yes Yes Yes Mozambique 112 28 No No Yes Namibia 113 18 No No Yes Nepal 114 34 No Yes Yes Netherlands 115 42 Yes Yes Yes New Zealand 116 42 Yes Yes Yes Nicaragua 117 24 Yes No Yes Nigeria 119 40 Yes Yes Yes Oman 121 26 No No Yes Pakistan 122 39 Yes Yes Yes Paraguay 125 29 Yes Yes Yes Peru 126 39 Yes Yes Yes Philippines 127 42 Yes Yes Yes Poland 128 39 Yes Yes Yes Portugal 129 42 Yes Yes Yes Qatar 131 35 No No Yes Romania 132 33 Yes Yes Yes Russia 133 18 Yes No Yes Rwanda 134 19 No No Yes Saudi Arabia 137 34 No No Yes Senegal 138 18 Yes No Yes Sierra Leone 140 30 No No Yes

33
Table B2 (Continued)
Country Current number
Number of observations
Are timeseries for Gini-index available?
Is the country involved in simulation experiment I?
Is the country involved in simulation experiment II?
Singapore 141 35 Yes No Yes Slovakia 142 17 Yes No Yes Slovenia 143 7 Yes No Yes Somalia 145 27 No No Yes South Africa 146 42 Yes Yes Yes South Korea 147 39 Yes Yes Yes Spain 148 42 Yes Yes Yes Sri Lanka 149 35 Yes No Yes Sudan 152 36 No Yes Yes Swaziland 154 6 No No Yes Sweden 155 42 Yes Yes Yes Switzerland 156 42 Yes Yes Yes Syria 157 29 No No Yes Tajikistan 158 6 Yes No No Tanzania 159 42 Yes Yes Yes Thailand 160 39 Yes Yes Yes Togo 162 16 No No Yes Trinidad and Tobago 164 30 No No Yes Tunisia 165 39 Yes Yes Yes Turkey 166 42 Yes Yes Yes Uganda 168 33 Yes Yes Yes Ukraine 169 18 Yes No Yes United Arab Emirates 170 25 No No Yes United Kingdom 171 42 Yes Yes Yes United States 172 42 Yes Yes Yes Uruguay 173 20 Yes Yes Yes Uzbekistan 174 10 Yes No Yes Venezuela 176 40 Yes Yes Yes Vietnam 177 34 Yes Yes Yes Yemen 178 12 Yes No Yes Zambia 179 38 Yes Yes Yes Zimbabwe 180 31 No Yes Yes Serbia and Montenegro
185 19 No No Yes
Total 4,220

34
Table B3. Countries included in estimations involving the origin unemployment rate1 Country Current number Australia 7 Austria 8 Belgium 15 Canada 29 Czech Republic 44 Denmark 45 Estonia 53 Finland 56 France 57 Germany 61 Greece 63 Hungary 72 Icelanda 73 Ireland 78 Israel 79 Italy 80 Japan 82 Luxembourg 95 Mexico 106 Netherlands 115 New Zealand 116 Poland 128 Portugal 129 Slovakia 142 South Korea 147 Spain 148 Sweden 155 Switzerland 156 Turkey 166 United Kingdom 171 United States 172 1In the estimation where both the Gini ratio variable and the origin unemployment rate are used as regressors. Iceland is omitted since one does not have access to a time series of Gini coefficents for this country.

35
Table B4. Countries omitted from the econometric analyses and their total number of immi-grants to Norway 1967−2010
Country Current number
Total number of immigrants 1967−2010
Bahamas 10 76Barbados 13 68Belize 16 20Burkina Faso 25 52Central African Republic 31 9Chad 32 32Comoros 36 6Djibouti 46 88Equatorial Guinea 51 30Fiji 55 62Gabon 58 124Grenada 64 38Guinea Bissau 67 41Haiti 69 49Lesotho 91 72Maldives 101 58Mauritania 104 33Micronesia 107 9Niger 118 86Panama 123 131Papua New Guinea 124 39Puerto Rico 130 13Samoa 135 20Sao Tome and Principe 136 2Salomon Islands 144 6St. Lucia 150 13St. Vincent and the Grenadines 151 12Suriname 153 46Timor Leste 161 33Tonga 163 18Turkmenistan 167 50Vanuatu 175 3
36
Appendix C. Description of migration policy dummies In 1957 a law concerning foreigners was passed (“Fremmedloven”), basically enacting a liberal
regime for immigration to Norway. One could come to Norway without a work permit and apply for
the permit after having arrived. There was no assessment of skill requirements for work, and after two
years of residence you were granted permanent residence permit. In 1971 this law was slightly
modified. A potential immigrant had to apply for work before coming to Norway and had to have
arranged for some kind of accommodation before a permit was granted.27 In 1975 this rather liberal
regime was formally modified by the introduction of new regulations based on the 1957 law. Changes
took place in how the law was enforced, and included a ban on general work permits: the employers
now had to confirm that the immigrant was a specialist, the work had to last at least one year, and the
immigrant had to be literate (in his or her mother tongue). However, there were also some elements of
liberalisation relating to possibilities of family reunions. We introduce a policy dummy for this change
specified as a step dummy since this change has been in effect ever since. There were preliminary
changes introduced in February 1974 and formally made in 1975 so the variable DDUM1974 is zero
until 1973 and 1 for the years 1975−2009 and roughly 0.9 in 1974. In principle all (non-Nordic)
countries are affected by the dummy and we expect the estimated effect of the policy change to be
negative.
In 1977 a change in a regulation was introduced stating that residence would not be granted to persons
entering Norway illegally. We expect DUM1977 (that is zero before 1977 and one thereafter) to enter
with a negative sign. In 1981 a number of minor changes to immigration rules were introduced that
generally made it easier for immigrants to enter and stay. Foreigners coming to Norway to study or go
to school would be granted a residence permit and foreign students were also given a work permit.
When studies had been completed it was made easier for foreigners to remain and work in Norway. A
step dummy (DUM1981) is introduced, taking on the value of one from 1981 being zero before that
year. We expect the effect of this dummy to enter with a positive sign.
In 1991 a number of minor changes in how immigration policies were practised took place. Family
reunion was made easier and immigrants without a residence permit were granted a residence permit
while the application was considered. Some minor changes were of a more restrictive nature, but all in
27 In line with the policy dummies introduced in this section one could ask why we have not tried to estimate any effect of the 1971 change in regulations. The answer is that we have tried but the result was that the estimated coefficient had the wrong sign and was also insignificant perhaps due to few observations before 1971. This result is available upon request.
37
all we expect these changes captured by DUM1991 to have a positive effect on immigration from 1991
and onwards.
Norway joined the European Economic Area (EEA) in 1994. In practice this meant that citizens of the
EU gained free access to work in Norway for three months or to stay for six months as job-seekers, as
well as getting in principle the same social benefits as Norwegian citizens. Although there was a time
limit to the length of residence without obtaining a residence permit, there were in practice unlimited
possibilities for extensions. We expect DUM1994 to enter with a positive sign for all members of the
EEA.
In 1997 a liberalisation took place in accordance with the Geneva-convention on how refugees should
be handled by the immigration authorities in Norway. The changes were related to immigrants from
countries in civil war. DUM1997 is not expected to affect many countries and therefore not to be
important for overall immigration but is expected to enter with a positive sign.
Another liberalisation took place in 1998 affecting people who are persecuted in their home country
for various reasons. The rules regarding refugees were to be interpreted in a more liberal way. We
expect DUM1998 to affect immigration to Norway positively and (in principle) affect all countries.
In 1999 the UN convention on children and women was made part of the Norwegian legislation. In
addition work permits were given for different lengths of time and did not expire automatically after
two years. All these changes are expected to lead DUM1999 to enter with a positive sign. The changes
are expected to affect all countries.
In 2000 a liberalisation took place relating to work permits for specialists with competences that are in
excess demand in the Norwegian labour market. DUM2000A is expected to enter with a positive sign.
Also Iraqis were granted easier access to Norway captured by DUM2000B.
In 2001 Norway joined the Schengen agreement that identifies countries covered by a common policy
for issuing short term visitors’ visa that are valid for all visits to all countries that are party to the
convention. It also extends the area where as a citizen of a member country you do not need a passport to
enter one of the other member countries (but you may need another form of identity document). The
Schengen agreement covers most members of the EU as well as all EFTA countries, but not all member
countries joined in 2001. The convention may have limited immigration to Norway for some non-

38
Schengen countries. We capture the effect of the Schengen agreement by two intervention dummies,
labelled DUM2001A and DUM2001B. The former is directed to the Schengen countries, whereas the
latter is directed towards the countries outside the Schengen area. A priori we expect DUM2001A to
enter with a positive effect and DUM2001B with a negative effect.
The liberalisation of 1997 was partly reversed in May 2003. Former asylum applicants had previously
been exempted from the requirement to provide for family member applying for a residence permit. From
2003 this exemption would no longer apply to those families whose reference person had been granted a
residence permit on humanitarian grounds following an asylum application, as long s/he had not yet been
granted a permanent residence permit. In practice this tightening of rules applied mainly to immigrants
from Afghanistan, Iraq, Somalia and former Yugoslavia, although in theory it is more general. So
DDUM2003 is zero before 2003, equal to one half in 2003 and one thereafter, and is expected to enter
with a negative sign.
In 2004 a number of countries joined the EU and citizens of these countries then also gained easier
access to Norway. Some transition rules were put in place (lifted in 2007 and 2009) but it seems that in
practice they limited immigration only marginally. Thus, DDUM2004 affects only the new members
of the EU from that year and is expected to affect immigration from these countries positively.
In 2005 two changes in policy were introduced, enabling Iraqis and Vietnamese boat refugees (or near
relatives) living in the Philippines easier access to Norway. Hence DUM2005 only applies to Iraq and
The Philippines.28 The dummy is expected to affect immigration from these two countries positively.
A more restrictive policy was introduced in 2006. Foreigners who had arrived on tourist visa and then
applied for family reunion were now less likely to be granted residence. This applied in principle to all
countries and DUM2006 is expected to enter with a negative sign.
In 2007 a number of changes in regulations affecting potential immigrants from EEA countries as well
as more generally were made. The new EU members in 2004 were included in the Schengen area. This
is captured by the dummy DUM2007A. Bulgaria and Romania became members of the EU but with
some restrictions on access to Norway (parallel to those imposed on new EU-members in 2004). The
effect of this is captured by DUM2007EU. Asylum seekers whose application was rejected and who
had not managed to return within 3 years, from no fault of their own, could be granted a residence
28 Note that because our statistics are for country of previous residence, not citizenship the dummy applies to the Philippines and Iraq and not Vietnam.

39
permit. We expect DUM2007B to enter with a positive sign and apply to all countries except the EU
and EEA countries. All these dummies are expected to enter with a positive sign.
2008 saw a tightening of rules related to family reunion when authorities made it more difficult for
family members to enter if the ability to provide for the family was not met. DUM2008 is expected to
enter with a negative sign.
Finally in 2009 transitional restriction affecting the countries that joined EU in 2004 (except Cyprus
and Malta) are lifted and the DUM2009A is expected to enter with a positive sign but to affect only
citizens of those countries. In 2009 Switzerland joins Schengen and this is captured by DUM2009B.29
29 The Norwegian implementation of the EU Free Movements Directive from 1. October 2009, cf. Footnote 1, was too late to be included in this analysis.

Statistics Norway
Oslo:PO Box 8131 DeptNO-0033 OsloTelephone: + 47 21 09 00 00Telefax: + 47 21 09 00 40
Kongsvinger:NO-2225 KongsvingerTelephone: + 47 62 88 50 00Telefax: + 47 62 88 50 30
E-mail: [email protected]: www.ssb.no
ISSN 0809-733X
Returadresse:Statistisk sentralbyråNO-2225 KongsvingerB