Embed Size (px)
Citation preview

Page 1/7
Detection of SARS-CoV-2-speci�c antibodies via rapid diagnosticimmunoassays in COVID-19 patientsJira Chansaenroj
Center of Excellence in Clinical virology, Chulalongkorn UniversityRitthideach Yorsaeng
Center of Excellence in Clinical Virology, Chulalongkorn UniversityNawarat Posuwan
Center of Excellence in Clinical Virology, Chulalongkorn UniversityJiratchaya Puenpa
Center of Excellence in Clinical Virology, Chulalongkorn UniversityNatthinee Sudhinaraset
Center of Excellence in Clinical Virology, Chulalongkorn UniversityChintana Chirathaworn
Center of Excellence in Clinical Virology, Chulalongkorn UniversityYong Poovorawan ( [email protected] )
Chulalongkorn University
Research
Keywords: antibody, COVID-19, immunoassay, rapid diagnostic test, SARS-CoV-2
Posted Date: February 2nd, 2021
DOI: https://doi.org/10.21203/rs.3.rs-125190/v2
License: This work is licensed under a Creative Commons Attribution 4.0 International License. Read Full License
Version of Record: A version of this preprint was published on March 9th, 2021. See the published version at https://doi.org/10.1186/s12985-021-01530-2.
Page 2/7
AbstractBackground: E�cient monitoring and control of coronavirus disease 2019 (COVID-19) require access to diagnostic tests, and serological diagnostictesting is desirable. In the current study, antibodies were investigated in patients recently diagnosed with severe acute respiratory syndromecoronavirus 2 (SARS-CoV-2) infection.
Methods: Cross-sectional data were obtained from 245 patients in whom SARS-CoV-2 infection had been con�rmed via real-time reversetranscriptase-polymerase chain reaction between March and October 2020. Serum samples were acquired between 2 and 60 days following the onsetof COVID-19 symptoms or the �rst detection of SARS-CoV-2 in asymptomatic patients. All specimens were tested simultaneously using an IgM/IgGrapid diagnostic test (RDT), IgG nucleocapsid protein-based chemiluminescent microparticle immunoassay (CMIA), IgG, and IgA spike protein-basedenzyme-linked immunosorbent assays (ELISAs). Blood donor samples obtained in 2018 were used as negative controls.
Results: The sensitivity and speci�city of the RDT IgG were compared with the IgG immunoassays as standards. The RDT IgG exhibited 97.5%sensitivity and 89.4% speci�city compared with a CMIA IgG, 98.4% sensitivity, and 78.8% speci�city compared with an ELISA IgG. IgM, IgG, and IgAseropositivity rates were low between 1-2 weeks after COVID-19 symptom onset or the detection of SARS-CoV-2 RNA. IgM seropositivity rate begandecreasing after 4 weeks, whereas IgG and IgA seropositivity rate remained at appreciable levels over the 8-week study period. No cross-reactivity withseasonal coronaviruses was detected.
Conclusions: IgM/IgG RDTs alone or combined with molecular diagnostic tests may be useful for identifying recent SARS-CoV-2 infection.
BackgroundSevere acute respiratory syndrome coronavirus 2 (SARS-CoV-2) causes an acute respiratory tract illness known as coronavirus disease 2019 (COVID-19) [1]. The incubation period ranges from 1 to 14 days. SARS-CoV-2 can be initially detected in upper respiratory tract samples 1 to 2 days beforesymptom onset and can persist for 7 to 12 days in moderate cases and for up to 2 weeks in severe cases [2]. Due to a rapid rise in the number ofcases and uncontrolled spread, the World Health Organization declared SARS-CoV-2 a world pandemic on 11 March 2020 [3]. Awareness of COVID-19outbreaks in individual countries is important with regard to effective diagnosis and control. Many countries can control morbidity, and asymptomaticSARS-CoV-2 infection does occur.
The most important strategies for controlling transmission are active case identi�cation, patient isolation, contact tracing, and social distancing [4].Accordingly, the use of rapid and easy to perform diagnostic methods during the early phase of COVID-19 has facilitated early laboratory diagnosis ofinfection with high sensitivity, particularly in asymptomatic and/or preclinical patients, and they are evidently a key factor to success [5]. Real-timereverse transcriptase-polymerase chain reaction (RT-PCR)-based methods designed to detect SARS‐CoV-2 in nasopharyngeal swabs are currently thegold standard for COVID-19 diagnosis [6]. Notably, however, molecular diagnostic approaches require technical expertise and equipment and can becomparatively costly.
Serological assessments are an alternative for surveillance purposes and include point-of-care techniques that may constitute readily available andeasy to apply tools [7]. They can generally be performed in relatively small community settings, facilitating broad application. Their utility may belimited by the fact that antibodies appear later during the disease course. Positive molecular testing is reportedly crucial for optimal serologicaltesting sensitivity, with the best results evidently being achieved at least 14 days after a positive real-time RT-PCR result. At later post-infection stages,serology can become negative [8, 9]. Patients with more severe symptoms develop greater immune responses against viral proteins thanasymptomatic patients [10, 11].
Immunoassays are the standard diagnostic method for precise and quantitative detection, wherein binding of speci�c antibodies is used to determinewhether a patient has previously been infected [12]. The sensitivity of antibody testing evidently depends on sampling time, but in most studies, themedian time to antiviral IgG seroconversion is reportedly between 6 and 14 days from symptom onset, and high IgG persists for at least 7 weeks [11].Several assays are currently available for the detection of antibodies against various SARS-CoV-2 proteins, including the spike protein, nucleocapsidprotein, and receptor-binding domain. Variable clinical sensitivity and speci�city of these tests have been reported in numerous independentstudies [11, 13, 14]. Lateral �ow immunoassays are an attractive alternative, as they require less operator skill and can potentially be utilized in point-of-care settings.
In the current study, serological assays for COVID-19 diagnosis, including the COVID-19 IgM/IgG rapid diagnostic test (RDT), IgG nucleocapsid protein-based chemiluminescent microparticle immunoassay (CMIA), IgG and IgA spike protein-based enzyme-linked immunosorbent assays (ELISAs) wereevaluated. The sensitivity and speci�city of RDT IgG were compared with the IgG immunoassays using serum samples from COVID-19patients. Serum samples collected from volunteers in 2018, i.e., before the COVID-19 outbreak, were used to test speci�city.
Materials And MethodsThe study protocol was approved by the Research Ethics Committee of the Faculty of Medicine, Chulalongkorn University (IRB number 572/63), andthat committee waived the requirement for consent because the samples used were obtained during the course of routine preventive measures and

Page 3/7
were de-identi�ed and anonymous.
Specimen collection
A cross-sectional set of serum samples derived from 245 patients in whom SARS-CoV-2 infection had been con�rmed via real-time RT-PCR of nasalswab specimens or who had a previous SARS-CoV-2-positive diagnostic test result in their medical record from the hospital and public health centerwere used in the study between March and October 2020. Samples from all 245 patients (138 from the National Blood Center, 107 from BangkokMetropolitan Administration Hospital) were obtained during the period between COVID-19 symptom onset and serum sample acquisition for serologytesting to monitor the presence of antibodies against SARS-CoV-2. For samples from asymptomatic patients, the period was calculated from the �rstdate of SARS‐CoV-2 detection via real-time RT-PCR to the date of serum sample acquisition. The interval between symptom onset or RT-PCR positivityand serum sampling for serological tests in this study ranged from 2 days to 60 days. A total of 130 blood donor specimens collected in 2018 wereused as negative control samples.
IgM/IgG rapid diagnostic test
The Standard Q COVID-19 IgM/IgG Combo test (SD biosensor, Chungcheongbuk-do, Republic of Korea) is a rapid chromatographic immunoassay forthe qualitative detection of SARS-CoV-2-speci�c antibodies. This test was performed according to the manufacturer’s instructions(http://sdbiosensor.com/xe/product/12509). The test utilizes recombinant COVID-19 nucleocapsid protein conjugated to colloidal gold particles asdetectors, and SARS-CoV-2-speci�c IgM and IgG antibodies are detected simultaneously. A violet test line is visible if SARS-CoV-2 antibodies arepresent in the specimen. The visual intensity of the violet test line varies depending on the amount of SARS-CoV-2 antibodies present in the specimen.A visual intensity ratio ranging from 0 to 3 compared to a control line is scored, where 0 = no intensity, 1 = weak intensity, 2 = medium intensity, and 3= strong intensity. In the current study, all results of this assay were interpreted by three different people independently to measure positivity.
IgG and IgA spike protein-based enzyme-linked immunosorbent assays
Anti-SARS-CoV-2 IgG and IgA enzyme-linked immunosorbent assays (ELISAs) (EUROIMMUN, Lubeck, Germany) are enzymatic immunoassays thatprovide semi-quantitative in vitro determination of human IgG and IgA antibodies against the S1 domain of the SARS-CoV-2 spike protein. Opticaldensity was measured at 450 nm. The results can be evaluated semi-quantitatively by calculating the ratio of the control or patient sample over theextinction of the calibrator. Samples with a cutoff ratio higher than 1.1 were considered positive. All ELISAs were tested and interpreted automaticallyusing the Analyzer I-2P machine (EUROIMMUN, Lubeck, Germany).
IgG nucleocapsid protein-based chemiluminescent microparticle immunoassay
The SARS-CoV-2 IgG chemiluminescent microparticle immunoassay (CMIA) (Abbott Ireland Diagnostics Division, Sligo, Ireland) is an automated two-step immunoassay for the quantitative detection of IgG antibodies against SARS-CoV-2. Samples were analyzed using an Abbott ARCHITECT I1000SR instrument. The ARCHITECT I system calculates the mean calibrator chemiluminescent signal. Results derived from test samples aremeasured as relative light units (RLU) and determined via comparison with the calibrator, and the cutoff is 1.4. There is a direct relationship betweenthe amount of SARS-CoV-2 antibodies in the sample and the RLU detected by the system.
Statistical analysis
Sensitivity and speci�city for detection of the presence of SARS-CoV-2 IgG antibodies were evaluated. Statistical analyses were performed using IBMSPSS Statistics for Windows, version 21 (IBM Corp., Armonk, NY, USA). Agreement rates and kappa coe�cients between immunoassays and RDTswere analyzed. The association between the amount of SARS-CoV-2 antibodies and the time period after COVID-19 symptom onset was analyzedusing the Chi-square test. Correlations between RDT IgG visual intensity scores and IgG immunoassay relative ratios were analyzed using one-wayANOVA. P < 0.05 was considered statistically signi�cant.
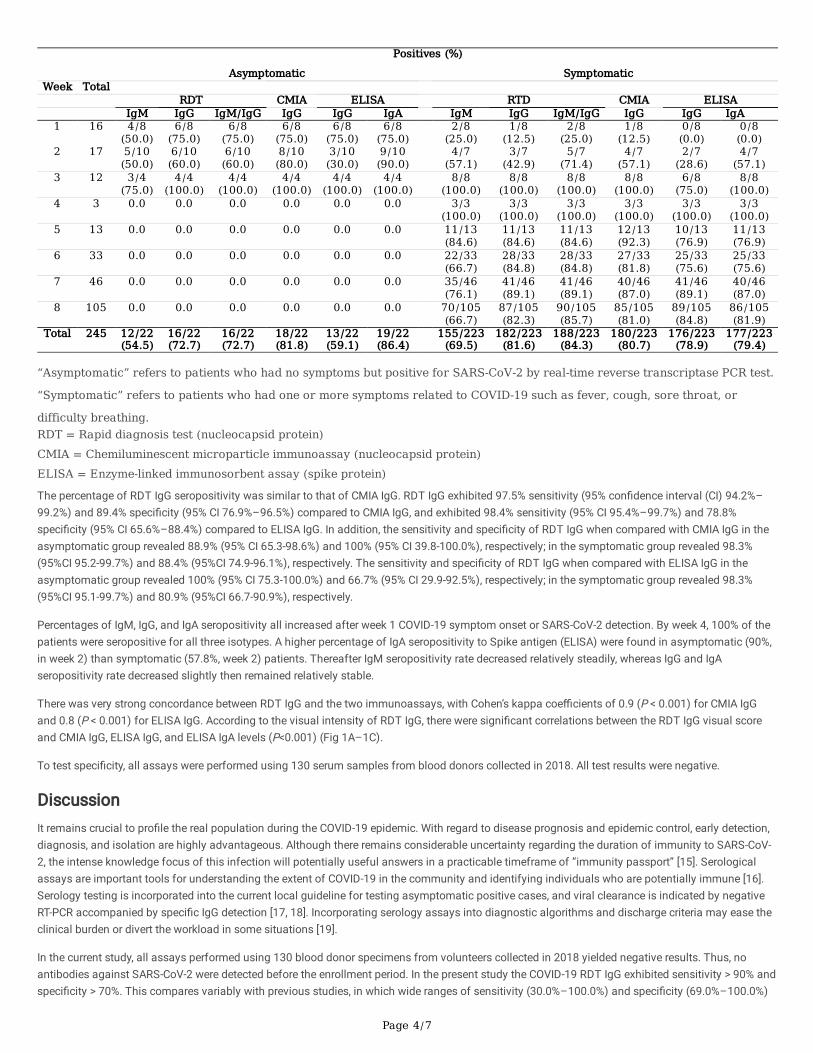
ResultsIn the current study, the interval between symptom onset or initial SARS-CoV-2 detection and serum sample acquisition for serology testing wasassessed by week. The mean (±Standard deviation, SD) and median interval in this study were 41.6 ± 17.1 days and 47 days, respectively. Overall,167/245 (68.2%) individuals tested seropositive for RDT IgM, 198/245 (80.8%) for RDT IgG, 198/245 (80.8%) for CMIA IgG, 189/245 (77.1%) forELISA IgG, and 196/245 (80.0%) for ELISA IgA. Six patients were RDT IgM-positive but RDT IgG-negative. The RDT positive (IgM and/or IgG) detectionrate increased to 204/245 (83.3%) when both IgG and IgM were assessed (Table 1).
Table 1 Distribution of SARS-CoV-2-specific antibodies detection in COVID-19 patients.
Page 4/7
Positives (%)
Asymptomatic SymptomaticWeek Total
RDT CMIA ELISA RTD CMIA ELISA IgM IgG IgM/IgG IgG IgG IgA IgM IgG IgM/IgG IgG IgG IgA1 16 4/8
(50.0)6/8
(75.0)6/8
(75.0)6/8
(75.0)6/8
(75.0)6/8
(75.0) 2/8
(25.0)1/8
(12.5)2/8
(25.0)1/8
(12.5)0/8
(0.0)0/8
(0.0)2 17 5/10
(50.0)6/10
(60.0)6/10
(60.0)8/10
(80.0)3/10
(30.0)9/10
(90.0) 4/7
(57.1)3/7
(42.9)5/7
(71.4)4/7
(57.1)2/7
(28.6)4/7
(57.1)3 12 3/4
(75.0)4/4
(100.0)4/4
(100.0)4/4
(100.0)4/4
(100.0)4/4
(100.0) 8/8
(100.0)8/8
(100.0)8/8
(100.0)8/8
(100.0)6/8
(75.0)8/8
(100.0)4 3 0.0 0.0 0.0 0.0 0.0 0.0 3/3
(100.0)3/3
(100.0)3/3
(100.0)3/3
(100.0)3/3
(100.0)3/3
(100.0)5 13 0.0 0.0 0.0 0.0 0.0 0.0 11/13
(84.6)11/13(84.6)
11/13(84.6)
12/13(92.3)
10/13(76.9)
11/13(76.9)
6 33 0.0 0.0 0.0 0.0 0.0 0.0 22/33(66.7)
28/33(84.8)
28/33(84.8)
27/33(81.8)
25/33(75.6)
25/33(75.6)
7 46 0.0 0.0 0.0 0.0 0.0 0.0 35/46(76.1)
41/46(89.1)
41/46(89.1)
40/46(87.0)
41/46(89.1)
40/46(87.0)
8 105 0.0 0.0 0.0 0.0 0.0 0.0 70/105(66.7)
87/105(82.3)
90/105(85.7)
85/105(81.0)
89/105(84.8)
86/105(81.9)
Total 245 12/22(54.5)
16/22(72.7)
16/22(72.7)
18/22(81.8)
13/22(59.1)
19/22(86.4)
155/223(69.5)
182/223(81.6)
188/223(84.3)
180/223(80.7)
176/223(78.9)
177/223(79.4)
“Asymptomatic” refers to patients who had no symptoms but positive for SARS-CoV-2 by real‐time reverse transcriptase PCR test.
“Symptomatic” refers to patients who had one or more symptoms related to COVID-19 such as fever, cough, sore throat, or
difficulty breathing.RDT = Rapid diagnosis test (nucleocapsid protein)CMIA = Chemiluminescent microparticle immunoassay (nucleocapsid protein)ELISA = Enzyme-linked immunosorbent assay (spike protein)
The percentage of RDT IgG seropositivity was similar to that of CMIA IgG. RDT IgG exhibited 97.5% sensitivity (95% con�dence interval (CI) 94.2%–99.2%) and 89.4% speci�city (95% CI 76.9%–96.5%) compared to CMIA IgG, and exhibited 98.4% sensitivity (95% CI 95.4%–99.7%) and 78.8%speci�city (95% CI 65.6%–88.4%) compared to ELISA IgG. In addition, the sensitivity and speci�city of RDT IgG when compared with CMIA IgG in theasymptomatic group revealed 88.9% (95% CI 65.3-98.6%) and 100% (95% CI 39.8-100.0%), respectively; in the symptomatic group revealed 98.3%(95%CI 95.2-99.7%) and 88.4% (95%CI 74.9-96.1%), respectively. The sensitivity and speci�city of RDT IgG when compared with ELISA IgG in theasymptomatic group revealed 100% (95% CI 75.3-100.0%) and 66.7% (95% CI 29.9-92.5%), respectively; in the symptomatic group revealed 98.3%(95%CI 95.1-99.7%) and 80.9% (95%CI 66.7-90.9%), respectively.
Percentages of IgM, IgG, and IgA seropositivity all increased after week 1 COVID-19 symptom onset or SARS-CoV-2 detection. By week 4, 100% of thepatients were seropositive for all three isotypes. A higher percentage of IgA seropositivity to Spike antigen (ELISA) were found in asymptomatic (90%,in week 2) than symptomatic (57.8%, week 2) patients. Thereafter IgM seropositivity rate decreased relatively steadily, whereas IgG and IgAseropositivity rate decreased slightly then remained relatively stable.
There was very strong concordance between RDT IgG and the two immunoassays, with Cohen’s kappa coe�cients of 0.9 (P < 0.001) for CMIA IgGand 0.8 (P < 0.001) for ELISA IgG. According to the visual intensity of RDT IgG, there were signi�cant correlations between the RDT IgG visual scoreand CMIA IgG, ELISA IgG, and ELISA IgA levels (P<0.001) (Fig 1A–1C).
To test speci�city, all assays were performed using 130 serum samples from blood donors collected in 2018. All test results were negative.
DiscussionIt remains crucial to pro�le the real population during the COVID-19 epidemic. With regard to disease prognosis and epidemic control, early detection,diagnosis, and isolation are highly advantageous. Although there remains considerable uncertainty regarding the duration of immunity to SARS-CoV-2, the intense knowledge focus of this infection will potentially useful answers in a practicable timeframe of “immunity passport” [15]. Serologicalassays are important tools for understanding the extent of COVID-19 in the community and identifying individuals who are potentially immune [16].Serology testing is incorporated into the current local guideline for testing asymptomatic positive cases, and viral clearance is indicated by negativeRT-PCR accompanied by speci�c IgG detection [17, 18]. Incorporating serology assays into diagnostic algorithms and discharge criteria may ease theclinical burden or divert the workload in some situations [19].
In the current study, all assays performed using 130 blood donor specimens from volunteers collected in 2018 yielded negative results. Thus, noantibodies against SARS-CoV-2 were detected before the enrollment period. In the present study the COVID-19 RDT IgG exhibited sensitivity > 90% andspeci�city > 70%. This compares variably with previous studies, in which wide ranges of sensitivity (30.0%–100.0%) and speci�city (69.0%–100.0%)

Page 5/7
have been reported. Variation is affected by many things, such as the population sampled and the period of symptom onset [13, 20, 21]. The RDT IgGexhibited very strong concordance with immunoassays, with Cohen’s kappa coe�cients of 0.9 (P < 0.001) for CMIA IgG and 0.8 (P < 0.001) for ELISAIgG. Unfortunately, in the current study, only IgG immunoassays were compared to the IgG RDT with respect to sensitivity and speci�city. However, theresults suggest that the RDT can be considered an e�cient and useful additional tool for generating population-level epidemiological SARS-CoV-2infection statistics. The RDT constitutes a viable tool for rapidly identifying subjects who have been exposed to SARS-CoV-2 infection and developedantibodies.
In the current study IgM seropositivity after COVID-19 symptom onset increased from the �rst week, peaked approximately 3-4 weeks after symptomonset, then decreased moderately. IgG and IgA seropositivity rates peaked approximately 3-4 weeks after symptoms onset, then decreased slightly butremained relatively stable. These results are consistent with SARS-CoV-2 antibody responses reported in several previous studies, in which people whorecovered from infection typically had antibodies to the virus 1–2 weeks after infection [17, 22-24]. These antibody dynamics are similar to those ofacute viral infections generally, where IgG levels increase as IgM levels start to decrease [17, 25, 26].
The current study had some limitations. As no data on the exposure history were obtained from the asymptomatic patients, the positive RT-PCRresults may not represent early infection. Therefore, the appearance of IgA to Spike antigen within the �rst few weeks after RT-PCR positivity in theasymptomatic group may represent late IgA response against SARS-CoV-2. The specimens from the asymptomatic group were collected between 1and 3 weeks after RT-PCR positivity, whereas the specimens from the symptomatic group were collected between 1 and 8 weeks. There is alsocurrently no gold standard serological assay for comparative SARS-CoV-2/COVID-19 studies. Lastly, comparable tests to assess the sensitivity andspeci�city of IgM and IgA were not available during the study.
ConclusionIn conclusion, testing for antibodies may enable the assessment of SARS-CoV-2 infections in asymptomatic and symptomatic patients. Theavailability of tests with satisfactory performance will result in more accurate determination of the overall spread of COVID-19. The current feasibilityassessment of the RDT will guide SARS-CoV-2 antibody testing for the diagnosis and management of the disease. Improved serological testingperformance may improve the identi�cation and monitoring of people who have already had contact with SARS-CoV-2. This approach may enablerapid screening of immunity in the population, particularly in areas identi�ed as “hotspots”, which may be informative with regard to future responseand preventive measures.
AbbreviationsSARS-CoV-2: Severe acute respiratory syndrome coronavirus 2; COVID-19: Coronavirus disease 2019; RT-PCR: Reverse transcriptase-polymerase chainreaction; ELISA: Enzyme-linked immunosorbent assay; CMIA: Chemiluminescent microparticle immunoassay; RDT: Rapid diagnosis test; RLU: Relativelight units
DeclarationsEthics approval and consent to participate
The study was conducted with the approval of the Research Ethics Committee of the Faculty of Medicine, Chulalongkorn University (IRB number572/63), and that committee waived the requirement for consent because the samples used were obtained during the course of routine preventivemeasures and were de-identi�ed and anonymous.
Consent to participate: not applicable.
Consent for publication
Not applicable.
Availability of data and materials
The datasets used and/or analyzed during the current study are available from the corresponding author on reasonable request.
Competing interests
The authors declare no competing interests.
Funding
This study was supported by a Research Chair Grant from the National Science and Technology Development Agency (P-15-50004), the Center ofExcellence in Clinical Virology of Chulalongkorn University/King Chulalongkorn Memorial Hospital (GCE 59‐009-30-005), and the Second CenturyFund (C2F), Chulalongkorn University to Jira Chansaenroj.

Page 6/7
Author contributions
JC drafted the manuscript; JC, RY, NP, and JP analyzed the data and interpreted the results; JC, NS, CC, and YP designed the study; NS, CC, and YPrevised the manuscript. All authors reviewed the manuscript, provided critical feedback and approved the �nal draft.
Acknowledgments
We thank all trainees from the Department of Microbiology and Biochemistry, Faculty of Science, Chulalongkorn University, and all staff from theCenter of Excellence in Clinical Virology, Faculty of Medicine, Chulalongkorn University for their help with the testing.
Con�icts of interest
None declared. There is no involvement from the companies Seegene or SD Biosensor, EUROIMMUN and Abbott Ireland Diagnostics Division.
Author details
1Center of Excellence in Clinical Virology, Department of Pediatrics, Faculty of Medicine, Chulalongkorn University, Bangkok 10330, Thailand.2Department of Microbiology, Faculty of Medicine, Chulalongkorn University, Bangkok 10330, Thailand. 3Tropical Medicine Cluster, Faculty ofMedicine, Chulalongkorn University, Bangkok 10330, Thailand
References1. Coronaviridae Study Group of the International Committee on Taxonomy of V. The species Severe acute respiratory syndrome-related
coronavirus: classifying 2019-nCoV and naming it SARS-CoV-2. Nat Microbiol. 2020;5:536-44.
2. Del Rio C and Malani PN. COVID-19-New Insights on a Rapidly Changing Epidemic. JAMA. 2020;323:1339-40.
3. WHO. General's opening remarks at the media brie�ng on COVID-19. https://www.who.int/dg/speeches/detail/who-director-general-s-opening-remarks-at-the-media-brie�ng-on-covid-19-11-march-2020. Accessed on 11 March 2020.
4. Wang Z, Fu Y, Guo Z, Li J, Li J, Cheng H, et al. Transmission and prevention of SARS-CoV-2. Biochem Soc Trans. 2020;48:2307-16.
5. Rothe C, Schunk M, Sothmann P, Bretzel G, Froeschl G, Wallrauch C, et al. Transmission of 2019-nCoV Infection from an Asymptomatic Contact inGermany. N Engl J Med. 2020;382:970-1.
�. Lippi G, Simundic AM, Plebani M. Potential preanalytical and analytical vulnerabilities in the laboratory diagnosis of coronavirus disease 2019(COVID-19). Clin Chem Lab Med. 2020;58:1070-6.
7. Zhen W, Smith E, Manji R, Schron D, Berry GJ. Clinical Evaluation of Three Sample-to-Answer Platforms for Detection of SARS-CoV-2. J ClinMicrobiol. 2020;58(8):e00783-20.
�. Andrey DO, Cohen P, Meyer B, Torriani G, Yerly S, Mazza L, et al. Diagnostic accuracy of Augurix COVID-19 IgG serology rapid test. Eur J ClinInvest. 2020;50:e13357.
9. Lai CC, Wang CY, Ko WC, Hsueh PR. In vitro diagnostics of coronavirus disease 2019: Technologies and application. J Microbiol Immunol Infect.2020.
10. Choe PG, Kang CK, Suh HJ, Jung J, Kang E, Lee SY, et al. Antibody Responses to SARS-CoV-2 at 8 Weeks Postinfection in Asymptomatic Patients.Emerg Infect Dis. 2020;26:2484-7.
11. Naaber P, Hunt K, Pesukova J, Haljasmagi L, Rumm P, Peterson P, et al. Evaluation of SARS-CoV-2 IgG antibody response in PCR positive patients:Comparison of nine tests in relation to clinical data. PLoS One. 2020;15:e0237548.
12. Rashed MZ, Kopechek JA, Priddy MC, Hamorsky KT, Palmer KE, Mittal N, et al. Rapid detection of SARS-CoV-2 antibodies using electrochemicalimpedance-based detector. Biosens Bioelectron. 2020;171:112709.
13. Augustine R, Das S, Hasan A, S A, Abdul Salam S, Augustine P, et al. Rapid Antibody-Based COVID-19 Mass Surveillance: Relevance, Challenges,and Prospects in a Pandemic and Post-Pandemic World. J Clin Med. 2020;9:3372.
14. Lisboa Bastos M, Tavaziva G, Abidi SK, Campbell JR, Haraoui LP, Johnston JC, et al. Diagnostic accuracy of serological tests for covid-19:systematic review and meta-analysis. BMJ. 2020;370:m2516.
15. Brown RCH, Kelly D, Wilkinson D, Savulescu J. The scienti�c and ethical feasibility of immunity passports. Lancet Infect Dis. 2020.
1�. Sethuraman N, Jeremiah SS, Ryo A. Interpreting Diagnostic Tests for SARS-CoV-2. JAMA. 2020;323:2249-51.
17. Guo L, Ren L, Yang S, Xiao M, Chang, Yang F, et al. Pro�ling Early Humoral Response to Diagnose Novel Coronavirus Disease (COVID-19). ClinInfect Dis. 2020;71:778-85.
1�. Zhang W, Du RH, Li B, Zheng XS, Yang XL, Hu B, et al. Molecular and serological investigation of 2019-nCoV infected patients: implication ofmultiple shedding routes. Emerg Microbes Infect. 2020;9:386-9.
19. Xiao SY, Wu Y, Liu H. Evolving status of the 2019 novel coronavirus infection: Proposal of conventional serologic assays for disease diagnosisand infection monitoring. J Med Virol. 2020;92:464-7.

Page 7/7
20. Ejazi SA, Ghosh S, Ali N. Antibody detection assays for COVID-19 diagnosis: an early overview. Immunol Cell Biol. 2020.
21. Guo CC, Mi JQ, Nie H. Seropositivity rate and diagnostic accuracy of serological tests in 2019-nCoV cases: a pooled analysis of individualstudies. Eur Rev Med Pharmacol Sci. 2020;24:10208-18.
22. To KK, Tsang OT, Leung WS, Tam AR, Wu TC, Lung DC, et al. Temporal pro�les of viral load in posterior oropharyngeal saliva samples and serumantibody responses during infection by SARS-CoV-2: an observational cohort study. Lancet Infect Dis. 2020;20:565-74.
23. Wolfel R, Corman VM, Guggemos W, Seilmaier M, Zange S, Muller MA, et al. Virological assessment of hospitalized patients with COVID-2019.Nature. 2020;581:465-9.
24. Zhao J, Yuan Q, Wang H, Liu W, Liao X, Su Y, et al. Antibody responses to SARS-CoV-2 in patients of novel coronavirus disease 2019. Clin InfectDis. 2020.
25. Zhou P, Yang XL, Wang XG, Hu B, Zhang L, Zhang W, et al. A pneumonia outbreak associated with a new coronavirus of probable bat origin.Nature. 2020;579:270-3.
2�. Long QX, Liu BZ, Deng HJ, Wu GC, Deng K, Chen YK, et al. Antibody responses to SARS-CoV-2 in patients with COVID-19. Nat Med. 2020;26:845-8.
Figures
Figure 1
Correlations between visual intensity scores of rapid diagnostic test IgG and CMIA IgG, ELISA IgG, and ELISA IgA levels. Red circles represent patientswith severe symptoms (symptomatic patients with pneumonia), green triangles represent patients with mild symptoms (symptomatic patients withoutpneumonia), and blue squares represent asymptomatic patients. (A) Chemiluminescent microparticle immunoassay IgG. (B) Enzyme-linkedimmunoassay IgG. (C) Enzyme-linked immunoassay IgA.