Embed Size (px)
Citation preview

Why Are Urban HospitalCosts So High?The Relative Importanceof Patient Source of Admission,Teaching, Competition, and Case MixKenneth E. Thorpe
This article examinesfactors accountingfor higher costs in urban hospitals as wellas their relative contribution to those costs. The costs of urban hospitals areinfluenced by case mix, wages, competition, the ratio of forecasted to actualadmissions, teaching, and the percentage of patients admitted through the emer-gency room. The bulk of the higher costs in urban hospitals are linked to graduatemedical education. Treatment of poor patients and the admission of patientsthrough the emergency room also contribute to the higher costs. Higher inpatientcosts stemmingfrom outpatient activities pose distributional problemsfor hospitalswhen these costs are not accountedfor in prospective (inpatient) rate-setting pro-grams.
Hospital costs in inner-city hospitals are significantly higher than inother facilities and persist even after controlling for case mix, wagerates, and teaching activity. Factors accounting for these differencesare not well understood and are complicated by differences in thehospital "product," service intensity, and technical efficiency. Despitethese problems, interest in the source of these cost differences has beenheightened with the move to prospective price setting and as employersand third-party payers have undertaken close examination of cost dif-ferences across hospitals.
A number of factors account for cost differences among inner-city,
Address correspondence and requests forreprints to Kenneth E. Thorpe, AssistantProfessor of Economics, Department of Health Policy and Management, HarvardSchool of Public Health, 677 Huntington Avenue, Boston MA 02115.

822 HSR: Health Services Research 22:6 (February 1988)
suburban, and rural hospitals. Included are case mix, input prices,teaching activity, the scope of specialized clinical services, and moreconservative staffing patterns in urban facilities due to greater varia-tion in patient admission patterns [1-3]. While many of these sourcesof cost variation among hospitals have received attention, the indepen-dent effect on costs has not been jointly examined. Moreover, the costimplications of a patient's source of hospital admission (for example,through the emergency room) independent of other factors have notbeen considered. For reasons discussed below, the percent of patientsadmitted through the emergency room may provide a measure ofseverity of illness not captured by the Medicare diagnosis-relatedgroup (DRG) case-mix index.
The goals of this article are twofold: first, to examine comprehen-sively the factors accounting for higher costs in urban hospitals, andsecond, to document empirically the relative importance of these fac-tors.
SOURCES OF HIGHER COSTS IN URBANHOSPITALS
In addition to input cost and case-mix differences, higher costs ininner-city hospitals stem from costs associated with treating low-income patients, differences in teaching commitment, and marketcompetition [1]. A brief discussion of these sources of cost variation isprovided below.
COSTS OF TREATING LOW-INCOME PATIENTS
Urban hospitals treat more severely ill patients, including a dispropor-tionate volume of low-income patients. For many medical problems,the costs of treating poor patients are higher than costs of otherpatients, and these differences are not sufficiently measured by existingcase-mix indexes [4].
For a number of reasons, the costs of treating low-income patientsmay be higher than treatment costs of other patients in the same DRG.First, poor patients may be more severely ill than other patients for anydiagnosis, due to complications or secondary health conditions (such aspoor nutritional status) which slow recovery time. Second, hospitalrestrictions on the volume of uncompensated care or increased costsharing may discourage patients from seeking care [5]. The genesis ofthis thesis dates at least to Roemer's comment that cost sharing, espe-

Urban Hospital Costs 823
cially for ambulatory care, would increase costs since lower-incomepatients would delay seeking care, thus becoming hospitalized at amore advanced disease stage [6]. Further, low-income patients oftenuse the emergency room as a substitute for the physician's office.Admission through the emergency room compounds the problemsnoted above. For instance, tests which are routinely completed outsidethe hospital are usually conducted, in an emergency room situation,after the patient is admitted. There is also some evidence that patientsadmitted through the emergency room are more severely ill than otherpatients.' For instance, average length of stay for patients admittedthrough the emergency room in New York City is nearly five dayslonger than for those admitted through outpatient department clinics,and nearly three days longer than for patients admitted by a physician[1]. These differences persist even after controlling for case mix. Fac-tors accounting for these differences are not precisely known.
Hospitals treating a significant volume of emergency cases maystaff more conservatively, maintaining greater staffed excess capacityto reduce the probability of turning patients away during peak periods[1, 7]. For instance, hospitals treating larger numbers of patientswhere admissions cannot be deferred (for instance, obstetric cases,emergency patients) are less able to smooth demand during peakperiods. Moreover, competitive interactions among hospitals in urbanareas serve to increase staffed excess capacity, thus reducing the proba-bility of patients turned away when the hospital is full [7].
Finally, length of stay may be extended for low-income patientsand costs may also be higher since these patients often lack the neces-sary financial and human support services after the acute care phase ofhospitalization is completed. Perhaps more important, those requiringlong-term care and currently without health insurance often must waitlong periods of time for nursing home placement. While this problemappears more prevalent in certain states, such as New York andCalifornia, where it constitutes a major source of hospital "backlog,"long stays and higher costs do reflect post-acute care placementproblems [8].
INDIRECT COSTS OF GRADUATE MEDICALEDUCATION
The indirect costs of graduate training have usually been definedempirically as cost differences remaining after all "relevant" factorshave been accounted for in hospital cost function estimates [9]. Factorsaccounting for the residual cost differences are not known precisely,

824 HSR: Health Services Research 22:6 (February 1988)
although they are usually attributed to variations in physician andresident practice patterns, including more intensive use of ancillaryservices. While a number of econometric studies have attempted toestimate the indirect costs of graduate medical education, there is littleconsensus regarding its definition or magnitude [20].
COST-INCREASING COMPETITION
Due to the pervasiveness of first-dollar health insurance coverage, hos-pitals traditionally have competed for physicians and their patients onthe basis of specialized clinical services and amenities rather than price[2]. As a result, competition among hospitals for patients has resultedin higher rather than lower hospital costs. Costs associated with abroader range of specialized services are not concentrated in a few case-mix categories; rather they are spread across many cost centers. Whilecase-mix measures standardize for variations in illness severity, they donot account for higher costs stemming from the mix of services offered.The magnitude of these additional costs generated from the greaterscope of available services is substantial in the most competitive mar-kets [2].
Whether higher costs resulting from the greater availability andmore intensive use of medical services represents inefficiencies orhigher quality care is generally unknown. Apparent cost differencesamong hospitals in competitive markets may be reduced if the avail-ability of additional diagnostic equipment provides health benefits.Adjusting cost differences for variations in quality remains a criticalresearch issue and is of growing interest to purchasers of health care.
HOSPITAL COST FUNCTIONS
A voluminous literature examining the structure of hospital costs exists[1-3]. While the functional form and explanatory variables used inthese studies differ, the consensus is that case mix, input prices, marketstructure, staffing patterns, teaching affiliation, location, and bed-sizeinfluence unit costs. The cost function estimated in this article extendsthis literature in two ways: first, source of hospital admission (forexample, physician-scheduled versus through the emergency room) isadded to the list of regressors and, second, the impact of market struc-ture and demand uncertainty on costs is included in the same model.
The analysis is limited to hospitals located in metropolitan statisti-cal areas (MSAs) for two reasons. First, previous analyses have

Urban Hospital Costs 825
rejected the hypothesis that the coefficient estimates of urban and ruralhospitals in cost functions are equal [3]. Second, hospital case- andservice-mix differences across urban and rural areas are not adequatelymeasured by existing case-mix measures [11]. These models are dis-cussed below.
Following the work of Friedman and Pauly [12] and Pauly andWilson [1], the cost function estimated below assumes that some costsdo not vary with output but are proportional to staffed beds. Sinceadministrators staff hospitals based on forecasts of patient arrivals,observed unit costs are higher if forecasted admissions exceed actualpatient arrivals. Failure to include forecasted arrivals in hospital costfunction analysis leads to specification error [1]. Thus, the ratio offorecasted to actual admissions, rather than actual admissions, isentered in the model to predict incurred costs.
The inverse of the occupancy rate is included to measure fixedcosts stemming from unoccupied staffed beds. If forecasted empty bedsare costless, cost per case should be independent of the occupancy rateholding the ratio of forecasted to actual admissions constant [1, 12].The level of competition among hospitals is measured through acounty-level Herfindahl index which attains its maximum value of 1 inpure monopoly markets (one hospital) and decreases as the number ofadmissions in competing hospitals rises [13]. Labor costs are measuredusing a hospital-specific measure of salary per full-time equivalentpersonnel. Since capital is generally purchased in national markets,these costs are not included in the analysis.
Hospital case mix is measured by Medicare's diagnosis-relatedgroup (DRG) index, which compares each hospital's cost per case rela-tive to the national average. While case-mix data on other patients arenot generally available, one recent study indicated that case-mix mea-sures based on all patients were highly correlated with the Medicareindex [14].
The ability of the Medicare case-mix index to measure case mixfor all patients is also tested below. By construction, a 1 percentincrease in the Medicare case-mix index should be associated with a 1percent increase in Medicare cost per discharge [14]. If the Medicarecase-mix index provides a reliable measure of the case mix of allpatients in urban hospitals, then the proportional relationship shouldalso exist for total costs per discharge. This hypothesis will be tested byrestricting the coefficient on case mix to assume proportionalitybetween the case-mix index and cost per case. Since the coefficient isrestricted to represent a reliable estimate of the hospital's overall casemix, other case-mix proxies, such as percent Medicare admissions, are
826 HSR: Health Services Research 22:6 (February 1988)
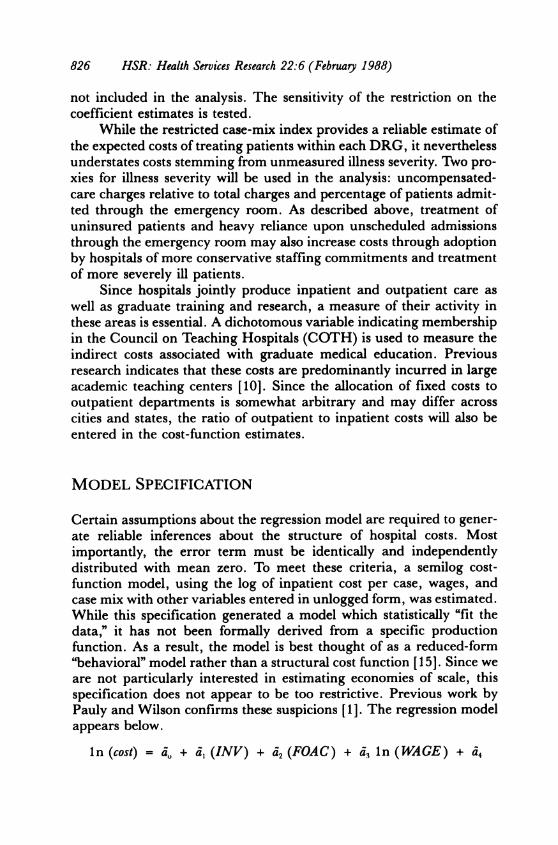
not included in the analysis. The sensitivity of the restriction on thecoefficient estimates is tested.
While the restricted case-mix index provides a reliable estimate ofthe expected costs of treating patients within each DRG, it neverthelessunderstates costs stemming from unmeasured illness severity. Two pro-xies for illness severity will be used in the analysis: uncompensated-care charges relative to total charges and percentage of patients admit-ted through the emergency room. As described above, treatment ofuninsured patients and heavy reliance upon unscheduled admissionsthrough the emergency room may also increase costs through adoptionby hospitals of more conservative staffing commitments and treatmentof more severely ill patients.
Since hospitals jointly produce inpatient and outpatient care aswell as graduate training and research, a measure of their activity inthese areas is essential. A dichotomous variable indicating membershipin the Council on Teaching Hospitals (COTH) is used to measure theindirect costs associated with graduate medical education. Previousresearch indicates that these costs are predominantly incurred in largeacademic teaching centers [10]. Since the allocation of fixed costs tooutpatient departments is somewhat arbitrary and may differ acrosscities and states, the ratio of outpatient to inpatient costs will also beentered in the cost-function estimates.
MODEL SPECIFICATION
Certain assumptions about the regression model are required to gener-ate reliable inferences about the structure of hospital costs. Mostimportantly, the error term must be identically and independentlydistributed with mean zero. To meet these criteria, a semilog cost-function model, using the log of inpatient cost per case, wages, andcase mix with other variables entered in unlogged form, was estimated.While this specification generated a model which statistically "fit thedata," it has not been formally derived from a specific productionfunction. As a result, the model is best thought of as a reduced-form"behavioral" model rather than a structural cost function [ 15]. Since weare not particularly interested in estimating economies of scale, thisspecification does not appear to be too restrictive. Previous work byPauly and Wilson confirms these suspicions [1]. The regression modelappears below.
In (cost) = dO + d, (INV) + d2 (FOAC) + d3 in (WAGE) + a,

Urban Hospital Costs 827
(BED1) + d5 (BED2) + d6 (BED3) + d7 In (DRG) + d8 (ER) + d,(HERF) + d1() (COTH) + dlI (SHR) + a12 (OPD) + et
Definitions of these variables appear in Table 1.
Table 1: Variable Definitions, Means, and StandardDeviations
StandardVariable* Mean Deviation
Dependent variableInpatient cost per case 1,792.2 706.0
(COST)Explanatory variablesPercent admissions through 28.0 12.5
emergency room (ER)Inverse occupancy rate 1.311 0.244
(INV)Ratio uncompensated to total 0.052 0.054
charges (SHR)Member, Council of Teaching 0.144 0.352
Hospitals (COTH)tHospital has fewer than 100 0.012 0.107
beds (BEDl)tHospital has 100-299 beds 0.483 0.500
(BED2)tHospital has 300-499 beds 0.329 0.471
(BED3)tHospital has more than 500 0.110 0.313
beds (BED4)tNonphysician wage per full 13,339.17 2,161.71
time equivalent employee(WAGE)
Medicare 1981 case-mix index 1.07 0.083(DRG)
Herfindahl index (HERF) 0.418 0.323Ratio forecasted to actual 0.960 0.073
admissions (FOAC)Ratio outpatient to inpatient 0.160 0.115
costs (OPD)*Information on all variables was provided by 346 hospitals. Fewer proprietary hospi-tals provided information covering all variables and as a result are underrepresentedin the analysis.tDichotomous variables set to I if hospital falls in particular category.

828 HSR: Health Services Research 22:6 (February 1988)
DEPENDENT AND INDEPENDENT VARIABLES
Dependent Variables
1. Log inpatient cost per admission: costs allocated to inpatientcare divided by total inpatient admissions.
Independent Variables1. Beds: four bed-size categories included-for hospitals with
less than 100 beds, between 100 and 300 beds, between 300and 500 beds, and with more than 500 beds
2. Inverse occupancy rate3. Ratio of forecasted to actual admissions: admissions fore-
casted using a three-year moving average4. Log wage: total nonphysician salary divided by full time
(nonphysician) equivalent employee5. Log case mix: Medicare DRG case-mix measure6. Percent of patients admitted through the emergency room7. Teaching affiliation: designates members of the Council on
Teaching Hospitals8. Ratio of uncompensated charges to total charges9. Ratio of outpatient to inpatient costs.
DATA
Data for the study were derived from two sources: the American Hos-pital Association's 1981 Annual Survey ofHospitals and a special survey ofcare to the poor jointly undertaken by the Urban Institute and theAmerican Hospital Association. Summary statistics for all variablesused in the analysis are presented in Table 1.
RESULTS
The results of the regression analysis are displayed in Table 2. Averagewage and bed-size both have the expected signs as hospitals with higherwages and larger bed complements incur higher costs. Smallhospitals- those having fewer than 100 beds- have inpatient costsapproximately 30 percent lower than other facilities. Other bed-sizedistinctions were not significant.
Higher ratios of outpatient to inpatient costs are negatively related

Urban Hospital Costs 829
Table 2: Cost-Function RegressionResults ( N = 346 )
Variable Coefficient StandardName Estimate Error
INVS 0.134 .072FOACI 0.729 .266WAGE*T 0.468 .116BEDI1 -0.363 .160BED2 -0.055 .055BED3 -0.008 .053DRG*t 1.000 *
ERT 0.279 .139HERF$ -0.192 .057COTHt 0.354 .057SHR 0.328 .336OPDt -0.767 .147CONSTANT 2.122 1.123Lagrangian 0.389 -.329Restrictiont
R2 .456
*Log of variable used. Log inpatient cost per dischargeis the dependent variable.tIndicates that the restricted case-mixcoefficient esti-mate is the same as the unrestricted estimate. Hence,at least in this sample, the Medicare case-mix index isa reliable indicator of the hospital's overall case mix.$Statistically significant at 5 percent level.SStatistically significant at 10 percent level.
to inpatient cost per admission. This may reflect different methodsused by hospital administrators to allocate fixed costs. For instance,holding total costs constant, an additional dollar of fixed or quasi-fixedcost allocated to the outpatient department reduces observed inpatientcost. Hence, greater outpatient activity allows hospitals to spread fixedcosts over a larger volume of patients.
Holding case mix constant, patients admitted through the emer-gency room incur greater costs than other patients. The magnitude ofthese costs is significant and highlights the role emergent admissionsassume in increasing inpatient costs. The results also shed light onprevious results that found diseconomies of scope between the emer-

830 HSR: Health Services Research 22:6 (February 1988)
gency department and inpatient care [3]. The results presented inTable 2 suggest that one source of these diseconomies stems from amore severely ill mix of patients served by hospitals with large emer-gency room facilities.
While the costs associated with treating more patients withoutinsurance are higher than those for other patients, the differences arenot statistically significant. The correlation between uncompensatedcare and volume of patients admitted through the emergency roommakes separate estimates of these variables imprecise.2
Inpatient costs also depend on the ratio of forecasted to actualadmissions. Costs are higher when forecasted admissions exceed actualadmissions. This confirms previous results and illustrates the impor-tance of including expected rather than actual output in hospital costfunctions [1, 12]. Higher inpatient costs result from staffing commit-ments based on expectations of future patient arrivals. Staffed excesscapacity also stems from competitive interactions among hospitalswhich reduce patient turnaway probabilities and service delay [7].Whether these higher costs should be viewed as a reflection ofincreased quality or inefficiency continues to be debated. Nonetheless,the results highlight (1) the difficulty of comparing unit staffing ratiosin hospitals maintaining different probabilities of patient turnaways aswell as (2) differences in the proportion of hospital admissions thatcannot be deferred.
The coefficient times the inverse occupancy rate measures fixedcosts associated with unoccupied staffed beds. The positive coefficientindicates that empty beds are not costless- that they add to averagecosts, although these costs are relatively small.
As previous results have indicated, the costs associated with grad-uate medical education are substantial although they appear to belimited to large teaching hospitals. The results indicate that much ofthe observed higher costs of urban hospitals are limited to those ofmajor medical centers, because costs in facilities with COTH member-ship are 42 percent higher than costs in other hospitals and remain soeven after controlling for case mix, proxies for illness severity (such asemergency room activity), and market competition.3
The impact of market structure on costs is also consistent withprevious research as costs are higher in more competitive markets. Thecost-increasing nature of competition in the hospital marketplacereflects nonprice competition resulting in more amenities and greaterservice intensity. While greater service intensity may or may notimprove patient outcomes, physicians and patients clearly value thebroader scope of services offered by these hospitals. Whether the diag-

Urban Hospital Costs 831
nostic benefits of these services exceed their costs, however, continuesto be debated.
DECOMPOSITION OF COST VARIATIONIN URBAN HOSPITALS
Higher wages, graduate medical education, case mix, competition,stochastic demand, and the treatment of poor patients all account forhigher costs in urban hospitals. While the foregoing analysis providesan indication of the statistical significance of these explanatory varia-bles, it does not discuss their relative importance in explaining thedisparity in hospital costs. The relative contribution of each of thesefactors in accounting for higher costs is explored below.
Table 3 provides a decomposition of the factors accounting for costdifferences among urban hospitals. The decomposition was developedby stratifying hospitals into quintiles according to their cost per dis-charge. Once defined, the average within each quintile was calculatedboth for unit costs and for each independent variable. The within-quintile mean for each variable was subsequently subtracted from theoverall sample mean. The ratio of each (differenced) independent vari-able to the (differenced) cost per discharge was determined within eachquintile. This ratio was then multiplied by its respective coefficientreported in Table 2. That is, unit cost differences were decomposedusing the following formula:
Cost Decomposition * iX sYi - Ys
Where Ol- represents the estimated coefficient from Table 2; the Xiand Yi constitute within-quintile means while Xs and Ys are samplemeans.
Among the sample hospitals, the most expensive hospitals hadunit costs 54 percent higher than the sample average. The single mostimportant determinant of these high costs in urban hospitals was teach-ing status, as nearly one-half of the cost difference was explained byCOTH membership alone. Case mix, wage rates, and greater serviceintensity stemming from nonprice competition represent the next mostimportant group of variables, accounting for slightly less than one-halfof the higher costs in these facilities. The treatment of poor patients-as manifested in admissions through the emergency room, ratio of

832 HSR: Health Services Research 22:6 (February 1988)
Table 3: Decomposition of Urban Hospital CostsCost Per Discharge
Explanatory Quintik
Variabk* 20 40 80 100INV + 0.8t -0.1 -1.6 -1.2FOAC -3.8 +1.4 -3.5 +2.2WAGE -8.5 -12.0 + 9.5 + 8.5BED1 -3.2 + 2.4 + 2.3 + 7.8BED2 -2.4 -3.0 + 2.3 + 2.9BED3 + 0.3 + 0.1 -0.1 -0.1DRG -6.3 -12.2 + 6.2 + 12.3ER -1.6 -0.8 + 0.2 + 0.9HERF -6.5 -9.9 + 9.7 + 5.7COTH -9.5 -22.9 + 5.7 + 23.8SHR -0.4 -1.1 + 0.6 + 0.8OPD -0.6 -4.9 + 6.7 -1.6
Percent Cost -53.6$ -17.9 + 18.3 + 54.0Difference,Sample andQuintile Mean
*Positive figures in the 80th and 100th quintiles indicate the variable contributes tohigher costs. Positive entries in the 20th and 40th quintiles indicate the variablecontributes to higher costs.
tCalculated as: Di (Xi - X)/( Yi - Y1).$Difference between sum of individual explanatory variable contribution and thepercent difference between the mean quintile and sample cost per discharge isexplained by error (regression residuals).
uncompensated to total charges, and more conservative staffingpatterns-contributes approximately 7 percent to the costs in the mostexpensive facilities.
Unit costs in the lowest quintile averaged 53.6 percent lower thanthe sample average. Since none of the lowest-cost urban hospitals wereCOTH members, the lack of graduate medical education involvementexplained much (about 20 percent) of the observed lower costs. Inaddition to lower average wage bills, less vigorous competition byhospitals in outlying locations of MSAs comprised the next largestcomponent, jointly accounting for 30 percent of these lower costs. Thelowest-cost urban hospitals had smaller volumes of patients admittedthrough the emergency room, which accounts for approximately 5percent of the lower-than-average costs in these hospitals. In additionto their lower volume of admissions through the emergency room,lower-cost urban hospitals also had less staffed excess capacity,

Urban Hospital Costs 833
accounting for 7 percent of their lower-than-average costs. Finally,case-mix differences also proved significant, accounting for nearly 12percent of these hospitals' lower costs.
DISCUSSION
The analysis presented here identifies a number of factors accountingfor cost variation among urban hospitals. Unit costs in the most expen-sive urban hospitals are over 53 percent higher than average and stemfrom six factors: major teaching programs, a more severely ill casemix, cost-increasing competition, staffed excess capacity, higher inputprices, and costs resulting from patients admitted through the emer-gency room.
The single most important determinant of high costs in urbanhospitals is teaching status. Hospitals with large teaching programs-as indicated by membership in COTH-accounted for nearly half ofthe cost difference between the highest-and average-cost urban hospi-tals. Case-mix differences in the most expensive urban hospitalsaccounted for approximately 20 percent of their higher-than-averagecosts. Higher average salaries and cost-increasing competition amonghospitals for physicians jointly explained another 25 percent of thehigher costs in the most expensive hospitals.
Over 7 percent of the costs in the most expensive quintile ofhospitals were traced to admission of patients through the emergencyroom as well as treatment of a large volume of uninsured patients;these persist even after controlling for case mix, location, and teachingstatus. These costs are important to recognize and identify since theyhighlight the relationship between inpatient care and the hospitalemergency department.
Higher inpatient costs resulting from admissions through theemergency room result partially from diseconomies of scope (and/orunmeasured differences in patient illness severity) rather than frominefficiencies per se. While higher costs have been noted and accountedfor by Medicare in hospitals involved in graduate medical education,higher costs from patients admitted through the emergency room havenot. Although Medicare recently increased its payments to hospitalsserving a disproportionate share of low-income patients, the analysispresented above indicates that the patient's source of admission, notsimply the volume of poor patients treated, accounts for higher costs.4However, the volume of poor patients and the percentage of admissionsthrough the emergency room are correlated.
834 HSR: Health Services Research 22:6 (February 1988)
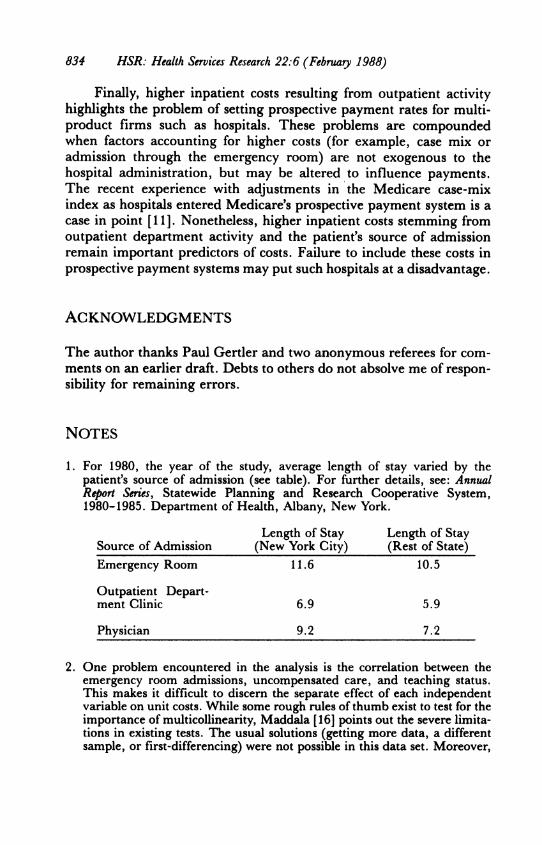
Finally, higher inpatient costs resulting from outpatient activityhighlights the problem of setting prospective payment rates for multi-product firms such as hospitals. These problems are compoundedwhen factors accounting for higher costs (for example, case mix oradmission through the emergency room) are not exogenous to thehospital administration, but may be altered to influence payments.The recent experience with adjustments in the Medicare case-mixindex as hospitals entered Medicare's prospective payment system is acase in point [11]. Nonetheless, higher inpatient costs stemming fromoutpatient department activity and the patient's source of admissionremain important predictors of costs. Failure to include these costs inprospective payment systems may put such hospitals at a disadvantage.
ACKNOWLEDGMENTS
The author thanks Paul Gertler and two anonymous referees for com-ments on an earlier draft. Debts to others do not absolve me of respon-sibility for remaining errors.
NOTES
1. For 1980, the year of the study, average length of stay varied by thepatient's source of admission (see table). For further details, see: AnnualReport Series, Statewide Planning and Research Cooperative System,1980-1985. Department of Health, Albany, New York.
Length of Stay Length of StaySource of Admission (New York City) (Rest of State)Emergency Room 11.6 10.5
Outpatient Depart-ment Clinic 6.9 5.9
Physician 9.2 7.2
2. One problem encountered in the analysis is the correlation between theemergency room admissions, uncompensated care, and teaching status.This makes it difficult to discern the separate effect of each independentvariable on unit costs. While some rough rules of thumb exist to test for theimportance of multicollinearity, Maddala [16] points out the severe limita-tions in existing tests. The usual solutions (getting more data, a differentsample, or first-differencing) were not possible in this data set. Moreover,

Urban Hospital Costs 835
the benefits of other approaches, such as ridge regression, in reducingmulticollinearity do not exceed the costs involved [16].
3. Correct interpretation of dummy variables in semilog models requires thefollowing transformation: Percent Change = et - 1.
4. The Consolidated Omnibus Reconciliation Act (COBRA) of 1985 addedan adjustment to Medicare's payment rates for hospitals that serve a dis-proportionate share of low-income patients. The add-on is based on aformula combining low-income Medicare patient-days and Medicaidpatient-days.
REFERENCES
1. Pauly, M. V., and P. Wilson. Hospital output forecasts and the costs ofempty hospital beds. Health Services Research 21(3):403-28, August 1986.
2. Robinson, J. C., and H. S. Luft. The impact of hospital market struc-ture on patient volume, average length of stay, and the cost of care.Journalof Health Economics 4(4):333-56, December 1985.
3. Grannemann, T. W., R. S. Brown, and M. V. Pauly. Estimating hospi-tal costs: A multiple-output analysis. Journal of Health Economics5(2):107-28, June 1986.
4. Thorpe, K. The distributional implications of using relative prices inDRG payment systems. Inquiry 24:85-95, Spring 1987.
5. Feder, J., J. Hadley, and R. Mullner. Falling through the cracks: Pov-erty, insurance coverage, and hospital care for the poor, 1980 and 1982.Milbank Memorial Fund Quarterly 62(4):544-66, Fall 1984.
6. Roemer, M. I., et al. Copayments for ambulatory care: Pennywise andpound-foolish. Medical Care 13:457-66, June 1975.
7. Joskow, P. The effects of competition and regulation on hospital bedsupply and the reservation quality of the hospital. BellJournal of Economics11(2):421-47, 1980.
8. Knickman, J., and A. Foltz. A statistical analysis of reasons for East-Westdifferences in hospital use. Inquiry 22(1):45-58, Spring 1985.
9. Anderson, G., and J. Lave. Financing graduate medical education usingmultiple regression to set payment rates. Inquiry 23(2):191-99, Summer1986.
10. Sloan, F., and J. Valvona. The high costs of teaching hospitals. HealthAffairs 5(3):68-85, Fall 1986.
11. Prospective Payment Assessment Commission. Technical Appendixes tothe Report and Recommendations to the Secretary, U.S. Department ofHealth and Human Services: Discussion. Washington, DC: GovernmentPrinting Office, April 1, 1986, pp. 57-63.
12. Friedman, B., and M. V. Pauly. Cost functions for a service firm withvariable quality and stochastic demand. Review of Economics and Statistics63:610-24, November 1981.
13. Dansby, R., and R. Willig. Industry performance gradient indexes.American Economic Review 69(3):249-60, June 1979.
14. Pettengill, J., and J. Vertrees. Reliability and validity in hospital case-

836 HSR: Health Services Research 22:6 (February 1988)
mix measurement. Health Care Financing Review 4(2):101-28, December1982.
15. Evans, R. C. Behavioral cost functions for hospitals. Canadian Journal ofEconomics 4: 198-214, Fall 1971.
16. Maddala, G. S. Econometrics. New York: McGraw-Hill, 1977.