Embed Size (px)
Citation preview
2009 SIMULIA Customer Conference 1
Impact Analysis and Dynamic Response of a 40mm Sensor Grenade
P. Carlucci, A. S. Haynes, and M. A. Mellini
U.S. Army – ARDEC, Picatinny Arsenal, Picatinny, NJ 07806
Abstract: The Army is developing new grenades with sensors instead of explosives. A grid of 40-mm grenades will be fired from conventional M16 rifles. The projectiles must survive gun launch and impact. After impact, soldiers will get a real-time ‘picture’ of a local area. Signals from the onboard sensors will be processed on a hand-held computer that captures the activity within the grenade web.
The grenades need to operate after they impact different types of structures. The payload contains sensitive electronics. Due to the nature of the electronics, most of the grenade structure is non-metallic to prevent attenuation of the signals. Impact energy must be absorbed by the ogive/nose section of the projectile. Different designs were evaluated to determine the g-loads exerted on the electronics and the reflected velocity of the grenade. A steel plate was used as the base-line impact structure. Results were compared for crushable polymer foams, crushable metal foams, and collapsible polymer structures. These analyses were completed using ABAQUS Explicit, a general-purpose finite element code. Collapsible polymer structures provided the smallest g-forces to the electronics and the smallest reflected velocities after impact.
Keywords: Grenades, Sensors, Crushable Foam, Damage, Dynamics, Experimental Verification, Failure, Impact, Polymer Structures, Johnson-Cook.
1. Introduction
1.1 Introduction
The modeling of grenade impact was performed using ABAQUS Explicit v6.8-1 finite element analysis software. The solid geometry originated in Pro/Engineer Wildfire v3.0. The analyses detailed in this paper will show the predicted accelerations at the electronics package induced by the impact event. The most sensitive electronic components contained in the package can withstand a maximum acceleration of 22,500Gs axially without failing. This threshold was determined by separate component testing of the electronics. The developed model is used to evaluate different design concepts and materials and determine resulting accelerations at the printed circuit board (PCB) stack. Ultimately, this model is used as a tool to select satisfactory candidates for fabrication and prototype testing.
Visit the SIMULIA Resource Center for more customer examples.
Visit the SIMULIA Resource Center for more customer examples.
2 2009 SIMULIA Customer Conference
2. Description
2.1 Sensor grenade components
The sensor grenade is meant to be deployed and transmit sensory data from its surroundings back to the user via RF transmission. The grenade accomplishes this by using onboard sensors that are part of a printed circuit board stack, which processes and transmits the data. The complete grenade assembly is shown in Figure 1.
Figure 1. Sensor grenade assembly
1: Ogive, 2: Support Disc, 3-PCB Stack, 4: Top Spac er, 5: Battery, 6: Bottom Spacer
The crushable ogive and support disc (shown as 1 and 2) are designed to mitigate the accelerations induced on the electronics package (3) during impact. The support disc transmits the impact forces to the sidewalls of the grenade body rather than directly to the electronics package.
1 2 3 4 5 6
2009 SIMULIA Customer Conference 3
2.2 Sensor grenade operating environment
At the intended range of use for the grenade, a maximum impact velocity of 180 ft/s is expected. In general, neither the angle of impact or target material will be known. Through testing, the electronics were found to be significantly less sensitive to radial accelerations than axially. An impact trajectory normal to the target will give the largest axial accelerations to the internals, and will be considered the limiting case for model development. For purposes of modeling and testing, the target is assumed to be a 0.5 in thick steel plate, which will behave very closely to a rigid surface. The operating mass for the grenade is approximately 0.40 lbm.
3. Model Development and Analysis
3.1 Model Geometry
The sensor grenade as modeled for the analysis is shown in Figure 2. A full 3D view is shown in at the top of the figure for reference. The model was developed using half symmetry, as shown in the bottom of the figure. The assembly at the bottom left is for the crushable foam design, while the assembly at the bottom right is the collapsible polymer structure design. In the assembly, the red component represents all of the grenades internals. In the actual construction, an epoxy potting is used to encapsulate all of the internals for additional structural support. As a simplifying assumption, the internals are approximated with the mechanical properties of the potting, and the density is modified to account for the correct mass. The blue portion is the main body of the grenade, while the white component is the ogive (and collapsible polymer structure in one case). The support disk is shown in gray and the crushable foam in light blue.
Figure 2. Sensor grenade model - overview
4 2009 SIMULIA Customer Conference
Figure 3 shows details of the ogive geometries for the two design concepts chosen for analysis. On the left the geometry for the crushable foam is shown, while the collapsible polymer structure is shown on the right.
Figure 3. Sensor grenade model – ogive details
3.2 Model mesh
The complete assembly is approximately 225,000 elements, type C3D8R linear reduced integration bricks with the default hourglass control. In order to properly resolve bending, a minimum of four elements were used through the thickness for all thin sections in the assembly. Figure 4 shows details of the mesh in the regions of interest for this analysis. For the collapsible polymer ogive, relatively smaller elements were used since this part will undergo damage and element deletion during the impact event.
Figure 4. Mesh details
3.3 Initial and boundary conditions
A predefined field was specified for the grenade assembly initial velocity of 180 ft/s. Half symmetry was used for this analysis, and the symmetry plane was specified along the exposed faces shown in the bottom of figure 2. To simulate the 0.5 in steel target, a rigid body was used in the analysis to simplify the model and reduce computational expense.
Patent Pending
2009 SIMULIA Customer Conference 5
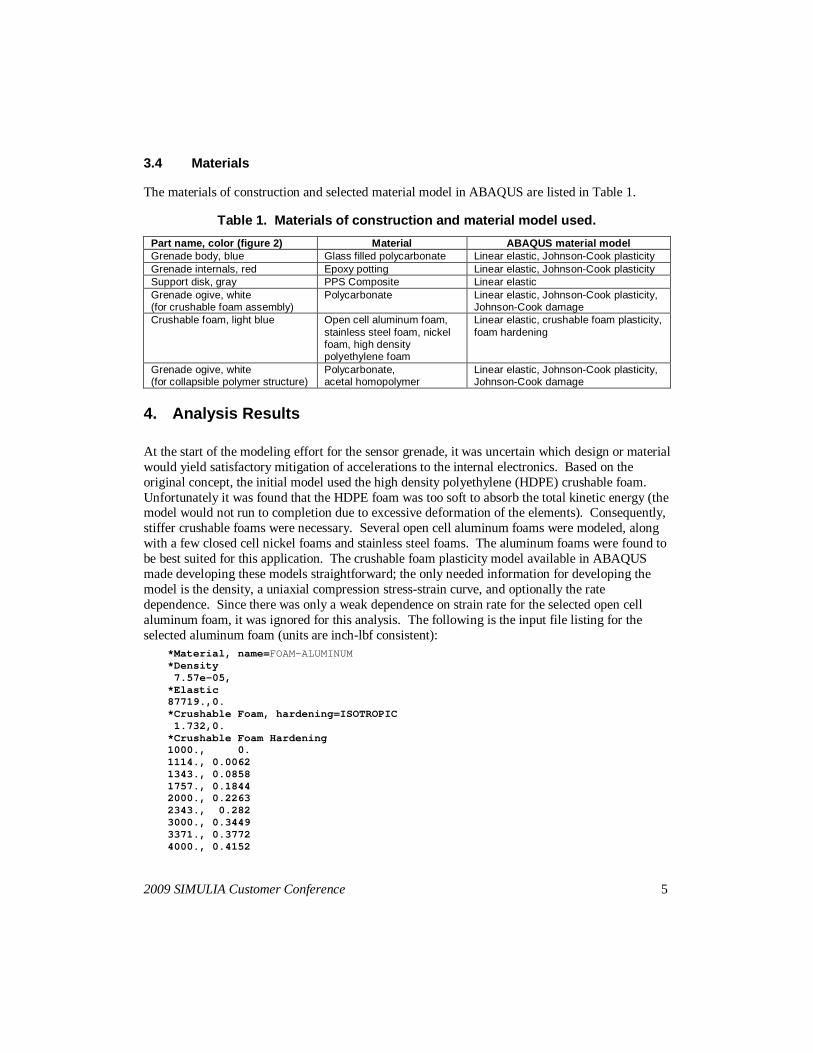
3.4 Materials
The materials of construction and selected material model in ABAQUS are listed in Table 1.
Table 1. Materials of construction and material mo del used.
Part name, color (figure 2) Material ABAQUS materia l model Grenade body, blue Glass filled polycarbonate Linear elastic, Johnson-Cook plasticity Grenade internals, red Epoxy potting Linear elastic, Johnson-Cook plasticity Support disk, gray PPS Composite Linear elastic Grenade ogive, white (for crushable foam assembly)
Polycarbonate Linear elastic, Johnson-Cook plasticity, Johnson-Cook damage
Crushable foam, light blue Open cell aluminum foam, stainless steel foam, nickel foam, high density polyethylene foam
Linear elastic, crushable foam plasticity, foam hardening
Grenade ogive, white (for collapsible polymer structure)
Polycarbonate, acetal homopolymer
Linear elastic, Johnson-Cook plasticity, Johnson-Cook damage
4. Analysis Results
At the start of the modeling effort for the sensor grenade, it was uncertain which design or material would yield satisfactory mitigation of accelerations to the internal electronics. Based on the original concept, the initial model used the high density polyethylene (HDPE) crushable foam. Unfortunately it was found that the HDPE foam was too soft to absorb the total kinetic energy (the model would not run to completion due to excessive deformation of the elements). Consequently, stiffer crushable foams were necessary. Several open cell aluminum foams were modeled, along with a few closed cell nickel foams and stainless steel foams. The aluminum foams were found to be best suited for this application. The crushable foam plasticity model available in ABAQUS made developing these models straightforward; the only needed information for developing the model is the density, a uniaxial compression stress-strain curve, and optionally the rate dependence. Since there was only a weak dependence on strain rate for the selected open cell aluminum foam, it was ignored for this analysis. The following is the input file listing for the selected aluminum foam (units are inch-lbf consistent):
*Material, name=FOAM-ALUMINUM *Density 7.57e-05, *Elastic 87719.,0. *Crushable Foam, hardening=ISOTROPIC 1.732,0. *Crushable Foam Hardening 1000., 0. 1114., 0.0062 1343., 0.0858 1757., 0.1844 2000., 0.2263 2343., 0.282 3000., 0.3449 3371., 0.3772 4000., 0.4152
6 2009 SIMULIA Customer Conference
5086., 0.4693 6000., 0.5042
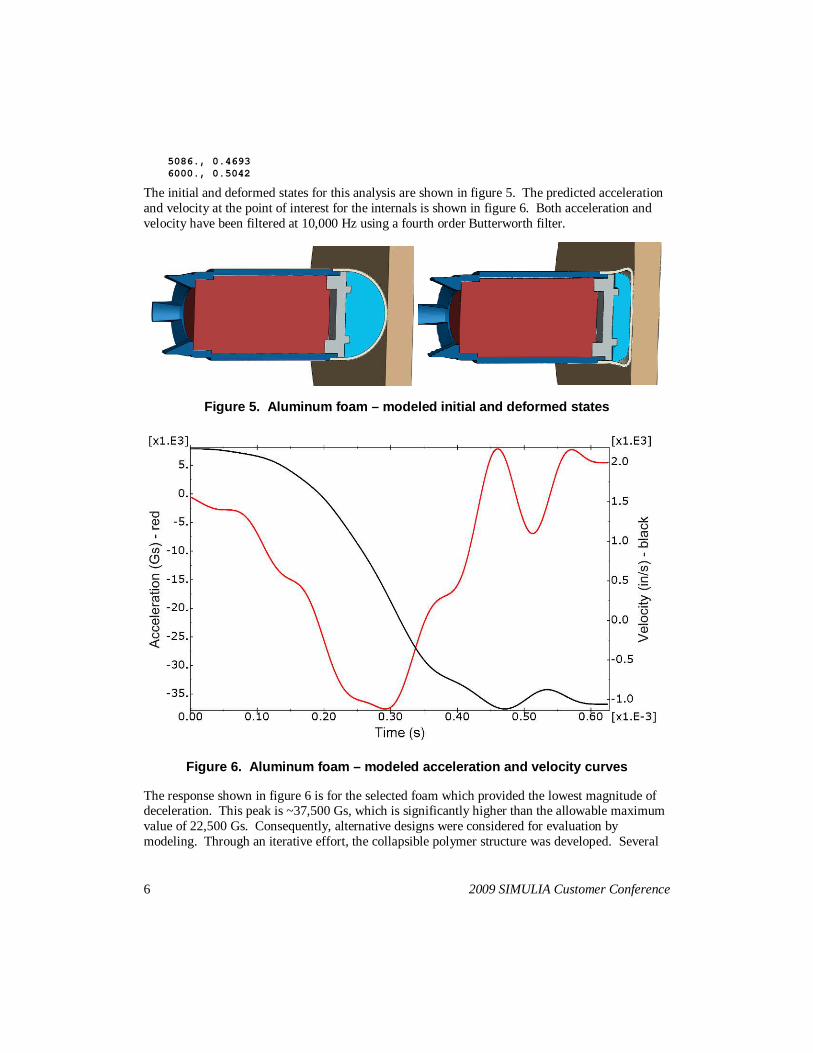
The initial and deformed states for this analysis are shown in figure 5. The predicted acceleration and velocity at the point of interest for the internals is shown in figure 6. Both acceleration and velocity have been filtered at 10,000 Hz using a fourth order Butterworth filter.
Figure 5. Aluminum foam – modeled initial and defo rmed states
Figure 6. Aluminum foam – modeled acceleration and velocity curves
The response shown in figure 6 is for the selected foam which provided the lowest magnitude of deceleration. This peak is ~37,500 Gs, which is significantly higher than the allowable maximum value of 22,500 Gs. Consequently, alternative designs were considered for evaluation by modeling. Through an iterative effort, the collapsible polymer structure was developed. Several
2009 SIMULIA Customer Conference 7
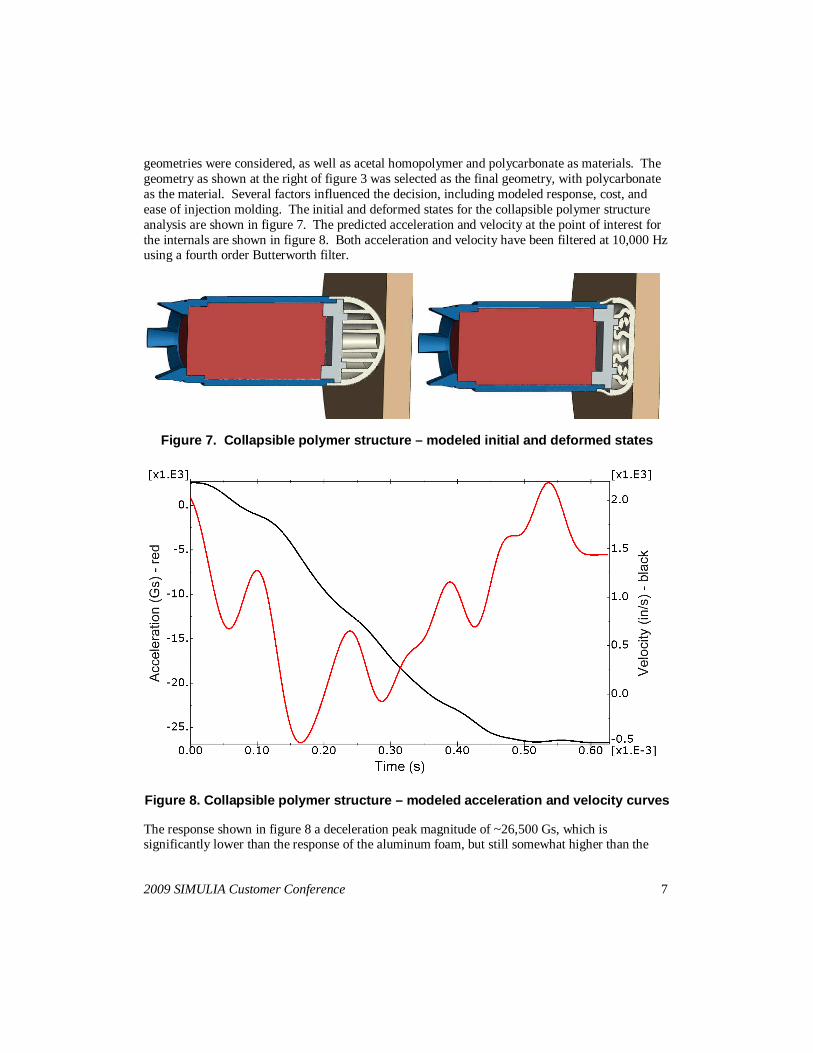
geometries were considered, as well as acetal homopolymer and polycarbonate as materials. The geometry as shown at the right of figure 3 was selected as the final geometry, with polycarbonate as the material. Several factors influenced the decision, including modeled response, cost, and ease of injection molding. The initial and deformed states for the collapsible polymer structure analysis are shown in figure 7. The predicted acceleration and velocity at the point of interest for the internals are shown in figure 8. Both acceleration and velocity have been filtered at 10,000 Hz using a fourth order Butterworth filter.
Figure 7. Collapsible polymer structure – modeled initial and deformed states
Figure 8. Collapsible polymer structure – modeled a cceleration and velocity curves
The response shown in figure 8 a deceleration peak magnitude of ~26,500 Gs, which is significantly lower than the response of the aluminum foam, but still somewhat higher than the
8 2009 SIMULIA Customer Conference
allowable maximum value of 22,500 Gs. Additionally, the reflected velocity was approximately half that of the aluminum foam, indicating that substantially more kinetic energy is dissipated.
The modeling results gave confidence to move forward with prototype fabrication and testing. While both solutions still did not meet the allowable limit for acceleration, testing was necessary to validate the models so that the next iterative step could be taken. For the testing effort two stiffness values for the aluminum foam were selected, as well as polycarbonate and acetal homopolymer materials for the collapsible polymer structure geometry.
5. Experimental Testing
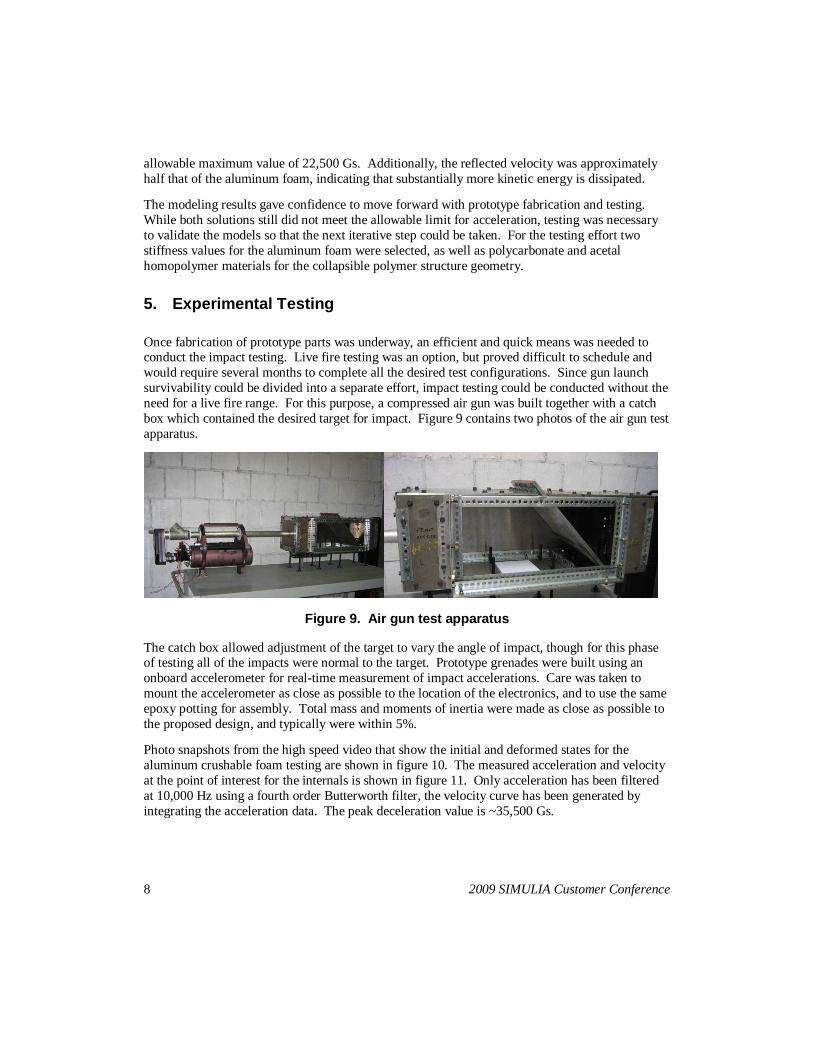
Once fabrication of prototype parts was underway, an efficient and quick means was needed to conduct the impact testing. Live fire testing was an option, but proved difficult to schedule and would require several months to complete all the desired test configurations. Since gun launch survivability could be divided into a separate effort, impact testing could be conducted without the need for a live fire range. For this purpose, a compressed air gun was built together with a catch box which contained the desired target for impact. Figure 9 contains two photos of the air gun test apparatus.
Figure 9. Air gun test apparatus
The catch box allowed adjustment of the target to vary the angle of impact, though for this phase of testing all of the impacts were normal to the target. Prototype grenades were built using an onboard accelerometer for real-time measurement of impact accelerations. Care was taken to mount the accelerometer as close as possible to the location of the electronics, and to use the same epoxy potting for assembly. Total mass and moments of inertia were made as close as possible to the proposed design, and typically were within 5%.
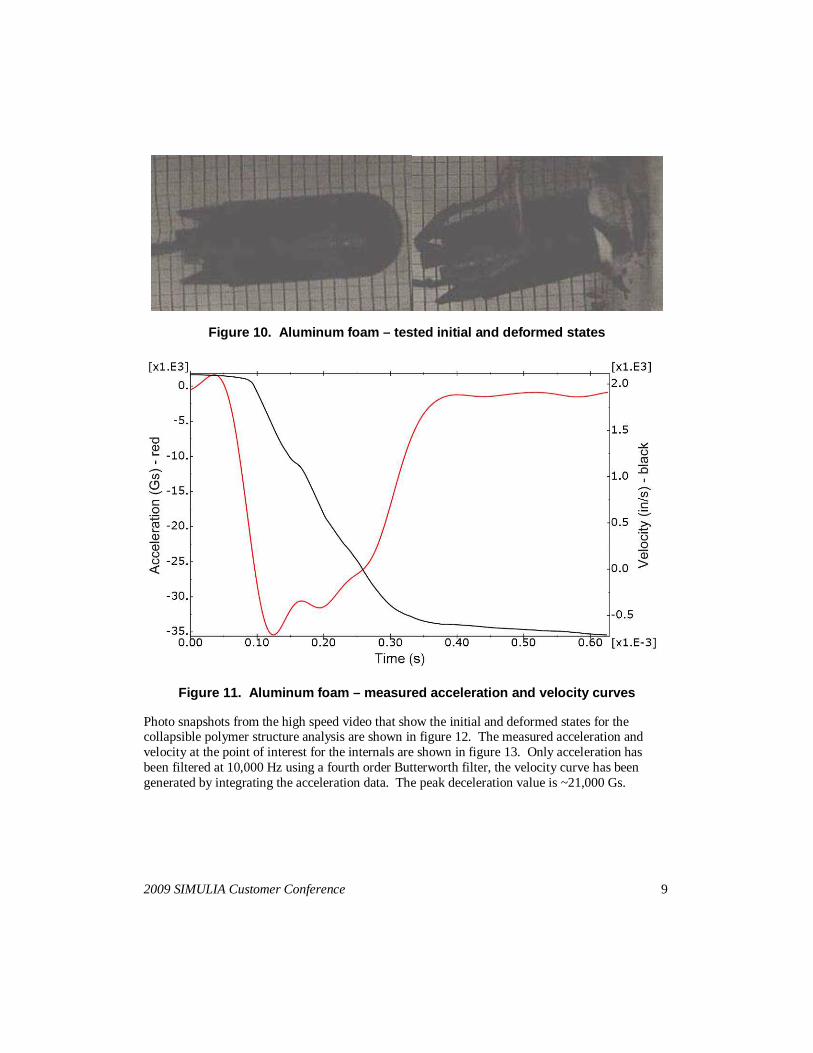
Photo snapshots from the high speed video that show the initial and deformed states for the aluminum crushable foam testing are shown in figure 10. The measured acceleration and velocity at the point of interest for the internals is shown in figure 11. Only acceleration has been filtered at 10,000 Hz using a fourth order Butterworth filter, the velocity curve has been generated by integrating the acceleration data. The peak deceleration value is ~35,500 Gs.
2009 SIMULIA Customer Conference 9
Figure 10. Aluminum foam – tested initial and defo rmed states
Figure 11. Aluminum foam – measured acceleration a nd velocity curves
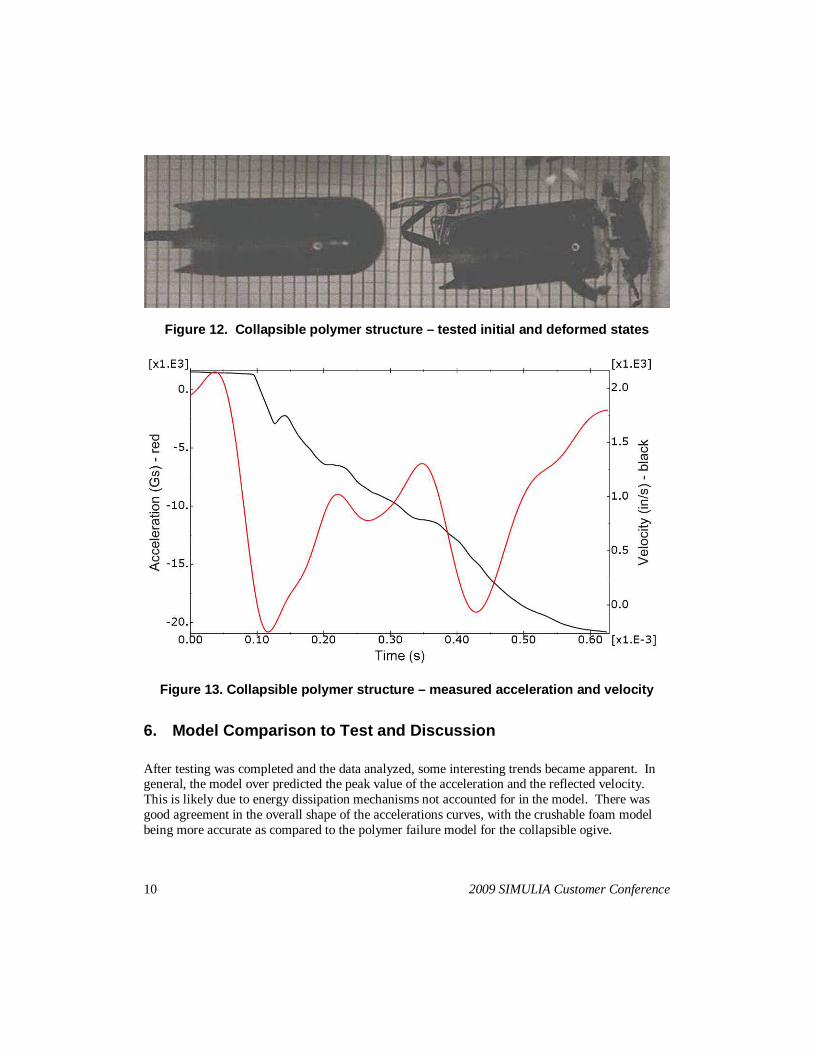
Photo snapshots from the high speed video that show the initial and deformed states for the collapsible polymer structure analysis are shown in figure 12. The measured acceleration and velocity at the point of interest for the internals are shown in figure 13. Only acceleration has been filtered at 10,000 Hz using a fourth order Butterworth filter, the velocity curve has been generated by integrating the acceleration data. The peak deceleration value is ~21,000 Gs.
10 2009 SIMULIA Customer Conference
Figure 12. Collapsible polymer structure – tested initial and deformed states
Figure 13. Collapsible polymer structure – measured acceleration and velocity
6. Model Comparison to Test and Discussion
After testing was completed and the data analyzed, some interesting trends became apparent. In general, the model over predicted the peak value of the acceleration and the reflected velocity. This is likely due to energy dissipation mechanisms not accounted for in the model. There was good agreement in the overall shape of the accelerations curves, with the crushable foam model being more accurate as compared to the polymer failure model for the collapsible ogive.
2009 SIMULIA Customer Conference 11
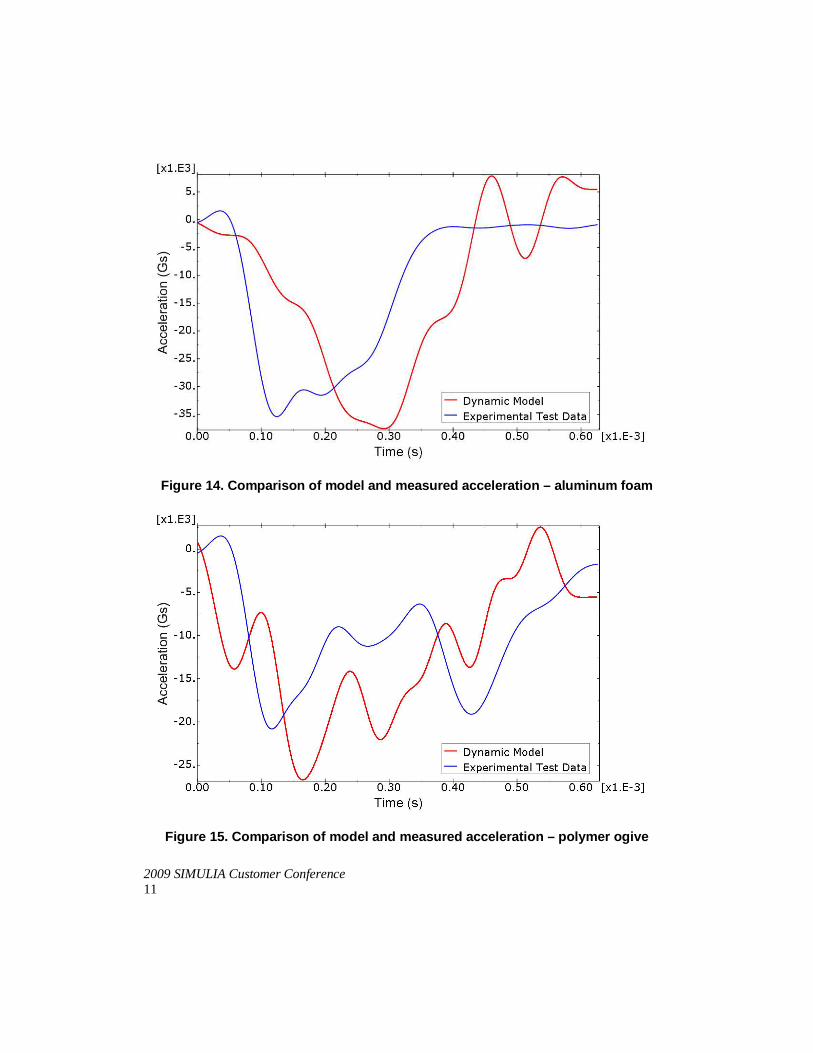
Figure 14. Comparison of model and measured acceler ation – aluminum foam
Figure 15. Comparison of model and measured acceler ation – polymer ogive
12 2009 SIMULIA Customer Conference
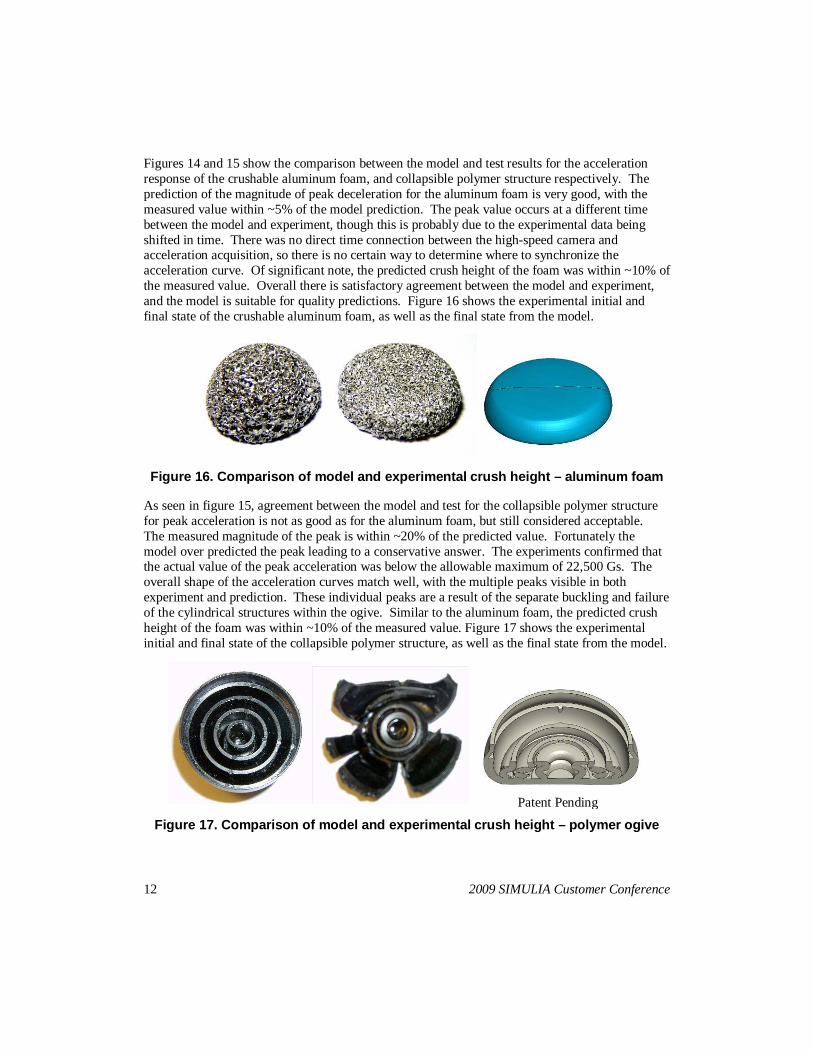
Figures 14 and 15 show the comparison between the model and test results for the acceleration response of the crushable aluminum foam, and collapsible polymer structure respectively. The prediction of the magnitude of peak deceleration for the aluminum foam is very good, with the measured value within ~5% of the model prediction. The peak value occurs at a different time between the model and experiment, though this is probably due to the experimental data being shifted in time. There was no direct time connection between the high-speed camera and acceleration acquisition, so there is no certain way to determine where to synchronize the acceleration curve. Of significant note, the predicted crush height of the foam was within ~10% of the measured value. Overall there is satisfactory agreement between the model and experiment, and the model is suitable for quality predictions. Figure 16 shows the experimental initial and final state of the crushable aluminum foam, as well as the final state from the model.
Figure 16. Comparison of model and experimental cru sh height – aluminum foam
As seen in figure 15, agreement between the model and test for the collapsible polymer structure for peak acceleration is not as good as for the aluminum foam, but still considered acceptable. The measured magnitude of the peak is within ~20% of the predicted value. Fortunately the model over predicted the peak leading to a conservative answer. The experiments confirmed that the actual value of the peak acceleration was below the allowable maximum of 22,500 Gs. The overall shape of the acceleration curves match well, with the multiple peaks visible in both experiment and prediction. These individual peaks are a result of the separate buckling and failure of the cylindrical structures within the ogive. Similar to the aluminum foam, the predicted crush height of the foam was within ~10% of the measured value. Figure 17 shows the experimental initial and final state of the collapsible polymer structure, as well as the final state from the model.
Figure 17. Comparison of model and experimental cru sh height – polymer ogive
Patent Pending

2009 SIMULIA Customer Conference 13
Generally the Johnson-Cook plasticity and damage model is not considered appropriate for use with polymers as it was developed as a metal constitutive model. For this application, the Johnson-Cook constitutive model gave satisfactory results since the loading was primarily monotonic up to failure. If the loading were more complex, or cyclic, it is expected that the results would not have been satisfactory. Looking closely final shapes for experiment and model prediction in figure 17, the differences become apparent. Though the final deformed shape of the two centermost cylinders show very good agreement. The material model makes very good prediction of the ductile failure and buckling mechanisms. For the outermost cylinder, the model captures the overall shape of the strain, but not formation of three petals. For the hemispherical ogive shape, the petal formation and failure is not captured at all. From these results, it appears the Johnson-Cook failure model alone can not capture all the failure mechanisms for polycarbonate, and likely for polymers in general.
It is important to point out that the models were developed before testing was conducted, and that model parameters were not modified after the test results were reviewed. All the model results included in this paper are truly predictive. The modeling served an extremely important role in the design and development of this 40mm sensor grenade. It substantially reduced the time and cost required for the iterative design-test-design process by identifying suitable solutions before any testing was completed. The required development schedule and specified funding would not have been adequate to produce an acceptable design without the predictive help of the dynamic model.
7. References
1. Payne, N., Carlucci, P., Mellini, M., “Modeling and Simulation of Engraving and Gun Launch of a 40-mm Sensor Grenade” Technical Report ARMET-TR-08022, U.S. Army Armament Research Development and Engineering Center, Picatinny Arsenal, NJ, November 2008.
2. Recchia, S., Geissler, D., Maselli, M., Tabao, D., “Improving the Reliability of the MOFA 155-mm Artillery Fuze”, ARAET-TR-07011, U.S. Army Armament Research Development and Engineering Center, Dover, NJ, June 2007
3. Carlucci, D., Cordes, J. A., Hahn, J., Frydman, A., “Electronics and the Gun Environment”, Invited Paper, U.S. Army Workshop on Advanced Active Thin Film Materials for the Next Generation of Meso-Micro Scale Army Applications, May 2005.
Visit the SIMULIA Resource Center for more customer examples.


![New Extended Range Shoulder-Fired 40mm Grenade System · 2018-04-26 · Grenade mass [g] 400 500 600 700 800 900 Maximum range [m] ERLP (840m) Std LV (435m) XM320 (2.3kg) XRGL40 (5kg)](https://img.pdfslide.net/doc/110x75/5ea45d9983c0773a564aaff2/new-extended-range-shoulder-fired-40mm-grenade-system-2018-04-26-grenade-mass.jpg)