Embed Size (px)
Citation preview

Contract No.: AF1254000000230 MPR Reference No.: 6095-300
National Job Corps Study and Longer-Term Follow-Up Study: Impact and Benefit-Cost Findings Using Survey and Summary Earnings Records Data Final Report August 2006 Peter Z. Schochet John Burghardt Sheena McConnell
Submitted to:
U.S. Department of Labor Employment and Training Administration Office of Policy Development and Research: Research and Evaluations Rm. N-5637 200 Constitution Ave., NW Washington, DC 20210
Project Officer:
Dan Ryan
Submitted by:
Mathematica Policy Research, Inc. P.O. Box 2393 Princeton, NJ 08543-2393 Telephone: (609) 799-3535 Facsimile: (609) 799-0005
Project Director:
Peter Z. Schochet


iii
ACKNOWLEDGMENTS
We would like to thank those whose efforts have made this report possible. Michael Risha at the Social Security Administration obtained the earnings data for our sample, and patiently ran our computer programs several times. Leah Hackleman provided valuable editorial assistance. Finally, Bryan Gustus did an excellent job of producing this report.


v
CONTENTS
Section Page
A OVERVIEW OF JOB CORPS ................................................................................4 B OVERVIEW OF THE STUDY DESIGN ...............................................................7 C DATA, SAMPLES, AND ANALYTIC METHODS..............................................9
1. Survey Data......................................................................................................9 2. Administrative Earnings Records ..................................................................10 3. Analytic Methods...........................................................................................11
D IMPACT RESULTS FOR THE FULL SAMPLE.................................................14
1. Education and Training..................................................................................15 2. Literacy ..........................................................................................................18 3. Employment and Earnings Impacts Based on the Survey Data.....................20 4. Employment and Earnings Impacts Based on the SER Data in
Years 1 to 4 ....................................................................................................22 5. Employment and Earnings Impacts Based on the SER Data After Year 4 ...26 6. Other Outcomes .............................................................................................28
E IMPACT RESULTS FOR SUBGROUPS.............................................................31
1. Youth Characteristics.....................................................................................31 2. Residents and Nonresidents ...........................................................................34 3. Center Subgroups...........................................................................................35
F ASSESSING SURVEY NONRESPONSE BIAS .................................................40
1. Impact Findings for Survey Respondents and Nonrespondents ....................41 2. Explanations for Survey Nonresponse Bias...................................................43
G COMPARING BENEFITS AND COSTS.............................................................44
1. Overview of the Benefit-Cost Methodology..................................................44 2. Results for the Full Sample............................................................................49 3. Results for the Older Youth ...........................................................................51

CONTENTS (continued) Section Page
vi
H SUMMARY AND CONCLUSIONS ....................................................................52 REFERENCES ......................................................................................................55
APPENDIX A: ADDITIONAL TABLES PRESENTING EARNINGS IMPACTS FOR KEY YOUTH SUBGROUPS........................A.1
APPENDIX B: ADDITIONAL TABLES PRESENTING FINDINGS FROM THE BENEFIT-COST ANALYSIS.............................B.1

vii
TABLES
Tables Page
1 CHARACTERISTICS OF ELIGIBLE JOB CORPS APPLICANTS........................ 7 2 IMPACTS ON KEY EDUCATIONAL OUTCOMES DURING THE 48 MONTHS AFTER RANDOM ASSIGNMENT ................................................. 16 3 IMPACTS ON LITERACY SKILLS AT 30 MONTHS.......................................... 19 4 HOURLY WAGES, FRINGE BENEFITS, AND OCCUPATIONS IN THE MOST RECENT JOB IN QUARTER 16................................................... 22 5 IMPACTS ON CALENDAR YEAR EARNINGS AND EMPLOYMENT RATES, BY DATA SOURCE ................................................................................. 24 6 IMPACTS ON KEY PUBLIC ASSISTANCE, CRIME, AND OTHER
OUTCOMES DURING THE 48 MONTHS AFTER RANDOM ASSIGNMENT......................................................................................................... 29
7 IMPACTS PER PARTICIPANT ON EARNINGS AND ARREST RATES,
FOR YOUTH SUBGROUPS AND FOR RESIDENTS AND NONRESIDENTS .................................................................................................... 32
8 IMPACTS PER PARTICIPANT ON EARNINGS AND ARREST RATES, FOR CENTER SUBGROUPS.................................................................................. 36 9 IMPACTS ON CALENDAR YEAR EARNINGS AND EMPLOYMENT RATES
FOR 48-MONTH SURVEY RESPONDENTS AND NONRESPONDENTS........ 42 10 BENEFITS AND COSTS OF JOB CORPS FROM SOCIETY’S PERSPECTIVE......................................................................................................... 50 11 BENEFITS AND COSTS UNDER DIFFERENT ASSUMPTIONS ABOUT
THE SIZE OF THE EARNINGS IMPACTS AND THEIR DECAY, FOR ALL JOB CORPS PARTICIPANTS, BY DATA SOURCE .......................... 51


ix
FIGURES
Figures Page
1 AVERAGE EARNINGS PER WEEK BASED ON SURVEY DATA, BY QUARTER......................................................................................................... 20 2 IMPACTS ON CALENDAR YEAR EARNINGS, BY DATA SOURCE.............. 23 3 TOTAL 1998 TO 2004 SER EARNINGS, BY CENTER PERFORMANCE LEVEL...................................................................................................................... 40


1
Job Corps stands out as the nation’s largest, most comprehensive education and job training
program for disadvantaged youths. It serves disadvantaged youths between the ages of 16 and
24, primarily in a residential setting. The program’s goal is to help youths become more
responsible, employable, and productive citizens. Each year, it serves more than 60,000 new
participants at a cost of about $1.5 billion, which is more than 60 percent of all funds spent by
the U.S. Department of Labor (DOL) on youth training and employment services. Because Job
Corps is one of the most expensive education and training programs currently available to
youths, DOL sponsored the National Job Corps Study (conducted from 1993 to mid-2004) to
examine the effectiveness of the program. Mathematica Policy Research, Inc. (MPR), was the
prime contractor for the study, with subcontractors Battelle Human Affairs Research Centers and
Decision Information Resources, Inc. (DIR). DOL subsequently contracted with MPR to
examine longer-term earnings impacts and benefit-cost comparisons using the same Job Corps
sample and earnings data from administrative records.
The Job Corps evaluation was designed to address the following research questions:
• How effective is Job Corps overall at improving the outcomes of its participants? Does the program increase educational attainment and literacy? Does it reduce criminal behavior and the receipt of welfare benefits? And, most importantly, does it improve postprogram employment and earnings?
• Do Job Corps impacts differ across groups defined by youth and center characteristics and for residents and nonresidents? Do impacts differ by age, gender, race and ethnicity, arrest history, or educational level? Are impacts associated with center performance level, type of center operator, or center size?
• Do program benefits exceed program costs? Is Job Corps a good investment of society’s resources?
The Job Corps study is based on an experimental design where, from late 1994 to early
1996, nearly 81,000 eligible applicants nationwide were randomly assigned to either a program
group, whose members were allowed to enroll in Job Corps, or to a control group, whose 6,000

2
members were not. The study research questions have been addressed by comparing the
outcomes of program and control group members using survey data collected during the four
years after random assignment and using administrative earnings records covering the ten years
after random assignment (at which point sample members were between the ages of 26 and 34).
This report is the final in a series of project reports presenting impact and benefit-cost
findings from this large-scale random assignment evaluation of Job Corps.1 The report serves
two main purposes. First, it presents an additional year of earnings impacts to those presented in
the previous project report (Schochet and Burghardt 2005) and updates findings from the benefit-
cost analysis. Second, it places the earnings impact findings in perspective, by providing a
comprehensive summary of key study findings across all project reports. Thus, this self-
contained report pulls together and interprets the main evaluation results from the past twelve
years.
A synopsis of study findings is as follows:
• Job Corps substantially increases the education and training services that youths receive. It also improves their educational attainment. During the four-year survey period, Job Corps increased the education and job training that participants in our sample received both inside and outside the program by about 1,000 hours. This is about equal to the hours of instruction received in a regular 10-month school year. Job Corps also substantially increased the receipt of GED and vocational certificates by more than 20 percentage points each.
• Job Corps improves literacy. Job Corps produced measurable improvements in literacy skills needed to function successfully in daily life.
• Job Corps generates earnings gains during the first two years after program exit. Statistically significant earnings gains were found using both survey and administrative records data in years 3 and 4 after random assignment. In year 4, the gain in earnings per participant was about $1,150, or 12 percent, according to the survey data. The gains were smaller according to the administrative records data,
1 The key project reports include Johnson et al. (1999; process analysis); Burghardt et al. (1999;
implementation of random assignment); Schochet et al. (2001; impacts based on survey data); McConnell and Glazerman (2001; initial benefit-cost analysis based on survey data); Schochet et al. (2003) and Schochet and Burghardt (2005; earnings impacts and updated benefit-cost analysis based on tax data).

3
primarily because reported earnings levels are about 75 percent higher according to the survey data and also due to survey nonresponse bias. Earnings gains were found across broad groups of students, and in particular, for both residential and nonresidential students.
• Overall, there are no long-term program impacts on earnings. According to the administrative records data, the estimated impacts in years 5 to 10 for the full sample are all near zero and none are statistically significant. Earnings impacts are zero for all youth subgroups, except for the oldest students.
• Earnings gains persist for those 20- to 24 years old at program application. Participation in Job Corps produced earnings gains for 20- to 24-year-olds (about one-quarter of Job Corps students) in years 5 to 10. These findings are consistent with other study findings that the older students remain in Job Corps longer than younger ones and are more highly motivated and disciplined.
• Earnings impacts are not associated with center performance level, type of center operator, or center size. Similar earnings gains were found for centers rated as high-, medium-, and low-performing based on the Job Corps performance measurement system. Thus, the performance measurement system does not seem to be achieving the goal of distinguishing between more and less effective centers. In addition, similar impacts were found for centers that are operated by government agencies and those that are operated by private contractors. Finally, similar impacts were found for students attending large, medium, and small centers.
• Job Corps significantly reduces involvement with crime. According to the survey data, the arrest rate was reduced by 16 percent (about 5 percentage points), and similar reductions were found also for conviction and incarceration rates. Reductions in criminal activity were found across all youth subgroups.
• Job Corps has modest or no impacts on a range of other outcomes. The survey data indicate that the program had small beneficial impacts on receipt of public assistance and on self-assessed health status, but no impacts on illegal drug use or fertility. Job Corps also had small positive impacts on the percentage married or living with a partner and on the percentage living on their own.
• Because overall earnings gains do not persist, the benefits to society of Job Corps are smaller than the substantial program costs. The finding that costs exceed benefits for the full sample holds under a wide range of reasonable assumptions. However, Job Corps appears to be cost-effective for the 20- to 24-year-olds, whose earnings impacts persisted in years 5 to 10. In addition, benefits exceed costs from the perspective of program participants.
The study findings suggest that the Job Corps model has promise; program participation
increases educational attainment and literacy and reduces criminal activity and welfare receipt. It
is also the only federal training program that has been shown to increase earnings for this

4
population for several years after program exit. These positive findings, however, need to be
balanced against the lack of long-term earnings impacts for the overall sample based on the
administrative records data, and the finding that social benefits do not appear to offset program
costs except for the oldest students. Thus, the policy challenge is to improve program services to
sustain the earnings gains for the younger students and make the program cost-effective for a
population that has been extremely hard to serve.
The remainder of this report provides evidence for these conclusions and is divided into
eight sections. In the first two sections, we provide a brief overview of Job Corps and then
discuss the study design. In the next section, we discuss the data, samples, and statistical
methods for the analysis. In the fourth and fifth sections, we present impact findings for the full
sample and for population subgroups. In the sixth section, we assess the extent to which survey
nonresponse influenced the estimated earnings impacts. In the seventh section, we present key
findings from the benefit-cost analysis, where a dollar value is placed on the individual impact
estimates and program benefits are compared to program costs. Finally, we present a synopsis of
the study’s findings.
A. OVERVIEW OF JOB CORPS
The Job Corps program, established by the Economic Opportunity Act of 1964, operates
under the provisions of the Workforce Investment Act of 1998. At the time of the study, DOL
administered Job Corps through a national office and nine regional offices.2 Applicants must
meet eleven criteria to be eligible for Job Corps. Some of the key criteria are that the applicant
must be age 16 to 24; be a legal U.S. resident; be economically disadvantaged; need additional
2 There are currently (2006) six regional offices.

5
education, training, or job skills; be free of serious behavioral problems; have a clean health
history; and have an adequate child care plan (for those with children).
Job Corps services are delivered in three stages: outreach and admissions, center operations,
and placement. Outreach and admissions (OA) counselors recruit students, inform them about
the program, and ensure they meet eligibility criteria. Center operations, which are the heart of
the program, involve vocational training, academic education, residential living, health care, and
a wide range of other services, including counseling, social skills training, health education, and
recreation. At the time of the study, these comprehensive services were delivered at 110 Job
Corps centers nationwide. Most centers are operated by private contractors, although about one-
quarter are operated by the U.S. Department of Agriculture and the U.S. Department of the
Interior. For six months after the youths leave the program, placement agencies help participants
find jobs or pursue additional training.
Most Job Corps students reside at the Job Corps center while training, although about 13
percent are nonresidential students who reside at home. Enrollment in Job Corps does not have a
fixed duration (duration is eight months on average but varies widely). The program has a
distinctive open-entry, open-exit educational philosophy, where instruction is individualized and
self-paced. At the time of the study, Job Corps offered vocational training in more than 75 trades,
and a typical center offered 10 or 11 trades. The vocational curricula were developed with input
from business and labor organizations and emphasize the achievement of specific competencies
necessary to work in a trade. Academic education aims to alleviate deficits in reading, math, and
writing skills and to provide a GED certificate. Job Corps has a uniform, computer-based
curriculum for major academic courses.
Job Corps has a number of distinctive characteristics: a high degree of uniformity in
program form and content; a high degree of federal direction; and continuity, especially in center

6
operations (where in many cases the same contractor has been operating the center for decades).
Job Corps also uses a comprehensive performance measurement system, which drives program
operations; heavy emphasis is placed on a contractor’s performance in awarding competitive
contracts.
Using data from week-long visits to 23 randomly-selected centers and from surveys of
outreach and admissions agencies and centers, Johnson et al. (1999) concluded that Job Corps
uses a well-developed program model and that the program is well implemented. One exception
is that placement services were found to be limited in scope and substance—relatively few
students got help from placement agencies in securing a job or further training.
As Congress intended when it formed the program, Job Corps serves disadvantaged youths
(Table 1). Only 23 percent of youths in our sample had a high school credential at program
application, and about 70 percent are members of racial or ethnic minority groups (nearly 50
percent are African American and 20 percent are Hispanic). About one-fourth of applicants (and
nearly one-third of male applicants) had been in trouble with the law before applying to Job
Corps. More than half lived in families that received public assistance while they were growing
up. About 59 percent of youths are male. About 30 percent of females had children at program
application. More than 40 percent of applicants were 16 or 17 years old, and about three-quarters
were younger than 20.
Using 1995 March Current Population Survey (CPS) data, we find that compared to a
nationwide population of low-income youths between the ages of 16 and 24, an eligible Job
Corps applicant is more likely to be male (59 percent versus 39 percent), African American (47
percent versus 29 percent), 16 or 17 years old (41 percent versus 24 percent), without a high
school credential (77 percent versus 53 percent), and from a large urban area (78 percent versus
70 percent) (Schochet 1998a).

7
TABLE 1
CHARACTERISTICS OF ELIGIBLE JOB CORPS APPLICANTS
Characteristic Percentage of Eligible Applicants Gender
Male 59.4 Females without children 28.9 Females with children 11.7
Age at Application
16 to 17 41.5 18 to 19 31.8 20 to 24 26.7
Race and Ethnicity
White, non-Hispanic 27.1 Black, non-Hispanic 47.7 Hispanic 17.7 Other 7.6
Had a High School Credential 23.0 Arrest History (Self-Reported)
Ever arrested 26.5 Arrested for serious crimesa 5.4
Family Received Welfare When Growing Up 53.4
Source: 14,327 eligible applicants who completed baseline interviews.
aSerious crimes include aggravated assault, murder, robbery, and burglary.
B. OVERVIEW OF THE STUDY DESIGN
The Job Corps evaluation is based on an experimental design in which, with a few
exceptions, all youths nationwide who applied to Job Corps in the 48 contiguous states between
November 1994 and December 1996 and were found to be eligible by the end of February 1996
were randomly assigned to either a program group or a control group.3 Program group members
were allowed to enroll in Job Corps; control group members were not for three years after
random assignment, although they could enroll in other training or education programs. Thus, the
3 Burghardt et al. (1999) provide more details on the sample design and the implementation of random
assignment.

8
comparisons of program and control group outcomes represent the effects of Job Corps relative
to other available programs that the study population would enroll in if Job Corps were not an
option. Due to the nationally representative sample, study results can be generalized to the full
Job Corps program as it operated at the time of the study.
The nonclustered design was adopted because it produced more precise impact estimates
than a clustered design with the same sample size. Furthermore, this approach spread the burden
of random assignment across all OA agencies and Job Corps centers, which helped sell random
assignment to Job Corps staff. Over 1,300 Job Corps OA counselors nationwide were directly
involved in random assignment.
The evaluation is based on large samples. Nearly 81,000 Job Corps-eligible applicants were
randomly assigned to a research status. During the sample intake period, 5,977 youths (about 7
percent of the total) were randomly assigned to the control group, 9,409 youths were randomly
assigned to the program group as part of the research sample (which we refer to hereafter as the
program group), and the remaining youths were randomly assigned to a program nonresearch
group (whose members could enroll in the program but were not followed for the study).
As expected, random assignment produced program and control groups whose distributions
of characteristics prior to random assignment were similar. Of the 94 statistical tests conducted
to assess differences in the baseline characteristics of the program and control groups, 5 were
statistically significant at the 5 percent level, which is what would be expected by chance
(Schochet 1998a). A joint test of differences across all baseline variables considered together
yields a p-value of more than .70.
Job Corps staff implemented random assignment procedures well (Burghardt et al. 1999). In
examining weekly extracts from the Job Corps Student Pay, Allotment, and Management
Information System (SPAMIS) on all new center enrollees, we found that less than 0.6 percent of

9
enrollees arrived at a center without having been previously randomly assigned; thus, nearly all
those in the study population were subject to random assignment. Furthermore, only 1.4 percent
of control group members enrolled in Job Corps before the end of the three-year embargo period
during which they were not supposed to enroll.4 Hence, we believe that the research sample is
representative of the youths in the intended study population, and that any potential bias in the
impact estimates due to contamination of the control group is very small.
The study did not appear to alter program operations substantially, which suggests that the
study evaluated Job Corps as it would have normally operated in the absence of the study.
Johnson et al. (1999) found that the effects of the random assignment process on OA counselors’
activities and on the composition of the students coming to the program appear to have been
modest.5
C. DATA, SAMPLES, AND ANALYTIC METHODS
The outcome measures for the analysis were obtained from two sources: (1) survey data
covering the four years after random assignment and (2) administrative earnings (tax) records
covering the ten years after random assignment. In this section, we discuss these data sources
and analysis samples for each. In addition, we discuss statistical methods for the impact analysis.
1. Survey Data
Surveys were conducted at baseline (shortly after random assignment) and at 12, 30, and 48
months after random assignment. Interviews were conducted by telephone and in person for
4 An additional 3.2 percent of control group members enrolled in Job Corps after their three-year restriction
period ended.
5 The presence of the control group without a substantial increase in recruitment led to a decrease in the percentage of center slots that were filled in the first half of 1995. However, Johnson et al. (1999) found no evidence that the reduction in the number of students affected center services.

10
those not reachable by telephone. During the baseline interview, in-person interviews were
conducted in randomly selected areas only in order to conserve data collection costs, resulting in
a survey sample that is slightly clustered (Schochet 2001). For the follow-up interviews,
however, in-person interviews were conducted in all areas.
The research sample includes 11,313 youths (6,828 program group and 4,485 control group
members) who completed a 48-month interview. The response rate to the 48-month interview
was 79.9 percent (81.5 percent for the program group, and 77.4 percent for the control group).
The distributions of baseline characteristics of program and control group members in the 48-
month sample are very similar (Schochet 2001). The distribution of baseline characteristics,
however, differs slightly for those in the 48-month sample and the full sample of respondents and
nonrespondents. Thus, we adjusted the sample weights using propensity scoring procedures so
that the observable baseline characteristics of the 48-month sample matched those of the full
sample.
The interviews obtained information on outcome measures in the following areas that we
hypothesized could by influenced by participation in Job Corps: (1) education and training; (2)
employment and earnings; and (3) nonlabor market outcomes, including welfare receipt, crime,
alcohol and illegal drug use, health, family formation, and child care.
2. Administrative Earnings Records
The evaluation relied also on 1993 to 2004 annual summary earnings records (SER) data
reported by employers to the Internal Revenue Service (IRS), which are maintained by the Social
Security Administration (SSA) to determine workers’ eligibility for social security. The primary
11
source for these data is the W-2 form. The SER data cover about 96 percent of all workers in
formal employment or self-employment (Social Security Administration 2001).6
The SER (tax) data were used for two purposes. First, they were used to verify the survey-
based earnings impact estimates during the four-year period covered by the survey (roughly
calendar years 1995 to 1998). Impact estimates using the two data sources could differ because
of interview nonresponse or reporting or coverage differences. For instance, earnings from
casual jobs or the underground economy are not covered in the SER data, although they may be
reported in surveys. Second, the SER data were used to cost effectively provide longer-term
earnings impacts through 2004 (when sample members were between the ages of 26 and 34).
To protect confidentiality, SSA does not release earnings data for individuals. Accordingly,
SSA ran computer programs that we provided to estimate impacts and their associated levels of
statistical significance for the full sample and for key subgroups of the Job Corps population.
The sample for the analysis included 15,138 of the 15,301 youths in the full study sample who
provided social security numbers and whose social security numbers were validated by SSA’s
Enumeration Verification System.
3. Analytic Methods
As discussed next, we estimated impacts for the full sample as well as for key subgroups
defined by youth and center characteristics. All figures were calculated using sample weights to
account for the sample design (and the survey design for estimates based on the survey data).
6 The evaluation also collected 1999 to 2001 quarterly wage records reported by employers to state
unemployment insurance (UI) agencies in 22 randomly selected states. Earnings impacts using these data are very similar to those using the SER data (Schochet et al. 2003) and are not presented in this report.

12
a. Estimating Impacts for the Full Sample
Random assignment was conducted at the point that program applicants were determined to
be eligible for Job Corps, not at the point that they enrolled in Job Corps. Thus, differences
between the average earnings of all program and control group members are impacts per eligible
applicant. Consequently, these estimates include the 73 percent of program group members who
enrolled in a Job Corps center at some point after random assignment as well as the 27 percent of
program group members who did not enroll (“no-shows”).
To obtain impact estimates per program participant, we divided the impact estimates per
eligible applicant by the program participation rate (Bloom 1984; Angrist et al. 1996).7 This
approach is commonly used in the evaluation literature, and yields unbiased impact estimates for
participants under the assumption that Job Corps has no effect on program no-shows. This is
likely to be a tenable assumption, because the offer of a Job Corps slot without active
participation is unlikely to appreciably affect a youth’s long-term earnings.8,9
The impact estimates per participant should be interpreted as the difference between the
mean outcomes of participants and what these outcomes would otherwise have been in the
absence of Job Corps. Because the program participation rate was high, the findings for eligible
applicants and program participants are very similar.
7 We obtained Job Corps participation data from SPAMIS.
8 There is no evidence that no-shows received additional counseling from Job Corps staff on options other than Job Corps, because their enrollment rates in other education and training programs were not unusual (Schochet et al. 2001).
9 The impacts reported in this report are based on a variant of this statistical procedure where we account also for the 1.2 percent of the control group who enrolled in Job Corps during its three-year restriction period (Schochet 2001). This variant divides the estimated impacts per eligible applicant by the difference between the program group participation rate and the control group crossover rate. Standard errors of the impact estimates were inflated to account for the estimation error in the participation and crossover rates.

13
We also estimated regression-adjusted impacts using multivariate models to control for other
factors measured at baseline that affect the outcome measures. The impact estimates and their
standard errors using the regression approach are very similar to the simple weighted
differences-in-means estimates that are presented in this report (Schochet 2001).
b. Estimating Impacts for Subgroups
An important part of the impact analysis was to assess whether impacts differed for
subgroups defined by youth and center characteristics and for residential and nonresidential
students. This information can be used by policymakers to improve program services and to
target them appropriately.
Subgroup definitions and sample sizes are shown in Appendix Table A.1. The youth
subgroups include age at application to Job Corps; gender, race and ethnicity; arrest history at
random assignment; and educational level at random assignment. The center characteristics
include type of operator (CCC or contract centers), size, and performance ranking. (For further
description of center characteristics, see Burghardt and Schochet 2001.)
The impacts by residential status are of considerable policy interest for several reasons.
First, the residential and nonresidential components serve students with different characteristics
and needs; relative to residents in our sample, nonresidents are more likely to be female (70
percent versus 36 percent), to have had children at program application (49 percent versus 13
percent), and to be older (74 percent versus 56 percent were at least 18 years old at program
application). Second, previous studies have found that disadvantaged youths do not benefit
significantly from participation in nonresidential training programs (Orr et al. 1996 and Cave et
al. 1993). Finally, the cost per participant is about 25 percent more for residential students than
for nonresidential students (McConnell and Glazerman 2001).

14
Impacts for subgroups defined by youth characteristics were estimated by comparing the
average outcomes of program and control group members in the group of interest. Impacts for
females, for example, were computed by comparing the outcomes of females in the program and
control groups. We conducted t-tests to determine the statistical significance of impact estimates
for each subgroup, and F-tests to jointly determine whether impacts differed across levels of a
subgroup— for example, across the three age groups or across males and females.
The estimation of impacts for the residential and center-related subgroups is complicated by
missing data on residential and center assignments for control group members and program
group no-shows. To account for this problem, we estimated impacts for these subgroups using
predictions by Job Corps OA staff as to whether each applicant was likely to be assigned to a
residential or nonresidential slot and the likely center assignment. These predictions were
collected before random assignment (and thus, are available for both program and control group
members), are rarely missing, and proved to be very accurate (Schochet 1998b). Thus, impacts
for residential designees were estimated by comparing the mean outcomes of residential
designees in the program and control groups and similarly for nonresidential designees and those
in each center-level subgroup.
Finally, we used the SER data to estimate impacts separately for respondents and
nonrespondents to the 48-month interview. We conducted this analysis to assess the extent to
which interview nonresponse may have affected the survey-based earnings impact estimates.
D. IMPACT RESULTS FOR THE FULL SAMPLE
Program group members received extensive and meaningful Job Corps services (Schochet et
al. 2001). Most enrolled in centers (about 73 percent), and participants typically enrolled soon
after being found eligible (about six weeks on average). The average length of stay per
participant was about eight months, although duration varied considerably; nearly one quarter

15
stayed for over a year, and 28 percent stayed for less than three months. Program
“completers”—the 49 percent of participants who completed a vocational trade or GED in Job
Corps—enrolled for about eleven months on average, compared to less than three months for
program noncompleters.
Participants used center activities extensively. More than 82 percent reported receiving
academic instruction, and nearly 89 percent received vocational training. The average participant
received 1,140 hours of academic and vocational instruction, equivalent to about one year of
high school classroom instruction. Participants also took part in the many socialization activities
in Job Corps, such as parenting education, health education, social skills training, and cultural
awareness classes.
1. Education and Training
Impacts on education and training outcomes depend critically on what education and
training the control group received, because these youths were allowed to enroll in education and
training programs other than Job Corps. We find, using survey data, that many control group
members received substantial amounts of education and training (Table 2). More than 70 percent
participated in an education or training program during the 48 months after random assignment.
On average, they received about 850 hours of education and training, roughly equivalent to
three-quarters of a year of high school. Participation rates were highest in programs that
substitute for Job Corps: GED programs (37 percent); high school (32 percent); and vocational,
technical, or trade schools (29 percent) (not shown).
Because control group members demonstrated the motivation to go to Job Corps, it is not
surprising that many had the motivation to find other programs. These results highlight that the
counterfactual for the evaluation is active participation in education and training programs other
than Job Corps, rather than the absence of such participation. Furthermore, they highlight that
study findings pertain to a specialized group of motivated youths interested in Job Corps rather

16
TABLE 2
IMPACTS ON KEY EDUCATIONAL OUTCOMES DURING THE 48 MONTHS AFTER RANDOM ASSIGNMENT
Program Group
Control Group
Estimated Impact per Eligible Applicanta
Estimated Impact per Participantb
Percentage Ever Enrolled in an Education or Training Program During the 48 Months After Random Assignment 92.5 71.7 20.8*** 28.9*** Average Percentage of Weeks Ever in Education or Training 24.4 18.2 6.3*** 8.7*** Average Hours Ever in Education or Training 1,559.8 848.2 711.6*** 989.0***
Vocational Training 788.2 231.5 556.8*** 773.8*** Academic Classes 771.6 616.8 154.8*** 215.2***
Degrees, Diplomas, and Certificates Received (Percentage)
GED certificatec 41.6 26.6 15.0*** 20.9*** High school diplomac 5.3 7.5 –2.2*** –3.1*** Vocational, technical, or trade certificate 37.5 15.2 22.3*** 30.9*** College degree (two- or four-year) 1.3 1.5 –0.2 –0.3
Sample Size 6,828 4,485 11,313 Source: Baseline and 12-, 30-, and 48-month follow-up interview data for those who completed 48-month
interviews. aEstimated impacts per eligible applicant are measured as the difference between the weighted means for program and control group members. bEstimated impacts per Job Corps participant are measured as the estimated impacts per eligible applicant divided by the difference between the proportion of program group members who enrolled in Job Corps and the proportion of control group members who enrolled in Job Corps during their three-year restriction period. cFigures pertain to sample members who did not have a high school credential at random assignment. *Significantly different from zero at the .10 level, two-tailed test. **Significantly different from zero at the .05 level, two-tailed test. ***Significantly different from zero at the .01 level, two-tailed test.

17
than to average disadvantaged youths nationwide (Job Corps serves only a small fraction of
disadvantaged youths).
Despite the activity of the control group, Job Corps substantially increased the education and
training that program participants received (Table 2). Over the four year follow-up period,
ninety-three percent of the program group engaged in some education or training (either from
Job Corps or elsewhere), compared to 72 percent of the control group. Job Corps participants
spent about 1,000 hours in total—about 5 hours per week—more in education or training than
they would have if they had not enrolled in the program.10 This impact per participant
corresponds to roughly one high school year. The impact per participant on time spent in
vocational training was more than triple the impact on time spent in academic classes (774 hours,
compared to 215 hours).
Job Corps had large effects on the receipt of credentials it emphasizes most: GED and
vocational certificates (Table 2). Among those program group members without a high school
credential at random assignment, about 42 percent obtained a GED during the 48-month period,
compared to only 27 percent of control group members. However, slightly more members of the
control group earned a high school diploma. This is probably because only about one-quarter of
Job Corps centers were accredited to grant high school diplomas, and some control group
members returned to high school. (Very few control group members graduated, however,
because on average they had only completed the tenth grade when applying for Job Corps and
returned to high school for an average of only about nine months.) About 38 percent of program
10 About 63 percent of the program group enrolled in programs other than Job Corps (Schochet et al. [2001]
display enrollment rates for program group Job Corps participants and no-shows). The impact per participant on hours per week spent in programs other than Job Corps was about –2 hours per week.

18
group members reported receiving a vocational certificate, compared to about 15 percent of the
control group.11 Job Corps, however, had no effect on college attendance or completion.
2. Literacy
The study also measured impacts on participants’ functional literacy—the ability to perform
a wide variety of information processing tasks that adults encounter in everyday life (Glazerman
et al. 2000). The assessment developed by the Educational Testing Service for the National Adult
Literacy Study (Kirsch et al. 1993) was administered in person to a random subsample of about
2,300 program and control group members in conjunction with the 30-month interview. The
response rate to the literacy study was about 60 percent.
The test developers identified five broad levels for each dimension of literacy (225 or less,
225 to 275, 275 to 325, 325 to 375, and 375 to 500). Not surprisingly, eligible Job Corps
applicants, as measured by the performance of the study’s control group, scored relatively low on
these tests compared to young adults nationally. In the national sample of young adults,
approximately 15 percent scored in the lowest level of each dimension. Among the control
group, 27 percent scored in the lowest level of prose, 20 percent scored in the lowest level of
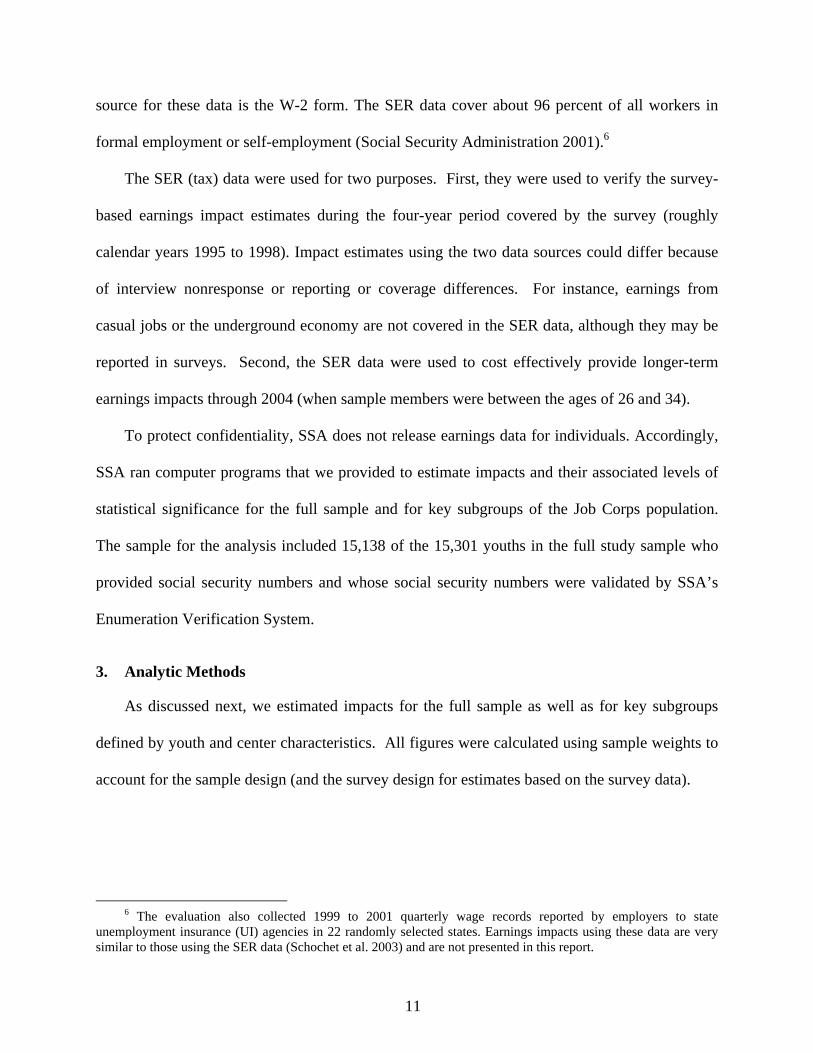
document literacy, and 44 percent scored in the lowest level of quantitative literacy (Table 3).
Job Corps improved participants’ functional literacy; the program group had higher average
scores on the assessment measures than the control group (Table 3).12 The impacts per
participant were about 4 points on the prose scale, 2 points on the document scale, and 5 points
11 Because of the emphasis given to documenting progress and certifying vocational completion in Job Corps,
participants might have been influenced by this emphasis and over-reported their certificate completion. However, the impacts on vocational certification are in line with impacts on the receipt of vocational training, which lends credence to the findings.
12 Due to relatively small sample sizes and relatively low response rates for the literacy study, we present regression-adjusted estimates in Table 3 rather than the simple differences-in-means estimates that are presented elsewhere in this report.
19
TABLE 3
IMPACTS ON LITERACY SKILLS AT 30 MONTHS
Program Group
Control Group
Estimated Impact per Eligible Applicanta
Estimated Impact per Participantb
Prose (Percentages)c
Level I Level II Level III Level IV Level V Average Prose Proficiency
24.3 48.2 24.2
3.2 0.0
251.0
26.8 48.2 22.2
2.8 0.0
248.3
0.077*
–2.5
0.0 2.1 0.4 0.0 2.7*
–3.2 0.0 2.8 0.6 0.0 3.7*
Document (Percentages)c
Level I Level II Level III Level IV Level V Average Document Proficiency
18.9 47.4 29.3
4.2 0.0
257.6
20.0 47.8 28.1
3.9 0.1
256.4
0.339
–1.1 –0.4
1.2 0.3 0.0 1.1
–1.5 –0.5
1.7 0.4 0.0 1.6
Quantitative (Percentages)c
Level I Level II Level III Level IV Level V Average Quantitative Proficiency
40.7 38.6 18.5
1.9 0.2
234.8
44.4 37.3 16.5
1.6 0.2
231.2
0.039**
–3.7
1.3 2.1 0.3 0.0 3.6*
–5.0 1.8 2.8 0.4 0.1 4.9**
Sample Size 1,117 1,156 2,273
Source: Data from Job Corps literacy assessments conducted in person with a random subset of sample members in conjunction with the 30-month follow-up interview.
Notes: All estimates are regression adjusted. Level I scores are 225 or less, Level II scores are between 225 and 275, Level III scores are between 275 and 325, Level IV scores are between 325 and 375, and Level V scores are between 375 and 500.
aEstimated impacts per eligible applicant are measured as the difference between the regression-adjusted means for program and control group members.
bEstimated impacts per Job Corps participant are measured as the estimated impacts per eligible applicant divided by the difference between the proportion of program group members who enrolled in Job Corps and the proportion of control group members who enrolled in Job Corps during their three-year restriction period.
cFigures in header rows are p-values for statistical tests for differences in the distribution of test scores across the program and control groups.
*Significantly different from zero at the .10 level, two-tailed test. **Significantly different from zero at the .05 level, two-tailed test. ***Significantly different from zero at the .01 level, two-tailed test.

20
on the quantitative scale, with most of the gains due to movements out of Level I. The impacts
on the average prose and quantitative scale are statistically significant at the 10 percent level.
The impacts in effect size units are about .10 standard deviations.
3. Employment and Earnings Impacts Based on the Survey Data
The survey data indicate that Job Corps generated positive earnings impacts beginning in the
third year after random assignment, and the impacts persisted through the end of the four-year
follow-up period (Figure 1 and Table A.2). The control group’s earnings were larger than those
of the program group early in the follow-up period, because many program group members were
FIGURE 1
AVERAGE EARNINGS PER WEEK BASED ON SURVEY DATA, BY QUARTER
0
50
100
150
200
250
1* 2* 3* 4* 5* 6 7 8 9* 10* 11* 12* 13* 14* 15* 16*
Source: Baseline and 12-, 30-, and 48-month follow-up interview data for those who completed 48-month interviews.
Note: Appendix Table A.2 displays the full set of estimates used to construct this figure.
*Difference between the mean outcome for program and control group members is statistically significant at the .05 level, two-tailed test. This difference is the estimated impact per eligible applicant.
Average Earnings per Week in Quarter (in 1995 Dollars)
Quarter After Random Assignment
Program Group
Control Group

21
enrolled in Job Corps then. It took about two years after random assignment for the program
group’s earnings to overtake those of the control group. The impacts grew in the third year of the
follow-up period and persisted in the fourth year. In the fourth year, average weekly earnings for
program group members were $211, compared to $195 for control group members. The
estimated impact per Job Corps participant was $22 per week (or $1,150 in total) in the fourth
follow-up year, which translates into a 12 percent earnings gain. These impacts are statistically
significant at the 1 percent level. Impacts on employment rates (Table A.2) and hours of work
followed similar patterns. Our decomposition analysis suggests that two-thirds of the earnings
impact was due to the impact on hours worked and that one-third was due to the impact on
earnings per hour (Schochet et al. 2001).
The survey data also indicate also that program group members found slightly higher-paying
jobs with slightly more benefits (Table 4). Employed program group members earned an average
of $0.22 more per hour than employed control group members in their most recent job in the last
quarter of the fourth follow-up year ($7.55 compared to $7.33). In addition, employed program
group members were slightly more likely than employed control group members to hold jobs that
offered fringe benefits. For example, in the most recent job in the fourth year, about 57 percent
of the employed program group received health insurance, compared to 54 percent of the
employed control group, and about 48 percent of employed program group members were
offered retirement or pension benefits, compared to 44 percent of employed control group
members. The percentages of program and control group members who worked in each of
several broad occupational areas, however, were similar, with more than 40 percent working in
low-wage service and construction occupations.

22
TABLE 4
HOURLY WAGES, FRINGE BENEFITS, AND OCCUPATIONS IN THE MOST RECENT JOB IN QUARTER 16
Outcome Measure Program Group Control Group Differencea Percent Employed in Quarter 16 71.1 68.7 2.4*** Average Hourly Wage (in 1995 Dollars)a 7.55 7.33 0.22 Benefits Available (Percentage)a
Health insurance Paid vacation Retirement or pension benefits
57.4 62.9 48.3
54.3 60.7 43.7
3.0** 2.2* 4.6***
Occupation (Percentage)a,b
Service Sales Construction Private household Clerical Mechanics/machinists Agriculture/forestry Other
21.3
9.7 20.9
6.9 11.8 13.9
2.6 12.9
20.8 12.1 20.3
7.2 12.8 13.1
2.6 11.1
.030** 0.4
–2.3 0.5
–0.2 –1.0
0.7 0.0 1.9
Sample Size 6,828 4,485 11,313 Source: Baseline and 12-, 30-, and 48-month follow-up interview data for those who completed 48-month
interviews. aBecause these estimates are conditional on being employed in quarter 16, they are not impact estimates. bThe value in the header row displays the p-value for a significance test of differences in the occupational distributions across the research groups. *Significantly different from zero at the .10 level, two-tailed test. **Significantly different from zero at the .05 level, two-tailed test. ***Significantly different from zero at the .01 level, two-tailed test.
4. Employment and Earnings Impacts Based on the SER Data in Years 1 to 4
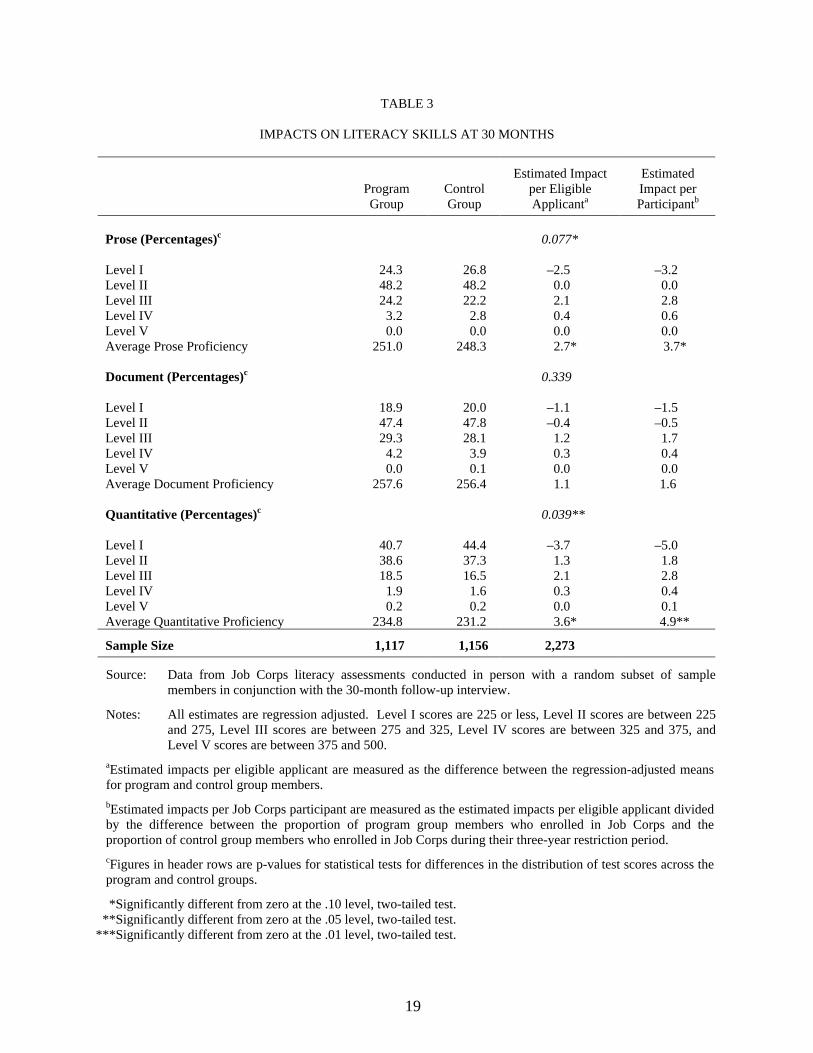
The pattern of the estimated impacts on annual earnings using the survey and SER data is
similar for the calendar years covered by both data sources (Figure 2 and Table 5).13 However,
the survey-based impact estimates are larger. For instance, in 1998, the earnings impacts were
13 The survey-based impact estimates differ slightly in Table 5 and Appendix Table A.2, because earnings in
Table 5 are measured in calendar time, whereas earnings in Appendix Table A.2 are measured in the time since random assignment.
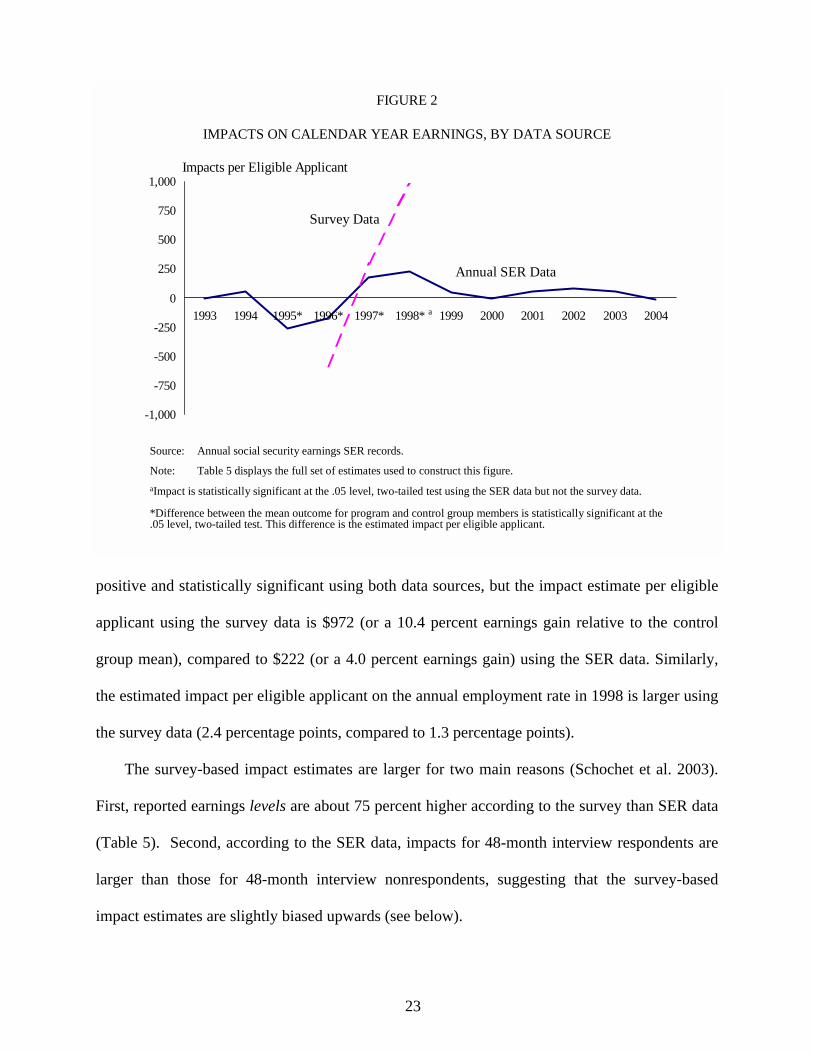
23
positive and statistically significant using both data sources, but the impact estimate per eligible
applicant using the survey data is $972 (or a 10.4 percent earnings gain relative to the control
group mean), compared to $222 (or a 4.0 percent earnings gain) using the SER data. Similarly,
the estimated impact per eligible applicant on the annual employment rate in 1998 is larger using
the survey data (2.4 percentage points, compared to 1.3 percentage points).
The survey-based impact estimates are larger for two main reasons (Schochet et al. 2003).
First, reported earnings levels are about 75 percent higher according to the survey than SER data
(Table 5). Second, according to the SER data, impacts for 48-month interview respondents are
larger than those for 48-month interview nonrespondents, suggesting that the survey-based
impact estimates are slightly biased upwards (see below).
FIGURE 2
IMPACTS ON CALENDAR YEAR EARNINGS, BY DATA SOURCE
Impacts per Eligible Applicant
-1,000
-750
-500
-250
0
250
500
750
1,000
1993 1994 1995* 1996* 1997* 1998* 1999 2000 2001 2002 2003 2004
Source: Annual social security earnings SER records.
Note: Table 5 displays the full set of estimates used to construct this figure.aImpact is statistically significant at the .05 level, two-tailed test using the SER data but not the survey data.
*Difference between the mean outcome for program and control group members is statistically significant at the.05 level, two-tailed test. This difference is the estimated impact per eligible applicant.
Annual SER Data
Survey Data
a

24
TABLE 5
IMPACTS ON CALENDAR YEAR EARNINGS AND EMPLOYMENT RATES, BY DATA SOURCE
Survey Data Annual Social Security Earnings SER Records
Outcome Measure
Program Group
Control Group
Estimated Impact per Eligible Applicanta
Estimated Impact per Participantb
Program Group
Control Group
Estimated Impact per Eligible Applicanta
Estimated Impact per Participantb
Average Calendar Year Earnings (in 1995 Dollars)
1993 1,010 1,016 –7 1994 1,590 1,543 47 1995 1,761 2,030 –270*** –368*** 1996 5,145 5,729 –584*** –812*** 3,101 3,279 –178*** –243*** 1997 8,111 7,819 292* 406* 4,559 4,385 175** 238** 1998 10,296 9,324 972*** 1,350*** 5,831 5,610 222** 302** 1999 6,701 6,658 43 59 2000 7,601 7,611 –11 –14 2001 7,850 7,795 56 76 2002 7,820 7,741 79 107 2003 7,914 7,865 49 67 2004 8,384 8,401 -18 -25 1998 to 2004 52,101 51,682 419 571
Percentage Employed in Calendar Year
1993 43.0 43.1 –0.1 1994 59.5 58.8 0.7 1995c 89.2 73.3 15.9*** 21.6*** 1996c 70.4 74.5 –4.2*** –5.8*** 88.8 78.4 10.3*** 14.0*** 1997 77.7 76.9 0.8 1.1 83.6 81.5 2.1*** 2.8*** 1998 81.4 78.9 2.4*** 3.4*** 84.6 83.3 1.3** 1.7** 1999 84.5 83.0 1.5** 2.0** 2000 83.6 83.0 0.6 0.8 2001 80.6 80.4 0.3 0.4 2002 76.8 76.7 0.1 0.1 2003 74.5 73.7 0.7 0.9 2004 74.2 73.6 0.6 0.8
Sample Size 6,828 4,485 11,313 9,264 5,874 15,138

TABLE 5 (continued) ________________________________________________________________________________________________________________________
25
Sources: (1) Baseline and 12-, 30-, and 48-month follow-up interview data for those who completed 48-month interviews and (2) annual social security earnings SER records for the full research sample.
Note: Blank entries signify that figures are not applicable.
aEstimated impacts per eligible applicant are measured as the difference between the weighted means for program and control group members. bEstimated impacts per Job Corps participant are measured as the estimated impact per eligible applicant divided by the difference between the proportion of program group members who enrolled in Job Corps and the proportion of control group members who enrolled in Job Corps during their three-year restriction period. cEmployment rates in the SER data are high for the program group in 1995 and 1996 because student pay that Job Corps students receive while enrolled in the program is reported to the government. *Significantly different from zero at the .10 level, two-tailed test. **Significantly different from zero at the .05 level, two-tailed test. ***Significantly different from zero at the .01 level, two-tailed test.

26
Schochet et al. (2003) tried to unravel reporting differences in earnings levels according to
the survey and administrative records data by comparing survey data to individual-level
Unemployment Insurance (UI) wage records from 22 randomly-selected states. (The UI data
produced very similar impact estimates to those based on the SER data.) The survey-UI
differences are partly explained by under-the-table earnings not reported in the UI data, the
noncoverage of some formal jobs in the UI program, the overreporting of hours worked in the
survey data, mismatched records, and incomplete reporting of taxable earnings by employers.
However, substantial residual factors remain.
The differences between the reporting levels based on the survey and administrative records
data are somewhat larger than those found in previous studies using similar populations. For
example, Kornfeld and Bloom (1999) found that mean quarterly earnings were about 35 to 70
percent higher according to the survey data than the UI data for youths in the National Job
Training Partnership Act (JTPA) Study. Similarly, Cave (1995) found that the survey-to-UI
ratios ranged from about 1.05 to 1.80 from several studies that examined the earnings of welfare
recipients in welfare-to-work demonstration programs. One possible explanation for these
findings is that the National Job Corps Study was conducted during a period of stronger
economic growth. Thus, in the tight labor market, the Job Corps sample may have been more
likely to collect under-the-table earnings from casual or cash-only jobs that are reported in the
survey but not in the administrative data.
5. Employment and Earnings Impacts Based on the SER Data After Year 4
Based on the SER data, we find no impacts of Job Corps on employment or earnings after
the four-year period covered by the survey. The estimated impacts on calendar year earnings in
1999 to 2004 are all near zero and not statistically significant (Figure 2 and Table 5). No
impacts were found during the period of strong economic growth in 1999 and 2000 (which may

27
have benefited the earnings of the lower-skilled control group more, as suggested by Hoynes
1999 and Katz and Krueger 1999), or as economic conditions worsened between 2001 and 2004
(as the employment rate decreased for both research groups).
Thus, the modest impacts on labor market activities that occurred during the initial
postprogram period—that were likely caused by positive impacts on time spent in education and
training, increases in the attainment of GED and vocational certificates, modest gains in
functional literacy, and perhaps by the job placement services offered by Job Corps—did not put
the program group on a different earnings trajectory than the control group. Instead, the earnings
differences faded as both groups gained job-specific skills through increased work experience.
The earnings of both groups increased over time, but youths in both groups continued to have
low-paying, intermittent jobs, as demonstrated by the very low earnings levels reported in the tax
data (in 2004, the average worker in both groups earned about $11,350, and only 10 percent of
the sample earned more than $22,500).14
It is impossible to say whether estimated impacts based on survey data would have also
disappeared after 1998. However, it is plausible that the decline in the survey impacts would
have mirrored the decline in the SER impacts, because the pattern of impacts estimated using the
SER and survey data were similar in overlapping periods, and we have no reason to expect this
pattern to have diverged. Furthermore, a decline in the SER impacts without a decline in the
survey impacts would suggest a growing impact on earnings from informal jobs. It would be
difficult to imagine a scenario where Job Corps had a growing impact on earnings from informal
jobs at the same time as it had a declining impact on earnings from formal jobs.
14 The earnings impacts are not likely to have been materially affected by differences across the research
groups in school enrollment rates or control group enrollment rates in Job Corps. Only about 13 percent of both the program and control groups were enrolled in school at 48 months after random assignment, and only about 1 percent of control group members were still enrolled in Job Corps after the four-year survey period.
28
Finally, the 1999 to 2004 earnings impacts for Job Corps completers—the 49 percent of
program group participants who completed a vocational trade or GED in Job Corps—are also
likely to be zero (Schochet et al. 2005). This is because the weighted average of the impacts for
Job Corps no-shows, noncompleters, and completers must equal the zero impacts for eligible
applicants (with weights .27, .36, and .37, respectively). Thus, impacts on completers could be
large and positive only if impacts on noncompleters are equally large and negative. We believe,
however, that this is unlikely, because it is difficult to construct a reasonable scenario in which a
relatively brief stint in Job Corps for noncompleters (about 2.7 months on average) would
actually cause their long-term earnings to be lower than they would have been without Job Corps
(although their short-term earnings could have been negatively affected). Thus, our best estimate
is that earnings impacts in 1999 to 2004 were zero for both the program completers and
noncompleters.
6. Other Outcomes
Using survey data, the study examined the impacts of Job Corps on several additional
outcomes to help assess whether the program achieves its goals of helping students become more
responsible and productive citizens. A summary of key findings is displayed in Table 6.
Job Corps participation reduced the receipt of public assistance benefits. The program
reduced the receipt of cash welfare plus food stamps by about $640 per participant—a
statistically significant impact at the one percent level. The estimated program impacts on the
receipt of individual types of assistance were small and in many cases not statistically
significant. Impacts on welfare receipt were larger during the early part of the follow-up period
but persisted through the end of the follow-up period.
Job Corps significantly reduced arrest and conviction rates, as well as time spent
incarcerated. About 33 percent of control group members were arrested during the 48-month

29
TABLE 6
IMPACTS ON KEY PUBLIC ASSISTANCE, CRIME, AND OTHER OUTCOMES DURING THE 48 MONTHS AFTER RANDOM ASSIGNMENT
Outcome Measure Program Group
Control Group
Estimated Impact per Eligible Applicanta
Estimated Impact per Participantb
Average Amount of Benefits Received (in Dollars)c 3,696.0 4,155.7 –459.8*** –638.9***
Percentage Arrested or Charged with a Delinquency or Criminal Complaint 28.8 32.6 –3.7*** –5.2***
Percentage Convicted, Pled Guilty, or Adjudged Delinquent 22.1 25.2 –3.1*** –4.3***
Percentage Served Time in Jail for Convictions 15.8 17.9 –2.1*** –2.9***
Average Weeks in Jail for Convictions 6.0 6.6 –0.6 –0.8
Percentage Ever a Victim of a Crime at 12 Months 21.9 24.2 –2.3*** –3.1***
Percentage Reported Using Illegal Drugs in the Past 30 Daysd
At 12 months At 30 months At 48 months
9.9 8.7 7.4
9.5 8.8 7.7
0.4 –0.1 –0.3
0.6 –0.1 –0.4
Percentage in Fair or Poor Health at 48 Months 16.5 17.8 –1.3* –1.8*
Percentage Married or Living Together at 48 Months 31.0 29.4 1.6* 2.2*
Percentage Not Living with Parents at 48 Months 68.2 65.3 2.9*** 4.0***
Percentage Had New Children 39.0 37.8 1.2 1.7
Average Hours per Week Females Used Child Care 7.7 6.5 1.2*** 1.8***
Sample Size 6,828 4,485 11,313
Source: Baseline and 12-, 30-, and 48-month follow-up interview data for those who completed 48-month interviews.
aEstimated impacts per eligible applicant are measured as the difference between the weighted means for program and control group members. bEstimated impacts per Job Corps participant are measured as the estimated impacts per eligible applicant divided by the difference between the proportion of program group members who enrolled in Job Corps and the proportion of control group members who enrolled in Job Corps during their three-year restriction period. cBenefits include AFDC/TANF, food stamps, SSI/SSA, and General Assistance. dIllegal drugs include marijuana, hashish, and hard drugs (cocaine powder; crack cocaine; speed, uppers, or methamphetamines; hallucinogenic drugs; and heroin, opium, methadone, or downers).
*Significantly different from zero at the .10 level, two-tailed test. **Significantly different from zero at the .05 level, two-tailed test. ***Significantly different from zero at the .01 level, two-tailed test.

30
follow-up period, compared to 29 percent of program group members (a statistically significant
reduction). Arrest rate reductions were largest during the first year after random assignment,
(when most program enrollees were in Job Corps and heavily supervised). Interestingly,
however, Job Corps also led to small arrest reductions during the later months of the follow-up
period, after most youths had left Job Corps. Although program group members were less likely
to have arrest charges for all categories of crimes, Job Corps had a larger impact on reducing
arrests for less serious crimes (such as disorderly conduct and trespassing) than for more serious
crimes (such as murder and aggravated assault). The reductions in convictions and incarcerations
for convictions follow a similar pattern.15
Job Corps participation also led to reductions in crimes committed against program
participants, suggesting that Job Corps students were safer at the centers than they would have
been in their home communities. On average, Job Corps reduced the number of times youths
were victims of crimes by about 20 percent during the first 12 months after random assignment
(when many program group members were enrolled in Job Corps).
We find small impacts on other outcomes. A slightly higher percentage of the control than
the program group said their health was “poor” or “fair” (18 percent versus 16 percent). In
addition, Job Corps participants were slightly more likely to be living independently at the 48-
month interview point and to be married or living with a partner. We find no impacts on self-
reported use of illegal drugs or on bearing children (about 38 percent of both groups had a child
during the follow-up period; 49 percent for females and 31 percent for males). Job Corps
15 Needels et al. (2000) present impact results on arrests and convictions covering the 30-month period after
random assignment using official crime records from North Carolina and Texas. These estimated impacts are consistent with the impacts based on the survey data, suggesting that the reliance on self-reports for the impact analysis is unlikely to have created serious bias in the survey-based estimates of crime impacts.

31
participation, however, led to increases in the use of child care by females while they were in Job
Corps and afterwards, due to positive impacts on their employment rates in years 3 and 4.
E. IMPACT RESULTS FOR SUBGROUPS
The impact findings for most subgroups are very similar to those for the full population.
However, a few important exceptions to this generalization exist for the earnings impacts: (1) the
earnings gains for the oldest students persisted beyond the survey period, and (2) no earnings
gains were ever found for Hispanics or those 18 and 19 years old at program application.
1. Youth Characteristics
All subgroups of program group participants that we examined received extensive Job Corps
services, and although many groups had different program experiences, the differences were
small (Schochet et al. 2001). Consequently, impacts on total time spent in education and training
programs and on the attainment of a GED or vocational certificate were large and statistically
significant for all key subgroups.
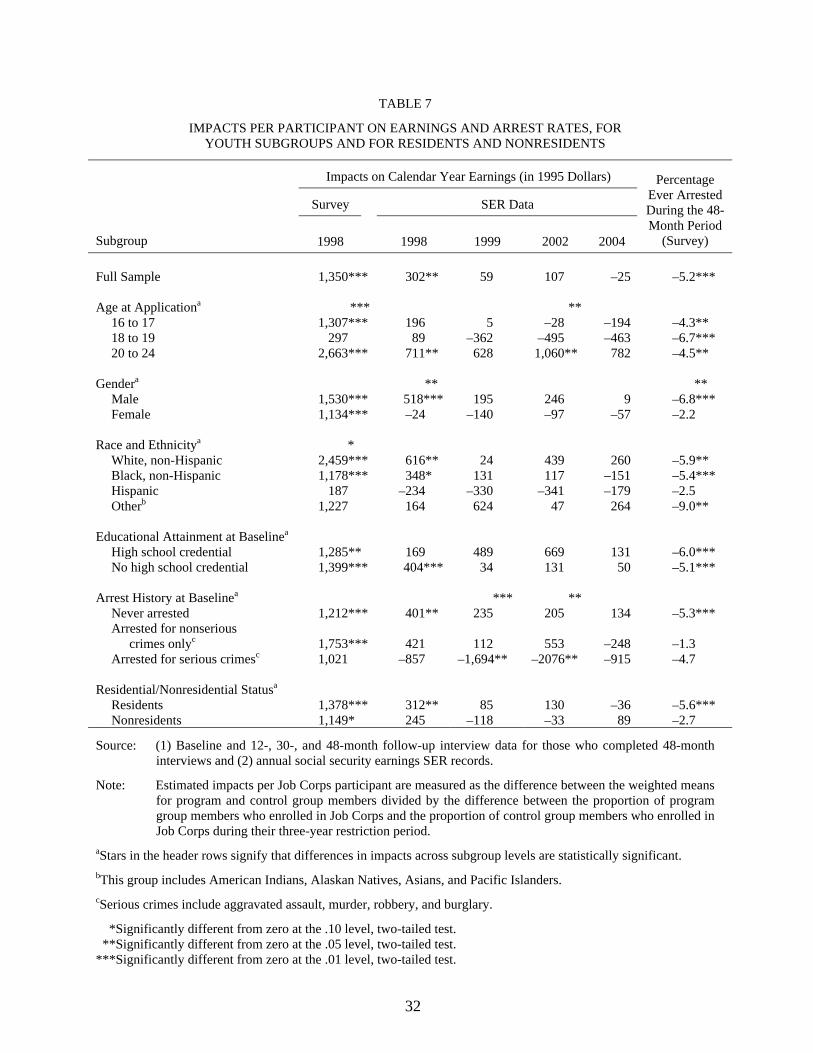
The survey data indicate that positive earnings impacts in 1998 were found broadly across
key subgroups (Tables 7 and A.3 to A.10).16 Earnings gains were similar for males and females.
Positive survey-based impacts were found for groups of students at special risk of poor outcomes
(such as very young students, youths who had been arrested for nonserious offenses, and those
who did not possess a high school credential at baseline). They were also found for groups at
lower risk, such as older participants with a high school credential at baseline. Earnings gains
were found for whites and African Americans.
16 To keep the presentation manageable, we present the full set of earnings impact estimates in Appendix A
only for the most important subgroups defined by age, gender, race and ethnicity, and residential status.
32
TABLE 7
IMPACTS PER PARTICIPANT ON EARNINGS AND ARREST RATES, FOR YOUTH SUBGROUPS AND FOR RESIDENTS AND NONRESIDENTS
Impacts on Calendar Year Earnings (in 1995 Dollars)
Survey SER Data
Subgroup 1998 1998 1999 2002 2004
Percentage Ever Arrested During the 48-Month Period
(Survey) Full Sample 1,350*** 302** 59 107 –25 –5.2*** Age at Applicationa *** **
16 to 17 1,307*** 196 5 –28 –194 –4.3** 18 to 19 297 89 –362 –495 –463 –6.7*** 20 to 24 2,663*** 711** 628 1,060** 782 –4.5**
Gendera ** **
Male 1,530*** 518*** 195 246 9 –6.8*** Female 1,134*** –24 –140 –97 –57 –2.2
Race and Ethnicitya *
White, non-Hispanic 2,459*** 616** 24 439 260 –5.9** Black, non-Hispanic 1,178*** 348* 131 117 –151 –5.4*** Hispanic 187 –234 –330 –341 –179 –2.5 Otherb 1,227 164 624 47 264 –9.0**
Educational Attainment at Baselinea
High school credential 1,285** 169 489 669 131 –6.0*** No high school credential 1,399*** 404*** 34 131 50 –5.1***
Arrest History at Baselinea *** **
Never arrested 1,212*** 401** 235 205 134 –5.3*** Arrested for nonserious
crimes onlyc 1,753*** 421 112 553 –248 –1.3 Arrested for serious crimesc 1,021 –857 –1,694** –2076** –915 –4.7
Residential/Nonresidential Statusa
Residents 1,378*** 312** 85 130 –36 –5.6*** Nonresidents 1,149* 245 –118 –33 89 –2.7
Source: (1) Baseline and 12-, 30-, and 48-month follow-up interview data for those who completed 48-month interviews and (2) annual social security earnings SER records.
Note: Estimated impacts per Job Corps participant are measured as the difference between the weighted means for program and control group members divided by the difference between the proportion of program group members who enrolled in Job Corps and the proportion of control group members who enrolled in Job Corps during their three-year restriction period.
aStars in the header rows signify that differences in impacts across subgroup levels are statistically significant.
bThis group includes American Indians, Alaskan Natives, Asians, and Pacific Islanders.
cSerious crimes include aggravated assault, murder, robbery, and burglary.
*Significantly different from zero at the .10 level, two-tailed test. **Significantly different from zero at the .05 level, two-tailed test. ***Significantly different from zero at the .01 level, two-tailed test.

33
The key exceptions are that no earnings gains were found for Hispanics or for those 18 to 19
at program application. We are not able to provide a satisfactory explanation for these
exceptions, although we have been able to rule out several possible explanations (Schochet et al.
2001). In particular, the lack of impacts is not due to differences in the length of time in Job
Corps—Hispanic students participated for nearly a month longer on average than non-Hispanic
students, and Job Corps participation measures did not differ by age. Nor do the lack of impacts
appear to have been due to the fact that Hispanic students exhibited other characteristics
associated with low impacts; overall, the characteristics of Hispanic students and African
American students are very similar (apart from primary language and region of residence), and
the characteristics of those 18 and 19 are not unusual. Finally, the findings are not due to
language barriers for Hispanics or the characteristics of centers or regions in which Hispanic or
18- and 19-year-old students are concentrated; we found no impacts for all subgroups of
Hispanics and 18- and 19-year olds.
In general, the pattern of the estimated subgroup impacts on earnings using the survey and
SER data are similar in periods covered by both data sources (Tables 7 and A.3 to A.10).
However, as with the full sample, the survey-based impact estimates are larger and more often
statistically significant, which results in several notable differences between the subgroup
findings using the two data sources. First, for the 16- and 17-year-olds, the impact estimate in
1997 is statistically significant according to both the survey and tax data ($791 and $391,
respectively), but the positive impact disappeared in 1998 according to the tax data. Second, for
females, the impact estimates in 1997 and 1998 are statistically significant according to the
survey data but not according to the tax data. Thus, these groups may have been more likely
than other groups to have held informal (cash-only) jobs with earnings that were not covered in
the SER data (Schochet et al. 2003).

34
In the 1999 to 2004 period, no statistically significant, positive SER-based earnings impacts
were found for any subgroup, except for those ages 20 to 24 at program application. The
earnings impacts for the oldest students were about $750 per year during this period, and were
statistically significant in 2002 and 2003. Furthermore, the impact on total postprogram earnings
for this group is statistically significant at the 10 percent level, and differs significantly from the
corresponding impacts for the younger students. The impacts for the oldest students are larger for
males than females and for whites than other racial and ethnic groups (Table A.13).
The findings for 20- to 24-year-olds are consistent with other project findings that older
students in our sample remained in Job Corps for an average of 1.3 months longer than younger
ones and were more highly motivated and well-behaved (as reported by program staff at 23
randomly-selected centers). In addition, the estimated impacts on total hours spent in education
and training during the four-year survey period were larger for the older students than the
younger ones, because older students stayed longer in Job Corps and because a large percentage
(nearly half) of the younger control group members attended high school after being rejected for
Job Corps (Schochet et al. 2001).
Finally, impacts on crime are very similar across the youth subgroups (Table 7). Although
the level of criminal activity differed substantially across youth subgroups, the impacts on crime
outcomes in percentage terms are similar. For instance, although the control group arrest rate
was about 39 percent for males and 15 percent for females, Job Corps participation reduced the
arrest rate by about 15 percent for both groups.
2. Residents and Nonresidents
Both residents and nonresidents received substantial Job Corps services. Our survey data
indicate that nonresidential students had somewhat lower enrollment rates than residential ones
(66 percent, compared to 75 percent). Once in Job Corps, however, the residents and

35
nonresidents got similar amounts, types, and intensity of education and training. Thus, it is not
surprising that we find similar impacts on education and training outcomes for the two groups of
participants.
The survey data indicate that both the residential and nonresidential program components
improved earnings for the students they served soon after the youths left Job Corps (Tables 7,
A.11, and A.12). The survey-based 1998 earnings impact estimate is statistically significant at
the 5 percent level for residents and at the 10 percent level for the smaller sample of
nonresidents, and the difference between the two impacts is not statistically significant. Similar
to previous findings, however, the 1998 earnings impact estimates are smaller according to the
SER data than the survey data for both residential groups, although the SER-based impact
remains statistically significant for the residents.
After 1998, the earnings impacts according to the tax data are zero for both residential
groups. Thus, Job Corps does not appear to improve the long-term earnings for either residential
group.
Finally, participation in each component reduces arrest rates (Table 7). Arrest rates were
much higher for residential control group members (31 percent) than nonresidential control
group members (18 percent), who were more likely to be older and female. However, the arrest
rate reductions as a percentage of the control group means are similar for the two residential
groups (about 15 percent each), and the difference between the two arrest rate impacts is not
statistically significant.
3. Center Subgroups
In this section, we discuss the impact findings for subgroups defined by type of center
operator (CCCs and contract centers), center size, and center performance level. Table 8 presents
impact estimates where the individual is treated as the unit of analysis (as is the case for all other

36
TABLE 8
IMPACTS PER PARTICIPANT ON EARNINGS AND ARREST RATES, FOR CENTER SUBGROUPS
Impacts on Calendar Year Earnings (in 1995 Dollars)
Survey SER Data
Subgroup 1998 1998 1999 2002 2004
Percentage Ever Arrested During the 48-Month Period
(Survey) Full Sample 1,350*** 302** 59 107 –25 –5.2*** Type of Center Operatora
Contract centers 1,388*** 275* 81 33 –42 –3.4*** CCC centers 1,730** 562 16 376 247 –8.8***
Center Sizea **
Small (< 226 slots) 1,103* 275 36 388 119 –7.7*** Medium (226 to 495 slots) 1,664*** 396* 131 299 267 –6.1*** Large (> 495 slots) 1,355*** 250 17 –353 –395 0.2
Performance Levela,b
High 1,578** 754 252 –158 –47 –6.6** Medium 1,304*** 212 –87 –36 –194 –3.4** Low 1,823*** 347 471 696 737 –4.9*
Source: (1) Baseline and 12-, 30-, and 48-month follow-up interview data for those who completed 48-month
interviews and (2) annual social security earnings SER records.
Note: Estimated impacts per Job Corps participant are measured as the difference between the weighted means for program and control group members divided by the difference between the proportion of program group members who enrolled in Job Corps and the proportion of control group members who enrolled in Job Corps during their three-year restriction period.
aStars in the header rows signify that differences in impacts across subgroup levels are statistically significant.
bHigh-performing centers are defined as those that were in the top third of the performance ranking during program years 1994 and 1996. Similarly, low-performing centers are those that were in the bottom third of the performance ranking in each year; and the remaining centers are designated medium-performing centers.
*Significantly different from zero at the .10 level, two-tailed test. **Significantly different from zero at the .05 level, two-tailed test. ***Significantly different from zero at the .01 level, two-tailed test.

37
estimates presented in this report), and Table A.14 presents estimates where the center is treated
as the unit of analysis, so that each center is given equal weight in the analysis.17
a. Type of Center Operator
Most Job Corps centers are operated by private organizations under competitively awarded
contracts with DOL. At the time of the study, approximately 80 contract centers served about 88
percent of new students. Thirty CCCs were operated by agencies of the U.S. Department of
Agriculture and the U.S. Department of the Interior. The two types of centers differ in important
ways, including (1) type of staff (CCC employees are federal civil service employees, while
contract center staff are employees of private for-profit and nonprofit organizations); (2) type of
procurements (unlike CCCs, operators of contract centers must win competitive procurements to
continue operating their centers); (3) size and location (most CCCs are small and located in
isolated rural areas in the Pacific Northwest or Mountain states); (4) the trades offered (the CCC
trades are heavily weighted toward construction); and (5) student characteristics (more students
at CCCs are male, under age 18 at enrollment, white, without a high school credential at
enrollment, and likely to have been arrested).
Despite the many differences between CCCs and contract centers, however, students at a
typical CCC and contract center had similar large gains in attainment of the GED or vocational
certificate (not shown). In addition, we found similar postprogram earnings gains and similar
reductions in the percentage arrested over the follow-up period (Tables 8 and A.14). Thus,
program impacts are not associated with the type of center operator.
17 Estimates in Table 8 pertain to Job Corps impacts for the average student in a center with a particular
attribute, whereas the estimates in Table A.13 pertain to impacts for a typical center with that attribute (see Burghardt and Schochet 2001).

38
b. Center Size
The capacity of Job Corps centers ranges from 200 to more than 2,000 students. The
characteristics of students are similar at medium centers (226 to 495 slots) and large centers (496
or more slots). At small centers (225 or less), however, more students are under 18 years old,
high school dropouts, white, and from a small town.
Capacity may affect students’ experiences and, thus, impacts in several ways. Large centers
might have the ability to provide students with more opportunities for vocational training and
recreation and to reap the benefits of economies of scale and lower costs per student. However, a
large-scale operation may make it more difficult to create the connections between staff
members and students that are thought to be important for successful learning.
Johnson et al. (2000) found that students who attend small centers are more likely to
complete their vocational trade and to stay on center for longer than students in other centers.
However, we found similar impacts for large, medium, and small centers. Impacts on key
education outcomes were similarly positive and statistically significant for all three center size
groups. Furthermore, differences in earnings impacts across the groups are not statistically
significant, and show no clear pattern over time (Tables 8 and A.14). Some evidence indicates,
however, that arrest rate impacts were smaller in large centers than in centers with fewer
students.
c. Center Performance
The Job Corps performance measurement system is intended to focus staff throughout Job
Corps on ensuring that students achieve important milestones in Job Corps and positive
outcomes after the program. Our process study concluded that this goal of the performance
39
measurement system is met: Job Corps is a performance-driven system (Johnson et al. 1999).
Center staff, and especially managers, are aware of standards and care about their center’s
ranking. Center managers use the system for day-to-day management, and many receive
financial incentives linked to center performance.
There are some differences, by performance level, in the characteristics of centers and the
students they serve. Relative to low- and medium-performing centers, high-performing centers
tend to be smaller, to have a higher fraction of nonresidential students, and to be operated by a
government agency (instead of a private contractor). Furthermore, high-performing centers tend
to serve less disadvantaged students; they serve a larger percentage of female students, a higher
percentage with a high school credential at program entry, and a higher percentage who are white
or Hispanic.
Despite Job Corps’ emphasis on performance, however, the impacts of Job Corps are similar
by performance level (Tables 8 and A.14). As one would expect, participants in higher-
performing centers had better outcomes (Figure 3). However, the same pattern holds for
comparable control group members. Thus, students served by higher-performing centers would
tend to have better outcomes than those served by lower-performing centers even in the absence
of Job Corps. These results are consistent with the finding that high-performing centers tend to
serve less disadvantaged students.
Thus, the performance measurement system does not seem to be achieving the goal of
distinguishing between more and less effective centers. Center performance appears to be related
more to the types of students that a center serves than measured center quality. This finding is
troubling because the lowest-ranking centers may be penalized financially or otherwise for not

40
showing satisfactory performance, even though they provide the same value added for their
students as do high-performing centers.
F. ASSESSING SURVEY NONRESPONSE BIAS
We have documented that the earnings impacts are larger according to the survey data than
the tax data. These differences reflect both the effects of (1) survey nonresponse bias due to
sample differences, because the tax data contain earnings information on both survey
nonrespondents and respondents, and (2) reporting differences between the two data sources for
those with both types of data. To help disentangle these effects, we present earnings impacts
using the SER data for the sample of 48-month survey respondents only, so that estimates using
the survey and tax data can be compared using the same sample of interview respondents. In
FIGURE 3
TOTAL 1998 TO 2004 SER EARNINGS, BY CENTER PERFORMANCE LEVEL
$61,582
$51,776$46,414
$61,749
$51,920
$43,496
$0
$25,000
$50,000
$75,000
High-Performing Medium-Performing Low-Performing
Program Group Control Group
Source: Annual social security earnings SER records.
41
addition, we present separate SER-based earnings impacts for the sample of survey
nonrespondents.
1. Impact Findings for Survey Respondents and Nonrespondents
The pattern of SER-based impacts using the survey respondents only is similar to those
based on the full sample; the impacts are negative in 1995 and 1996, positive and statistically
significant in 1997 and 1998, and zero afterwards (Table 9). The similarity of the estimates,
however, is due to the relatively high survey response rate and masks important differences
between the impacts for survey respondents and those for nonrespondents.
We find the unexpected, and disturbing, result that impacts are substantially larger for
survey respondents than nonrespondents during the postprogram period, which suggests that the
survey-based earnings impact estimates are somewhat biased upward (Table 9). This pattern was
not noticeable in 1993 or 1994 (the period before random assignment) or in 1995 and 1996 (the
in-program period). However, starting in 1997, the earnings impacts for respondents were
positive, while the earnings impacts for nonrespondents were negative (and statistically
significant at the 10 percent level). This occurred because respondents earned more than
nonrespondents (and increasingly so over time) for the program group, whereas the earnings of
respondents and nonrespondents were more similar for the control group. In 2004, for instance,
mean earnings were $8,673 for program group respondents, compared to only $7,223 for
program group nonrespondents, whereas mean earnings were about $8,300 for both control
group respondents and nonrespondents.
We calculate that survey nonresponse accounts for about one-quarter of the survey-SER
earnings impact difference in 1998. The 1998 gap is $750 ($972-$222) when the full sample is
used to obtain the SER impact, compared to $570 ($972-$402) when only survey respondents are

42
TABLE 9
IMPACTS ON CALENDAR YEAR EARNINGS AND EMPLOYMENT RATES FOR 48-MONTH SURVEY RESPONDENTS AND NONRESPONDENTS
48-Month Survey Respondents 48-Month Survey Nonrespondents Full Sample
Outcome Measureb
Program Group
Control Group
Estimated Impacta
Program Group
Control Group
Estimated Impacta
Estimated Impacta
Average Calendar Year Earnings (in 1995 Dollars) 1993 999 999 0 1,050 1,085 –34 –7 1994 1,571 1,525 46 1,664 1,614 50 47 1995 1,747 2,010 –264*** 1,815 2,109 –294*** –270*** 1996 3,161 3,282 –122* 2,862 3,265 –404** –178*** 1997* 4,681 4,405 276*** 4,074 4,307 –232 175** 1998** 6,018 5,616 401*** 5,085 5,584 –499 222** 1999 6,927 6,732 195 5,790 6,362 –573 43 2000** 7,854 7,637 217 6,588 7,510 –922** –11 2001** 8,164 7,877 287* 6,594 7,465 –871** 56 2002** 8,126 7,851 275 6,596 7,302 –706* 79 2003*** 8,221 7,914 307* 6,686 7,669 –983** 49 2004** 8,674 8,470 204 7,223 8,129 -906* -18
Percentage Employed in Calendar Year 1993* 42.7 42.2 0.5 44.2 46.7 –2.5* –0.1 1994 59.9 58.8 1.2 57.9 58.8 –0.9 0.7 1995***c 90.1 73.0 17.1*** 85.6 74.5 11.1*** 15.9*** 1996c 89.6 78.9 10.7*** 85.6 76.4 9.2*** 10.3*** 1997 84.9 82.6 2.3*** 78.4 77.1 1.3 2.1*** 1998 85.8 84.5 1.3* 79.8 78.5 1.3 1.3** 1999 86.1 84.7 1.4** 78.1 76.2 1.9 1.5** 2000 85.4 85.3 0.1 76.4 73.8 2.6 0.6 2001 82.3 82.4 –0.1 73.8 72.4 1.4 0.3 2002 78.5 78.5 0.0 70.0 69.5 0.5 0.1 2003 76.1 75.1 1.0 68.1 68.1 0.0 0.7 2004 76.3 75.5 0.8 65.8 66.0 -0.2 0.6
Sample Size 6,828 4,485 11,313 1,495 1,187 2,682 15,138d
Source: Annual social security earnings SER records. aImpacts are measured as the difference between the weighted means for program and control group members. bStars next to a calendar year signifies that differences between estimated impacts for survey respondents and nonrespondents are statistically significant. cEmployment rates are high for the program group in 1995 and 1996 because student pay that Job Corps students receive while enrolled in the program is reported to the government. dThe sample size for the full sample is larger than the combined sample size for respondents and nonrespondents because of the random subsampling of youths for 48-month interviews to conserve project resources.
*Significantly different from zero at the .10 level, two-tailed test. **Significantly different from zero at the .05 level, two-tailed test. ***Significantly different from zero at the .01 level, two-tailed test.

43
used to obtain the SER impact (Tables 5 and 9). This $180 reduction is a 24 percent narrowing of
the survey-SER gap. Thus, reporting differences between the two data sources, holding the
sample constant, account for about 76 percent of the survey-SER gap.
2. Explanations for Survey Nonresponse Bias
What accounts for the unexpected interview nonresponse bias? There are two possible
explanations:
• There are differences in the baseline characteristics of respondents in the program and control groups that are correlated with earnings. If interview respondents in the program group were drawn from a somewhat more advantaged subpopulation of the full program group than was true for interview respondents in the control group, then the survey-based impact estimates would be biased upward.
• There are true differences in the earnings impacts for survey respondents and survey nonrespondents. If earnings impacts are truly larger for survey respondents than survey nonrespondents, then the survey-based earnings impacts would be biased upward even if the observable and unobservable characteristics of respondents in the program and control groups are similar. In this case, the impacts using interview respondents only are unbiased but are not generalizable to the full study population.
While it is difficult to disentangle these two effects, the first explanation is probably more
plausible, because it is difficult to envision a scenario in which Job Corps participation would
reduce the long-term earnings of survey nonrespondents. Among program group members,
respondents had only slightly higher Job Corps participation levels than nonrespondents (77
percent compared to 70 percent), and respondents stayed in the program for only about one
month longer on average than nonrespondents (7 months compared to 6 months). Furthermore,
although there are some differences in the baseline characteristics of nonrespondents and
respondents (for instance, nonrespondents are more likely to be male), these differences do not
seem large enough to generate “true” impacts that are negative for nonrespondents and positive
for respondents.

44
It is disturbing, however, that standard statistical testing and correction procedures failed to
detect differences between program and control group respondents (Schochet et al. 2003). The
response rates to the 48-month interview were similar for the program and control groups, and
the two groups have similar baseline characteristics. In addition, the survey-based earnings
impacts do not change when standard approaches are used to adjust for survey nonresponse bias,
such as using regression models to control for observable baseline differences between the
program and control group respondents, propensity scoring methods to adjust sample weights for
interview nonresponse, and multiple imputation procedures to account for missing earnings data.
Our results clearly reinforce the importance of allocating sufficient resources to ensure high
response rates in studies that conduct interviews with a population similar to that of Job Corps. If
survey response rates had been lower in the National Job Corps Study, survey nonresponse bias
could have yielded survey-based impact estimates that were seriously misleading.
G. COMPARING BENEFITS AND COSTS
Job Corps is an expensive program, costing the government nearly $16,500 per participant.
To assess whether the impacts of Job Corps are large enough to justify this large outlay, we
conducted a benefit-cost analysis in which a dollar value was placed on each impact of the
program. This section presents final estimates from the benefit-cost analysis; we update
estimates presented in McConnell and Glazerman (2001)—which provides a detailed discussion
of the benefit-cost methodology—and Schochet et al. (2003).
1. Overview of the Benefit-Cost Methodology
Benefit-cost analysis involves identifying all the benefits and costs of the program and
placing a dollar value on as many of them as possible. By placing a monetary value on the
diverse impacts of the program, we can readily compare benefits with costs.

45
The measured benefits and costs of Job Corps fall into four categories:
• The benefits of the increased output resulting from the additional productivity of Job Corps participants, principally from increased earnings but also from output produced during vocational training on center
• The benefits from the reduced use of other programs and services, including other education and training programs, and public assistance
• The benefits from the reduced crime committed by and against participants
• Program operating and capital costs
Benefits and costs were measured from three perspectives: (1) society, (2) participants, and
(3) the rest of society. Society’s perspective is the most relevant for policymakers, because it
indicates whether the aggregate benefits from the program are greater than the resources the
program uses, abstracting from who enjoys the benefits of the program and who bears its costs.
Hence, the analysis presented in this section focuses primarily on this perspective. Members of
society fall into two groups: participants and everyone else (the rest of society). The perspective
of participants indicates whether participating in Job Corps is a good investment for the youths
themselves. The perspective of the rest of society indicates the magnitude of the investment that
taxpayers and other citizens made in Job Corps. Appendix B presents detailed estimates of
benefits and costs from all three perspectives.
We present comparisons of program benefits and costs (net benefits) for two groups of
students. First, we present estimates for the full sample to examine the overall cost effectiveness
of Job Corps. Second, we present net benefit estimates for those 20 to 24 years old at program
application, because earnings gains persisted for these youths. We present estimates under our
benchmark assumptions, and under alternative assumptions to assess the robustness of findings.

46
a. Measuring Program Benefits
In this section, we summarize our approach for measuring program benefits due to increased
output, the reduced use of other programs and services, and reduced criminal activity. Program
benefits were valued in 1995 dollars and discounted at a 4 percent real discount rate
(approximately the real rate of return on 30-year Treasury bonds).
Increased Output of Job Corps Participants. The largest expected benefit from Job
Corps is the increased productivity of its participants. The benefits from this increased
productivity were obtained from the estimated impacts on earnings plus the estimated cost of
fringe benefits (about 20 percent of earnings), net of the cost of any additional child care.
We used the survey earnings data to measure program benefits, because the survey data
include informal earnings and other sources of income not reported on the SER data. However,
we adjusted the survey impacts in two ways to reflect the likelihood that they overstate the true
impacts (Schochet et al. 2003). First, we assumed that survey respondents overreported the
hours they worked by 10 percent, to reflect the difference between the average hours reported by
survey respondents and the national average. Second, we adjusted the survey-based earnings for
interview nonresponse by multiplying these earnings by the ratio of average SER-based earnings
for the full sample to average SER-based earnings for survey respondents only, separately for the
program and control groups. These ratios were typically less than one.
Associated with the increase in participants’ earnings is an increase in their tax payments.
Although we did not observe directly how much our sample members paid in taxes, we estimated
tax payments based on reported income and household composition. Tax payments, however, are
not a program benefit from society’s perspective, because they are a direct transfer from
participants to the rest of society.

47
Job Corps is an intensive program and is expected to have a long-term impact on the lives of
its participants—certainly longer than the four years observed with the survey data. To estimate
the impact on lifetime earnings, we assumed that the observed survey earnings impacts in the
fourth year of the observation period would have continued to follow the same pattern as the
estimated SER impacts between 1998 and 2004 and that these patterns would continue for the
rest of the participant’s working life. Hence, for the full sample, we assumed that the survey-
based earnings impacts in year 4 would decline by 80 percent per year, and for the 20- to 24-
year-olds, we assumed that the impact in year 4 would remain constant.
Finally, we valued the output produced by participants as part of their vocational training
projects in Job Corps. While the purpose of these projects is to provide hands-on training, the
students often produce an output or a service whose value we included in the benefit-cost
analysis. Estimates of the value of these projects were based on the market value of the output of
44 randomly selected projects at 22 randomly selected centers (McConnell 1999).
Reduced Use of Other Programs and Services. Participation in Job Corps reduces the use
of a wide variety of other programs and services, including those involving education and
training programs (such as high school, GED programs, vocational or trade schools, and two-
year colleges) and public assistance (such as welfare, food stamps, Medicaid, and drug treatment
programs). Because these programs and services are expensive, reducing their use benefits
society. Further, because the government usually pays for them, their reduced use benefits the
rest of society.18
Benefits from the reduced use of other programs and services were estimated by valuing
their impacts at market (shadow) prices. These shadow prices were estimated using a wide
18 Whether these savings are netted out of program costs or included as program benefits has no effect on the
net benefit-cost estimates.

48
variety of published sources (McConnell and Glazerman 2001). To value reductions in the
receipt of public assistance benefits from society’s perspective, we included only the savings in
administrative costs associated with these programs. This is because the value of public
assistance benefits is a benefit to the participants and an equal cost to the taxpayers, and thus, on
net, cancels from society’s perspective.
Reduced Criminal Activity. Job Corps significantly reduces criminal activity; program
group members were less likely than control group members to have been arrested, convicted,
and incarcerated. The reduction in criminal activity is a benefit to society in the form of reduced
victimization and criminal justice system costs, whose shadow prices were estimated from a
variety of published sources (McConnell and Glazerman 2001).19
Job Corps participants were also less likely to have a crime committed against them. The
benefit-cost analysis accounts for the benefits of this additional safety of Job Corps participants.
b. Measuring Program Costs
Program costs were measured as a weighted average of costs in program years 1994 to 1996,
the period when program group participants were enrolled in Job Corps. As with program
benefits, program costs were measured in 1995 dollars.
We measured three broad categories of costs: (1) reported program operating costs; (2) costs
not reported on Job Corps’ financial reports (such as the costs of administering the national and
regional offices and donated goods and services); and (3) the economic costs of the capital—
land, buildings, furniture, and equipment—used by Job Corps.
While in Job Corps, the average participant in our sample received about $1,400 in student
pay (allowances and bonuses) and about $1,000 in food and clothing. As these items have
19 Impacts on crime and the use of other programs and services declined during the 48-month observation
period covered by the survey; therefore, we did not include the possible future benefits of these impacts after the 48-month follow-up period.

49
intrinsic value to the students irrespective of their contribution to the participants’ future, we
treat them as transfers from taxpayers to Job Corps students. Hence, in calculating the cost of
Job Corps to society, these expenditures are subtracted from total program costs.
2. Results for the Full Sample
The benefit-cost analysis found that the benefits of Job Corps are less than the resources
spent on it for all Job Corps participants. Our best estimate is that the costs to society of Job
Corps exceed its benefits to society by about $10,300 per participant (Table 10). The benefits
from increased lifetime earnings ($1,119), reduced use of other programs and services ($2,186),
and reduced crime ($1,240) are small compared to its costs.
The rate of decay of the earnings impacts is key to this finding (Table 11). If we assumed,
unrealistically, that the adjusted earnings impacts would not decline after the survey observation
period, benefits exceed costs by over $4,000 per participant. Apart from the assumption of
decay, the finding that costs exceed benefits for the full sample is not sensitive to other changes
in assumptions. Even if we assumed there was no nonresponse bias or overreporting of hours,
costs would exceed benefits. Costs would still exceed benefits if we had underestimated the
benefits from reduced crime or reduced use of other programs and services by a factor of two.
And costs exceed benefits as long as the impacts on earnings decay by more than only 2.5
percent per year.
Even with earnings impacts that decay over time, the benefits of Job Corps still exceed the
costs from the perspective of its participants. Using the adjusted survey data and assuming a
decay rate of 80 percent, the benefits of Job Corps exceed its costs to participants by $1,784 per
participant (Table B.1). Even though our estimates of the impact on post-program earnings
decreased, participants still benefit from Job Corps because the value of pay, food, and clothing
they receive in the program offset the earnings forgone while they are enrolled in Job Corps.
The cost of Job Corps to the rest of society is $12,084 per participant (Table B.1).

50
TABLE 10
BENEFITS AND COSTS OF JOB CORPS FROM SOCIETY’S PERSPECTIVE (1995 DOLLARS)
Present Discounted Value
Benefits or Costs All Job Corps Participants
Those 20 to 24 Years of Age at Program
Application Total Benefits $3,544 $32,045 Benefits from Increased Output 119 34,896
Years 1 to 4a –281 338 After year 4a 179 34,308 Output produced during vocational training in Job Corps 220 250
Benefits from Reduced Use of Other Programs and Services 2,186 937 Benefits from Reduced Crime 1,240 –3,787 Total Costs –13,844 –15,193 Program Costs –16,205 –17,755 Program Costs Considered to Be Transfers 2,361 2,562
Net Benefits –$10,300 $16,853
Sources: (1) Baseline and 12-, 30-, and 48-month follow-up interview data for those who completed 48-month interviews; (2) annual social security SER earnings records; and (3) McConnell and Glazerman (2001).
aThe calculations are based on the survey-based earnings impacts, and assume a decline in the year 4 earnings impact equal to the rate of decline observed in the SER data after year 4. For the full sample, the calculations are based on an assumed decline in impacts of 80 percent per year. For those 20 to 24 years of age at program application, we assume no decline in the impact after year 4. Earnings reported in the surveys are adjusted also for survey nonresponse and the overreporting of hours worked by 10 percent. The length of time youth are in Job Corps is also adjusted for nonresponse. The value of increased output includes additional earnings and fringe benefits net of increased child care costs. Taxes are not included because they are a transfer from society’s perspective.

51
TABLE 11
BENEFITS AND COSTS UNDER DIFFERENT ASSUMPTIONS ABOUT THE SIZE OF THE EARNINGS IMPACTS AND THEIR DECAY, FOR ALL JOB CORPS PARTICIPANTS, BY DATA SOURCE
(1995 Dollars)
Adjusted Survey Dataa Annual Social Security
Earnings Records Unadjusted Survey Data
No Decay in Earnings Impacts
Benchmark: Decay Rate Observed in SER Datab
No Decay in Earnings Impacts
Decay Rate Observed in SER Datab
No Decay in Earnings Impacts
Decay Rate Observed in SER Datab
Total Benefits (Dollars) $18,229 $3,544 $9,305 $3,528 $30,018 $4,490 Benefits from Increased Output 14,804 119 5,880 102 26,592 1,064
Years 1-4c –60 –60 32 32 753 753 After Year 4 14,864 179 5,848 70 25,839 311 Other Benefits 3,426 3,426 3,426 3,426 3,426 3,426
Total Costsd –13,844 –13,844 –14,128 –14,128 –14,128 –14,128
Net Benefits $4,385 –$10,300 –$4,823 –$10,600 $15,890 –$9,638 Sources: (1) Baseline and 12-, 30-, and 48-month follow-up interview data for those who completed 48-month
interviews; (2) annual social security earnings records; and (3) McConnell and Glazerman (2001). aEarnings reported on the surveys are adjusted for survey nonresponse and overreporting of hours by 10 percent. The length of time youth are in Job Corps is also adjusted for nonresponse; this affects estimates of program costs and the output produced during vocational training in Job Corps. bAssumes that impacts on earnings and child-care expenses decay at 80 percent per year. cFigures include benefits from output produced during vocational training in Job Corps. dTotal costs are net of program costs that are considered to be transfers. 3. Results for the Older Youth
Although Job Corps is not cost effective for the full sample, the program appears to be cost
effective from society’s perspective for the subgroup of youth who were 20 to 24 years old at the
time of program application (Table 10). Benefits exceed costs by about $17,000 for these youth.
Total benefits are about twice the size of total costs. Net benefits are positive even though there

52
was an increase in serious crimes committed by this group, which is reflected in the negative
“benefits from reduced crime.” The calculations were conducted assuming that the survey
earnings impacts would have remained approximately constant for the rest of the youth’s
working life.
H. SUMMARY AND CONCLUSIONS
Job Corps makes a difference; it produces beneficial impacts for disadvantaged youth, most
of whom enroll in the program without a high school credential. Job Corps provides broad
groups of participants with the instructional equivalent of one additional year in school, improves
functional literacy, and has large effects on the receipt of credentials that it emphasizes most:
GED and vocational certificates. These impacts must be viewed in terms of the counterfactual
for the evaluation: active participation of the control group in education and training programs.
The 12 percent survey-based earnings gains observed in the third and fourth years after random
assignment are commensurate with what would be expected from an additional year of school
(Card 1999). Job Corps also reduces criminal activity by about 16 percent per participant and
the receipt of public assistance.
These positive findings, however, need to be balanced against the lack of long-term earnings
impacts for the overall sample based on the administrative records data and the finding that
social benefits do not appear to offset program costs, except for the oldest students. While it is
possible that positive earnings impacts for the full sample will re-emerge as the sample matures
into their late 20s and 30s, it seems unlikely that this will occur for several reasons. First, it has
been more than six years since earnings gains were last observed. Second, zero earnings impacts
were observed under both a strong and weak economy; thus, changes in economic conditions are
not likely to affect future impacts.

53
Nonetheless, the statistically significant short-term earnings gains experienced by program
participants makes Job Corps the only large-scale education and training program that has been
shown to increase the earnings of disadvantaged youths. For instance, a study of the large youth
training programs funded under Title II-A of the Job Training Partnership Act (JTPA) found no
impacts on the earnings of low-income out-of-school youths who participated (Orr et al. 1996).
However, the JTPA programs were nonresidential and provided less intensive services than Job
Corps. Similarly, the Jobstart demonstration (which provided education, training, and job
placement services in a nonresidential setting to disadvantaged dropouts ages 17 to 21) found
statistically insignificant earnings impacts (Cave et al. 1993). In the end, Job Corps remains the
only large-scale program to have produced statistically significant earnings gains for
disadvantaged youths.
Several interesting impact findings related to program components emerge from the study.
First, impacts for residents and nonresidents are very similar, which suggests that both
components are equally effective for the (very different) types of students they serve. Second,
impacts on key outcomes are similar for CCC centers (that are operated by government agencies)
and contract centers (that are operated by private companies). Third, impacts appear to be similar
in large and smaller centers. Finally, impacts are not associated with center performance level as
measured by the Job Corps performance measurement system. High-performing centers provide
the same value added for their students as lower-performing centers. Thus, the performance
measurement system does not seem to be achieving the goal of distinguishing between more and
less effective centers.
As is the case for any long-term study, there is a lag between the time study subjects receive
the intervention and when study results are published. Thus, we emphasize that the findings
presented in this report pertain to the Job Corps program as it operated in 1995 and 1996 (when

54
our program group members were enrolled in Job Corps) and not necessarily to the program as it
operates today. There have been a number of changes that Job Corps has recently implemented
in response to WIA provisions and other factors. For example, more Job Corps centers are now
accredited to award high school diplomas, and Job Corps is more focused on providing longer-
term support and placement services for their former students. These changes may have
improved program effectiveness.
In conclusion, the positive study findings, including the important finding that the program
is cost effective for the older students, suggest that there is promise in the Job Corps model. The
challenge is to improve program services to sustain the earnings gains for the younger students
and to make the program cost-effective for a population that has been extremely hard to serve. In
particular, Job Corps needs to fully address differences, by age, in program structure and
student program readiness.

55
REFERENCES
Agodini, Roberto and Mark Dynarski. “Are Experiments the Only Option? A Look at Dropout Prevention Programs.” Review of Economics and Statistics, vol. 86 (1), 2004.
Dehejia, Rajeev H. and Sadek Wahba. “Causal Effects in Nonexperimental Studies: Reevaluating the Evaluation of Training Programs.” Journal of the American Statistical Association, 94:448, 1999.
Fraker, Thomas and Rebecca Maynard. “The Adequacy of Comparison Group Designs for Evaluations of Employment-Related Programs.” Journal of Human Resources, vol. 22, no.2, spring 1987.
Glazerman, Steve, Dan Levy, and David Myers. “Nonexperimental Replications of Social Experiments: A Systematic Review.” Princeton, NJ: Mathematica Policy Research, Inc., September 2002.
Gritz, M. and T. Johnson. “National Job Corps Study: Assessing Program Effects on Earnings for Students Achieving Key Program Milestones.” Seattle, WA: Battelle Human Affairs Research Centers, June 2001.
Heckman, James J. “Sample Selection Bias as a Specification Error.” Econometrica, vol. 47(1), 1979, pp. 153-61.
Heckman, James J. and V. Joseph Hotz. “Choosing Among Alternative Nonexperimental Methods for Estimating the Impact of Social Programs: The Case of Manpower Training.” Journal of the American Statistical Association, vol. 84(408), 1989, pp. 862-74.
Hotz, J. and Seth Sanders. “Bounding Treatment Effects in Controlled and National Experiments to Post-Randomized Treatment Choice.” Working Paper 94.sup11. The Harris School: University of Chicago, 1994.
Johnson, T., M. Gritz, and M. Dugan. “National Job Corps Study: Job Corps Applicants’ Programmatic Experiences.” Seattle WA: Battelle Human Affairs Research Centers, May 2000.
Johnson, T., M. Gritz, R. Jackson, J. Burghardt, C. Boussy, J. Leonard, and C. Orians. “National Job Corps Study: Report on the Process Analysis.” Princeton, NJ: Mathematica Policy Research, Inc., February 1999.
LaLonde, Robert. “Evaluating the Econometric Evaluations of Training Programs with Experimental Data.” American Economic Review, vol. 76, 1986.
Schochet, Peter, John Burghardt, and Sheena McConnell. “Conducting a Long-Term Follow-Up of National Job Corps Study Samples: Impact Findings Using 1993 to 2003 Summary Earnings Records Data.” Princeton, NJ: Mathematica Policy Research, Inc., July 2005.

56
Schochet, Peter, Sheena McConnell, and John Burghardt. “National Job Corps Study: Findings Using Administrative Earnings Records Data.” Princeton, NJ: Mathematica Policy Research, Inc., July 2003.
Schochet, Peter, John Burghardt, and Steven Glazerman. “National Job Corps Study: The Impacts of Job Corps on Participants’ Employment and Related Outcomes.” Princeton, NJ: Mathematica Policy Research, Inc., June 2001.
Smith, Jeffrey and Petra Todd. “Does Matching Overcome LaLonde’s Critique of Nonexperimental Estimators?” Working Paper, 2000.

APPENDIX A
ADDITIONAL TABLES PRESENTING EARNINGS IMPACTS FOR KEY YOUTH SUBGROUPS


A.3
TABLE A.1
SUBGROUP SAMPLE SIZES, BY RESEARCH STATUS AND DATA SOURCE
Survey Data SER Data
Subgroup
Percentage of the Study Population
Program Group
Control Group
Program Group
Control Group
Subgroups Defined by Youth Characteristics Age at Application
16 to 17 41 2,742 1,907 3,709 2,439 18 to 19 32 2,175 1,402 2,948 1,857 20 to 24 27 1,911 1,176 2,607 1,578
Gender
Male 59 3,741 2,787 5,314 3,854 Female 41 3,087 1,698 3,950 2,020
Race
White, non-Hispanic 27 1,793 1,193 2,474 1,558 Black, non-Hispanic 47 3,366 2,179 4,462 2,814 Hispanic 18 1,175 787 1,623 1,051 Othera 8 494 326 699 444
Arrest History
Never arrested 77 5,020 3,225 6,437 3,960 Ever arrested for nonserious
crimes onlyb 19 1,158 795 1,529 984 Ever arrested for serious crimesa 5 294 203 392 262
Educational Level Had a high school diploma
or GED 23 1,626 1,028 2,036 1,267 Had neither 77 5,161 3,436 6,777 4,272
Residents and Nonresidents Residential Designation Status
Residents 86 5,484 3,753 7,499 4,982 Nonresidents 14 1,344 732 1,765 892
Subgroups Defined by Center Characteristics Type of Center Operator
Contract centers (73 centers) 85 5447 3,540 7,411 4,595 CCC centers (30 centers) 15 914 617 1,240 816

TABLE A.1 (continued)
A.4
Survey Data SER Data
Subgroup
Percentage of the Study Population
Program Group
Control Group
Program Group
Control Group
Center Size
Small centers (< 226 slots; 38 centers) 20 1,272 837 1,716 1,087
Medium centers (226 to 495 slots; 49 centers) 45 2,909 1,891 3,952 2,462
Large centers (> 495 slots; 16 centers) 35 2,180 1,429 2,983 1,862
Performance Levelc
High (18 centers) 15 918 623 1,269 804 Medium (68 centers) 66 4,240 2,727 5,751 3,549 Low (17 centers) 20 1,203 807 1,631 1,058
Sample Size 80,883 6,828 4,485 9,264 5,874 Source: Annual social security earnings SER records. Note: Subgroup sample sizes do not always sum to the full sample size because of missing values. aThis group includes American Indians, Alaskan Natives, Asians, and Pacific Islanders. bSerious crimes include murder, assault, robbery, and burglary. Nonserious crimes include larceny, vehicle theft, other property crimes, drug law violations, other personal crimes, and other miscellaneous crimes. cHigh-performing centers are defined as those that were in the top third of the performance ranking during program years 1994 and 1996. Similarly, low-performing centers are those that were in the bottom third of the performance ranking in each year; and the remaining centers are designated medium-performing centers.

A.5
TABLE A.2
IMPACTS ON EARNINGS AND EMPLOYMENT RATES BASED ON SURVEY DATA, BY QUARTER AFTER RANDOM ASSIGNMENT
Outcome Measure Program Group
Control Group
Estimated Impact per
Eligible Applicanta
Estimated Impact per Participantb
Average Earnings per Week, by Quarter (in 1995 Dollars) 1 2 3 4 5 6 7 8 9 10 11 12 13 14 15 16 Total Earnings Year 3 Year 4
44.5 57.9 77.6 92.4
108.8 126.8 142.3 153.3 164.8 171.6 186.1 196.2 205.3 209.8 213.7 217.5
9,286.2
10,990.4
65.5 87.4 99.2
106.0 117.7 129.3 138.2 146.9 155.8 160.0 170.2 178.6 188.0 194.2 197.2 199.4
8589.9
10,162.8
–22.0*** –29.5*** –21.6*** –13.6***
–8.9*** –2.5
4.1 6.4* 9.0**
11.6*** 15.9*** 17.6*** 17.3*** 15.7*** 16.5*** 18.1***
696.3*** 827.5***
–30.6*** –41.0*** –30.1*** –19.0*** –12.3***
–3.4 5.8 8.9*
12.5** 16.2*** 22.1*** 24.5*** 24.1*** 21.8*** 22.9*** 25.2***
967.6***
1,150.0***
Percentage Employed, by Quarter 1 2 3 4 5 6 7 8 9 10 11 12 13 14 15 16
33.2 32.8 41.8 49.8 52.6 52.1 55.2 59.0 62.7 65.6 67.1 66.2 66.8 67.5 69.2 71.1
42.1 47.5 53.0 57.7 56.7 54.3 55.8 57.9 61.4 63.7 64.3 63.0 63.4 65.1 65.6 68.7
–8.9* –14.7* –11.1*
–7.9* –4.1* –2.2* –0.6
1.2 1.2 1.9* 2.9* 3.2* 3.4* 2.4* 3.6* 2.4*
–12.4* –20.4* –15.4* –10.9*
–5.7* –3.0* –0.8
1.6 1.7 2.7* 4.0* 4.4* 4.8* 3.3* 5.0* 3.3*
Sample Size 6,828 4,485 11,313

TABLE A.2 (continued) ___________________________________________________________________________________________ 1
A.6
Source: Baseline and 12-, 30-, and 48-month follow-up interview data for those who completed 48-month interviews.
Note: Standard errors are in parentheses.
aEstimated impacts per eligible applicant are measured as the difference between the weighted means for program and control group members.
bEstimated impacts per Job Corps participant are measured as the estimated impacts per eligible applicant divided by the difference between the proportion of program group members who enrolled in Job Corps and the proportion of control group members who enrolled in Job Corps during their three-year restriction period.
*Significantly different from zero at the .10 level, two-tailed test. **Significantly different from zero at the .05 level, two-tailed test. ***Significantly different from zero at the .01 level, two-tailed test.

A.7
TABLE A.3
IMPACTS ON 1993 TO 2004 CALENDAR YEAR EARNINGS AND EMPLOYMENT RATES FOR 16- AND 17-YEAR-OLDS
Outcome Measurea Program Group
Control Group
Estimated Impact per Eligible Applicantb
Estimated Impact per Participantc
Average Calendar Year Earnings (in 1995 Dollars)
SER Data
1993d 119 127 –8 NA 1994d 417 402 15 NA 1995*** 805 886 –81** –102** 1996*** 2,021 1,853 168** 212** 1997** 3,214 2,905 309*** 391*** 1998 4,253 4,098 155 196 1999 5,146 5,142 4 5 2000 5,937 5,999 –62 –78 2001 6,158 6,132 26 33 2002** 6,148 6,170 –22 –28 2003* 6,205 6,256 –51 –64 2004 6,637 6,791 –154 –194 1998 to 2004* 40,484 40,588 –105 –133
Survey Data
1997 6,900 6,286 614*** 791*** 1998*** 8,946 7,931 1,015*** 1,308***
Percentage Employed in Calendar Year (SER Data) 1993d 17.1 17.4 –0.4 NA 1994d 38.5 38.0 0.5 NA 1995***e 85.4 59.3 26.0*** 32.8*** 1996***e 86.5 70.7 15.9*** 20.1*** 1997 81.0 78.0 3.0*** 3.7*** 1998 82.6 81.8 0.8 1.0 1999 82.8 80.9 1.9* 2.4* 2000 81.8 80.7 1.1 1.3 2001 77.6 77.6 0.0 0.0 2002 72.9 73.0 –0.1 –0.1 2003 70.4 69.6 0.8 1.0 2004 70.3 69.7 0.6 0.7
Sample Size 3,709 2,439 6,148

TABLE A.3 (continued) _____________________________________________________________________________________________
A.8
Source: Baseline and 12-, 30-, and 48-month follow-up interview data for those who completed 48-month interviews and (2) annual social security earnings SER records.
aStars next to a variable name represent statistical significance levels for joint tests of differences between estimated impacts per eligible applicant across levels of a subgroup. bEstimated impacts per eligible applicant are measured as the difference between the weighted means for program and control group members. cEstimated impacts per Job Corps participant are measured as the estimated impact per eligible applicant divided by the difference between the proportion of program group members who enrolled in Job Corps and the proportion of control group members who enrolled in Job Corps during their three-year restriction period. d1993 and 1994 pertain to the period before random assignment. eEmployment rates are high for the program group in 1995 and 1996 because student pay that Job Corps students receive while enrolled in the program is reported to the government. NA = Not applicable *Significantly different from zero at the .10 level, two-tailed test. **Significantly different from zero at the .05 level, two-tailed test. ***Significantly different from zero at the .01 level, two-tailed test.

A.9
TABLE A.4
IMPACTS ON 1993 TO 2004 CALENDAR YEAR EARNINGS AND EMPLOYMENT RATES FOR 18- AND 19-YEAR-OLDS
Outcome Measurea Program Group
Control Group
Estimated Impact per Eligible Applicantb
Estimated Impact per Participantc
Average Calendar Year Earnings (in 1995 Dollars)
SER Data
1993d 748 793 –45 NA 1994d 1,599 1,561 37 NA 1995*** 1,897 2,345 –448*** –631*** 1996*** 3,241 3,711 –470*** –662*** 1997** 4,734 4,887 –153 –216 1998 6,187 6,124 63 89 1999 6,914 7,171 –257 –362 2000 7,849 8,158 –310 –436 2001 8,224 8,440 –217 –305 2002** 8,228 8,579 –351 –495 2003* 8,307 8,623 –316 –445 2004 8,890 9,218 –329 –463 1998 to 2004* 54,598 56,313 –1,715 –2,418
Survey Data
1997 8,242 8,417 –175 –253 1998*** 10,242 10,037 205 297
Percentage Employed in Calendar Year (SER Data) 1993d 51.7 51.9 –0.2 NA 1994d 70.1 69.5 0.6 NA 1995***e 91.2 81.8 9.4*** 13.2*** 1996***e 89.3 83.4 5.9*** 8.3*** 1997 84.8 82.9 1.9* 2.6* 1998 84.5 83.1 1.4 1.9 1999 84.8 84.3 0.5 0.7 2000 83.7 84.6 –0.9 –1.2 2001 81.8 82.3 –0.5 –0.7 2002 78.4 79.3 –0.9 –1.2 2003 76.2 76.7 –0.5 –0.7 2004 76.5 77.1 –0.6 –0.8
Sample Size 2,948 1,857 4,805

TABLE A.4 (continued)
_________________________________________________________________________________
A.10
Source: Baseline and 12-, 30-, and 48-month follow-up interview data for those who completed 48-month interviews and (2) annual social security earnings SER records.
aStars next to a variable name represent statistical significance levels for joint tests of differences between estimated impacts per eligible applicant across levels of a subgroup. bEstimated impacts per eligible applicant are measured as the difference between the weighted means for program and control group members. cEstimated impacts per Job Corps participant are measured as the estimated impact per eligible applicant divided by the difference between the proportion of program group members who enrolled in Job Corps and the proportion of control group members who enrolled in Job Corps during their three-year restriction period. d1993 and 1994 pertain to the period before random assignment. eEmployment rates are high for the program group in 1995 and 1996 because student pay that Job Corps students receive while enrolled in the program is reported to the government. NA = Not applicable *Significantly different from zero at the .10 level, two-tailed test. **Significantly different from zero at the .05 level, two-tailed test. ***Significantly different from zero at the .01 level, two-tailed test.

A.11
TABLE A.5
IMPACTS ON 1993 TO 2004 CALENDAR YEAR EARNINGS AND EMPLOYMENT RATES FOR 20- TO 24-YEAR-OLDS
Outcome Measurea Program Group
Control Group
Estimated Impact per Eligible Applicantb
Estimated Impact per Participantc
Average Calendar Year Earnings (in 1995 Dollars)
SER Data
1993d 2,658 2,653 5 NA 1994d 3,349 3,277 72 NA 1995*** 3,043 3,415 –371*** –552*** 1996*** 4,567 4,956 –389** –579** 1997** 6,387 6,062 325* 483* 1998 7,798 7,320 478** 711** 1999 8,801 8,379 422 628 2000 9,822 9,438 384 571 2001 9,969 9,581 388 578 2002** 9,867 9,154 713** 1,060** 2003* 10,035 9,435 600* 892* 2004 10,430 9,904 526 782 1998 to 2004* 66,721 63,210 3,511* 5,221*
Survey Data
1997 9,800 9,478 322 482 1998*** 12,393 10,616 1,778*** 2,663***
Percentage Employed in Calendar Year (SER Data) 1993d 71.8 71.9 –0.1 NA 1994d 78.9 78.2 0.7 NA 1995***e 92.8 84.6 8.2*** 12.1*** 1996***e 91.4 84.4 7.0*** 10.4*** 1997 86.1 85.2 0.9 1.3 1998 87.6 85.6 2.0* 2.9* 1999 86.9 84.8 2.1** 3.1** 2000 86.3 84.5 1.7 2.5 2001 83.8 82.3 1.5 2.2 2002 80.8 79.2 1.6 2.3 2003 78.5 76.5 2.0 2.9 2004 77.6 75.6 2.0 2.9
Sample Size 2,607 1,578 4,185
Source: Baseline and 12-, 30-, and 48-month follow-up interview data for those who completed 48-month interviews and (2) annual social security earnings SER records.

TABLE A.5 (continued) ________________________________________________________________________________
A.12
aStars next to a variable name represent statistical significance levels for joint tests of differences between estimated impacts per eligible applicant across levels of a subgroup. bEstimated impacts per eligible applicant are measured as the difference between the weighted means for program and control group members. cEstimated impacts per Job Corps participant are measured as the estimated impact per eligible applicant divided by the difference between the proportion of program group members who enrolled in Job Corps and the proportion of control group members who enrolled in Job Corps during their three-year restriction period. d1993 and 1994 pertain to the period before random assignment. eEmployment rates are high for the program group in 1995 and 1996 because student pay that Job Corps students receive while enrolled in the program is reported to the government. NA = Not applicable *Significantly different from zero at the .10 level, two-tailed test. **Significantly different from zero at the .05 level, two-tailed test. ***Significantly different from zero at the .01 level, two-tailed test.

A.13
TABLE A.6
IMPACTS ON 1993 TO 2004 CALENDAR YEAR EARNINGS AND EMPLOYMENT RATES FOR MALES
Outcome Measurea Program Group
Control Group
Estimated Impact per Eligible Applicantb
Estimated Impact per Participantc
Average Calendar Year Earnings (in 1995 Dollars)
SER Data
1993d 1,067 1,052 15 NA 1994d 1,687 1,600 87 NA 1995 1,826 2,136 –310*** –407*** 1996 3,278 3,507 –229*** –301*** 1997 4,945 4,736 209* 275* 1998** 6,353 5,959 394*** 518*** 1999 7,185 7,037 148 195 2000 8,138 8,149 –11 –14 2001 8,339 8,239 99 131 2002 8,234 8,047 187 246 2003 8,361 8,255 106 139 2004 8,839 8,833 7 9 1998 to 2004 55,450 54,520 930 1,222
Survey Data
1997 9,252 8,955 297 398 1998 11,721 10,581 1,140*** 1,530***
Percentage Employed in Calendar Year (SER Data) 1993d 43.5 44.1 –0.6 NA 1994d 60.1 59.1 1.0 NA 1995e 90.4 74.3 16.2*** 21.2*** 1996e 89.6 79.5 10.1*** 13.2*** 1997 84.7 82.7 2.0*** 2.6*** 1998 84.9 83.4 1.5** 1.9** 1999 84.1 83.1 0.9 1.1 2000 83.0 82.3 0.8 1.0 2001 79.4 80.0 –0.6 –0.7 2002 75.7 75.7 –0.1 –0.1 2003** 73.1 73.6 –0.5 –0.6 2004 73.3 72.7 0.6 0.7
Sample Size 5,314 3,854 9,168
Source: Baseline and 12-, 30-, and 48-month follow-up interview data for those who completed 48-month interviews and (2) annual social security earnings SER records.

TABLE A.6 (continued) _______________________________________________________________________________
A.14
aStars next to a variable name represent statistical significance levels for joint tests of differences between estimated impacts per eligible applicant across levels of a subgroup. bEstimated impacts per eligible applicant are measured as the difference between the weighted means for program and control group members. cEstimated impacts per Job Corps participant are measured as the estimated impact per eligible applicant divided by the difference between the proportion of program group members who enrolled in Job Corps and the proportion of control group members who enrolled in Job Corps during their three-year restriction period. d1993 and 1994 pertain to the period before random assignment. eEmployment rates are high for the program group in 1995 and 1996 because student pay that Job Corps students receive while enrolled in the program is reported to the government. NA = Not applicable *Significantly different from zero at the .10 level, two-tailed test. **Significantly different from zero at the .05 level, two-tailed test. ***Significantly different from zero at the .01 level, two-tailed test.

A.15
TABLE A.7
IMPACTS ON 1993 TO 2004 CALENDAR YEAR EARNINGS AND EMPLOYMENT RATES FOR FEMALES
Outcome Measurea Program Group
Control Group
Estimated Impact per Eligible Applicantb
Estimated Impact per Participantc
Average Calendar Year Earnings (in 1995 Dollars)
SER Data
1993 926 963 –37 NA 1994 1,449 1,459 –10 NA 1995 1,665 1,873 –208*** –300*** 1996 2,844 2,941 –97 –140 1997 4,000 3,864 136 196 1998** 5,075 5,091 –16 –24 1999 6,000 6,097 –97 –140 2000 6,821 6,814 8 11 2001 7,143 7,136 7 10 2002 7,220 7,287 –68 –97 2003 7,266 7,287 –21 –30 2004 7,723 7,763 –40 –57 1998 to 2004 47,247 47,474 –227 –327
Survey Data
1997 6,472 6,152 320 468 1998 8,251 7,476 775*** 1,134***
Percentage Employed in Calendar Year (SER Data) 1993 42.2 41.6 0.7 NA 1994 58.6 58.4 0.2 NA 1995d 87.5 71.9 15.6*** 22.4*** 1996d 87.5 76.8 10.7*** 15.4*** 1997 81.9 79.7 2.3** 3.3** 1998 84.2 83.0 1.1 1.5 1999 85.2 82.9 2.3** 3.3** 2000 84.4 84.0 0.4 0.5 2001 82.4 80.9 1.5 2.1 2002 78.5 78.1 0.4 0.5 2003** 76.4 73.9 2.5** 3.6** 2004 75.5 75.0 0.5 0.7
Sample Size 3,950 2,020 5,970
Source: Baseline and 12-, 30-, and 48-month follow-up interview data for those who completed 48-month interviews and (2) annual social security earnings SER records.

TABLE A.7 (continued) ________________________________________________________________________________
A.16
aStars next to a variable name represent statistical significance levels for joint tests of differences between estimated impacts per eligible applicant across levels of a subgroup. bEstimated impacts per eligible applicant are measured as the difference between the weighted means for program and control group members. cEstimated impacts per Job Corps participant are measured as the estimated impact per eligible applicant divided by the difference between the proportion of program group members who enrolled in Job Corps and the proportion of control group members who enrolled in Job Corps during their three-year restriction period. dEmployment rates are high for the program group in 1995 and 1996 because student pay that Job Corps students receive while enrolled in the program is reported to the government. NA = Not applicable *Significantly different from zero at the .10 level, two-tailed test. **Significantly different from zero at the .05 level, two-tailed test. ***Significantly different from zero at the .01 level, two-tailed test.

A.17
TABLE A.8
IMPACTS ON 1993 TO 2004 CALENDAR YEAR EARNINGS AND EMPLOYMENT RATES FOR WHITE, NON-HISPANIC YOUTH
Outcome Measurea Program Group
Control Group
Estimated Impact per Eligible Applicantb
Estimated Impact per Participantc
Average Calendar Year Earnings (in 1995 Dollars)
SER Data
1993d 1,279 1,231 48 NA 1994d 1,938 1,876 62 NA 1995 2,086 2,512 –426*** –585*** 1996 3,784 3,877 –93 –128 1997 5,509 5,345 164 226 1998 6,957 6,508 448** 616** 1999 7,717 7,700 18 24 2000 8,792 8,658 134 184 2001 8,992 8,738 254 349 2002 8,845 8,526 319 439 2003 8,764 8,437 327 449 2004 9,196 9,006 190 260 1998 to 2004 59,261 57,573 1,689 2,321
Survey Data
1997 10,414 9,841 574* 823* 1998* 12,921 11,207 1,714*** 2,459***
Percentage Employed in Calendar Year (SER Data) 1993d 50.8 49.9 0.9 NA 1994d 69.6 68.1 1.5 NA 1995***e 93.3 82.4 10.9*** 14.9*** 1996e 92.8 85.0 7.8*** 10.7*** 1997* 89.9 88.8 1.0 1.3 1998 89.7 88.4 1.3 1.7 1999 89.0 88.7 0.3 0.4 2000 88.7 86.9 1.8* 2.4* 2001 85.7 84.0 1.7 2.3 2002 81.3 80.4 0.9 1.2 2003 77.8 76.2 1.6 2.1 2004 77.4 76.4 1.0 1.3
Sample Size 2,474 1,558 4,032
Source: Baseline and 12-, 30-, and 48-month follow-up interview data for those who completed 48-month interviews and (2) annual social security earnings SER records.

TABLE A.8 (continued) _________________________________________________________________________________________________
A.18
aStars next to a variable name represent statistical significance levels for joint tests of differences between estimated impacts per eligible applicant across levels of a subgroup. bEstimated impacts per eligible applicant are measured as the difference between the weighted means for program and control group members. cEstimated impacts per Job Corps participant are measured as the estimated impact per eligible applicant divided by the difference between the proportion of program group members who enrolled in Job Corps and the proportion of control group members who enrolled in Job Corps during their three-year restriction period. d1993 and 1994 pertain to the period before random assignment. eEmployment rates are high for the program group in 1995 and 1996 because student pay that Job Corps students receive while enrolled in the program is reported to the government. NA = Not applicable *Significantly different from zero at the .10 level, two-tailed test. **Significantly different from zero at the .05 level, two-tailed test. ***Significantly different from zero at the .01 level, two-tailed test.

A.19
TABLE A.9
IMPACTS ON 1993 TO 2004 CALENDAR YEAR EARNINGS AND EMPLOYMENT RATES FOR BLACK, NON-HISPANIC YOUTH
Outcome Measurea Program Group
Control Group
Estimated Impact per Eligible Applicantb
Estimated Impact per Participantc
Average Calendar Year Earnings (in 1995 Dollars)
SER Data
1993d 851 864 –13 NA 1994d 1,357 1,319 38 NA 1995 1,542 1,748 –206*** –279*** 1996 2,605 2,704 –99 –134 1997 3,788 3,566 222** 301** 1998 4,871 4,615 256* 348* 1999 5,669 5,573 96 131 2000 6,365 6,341 24 33 2001 6,534 6,320 214 291 2002 6,511 6,425 86 117 2003 6,620 6,505 114 155 2004 6,991 7,102 –112 –151 1998 to 2004 43,561 42,881 680 922
Survey Data
1997 6,907 6,551 356* 489* 1998* 8,770 7,912 858*** 1,178***
Percentage Employed in Calendar Year (SER Data) 1993d 40.3 40.0 0.3 NA 1994d 56.1 56.1 0.0 NA 1995***e 87.8 69.9 17.9*** 24.2*** 1996e 86.4 75.3 11.1*** 15.0*** 1997* 80.7 78.2 2.5*** 3.3*** 1998 82.0 81.0 1.0 1.3 1999 82.7 80.5 2.1** 2.8** 2000 80.7 81.1 –0.4 –0.5 2001 77.2 78.4 –1.2 –1.6 2002 73.4 73.9 –0.5 –0.6 2003 71.1 71.0 0.1 0.1 2004 71.2 71.1 0.2 0.2
Sample Size 4,462 2,814 7,276 Source: Baseline and 12-, 30-, and 48-month follow-up interview data for those who completed 48-month interviews
and (2) annual social security earnings SER records.

TABLE A.9 (continued) _________________________________________________________________________________________________
A.20
aStars next to a variable name represent statistical significance levels for joint tests of differences between estimated impacts per eligible applicant across levels of a subgroup. bEstimated impacts per eligible applicant are measured as the difference between the weighted means for program and control group members. cEstimated impacts per Job Corps participant are measured as the estimated impact per eligible applicant divided by the difference between the proportion of program group members who enrolled in Job Corps and the proportion of control group members who enrolled in Job Corps during their three-year restriction period.
d1993 and 1994 pertain to the period before random assignment. eEmployment rates are high for the program group in 1995 and 1996 because student pay that Job Corps students receive while enrolled in the program is reported to the government. NA = Not applicable *Significantly different from zero at the .10 level, two-tailed test. **Significantly different from zero at the .05 level, two-tailed test. ***Significantly different from zero at the .01 level, two-tailed test.

A.21
TABLE A.10
IMPACTS ON 1993 TO 2004 CALENDAR YEAR EARNINGS AND EMPLOYMENT RATES FOR HISPANIC YOUTH
Outcome Measurea Program Group
Control Group
Estimated Impact per Eligible Applicantb
Estimated Impact per Participantc
Average Calendar Year Earnings (in 1995 Dollars)
SER Data
1993d 1,105 1,112 –7 NA 1994d 1,740 1,650 90 NA 1995 1,782 2,053 –270** –376** 1996 3,449 3,758 –309* –430* 1997 5,167 5,007 160 222 1998 6,567 6,735 –168 –234 1999 7,740 7,977 –237 –330 2000 8,772 9,274 –502 –698 2001 9,348 9,980 –632 –879 2002 9,611 9,856 –245 –341 2003 9,756 10,326 –570 –793 2004 10,643 10,771 –129 –179 1998 to 2004 62,437 64,920 –2,484 –3,453
Survey Data
1997 7,911 8,062 –151 –209 1998* 10,282 10,146 136 187
Percentage Employed in Calendar Year (SER Data) 1993d 40.9 41.2 –0.3 NA 1994d 55.3 55.8 –0.4 NA 1995***e 87.9 71.5 16.4*** 22.8*** 1996e 88.8 77.3 11.5*** 15.9*** 1997* 83.9 79.6 4.4*** 6.1*** 1998 84.1 82.2 1.8 2.5 1999 83.0 82.7 0.2 0.2 2000 83.8 82.9 0.9 1.2 2001 82.2 80.7 1.5 2.0 2002 79.4 78.9 0.5 0.6 2003 78.7 76.8 1.9 2.6 2004 77.7 76.1 1.6 2.2
Sample Size 1,623 1,051 2,674
Source: Baseline and 12-, 30-, and 48-month follow-up interview data for those who completed 48-month interviews and (2) annual social security earnings SER records.

TABLE A.10 (continued) __________________________________________________________________________________________________
A.22
aStars next to a variable name represent statistical significance levels for joint tests of differences between estimated impacts per eligible applicant across levels of a subgroup. bEstimated impacts per eligible applicant are measured as the difference between the weighted means for program and control group members. cEstimated impacts per Job Corps participant are measured as the estimated impact per eligible applicant divided by the difference between the proportion of program group members who enrolled in Job Corps and the proportion of control group members who enrolled in Job Corps during their three-year restriction period. d1993 and 1994 pertain to the period before random assignment. eEmployment rates are high for the program group in 1995 and 1996 because student pay that Job Corps students receive while enrolled in the program is reported to the government. NA = Not applicable *Significantly different from zero at the .10 level, two-tailed test. **Significantly different from zero at the .05 level, two-tailed test. ***Significantly different from zero at the .01 level, two-tailed test.

A.23
TABLE A.11
IMPACTS ON 1993 TO 2004 CALENDAR YEAR EARNINGS AND EMPLOYMENT RATES FOR RESIDENTIAL DESIGNEES
Outcome Measurea Program Group
Control Group
Estimated Impact per Eligible Applicantb
Estimated Impact per Participantc
Average Calendar Year Earnings (in 1995 Dollars)
SER Data
1993d 955 982 –27 NA 1994d 1,543 1,523 20 NA 1995** 1,711 2,018 –308*** –410*** 1996* 3,038 3,259 –221*** –295*** 1997 4,515 4,342 173* 231* 1998 5,759 5,525 234** 312** 1999 6,602 6,538 64 85 2000 7,445 7,477 –32 –43 2001 7,677 7,594 83 110 2002 7,642 7,544 98 130 2003 7,773 7,717 57 76 2004 8,211 8,238 –27 –36 1998 to 2004 51,108 50,632 476 634
Survey Data
1997 8,171 7,903 267 365 1998 10,346 9,336 1,010*** 1,378***
Percentage Employed in Calendar Year (SER Data) 1993d 41.9 42.2 –0.2 NA 1994d 59.5 58.8 0.7 NA 1995e 89.7 73.8 15.8*** 21.0*** 1996e 88.9 78.6 10.3*** 13.7*** 1997 83.6 81.6 2.1*** 2.7*** 1998 84.5 83.0 1.5** 1.9** 1999 84.2 82.6 1.5** 1.9** 2000 83.3 82.5 0.8 1.0 2001 80.1 79.9 0.2 0.2 2002 76.2 75.8 0.4 0.5 2003 74.0 73.2 0.7 0.9 2004 73.6 73.3 0.3 0.3
Sample Size 7,499 4,982 12,481
Source: Baseline and 12-, 30-, and 48-month follow-up interview data for those who completed 48-month interviews and (2) annual social security earnings SER records.

TABLE A.11 (continued) ________________________________________________________________________________________________
A.24
aStars next to a variable name represent statistical significance levels for joint tests of differences between estimated impacts per eligible applicant across levels of a subgroup. bEstimated impacts per eligible applicant are measured as the difference between the weighted means for program and control group members. cEstimated impacts per Job Corps participant are measured as the estimated impact per eligible applicant divided by the difference between the proportion of program group members who enrolled in Job Corps and the proportion of control group members who enrolled in Job Corps during their three-year restriction period. d1993 and 1994 pertain to the period before random assignment. eEmployment rates are high for the program group in 1995 and 1996 because student pay that Job Corps students receive while enrolled in the program is reported to the government. NA = Not applicable *Significantly different from zero at the .10 level, two-tailed test. **Significantly different from zero at the .05 level, two-tailed test. ***Significantly different from zero at the .01 level, two-tailed test.

A.25
TABLE A.12
IMPACTS ON 1993 TO 2004 CALENDAR YEAR EARNINGS AND EMPLOYMENT RATES FOR NONRESIDENTIAL DESIGNEES
Outcome Measurea Program Group
Control Group
Estimated Impact per Eligible Applicantb
Estimated Impact per Participantc
Average Calendar Year Earnings (in 1995 Dollars)
SER Data
1993d 1,354 1,230 124 NA 1994d 1,885 1,665 220* NA 1995** 2,074 2,103 –28 –45 1996* 3,497 3,402 95 152 1997 4,840 4,653 187 300 1998 6,287 6,134 153 245 1999 7,328 7,402 –74 –118 2000 8,582 8,444 138 221 2001 8,943 9,038 –95 –152 2002 8,936 8,957 –21 –33 2003 8,797 8,787 10 16 2004 9,472 9,417 56 89 1998 to 2004 58,346 58,179 167 267
Survey Data
1997 7,739 7,307 432 680 1998 9,984 9,254 730* 1,149*
Percentage Employed in Calendar Year (SER Data) 1993d 49.3 48.5 0.9 NA 1994d 59.5 59.1 0.4 NA 1995e 86.4 70.0 16.4*** 26.2*** 1996e 87.9 77.3 10.6*** 16.9*** 1997 83.3 81.0 2.3 3.6 1998 84.9 84.8 0.1 0.1 1999 87.0 85.5 1.5 2.4 2000 85.7 85.8 –0.1 –0.1 2001 84.0 83.5 0.5 0.8 2002 80.3 81.9 –1.6 –2.5 2003 77.6 76.9 0.7 1.1 2004 78.1 75.9 2.3 3.6
Sample Size 1,765 892 2,657
Source: Baseline and 12-, 30-, and 48-month follow-up interview data for those who completed 48-month interviews and (2) annual social security earnings SER records.

TABLE A.12 (continued) ________________________________________________________________________________________________
A.26
aStars next to a variable name represent statistical significance levels for joint tests of differences between estimated impacts per eligible applicant across levels of a subgroup. bEstimated impacts per eligible applicant are measured as the difference between the weighted means for program and control group members. cEstimated impacts per Job Corps participant are measured as the estimated impact per eligible applicant divided by the difference between the proportion of program group members who enrolled in Job Corps and the proportion of control group members who enrolled in Job Corps during their three-year restriction period. d1993 and 1994 pertain to the period before random assignment. eEmployment rates are high for the program group in 1995 and 1996 because student pay that Job Corps students receive while enrolled in the program is reported to the government. NA = Not applicable *Significantly different from zero at the .10 level, two-tailed test. **Significantly different from zero at the .05 level, two-tailed test. ***Significantly different from zero at the .01 level, two-tailed test.

A.27
TABLE A.13
IMPACTS PER PARTICIPANT ON EARNINGS FOR 20- TO 24-YEAR-OLDS, BY GENDER AND RACE AND ETHNICITY
Impacts on Calendar Year Earnings (in 1995 Dollars)
Subgroup 1998 1999 2000 2001 2002 2003 2004 Full Sample of Those 20 to 24 at Program Application 711** 628 571 578 1,060** 892* 782 Gendera ** **
Male 890** 1,096** 858 1,365** 1,910*** 1,542** 1,293* Female 495 8 213 –489 –108 9 95
Race and Ethnicitya ** ** ** **
White, non-Hispanic 1,429** 630 854 1,908** 3,124*** 3,217*** 3,047*** Black, non-Hispanic 888 1,056* 1,067 1,026 703 504 103 Hispanic –542 –532 –1,255 –1,674 –118 –1,019 –618
Source: Annual social security earnings SER records for the full sample.
Note: Estimated impacts per Job Corps participant are measured as the difference between the weighted means
for program and control group members divided by the difference between the proportion of program group members who enrolled in Job Corps and the proportion of control group members who enrolled in Job Corps during their three-year restriction period.
aStars in the header rows signify that differences in impacts across subgroup levels are statistically significant. *Significantly different from zero at the .10 level, two-tailed test. **Significantly different from zero at the .05 level, two-tailed test. ***Significantly different from zero at the .01 level, two-tailed test.

A.28
TABLE A.14
IMPACTS PER PARTICIPANT ON EARNINGS AND ARREST RATES, FOR CENTER SUBGROUPS WHEN CENTERS ARE WEIGHTED EQUALLY IN THE CALCULATIONS
Impacts on Calendar Year Earnings (in 1995 Dollars)
Survey SER Data
Subgroup 1998 1998 1999 2002 2004
Percentage Ever Arrested During the 48-Month Period
(Survey) Full Sample 1,581* 636*** 355* 354 359 –7.1* Type of Center Operatora
Contract centers 1,456* 552*** 371* 305 86 –6.2* CCC centers 1,444 600 192 428 538 –8.9*
Center Sizea *
Small (< 226 slots) 749 298 251 326 240 –10.2* Medium (226 to 495 slots) 1,863* 856*** 475 642* 468 –6.5* Large (> 495 slots) 1,830* 341 10 –531 –592 –1.2
Performance Levela,b
High 1,276 765 184 415 477 –9.2* Medium 1,670 652*** 261 252 -121 –5.7* Low 766 106 622 576 1,150* –10.0*
Source: (1) Baseline and 12-, 30-, and 48-month follow-up interview data for those who completed 48-month
interviews and (2) annual social security earnings SER records for the full sample.
Note: Estimated impacts per Job Corps participant are measured as the difference between the weighted means for program and control group members divided by the difference between the proportion of program group members who enrolled in Job Corps and the proportion of control group members who enrolled in Job Corps during their three-year restriction period. Centers are weighted equally in all analyses.
aStars in the header rows signify that differences in impacts across subgroup levels are statistically significant.
bHigh-performing centers are defined as those that were in the top third of the performance ranking during program years 1994 and 1996. Similarly, low-performing centers are those that were in the bottom third of the performance ranking in each year; and the remaining centers are designated medium-performing centers.
*Significantly different from zero at the .10 level, two-tailed test. **Significantly different from zero at the .05 level, two-tailed test. ***Significantly different from zero at the .01 level, two-tailed test.

APPENDIX B
ADDITIONAL TABLES PRESENTING FINDINGS FROM THE BENEFIT-COST ANALYSIS


B.3
TABLE B.1
REVISED BENEFITS AND COSTS OF JOB CORPS, FULL SAMPLE, BASED ON ADJUSTED SURVEY DATA AND AN ASSUMPTION OF A DECAY IN EARNINGS IMPACTSa
(1995 Dollars)
Perspective
Benefits or Costs Society Participants Rest of Society
Benefits from Increased Output (Dollars) 119 –392 511
Year 1 Increased Earnings and Fringe Benefits –1,715 –1,715 0 Increased Child Care Costs –50 –47 –4 Increased Taxes 0 268 –268
Years 2 to 4 Increased Earnings and Fringe Benefits 1,581 1,581 0 Increased Child Care Costs –96 –77 –19 Increased Taxes 0 –514 514
After the Observation Period Increased Earnings and Fringe Benefits 196 196 0 Increased Child Care Costs –17 –14 –4 Increased Taxes 0 –70 70
Output Produced During Vocational Training in Job Corps 220 0 220
Benefits from Reduced Use of Other Programs and Services 2,186 –780 2,966
Reduced Use of High School 1,189 0 1,189 Reduced Use of Other Education and Training Programs 874 0 874 Reduced Use of Public Assistance and Substance Abuse Treatment Programs 122 –780 902
Benefits from Reduced Crime 1,240 643 597
Reduced Crime by Participants 1,240 0 1,240 Reduced Crime Against Participants 0 643 –643
Program Costs –13,844 2,314 –16,158
Reported Program Operating Costs (Net of Transfers) –12,285 0 –12,285 Unreported Program Operating Costs (Net of Transfers) –543 0 –543 Capital Costs –1,016 0 –1,016 Student Pay, Food, and Clothing (Transfers) 0 2,314 –2,314
Net Benefits (Dollars)b –10,300 1,784 –12,084
Sources: (1) Baseline and 12-, 30-, and 48-month follow-up interview data for those who completed 48-month interviews; (2) annual social security earnings records; and (3) McConnell and Glazerman (2001).
aAssumes that impacts on earnings and child-care expenses decay at 80 percent per year after the observation period.
bBecause of rounding, net benefits may not equal the sum of the rows. Similarly, benefits to society may not precisely equal the sum of the benefits to participants and the benefits to the rest of society.

B.4
TABLE B.2
REVISED BENEFITS AND COSTS OF JOB CORPS, YOUTH AGES 20 TO 24 AT PROGRAM APPLICATION, BASED ON ADJUSTED SURVEY DATA AND AN ASSUMPTION
OF NO DECAY IN EARNINGS IMPACTSa (1995 Dollars)
Perspective
Benefits or Costs Society Participants Rest of Society
Benefits from Increased Output (Dollars) 34,896 31,077 3,819
Year 1 Increased Earnings and Fringe Benefits –2,381 –2,381 0 Increased Child Care Costs –83 –73 –9 Increased Taxes 0 513 –513
Years 2 to 4 Increased Earnings and Fringe Benefits 3,006 3,006 0 Increased Child Care Costs –204 –185 –19 Increased Taxes 0 –394 394
After the Observation Period Increased Earnings and Fringe Benefits 36,021 36,021 0 Increased Child Care Costs –1,713 –1,424 –289 Increased Taxes 0 –4,006 4,006
Output Produced During Vocational Training in Job Corps 250 0 250
Benefits from Reduced Use of Other Programs and Services 937 –1,358 2,295
Reduced Use of High School 21 0 21 Reduced Use of Other Education and Training Programs 629 0 629 Reduced Use of Public Assistance and Substance Abuse Treatment Programs 287 –1,358 1,645
Benefits from Reduced Crime –3,787 643 –4,430
Reduced Crime by Participants –3,787 0 –3,787 Reduced Crime Against Participants 0 643 –643
Program Costs –15,193 2,562 –17,754
Reported Program Operating Costs (Net of Transfers) –13,487 0 –13,487 Unreported Program Operating Costs (Net of Transfers) –554 0 –554 Capital Costs –1,152 0 –1,152 Student Pay, Food, and Clothing (Transfers) 0 2,562 –2,562
Net Benefits (Dollars)b 16,853 32,924 –16,071
Sources: (1) Baseline and 12-, 30-, and 48-month follow-up interview data for those who completed 48-month interviews; (2) annual social security earnings records; and (3) McConnell and Glazerman (2001).
aAssumes that impacts on earnings do not decay after the observation period.
bBecause of rounding, net benefits may not equal the sum of the rows. Similarly, benefits to society may not precisely equal the sum of the benefits to participants and the benefits to the rest of society.