Embed Size (px)
Citation preview
1
UNIVERSITÀ CATTOLICA DEL SACRO CUORE
Sede di Piacenza
Dottorato per il Sistema Agro-alimentare
Ph.D. in Agro-Food System
cycle XXXIII
Impact and prevention of groundwater pollution by
pesticides and nitrate in hilly vineyards: evaluation of
contamination sources and development of best management
practices and mitigation measures
Candidate: Roberta Zambito Marsala
Matr. n.: 4713601
Academic Year 2019/2020

2
3
Dottorato per il Sistema Agro-alimentare
Ph.D. in Agro-Food System
cycle XXXIII
S.S.D: AGR/13 – CHIM/01
Impact and prevention of groundwater pollution by pesticides and nitrate
in hilly vineyards: evaluation of contamination sources and development
of best management practices and mitigation measures
Coordinator: Ch.mo Prof. Paolo Ajmone Marsan
Candidate: Roberta Zambito Marsala
Matriculation n.: 4713601
Tutor: Prof. Ettore Capri, Dott. Nicoleta Suciu
Academic Year 2019/2020

4

5
“If there is magic on this planet, it is contained in water”
Loren Eiseley

6
Contents
Thesis outline
UNIVERSITÀ CATTOLICA DEL SACRO CUORE………………………………………………………...3
Chapter 1. General introduction and objectives………………………………………………………………..7
The context and background…………………………………………………………………………………...9
Chapter 2. Assessment of groundwater contamination by plant protection products and pollution source .... 41
Chapter 2.1 First evaluation of pesticides occurrence in groundwater of Tidone Valley, an area with intensive
viticulture ......................................................................................................................................................... 42
Chapter 2.2. Evaluation of groundwater contamination sources by plant protection products in hilly
vineyards of Northern Italy.............................................................................................................................. 83
Chapter 3. Influence of nitrogen-based fertilization on nitrates occurrence in groundwater of hilly vineyards
....................................................................................................................................................................... 113
Chapter 4. Multi-actor approach and engagement strategy to promote the adoption of Best Management
Practices and a Sustainable Use of Pesticides for groundwater quality improvement in hilly vineyards ..... 153
Chapter 5. General conclusion………………………………………………………………………………183
Acknowledgements………………………………………………………………………………………….187

7
Chapter 1
1. General introduction and objectives
Many anthropic activities, including the agricultural and food industries, give rise to environmental problems
for which it is necessary to find solutions.
The presence of undesirable substances in water, soil and foodstuffs, indeed, can pose a risk to the health and
hygiene of both men and animals. It is, therefore, essential to find methods in order to avoid pollutants from
these matrices, so as to make them compatible with the maintenance of healthy environmental conditions. This
work aims to assessing the groundwater quality of an area in which the quality of water was never studied,
particularly investigating the occurrence of pesticides and nitrate in order to understand the grant of viticulture
on water pollution. This study derives from the necessity to improve the water governance and to implement
the best management practices and mitigation measures to prevent groundwater and environmental pollution.
This thesis is part of a broader project which aims to contribute to a better knowledge and understanding of
how water governance is organized at catchment level and how the agricultural activities can be improved in
order to limit their impact on groundwater. The Italian case study considers three catchments in Tidone Valley,
northern Italy, characterized by an intensive viticulture production.
In particular the major purposes of this thesis are:
- Investigate the impact of viticulture on groundwater quality by pesticides and nitrate in Tidone Valley,
an area where the quality of groundwater was never investigated before, through monitoring studies;
- Understand the groundwater contamination source by pesticides and nitrate through isotopic studies
and by collecting and integrating monitoring data, sub-surface water movement data and territorial
characteristics;
- Develop an engagement strategy to prevent groundwater contamination by pesticides involving all
stakeholders with a role in water governance;
- Raise awareness concerning groundwater contamination issues and consequently the water benefits
given by the adoption of the Best Management Practices to the farmers of the study area.
8
- Contribute to a better knowledge and understanding of how water governance is organized at
catchment level and how the agricultural activities can be improved in order to limit their impact on
drinking water.

9
2. The context and background
2.1 Environmental pollution by anthropogenic compounds
The earth system is entering a new epoch—the Anthropocene—which is characterized by significant global
environmental impacts mainly driven by human activities (Steffen et al. 2011).
The ambition of mankind to improve life quality has great benefits for humanity but has also strongly affected
the environment for centuries. According to the Nobel Prize chemist Paul Crutzen, our planet has entered the
Anthropocene, a new epoch that is dominated by intense human activities causing global environmental
changes (Crutzen, 2002). Nowadays, an incredibly large variety of compounds of anthropogenic origin is
present in the environment all over the world and threatens environmental quality and human health
(Hutzinger, 2013; Lewis and Maslin, 2015). Among these compounds, pesticides represent one of the few
chemicals that are intentionally released at large scales into the environment (e.g. into agro-ecosystems to
protect crops). As a result of their widespread use, in fact, pesticide residues together with chemical fertilizers
such as nitrogen, are major environmental contaminants contributing to environmental pollution (Rathore and
Nollet, 2012). This paradox has its origin in weighing up pesticide benefits against pesticide hazards (Storck,
2016).
2.2 Pesticides and chemical fertilizers
Any substance or mixture of substances intended for preventing, destroying, repelling, or mitigating any pest
or weed is a pesticide. Pesticides are mainly known as plant protection products (PPPs) but while the term
'pesticide' is something that prevents, destroys, or controls a harmful organism ('pest') or disease, or protects
plant products during production, storage and transport, PPPs are 'pesticides' that protect crops or desirable or
useful plants. They contain at least one active substance and have one of the following functions:
- protect plants or plant products against pests/diseases, before or after harvest
- influence the life processes of plants (such as substances influencing their growth, excluding nutrients)
- preserve plant products
- destroy or prevent growth of undesired plants or parts of plants.
10
The term 'pesticide' is often used interchangeably with 'plant protection product', however, pesticide is a
broader term that also covers non plant/crop uses, for example biocides
(https://ec.europa.eu/food/plant/pesticides_en). However in the text both the terms “PPPs” and "pesticides" are
used.
PPPs can be classified according to their target, their mode or period of action, or their chemistry. More than
500 different pesticide formulations are being used in our environment, mostly in agriculture (Azevedo, 1998),
although the control of biological public health hazards also continues to be an important field of application.
Today, around 2.4 million tons of PPPs (active substances) are released into the environment worldwide each
year (U.S. EPA, 2011), whereof 80% are used in agriculture (Enserink et al., 2013). PPPs can be distinguished
with three majorly used groups: insecticides used against insects, herbicides used for growth control of various
weeds, and fungicides effective to control fungal diseases (Gilden et al., 2010), which account for 30 %
(insecticides), 40 % (herbicides) and 10 % (fungicides) of the global pesticide market (Enserink et al., 2013).
PPPs contribute to high agricultural yields and help in ensuring that good quality food is available at reasonable
prices. However at the same time they can have negative effects on human health and the environment, which
represent high costs for society.
In addition, the PPPs use can cause effects on non-target organisms, including human. Non-target pesticide
poisoning has been identified as the cause of fish kills, reproductive failure in birds, and illness in humans
(Rao et al., 1993). In fact, it has been estimated that less than 0.1% of the pesticide applied to crops actually
reaches the target pest; the rest enters the environment, contaminating soil, water and air, where it can poison
or otherwise adversely affect non-target organisms (Pimentel and Levitan, 1986). Indeed, often, measurements
indicate the occurrence of PPPs on non-agricultural land as in groundwater. In particular, PPPs represent a
potential threat to the quality of extracted groundwater when the water-supply area is used for agricultural
activities (Gaus, 2000). In this regard, particular attention is paid for PPP contamination of surface and
groundwater, and appropriate measures to reduce exposure of water bodies to nonpoint sources (spray drift,
drain flow, and runoff) and point sources (pesticide handling procedures) should be adopted (Suciu et al., 2013;
The European Parliament and the Council of the European Union. 2009).
However, if PPPs are applied under appropriate cropping and climatically conditions in prescribed amounts
using modern techniques according to good farming practices, they can be effective in pest control with little

11
adverse effects on the surrounding environment. Therefore, the European Community has developed a
comprehensive regulatory framework in order to minimize negative effects as much as possible. For example,
the enforcement of the European directive 2009/128/EC is determining for all the European Member States to
develop National Plans aimed at setting quantitative objectives, targets, measures, timetables and indicators
for reducing the risks and impacts of pesticide use on human health and the environment and at encouraging
the development and introduction of integrated pest management.
Different international regulatory bodies such as the European Union (EU), the United States Environmental
Protection Agency (US EPA) and the World Health Organization (WHO) established maximum allowed
concentrations for PPPs in drinking water (Donato et al., 2015) that in most of the cases correspond to the
Environmental Quality Standards for groundwater (EQSgw; equal to 0.1 μg/L and 0.5 μg/L, respectively for
the single substance and for the sum of the substances), established by Directive 2006/118/EC (EC, 2006).
Another big issue is represented by the excessive use of chemical fertilizers (i.e. nitrogen-based fertilizers),
which can lead to the nitrate contamination. In fact, in Italy, as in the rest of Europe, nitrate contamination in
surface and groundwater is a widespread phenomenon especially in the North-Centre, where agriculture is the
main nitrogen input (Balestrini et al., 2003). In particular, nitrogen fertilizers are applied extensively in
agriculture to increase crop production, but excess nitrogen supplies can cause air, soil, and water pollution as
well. Arguably one of the most widespread and damaging impacts of agricultural overapplication of nitrogen
fertilizers is the degradation of groundwater quality and contamination of drinking water supplies, which can
pose immediate risks to human health (Schroeder et al., 2004).
Indeed, groundwater contamination by nitrate and other nutrients is a major problem throughout the world,
often occurring as the result of anthropogenic activities, lack of management, and over-exploitation of
groundwater resources. In the last few decades in the majority of the Italian regions, the nitrate concentrations
in groundwater have dramatically increased, mainly as a consequence of the large-scale agricultural application
of manure and fertilizers (Pisciotta et al., 2015).
Nitrate is the primary form of inorganic nitrogen within the soil, which is essential for the growth and
development of healthy crops. It has been shown in vivo that nitrite derived from nitrate can form N-nitroso
compounds with amines and amides, which may have carcinogenic properties (Van Maanen et al., 1996). The
EU Directive 91/676/EEC, which protects waters against pollution caused by nitrates from agricultural

12
sources, sets the acceptable threshold of nitrate concentration in groundwater at 50 mg/l as nitrate. The EU
Directive 2006/118/EC also attempts to protect groundwater against pollution and deterioration by suggesting
that Member States establish quality standards, develop methodologies for assessing and monitoring
groundwater quality, and implement measures supporting groundwater protection, including changes to
farming and forestry practices (Wick et al., 2012).
The prevention, control and combat of groundwater pollution are addressed in various European Union (EU)
and national legislative acts, since groundwater is considered a valuable natural source. The EU Water
Framework Directive (2000/60/EC, 2000), WFD, and its daughter Directive on the Protection of groundwater
against Pollution (2006/118/EC, 2006), GWD, establish criteria for the definition of groundwater status
(quality and quantity). Moreover, the Nitrates Directive (91/676/EEC, 1991) is an integral part of the WFD
and it was drawn up with the specific purpose to reduce water pollution caused by nitrate from agricultural
sources and prevent further such pollution. In this regard, EU members are required to identify waters affected
by nitrate pollution, designate nitrate vulnerable zones (NVZs) and several spatial analysis techniques were
adopted to identify them. Italy formally acknowledged this directive in 1999 and in 2006 with the Italian
Legislative Decree 152/06, 2006, Italian Legislative Decree 152/99, 1999. This national regulation suggests a
parametric system based on empirical relationships between the soil or sub-soil characteristics and Nitrogen
leaching risk.
2.3 Environmental risk assessment of PPPs
PPPs use in agriculture can cause undesirable effects on humans and the natural environment, and one of the
objectives of integrated agriculture is the elimination or reduction of possible sources of environmental
pollution such as PPPs. To achieve this objective, farmers need a method to assist them in estimating the
environmental impact of PPP use (Van der Werf, 1996). The environmental impact of a PPP depends on its
dispersion in the environment and on its toxicological properties.
In the European Union (EU), a statutory PPP authorization process is the prerequisite for the market permission
of a pesticide. After the invention of a new pesticide, its behavior in the environment and its potential hazards
for non-target organisms are investigated during an environmental risk assessment procedure at EU and
national level prior to its authorization. Only active substances that are registered on the EU’s list of approved
13
active substances and subsequently authorized as PPPs by each EU Member State are released into the
environment (Storck, 2016). Despite these efforts to minimize environmental risks, the safe use of PPPs
appears to be one of the biggest challenges of sustainable agriculture, because pesticide residues remain one
of the most widespread pollutant groups worldwide (Rathore and Nollet, 2012).
The PPP risk analysis process, therefore, is well regulated in the EU in order to avoid risks for human health
and environment in the use phase, information on how these substances are employed and on socio-behavioral
factors that can influence the exposure have to be considered (Calliera et al., 2015).
Over the last decades, agriculture and crop management practices have shown deep changes, to allow the
extension of cropped areas ensuring an efficient control of pest populations and diseases. PPPs are part of these
management practices, and the catalogue of products available to farmers has followed a parallel evolution to
match farmers’ expectations regarding efficacy and safety, but also the expectations of the public. The
regulatory framework ruling the placing on the market of PPPs, as well as aspects of their use reflect these
changes and shape the conditions of their use on a sustainable way. EC Regulation No. 1107/2009 bases the
placing of pesticide products on the market on the demonstration that their use complies with defined
protection goals guaranteeing a high level of safety for humans and the environment. Directive 2009/128/EC
also called the “Sustainable Use Directive” extend the set of measures that, from the training and certification
of users to the control of application machines and the development of effective alternative methods, should
improve the safety level over the whole process (Alix and Capri, 2018).
In addition, although PPPs are already regulated in Europe under Directive 91/414/EEC, there is particular
increasing concern about the pollution of ground and surface water caused by point sources of PPPs, such as
tank filling, spillages, faulty equipment, washing, waste disposal, and direct contamination (Fait et al., 2007).
The European Union (EU) strategy for sustainable development, revised in 2006, indicated sustainable
consumption and production as key challenges for the future. From the regulatory point of view in the
development of environmental and human health policies, this requires deciding which economic sectors,
products and resources should be subject to political regulatory intervention. In agriculture, PPPs control, for
which the perception of risk is substantial as they are deliberately released into the environment, and the
sustainability of their use, is one of the most important aspects. To achieve more sustainable use of PPPs, in
2009 the European Parliament and the Council approved Directive 128 for the sustainable use of pesticides
14
which provides measures to establish and reduce the overall risk that PPPs pose to human health and to the
environment during their use. According to this Directive, EU Member States have to establish National Action
Plans to set objectives, targets and measures to reduce risks and impacts of pesticide use on human health and
the environment and to encourage integrated pest management. Training has a strategic role to achieve all the
objectives that the Directive sets for the EU Member States, who must ensure that all professional users,
distributors and advisers have access to ‘appropriate training by bodies designated by the competent
authorities’ (Calliera et al., 2013).
2.4 Sustainable use of PPPs
Sustainability in agriculture is an important goal for many farmers and agronomists (Medrano et al., 2014).
The Sustainable Use Directive (SUD; 2009/128/EC) is a Community action aiming at the sustainable use of
chemicals like PPPs. It aims at improving use and handling of pesticides, and mitigating human and
environmental exposure. Focus areas of the SUD including training pesticide users, inspection of PPP
applicators, and ensuring local processes and infrastructures are in place to manage waste and remnants. The
SUD addresses poor use and handling of pesticides on farm to prevent “point source” contamination, e.g.,
spills or waste water from rinsing pesticide application equipment. That is why Member States’ National
Action Plans also include measures that promote good agricultural practices, tailored to local conditions, to
help with preventing “diffuse source” contamination from the field, e.g., runoff (Singh et al., 2018). As with
the Water Framework Directive (2000/60/EC), the implementation of the SUD is challenged. Indeed, the
implementation across Member States is reported to be inconsistent and the measures implemented not
sufficient to deliver improvements in the sustainable use of PPPs. However, the execution of suitable remedial
measures facilitates to reduced incidents of pesticide toxicity and other health issues linked to usage of PPPs.
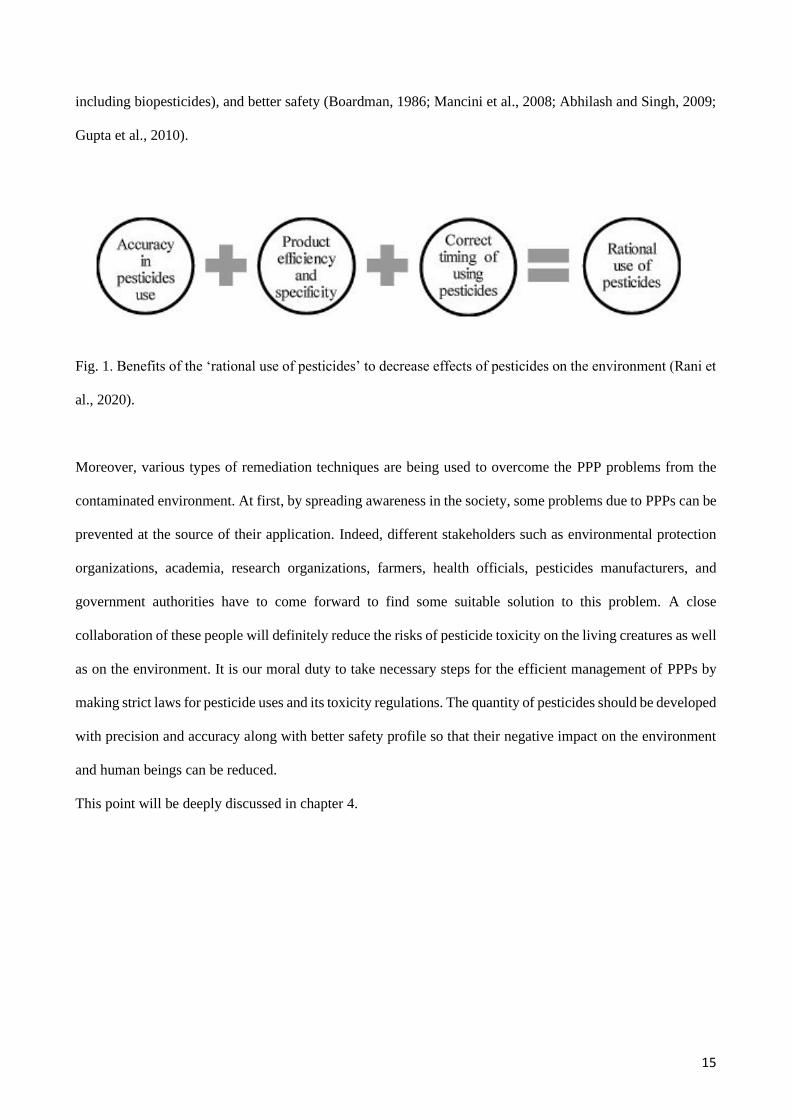
The rational usage of pesticides (RUP), is a term invented in the label of a book written by Brent and Atkin
(1987). RUP (Fig 1) mainly emphasized on the sub-set of integrated crop management (ICM), which efforts
to moderate the harmful influences of PPP usage through better specificity and accuracy in PPP usage with
space as well as time of the products themselves. The advantages of RUP are enhanced by a mixing of all
three, and the promising advantages including decreased expenses (for pesticides as well as labour), decreased
environmental influence (by additional efficient application of sprays and usage of the selective compounds
15
including biopesticides), and better safety (Boardman, 1986; Mancini et al., 2008; Abhilash and Singh, 2009;
Gupta et al., 2010).
Fig. 1. Benefits of the ‘rational use of pesticides’ to decrease effects of pesticides on the environment (Rani et
al., 2020).
Moreover, various types of remediation techniques are being used to overcome the PPP problems from the
contaminated environment. At first, by spreading awareness in the society, some problems due to PPPs can be
prevented at the source of their application. Indeed, different stakeholders such as environmental protection
organizations, academia, research organizations, farmers, health officials, pesticides manufacturers, and
government authorities have to come forward to find some suitable solution to this problem. A close
collaboration of these people will definitely reduce the risks of pesticide toxicity on the living creatures as well
as on the environment. It is our moral duty to take necessary steps for the efficient management of PPPs by
making strict laws for pesticide uses and its toxicity regulations. The quantity of pesticides should be developed
with precision and accuracy along with better safety profile so that their negative impact on the environment
and human beings can be reduced.
This point will be deeply discussed in chapter 4.

16
2.5 Chemical fertilizers and PPPs: role in groundwater contamination
Agriculture has been an important practice to sustain the life-support systems of human civilizations since
ancient times. Modern agriculture has included several innovative ideas to enhance crop production such as
the applications of chemical fertilizers and PPPs in farming. Addition of chemical fertilizers and PPPs has
become the fundamental part of today’s agricultural systems to fulfill the huge demand of food grains of the
whole world. However, excessive application of agrochemicals is deteriorating the quality of soil as well as
groundwater due to the addition of nitrogen, phosphorous, and persistent pesticides. Groundwater
contamination, in fact, poses several human health problems as it is the main source of safe drinking water
(Srivastav, 2020).
Most problems related to water quality are caused as well as by intensive agriculture, also by industrial
production, mining and untreated urban runoff and wastewater. Expansion of industrial agriculture, indeed,
has led to increases in fertilizer applications. These and other industrial water pollutants create environmental
and health risks: for example, excessive loads of nitrogen, which represents the most common chemical
contaminant in the world’s freshwater resources (WWAP, 2009), contribute to the eutrophication of freshwater
and coastal marine ecosystems, creating ‘dead zones’ and erosion of natural habitats (WWAP, 2013).
Over the past several decades, ever-growing demands for – and misuse of – water resources have increased
the risks of pollution and severe water stress in many parts of the world. Although the central and irreplaceable
roles that water occupies in all dimensions of sustainable development have become progressively recognized,
the management of water resources and the provision of water-related services remains far too low on the
scales of public perception and of governmental priorities. As a result, water often becomes a limiting factor,
rather than an enabler, to social welfare, economic development and healthy ecosystems (WWAP, 2015).
Moreover, agricultural water quality has been identified as a major environmental issue in Organization for
Economic Co-operation and Development (OECD) countries, and as a topic for policy analysis, is an issue of
relevance across all OECD countries. The primary agricultural sector is mainly responsible for nitrate,
phosphorus, PPP, soil sediment, salt, and pathogen pollution of water from crop and livestock activities, but it
can also play a role under certain farm practices in terms of improving water quality through a water
purification function (Parris, 2011). In the European Union, 38% of water bodies are significantly under

17
pressure from agricultural pollution (WWAP, 2015) and this causes greater awareness and growing concern
on the part of the population towards agricultural practices related to aquatic ecosystems.
Following the growing food demand in relation to population growth and changes in dietary patterns,
agricultural pressures on water quality, also coming from livestock and animal husbandry, have intensified.
The degradation of water quality can also have serious direct consequences on the aquatic ecosystem, on
biodiversity, on fishing and on productivity in general.
Management of the nitrogen cycle has been identified as a major challenge across most of the region, and
improving the handling of nutrients in agriculture plays a key role in addressing the related problems.
Water quality in rural areas is largely depending on farming practices. Despite numerous efforts to reduce
nutrient and pesticide concentrations in surface water and groundwater and regulation (Nitrates Directive
(91/676), Water Framework Directive (2000/60), Groundwater Daughter Directive (2006/118), Directive on
Environmental Quality Standards (2008/105), Sustainable Use Directive (2009/128)), many water bodies are
not in good status for nitrates and hot spots of contamination for phosphorous and PPPs persist. The stagnation
of the water quality is not only due to a long-term storage of the agrochemicals in soil and groundwater systems
but also to the lack of implementation of good agricultural practices and mitigation measures that prevent the
chemicals to enter the water system. Over the past two to three decades, our understanding of the functioning
of the water system and the effect of farming practices and mitigation measures has increased tremendously,
but somehow we fail to convert that knowledge into actual implementation at a scale which is necessary to
create real improvement of water quality. We think that a paradigm shift from purely top-down regulation and
enforcement to local actor engagement is needed to revert the trend (Belmans et al., 2018). In this regard,
implementation of sustainable agricultural practices and mitigation measures can prevent the groundwater
contamination from these agrochemicals along with high crop yield as well as safeguards to the environmental
ecosystems. Moreover, it also promotes the use of biologically originated fertilizers and PPPs via giving equal
importance to the local/traditional knowledge and innovative farming techniques (Srivastav, 2020).
Therefore, in the chapter 4 of this thesis is presented a multi-actor approach to engage actors at the scale of
water system catchment or a so-called action lab. Within an action lab, key actors are involved in setting up
new governance strategies including participatory monitoring approaches, best management practices, and
collaborative software applications to facilitate the process of implementation of mitigation measures.
18
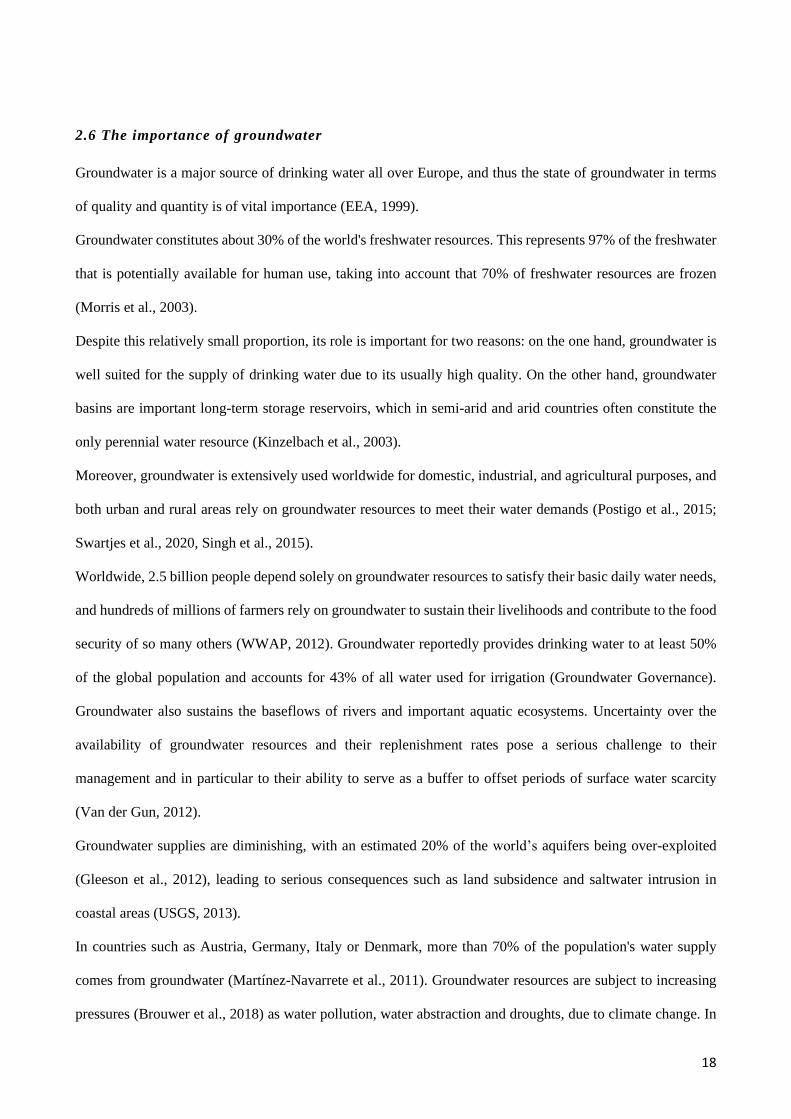
2.6 The importance of groundwater
Groundwater is a major source of drinking water all over Europe, and thus the state of groundwater in terms
of quality and quantity is of vital importance (EEA, 1999).
Groundwater constitutes about 30% of the world's freshwater resources. This represents 97% of the freshwater
that is potentially available for human use, taking into account that 70% of freshwater resources are frozen
(Morris et al., 2003).
Despite this relatively small proportion, its role is important for two reasons: on the one hand, groundwater is
well suited for the supply of drinking water due to its usually high quality. On the other hand, groundwater
basins are important long-term storage reservoirs, which in semi-arid and arid countries often constitute the
only perennial water resource (Kinzelbach et al., 2003).
Moreover, groundwater is extensively used worldwide for domestic, industrial, and agricultural purposes, and
both urban and rural areas rely on groundwater resources to meet their water demands (Postigo et al., 2015;
Swartjes et al., 2020, Singh et al., 2015).
Worldwide, 2.5 billion people depend solely on groundwater resources to satisfy their basic daily water needs,
and hundreds of millions of farmers rely on groundwater to sustain their livelihoods and contribute to the food
security of so many others (WWAP, 2012). Groundwater reportedly provides drinking water to at least 50%
of the global population and accounts for 43% of all water used for irrigation (Groundwater Governance).
Groundwater also sustains the baseflows of rivers and important aquatic ecosystems. Uncertainty over the
availability of groundwater resources and their replenishment rates pose a serious challenge to their
management and in particular to their ability to serve as a buffer to offset periods of surface water scarcity
(Van der Gun, 2012).
Groundwater supplies are diminishing, with an estimated 20% of the world’s aquifers being over-exploited
(Gleeson et al., 2012), leading to serious consequences such as land subsidence and saltwater intrusion in
coastal areas (USGS, 2013).
In countries such as Austria, Germany, Italy or Denmark, more than 70% of the population's water supply
comes from groundwater (Martínez-Navarrete et al., 2011). Groundwater resources are subject to increasing
pressures (Brouwer et al., 2018) as water pollution, water abstraction and droughts, due to climate change. In

19
Europe, 25 % of groundwater has poor chemical status (EEA, 2018), and particularly, agricultural non-point
source pollution has been increasingly recognized as a primary contributor to water quality impairment and as
a key water quality problem worldwide (Kourakos et al., 2012). Nowadays, within a generation, a global water
crisis has developed, due to poor resource management since the scientific evidence has been clear, that water
withdrawals exceed natural rates of renewal. For groundwater, indeed, it is vital that finite amounts of any
renewable resource can be recognized and quantified (Edmunds, 2003).
European Environmental Agency identifies 29% of 35% of diffuse pollution in agriculture and many authors
do not associate point pollution with agriculture, except with livestock farms and manure depots (e.g.
Balderacchi et al., 2013; Parris, 2011). The overall growth of agricultural production has been achieved mainly
through intensive use of inputs, as PPPs and nitrogen-based fertilizers.
As mentioned before, PPPs in drinking water are currently regulated by the Drinking Water Directive using a
maximum allowable concentration of 0.1 μg/L. This standard (a surrogate zero) was consistent with the
precautionary principle when it was originally set in 1980 and remained consistent when retained in 1998.
However, given developments in EU pesticide and water policy, international experience in regulating
pesticides, and an increasing knowledge of pesticide toxicity, it can be argued that the level of epistemic
uncertainty faced by regulators has substantially decreased (Dolan et al., 2014).
Based on what has been argued, it can be concluded that a constant monitoring of the most vulnerable
ecosystems to contamination, represents a primary importance.

20
2.7 Groundwater monitoring
Groundwater monitoring is considered a higher tier assessment in the regulatory groundwater assessment of
PPPs in the European Union (EU Commission, 2014). In fact, in order to determine if groundwater is
adequately protected against leaching of active substances and their metabolites used in PPPs, groundwater
monitoring is considered a fundamental approach. The recently published report “Conducting Ground Water
Monitoring Studies in Europe for Pesticide Active Substances and their Metabolites in the Context of
Regulation (EC) 1107/2009” was prepared by advisory group SETAC EMAG-Pest GW, and provides
recommendations on study design and study procedures, with specific emphasis on vulnerability assessment
and mapping of monitoring sites. Vulnerability, in the context of groundwater monitoring for pesticides,
usually refers to the vulnerability of groundwater to leaching of these compounds from the topsoil.
Understanding groundwater vulnerability is crucial for the design and interpretation of groundwater
monitoring studies.
In the European Union, placing a PPP on the market is regulated by Regulation (EC) No. 1107/2009 and its
associated implementing Regulations (i.e., 546/2011 on uniform principles, plus 283/2013 and 284/2013 on
data requirements). Regulation 284/2013 requires estimating concentrations in groundwater (PECgw) of the
active substance and all metabolites identified as part of the residue definition for risk assessment with respect
to groundwater. Therefore, monitoring is useful for determining whether groundwater is being adequately
protected against leaching of active substances and their metabolites (biotic or abiotic degradation products)
under relevant field conditions and it is considered the highest tier of assessment also in the FOCUS
groundwater assessment scheme for assessing potential impacts of active substances and their metabolites
(FOCUS, 2009; European Commission 2014).
Decree no. 152/1999, for example, introduced the ‘integrated system for monitoring and control’ of water
resources for quality and quantity. This monitoring system is based upon the DPSIR model (Determinant-
Pressure-Status-Impact-Response, i.e. the analysis of driving forces that can assert pressure on the state of
water bodies) and it is very important in order to plan actions as part of the Water Protection Plan.
In Italy, in 2007, the situation was as follows: 48% (1,014) of monitored sites falled into quality class 1 (very
good) and 2 (good), 32% falled into class 3 (sufficient) and the remaining 20% of sites were of poor quality
(Fig. 2) (Balzarolo et al., 2011).

21
A study of a groundwater monitoring in an area situated in the North-West of Italy is reported in chapter 2.1
and it represents a first evaluation of groundwater quality by PPPs occurrence.
Fig. 2. Percentage distribution of the classes of the Ecological Status Watercourses quality index.
(ISPRA, 2009)
2.8 Pesticides fate and the ways of water contamination
The greatest concern regarding human exposure to pesticides is their presence in water (Younes and Galal-
Gorchev, 2000) especially that used for drinking.
All pesticides in groundwater, and most residues present in surface water enter via the soil. There are two main
routes by which pesticides enter the soil: spray drift to soil during foliage treatment plus wash-off from treated
foliage (Rial-Otero et al., 2003) and release from granulates applied directly to the soil (López-Pérez et al.,
2006) (Fig. 3).

22
Fig. 3. Pathways of a pesticide applied to a crop. Ideally, at least one includes its contact with the targeted
pest (Arias-Estévez et al., 2008).
Groundwater resources in particular, are subject to increasing pressures from both point and diffuse pollution
sources (Brouwer et al., 2018). Diffuse sources, particularly from agriculture (35 %), and point sources (14 %)
are the main pressures on groundwater chemical status (EEA, 2018).
Diffuse agricultural pollution poses significant pressure on 38% of the European union’s (EU) water bodies.
the EU water blueprint also identifies the need to tackle diffuse pollution using different approaches to
accommodate the wide range of agricultural systems (WWDR, 2015).
Diffuse pollution can be caused by a variety of activities that have no specific point of discharge. Agriculture
is a key source of diffuse pollution, but urban land, forestry, atmospheric deposition and rural dwellings can
also be important sources (EEA, 2020).
Non-point source pollution generally results from land runoff, precipitation, atmospheric deposition, drainage,
seepage or hydrologic modification and, unlike pollution from industrial and sewage treatment plants, comes
from many diffuse sources. As runoff from precipitation moves, it picks up and transports pollutants resulting
from nature and human activity, ultimately depositing them into rivers, lakes, wetlands, and groundwater (Lam
et al., 2011).
In addition, agricultural diffuse pollution has been increasingly recognized as a primary contributor to water
quality impairment and as a key water quality problem worldwide (Kourakos et al., 2012).
This kind of source pollution can includes:
- Excess fertilizers, herbicides and insecticides from agricultural lands and residential areas
- Oil, grease and toxic chemicals from urban runoff and energy production
- Sediment from improperly managed construction sites, crop and forest lands, and eroding streambanks
- Salt from irrigation practices and acid drainage from abandoned mines
- Bacteria and nutrients from livestock, pet wastes and faulty septic systems
- Atmospheric deposition and hydro modification

23
By its very nature, the management of diffuse pollution is complex and requires the careful analysis and
understanding of various natural and anthropogenic processes. As the name suggests, non-point source areas
can be difficult to characterize due to spatial and temporal heterogeneity (Rao et al., 2009). States report that
nonpoint source pollution is the leading remaining cause of water quality problems. The effects of nonpoint
source pollutants on specific waters vary and may not always be fully assessed. However, we know that these
pollutants have harmful effects on drinking water supplies, recreation, fisheries and wildlife (EEA, 2017).
On the other hand there is the point sources contamination, which is mainly linked to the filling and cleaning
area on the farm. Indeed, the most direct losses are related with spillages resulting from the filling operation,
spray excess and technical rest volumes in the tank, leakages of the spray equipment, pump and booms, rinsing
water from cleaning the internal tank to avoid carry over effects onto the following crop, water from external
cleaning of spray equipment, etc. (Isensee and Sadeghi, 1996). The term "point source" means any discernible,
confined and discrete conveyance, including but not limited to any pipe, ditch, channel, tunnel, conduit, well,
discrete fissure, container, rolling stock, concentrated animal feeding operation, or vessel or other floating
craft, from which pollutants are or may be discharged. This term does not include agricultural storm water
discharges and return flows from irrigated agriculture (EEA, 2017). For this reason, identify the source of
contamination allows to effectively preventing or reducing groundwater contamination and this is an important
component in groundwater management (Wang et al., 2012). This kind of study was elaborated and will be
discussed in chapter 2.2.
In conclusion, additional technological and infrastructural solutions are required to reduce the direct pesticide
releases. Some possible solutions could include (i) the existence of a filling and loading area on the farmyard
to minimize the release of pesticides (Rose 2001), (ii) the cleaning process of the spray equipment in the field
(Balsari, 2003), and (iii) waste water treatment systems to separate and/or degrade the contaminants from the
water fraction (De La Rocque, 2004; Osaer et al., 2001).
Furthermore, the directive 2006/118/EC of the European Parliament and of the council of 12 December 2006
establishes specific measures to prevent and control groundwater pollution.
24
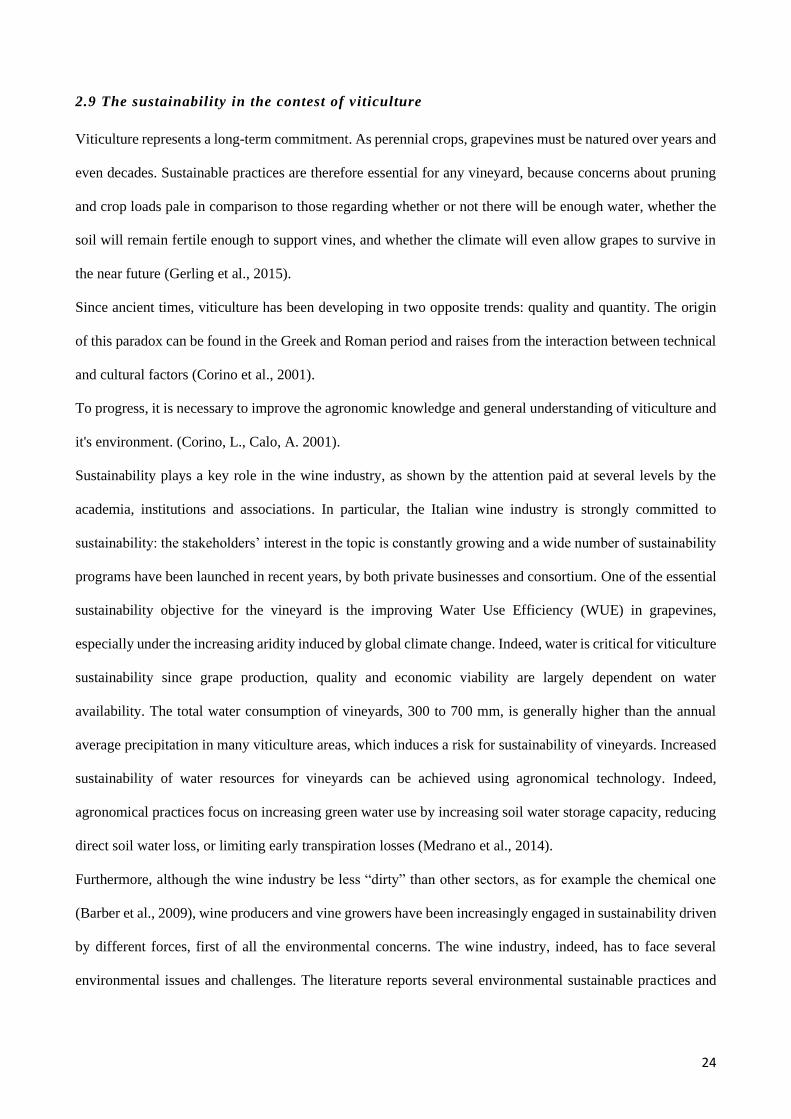
2.9 The sustainability in the contest of viticulture
Viticulture represents a long-term commitment. As perennial crops, grapevines must be natured over years and
even decades. Sustainable practices are therefore essential for any vineyard, because concerns about pruning
and crop loads pale in comparison to those regarding whether or not there will be enough water, whether the
soil will remain fertile enough to support vines, and whether the climate will even allow grapes to survive in
the near future (Gerling et al., 2015).
Since ancient times, viticulture has been developing in two opposite trends: quality and quantity. The origin
of this paradox can be found in the Greek and Roman period and raises from the interaction between technical
and cultural factors (Corino et al., 2001).
To progress, it is necessary to improve the agronomic knowledge and general understanding of viticulture and
it's environment. (Corino, L., Calo, A. 2001).
Sustainability plays a key role in the wine industry, as shown by the attention paid at several levels by the
academia, institutions and associations. In particular, the Italian wine industry is strongly committed to
sustainability: the stakeholders’ interest in the topic is constantly growing and a wide number of sustainability
programs have been launched in recent years, by both private businesses and consortium. One of the essential
sustainability objective for the vineyard is the improving Water Use Efficiency (WUE) in grapevines,
especially under the increasing aridity induced by global climate change. Indeed, water is critical for viticulture
sustainability since grape production, quality and economic viability are largely dependent on water
availability. The total water consumption of vineyards, 300 to 700 mm, is generally higher than the annual
average precipitation in many viticulture areas, which induces a risk for sustainability of vineyards. Increased
sustainability of water resources for vineyards can be achieved using agronomical technology. Indeed,
agronomical practices focus on increasing green water use by increasing soil water storage capacity, reducing
direct soil water loss, or limiting early transpiration losses (Medrano et al., 2014).
Furthermore, although the wine industry be less “dirty” than other sectors, as for example the chemical one
(Barber et al., 2009), wine producers and vine growers have been increasingly engaged in sustainability driven
by different forces, first of all the environmental concerns. The wine industry, indeed, has to face several
environmental issues and challenges. The literature reports several environmental sustainable practices and
25
these aspects are often mentioned as relevant: soil management, water management, wastewater, biodiversity,
solid waste energy use, air quality, and agrochemical use (Ohmart, 2008).
Water must also be managed responsibly by minimizing consumption and reducing run-off of contaminated
wastewater. Moreover, wineries must manage the landscape, to protect the health and safety of workers, as
well as minimize its impact on the community (from chemical spray drifts, odor, and noises) (Gabzdylova et
al., 2009; Barber et al., 2009).
The global wine industry also faces institutional and stakeholders’ pressures. The pressures from governments
and environmental groups, the growing interest from consumers for green products and the higher commitment
to export in countries with a strong attention for “sustainable products” are among the “institutional drivers”
to sustainability (Sinha et al., 2010; Marshall et al., 2005). Finally, managers’ personal values, entrepreneurs’
personal motivations, and employees’ environmental attitudes can be considered as important drivers to guide
the wine industry towards sustainability, given the fact that the sector is mainly made by small-medium
companies, and there is a frequent coincidence between the ownership and the management (Marshall et al.,
2005).
The term “sustainability” also has to be interpreted from a social and economic point of view: only an equal
consideration of the ecological, economic and social dimensions of sustainability can lead to the achievement
of (among the others) “changing unsustainable patterns of production and consumption and protecting and
managing the natural resource base of economic and social development” (United Nations , 2005). Therefore,
the three interdependent and mutually reinforcing pillars of sustainability must always be jointly considered in
order to define viticulture as “sustainable”, promoting aspects such as, the health and safety of workers, the
Company’s contribution to the rural and local development, and the economic viability and profitability of the
measures taken.
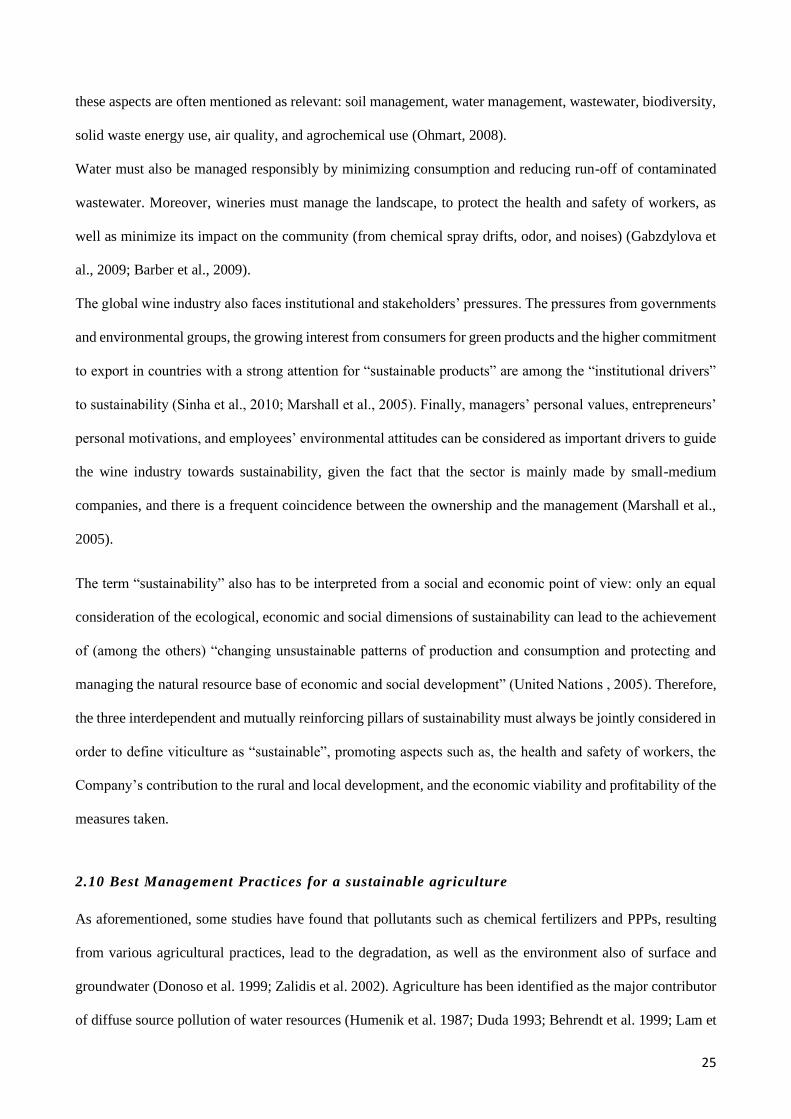
2.10 Best Management Practices for a sustainable agriculture
As aforementioned, some studies have found that pollutants such as chemical fertilizers and PPPs, resulting
from various agricultural practices, lead to the degradation, as well as the environment also of surface and
groundwater (Donoso et al. 1999; Zalidis et al. 2002). Agriculture has been identified as the major contributor
of diffuse source pollution of water resources (Humenik et al. 1987; Duda 1993; Behrendt et al. 1999; Lam et
26
al. 2010). Therefore, application of Best Management Practices (BMPs) is a useful method to eliminate or
minimize pollution resulting from agricultural activities in order to achieve good ecological and chemical
conditions of water quality standard regulated by the European Framework Directive (EC 2000).
BMPs are methods, measures, or practices designed to promote environmental, social and economic
sustainability from the agricultural sector to mitigate the air, soil and water pollution in a sustainable way
(Martinho, 2019). They include structural and non-structural controls as well as operation and maintenance
procedures. The practices can be in varying combinations to prevent or control pollution from a particular non-
point or point source (Logan, 1990). Point and non-point source pollution, indeed, are become a serious
problem causing the impairment of water quality in many European countries.
Research on water quality degradation caused by point and diffuse source pollution plays an important role in
protecting the environment sustainably and implementation of BMPs is challenged by integration of
environmental, economic, and institutional criteria. Assessment of environmental issues in watersheds relates
to social benefits such as achieving the goal of maximum productions, minimum yield reduction, and
unchanged farming habits. Establishment cost and environmental effectiveness of BMPs are often crucial
factors in selecting and adopting BMPs (Arabi et al. 2004). Identifying optimal combination of BMPs requires
systematic approaches that allow decision makers to quickly assess trade-off among environmental and
economic criteria.
Conclusions
Although contaminants like PPPs and nitrates are regulated in Europe, there is increasing concern about the
pollution of environment, particularly of groundwater which is highly affected by the improper usage of
chemicals in the fields. In fact, nowadays, the intensive agricultural activities and the unsustainable use of
PPPs and fertilizers, can potentially cause pollution of the groundwater. In this regard, monitoring studies are
fundamental in order to investigate groundwater quality and thus to find the better solutions for a sustainable
water management. Furthermore, to achieve this purpose, the implementation of Best Management Practices
and mitigation measures is essential.
From the assessment of status, and from the assessment of pressures and impacts, it is evident that the driving
forces behind the achievement or non-achievement of good water status are activities insectors such as
27
agriculture, energy or transport. This integration throughout the river basin is enhanced, for example, by better
cooperation between competent authorities, increased involvement of stakeholders and early participation of
the public. Sustainable water management is a critical element of the green economy because healthy and
resilient ecosystems provide the services needed to sustain human well‑being and, thus, our economy.
Therefore, we need to ensure that economic sectors, such as agriculture energy and transport, also adopt
management practices that can keep water ecosystems healthy and resilient. The WFD is an important policy
to achieve this. The good status objective under the WFD defines these boundaries of sustainability. Managing
water in a green economy means using water in a sustainable way in all sectors and ensuring that ecosystems
have both the quantity and the quality of water needed to function. It also means fostering a more integrated
and ecosystem‑based approach that involves all relevant economic sectors as well as society as a whole (EEA,
2018).
It is therefore of paramount importance to develop new integrated strategies to preserve natural groundwater
quality, to protect it from further contamination and to promote new, sustainable management practices at the
local and regional level. If groundwater resources are carefully managed, they can make a significant
contribution towards meeting water demands, agricultural needs and adapting to global climate change
(WWAP 2012).
To conclude, the prevention of contamination is the primary strategy of water quality management, and the
implementation of best management practices is mandatory to prevent water and environmental pollution.

28
References
Anne Alix, Ettore Capri. 2018. Chapter One - Modern Agriculture in Europe and the Role of Pesticides.
Advances in Chemical Pollution, Environmental Management and Protection, Volume 2, Pages 1-22.
https://doi.org/10.1016/bs.apmp.2018.04.001
Arabi, M., Govindaraju, R. S., & Hantush, M. M. (2004). Watershed management tool for selection and spatial
allocation of non-point source pollution control practices (91 pp.). EPA/600/R-08/036, National Risk
Management Research Laboratory, Office of Research and Development, U.S. Environmental Protection
Agency, Cincinnati, Ohio 45268.
Arias-Estévez, M., López-Periago, E., Martínez-Carballo, E., Simal-Gándara, J., Mejuto, J., C., García-Ríod,
L. The mobility and degradation of pesticides in soils and the pollution of groundwater resources. Agriculture,
Ecosystems & Environment, 4, 247-260. https://doi.org/10.1016/j.agee.2007.07.011
Azevedo, A.S.O.N. (1998). Assessment and Simulation of Atrazine as Influenced by Drainage and Irrigation
- An Interface between RZWQM and ArcView GIS, Doctor Thesis, Iowa State University: Ames, Iowa.
Balderacchi, M., Benoit, P., Cambier, P., Eklo, O.M., Gargini, A., Gemitzi, A., Gurel, M., Kløve, B., Nakic,
Z., Predaa, E., Ruzicic, S., Wachniew, P., Trevisan, M., 2013. Groundwater Pollution and Quality Monitoring
Approaches at the European Level. Critical Reviews in Environmental Science and Technology. 43:4, 323-
408. https://doi.org/10.1080/10643389.2011.604259.
Balestrini, R., Arese, C., Delconte, C. 2003. Funzionalità degli ecosistemi acquatici: il ruolo delle fasce riparie
nella dinamica dei nutrienti. Istituto di ricerca sulla acque – CNR, Sezione di Bugherio (Mi).
Balsari P. 2003. Developing international standards concerning sprayer cleaning. Infield sprayer cleaning –
An industry specialist day to review the developments needed to ensure effective in-field sprayer cleaning
methods. Harper Adams University College.
Balzarolo, D., Lazzara P., Colonna, P., Becciu, G., Rana, G. 2011. The implementation of the Water
Framework Directive in Italy.
29
Barber, N., Taylor, C., Strick, S. 2009. Wine consumers’ environmental knowledge and attitudes: Influence
on willingness to purchase. International Journal of Wine.
Barbora Gabzdylova, John F. Raffensperger, Pavel Castka, 2009. Sustainability in the New Zealand wine
industry: drivers, stakeholders and practices. Journal of Cleaner Production, Volume 17, Issue 11,Pages 992-
998. https://doi.org/10.1016/j.jclepro.2009.02.015
Behrendt, H., Huber, P., Opity, D., Scholy, G., Uebe, R. (1999). Nährstof fbilanzierung der Flussgebiete
Deutschlands (373 pp.). UBA-Bericht. Inst. f. Gewässerökologie und Binnenfischerei im Forschungsverbund
Berlin e. V., Berlin.
Brouwer, R., Ordens, C.M., Pinto, R., Condesso de Melo, M.T., 2018. Economic valuation of groundwater
protection using a groundwater quality ladder based on chemical threshold levels. Ecological Indicators. 88,
292-304. https://doi.org/10.1016/j.ecolind.2018.01.041
Brouwer, R., Ordens, C.M., Pinto, R., Condesso de Melo, M.T., 2018. Economic valuation of groundwater
protection using a groundwater quality ladder based on chemical threshold levels. Ecological Indicators. 88,
292-304. https://doi.org/10.1016/j.ecolind.2018.01.041.
Calliera, M., Berta, F., Galassi, T., Mazzini, F., Rossi, R., Bassi, R., Meriggi, P., Bernard, A., Marchis, A., Di
Guardo, A. and Capri, E. (2013), Enhance knowledge on sustainable use of plant protection products within
the framework of the Sustainable Use Directive. Pest. Manag. Sci., 69: 883-888.
https://doi.org/10.1002/ps.3579
Calliera, M., Capri, E., Zambito Marsala, R., Russo, E., Bisagni, M., Colla, R., Suciu, N., 2021. Multi-actor
approach and engagement strategy to promote the adoption of best management practices and a sustainable
use of pesticides for groundwater quality improvement in hilly vineyards. Science of The Total Environment.
https://doi.org/10.1016/j.scitotenv.2020.142251
Calliera, M., Sacchettini, G., Capri, E. 2015. SUPTraining project: development of an e-learning platform for
the sustainableuse of pesticides. Abstract de <<XV SYMPOSIUM IN PESTICIDE CHEMISTRY
ENVIRONMENTAL RISK ASSESSMENT AND MANAGEMENT>>, (Piacenza, 02-04 September 2015 ),
Mattioli 1885, Fidenza 2015: 140-140 [http://hdl.handle.net/10807/71987].

30
Capri, E., Balderacchi, M., Yon, D., Reeves, G., 2005. Deposition and dissipation of chlorpyrifos in surface
water following vineyard applications in northern Italy. Environmental Toxicology and Chemistry. 24, 852-
860. https://doi.org/10.1897/04-151R.1.
Capri, E., Civita, M., Corniello, A., Cusimano, G., De Maio, M., Ducci, D., Fait, G., Fiorucci, A., Hauser, S.,
Pisciotta, A., Pranzini G., Trevisan M., Delgado Huertas, A., Ferrari, F., Frullini, R., Nisi, B., Offi, M., Vaselli,
O., Vassallo, M. 2009. Assessment of nitrate contamination risk: The Italian experience. Journal of
Geochemical Exploration, 102, 71–86.
Corino, L., Calo, A. 2001. Sustainable viticulture: current practices and future developments. Agriculturae
Conspectus Scientificus, 66, 3-11. https://hrcak.srce.hr/12431
Council Directive 91/414/EEC of 15 July 1991 concerning the placing of plant protection products on the
market.
Council Directive 91/676/EEC of 12 December 1991 concerning the protection of waters against pollution
caused by nitrates from agricultural sources.
Crutzen, P.J. 2002. Geology of mankind. Nature 415, 23.
De La Rocque B. 2004. Gestion des effluents phytosanitaires. Phytoma 569 31-3.
DGR 619 08/06/2020. New designation of new Nitrate Vulnerable Zones of agricultural origin. New
designation of areas vulnerable to nitrates of agricultural origin, in implementation of directive 91/676 /EEC
on the protection of waters from pollution caused by nitrates from agricultural sources.
Directive 2006/118/EC of the European Parliament and of the Council of 12 December 2006 on the protection
of groundwater against pollution and deterioration. doi:10.2800/303664
Donato, F., F., Martins, M., L., Munaretto, J., S., Prestes, O., D., Adaime, M., B., Zanella, R. 2015.
Development of a Multiresidue Method for Pesticide Analysis in Drinking Water by Solid Phase Extraction
and Determination by Gas and Liquid Chromatography with Triple Quadrupole Tandem Mass Spectrometry.
J. Braz. Chem. Soc., 26(10). https://doi.org/10.5935/0103-5053.20150192
Donoso, G., Cancino, J., & Magri, A. 1999. Effects of agricultural activities on water pollution with nitrates
and pesticides in the central valley of Chile. Water Science and Technology, 39(3), 49–60.

31
Duda, A. M. 1993. Addressing non-point sources of water pollution must become an international
priority. Water Science and Technology, 28(3–5), 1–11.
EC, 2017, Commission Staff Working Document — Agriculture and Sustainable Water Management in the
EU (SWD (2017) 153 final), European Commission, Brussels.
Els Belmans The Multiactor Approach Enabling Engagement of Actors in Sustainable Use of Chemicals in
Agriculture. In Advances in chemical pollution, environmental management and protection. Vol 2
Sustainable Use of Chemicals in Agriculture Edited by Ettore Capri and Anne Alix, Academic Press (2018)
ISBN: 978-0-12-812866-4 ISSN: 2468-9289
Enserink, M., Hines, P.J., Vignieri, S.N., Wigginton, N.S. and Yeston, J.S. (2013). The Pesticide Planet.
Science 341, 730-731.
EPA, Guidance for Data Quality Assessment. (2000). Practical Methods for Data Analysis.
https://19january2017snapshot.epa.gov/sites/production/files/2015-06/documents/g9-final.pdf
EU, 1991, Council Directive 91/676/EEC of 12 December 1991 concerning the protection of waters against
pollution caused by nitrates from agricultural sources (OJ L 375, 31.12.1991, pp. 1-8) (http://eur-
lex.europa.eu/legal-content/EN/ TXT/?uri=CELEX:31991L0676) accessed 17 April 2018.
European Commission (EC), 2000. Directive 2000/60/EC of the European Parliament and of the Council
establishing a framework for the Community action in the field of water policy. Water Framework Directive.
http://data.europa.eu/eli/dir/2000/60/oj
European Commission (EC), 2014. Assessing Potential for Movement of Active Substances and their
Metabolites to Ground Water in the EU. Report of the FOCUS Ground Water Work Group. EC Document
Reference Sanco/13144/2010 version 3, 513 pp.
European Commission (EC), 2014. Assessing Potential for Movement of Active Substances and their
Metabolites to Ground Water in the EU. Report of the FOCUS Ground Water Work Group. EC Document
Reference Sanco/13144/2010 version 3, 513 pp.
European Environment Agency (EEA). 2017 Report. Air quality in Europe.
32
European Environment Agency (EEA). 2018. European waters. Assessment of status and pressures 2018.
doi:10.2800/303664
European Environment Agency (EEA). 2018. European waters. Assessment of status and pressures 2018.
European Environment Agency (EEA). 2020 Report. European waters.
European Environmental Agency (EEA), 1999. European waters Assessment of status and pressure 2018. EEA
Report, 4/1999. Copenhagen.
European Environmental Agency (EEA), 2018. European waters Assessment of status and pressure 2018.
EEA Report, 7/2018. Luxembourg: Publications Office of the European Union, 2018. doi:10.2800/303664.
European Parliament and the Council of the European Union, 2000. Directive of the European Parliament and
of the Council of 23 October 200 establishing a framework for Community action in the field of water policy,
2000/60/EC.
European Parliament and the Council of the European Union, 2006. Directive of the European Parliament and
of the Council of 12 December 2006 on the protection of groundwater against pollution and deterioration,
2006/118/EC.
European Parliament and the Council of the European Union, 2006. Annex I of the directive of the European
Parliament and of the Council of 12 December 2006 on the protection of groundwater against pollution and
deterioration, 2006/118/EC.
European Parliament and the Council of the European Union, 2009a. Directive of the European Parliament
and of the Council of 21 October 2009 establishing a framework for Community action to achieve the
sustainable use of pesticides. 2009/128/EC.
European Parliament and the Council of the European Union, 2009b. Regulation (EC) of the European
Parliament and of the Council of 21 October 2009 concerning the placing of plant protection products on the
market and repealing Council Directives 79/117/EEC and 91/414/EEC, No 1107/2009.
33
Fait, G., Nicelli, M., Fragoulis, G., Trevisan, M., Capri, E. 2007. Reduction of Point Contamination Sources
of Pesticide from a Vineyard Farm. Environmental Science & Technology, 41, 9, 3302-3308.
https://doi.org/10.1021/es062706k
Francesca Mancini, Aad J. Termorshuizen, Janice L.S. Jiggins, Ariena H.C. van Bruggen. 2008. Increasing the
environmental and social sustainability of cotton farming through farmer education in Andhra Pradesh, India.
Agricultural Systems, Volume 96, Issues 1–3, Pages 16-25. https://doi.org/10.1016/j.agsy.2007.05.001
Gaus, I. 2000. Effects of water extraction in a vulnerable phreatic aquifer: Consequences for groundwater
contamination by pesticides, Sint-Jansteen area, The Netherlands. Hydrogeology Journal 8, 218–229.
https://doi.org/10.1007/s100400050240
Gerling, C. 2015. Environmentally sustainable viticulture: practices and practicality.
Gleeson, T., Wada, Y., Bierkens, M. 2012. Water balance of global aquifers revealed by groundwater footprint.
Nature 488, 197–200. https://doi.org/10.1038/nature11295
Gonzalo C. López-Pérez, Arias-Estévez, M., López-Periago, E., Soto-González, B., Cancho-Grande, B.,
Simal-Gándara, J. 2006. Journal of Agricultural and Food Chemistry, 54 (5), 1797-1803. DOI:
10.1021/jf0525737
Hayo M.G. van der Werf. Assessing the impact of pesticides on the environment, Agriculture, Ecosystems &
Environment, Volume 60 - 81-96. https://doi.org/10.1016/S0167-8809(96)01096-1
Medrano, H., Tomás, M., Martorell, S., Escalona, J., Pou, A., Fuentes, S., Flexas, J., Bota, J.. 2014. Improving
water use efficiency of vineyards in semi-arid regions. A review. Agron. Sustain. Dev. 35:499–517. DOI
10.1007/s13593-014-0280-z
Humenik, F. J., Smolen, M. D., Dressing, S. A. (1987). Pollution form nonpoint sources: Where we are and
where we should go. Environmental Science & Technology, 21(8), 737–742.
Hutzinger, O. (2013). The handbook of environmental chemistry – anthropogenic compounds, 3rd edition,
Springer, Berlin Heidelberg.
34
Isensee, A.; Sadeghi, A. 1996. Effect of tillage reversal on herbicide leaching to groundwater. Soil Science,
Volume 161 - Issue 6 - p 382-389.
ISPRA, 2009. Italian environmental data yearbook 2008. Available online: www.apat.gov.it e
http://annuario.apat.it
Jamshidzadeh, Z., Mirbagheri, S., A. 2011. Evaluation of groundwater quantity and quality in the Kashan
Basin, Central Iran. Desalination, 270, 23-30. https://doi.org/10.1016/j.desal.2010.10.067
Kinzelbach, W., Bauer, P., Siegfried, T., Brunner, P. 2003. Sustainable groundwater management — problems
and scientific tools. Institute for Hydromechanics and Water Resources Management, ETH Zürich,
Switzerland.
Kourakos, G., Klein, F., Cortis A., Harter, T., 2012. A groundwater nonpoint source pollution modeling
framework to evaluate long-term dynamics of pollutant exceedance probabilities in wells and other discharge
locations. Water Resources Research. 48. https://doi.org/10.1029/2011WR010813.
Kourakos, G., Klein, F., Cortis A., Harter, T., 2012. A groundwater nonpoint source pollution modeling
framework to evaluate long-term dynamics of pollutant exceedance probabilities in wells and other discharge
locations. Water Resources Research. 48. https://doi.org/10.1029/2011WR010813.
Lam, Q. D., Schmalz, B., Fohrer, N. 2010. Modelling point and diffuse source pollution of nitrate in a rural
lowland catchment using the SWAT model. Agr Water Manage, (97), 317–325.
Lam, Q., D., Schmalz, B., Fohrer, N. 2011. The impact of agricultural Best Management Practices on water
quality in a North German lowland catchment. Environmental Monitoring and Assessment, 183, 351-379.
https://doi.org/10.1007/s10661-011-1926-9
Rani, L., Thapa, K., Kanojia, N., Sharma, N., Singh, S., Grewal, A., S., Srivastav, A., L., Kaushal, J. 2020. An
extensive review on the consequences of chemical pesticides on human health and environment. Journal of
Cleaner Production, https://doi.org/10.1016/j.jclepro.2020.124657
Lewis, S.L. and Maslin, M.A. 2015. Defining the Anthropocene. Nature, 519, 171-180.

35
Liu, T., Bruins, R., J., F., Heberling, M., T. 2018. Factors Influencing Farmers’ Adoption of Best Management
Practices: A Review and Synthesis. Sustainability, 10, 432. https://doi.org/10.3390/su10020432
Logan, T., J. 1990. Agricultural best management practices and groundwater protection. Journal of Soil and
Water Conservation, 45 (2) 201-206.
Maroni M, Fanetti AC, Metruccio F.. 2006. Risk assessment and management of occupational exposure to
pesticides in agriculture. Med. Lav, 97(2): 430-437.
Marshall, R.S., Cordano, M. and Silverman, M. (2005), Exploring individual and institutional drivers of
proactive environmentalism in the US Wine industry. Bus. Strat. Env., 14: 92-109.
https://doi.org/10.1002/bse.433.
Martínez-Navarrete, C., Jiménez-Madrid, A., Sánchez-Navarro, I., Carrasco-Cantos, F., Moreno-Merino, L.,
2011. Conceptual Framework for Protecting Groundwater Quality. International Journal of Water Resources
Development. 27:1, 227-243. https://doi.org/10.1080/07900627.2010.532476.
Martinho, V., J., P., D. 2019. Best management practices from agricultural economics: Mitigating air, soil and
water pollution. Science of The Total Environment, Volume 688, Pages 346-360,
https://doi.org/10.1016/j.scitotenv.2019.06.199
Morris, B.L.; Lawrence, A.R.L.; Chilton, P.J.C.; Adams, B.; Calow, R.C.; Klinck, B.A. 2003. Groundwater
and its susceptibility to degradation: a global assessment of the problem and options for management. United
Nations Environment Programme, 126pp. http://nora.nerc.ac.uk/id/eprint/19395
Ohmart C. 2008. Innovative outreach increases adoption of sustainable winegrowing practices in Lodi region.
Calif Agr 62(4):142-147. https://doi.org/10.3733/ca.v062n04p142.
Osaer A, Audebert A, Orts R, Thicoipe JP and Zavagli F. 2001. Phytosanitary treatment: effluent management
- risk management techniques. Infos-Ctifl 177 24-27.
P.C. Abhilash, N. Singh. 2009. Pesticide use and application: an Indian scenario. J. Hazard Mater., 165 (1–3),
pp. 1-12. 10.1016/j.jhazmat.2008.10.061
36
Paresha Sinha & Michèle E. M. Akoorie. 2010. Sustainable Environmental Practices in the New Zealand Wine
Industry: An Analysis of Perceived Institutional Pressures and the Role of Exports, Journal of Asia-Pacific
Business, 11:1, 50-74, DOI: 10.1080/10599230903520186
Parris, K., 2011. Impact of Agriculture on Water Pollution in OECD Countries: Recent Trends and Future
Prospects. International Journal of Water Resources Development. 27:1, 33-52.
https://doi.org/10.1080/07900627.2010.531898
Parris, K., 2011. Impact of Agriculture on Water Pollution in OECD Countries: Recent Trends and Future
Prospects. International Journal of Water Resources Development. 27:1, 33-52.
https://doi.org/10.1080/07900627.2010.531898.
Pimentel, D., Berger, B., Filiberto, D., Newton, M., Wolfe, B., Karabinakis, E., Clark, S., Poon, E., Abbett, E.,
Nandagopal, S. 2004. Water Resources: Agricultural and Environmental Issues. BioScience, 54- 909–918.
https://doi.org/10.1641/0006-3568(2004)054[0909:WRAAEI]2.0.CO;2
Pisciotta, A., Cusimano, G., Favara, R. 2015. Groundwater nitrate risk assessment using intrinsic vulnerability
methods: A comparative study of environmental impact by intensive farming in the Mediterranean region of
Sicily, Italy. Journal of Geochemical Exploration, 156, 89-100. https://doi.org/10.1016/j.gexplo.2015.05.002
Postigo, C., & Barceló, D. 2015. Synthetic organic compounds and their transformation products in
groundwater: Occurrence, fate and mitigation. Science of the Total Environment, 503–504, 32–47.
https://doi.org/10.1016/j.scitotenv.2014.06.019
R. Boardman. 1986. Pesticides in world agriculture. International Political Economy Series, Palgrave
Macmillan, London, 10.1007/978-1-349-18231-2
Rathore, H.S. and Nollet, L.M.L. 2012. Pesticides – evaluation of environmental pollution. CRC Press Taylor
& Francis Group.
Rial Otero, R.; Cancho Grande, B.; Arias Estévez, M.; López Periago, E.; Simal Gándara, J. 2003. Procedure
for the measurement of soil inputs of plant-protection agents washed off through vineyard canopy by rainfall
J. Agric. Food Chem. 51, 5041– 5046.
37
Robyn C. Gilden, Katie Huffling, Barbara Sattler, Pesticides and Health Risks, Journal of Obstetric,
Gynecologic & Neonatal Nursing. Volume 39, Issue 1, 2010, Pages 103-110. https://doi.org/10.1111/j.1552-
6909.2009.01092.x.
Rose D. The design of a pesticide handling and washdown facility. 379-384. 2001. Brighton; British Crop
Protection Council: Farnham, UK. Symposium Proceedings No. 78, Pesticide Behaviour In Soil and Water.
Rose, David. Pevalin, David, J. 2001. ‘The National Statistics Socio-economic Classification: Unifying
Official and Sociological Approaches to the Conceptualisation and Measurement of Social Class’ ISER
Working Papers. Paper 2001-4 Colchester: University of Essex.
S. Gupta, A.K. Dikshit. 2010. Biopesticides: an ecofriendly approach for pest control J. Biopestic., 3 (1), pp.
186-188.
Schroeder, J., J., Scholefield, D., Cabral, F., Hofman, G. 2004. The effect of nutrient losses from agriculture
on ground and surface water quality: the position of science in developing indicators for regulation.
Environmental Science & Policy, 7, 15-23. https://doi.org/10.1016/j.envsci.2003.10.006
Shiklomanov, I.A., e Rodda J.C., 2003. World Water Resources at the Beginning of the Twenty-First Century.
International Hydrology series.
Singh, S., Raju, N. J., & Ramakrishna, C. 2015. Evaluation of Groundwater Quality and Its Suitability for
Domestic and Irrigation Use in Parts of the Chandauli-Varanasi Region, Uttar Pradesh, India. Journal of Water
Resource and Protection, 07(07), 572–587. https://doi.org/10.4236/jwarp.2015.77046
Srivastav, A., L. 2020. Chapter 6 - Chemical fertilizers and pesticides: role in groundwater contamination.
Agrochemicals Detection, Treatment and Remediation, Butterworth-Heinemann, Pages 143-159.
https://doi.org/10.1016/B978-0-08-103017-2.00006-4
Suciu, A.N., Ferrari, T., Ferrari, F., Trevisan, M., Capri, E., 2011. Pesticide removal from waste spray-tank
water by organoclay adsorption after field application to vineyards. Environ Sci Pollut Res. 18, 1374-1383.
https://doi.org/10.1007/s11356-011-0494-4

38
Suciu, N., A., Ferrari, F., Vasileiadis, S., Merli, A., Capri, E., Trevisan, M. 2013. Pesticides water
decontamination in oxygen-limited conditions. Journal of Environmental Science and Health, Volume 48,
2013 - Issue 9: Pesticides in the Environment.
Swartjes, F. A., & Van der Aa, M. 2020. Measures to reduce pesticides leaching into groundwater-based
drinking water resources: An appeal to national and local governments, water boards and farmers. Science of
the Total Environment, 699, 134186. https://doi.org/10.1016/j.scitotenv.2019.134186
T. Dolan, P. Howsam, D. J. Parsons, M. J. Whelan. 2014. Impact of European Water Framework Directive
Article 7 on Drinking Water Directive compliance for pesticides: challenges of a prevention-led approach.
Water Policy 1 April 2014; 16 (2): 280–297. https://doi.org/10.2166/wp.2013.166
The European Parliament and the Council of the European Union. 2009. Directive of the European Parliament
and of the council establishing a framework for Community action to achieve the sustainable use of pesticides.
128/EC.
U.S. EPA. Report on the 2011 U.S. Environmental Protection Agency (EPA) Decontamination Research and
Development Conference. U.S. Environmental Protection Agency, Washington, DC, EPA/600/R/12/557,
2012.
United Nations (UN). Resolution adopted by the General Assembly. 60/1. 2005 World Summit Outcome.
Available online: http://unpan1.un.org/intradoc/groups/public/documents/un/unpan021752.pdf (accessed on
11 November 2013).
USGS, 2013. Faundeen, J.L., Burley, T.E., Carlino, J.A., Govoni, D.L., Henkel, H.S., Holl, S.L., Hutchison,
V.B., Martín, Elizabeth, Montgomery, E.T., Ladino, C.C., Tessler, Steven, and Zolly, L.S., 2013, The United
States Geological Survey Science Data Lifecycle Model: U.S. Geological Survey Open-File Report 2013–
1265, 4 p., http://dx.doi.org/10.3133/ofr20131265.
Van Maanen, J., M., Welle, I., J., Hageman, G., Dallinga, J., W., Mertens, P., L., Kleinjans, J., C. 1996. Nitrate
contamination of drinking water: relationship with HPRT variant frequency in lymphocyte DNA and urinary
excretion of N-nitrosamines. Environmental Health Perspective. https://doi.org/10.1289/ehp.96104522

39
Véronika Storck. Assessment of the environmental fate of pesticides and their ecotoxicological impact on soil
microorganisms: the case of chlorpyrifos, isoproturon and tebuconazole. Life Sciences[q-bio]. Université de
Bourgogne,2016.English.tel-02801785
Vischetti, C., Monaci, E., Cardinali, A., Casucci, C., Perucci, P. (2008). The effect of initial concentration, co-
application and repeated applications on pesticide degradation in a biobed mixture. Chemosphere, 72(11),
1739-1743. https://doi.org/10.1016/j.chemosphere.2008.04.065
W. Steffen, J. Grinevald, P.J. Crutzen, J. McNeill. The Anthropocene: conceptual and historical perspectives
Philos. Trans. R. Soc. A, 369 (2011), pp. 842-867. https://doi.org/10.1098/rsta.2010.0327
W.M Edmunds, A.H Guendouz, A Mamou, A Moulla, P Shand, K Zouari. 2003. Groundwater evolution in
the Continental Intercalaire aquifer of southern Algeria and Tunisia: trace element and isotopic indicators,
Applied Geochemistry, Volume 18, Issue 6, Pages 805-822. https://doi.org/10.1016/S0883-2927(02)00189-0
Wang, J., Rothausen, S., Conway, D. Zhang, L., Xiong, W., Holman, I., P., Yumin Li, Y. 2012.China's water–
energy nexus: greenhouse-gas emissions from groundwater use for agriculture. Environmental Research
Letters, Volume 7, Number 1.
Wick, K., Heumesser, C., Schmid, E. 2012. Groundwater nitrate contamination: Factors and indicators. Journal
of Environmental Management, 111, 178-186. https://doi.org/10.1016/j.jenvman.2012.06.030
WWAP, 2009 World Water Assessment Programme. The United Nations World Water Development Report
3. Water in a Changing World.
http://www.unesco.org/new/fileadmin/MULTIMEDIA/HQ/SC/pdf/WWDR3_Facts
WWAP (United Nations World Water Assessment Programme), 2015. The United Nations World Water
Development Report 2015: Water for a Sustainable World. Paris, UNESCO.
WWAP (United Nations World Water Assessment Programme). 2015. The United Nations World Water
Development Report 2015: Water for a Sustainable World. Paris, UNESCO.
WWAP (United Nations World Water Assessment Programme). 2015. The United Nations World Water
Development Report 2015: Water for a Sustainable World. Paris, UNESCO.

40
WWAP (United Nations World Water Assessment Programme). 2015. The United Nations World Water
Development Report 2013.
WWAP (World Water Assessment Programme). 2012. The United Nations World Water Development Report
4: Managing Water under Uncertainty and Risk. Paris, UNESCO.
Younes, M., Galal-Gorchev. H. 2000. Pesticides in drinking water—A case study, Food and Chemical
Toxicology, Volume 38, Supplement 1, Pages S87-S90. https://doi.org/10.1016/S0278-6915(99)00132-5
Zalidis, G., Stamatiadis, S., Takavakoglou, V., Eskridge, K., Misopolinos, N. 2002. Impacts of agricultural
practices on soil and water quality in the Mediterance region and proposed assessment methodology.
Agriculture, Ecosystems & Environment, 88(2), 133–146.

41
Chapter 2
Assessment of groundwater contamination by plant protection products and
pollution source
Groundwater monitoring is essential to the prevention of pollution from contaminants like PPPs. However, in
order to take the necessary measures to avoid water contamination, it is essential to study the possible sources
of contamination.
Chapter 2.1 examines the occurrence of fifteen PPPs in groundwater of an area characterized by an intensive
viticulture activity in order to have a full picture of the general impact that vineyard may have on groundwater.
The peculiarity of the study area, over the huge vineyard, is that the groundwater contamination was never
investigated before.
Chapter 2.2 represents the second part of this study and evaluates the groundwater contamination sources by
PPPs in a smaller part of the study area, by collecting and integrating monitoring data obtained in the study of
the chapter 1, sub-surface water movement data and territorial characteristics.
This chapter also shows how the several demonstration activities organized with the farmers of the entire
Valley to prevent the point-source and diffuse contamination have been successful as demonstrated in chapter
4.

42
Chapter 2.1
First evaluation of pesticides occurrence in groundwater of Tidone Valley, an area
with intensive viticulture
Roberta Zambito Marsalaa, Ettore Capria, Elisabetta Russoc, Miriam Bisagnid, Ruggero Collae, Luigi Lucinia,
Antonio Gallob, Nicoleta Alina Suciua
a Università Cattolica del Sacro Cuore, Department for Sustainable Food Process, Via Emilia Parmense 84,
29122 Piacenza, PC, Italy
b Università Cattolica del Sacro Cuore, Department of Animal Science, Food and Nutrition (DIANA), Via
Emilia Parmense 84, 29122 Piacenza, PC, Italy
c ARPAE – Regional Agency for Prevention, Environment and Energy of Emilia Romagna, Via XXI Aprile 48,
29121 Piacenza, PC, Italy
d APCS – Associazione Piace Cibo Sano, Via San Bartolomeo 25/G, Piacenza, PC, Italy
e Phytosanitary consortium of Piacenza, Via Cristoforo Colombo 35, 29122 Piacenza, PC, Italy
https://doi.org/10.1016/j.scitotenv.2020.139730
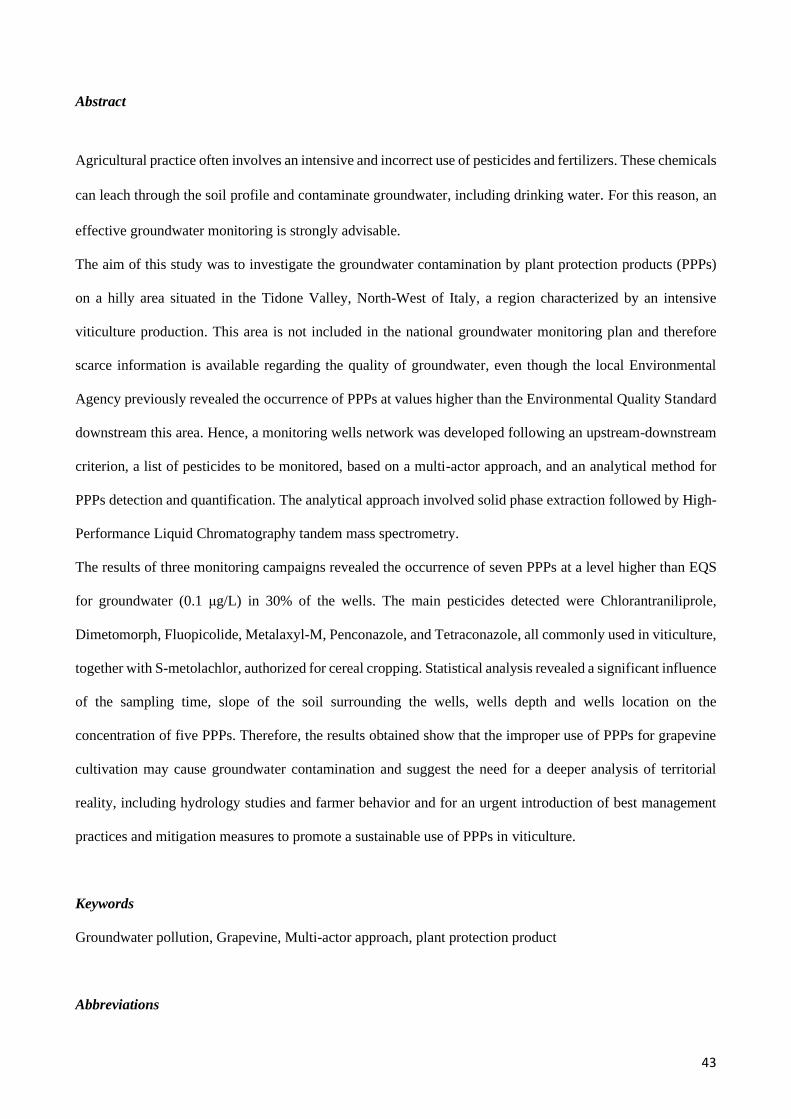
43
Abstract
Agricultural practice often involves an intensive and incorrect use of pesticides and fertilizers. These chemicals
can leach through the soil profile and contaminate groundwater, including drinking water. For this reason, an
effective groundwater monitoring is strongly advisable.
The aim of this study was to investigate the groundwater contamination by plant protection products (PPPs)
on a hilly area situated in the Tidone Valley, North-West of Italy, a region characterized by an intensive
viticulture production. This area is not included in the national groundwater monitoring plan and therefore
scarce information is available regarding the quality of groundwater, even though the local Environmental
Agency previously revealed the occurrence of PPPs at values higher than the Environmental Quality Standard
downstream this area. Hence, a monitoring wells network was developed following an upstream-downstream
criterion, a list of pesticides to be monitored, based on a multi-actor approach, and an analytical method for
PPPs detection and quantification. The analytical approach involved solid phase extraction followed by High-
Performance Liquid Chromatography tandem mass spectrometry.
The results of three monitoring campaigns revealed the occurrence of seven PPPs at a level higher than EQS
for groundwater (0.1 μg/L) in 30% of the wells. The main pesticides detected were Chlorantraniliprole,
Dimetomorph, Fluopicolide, Metalaxyl-M, Penconazole, and Tetraconazole, all commonly used in viticulture,
together with S-metolachlor, authorized for cereal cropping. Statistical analysis revealed a significant influence
of the sampling time, slope of the soil surrounding the wells, wells depth and wells location on the
concentration of five PPPs. Therefore, the results obtained show that the improper use of PPPs for grapevine
cultivation may cause groundwater contamination and suggest the need for a deeper analysis of territorial
reality, including hydrology studies and farmer behavior and for an urgent introduction of best management
practices and mitigation measures to promote a sustainable use of PPPs in viticulture.
Keywords
Groundwater pollution, Grapevine, Multi-actor approach, plant protection product
Abbreviations
44
ARPAE Regional Agency for Prevention, Environment and Energy
AUSL health local agency
EQS Environmental Quality Standard
GLM generalized linear model
GUS groundwater ubiquity score
HPLC-MS/MS high performance liquid chromatography tandem mass spectrometry
PPP plant protection product
UPLC-QTOF-MS ultra performance liquid chromatography quadrupole time of flight mass spectrometry
ANOVA analysis of variance
1. Introduction
Groundwater constitutes about 30% of the world's freshwater resources. This represents 97% of the freshwater
that is potentially available for human use, taking into account that 70% of freshwater resources are frozen
(Morris et al., 2003). According to this, groundwater may therefore be the key to sustainability of world water
supplies and needs to be managed accordingly. Groundwater is extensively used worldwide for domestic,
industrial, and agricultural purposes, and both urban and rural areas rely on groundwater resources to meet
their water demands (Postigo et al., 2015; Swartjes et al., 2020, Singh et al., 2015).
Moreover, thanks to its excellent biological and physical-chemical characteristics over surface water (rivers
and lakes), it is mainly used as a source of drinking water. Nowadays, unfortunately, water is subject to the
influence of large quantities of pollutants which cause serious environmental damage. Agriculture has direct
and indirect effects on its quality, rates and compositions recharge and aquifer biogeochemistry. In particular,
agricultural pollution often involves an excessive and incorrect use of Plant Protection Products (PPPs) and
fertilizers which, being to some extent soluble in water, can penetrate into the soil and contaminate
groundwater used for drinking (MN Khan et al., 2018; Serpa 2017).
In viticulture the diseases and pest pressure are high and forces winegrowers to an intensive use of PPPs. This
spraying of PPPs, however, can have a relevant impact on water quality due to their leaching to groundwater
and transfer by runoff, drift and erosion to surface water (Padovani et al. 2004; Vischetti et al. 2008; Nario et
al., 2018). The risk of such events is important in vineyards (Battany and Grismer, 2000 Lamastra et al., 2016),
45
because vine is grown in many areas on slopes to provide grape with a good sunlight exposition and to secure
the quality of berries. (Thiollet-Scholtus et al., 2015).
The pollution of groundwater by PPPs is governed by the physicochemical characteristics of the compounds
including water solubility, groundwater ubiquity score (GUS) index, their capacity to be retained by soil
components and their degradation rate. (Herrero-Hernandez et al., 2013). The GUS index is one of the most
used indicators for screening the PPPs potential of leaching in groundwater since 2000 (Trevisan et al. 1999;
Padovani et al. 2004). Furthermore, over the physicochemical characteristics, also soil characteristics, soil
slope and rainfall frequency and intensity can influence the groundwater contamination after PPPs spraying.
Indeed, the lower is the slope, the higher is the risk of leaching to groundwater. Precipitations, however, can
dilute the groundwater within the wells and therefore the contamination may depend on the sampling period.
Moreover, the retention of a PPP by soil can prevent its short-term access to ground or surface waters and its
effects on non-target organisms, but the persistence of the un-degraded pesticide or of harmful metabolites
constitutes a cumulative – risk to the environment and thus to human health (Arias-Estévez et al., 2008)
In fact, it has been estimated that less than 0.1% of the pesticide applied to crops actually reaches the target
pest; the rest enters the environment, contaminating soil, air and waterbodies (Pimentel and Levitan, 1986).
Pesticides slowly start dissipating after these are sprayed. If the conditions of good agricultural practice (GAP)
such as applicable doses of the PPP and the time interval between applying the pesticide and harvesting the
crop are not met, harvested crops may contain unacceptable levels of pesticide residues (Gonzalez-Rodriguez
et al., 2011).
In that regard, different international regulatory bodies such as the European Union (EU), the United States
Environmental Protection Agency (US EPA) and the World Health Organization (WHO) established
maximum allowed concentrations for PPPs in drinking water (Donato et al., 2015) that in most of the cases
corespond to the Environmental Quality Standards for groundwater (EQSgw; equal to 0.1 μg/L and 0.5 μg/L,
respectively for the single substance and for the sum of the substances), established by Directive 2006/118/EC
(EC, 2006). This, even if the regulatory framework governing the placing on the market of PPPs, as well as
aspects of their use, shape the conditions of their use on a sustainable way, through the EC Regulation No.
1107/2009 (EC, 2009a), that bases the placing of pesticide products on the market on the demonstration that
their use complies with defined protection goals guaranteeing a high level of safety for humans and the

46
environment and the Directive 2009/128/EC (EC, 2009b) also called the “Sustainable Use Directive” that
extend the set of measures that, from the training and certification of users to the control of application
machines and the development of effective alternative methods, should improve the safety level over the whole
process (Alix and Capri, 2018). Despite of the well-defined regulatory framework, in general monitoring data
from EU Member States show a diffuse pollution of surface and groundwater in several countries (SOeS, 2015;
Stone, 2014; Petersen, 2012). The national monitoring plans aim to identify issues not adequately foreseen by
the regulatory framework (ISPRA, 2018). In Italy the Institute for Environmental Protection and Research
(ISPRA) is responsible for technical management and assessment of the monitoring. Analytical investigations
are carried out by the territorial Agencies and are transmitted to the Institute, in accordance with the provisions
of the Directive 2009/128/EC (EC, 2009b) and the relevant National Action Plan (DM 35/2014) (MIPAAF,
2014). However, the national monitoring network is planned to cover the institutional bodies of water, foreseen
by the application of the Dir. 2000/60/CE (EC, 2000) and national application decrees that not always considers
adequately local stressor realities.
In this context, the main objective of this study, part of the H2020 WaterProtect Project, is to investigate the
groundwater contamination by PPPs in a hilly area situated in the Tidone Valley, Province of Piacenza, North-
West of Italy, and characterized by an intensive viticulture production. In this area the groundwater wells of
the institutional monitoring network are too rarefied and in positions unsuitable to adequately represent the
underlying and potentially impacted aquifers. Nonetheless, downstream this area the Local Environmental
Agency (ARPAE) revealed the presence of nitrates and pesticides at values higher than the Environmental
Quality Standard (EQS) (data not shown). In more detail, the study aims to (i) develop a specific monitoring
wells network directly in the field, in the middle of the vineyards, limiting the distance of the points and
following an upstream-downstream criterium (ii) establish a list of PPPs to be monitored, following a multi-
actor and analytical screening approach (iii) develop an analytical method for pesticides detection and
quantification at levels below the EQSgw and (iv) provide a first screening of the groundwater contamination
by PPPs used in grapevine cultivation.

47
2. Materials and methods
2.1 Study area
Tidone Valley is placed in the North-West of Italy, Emilia Romagna Region, Province of Piacenza, and is
characterized by a mix of urban, peri-urban and rural areas (Fig. 1). The area covers five municipalities: Ziano
Piacentino (http://www.comune.ziano.pc.it/), Castel S. Giovanni
(http://www.comune.castelsangiovanni.pc.it/), Alta Val Tidone
(http://www.comunealtavaltidone.pc.it/hh/index.php), Pianello Val Tidone
(http://www.comunepianellovaltidone.it/hh/index.php), and Borgonovo Val Tidone
(http://www.comune.borgonovo.pc.it/) for 29.462 inhabitants and 455 declared farms. It is a hilly zone
characterized by an elevation level between 100 and 350 above sea level and it is renowned for the deeply
rooted tradition and vocation to viticulture. The main cultivation is vineyard, with 2941 ha in 2016 (ISTAT,
2016; http://dati.istat.it/Index.aspx?DataSetCode=DCSP_COLTIVAZ).
Fig 1. The Action Lab area, an intensive viticulture region in North-Western Italy.

48
2.2 Development of the sampling network
Considering that the study area is a hilly area with a slope between 1.7 and 8.9° and aiming to highlight the
impact of pesticides treatment, a criterium for wells individuation and selection was developed. The wells
were selected taking into consideration the upstream and downstream of the small water bodies crossed by
tributaries (vallicola) of Tidone Torrent and of two Streams Lora-Carogna and Carona-Boriacco, where the
vineyards are treated with pesticides and fertilizers (Fig. 2). The upstream well should be the one no
contaminated while the downstream well should collect all the residues of the treatments due to run-off at
soil surface and transport of surface water body and drainage to groundwater.
Fig 2. Upstream-downstream criterium. Representation of the criterium for wells selection, with groundwater
flow considered from south-west to north-east.
Based on this criterium 26 wells have been selected for the monitoring network, coded from WP01 to WP32
and including 3 wells used for drinking water and part of Regional Environmental Agency (ARPAE) and the
water supplier company (IRETI) networks (Table 1).

49
Table 1. Network wells description.
Well Municipality Upstream/Downstream Vallicola Depth (m) Soil Slope (°)
WP01 Ziano Downstream Rio Gatto 2.0 6.4
WP03 Ziano Upstream Rio del Volto 6.0 3.2
WP04 Ziano Downstream Rio Lora 0.0 2.7
WP05 Ziano Downstream Rio Valle 3.0 0.0
WP06 Ziano Upstream Rio Valle 7.0 7.8
WP07 Ziano Upstream Rio Battilana 34.0 2.3
WP08 Castel San Giovanni Downstream Rio Battilana 30.1 5.1
WP09 Ziano Downstream Rio Guarone 6.2 8.3
WP10 Ziano Upstream Rio Guarone 9.0 4.7
WP11 Ziano Upstream Rio Bardonazzo 5.7 5.4
WP13 Ziano Downstream Rio Caroncella/ Bardonazzo 5.4 7.8
WP14 Ziano Upstream Rio Montalbo 4.5 7.9
WP15 Ziano Downstream Rio Montalbo 4.6 2.8
WP17 Pianello Val Tidone Upstream Rio Lisone 11.5 5.4
WP18 Pianello Val Tidone Downstream Rio Lisone 3.5 5.7
WP19 Alta Val Tidone Action lab upstream/drinkable Rio Gualdora 0.0 8.8
WP20 Castel San Giovanni Action lab downstream Rio Ganaghello 117.0 1.7
WP21 Pianello Val Tidone Drinkable Torrente Tidone 11.0 3.2
WP22 Ziano Upstream Rio Lora 5.4 7.9
WP24 Ziano Upstream Rio Gatto 3.7 8.9
WP25 Ziano Upstream Rio Caroncella 11.2 7.6
WP26 Borgonovo Val Tidone Upstream Rio Carona 8.8 1.7
WP28 Ziano Downstream Rio Bardonazzo 5.0 2.4
WP29 Ziano Upstream Rio del Volto 2.9 5.8
WP30 Ziano Downstream Rio del Volto 7.8 2.9
WP32 Ziano Downstream/drinkable Rio Carona 15.0 1.7
Fig 3 shows the selected sampling sites, distinguishing between upstream and downstream wells based on the
abovementioned criterium.
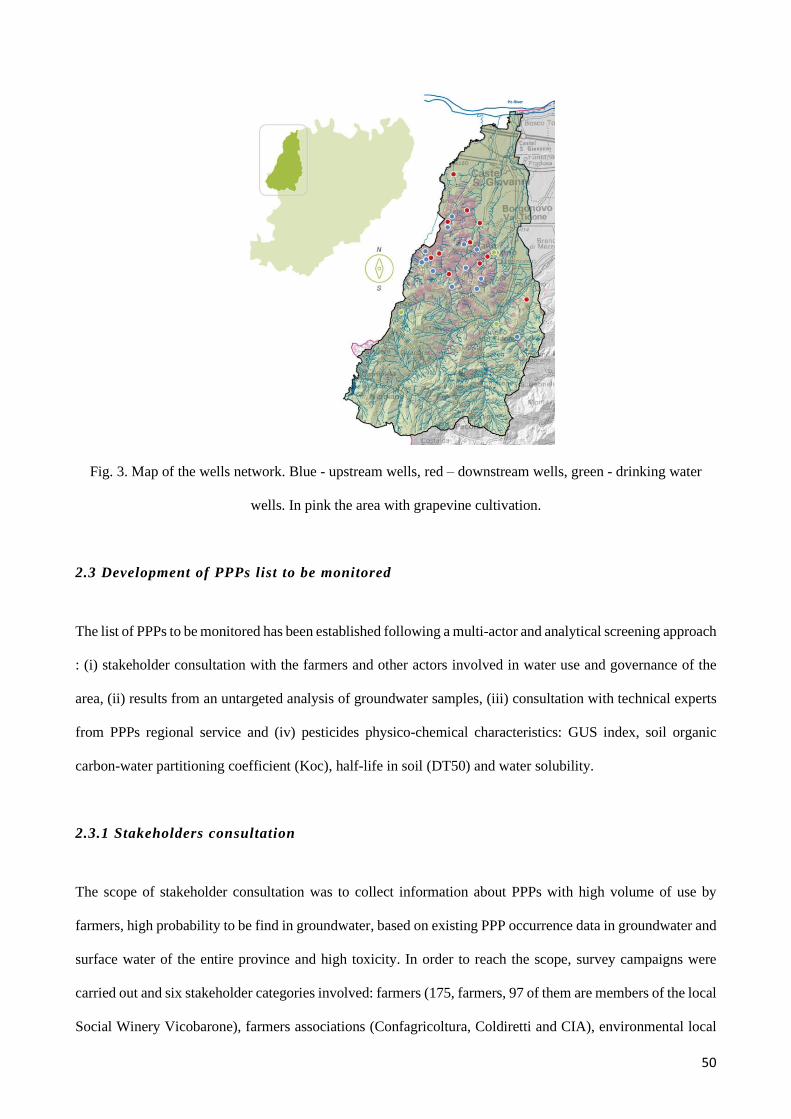
50
Fig. 3. Map of the wells network. Blue - upstream wells, red – downstream wells, green - drinking water
wells. In pink the area with grapevine cultivation.
2.3 Development of PPPs list to be monitored
The list of PPPs to be monitored has been established following a multi-actor and analytical screening approach
: (i) stakeholder consultation with the farmers and other actors involved in water use and governance of the
area, (ii) results from an untargeted analysis of groundwater samples, (iii) consultation with technical experts
from PPPs regional service and (iv) pesticides physico-chemical characteristics: GUS index, soil organic
carbon-water partitioning coefficient (Koc), half-life in soil (DT50) and water solubility.
2.3.1 Stakeholders consultation
The scope of stakeholder consultation was to collect information about PPPs with high volume of use by
farmers, high probability to be find in groundwater, based on existing PPP occurrence data in groundwater and
surface water of the entire province and high toxicity. In order to reach the scope, survey campaigns were
carried out and six stakeholder categories involved: farmers (175, farmers, 97 of them are members of the local
Social Winery Vicobarone), farmers associations (Confagricoltura, Coldiretti and CIA), environmental local
51
agency (ARPAE), reclamation authority (Consorzio di Bonifica di Piacenza), water supplier company (IRETI)
and local Health Agency (AUSL).
2.3.2 Untargeted analysis
In order to investigate the occurrence of pesticides in groundwater and obtain a general picture of land use, an
untargeted analysis was carried out on groundwater sampled in the Action Lab area during November 2017-
May 2018 for a total of 32 samples. However, 26 of these samples were then used for target analyses. The
untargeted screening was done through ultra-performance liquid chromatography coupled to quadrupole-time-
of-flight mass spectrometry (UPLC-QTOF-MS). Briefly, reverse phase gradient chromatography was used for
separation and a data-independent tandem mass spectrometry adopted for detection. Compounds annotation
was achieved using at least three fragment ions. The description of samples preparation and analysis is fully
detailed as supplementary material.
2.3.3 Expert judgement
The scope of expert judgement consultation was to collect data on PPPs with the highest use and sale in the
study area. The expert judgement consultation is a technique in which judgment is made based on the
competences acquired in a particular area of knowledge. This knowledge base can be provided by a key
member of the project team. In this case the key member is a representative of Provincial Phytosanitary
Consortium, support partner of the WaterProtect Project.
All the obtained information, in form of lists of PPPs, were then compared with the indications given by the
integrated pest Management guidelines of Emilia - Romagna Region (http://agricoltura.regione.emilia-
romagna.it/produzioni-agroalimentari/temi/bio-agro-climambiente/agricoltura-integrata/disciplinari-
produzione-integrata-vegetale/Collezione-dpi/2019/norme-generali-2019) for the active ingredients
authorized for grapevine cultivation and the most recent data concerning the active ingredients quantity sold
in Emilia Romagna Region, and the list of PPPs to be monitored was established.

52
2.4 Reagents and standards
Methanol and acetonitrile HPLC grade were purchased from Carlo Erba reagents S.R.L (Milan, Italy). Formic
acid was purchased from Sigma Aldrich S.R.L. (Milan, Italy). SPE Bond Elut PPL cartridges were purchased
from Agilent Technology (Milan, Italy). Pesticide standards were supplied by VWR International S.R.L.
(Milan, Italy). Individual stock solutions (100 mg L-1) of each analyte was prepared in methanol and then
mixed standard solutions (5, 2.5, 1, 0.5, 0.1, 0.05, 0.025, 0.010, 0.001 mg L-1) of all analytes were prepared
in methanol.
2.5 Groundwater sampling and instrumental analysis
Sampling of the 26 network wells was carried out between November 2017 and September 2018. The samples
were collected in triplicate and filled into 1500 mL plastic bottles after well flush out. All bottles were kept at
-28 °C until analysis. Before SPE extraction, the samples were thawed at room temperature and three aliquots
of 500 mL were filtered with a bottle-top vacuum filtration unit through a glass microfiber filter (1.6 µm
average pore size, 90 mm diameter, 0.26 mm thickness) into 500 mL glass flasks.
A method based on solid phase extraction from groundwater, suitable for the selected PPPs, and their analysis
through HPLC-MS/MS, was then developed following the Guidelines for the detection of Residues for post-
registration control and monitoring, proposed by European Commission
(https://ec.europa.eu/food/plant/pesticides/approval_active_substances/guidance_documents_en;
https://esdac.jrc.ec.europa.eu/projects/focus-dg-sante) (EC, 2010).
Shortly, several types of cartridges and absorbents were chosen and tested, based on the sorbent characteristics,
properties of the selected pesticides and literature search. SPE cartridges tested for the recovery tests were
Oasis HLB, Bond Elut ENV, Bond Elut PPL and C18. After several recovery test the cartridge that showed
the highest recovery for all selected pesticides (recovery between 41% and 103%) was PPL cartridge (styrene-
divinylbenzene adsorbent), whereas the elution solvent was methanol.
For the analysis of the extracts, a 1200 series liquid chromatograph system equipped with quaternary pump,
electrospray ionization system and coupled to a G6410A triple quadrupole mass spectrometer detector (all
from Agilent technologies, Santa Clara, CA, USA) was used. The chromatographic separation was achieved

53
on a EC-C18 column (4.6 x 100 mm, 2.7 µm, Agilent technologies, Milan, Italy) using ultra-pure water with
0.1% formic acid (phase A) and 0.1% formic acid in methanol (phase B) as mobile phases. Injection volume
was 20 µL, run time was 30 min and the flow rate was 0.2 mL/min. The proposed method was validated by
evaluating linearity, matrix effect, limit of detection (LOD), limit of quantification (LOQ), accuracy (in terms
of recovery) and precision (in terms of repeatability). The linearity was evaluated through the coefficient of
determination (R2) of the analytical curves at concentration levels between 1 and 2500 µg L-1. The solutions
for instrumental calibration were prepared in methanol. Matrix effect was calculated comparing the slope of
curves prepared in solvent and in the blank extract. Precision was evaluated in terms of repeatability and
intermediate precision, by estimating the relative standard deviation (RSD) of the recovery percentage for each
spiked level. The LOD and LOQ were calculated using the method of signal-to-noise ratio, and the LOD was
defined as the lowest concentration at which the analytical signal could be reliably differentiated with a signal-
to-noise ratio of 3:1. The LOQ was established as the lowest spiked level concentration, which produced a
signal-to-noise ratio of 10:1. The complete description of the analytical method and the results of recovery test
are presented in the supplementary material.
2.6 Statistical analysis
The normal distribution of the data was verified by using UNIVARIATE procedure (SAS Inst. Inc., Cary, NC;
release 8.0) by NORMAL option. Data were not normally distributed, and a log normal transformation was
applied to satisfy normality and homogeneity of variance assumptions underlying linear models. Through the
text, in tables and graphs, the average data were presented in their original scale, whereas pooled error terms
(i.e., root means square error or √MSE) were associated to log normal transformed data (Petrie and Watson,
2006). Two experimental designs have been elaborated. One experimental design corresponded to a
completely randomized design with a 2 x 3 x 4 factorial arrangement of treatments. A generalized linear model
(GLM procedure) was applied to log transformed data and main tested effects in the model were the location
of the wells (Stream, n=2; upstream vs downstream), the wells depth (Deep, n=4) and the sampling period
(Period, n=3). First and second order interactions of main tested effects were also included in the model.
54
The second experimental design corresponded to a completely randomized design with a 2 x 3 x 2 factorial
arrangement of treatments. Also in this case a GLM procedure was applied to log transformed data and the
tested effects were the location of the wells (Stream, n=2; upstream vs downstream), the degree of the slope
of the soil in which the wells are located (Slope, n=2) and the sampling period (Period, n=3).
In particular, the sampling periods considered were November 2017, July 2018 and September 2018, whereas
two slope levels were defined, slope level I, with a slope between 0 and 3 ° and slope level II, with a slope >
3°. Based on the wells depth, four levels were defined, level I, with a depth < 6m, level II, with a depth between
6 and 10 m, level III , with a depth between 10 and 15 m and level IV, with a depth > than 30 m.
3. Results and discussion
3.1 PPPs selection for groundwater monitoring
In order to define the final list of PPPs to be monitored in groundwater, thus highlighting the impact of
viticulture on groundwater pollution, the results from untargeted analysis, the stakeholders’ consultation and
expert judgement outcomes and the PPPs’ physicochemical characteristics were considered.
The untargeted analysis showed the presence of fourteen PPPs in the groundwater samples: five insecticides
(Chlorantraniliprole, DEET, Dimetan, Pirimicarb, Trimethacarb), three herbicides (Defenuron, Glufosinate,
Isopropalin) and five fungicides (Dimethirimol, Dimetomorph, Fluopicolide, Isopamphos, Metalaxyl-M).
Among the insecticides and the herbicides found, three were revoked fron the market (not longer authorised
as pesticides) : DEET (Diethyltoluamide), Dimetan and Isopropalin. Furthermore, untargeted analysis revealed
the occurrence of other chemicals such as PPPs metabolite products, pharmaceuticals, anthelmintic,
rodenticides, molluscicides, bronchodilatators and surfactants. Table 4S in supplementary material reports all
the chemicals found by the untargeted analysis and the physico-chemical properties and GUS index for each
PPP detected.
The outcomes of stakeholders and expert judgement consultation produced a list of twenty one PPPs, with
high interest for the local stakeholders and high use on the territory (Table 5S and 6S in the supplementary
materials). In particular, farmers and other stakeholders indicated seven herbicides (Acetolachlor, Flufenacet,
Isopropalin, Metsulfuron-methyl, S-metolachlor, Terbuthylazine and Tribenuron-methyl), two insecticides

55
(Chlorantraniliprole and Parathion-methyl) and two fungicides (Benomyl and Fluopicolide), whereas the
expert judgement consultation indicated three insecticides (Chlorpyrifos, Chlorpyrifos-methyl and
Thiamethoxam) and six fungicides (Cyflufenamid, Cyprodinil, Mancozeb, Metiram, Penconazole and
Tetraconazole) as high used pesticides on the study area. Tables 5S and 6S in the supplementary material show
their physicochemical properties and GUS Index.
For what concern the physicochemical properties of the pesticides previously detected/indicated by the
stakeholders, the dissipation of a substance is usually expressed through the DT50 and contributes, in
combination with the Koc, to the leaching potential through the GUS index: GUS = log (DT50) x [4 - log
(Koc)]. This is an empirical index and represents a potential indicator since environmental conditions are not
considered. GUS values higher than 2.8 indicate that the leaching of the substance is probable, while this is
not likely to happen with GUS values less than 1.8. Intermediate values point indicates a limited leaching
potential. The partition coefficient Koc is expressed on the basis of the organic carbon content of the sediment.
This parameter gives indications on the chemical compound's ability to bind to the soil according to its
characteristics. The higher value represents the stronger tendency to be tied to the ground, while the lower
value represents the greater tendency to move with percolation water. The half-life of the pesticides in the soil
(soil DT50), expressed in days, indicates the time in which the substance is halved compared to the initial
concentration: greater is the value, more persistent is the substance in the soil. For this last parameter, three
different values are provided: laboratory, field and typical. The typical value is that reported in the literature
and it is often the average of all field and laboratory studies. (Vassiliou 2016).
Therefore, merging all the information obtained from the untargeted analysis, the outcomes of stakeholders
and expert judgement consultation, the physicochemical properties (Koc, DT50 and water solubility) and
finally the GUS Index, the pesticides list showed in Table 2 was selected. Higher priority was given to the
PPPs authorized for grape cultivation and with high number of treatments, following the integrated pest
Management guidelines of Emilia - Romagna Region. It consists in three insecticides (Chlorantraniliprole,
Chlorpyrifos and Chlorpyrifos methyl), used on grapevine against Eupoecilia ambiguella, seven fungicides
(Cyflufenamid, Cyprodinil, Dimethomorf, Metalaxyl-M, Penconazole, Tetraconazole, Fluopicolide) used on
grapevine against downy and powdery mildew, Ascomycetes, Basidiomycetes, Deuteromiceti, Septoria and
Rhynchosporium, and five herbicides (Flufenacet, Isopropalin, Metsulfuron-methyl, S-metolachlor,
56
Tribenuron-methyl) not authorised for grapevine cultivation but commonly used for cereals in conventional
farming. Indeed, the selected herbicides were included in the final list (Table 2) in order to assess a possible
inappropriate use for grapevine cultivation or a possible impact of cereals cultivation. The ISTAT data,
elaborated by AAAF (Gruppo di lavoro Fitofarmaci) group, concerning the active ingredients quantity sold in
Emilia Romagna Region in 2012 (no other recent data available) confirm the high use of Chlorpyrifos, S-
Metolachlor, Dimetomorph, Chlorpyrifos-methyl, Cyprodinil, Metalaxyl-M, Chlorantraniliprole,
Fluopicolide, Penconazole, Flufenacet, Tetraconazole, Metsulfuron-methyl and Cyflufenamid, with values
ranging between 16 kg (Cyflufenamid) and 117069 Kg (Chlorpyrifos)
(http://www.appa.provincia.tn.it/fitofarmaci/programmazione_dei_controlli_ambientali/Criteri_vendita_prod
otti_fitosanitari/pagina123.html).
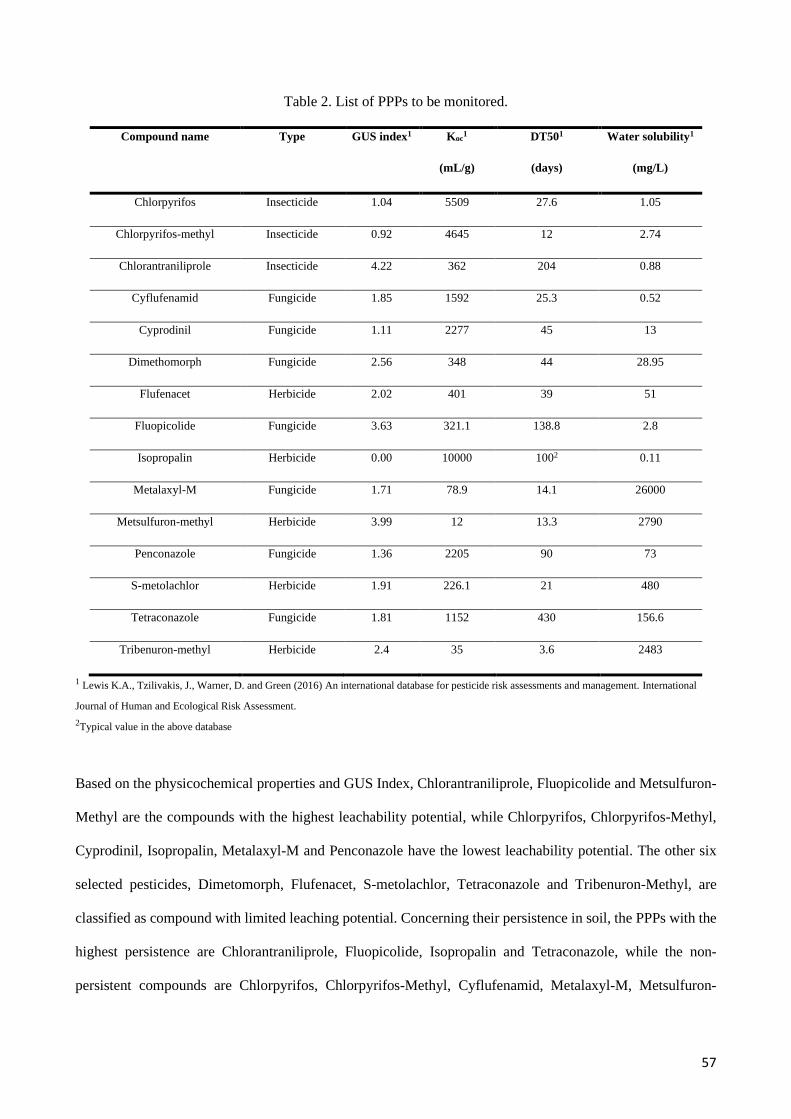
57
Table 2. List of PPPs to be monitored.
Compound name Type GUS index1 Koc1
(mL/g)
DT501
(days)
Water solubility1
(mg/L)
Chlorpyrifos Insecticide 1.04 5509 27.6 1.05
Chlorpyrifos-methyl Insecticide 0.92 4645 12 2.74
Chlorantraniliprole Insecticide 4.22 362 204 0.88
Cyflufenamid Fungicide 1.85 1592 25.3 0.52
Cyprodinil Fungicide 1.11 2277 45 13
Dimethomorph Fungicide 2.56 348 44 28.95
Flufenacet Herbicide 2.02 401 39 51
Fluopicolide Fungicide 3.63 321.1 138.8 2.8
Isopropalin Herbicide 0.00 10000 1002 0.11
Metalaxyl-M Fungicide 1.71 78.9 14.1 26000
Metsulfuron-methyl Herbicide 3.99 12 13.3 2790
Penconazole Fungicide 1.36 2205 90 73
S-metolachlor Herbicide 1.91 226.1 21 480
Tetraconazole Fungicide 1.81 1152 430 156.6
Tribenuron-methyl Herbicide 2.4 35 3.6 2483
1 Lewis K.A., Tzilivakis, J., Warner, D. and Green (2016) An international database for pesticide risk assessments and management. International
Journal of Human and Ecological Risk Assessment.
2Typical value in the above database
Based on the physicochemical properties and GUS Index, Chlorantraniliprole, Fluopicolide and Metsulfuron-
Methyl are the compounds with the highest leachability potential, while Chlorpyrifos, Chlorpyrifos-Methyl,
Cyprodinil, Isopropalin, Metalaxyl-M and Penconazole have the lowest leachability potential. The other six
selected pesticides, Dimetomorph, Flufenacet, S-metolachlor, Tetraconazole and Tribenuron-Methyl, are
classified as compound with limited leaching potential. Concerning their persistence in soil, the PPPs with the
highest persistence are Chlorantraniliprole, Fluopicolide, Isopropalin and Tetraconazole, while the non-
persistent compounds are Chlorpyrifos, Chlorpyrifos-Methyl, Cyflufenamid, Metalaxyl-M, Metsulfuron-
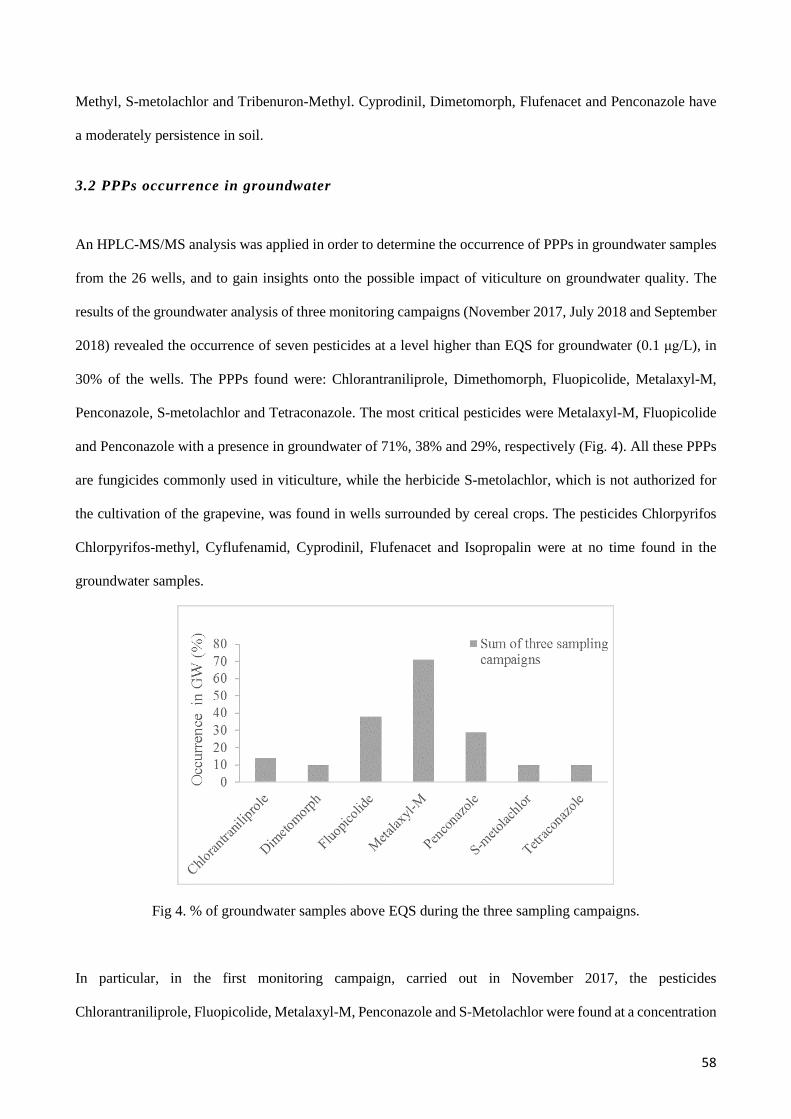
58
Methyl, S-metolachlor and Tribenuron-Methyl. Cyprodinil, Dimetomorph, Flufenacet and Penconazole have
a moderately persistence in soil.
3.2 PPPs occurrence in groundwater
An HPLC-MS/MS analysis was applied in order to determine the occurrence of PPPs in groundwater samples
from the 26 wells, and to gain insights onto the possible impact of viticulture on groundwater quality. The
results of the groundwater analysis of three monitoring campaigns (November 2017, July 2018 and September
2018) revealed the occurrence of seven pesticides at a level higher than EQS for groundwater (0.1 μg/L), in
30% of the wells. The PPPs found were: Chlorantraniliprole, Dimethomorph, Fluopicolide, Metalaxyl-M,
Penconazole, S-metolachlor and Tetraconazole. The most critical pesticides were Metalaxyl-M, Fluopicolide
and Penconazole with a presence in groundwater of 71%, 38% and 29%, respectively (Fig. 4). All these PPPs
are fungicides commonly used in viticulture, while the herbicide S-metolachlor, which is not authorized for
the cultivation of the grapevine, was found in wells surrounded by cereal crops. The pesticides Chlorpyrifos
Chlorpyrifos-methyl, Cyflufenamid, Cyprodinil, Flufenacet and Isopropalin were at no time found in the
groundwater samples.
Fig 4. % of groundwater samples above EQS during the three sampling campaigns.
In particular, in the first monitoring campaign, carried out in November 2017, the pesticides
Chlorantraniliprole, Fluopicolide, Metalaxyl-M, Penconazole and S-Metolachlor were found at a concentration
59
above the EQS in 6 wells out of 26. In the second monitoring campaign, carried out in July 2018, the pesticides
Chlorantraniliprole, Dimethomorph, Fluopicolide, Metalaxyl-M, Penconazole, S-metolachlor and
Tetraconazole were found at concentrations above the EQS in 11 out of 26 wells, whereas in the third
monitoring campaign, carried out in September 2018, only the pesticides Fluopicolide, Metalaxyl-M and
Penconazole were found at concentrations above the EQS in 5 out of 26 wells. The period with the highest
number of wells having concentration of PPPs above the EQS was July 2018. Indeed, this period is just after
the period of application for pesticides. Normally, almost 95% of pesticide treatments for grape protection
have been already carried out by that date (expert judgement). The wells with concentrations of PPPs higher
than EQS in all three monitoring campaigns were well WP09, well WP13, well WP14, well WP15, well WP17,
well WP 22, well WP 28 and well WP 30. Fig. 5 shows the concentration levels of the pesticides that exceed
the EQS, for all the wells (expressed only with the number that characterized the code) and the three sampling
campaigns.

60

61

62
Fig 5. Concentration (μg/L) of the pesticides that exceed the EQS during the three sampling campaigns; a)
Chlorantraniliprole, b) Fluopicolide, c) Metalaxyl-M, d) Penconazole, e) S-metolachlor, f) Tetraconazole and
g) Dimethomorph.
Based on the physico-chemical properties and GUS Index, Metalaxyl-M, Penconazole, S-metolachlor and
Tetraconazole are not persistent in the soil and have a low leaching potential (1.71; 1.36; 1.91; 1.81), making
them unlikely to be found in groundwater. On the contrary, Chlorantraniliprole, Fluopicolide and
63
Dimethomorph are compounds with high persistence in soil and high leaching potential (4.22; 3.63; 2.56).
However, further study on territorial hydrology, discussed by Suciu et al. (2020, under submission in this
special issue), highlighted that for a sub-area of 7 km2 and containing six of the twenty-six wells (WP 32, WP
13, WP 28, WP 11, WP 26 and WP 25), the occurrences and concentrations of PPPs are due to both point and
diffuse contamination sources, but the position of the well in the territorial context may help to discriminate
which of the two sources is the most influent.
Several studies were conducted on the impact of viticulture on groundwater, surface water or soils (Pose-Juan
et al., 2015; Hildebrandt et al., 2008; Herrero-Hernández et al., 2013). The study of Pose-Juan et al. (2015),
about the PPPs occurrence in vineyard soils in Spain, showed the presence in soil of herbicides, fungicides and
insecticides typically used in viticulture, with the highest number detected in June. One of the highest
concentrations was determined for the fungicide Metalaxyl, at a value of 11.5 μg/kg. Furthermore, the study
revealed a more intensive use of herbicides in March, while the use of insecticides and fungicides may depend
on the specific needs of crops and/or the onset of diseases. Their results were consistent with the residues found
in groundwater in that region (Herrero-Hernández et al., 2013). Four of the forty-seven PPPs analyzed in the
Spanish study are common with the present study: Chlorpyrifos, Cyprodinil, Dimethomorph and Penconazole,
while for S-metolachlor and Metalaxyl – M, analyzed in the present study, the enantiomers Metalaxyl and
Metolachlor were searched in Spanish groundwater. Metalaxyl, Penconazole, Dimethomorph and Metolachlor
were found in 50%, 46%, <5% and <15%, respectively, of Spanish groundwater samples, with the highest
concentration of Metalaxyl and Penconazole equal to 8.015 μg/L and 18.72 μg/L, respectively. Similarly, in
the present study Metalaxyl-M and Penconazole show the highest presence (Fig. 4), with maximum
concentrations equal to 7.85 μg/L (July 2018) and 6.21 μg/L (November 2017), respectively.
Another study, conducted by Hildebrandt et al. in 2008, investigated the occurrence of eight PPPs (including
Metolachlor and Metalaxyl) in the surface and groundwater of agricultural and vineyard areas in the north of
Spain. Overall, the analytical results show that only 12% of examined water samples exceeded the 0.1 μg/L
limit. However, sporadic high levels up to 2.46 μg/L in groundwater and 0.63 μg/L in surface water were
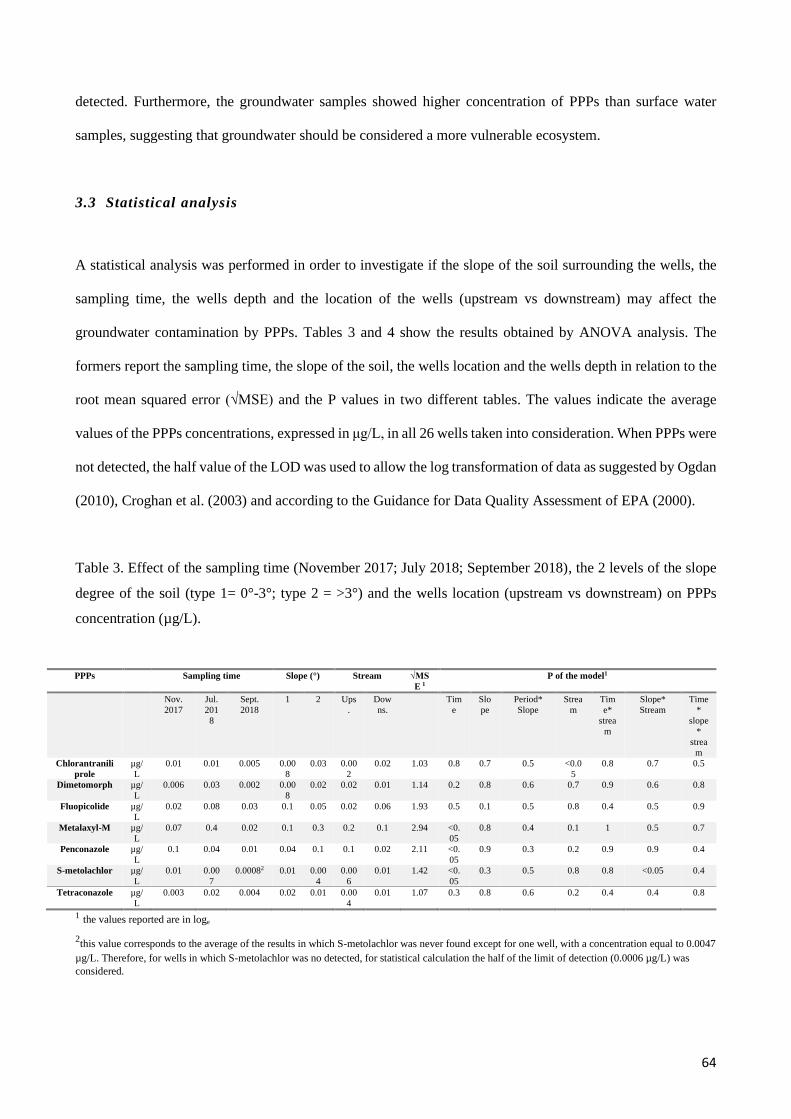
64
detected. Furthermore, the groundwater samples showed higher concentration of PPPs than surface water
samples, suggesting that groundwater should be considered a more vulnerable ecosystem.
3.3 Statistical analysis
A statistical analysis was performed in order to investigate if the slope of the soil surrounding the wells, the
sampling time, the wells depth and the location of the wells (upstream vs downstream) may affect the
groundwater contamination by PPPs. Tables 3 and 4 show the results obtained by ANOVA analysis. The
formers report the sampling time, the slope of the soil, the wells location and the wells depth in relation to the
root mean squared error (√MSE) and the P values in two different tables. The values indicate the average
values of the PPPs concentrations, expressed in μg/L, in all 26 wells taken into consideration. When PPPs were
not detected, the half value of the LOD was used to allow the log transformation of data as suggested by Ogdan
(2010), Croghan et al. (2003) and according to the Guidance for Data Quality Assessment of EPA (2000).
Table 3. Effect of the sampling time (November 2017; July 2018; September 2018), the 2 levels of the slope
degree of the soil (type 1= 0°-3°; type 2 = >3°) and the wells location (upstream vs downstream) on PPPs
concentration (µg/L).
PPPs
Sampling time Slope (°) Stream √MS
E 1
P of the model1
Nov.
2017
Jul.
201
8
Sept.
2018
1 2 Ups
.
Dow
ns.
Tim
e
Slo
pe
Period*
Slope
Strea
m
Tim
e*
strea
m
Slope*
Stream
Time
*
slope
*
strea
m
Chlorantranili
prole
µg/
L
0.01 0.01 0.005 0.00
8
0.03 0.00
2
0.02 1.03 0.8 0.7 0.5 <0.0
5
0.8 0.7 0.5
Dimetomorph µg/
L
0.006 0.03 0.002 0.00
8
0.02 0.02 0.01 1.14 0.2 0.8 0.6 0.7 0.9 0.6 0.8
Fluopicolide µg/
L
0.02 0.08 0.03 0.1 0.05 0.02 0.06 1.93 0.5 0.1 0.5 0.8 0.4 0.5 0.9
Metalaxyl-M µg/
L
0.07 0.4 0.02 0.1 0.3 0.2 0.1 2.94 <0.
05
0.8 0.4 0.1 1 0.5 0.7
Penconazole µg/
L
0.1 0.04 0.01 0.04 0.1 0.1 0.02 2.11 <0.
05
0.9 0.3 0.2 0.9 0.9 0.4
S-metolachlor µg/
L
0.01 0.00
7
0.00082 0.01 0.00
4
0.00
6
0.01 1.42 <0.
05
0.3 0.5 0.8 0.8 <0.05 0.4
Tetraconazole µg/
L
0.003 0.02 0.004 0.02 0.01 0.00
4
0.01 1.07 0.3 0.8 0.6 0.2 0.4 0.4 0.8
1 the values reported are in loge
2this value corresponds to the average of the results in which S-metolachlor was never found except for one well, with a concentration equal to 0.0047
µg/L. Therefore, for wells in which S-metolachlor was no detected, for statistical calculation the half of the limit of detection (0.0006 µg/L) was
considered.

65
Table 4. Effect of the sampling time (November 2017; July 2018; September 2018), the wells depth (type 1=
less than 6 meters; type 2 = 6-10 meters; type 3= 10-15 meters; type 4= over 30 meters) and the wells location
(upstream vs downstream) on PPPs concentration (µg/L).
PPPs
Sampling time Stream Depth (m) √M
SE1
P of the model1
No
v.
20
17
Jul.
20
18
Sept.
2018
Up. Do
wn.
1 2 3 4
Peri
od
De
pth
Peri
od*
dept
h
Stre
am
Peri
od*
strea
m
Depth*
Stream
Peri
od*
strea
m*
dept
h
Chlorantran
iliprole
µg/
L
0.0
1
0.0
1
0.005 0.0
02
0.02 0.0
07
0.0
3
0.0
02
0.00
2
1.03 0.8 0.5 0.9 <0.0
5
0.8 0.5 0.9
Dimetomorp
h
µg/
L
0.0
06
0.0
3
0.002 0.0
2
0.01 0.0
08
0.0
06
0.0
3
0.01 1.14 0.2 0.7 0.7 0.7 0.9 0.1 0.5
Fluopicolide
µg/
L
0.0
2
0.0
8
0.03 0.0
2
0.06 0.1 0.0
3
0.0
02
0.01 1.93 0.5 0.3 1 0.8 0.4 0.1 0.9
Metalaxyl-
M
µg/
L
0.0
7
0.4 0.02 0.2 0.1 0.3 0.2 0.0
3
0.05 2.94 <0.
05
0.2 0.8 0.1 1 0.8 1
Penconazole
µg/
L
0.1 0.0
4
0.01 0.1 0.02 0.2 0.0
3
0.0
03
0.00
7
2.11 <0.
05
0.1 1 0.2 0.9 0.7 1
S-
metolachlor
µg/
L
0.0
1
0.0
07
0.00082
0.0
06
0.00
4
0.0
08
0.0
04
0.0
07
0.00
06
1.42 <0.
05
0.6 0.8 0.8 0.8 0.4 0.6
Tetraconazo
le
µg/
L
0.0
03
0.0
2
0.004 0.0
04
0.01 0.0
2
0.0
2
0.0
02
0.00
2
1.07 0.3 0.5 0.9 0.2 0.4 0.9 1
1 the values reported are in loge
2this value corresponds to the average of the results in which S-metolachlor was never found except for one well, with a concentration equal to 0.0047
µg/L. Therefore, for wells in which S-metolachlor was no detected, for statistical calculation the half of the limit of detection (0.0006 µg/L) was
considered.
As shown in Table 3, the pesticides Dimetomorph and Tetraconazole did not show a significantly differences
of concentrations among the period of sampling campaigns, the degree of the soil slope and the location of the
wells (P > 0.05 for all terms). Instead, the wells location have shown to affect significantly the concentration
of the insecticide Chlorantraniliprole (P< 0.05), with the highest concentration found in the downstream wells,
indicating that these wells may have collected the residues of the treatments due to run-off at soil surface,
transport of surface water body and drainage to groundwater. This seems to be supported by the value of GUS
index of Chlorantraniliprole, 4.22, that indicates its high leaching potential and high persistence in soil. For
the fungicide Fluopicolide, the slope of the soil surrounding the wells showed to slightly influence its
concentration in groundwater (P = 0.1), with a higher concentration detected in the wells characterized by a
slope of type 1 (0-3°), indicating that the cause of contamination may be attributed to the rainfall events which
facilitate its leaching to groundwater. Again, this seems to be supported by the Fluopicolide GUS index, 3.63,
that indicates a high leaching potential. Moreover, the concentration of Fluopicolide slightly decreases from

66
wells with low depth (level I) to the deeper ones (levels II, III and IV) and increases from upstream to
downstream wells (P = 0.1 deep x stream) (Table 4), indicating a higher vulnerability of shallower wells due
to the higher proximity to the soil surface. Similar results, higher concentrations in shallower wells were
observed by Herrero-Hernández et al. (2013), in a similar study.
Furthermore, the most influencing variable was the sampling time (Tables 3 and 4). Indeed, the concentration
of the fungicide Metalaxyl-M was significantly higher in July 2018, whereas those of Penconazole and S-
Metolachlor were significantly higher in November 2017 (P < 0.05). Metalaxyl-M is a fungicide used against
downy mildew, with the most treatments before July (expert statement). Hence, sampling the water in July
may have influenced its occurrence and concentration in groundwater. This is in accordance with its
physicochemical properties, as it is not persistent in the soil and it has a low leaching potential (GUS = 1.71).
Furthermore, the wells location slightly affects the contamination of groundwater from Metalaxyl-M (P = 0.1),
with higher concentration in the upstream wells. Therefore, this may indicate a possible point source
contamination of wells by Metalaxyl-M. Indeed, Suciu et al. 2020 in the study on territorial hydrology of a
sub-area of 7 km2 and containing six of the twenty-six wells (WP 32, WP 13, WP 28, WP 11, WP 26 and WP
25), show that the contamination of upstream wells (ex: WP25, WP26) is mainly due to point contamination
sources, as water movement in the period November 2017 – November 2018 was very low.
The fungicide Penconazole is mostly used for grape cultivation against powdery mildew and often the
treatments go on until end of August (expert statement). However, a very high concentration in November
2017 was detected in well WP14 (Fig 5), that could be attributed just to a point-source contamination, as
Penconazole is not persistent in the soil and it is characterized by a low leaching potential (1.36). Furthermore,
its concentration decreases slightly from the wells with a level I of deep (< 6 m) to a well with a level IV of
deep (> 30 m) (P = 0.1) (Table 4).
The concentration of the herbicide S-metolachlor decreases significantly over time, 0.01 µg/L in November
2017, 0.007 in July 2018 and 0.0008 in September 2018. S-metolachlor is an herbicide not authorized for the
use in grapevine cultivation and its occurrence was in wells where the territory is used also for cereals
cultivation. Furthermore, the concentration of S-metolachlor increased in the wells with a slope of type 1 (0-3
°) and located downstream, and decreased in the wells with a slope of type 2 (>3 °) and located upstream (P<
67
0.05 slope x stream). This is in accordance with the upstream-downstream approach, even if S-metolachlor is
characterized by a low GUS index (1.91) and its leaching to groundwater is unlikely.
4. Conclusions
In this work, the quality of groundwater in an area with intensive viticulture activity, located in North-West of
Italy and out of the national groundwater monitoring plan, was investigated for the first time. With this aim, a
specific list of PPPs with high use in the area and high interest for the local stakeholders was developed based
on a multi-actor approach and untargeted screening analysis in groundwater. Furthermore, considering the
territorial characteristics and following an upstream-downstream criterium, a specific groundwater wells
network was settled. The untargeted screening revealed the occurrence of several contaminants in addition to
PPPs and PPPs metabolites, including pharmaceuticals and surfactants. Thereafter, 78 groundwater samples
were collected between November 2017 and September 2018 and a target analytical method, comprising solid
phase extraction and HPLC-MS/MS detection, was developed and applied for the detection of the 15 PPPs.
Groundwater analysis showed the occurrence of nine PPPs in 80% of the twenty-six wells monitored, and in
30% of them the values were above the EQS limit for groundwater. The most critical PPPs were
Chlorantraniliprole, Dimetomorph, Fluopicolide, Metalaxyl-M, Penconazole and Tetraconazole, all fungicides
used for grapevine cultivation, and S-metolachlor, an herbicide authorized for cereal cultivation.
ANOVA statistical analysis revealed significant influence of the sampling time, the slope of the soil
surrounding the wells, the wells depth and the location of the wells (upstream vs downstream) on the
concentration of five of the fifteen PPPs monitored. Furthermore, study of territorial hydrology for a sub-area
of 7 km2 and containing six of the twenty-six wells (WP 32, WP 13, WP 28, WP 11, WP 26 and WP 25)
(Suciu et al.2020) helped to discriminate which of the two between point and diffuse contamination sources
was more influent, in some cases, although additional information about farmers’ practices are necessary to
fully understand the actual contamination pathway(s). In conclusion, intensive viticulture may affect
groundwater quality, thus suggesting the need for an urgent introduction of the best management practices and
mitigation measures for a sustainable use of PPPs to enhance groundwater governance and ensure good
groundwater quality (Calliera et al. 2020).
Supplementary material
68
S.1 Development of priority list of PPPs
S.1 Untargeted analysis
In order to investigate the presence of chemical substances in groundwater and obtain a general picture of land
use, an untargeted analysis on groundwater samples was performed.
Aliquots of 60 mL of each sample were lyophilized, dissolved in 1.5 mL of methanol: water (1:1 V/V) and
then transferred in amber glass vials for analysis. A High-resolution mass spectrometry (MS) analysis was
performed using a hybrid quadrupole-time-of-flight instrument, coupled to an UHPLC chromatograph
(UHPLC-ESI/QTOF-MS) to investigate chemicals occurrence in groundwater. In more detail, a 1290 liquid
chromatograph system, equipped with a binary pump, degasser, thermostatted column compartment and a Dual
Electrospray JetStream ionization system was coupled to a 6550 mass spectrometer detector (all from Agilent
Technologies, Palo alto, CA), was used. Reverse phase chromatographic separation was achieved using an
Agilent Zorbax eclipse plus C18 column (50 × 2.1 mm, 1.8 μm) and under a water-methanol binary gradient
elution (from 5% to 90% organic in 34 min), as previously reported (Rocchetti et al., 2018). Injection volume
was 20 μL, and electrospray source conditions were set up for untargeted screening purposes (Storck et al.,
2016).
The mass spectrometer was operated in positive polarity, with a scan rate of 1 Hz, a mass range of 70-1000
m/z, and a nominal mass resolution of 30.000 FWHM. An absolute peak height threshold of 3000 counts was
also adopted. The All-Ions acquisition algorithm, a tandem mass acquisition according to which no precursor’s
selection is adopted and all ions in the scan are fragmented, was used. Such data-independent approach used
MS-only data and tandem MS fragmentation at three distinct collision energies (10, 20 and 40 V) to achieve a
higher confidence of identification. The raw data were processed using the Mass Hunter B.05 software (Agilent
technologies) and the find-by-formula algorithm, thus combining monoisotopic accurate mass and isotopic
profiling for features deconvolution. The Pesticide Personal Compounds Database and Library B.04 (Agilent
technologies), a commercially available library that includes MS and tandem MS data for pesticides and their
metabolites, was used as reference. Candidates selected from MS data were then confirmed using MS/MS data,
thus using fragments information from the library and matching elution profile of precursor and fragment ions

69
through a chromatographic co-elution score. A minimum of three co-eluting fragments was used for
confirmation.
S.2 Targeted multi-residue analysis
S.2.1 Extraction set up
The recovery tests have been performed in order to evaluate the accuracy and precision of the method. For the
extraction of PPPs from groundwater samples, several types of cartridges and absorbents have been chosen
based on the characteristics and properties of selected PPPs and literature research. SPE cartridges used for the
recovery tests were Oasis HLB, Bond Elut ENV, Bond Elut PPL and C18. Oasis hydrophilic lipophilic
balance® (HLB) is one of the more widely used sorbents in SPE and passive sampling applications. The HLB
polymer, poly(N-vinylpyrrolidone-divinylbenzene), contains apolar (i.e., benzene and aliphatic chains) as well
as polar (i.e., pyrrolidone) regions. This leads to a good water wettability and an increased ability to interact
with both apolar and polar organic molecules (Jeong et al., 2017). The Oasis HLB is used for the extraction of
a wide range of acidic, basic and neutral compounds. The Bond Elut ENV cartridge is packed with modified
styrene-divinylbenzene polymers and can retain hydrophilic and polar organic compounds (Tang et al., 2016).
The absorbent of Bond Elut PPL cartridge is a styrene-divinylbenzene polymer modified with a non-polar
surface and it is able to retain the most polar classes of analytes, including phenols; the large particle size
allows easy fluidity for samples of viscous or particulate rich water, while the high surface area and strong
hydrophobicity ensure reproducible extractions with high recoveries at the time of the elution (Zherebker et
al., 2015). The C18 cartridge based on octadecylsilyl absorbent represents the most hydrophobic silicone
sorbent and it retains most of the organic analytes from aqueous matrices (Fu, 2008); it consists of a chain of
eighteen carbons.
SPE extraction was performed by use of 5 mL of methanol and 5 mL of Milli-Q water for the conditioning of
all cartridges. The recovery tests were carried out using both groundwater sampled in the Action lab area and
tap water in order to evaluate possible matrix effects, at spiking level of 0.1µg/L. Since no significant
differences have been observed, other two additional spiking levels, 0.5 and 1 µg/L, were used for recovery
tests just with tap water. Then, 1000 and 500 mL of water were passed through the conditioned cartridges at a
flow rate of approximately 8 mL min-1 under vacuum. The cartridges were then washed with a 2.5 mL of ultra-

70
pure water and dried for 1 h under vacuum. The analytes were eluted from the solid phase by use of three
different solvents based on the cartridges characteristics: methanol, methanol: acetonitrile (1:1 V/V) and
hexane. A blank sample of tap water was always used during samples extraction as control. The results
obtained for these trials were then used to optimize the final extraction method.
S.2.2 High Performance Liquid Chromatography-tandem mass spectrometry
A 1200 series liquid chromatograph system was used, equipped with quaternary pump, electrospray
ionization system and coupled to a G6410A triple quadrupole mass spectrometer detector (all from Agilent
technologies, Santa Clara, CA, USA) (Lucini et al., 2015).
The chromatographic separation was performed with an EC-C18 column (2.1 x 50 mm, 5 µm, Agilent
technologies, Milan, Italy) connected to a 6410 triple quadrupole mass spectrometer, equipped with an Electron
Spray Ionization (ESI) source operated in positive mode and multiple reaction monitoring (MRM). Injection
volume was 20 µL, run time was 30 min and the flow rate was 0.2 mL/min. The mobile phases were ultra-pure
water with 0.1% formic acid (phase A) and 0.1% formic acid in methanol (phase B). The gradient of solvent
B was set up as follows: 0–5 min from 75 to 80%, 5-7 min from 80 to 85%, 7-23 min from 85 to 90% and
finally 23-30 min at 75%. A post run of one minute was set up. The stop time selected was 30 min.
Individual standards of each pesticide solution at a concentration level of 5 mg L-1 were injected in HPLC-
MS/MS in order to register the transitions in multiple reaction monitoring mode (MRM).
The transitions in MRM mode, the collision energies expressed in Volt and the retention time registered for
each compound are showed in the Table 1S.
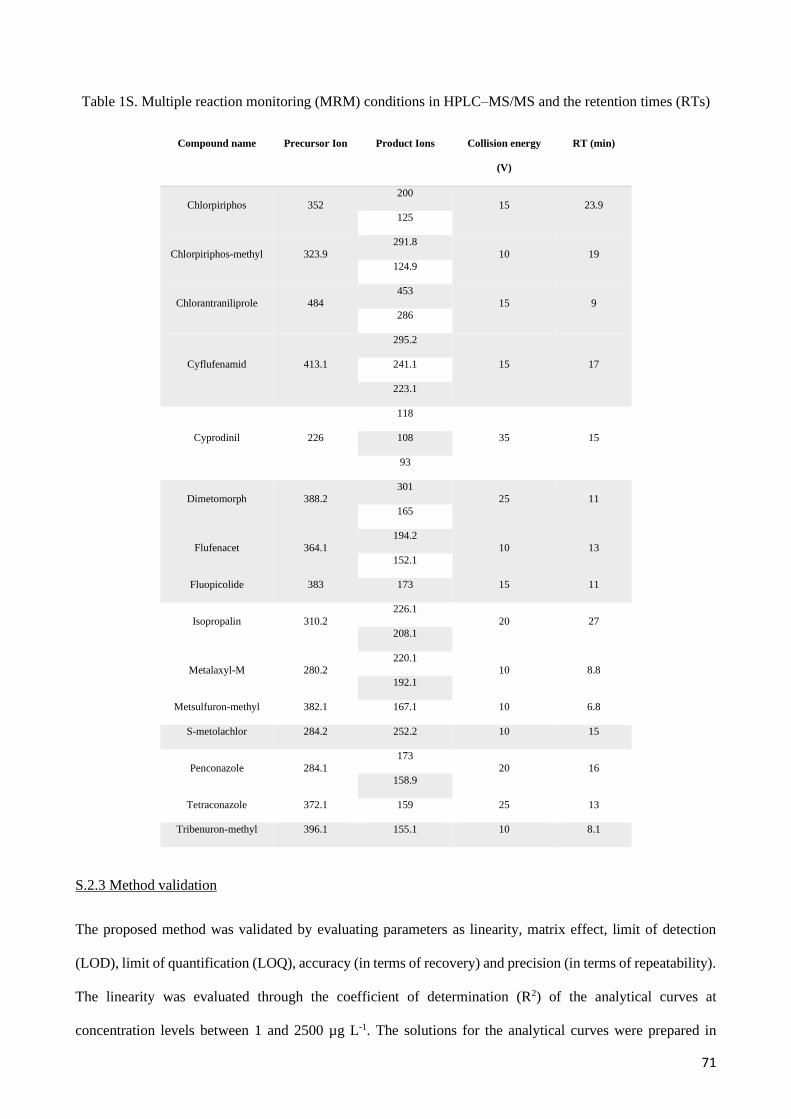
71
Table 1S. Multiple reaction monitoring (MRM) conditions in HPLC–MS/MS and the retention times (RTs)
Compound name Precursor Ion Product Ions Collision energy
(V)
RT (min)
Chlorpiriphos 352 200
15 23.9
125
Chlorpiriphos-methyl 323.9
291.8
10 19
124.9
Chlorantraniliprole 484
453
15 9 286
Cyflufenamid 413.1
295.2
15 17 241.1
223.1
Cyprodinil 226
118
35 15 108
93
Dimetomorph 388.2 301
25 11
165
Flufenacet 364.1
194.2
10 13
152.1
Fluopicolide 383 173 15 11
Isopropalin 310.2
226.1
20 27 208.1
Metalaxyl-M 280.2 220.1
10 8.8
192.1
Metsulfuron-methyl 382.1 167.1 10 6.8
S-metolachlor 284.2 252.2 10 15
Penconazole 284.1
173
20 16 158.9
Tetraconazole 372.1 159 25 13
Tribenuron-methyl 396.1 155.1 10 8.1
S.2.3 Method validation
The proposed method was validated by evaluating parameters as linearity, matrix effect, limit of detection
(LOD), limit of quantification (LOQ), accuracy (in terms of recovery) and precision (in terms of repeatability).
The linearity was evaluated through the coefficient of determination (R2) of the analytical curves at
concentration levels between 1 and 2500 µg L-1. The solutions for the analytical curves were prepared in

72
methanol. Matrix effect was calculated comparing the slope of curves prepared in solvent and in the blank
extract. Precision was evaluated regarding repeatability and intermediate precision by estimating the relative
standard deviation (RSD) of the recovery percentage for each spiked level. The LOD and LOQ were calculated
using the method of signal-to-noise ratio, and the LOD was defined as the lowest concentration at which the
analytical signal could be reliably differentiated with a signal-to-noise ratio of 3:1. The LOQ was established
as the lowest spiked level concentration, which produced a signal-to-noise ratio of 10:1.
S.2.4 Optimization of SPE and HPLC-MS/MS method
Different sample volumes and sorbents were evaluated based on the characteristics of the selected PPPs. Four
SPE columns with different adsorbent including n-vinilpirrolidone-divinilbenzene (HLB), polystyrene-
divinylbenzene (ENV), styrene-divinylbenzene polymer modified with a non-polar surface (PPL) and
octadecylsilyl (C18) were tested.
The SPE PPL cartridge (styrene-divinylbenzene) and the use of methanol for the elution of the analytes,
showed the highest recovery rates ranging from 41% to 103%. Therefore the following optimized SPE method
was used for the selected pesticides in groundwater samples: Bond Elut PPL cartridges were conditioned with
5 mL of methanol, followed by 5 mL of ultra-pure water Milli-Q at a flow rate of 2,5 ml min-1, without allowing
the cartridge to dry out. Then, 500 mL of groundwater samples were passed through the conditioned cartridges
at a flow rate of approximately 8 mL min-1 under vacuum. The cartridges were firstly washed with a 2.5 mL
of ultra-pure water and dried for 1 h under vacuum. Afterwards the analytes were eluted from the solid phase
with 5 mL of methanol. The extracts were then evaporated to dryness under a stream of nitrogen and the
residues were dissolved in 0.2 mL of methanol for HPLC-MS/MS analysis.
For validation and quantitation purposes, additional recovery studies were carried out by adding a mix of
analytes standard solutions in 1000 and 500 mL of tap water and groundwater, obtaining the following final
concentration levels: 0.1, 0.5, 0.75, 1, 2.5 mg L-1. Each sample was extracted in triplicate.
The limit of quantification (LOQ), ranging from 0.0008 to 0.02 µg L-1, was found for the 15 compounds, under
the optimized experimental conditions, and were below the environmental quality standard (EQS) imposed by
the legislation for groundwater (Table 2S).
According to the results, a volume of 500 mL was considered sufficient for PPPs detection under level required
by the legislation (0.1 µg/L). Additionally, it was observed that extraction efficiency increases when adding

73
few drops of formic acid in each sample flask. Methanol proved to be the best solvent for the final suspension
of the extracts compared to a mixture of methanol:acetonitrile solution (1:1) and to hexane. Concerning the
HPLC-MS/MS method, technical parameters, flow and gradients percentage were optimized for a better
resolution of the chromatographic peaks.
For each pesticide two transitions were obtained, exept for Cyflufenamid and Cyprodinil for which three
transitions were acquired. The collision energy was between 10 and 25.. The method was optimized testing
several gradient percentages of mobile phases and different run times. The final run time selected was 30 min.
A post run of one minute was set up.
Table 2S. Limit of Quantification and R2 obtained for each pesticide
Pesticide LOQ (µg L-1) Linearity (R2)
Chlorpiriphos 0.02 0.95
Chlorpiriphos-methyl 0.02 0.96
Chlorantraniliprole 0.02 0.97
Cyflufenamid 0.004 0.97
Cyprodinyl 0.02 0.98
Dimetomorph 0.02 0.98
Flufenacet 0.02 0.97
Fluopicolide 0.02 0.99
Isopropalin 0.02 0.99
Metalaxyl-m 0.0008 0.99
Metsulfuron-methyl 0.0008 0.99
S-metolachlor 0.004 0.99
Penconazole 0.004 0.96
Tetraconazole 0.02 0.98
Tribenuron-methyl 0.02 0.99
S.2.5 Results of recovery tests
Table 3S shows the results of the recovery test averages and the respective standard deviation obtained for
each cartridge and pesticide, expressed as percentage.

74
Table 3S. Recovery percentage average of PPPs for each SPE cartridge
Pesticide HLB ENV PPL C18
Chlorpyrifos 63 ± 4.4a 24 ± 24ab 65 ± 3.4a 45 ± 0.7b
Chlorpyrifos-methyl 44 ± 10.3ac 13 ± 12.5bc 43 ± 4.6ab 23 ± 0.4c
Chlorantraniliprole 64 ± 1.6a 58 ± 1.6a 68 ± 2.1a 5 ± 0.7b
Cyflufenamid 45 ± 10.6b 113 ± 41.5a 56 ± 2.7a 0 ± 0c
Cyprodinil 35 ± 1a 26 ± 26.4ab 70 ± 2.7a 14 ± 1.5b
Dimetomorph 46 ± 13.3a 19 ± 19.3ab 42 ± 0.05a 0 ± 0b
Flufenacet 117 ± 12.7a 68 ± 27.6abc 45 ± 2b 0.1 ± 0.1c
Fluopicolide 40 ± 2.1a 34 ± 5.4a 48 ± 4.6a 0 ± 0b
Isopropalin 0 ± 0b 0 ± 0b 41 ± 4a 0 ± 0b
Metalaxyl-m 56 ± 1a 55 ± 1.5a 63 ± 3.6a 0 ± 0b
Metsulfuron-methyl 51 ± 3.9a 82 ± 18.5ab 68 ± 1.7ab 42 ± 2.1b
S-metolachlor 61 ± 4.9a 39 ± 17.5ab 51 ± 6.2a 0 ± 0b
Penconazole 89 ± 4.5a 63 ± 13.4ab 76 ± 2.7b 19 ± 0.7c
Tetraconazole 82 ± 2.3a 56 ± 12.5ab 52 ± 3.2b 0 ± 0c
Tribenuron-methyl 76 ± 3.4a 88 ± 0.7a 72 ± 12.9a 28 ± 2.6b
Note: the letter “a”, indicated at the apex of each value, suggests the highest average value and if there is no significantly difference
among the cartridges the letters indicated are equal, on the contrary, if the letters are different, this means there is a significantly
difference.
The one way ANOVA, performed taking into consideration a P value of ≤0.05, shows that at least one of the
calculated percentage averages was significantly different from the other. The student t was then performed
for each pesticide in order to determinate which cartridge had the highest recovery percentage. Table 3S shows
an average of the total recovery tests carried out. The cartridge C18 revealed to be the worst filter because
seven compounds were not recovered. The cause can be attributed to the lack of affinity for pesticides under
study and therefore to absorbent phase.
Based on the statistical analysis the Bond Elut PPL was the cartridge with an accettable performance for most
of thepesticides selected and the only one able to recover Isopropalin, Additional recovery tests were further
carried out in triplicate by use of PPL cartridge and adding a concentration equal to the EQS limit of 0.1 µg L-
1 in 500 mL of tap water.
S.2.6 Priority list of PPPs

75
Table 4S. List of chemicals and their properties found by the untargeted analysis carried out on the
groundwater samples
Compound name Type GUS index1 Koc1 DT501 Water solubility1
2,3,5-Trimethacarb (Landrin) Insecticide 2.49 400 50 58
Ascaridole Anthelmintic in
veterinary medicine
- - - -
Atrazine-2-ethylamino Atrazine metabolite - - - -
BTS 27919 (N-(2,4-
dimethylphenyl)formamide)
Amitraz metabolite - - - -
Butyl paraben Generic preservative - - - -
Chlorantraniliprole Insecticide 4.22 362 204 0.88
DEET (Diethyltoluamide) Insecticide - 277 - 912
Defenuron Herbicide - - - -
Dimetan Insecticide (revoked) - - - -
Dimethirimol Fungicide 4.25 90 1202 1200
Dimetomorph Fungicide 2.56 348 44 28.95
Fluopicolide Fungicide 3.63 321.1 271 2.8
Formetanate Insecticide
Glufosinate Herbicide - - - -
Isopamphos Fungicide
Isopropalin Herbicide 0.00 10000 100 0.11
Metalaxyl-m Fungicide 1.71 78.9 14.1 26000
Metaldehyde Molluscicide 1.5 240 5.12 188
Nitrophenol, 4- Intermediate of
generic synthesis
- - - -
Pindone (Pival) Rodenticide - - - 18
Pirimicarb Insecticide 2.63 388 9 3100
Pirimicarb, desmethyl Pirimicarb metabolite - - - -
Pirimicarb-desmethyl-
formamide
Pirimicarb metabolite - - - -
p-Nonylphenol (4-Nonylphenol) Surfactant - - - -
Salbutamol (Albuterol) Bronchodilator drug - - - -
Terbutaline Bronchodilator drug - - - -
Trimethacarb Insecticide 2.49 400 50 58
1 Lewis K.A., Tzilivakis, J., Warner, D. and Green (2016) An international database for pesticide risk assessments and management. International
Journal of Human and Ecological Risk Assessment; 2Typical value

76
Table 4S shows that fourteen PPPs were detected in the groundwater samples: five insecticides
(Chlorantraniliprole, DEET, Dimetan, Pirimicarb, Trimethacarb), three herbicides (Defenuron, Glufosinate,
Isopropalin) and five fungicides (Dimethirimol, Dimetomorph, Fluopicolide, Isopamphos, Metalaxyl-m).
Among the insecticides and the herbicides found, three result revoked: DEET (Diethyltoluamide), Dimetan
and Isopropanil, but the latter was taken into consideration for the pesticides list because it was declared to be
used by farmers (see Table 5S).
Table 5S. List of PPPs and their properties with high interest for stakeholders
Compound name Type GUS index1 Koc1 DT501 Water
solubility1
Acetolachlor Herbicide 1.58 156 12.1 282
Benomyl Fungicide -0.07 1900 672 2
Chlorantraniliprole Insecticide 4.22 362 204 0.88
Flufenacet Herbicide 2.02 401 19.7 51
Fluopicolide Fungicide 3.63 321.1 138.8 2.8
Isopropalin Herbicide 0.00 10000 100 0.11
Metsulfuron-methyl Herbicide 3.99 12 13.3 2790
Parathion-methyl Insecticide 1.46 240 10 55
S-metolachlor Herbicide 1.91 226.1 21 480
Terbuthylazine Herbicide 3.04 231 21.8 6.6
Tribenuron-methyl Herbicide 2.4 35 3.6 2480
1 Lewis K.A., Tzilivakis, J., Warner, D. and Green (2016) An international database for pesticide risk assessments and management. International
Journal of Human and Ecological Risk Assessment; 2Typical value
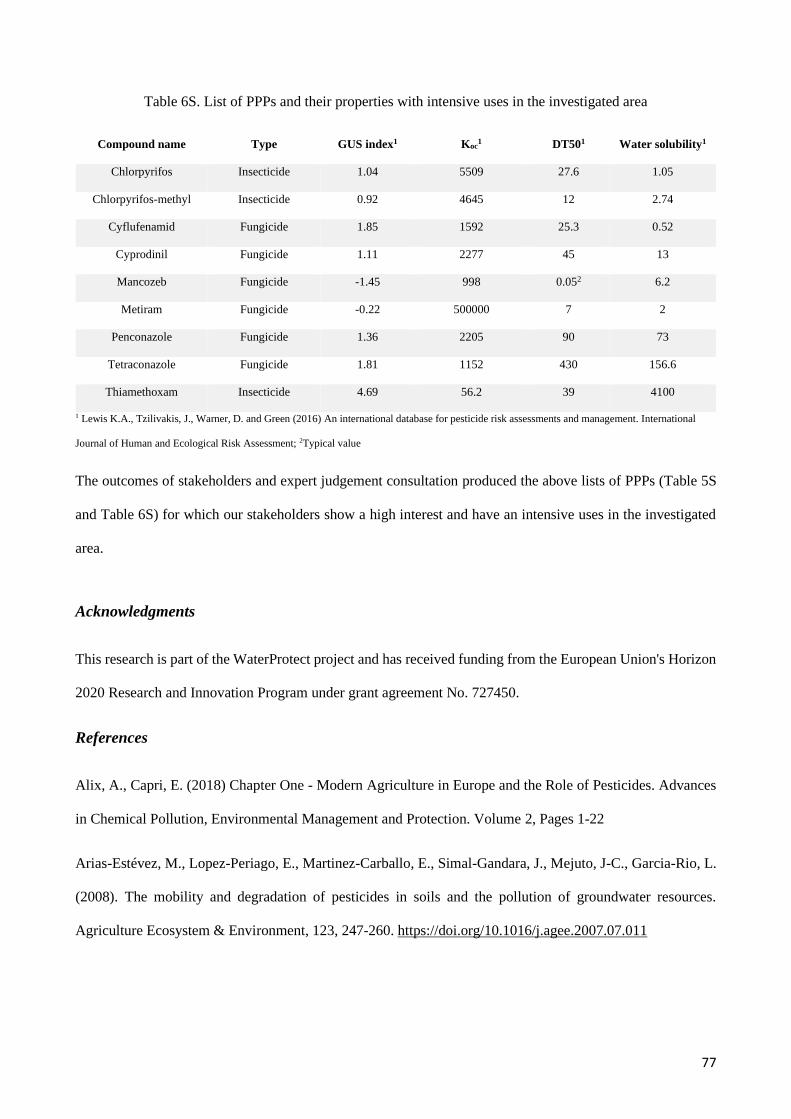
77
Table 6S. List of PPPs and their properties with intensive uses in the investigated area
Compound name Type GUS index1 Koc1 DT501 Water solubility1
Chlorpyrifos Insecticide 1.04 5509 27.6 1.05
Chlorpyrifos-methyl Insecticide 0.92 4645 12 2.74
Cyflufenamid Fungicide 1.85 1592 25.3 0.52
Cyprodinil Fungicide 1.11 2277 45 13
Mancozeb Fungicide -1.45 998 0.052 6.2
Metiram Fungicide -0.22 500000 7 2
Penconazole Fungicide 1.36 2205 90 73
Tetraconazole Fungicide 1.81 1152 430 156.6
Thiamethoxam Insecticide 4.69 56.2 39 4100
1 Lewis K.A., Tzilivakis, J., Warner, D. and Green (2016) An international database for pesticide risk assessments and management. International
Journal of Human and Ecological Risk Assessment; 2Typical value
The outcomes of stakeholders and expert judgement consultation produced the above lists of PPPs (Table 5S
and Table 6S) for which our stakeholders show a high interest and have an intensive uses in the investigated
area.
Acknowledgments
This research is part of the WaterProtect project and has received funding from the European Union's Horizon
2020 Research and Innovation Program under grant agreement No. 727450.
References
Alix, A., Capri, E. (2018) Chapter One - Modern Agriculture in Europe and the Role of Pesticides. Advances
in Chemical Pollution, Environmental Management and Protection. Volume 2, Pages 1-22
Arias-Estévez, M., Lopez-Periago, E., Martinez-Carballo, E., Simal-Gandara, J., Mejuto, J-C., Garcia-Rio, L.
(2008). The mobility and degradation of pesticides in soils and the pollution of groundwater resources.
Agriculture Ecosystem & Environment, 123, 247-260. https://doi.org/10.1016/j.agee.2007.07.011

78
Battany, M., C., Grismer, M., E. (2000). Development of a portable field rainfall simulator for use in hillside
vineyard runoff and erosion studies. Hydrological Processes, 14(6), 1119-1129.
https://doi.org/10.1002/(SICI)1099-1085(20000430)14:6<1119::AID-HYP8>3.0.CO;2-O
Croghan, C AND P P. Egeghy. (2003). METHODS OF DEALING WITH VALUES BELOW THE LIMIT
OF DETECTION USING SAS. Presented at Southeastern SAS User Group, St. Petersburg, FL, September
22-24.
Donato, F., F., Martins, M., L., Munaretto, J., S., Prestes, O., D., Adaime, M., B., Zanella, R. (2015).
Development of a Multiresidue Method for Pesticide Analysis in Drinking Water by Solid Phase Extraction
and Determination by Gas and Liquid Chromatography with Triple Quadrupole Tandem Mass Spectrometry.
J. Braz. Chem. Soc., 26(10). https://doi.org/10.5935/0103-5053.20150192
EPA, Guidance for Data Quality Assessment. (2000). Practical Methods for Data Analysis.
European Commission (EC), (2006). Directive 2006/118/EC of the European Parliament and of the Council
of 12 December 2006 on the protection of groundwater against pollution and deterioration.
http://data.europa.eu/eli/dir/2006/118/oj
European Commission (EC), (2009a). Regulation No 1107/2009 of the European Parliament and of the
Council of 21 October 2009 concerning the placing of plant protection products on the market and repealing
Council Directives 79/117/EEC and 91/414/EEC. http://data.europa.eu/eli/reg/2009/1107/oj
European Commission (EC), (2009b). Directive 2009/128/EC of the European Parliament and of the Council
of 21 October 2009 establishing a framework for Community action to achieve the sustainable use of pesticides
(Text with EEA relevance). http://data.europa.eu/eli/dir/2009/128/oj
European Commission (EC), (2000). Directive 2000/60/EC of the European Parliament and of the Council
establishing a framework for the Community action in the field of water policy. Water Framework Directive.
http://data.europa.eu/eli/dir/2000/60/oj
European Commission (EC), (2010). Guidance document on pesticide residue analytical method.
79
Fu, G., C. 2008. The Development of Versatile Methods for Palladium-Catalyzed Coupling Reactions of Aryl
Electrophiles through the Use of P(t-Bu)3 and PCy3 as Ligands. Accounts of Chemical Research, 41 (11),
1555-1564. DOI: 10.1021/ar800148f
Gonzalez-Rodriguez, R., M., Rial-Otero, R., Cancho-Grande, B., Gonzalez-Barreiro, C., Simal-Gandara, J.
(2011). A Review on the Fate of Pesticides during the Processes within the Food-Production Chain. Food
Science and Nutrition, 1549-7852. https://doi.org/10.1080/10408390903432625
Herrero-Hernández, E., Andrades, M. S., Álvarez-Martín, A., Pose-Juan, E., Rodríguez-Cruz, M. S., &
Sánchez-Martín, M. J. 2013. Occurrence of pesticides and some of their degradation products in waters in a
Spanish wine region. Journal of Hydrology, 486, 234–245. https://doi.org/10.1016/j.jhydrol.2013.01.025
Hildebrandt, A., Guillamón, M., Lacorte, S., Tauler, R., & Barceló, D. (2008). Impact of pesticides used in
agriculture and vineyards to surface and groundwater quality (North Spain). Water Research, 42(13), 3315–
3326. https://doi.org/10.1016/j.watres.2008.04.009
Jeong, Y., Schäffer, A., & Smith, K. 2017. Equilibrium partitioning of organic compounds to OASIS HLB®
as a function of compound concentration, pH, temperature and salinity. Chemosphere, 174, 297–305.
https://doi.org/10.1016/j.chemosphere.2017.01.116
Khan, M. N., Mobin, M., Abbas, Z. K., & Alamri, S. A. 2018. Fertilizers and Their Contaminants in Soils,
Surface and Groundwater. In Encyclopedia of the Anthropocene (Vol. 5). Elsevier Inc.
https://doi.org/10.1016/b978-0-12-809665-9.09888-8
MIPAAF- Ministero delle politiche Agricole, Alimentari e Forestali (2014) Interministerial Decree of 22
January 2014, n.35. Adoption of the national action plan for the sustainable use of plant protection products,
pursuant to article 6 of the legislative decree no. 150 bearing: "Implementation of Directive 2009/128 / EC
establishing a framework for Community action for the sustainable use of pesticides". (14A00732) (OJ General
Series n.35 of 12-2-2014).
ISPRA, 2018. Pesticides in water Italian monitoring 2016. Synthesis report. Report 289/2018.

80
Laini, A., Bartoli, M., Lamastra, L., Capri, E., Balderacchi, M., Trevisan, M. (2012). Herbicide contamination
and dispersion pattern in lowland springs. Science of The Total Environment, 438, 312-318.
https://doi.org/10.1016/j.scitotenv.2012.08.080
Lamastra, L., Balderacchi, M., Di Guardo, A., Monchiero, M., Trevisan, M. (2016). A novel fuzzy expert
system to assess the sustainability of the viticulture at the wine-estate scale. Science of The Total Environment,
572, 724-733. https://doi.org/10.1016/j.scitotenv.2016.07.043
Lewis, K. A., Tzilivakis, J., Warner, D. J., & Green, A. (2016). An international database for pesticide risk
assessments and management. Human and Ecological Risk Assessment, 22(4), 1050–1064.
https://doi.org/10.1080/10807039.2015.1133242
Lucini, L., Pellegrino, R., Cimino, N., Kane, D., & Pretali, L. (2015). QqQ and Q-TOF liquid chromatography
mass spectrometry direct aqueous analysis of herbicides and their metabolites in water. International Journal
of Mass Spectrometry, 392, 16–22. https://doi.org/10.1016/j.ijms.2015.08.017
Morris, B.L.; Lawrence, A.R.L.; Chilton, P.J.C.; Adams, B.; Calow, R.C.; Klinck, B.A. (2003). Groundwater
and its susceptibility to degradation: a global assessment of the problem and options for management. United
Nations Environment Programme, 126pp. http://nora.nerc.ac.uk/id/eprint/19395
Nario, A., Parada, A., M., Videla, X., Pino, I., Acuña, M., Casanova, M., Seguel, O., Luzio, W., Balderacchi,
M., Capri, E., Moya, J., Astete, R., Enriquez, P., Chamorro, J. (2018). Chapter 17 - Indicators of Good
Agricultural Practices in: Viticulture in Integrated Analytical Approaches for Pesticide Management. 261-270.
https://doi.org/10.1016/B978-0-12-816155-5.00017-8
Note, A. (n.d.). Analysis of Carbaryl and Carbofuran in Drinking Water with Post-Column Derivatization
Using Agilent ’ s New LC Column and SampliQ SPE. 1–6.
T. L. Ogden. (2010). Handling results below the level of detection, The Annals of Occupational Hygiene, 54-
3, 255–256, https://doi.org/10.1093/annhyg/mep099
Padovani, L., Trevisan, M., Capri, E. (2004). A calculation procedure to assess potential environmental risk of
pesticides at the farm level. Ecological Indicators, 4(2), 111-123.
https://doi.org/10.1016/j.ecolind.2004.01.002
81
Petersen J., Grant R., Larsen S. E. and Blicher-Mathiesen G. (2012). Sampling of herbicides in streams during
flood events. Journal of Environmental Monitoring 2012, 14, 3284–3294. DOI: 10.1039/c2em30771e
Petrie, A., and P. F. Watson. (2006). Statistics for veterinary and animal science. Second edition. Blackwell
Publishing Ltd., Oxford, UK.
Pimentel, D., Levitan, L. (1986). Pesticides: Amounts Applied and Amounts Reaching Pests. BioScience, 36,
86-91. DOI: 10.2307/1310108.
Pose-Juan, E., Sánchez-Martín, M. J., Andrades, M. S., Rodríguez-Cruz, M. S., & Herrero-Hernández, E.
(2015). Pesticide residues in vineyard soils from Spain: Spatial and temporal distributions. Science of the Total
Environment, 514, 351–358. https://doi.org/10.1016/j.scitotenv.2015.01.076
Postigo, C., & Barceló, D. (2015). Synthetic organic compounds and their transformation products in
groundwater: Occurrence, fate and mitigation. Science of the Total Environment, 503–504, 32–47.
https://doi.org/10.1016/j.scitotenv.2014.06.019
Rocchetti, G., Chiodelli, G., Giuberti, G., Ghisoni, S., Baccolo, G., Blasi, F., Montesano, D., Trevisan, M., &
Lucini, L. 2018. UHPLC-ESI-QTOF-MS profile of polyphenols in Goji berries (Lycium barbarum L.) and its
dynamics during in vitro gastrointestinal digestion and fermentation. Journal of Functional Foods,
40(December 2017), 564–572. https://doi.org/10.1016/j.jff.2017.11.042
Serpa, D., Nunes, J. P., Keizer, J. J., & Abrantes, N. (2017). Impacts of climate and land use changes on the
water quality of a small Mediterranean catchment with intensive viticulture. Environmental Pollution, 224,
454–465. https://doi.org/10.1016/j.envpol.2017.02.026
Singh, S., Raju, N. J., & Ramakrishna, C. (2015). Evaluation of Groundwater Quality and Its Suitability for
Domestic and Irrigation Use in Parts of the Chandauli-Varanasi Region, Uttar Pradesh, India. Journal of Water
Resource and Protection, 07(07), 572–587. https://doi.org/10.4236/jwarp.2015.77046
SOeS, 2015. Les pesticides dans les cours d’eau français en 2013 (Pesticides in French rivers in 2013). Chiffres
& statistiques n° 697 novembre 2015. Commissariat général au développement durable - Service de
l’observation et des statistiques – SOeS. ISSN: 2102-6378. http://www.statistiques.developpement-
durable.gouv.fr

82
Stone, W.W., Gilliom, R.J. and Martin, J.D. (2014). An overview comparing results from two decades of
monitoring for pesticides in the Nation’s streams and Rivers, 1992–2001 and 2002–2011. U.S. Geological
Survey Scientific. Investigations Report 2014–5154, 23 p. http://dx.doi.org/10.3133/sir20145154
Storck, V., Lucini, L., Mamy, L., Ferrari, F., Papadopoulou, E. S., Nikolaki, S., Karas, P. A., Servien, R.,
Karpouzas, D. G., Trevisan, M., Benoit, P., & Martin-Laurent, F. 2016. Identification and characterization of
tebuconazole transformation products in soil by combining suspect screening and molecular typology.
Environmental Pollution, 208, 537–545. https://doi.org/10.1016/j.envpol.2015.10.027
Swartjes, F. A., & Van der Aa, M. (2020). Measures to reduce pesticides leaching into groundwater-based
drinking water resources: An appeal to national and local governments, water boards and farmers. Science of
the Total Environment, 699, 134186. https://doi.org/10.1016/j.scitotenv.2019.134186
Tang, Y., Xu, Y., Li, F., Jmaiff, L., Hrudey, S. E., & Li, X. F. 2016. Nontargeted identification of peptides and
disinfection byproducts in water. Journal of Environmental Sciences (China), 42, 259–266.
https://doi.org/10.1016/j.jes.2015.08.007
Trevisan, M., Errera, G., Capri, E., Padovani, L., Del Re, A., A., M. (1999). Environmental potential risk
indicator for pesticides. In: Reus, J., Leendertse, P., Bockstaller, C., Fomsgaard, I., Gutsche, V., Lewis, K.
Nilsson, C., Pussemier, L., Trevisan, M., van der Werf, H., Alfarroba, F., Blümel S., Isart J., McGrath D.,
Seppälä T. (eds) Comoaring Environmental Risk Indicators for Pesticides: Results of the European CAPER
Project. Centre for Agriculture and the Environment, Utrecht, The Netherlands, pp. 141-147.
Thiollet-Scholtus, M., & Bockstaller, C. (2015). Using indicators to assess the environmental impacts of wine
growing activity: The INDIGO® method. European Journal of Agronomy, 62, 13–25.
https://doi.org/10.1016/j.eja.2014.09.001
Vassiliou, G. (2016). Factors Affecting Risk Assessment of Pesticides in Water Bodies: A Review. MOJ
Toxicology, 2(1), 1–8. https://doi.org/10.15406/mojt.2016.02.00030
Vischetti, C., Monaci, E., Cardinali, A., Casucci, C., Perucci, P. (2008). The effect of initial concentration, co-
application and repeated applications on pesticide degradation in a biobed mixture. Chemosphere, 72(11),
1739-1743. https://doi.org/10.1016/j.chemosphere.2008.04.065

83
Chapter 2.2
Evaluation of groundwater contamination sources by plant protection products in hilly vineyards
of Northern Italy
Nicoleta Suciua,e, Camilla Farolfia,e, Roberta Zambito Marsalaa,e, Elisabetta Russob, Marcello De Cremab,
Emanuela Peroncinib, Fausto Tomeib, Gabriele Antolinib, Marco Marcacciob, Vittorio Marlettob, Ruggero
Collac, Antonio Galloa, Ettore Caprie
a Università Cattolica del Sacro Cuore, Department for Sustainable Food Process, Via Emilia Parmense 84,
29122 Piacenza, PC, Italy
b ARPAE–Regional Agency for Prevention, Environment and Energy of Emilia-Romagna, via Po 5, 40139
Bologna, Italy
c Phytosanitary Consortium of Piacenza, Via Cristoforo Colombo 35, 29122 Piacenza, PC, Italy
d Università Cattolica del Sacro Cuore, Department of Animal Science, Food and Nutrition (DIANA), Via
Emilia Parmense 84, 29122 Piacenza, PC, Italy
e European Observatory on Sustainable Agriculture (OPERA), Università Cattolica del Sacro Cuore, Via
Emilia Parmense 84, 29122 Piacenza, PC, Italy
https://doi.org/10.1016/j.scitotenv.2020.141495

84
Abstract
In Europe, 25% of groundwater has poor chemical status. One of the main stressors is agriculture, with nitrates
and plant protection products (PPPs) causing failure in 18% and 6.5%, respectively, of groundwater bodies
(by area). EU legislation for the placement of the PPPs on the market is one of the most stringent in the world.
However, recent monitoring studies in hilly vineyards of Tidone Valley, north-west of Italy, show presence of
PPPs used for grapevine cultivation in 15 out of 26 groundwater wells monitored, at values above the
Environment Quality Standard (EQS) for groundwater (0.1 µg/L). However, no information about the
contamination sources are available. Therefore, the objective of the present work is to evaluate the groundwater
contamination sources by PPPs, in a small catchment with intensive viticulture, by collecting and integrating
monitoring data, sub-surface water movement data and territorial characteristics. The results show that in wells
used for PPP’s mixture preparation and sprayer washing located at the top of hilly vineyards, with low slope
and no water movement in the surrounding soil, the contamination is most likely from point sources. On the
contrary, for wells located in a fenced area at the bottom of the hill, far away from vineyards and being used
for drinking water production, the contamination is most likely from diffuse sources. Our results were used to
raise awareness on groundwater contamination from PPPs among farmers in the study area; moreover a
waterproof platform for sprayers washing, equipped with wastewater recovery and disposal system, able to
avoid point-source contamination, was implemented in a local demonstration farm. Several demonstration
activities were then organized with the farmers of the entire Valley in order to show its functionality and
promote its diffuse use.
Keywords
Pesticides, Vineyards, Tidone Valley, Groundwater monitoring, Stakeholder involvement, Best management
practices
Abbreviations
ARPAE Agenzia Regionale per la Prevenzione, l'Ambiente e l'Energia dell'Emilia-Romagna
BMP Best Management Practice
CD Cumulated Drainage
85
CWI Cumulated Water Inflow
CIA Confederazione Italiana Agricoltori
DEM Digital Elevation Model
DOS Degree Of Saturation
EEA European Environmental Agency
EFSA European Food Safety Authority
EFSA PPR European Food Safety Authority - Panel on Plant Protection Products and their Residues
EPA Environmental Protection Agency
EQS Environment Quality Standard
FOCUS FOrum for the Co-ordination of pesticide fate models and their UseGLM - Generalized Linear Model
GIS Geographic Information System
LOD Limit of Detection
LOQ Limit of Quantification
MM Mitigation Measure
MSE Mean Squared Error
PPPs Plant Protection Products
SAS Statistical Analysis Software
SETAC EMAG-Pest GW Society of Environmental Toxicology And Chemistry - Environmental Monitoring
Advisory Group on Pesticides - Groundwater expert group
VFS Vegetated filter strip
WFD Water Framework Directive
WL Water Level

86
WWAP World Water Assessment Programme
1. Introduction
Groundwater plays a substantial role in water supply, in ecosystem functioning and human well-being
(WWAP, 2015). In countries such as Austria, Germany, Italy or Denmark, more than 70% of the population's
water supply comes from groundwater (Martínez-Navarrete et al., 2011). Groundwater resources are subject
to increasing pressures, from both point - and diffuse - pollution sources. The main pressure factors are water
pollution, water abstraction and droughts, due to climate change (Brouwer et al., 2018). In Europe, 25% of
groundwater has poor chemical status (EEA, 2018). In particular, agricultural non-point source pollution has
been increasingly recognized as a primary contributor to water quality impairment and as a key water quality
problem worldwide (Tan et al., 2011; Kourakos et al., 2012). Many authors do not associate point pollution
with agriculture, except with livestock farms and manure depots (e.g. Balderacchi et al., 2013; Parris, 2011).
The overall growth of agricultural production has been achieved mainly through intensive use of inputs, such
as pesticides. In particular, Italy vineyard productivity requires several pesticide treatments especially against
pathogens as fungi and insects (Vischetti et al., 2008). Fungicides account for the largest share of pesticide
treatments in most vineyards, with an average of 12–15, up to 25–30 applications in the most problematic
conditions (Pertot et al., 2017). With the coming into force of the European directive 2009/128/EC (The
European Parliament and the Council of the European Union, 2009a), the sustainable use of Plant Protection
Products (PPPs) becomes a duty for all the European Member States (Suciu et al., 2011). Particular attention
is accorded to PPP contamination of groundwater. In fact, PPPs can reach groundwater indirectly as a result
of drift and run-off into adjacent or non-target environments (as non-point sources) or more directly via
leaching from application sites or PPP handling procedures (point sources). The directive 2006/118/EC of the
European Parliament and of the council of 12 December 2006 establishes specific measures to prevent and
control groundwater pollution. The groundwater quality standard of active substances in pesticides, including
their relevant metabolites, degradation and reaction products, is 0.1 μg/L for each individual pesticide and 0.5
μg/L for their sum (The European Parliament and the Council of the European Union, Annex 1, 2006/118/EC).
This value was also included in the EU Regulation 1107/2009/EC (formerly 91/414/EEC), concerning the
placing in the market of PPPs. The regulation establishes rules concerning authorization, placing on the market,
87
use and control of PPPs. The directive 2009/128/EC and the regulation1107/2009/EC (The European
Parliament and the Council of the European Union,2009b) represent a challenge for water quality management
and environmental risk assessment, environmental fate and exposure. Monitoring studies are very useful for
regulatory purposes to verify whether the concentration of chemicals exceeds predetermined trigger values
(e.g. 0.1 μg/L). However, they do not provide information on the origin of contamination (point and non-point
source pollution, Di Guardo and Finizio, 2016). Furthermore, to date, little guidance has been provided on
study designs of monitoring studies. SETAC EMAG-Pest GW, a group of regulatory, academic, and industry
scientists, was created in 2015 to establish scientific recommendations for conducting such studies (Gimsing
et al., 2019). “The need to tailor study designs to objectives, exposure assessment options, compound
properties and site characteristics complicates the development of standardised study designs.” (direct
quotation from Gimsing et al., 2019). As a foundation for groundwater leaching assessments, FOCUS (FOrum
for the Co-ordination of pesticide fate models and their Use) models are used in the pre-registration process to
evaluate the environmental fate (groundwater, surface water, soil, sediment, and air) of pesticides.
Unfortunately, the FOCUS Tier 1-3 simulations use standard scenarios and various refinements (Capri et al.,
2005). At Tier 4, monitoring data can be used. This framework is intentionally simplified and, thus, has a
number of constraints in the context, or application to, of either a site-specific evaluation or an evaluation of
the full range of leaching conditions encountered on an EU level (e.g. leaching karstic soils etc.). The EFSA
PPR Panel criticised the quality criteria in the FOCUS Tier 4 as too imprecise and the knowledge on
groundwater hydrology at the European level as insufficient to demonstrate a safe use of pesticides at EU level
(EFSA, 2013; European Commission, 2014).
As defined by the Water Framework directive (WFD) 2000/60/EC, “Groundwater” means all water that is
below the surface of the ground in the saturation zone and in direct contact with the ground or subsoil (The
European Parliament and the Council of the European Union, 2000).. The protection goal implicit in the
FOCUS groundwater modelling for EU registration is an overall vulnerability at the 90th percentile
considering both spatial and temporal vulnerability for the yearly average pesticide concentration in
groundwater, located at least one meter below the ground surface (EFSA, 2013). However, the representativity
of monitoring data should be assessed combining pedoclimatic vulnerability and groundwater hydrology
(Gimsing et al., 2019).
88
Recent monitoring studies (Zambito Marsala et al., 2020) in hilly vineyards in north-west of Italy, Province of
Piacenza, settled in the EU project WaterProtect, show presence of PPPs used for grapevine cultivation in 15
out of 26 groundwater wells monitored, at values above the Environment Quality Standard (EQS) for
groundwater (0.1 µg/L). Herrero-Hernández et al. (2013) reported similar results in groundwater of Spanish
vineyards. Indeed, concentrations above 0.1 μg L−1 were detected for 37 of the 47 compounds studied, and in
several cases recorded values of over 18 μg L−1. The results reveal the presence of pesticides in most of the
samples investigated. In 64% of groundwaters and 62% of surface waters, the sum of compounds detected was
higher than 0.5 μg L−1. Rabiet et al. (2010) for an agricultural catchment devoted to vineyard and located about
70 km north of Lyon, France, show PPPs presence in surface water for several months after PPPs application
and the results pointed out pesticides potential to persist in soils and shallow groundwater. The study of
Zambito Marsala et al., 2020 represents the first evaluation of PPPs occurrence in groundwater of Tidone
Valley and the authors highlighted the significant influence of the sampling time, slope of the soil surrounding
the wells, wells depth and wells location on the concentration of five PPPs. Furthermore, the authors suggested
the need for a deeper analysis of territorial context, including hydrology studies and farmer behavior during
PPPs storage and handling, and for an urgent introduction of best management practices and mitigation
measures to promote a sustainable use of PPPs in viticulture. In this context, the objective of the present work
is to evaluate the groundwater contamination sources by PPPs in one of the three catchments of the area
monitored by Zambito et al. (2020), by collecting and integrating monitoring data, sub-surface water
movement data and territorial characteristics. For sub-surface water movement, the hydrological three-
dimensional catchment-scale model CRITERIA 3D was used, while as territorial characteristics, the
pedoclimatic conditions, the acquifer conceptual model, farm management and farmers’ behavior during PPPs
storage and handling, were taken into account.
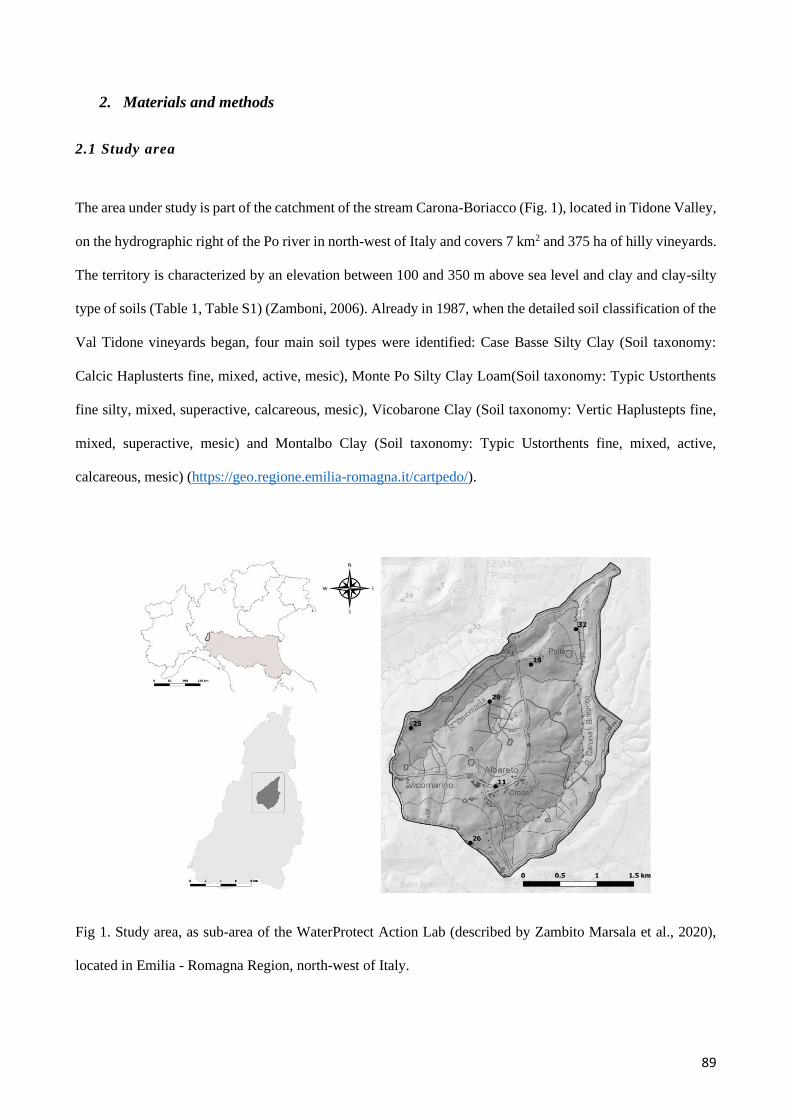
89
2. Materials and methods
2.1 Study area
The area under study is part of the catchment of the stream Carona-Boriacco (Fig. 1), located in Tidone Valley,
on the hydrographic right of the Po river in north-west of Italy and covers 7 km2 and 375 ha of hilly vineyards.
The territory is characterized by an elevation between 100 and 350 m above sea level and clay and clay-silty
type of soils (Table 1, Table S1) (Zamboni, 2006). Already in 1987, when the detailed soil classification of the
Val Tidone vineyards began, four main soil types were identified: Case Basse Silty Clay (Soil taxonomy:
Calcic Haplusterts fine, mixed, active, mesic), Monte Po Silty Clay Loam(Soil taxonomy: Typic Ustorthents
fine silty, mixed, superactive, calcareous, mesic), Vicobarone Clay (Soil taxonomy: Vertic Haplustepts fine,
mixed, superactive, mesic) and Montalbo Clay (Soil taxonomy: Typic Ustorthents fine, mixed, active,
calcareous, mesic) (https://geo.regione.emilia-romagna.it/cartpedo/).
Fig 1. Study area, as sub-area of the WaterProtect Action Lab (described by Zambito Marsala et al., 2020),
located in Emilia - Romagna Region, north-west of Italy.

90
Table 1. Soil and groundwater wells' characteristics.
2.2 Stakeholders involvement
As stated by Zambito et al. (2020), for the development of the sampling network and the characterization of
the territorial agricultural and fertilization practices in the Italian Action Lab of WaterProtect project, two
survey campaigns were conducted between August 2017 and June 2018, by the use of ad hoc questionnaires
involving 175 farmers in Tidone Valley. The farmers involved were from five municipalities: Ziano
Piacentino, 50.3%, Alta Val Tidone, 16%, Castel San Giovanni, 9.7%, Pianello Val Tidone, 6.9%, Borgonovo
Val Tidone, 4.6%, and other regions and municipalities, 12.5%. For farmers’ involvement an "active
engagement" methodology was adopted, through bilateral and multi-actor conversations and selecting strategic
places and timing, and in this respect the support of farmers’ organization Cantina Sociale Vicobarone, of
farmers’ unions Coldiretti, Confagricoltura and CIA, and of farmers’ consultancy organization Consorzio
Fitosanitario Provinciale, was fundamental (Calliera et al., 2020).
91
At the end of the sampling campaigns and involving three farmers from the study area, a third survey campaign
was conducted. The survey had the purpose of assessing farm management and PPPs use in farms, starting
from type of cultivation system up to the operations following PPP treatments, i.e. the management of
wastewater containing PPPs, equipment washing and waste disposal. The farmers involved are the owners of
4 of the 6 sampling groundwater wells and their farms covers 30.4% of the entire vineyards surface in the
study area.
2.3 Groundwater monitoring
Six groundwater wells (WP11, WP13, WP25,WP26, WP28 and WP32) part of the network developed by
Zambito Marsala et al. (2020) and selected based on an hydrological upstream – downstream criteria, were
monitored for the content of 15 PPPs (three insecticides, Chlorantraniliprole, Chlorpyrifos and Chlorpyrifos
methyl used on grapevine against Eupoecilia ambiguella, seven fungicides Cyflufenamid, Cyprodinil,
Dimethomorf, Metalaxyl-M, Penconazole, Tetraconazole, Fluopicolide, used on grapevine against downy and
powdery mildew, Ascomycetes, Basidiomycetes, Deuteromiceti, Septoria and Rhynchosporium, and five
herbicides, Flufenacet, Isopropalin, Metsulfuron-methyl, S-metolachlor, Tribenuron-methyl, not authorised
for grapevine cultivation but commonly used for cereals in conventional farming) between November 2017
and September 2018. The analytical and sampling procedures are described in Zambito Marsala et al. (2020).
The development of the sampling network was a long and complex process and took place between November
2017 and May 2018. For this reason, the first sampling campaign corresponds to November 2017 for wells
WP11 and WP 13 and to May 2018 for wells WP25, WP26, WP 28, WP32. Well characteristics are listed in
Table 1. Groundwater considered is surface phreatic water (shallow aquifer), fed by precipitation and, near the
watercourses, by the hydrological relationship. Indeed, well WP 32, which is used for drinking water extraction
and is located in the alluvial deposits of Stream Carona-Boriacco, is mainly recharged by the stream through
streambed and partially by the subsurface inflow, while five wells (WP 11, WP13, WP25, WP26 and WP28)
are recharged by rainwater and subsurface inflow.

92
2.4 Aquifer’s conceptual model
Based on hydrology studies of the regional environmental agency ARPAE (Regione Emilia-Romagna, 2010;
Farina et al., 2014), a wide permanent shallow aquifer - as requested by WFD for the definition of a
groundwater body - does not exist in the study area.
The silty-clayed sediment, the soil slope between 0 and 20°, the thickness lower than 3 m and the substrate
morphology, are the main parameters that government the groundwater movement in the shallow phreatic
aquifers of the study area. There isn't a recharge groundwater area able to sustain a perennial groundwater
flow, but when groundwater flow exists, is due to rainfall infiltration in the subsurface. Only into the alluvial
porous deposits in the valley bottom the groundwaters flow are mainly dependent by the Stream Carona-
Boriacco water level.
In the scheme of the versant from the crest to valley bottom of the study area (Fig. 2) are defined three zones
where are different types of the local storage of groundwater: Type A, located in the valley crests where the
slope is low (<3°) and recharge is only by rainfall inputs (wells 26 and 28); Type B, located in a middle zone
of valley versant where the slope is the medium (>5°) and recharge is by rainfall inputs and by subsurface
flows from Type A zones (wells 25, 11 and 13); Type C, located in the valley bottom where the slope is low
(<3°) and recharge has already been described (well 32).
Fig 2. Conceptual model of shallow aquifer (CMA)

93
The variability of the water table (Table 1) is less in the wells of Type B than in the other two types, because
the water table depending only rainfall input in the first and mainly water body Stream Carona-Boriacco in the
second. Furthermore in the zones of Type B the substrate morphology determines the presence of a local
depressions allows at groundwaters the permanence/stagnation (storage and accumulation) during dry periods.
These areas are located where the large-diameter perennial wells are present, as the six groundwater stations
of monitoring network.
2.5 Sub-surface water movement assessment
CRITERIA-3D is a physically based, three-dimensional catchment-scale model of surface and subsurface soil
water balance developed by ARPAE (Bittelli et al., 2010). The model is based on the integrated finite
difference (also called cell-centered finite volume scheme) method and accounts for saturated water flow,
unsaturated water flow and surface runoff; the model is coupled with interpolation schemes for mapping the
meteorological input variables (Antolini et al., 2015), and a topography-dependent solar radiation model.
Spatial interpolation uses as input data from a monitoring network providing hourly data of temperature,
precipitation, relative humidity, wind speed and solar irradiance, and takes into account topography
dependencies by means of a DEM (Digital Elevation Model). A soil map is also needed as input with
parameters for hydraulic properties and parameters. The soil hydraulic properties are computed using the
modified Van Genuchten-Mualem model proposed by Ippisch et al. (2006). The model was validated both in
its 1D version (Tomei et al., 2007) and 3D version (Bittelli et al., 2010). The model is freely available at the
following link: https://github.com/ARPA-SIMC/CRITERIA3D.
CRITERIA-3D has already been coupled in previous works with phenology and plant growth models specific
for grapevine (Bois et al., 2014). The phenology models (Bindi et al., 1997; Caffarra and Eccel, 2011) simulate
the main development stages for grapevine and are computed at a daily time step. Plant growth is computed
by simulating the photosynthetic process at hourly time step through the Farquhar equation, following the
implementation of Magnani et al., (2009). The model estimates biomass accumulation and water uptake, while
water stress acts in the process by reducing stomatal conductance (Lebon et al., 2003). The parameters used
for scenario development and sub-surface water movement simulations are shown in Tables S1, S2 and S3 of
supplementary material.
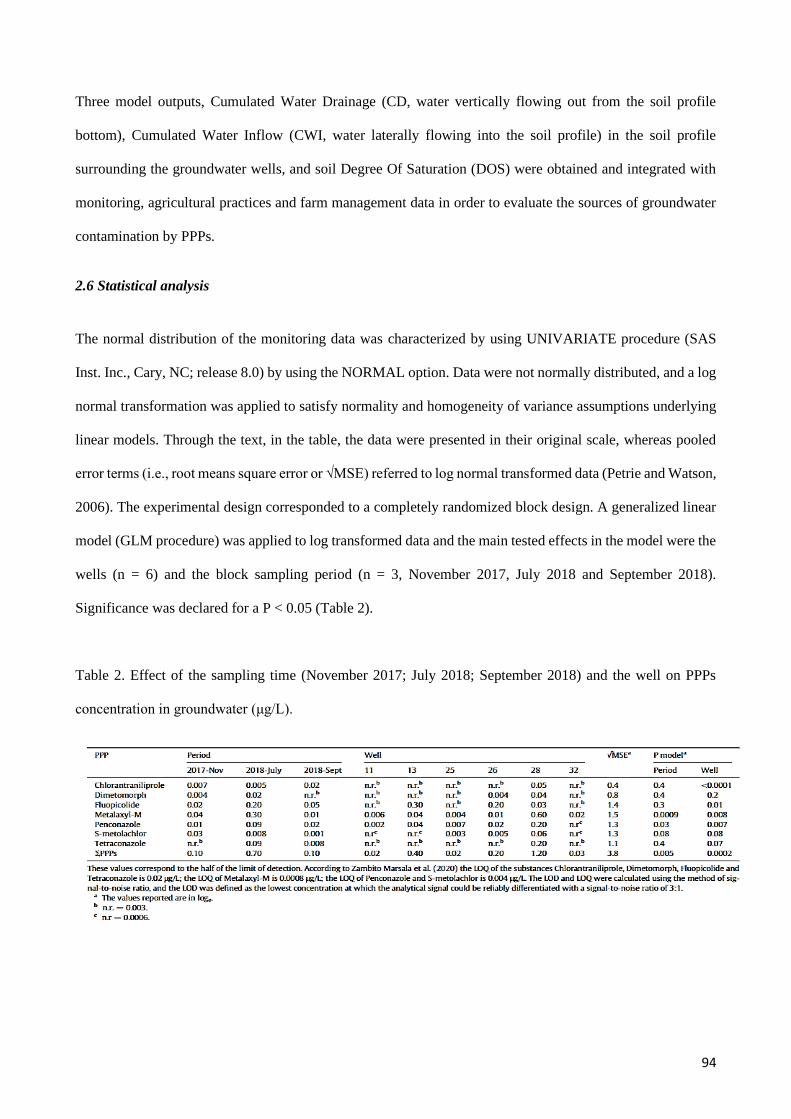
94
Three model outputs, Cumulated Water Drainage (CD, water vertically flowing out from the soil profile
bottom), Cumulated Water Inflow (CWI, water laterally flowing into the soil profile) in the soil profile
surrounding the groundwater wells, and soil Degree Of Saturation (DOS) were obtained and integrated with
monitoring, agricultural practices and farm management data in order to evaluate the sources of groundwater
contamination by PPPs.
2.6 Statistical analysis
The normal distribution of the monitoring data was characterized by using UNIVARIATE procedure (SAS
Inst. Inc., Cary, NC; release 8.0) by using the NORMAL option. Data were not normally distributed, and a log
normal transformation was applied to satisfy normality and homogeneity of variance assumptions underlying
linear models. Through the text, in the table, the data were presented in their original scale, whereas pooled
error terms (i.e., root means square error or √MSE) referred to log normal transformed data (Petrie and Watson,
2006). The experimental design corresponded to a completely randomized block design. A generalized linear
model (GLM procedure) was applied to log transformed data and the main tested effects in the model were the
wells (n = 6) and the block sampling period (n = 3, November 2017, July 2018 and September 2018).
Significance was declared for a P < 0.05 (Table 2).
Table 2. Effect of the sampling time (November 2017; July 2018; September 2018) and the well on PPPs
concentration in groundwater (μg/L).

95
3. Results and Discussion
3.1 Surveys results
The results of the two surveys conducted between August 2017 and June 2018, involving 175 farmers of
Tidone Valley, and described in details by Calliera et al. (2020) and Zambito Marsala et al. (2020) show a
moderate to low level of adoption of best management practices (BMPs) and mitigation measures (MMs)
capable to prevent water contamination by PPPs. In some cases, the existing practices and measures are used
in an incorrect way, as in the case of vegetated filter strip (VFS) at edge-of-field, which are present in 52% of
farms but in a high percentage are used for vehicles’ passage. Furthermore, suggested good agricultural
practices, such as specific VFS at landscape level (to avoid diffuse contamination), or correct management of
wastewater resulting from the internal and external machine cleaning (to avoid point source contamination)
are discredited by farmers for several reasons, such as not always compatible with farmers’ work organization
and landscape situations, their impact is not ensured, farmers need more information, or are not economically
feasible (Calliera et al. 2020).
Regarding the study area and considering the results of the third survey, it was observed that just one of the
three farms follows the guidelines of integrated pest management and implemented VFS at field edge while in
two of the three farms the vineyard grass cover is the only practice adopted to avoid water contamination due
to run-off. Furthermore, in order to avoid water contamination due to drift, two of the three farms adopted
systems for regulating the direction of the air flow in combination with anti-drift nozzles. However, no other
measures, for example a plant barrier or an insect/hail net, are adopted.
Concerning wastewater management, none of the three farms adopts an individual farm or co-operative
wastewater management system, such as dedicated areas for sprayer washing, equipped with wastewater
recovery and disposal systems. The internal remaining mixture is further distributed in the field, after dilution,
but the water resulting from the external washing of the sprayers is not collected. No farm has a collecting
system for washing water and/or residual mixture and the washing of sprayers is done simply outdoors. No
further information was provided by the farmers. Furthermore, the wells WP 11, WP 13, WP 25, WP 26 and
WP 28 are present in the farms and WP 28 is e used for PPPs mixtures and sprayers washing.

96
3.2 Groundwater monitoring
The monitoring results of the three sampling campaigns show the sum of 15 PPPs below the EQS (0.5 µg/L)
in wells WP 25, WP 26, WP 11, and WP 32 with the highest value registered in September 2018 in well WP26,
0.3 µg/L. Fluopicolide, Metalaxyl-M, Penconazole and S-Metolachlor were the most frequently detected
substances. Wells WP 28 and WP 13 were characterized by greatest contamination, with values for ΣPPPs
higher than EQS in July 2018 (2.8 µg/L, well WP 28 and 0.99 µg/L, well WP 13). In well WP 32, a well-used
for drinking water abstraction, the only PPP revealed was Metalaxyl-M, in July 2018, at values below EQS
(0.1 µg/L). Sampling time was shown to have a significant influence on PPPs concentrations in groundwater,
with significantly higher value for Σ7PPPs in July 2018. This could be explained by the fact that almost 95%
of pesticide treatments for grape protection have been already carried out by July (expert judgment). However,
Metalaxyl-M was the only PPP present in all the wells at values higher than limit of quantification (LOQ)
while the second most found PPP was Penconazole. For statistical analysis, when PPPs were not detected, the
half value of the LOD was used to allow the log transformation of data, as suggested by Ogdan (2010), Croghan
et al. (2003) and according to the Guidance for Data Quality Assessment of EPA (2000). Comparing our results
with those of Herrero-Hernández et al. (2013) reported for the groundwater of Spanish vineyards, four of the
forty-seven PPPs analysed in the Spanish study are present in this study: Chlorpyrifos, Cyprodinil,
Dimethomorf and Penconazole, while for S-metolachlor and Metalaxyl – M, analysed in the present study, the
enantiomers Metalaxyl and Metolachlor were screened for in Spanish groundwater. Metalaxyl, Penconazole,
Dimethomorf and Metolachlor were found in 50%, 46%, <5% and <15%, respectively, of Spanish groundwater
samples, with the highest concentration of Metalaxyl and Penconazole, as in the present study. Furthermore,
Herrero-Hernández et al. (2013) reported an influence of well depth on PPPs concentrations in groundwater,
with the shallow wells being the most contaminated. This is in agreement with our results, as wells WP 13 and
WP28, resulted the most contaminated, and are also the most superficial, with a depth below 5.5 m. However,
in the recent study of Herrero-Hernández et al. (2020) in a Spanish vineyard region included in the
Denomination of Origin Jumilla reported lower frequencies of fungicides in water samples than the other
groups of pesticides. This may be due to their unusual or low application in that area, with climatic conditions
97
that do not favor the onset of fungal diseases. Some of the compounds studied were detected even in wells
reaching down to 400 m.
3.3 Sub-surface water movement and contamination sources evaluation
The results of the model simulations, showing CD and CWI and DOS for the soil surrounding the six
groundwater wells, are presented in the Fig. 3, Fig. 4, Fig. 5. In general, the cumulated water movement (CD
and CWI) in the soil surrounding the six groundwater wells is low, with values between near zero and
maximum 15 mm during the entire period, mainly due to the clayey soils present in the study sub-area. These
values, together with the slope and well position, at the top, bottom or middle of the hill, allowed a quite clear
distinction between the six wells. Three types “A”, “B” and “C” were hypothesized (Fig. 2). Wells WP 26 and
WP 28 are of type “A”, located on hilltop and with low slope. Water movement in the surrounding soils is
almost negligible (Fig. 3) and the recharge of the aquifer is only through rainfall. Furthermore, the water level
(WL) in the well is consistent with soil saturation level, maximum when the WL is highest. For well WP 26
the ΣPPPs in groundwater (μg/L) was higher in July and September compared to May, while for well WP 28
the highest concentrations were observed in July. However, the increase cannot be due to water movement as
between May and September no water drainage or lateral movement were registered (Fig. 3). The PPPs found
in well WP 28 above EQS in July were Dimetomorph, Metalaxyl-M, Penconazole and Tetraconazole, while
in well WP 26 was Fluopicolide. Therefore, for Well WP 26, even though there is no water entering the aquifer,
concentrations are increasing in time and this is dominated by Fluopicolide, which is a fairly persistent
substance (EFSA, 2009). As contamination cannot be from leaching, it must be point source and when in the
aquifer, Fluopicolide does not degrade. For well WP28, again, even though there is no water entering the
aquifer, there is an increase of concentrations in July and this is dominated by Metalaxyl-M and Penconazole,
which are not persistent substances. Penconazole was also found in September, at a value one quarter of the
level detected in July, but remaining above EQS. Therefore, as Penconazole is a PPP with a fast degradation
rate in water (EFSA, 2008), most probably, it was used after July and this is in agreement with the fungal
disease in the area in August (expert statement). Also in this case, there is point-source entry followed by
chemical transformation in the aquifer. Possible point sources are losses during pesticides mixture preparation,
containers cleaning or inappropriate discharge of water resulted from sprayer cleaning. Indeed, the water of
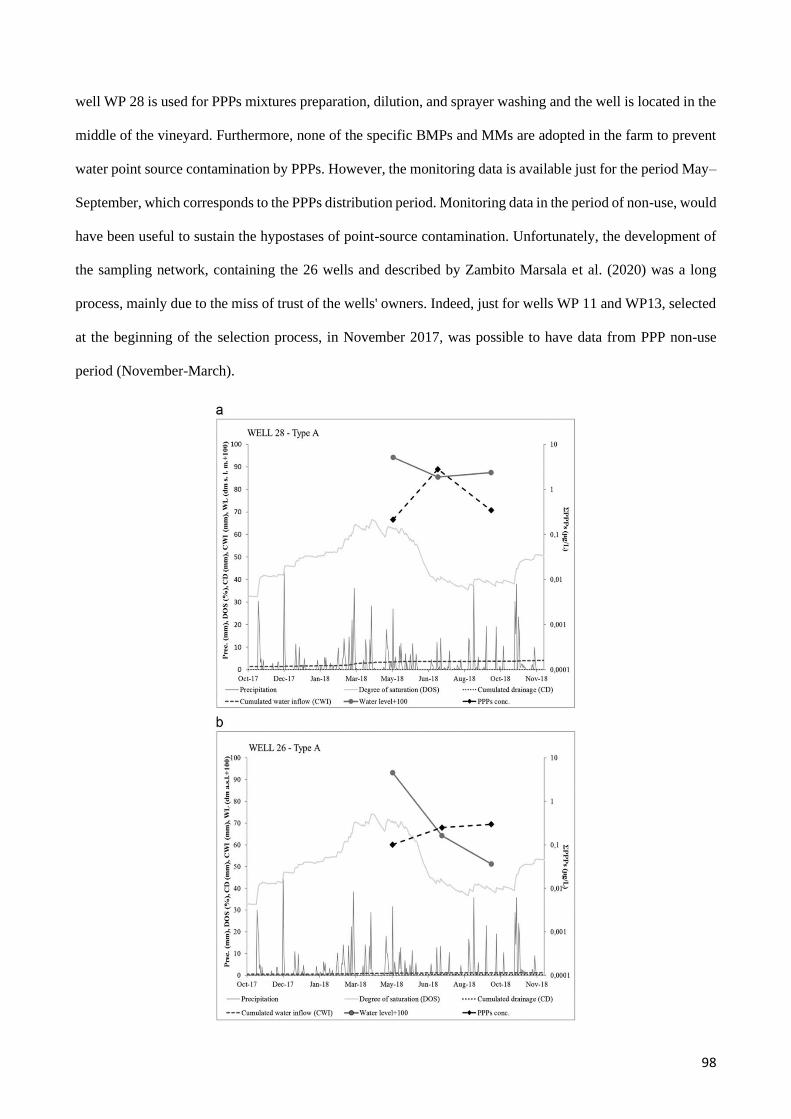
98
well WP 28 is used for PPPs mixtures preparation, dilution, and sprayer washing and the well is located in the
middle of the vineyard. Furthermore, none of the specific BMPs and MMs are adopted in the farm to prevent
water point source contamination by PPPs. However, the monitoring data is available just for the period May–
September, which corresponds to the PPPs distribution period. Monitoring data in the period of non-use, would
have been useful to sustain the hypostases of point-source contamination. Unfortunately, the development of
the sampling network, containing the 26 wells and described by Zambito Marsala et al. (2020) was a long
process, mainly due to the miss of trust of the wells' owners. Indeed, just for wells WP 11 and WP13, selected
at the beginning of the selection process, in November 2017, was possible to have data from PPP non-use
period (November-March).

99
Fig 3. Integration of modelling outputs with precipitation data and PPPs concentration in wells of type “A”;
a) well WP 26 and b) well WP 28.

100
Fig 4. Integration of modelling outputs with precipitation data and PPPs concentration in wells of type “B”;
a) well WP 25, b) well WP 11 and c) well WP 13

101
Fig 5. Integration of modelling outputs with precipitation data and PPPs concentration in well 32, type “C”
Wells WP 25, WP 11 and WP 13, considered of “type” B, are located in areas with medium slope, in the middle
of the hill, and their water is most probably (based on the aquifer's conceptual model) supplied by meteoric
recharge and by significant underground hypodermic flow, determining its accumulation and stagnation even
in dry periods. As shown in Fig. 4, WL is maintained and does not decrease. For both wells WP 25 and WP
11 the ΣPPPs in groundwater (μg/L) were below EQS during all three sampling campaigns, while for well WP
13 values higher than EQS (0.5 total and 0.1 individual μg/L) were registered in July 2018. The most detected
PPPs were Fluopicolide, Metalaxyl – M and Penconazole, with values above EQS (0.1 μg/L) for the first two
in WP 13. Based on PPPs characteristics, discussed above, and considering the higher water movement
registered in the soil surrounding these wells, their contamination is most probably due to both diffuse and
point sources. Indeed, the subsurface inflow from up-hill could transport chemical residues to these wells
(diffuse contamination) but at the same time could dilute the existing concentrations and as outflow transport
residues downhill, to downstream wells. Moreover, wells WP 11 and WP 25 are part of the same farm but well
WP 11 is in the middle of the farm while WP 25 is in the middle of the vineyards and the water of both wells
is not used for PPPs treatments or sprayer washing and these operations are made far away. However, a
dedicated area for sprayers washing, equipped with wastewater recovery and disposal systems is not present
in the farm. The well WP 13 is located in the middle of vineyards, but no information about its use and
102
vineyard/farm management is available, as the owner does not manage the surrounding vineyards anymore
and the new manager did not accept to collaborate.
Water movements are more consistent in the soil surrounding the well WP 32, type “C”, (Fig. 5), which is at
the bottom of the hill and of the entire valley, with a low slope and river recharge through the riverbed and
partially from hypodermic flow (subsurface flow), originating from the slope. The only PPP present in the
groundwater was Metalaxyl - M, in July 2018. Most probably, the contamination source is diffuse, driven by
lateral transport. As in case of type B wells, the subsurface inflow from up-hill could have transported chemical
residues to this well (diffuse contamination) from upstream contaminated wells. Indeed, WP 13 and WP 28
are upstream wells (Fig. 1.), having the highest Metalaxyl- M concentrations in July 2018, the only time in
which Metalaxyl – M was found in well WP32. Furthermore, the well is located in a fenced/protected enclosure
where it is utilised as a source for drinking water, where point contamination is impossible. However, in
September 2018 Metalaxyl – M was no longer found in groundwater, probably due to its chemical
transformation (not persistent PPP) and well dilution through the riverbed.
As a final point, the obtained results underlined the type A wells as the most exposed to PPP contamination
and the type C as the less exposed, while type B wells are somewhere in the middle. This can be explained by
the conservative conditions of the type A wells: use for PPPs mixtures and sprayer washing (well WP 28, for
WP 26 no information is available), positioned in the middle of the vineyards, at the top hill, with low slope
clayey surrounding soils and no subsurface inflow able to “wash” it. Therefore, when contaminated by point
sources, the chemicals either degrade or in case of intense rainfalls are transported downhill by outflow. On
the contrary, the position of type C well far away from agricultural crops, with a low slope and river recharge
through the riverbed and just partially from subsurface inflow makes it less exposed. Indeed, the subsurface
inflow could transport chemicals from uphill and contaminate it but due to river recharge, its water is
continuously “washed off”.

103
4. Conclusions
As main conclusion of the present work, it can be stated that the occurrence of PPPs in groundwater in areas
with intensive agricultural activities cannot be related just to chemical environmental fate properties or
pedoclimatic conditions, but also to end-user behavior. Indeed, the approach proposed in this work, which
collected and integrated monitoring data, sub-surface water movement data and territorial characteristics,
including farm management and farmer’s behavior, is shown to be suitable for a first identification of the most
probable contamination source of groundwater by PPPs used in viticulture. Indeed, for wells located on hilltop
vineyards, with low slope and no water movement in the surrounding soil, that are utilized for PPP’s mixture
preparation and sprayer washing, the contamination is most likely from point sources. On the contrary, for
wells located in a fenced area at the bottom of the hill, far away from vineyards and being used for drinking
water production, the contamination is most likely from diffuse sources. However, additional hydrological
data, both modelling and field, and monitoring data, with a higher frequency and for a longer period, would
allow a more complete assessment. In the study area, the obtained results were used to raise awareness among
farmers and one of the three farms involved in the third survey become a demonstration farm where a dedicated
waterproof platform for sprayer washing, equipped with wastewater recovery and disposal system was
implemented.. Several demonstration activities were then organized with the farmers of the entire Action Lab
of WaterProtect Project in order to show its functionality and promote a diffuse use in Tidone Valley. Finally,
the proposed approach could be used to assess possible effects of climate change and even transferred to other
similar territorial realities. In our specific case, considering the particularity of the small shallow aquifers where
the wells are located, an increase of atmospheric temperature and decrease of precipitations could determinate
a concentration rise of PPPs in the groundwater of the wells. Furthermore, intensive rainfall events, that
occurred frequently in recent summers, could result in an interaction between these shallow aquifers, due to
lateral water movement in the first layer of the soil, posing a risk of contamination of the protected drinking
water wells.

104
Supplementary material
Table S1. Soil characteristics used for CRITERIA 3 D simulations.
1. Particles > 2 mm.
2. Percentages refer to soil texture only (particles < 2 mm).
Soil code Horizon
nr
Upper
depth
[cm]
Lower
depth [cm]
Gravel1 [%] Organic
matter
[%]
Sand2
[%]
Silt2
[%]
Clay2
[%]
MNB1 1 0 20 0 1.1 15 29 56
MNB1 2 20 80 45 0.5 24 28 48
MNB1 3 80 110 45 0.6 23 30 47
MNB1 4 110 160 45 0.5 14 36 50
VCB 1 0 30 0 2.8 8 51 41
VCB 2 30 60 0 1 12 29 59
VCB 3 60 80 0 0.7 9 37 54
VCB 4 80 140 0 0.3 21 42 37
SMD 1 0 25 0 1.5 20 35 45
SMD 2 25 70 3 0.6 24 40 36
SMD 3 70 110 20 0.4 14 52 34
SMD 4 110 160 20 0.4 31 35 34
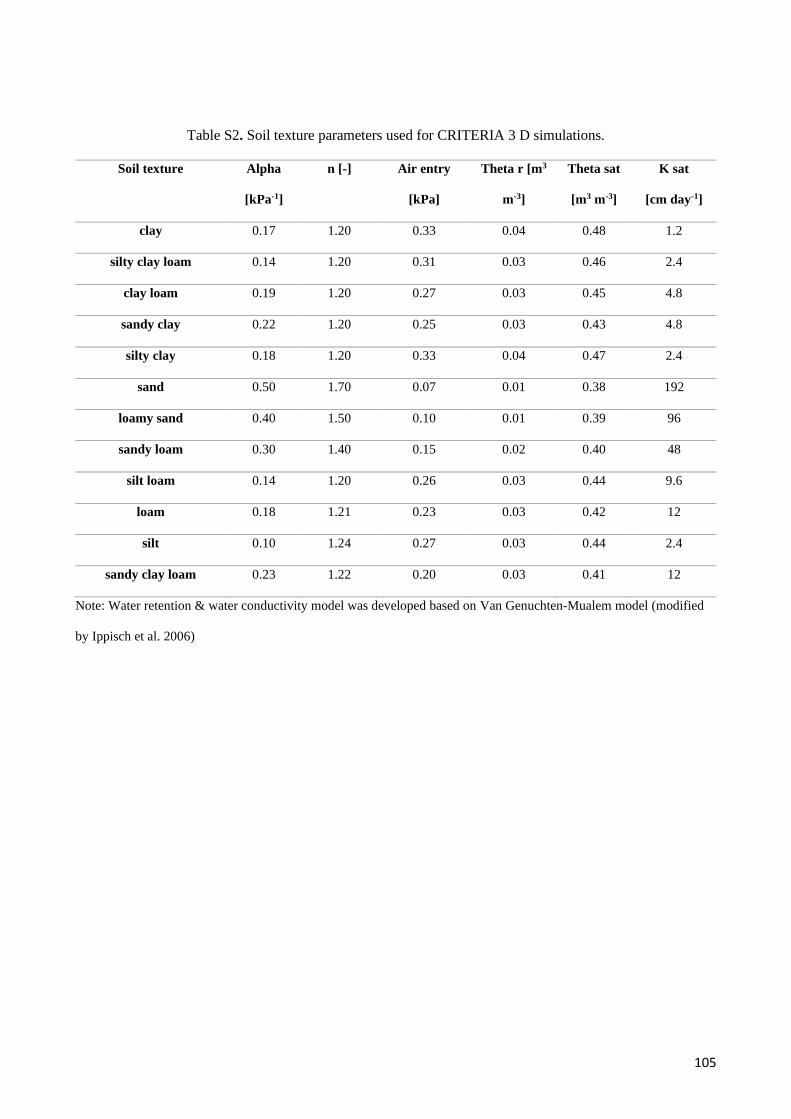
105
Table S2. Soil texture parameters used for CRITERIA 3 D simulations.
Soil texture Alpha
[kPa-1]
n [-] Air entry
[kPa]
Theta r [m3
m-3]
Theta sat
[m3 m-3]
K sat
[cm day-1]
clay 0.17 1.20 0.33 0.04 0.48 1.2
silty clay loam 0.14 1.20 0.31 0.03 0.46 2.4
clay loam 0.19 1.20 0.27 0.03 0.45 4.8
sandy clay 0.22 1.20 0.25 0.03 0.43 4.8
silty clay 0.18 1.20 0.33 0.04 0.47 2.4
sand 0.50 1.70 0.07 0.01 0.38 192
loamy sand 0.40 1.50 0.10 0.01 0.39 96
sandy loam 0.30 1.40 0.15 0.02 0.40 48
silt loam 0.14 1.20 0.26 0.03 0.44 9.6
loam 0.18 1.21 0.23 0.03 0.42 12
silt 0.10 1.24 0.27 0.03 0.44 2.4
sandy clay loam 0.23 1.22 0.20 0.03 0.41 12
Note: Water retention & water conductivity model was developed based on Van Genuchten-Mualem model (modified
by Ippisch et al. 2006)
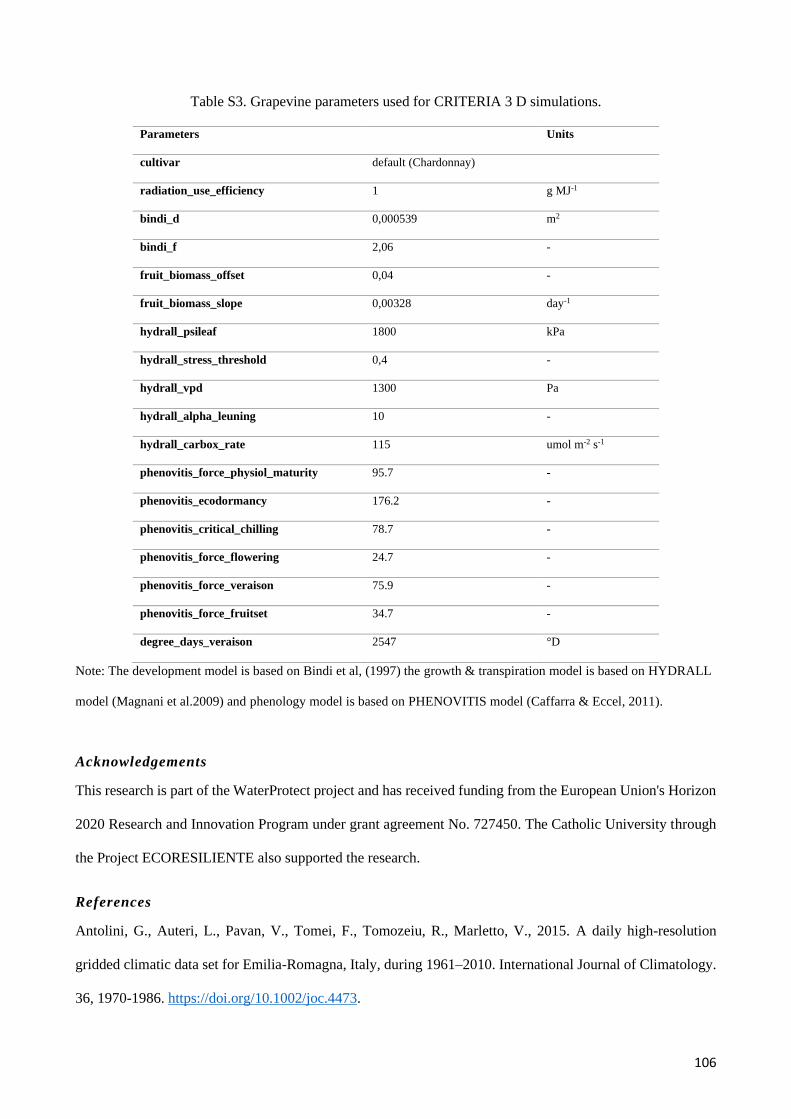
106
Table S3. Grapevine parameters used for CRITERIA 3 D simulations.
Parameters
Units
cultivar default (Chardonnay)
radiation_use_efficiency 1 g MJ-1
bindi_d 0,000539 m2
bindi_f 2,06 -
fruit_biomass_offset 0,04 -
fruit_biomass_slope 0,00328 day-1
hydrall_psileaf 1800 kPa
hydrall_stress_threshold 0,4 -
hydrall_vpd 1300 Pa
hydrall_alpha_leuning 10 -
hydrall_carbox_rate 115 umol m-2 s-1
phenovitis_force_physiol_maturity 95.7 -
phenovitis_ecodormancy 176.2 -
phenovitis_critical_chilling 78.7 -
phenovitis_force_flowering 24.7 -
phenovitis_force_veraison 75.9 -
phenovitis_force_fruitset 34.7 -
degree_days_veraison 2547 °D
Note: The development model is based on Bindi et al, (1997) the growth & transpiration model is based on HYDRALL
model (Magnani et al.2009) and phenology model is based on PHENOVITIS model (Caffarra & Eccel, 2011).
Acknowledgements
This research is part of the WaterProtect project and has received funding from the European Union's Horizon
2020 Research and Innovation Program under grant agreement No. 727450. The Catholic University through
the Project ECORESILIENTE also supported the research.
References
Antolini, G., Auteri, L., Pavan, V., Tomei, F., Tomozeiu, R., Marletto, V., 2015. A daily high-resolution
gridded climatic data set for Emilia-Romagna, Italy, during 1961–2010. International Journal of Climatology.
36, 1970-1986. https://doi.org/10.1002/joc.4473.

107
Balderacchi, M., Benoit, P., Cambier, P., Eklo, O.M., Gargini, A., Gemitzi, A., Gurel, M., Kløve, B., Nakic,
Z., Predaa, E., Ruzicic, S., Wachniew, P., Trevisan, M., 2013. Groundwater Pollution and Quality Monitoring
Approaches at the European Level. Critical Reviews in Environmental Science and Technology. 43:4, 323-
408. https://doi.org/10.1080/10643389.2011.604259.
Bittelli, M., Tomei, F., Pistocchi, A., Flury, M., Boll, J., Brooks, E.S, Antolini, G., 2010. Development and
testing of a physically based, three-dimensional model of surface and subsurface hydrology. Advances in
Water Resource. 33, 106-122. https://doi.org/10.1016/j.advwatres.2009.10.013.
Bindi, M., Miglietta, F., Gozzini, B., Orlandini, S., & Seghi, L. (1997). A simple model for simulation of
growth and development in grapevine (Vitis vinifera L.). I. Model description. Vitis, 36(2), 67–71.
https://doi.org/10.5073/vitis.1997.36.67-71
Bois, B., Volta, A., Rega, M., Caffarra, A., Costa, F., Antolini, G., Tomei, F., Galizia, S., Nascimben, J.,
Crestini, D., Baret, F., Neri, M., Bertozzi, C., Lughi, G., Roffilli, M., Botarelli, L., Bauer-Marschallinger, B.,
Hasenauer, S., Campagnolo, S., Dellavalle, D., Brossaud, F., Grosso, V., Marletto, V., 2014. GIS, mechanistic
modelling and ontology: a performing mix for precision and sustainable viticulture. In Proc. of 37h World
Congress of Vine and Wine, Mendoza, Argentina. 292-304.
Brouwer, R., Ordens, C.M., Pinto, R., Condesso de Melo, M.T., 2018. Economic valuation of groundwater
protection using a groundwater quality ladder based on chemical threshold levels. Ecological Indicators. 88,
292-304. https://doi.org/10.1016/j.ecolind.2018.01.041.
Caffarra, A., Eccel, E. (2011). Projecting the impacts of climate change on the phenology of grapevine in a
mountain area. Grape and Wine Research. 17, 52-61. https://doi.org/10.1111/j.1755-0238.2010.00118.x
Calliera, M., Capri, E., Zambito Marsala, R., Russo, E., Bisagni, M., Colla, R., Suciu, N., 2020. The role of
Risk Communication and Stakeholders involvement in the adoption of Best Management Practices and for a
sustainable use of pesticides in hilly vineyards. Submitted to this VSI.
Capri, E., Balderacchi, M., Yon, D., Reeves, G., 2005. Deposition and dissipation of chlorpyrifos in surface
water following vineyard applications in northern Italy. Environmental Toxicology and Chemistry. 24, 852-
860. https://doi.org/10.1897/04-151R.1.

108
Croghan, C., Egeghy P. P., 2003. METHODS OF DEALING WITH VALUES BELOW THE LIMIT OF
DETECTION USING SAS. Presented at Southeastern SAS User Group, St. Petersburg, FL, September 22-24.
Di Guardo, A., Finizio, A., 2016. A moni-modelling approach to manage groundwater risk to pesticide
leaching at regional scale. Science of the Total Environment. 545-546, 200-209.
https://doi.org/10.1016/j.scitotenv.2015.12.056.
Diamantopoulos, E., Šimůnek, J., Oberdörster, C., Hammel, K., Jene, B., Schröder, T., Harter, T., 2017.
Assessing the potential exposure of groundwater to pesticides: A model comparison. Vadose Zone Journal.
16. https://doi.org/10.2136/vzj2017.04.0070.
EFSA Conclusion regarding the peer review of the pesticide risk assessment of the active substance
Penconazole, 2008. EFSA Journal. https://doi.org/10.2903/j.efsa.2008.175r
EFSA Conclusion on pesticide peer review regarding the risk assessment of the active substance fluopicolide,
2009. EFSA Journal. https://doi.org/10.2903/j.efsa.2009.299r
EFSA Panel on Plant Protection Products and their Residues (PPR), 2013. Scientific Opinion on the report of
the FOCUS groundwater working group (FOCUS, 2009): assessment of higher tiers. EFSA Journal. 11, 3291.
https://doi.org/10.2903/j.efsa.2013.3291.
European Commission (EC), 2014. Assessing Potential for Movement of Active Substances and their
Metabolites to Ground Water in the EU. Report of the FOCUS Ground Water Work Group. EC Document
Reference Sanco/13144/2010 version 3, 513 pp.
European Environmental Agency (EEA), 2018. European waters Assessment of status and pressure 2018. EEA
Report, 7/2018. Luxembourg: Publications Office of the European Union, 2018. doi:10.2800/303664.
EPA, Guidance for Data Quality Assessment. (2000). Practical Methods for Data Analysis.
https://19january2017snapshot.epa.gov/sites/production/files/2015-06/documents/g9-final.pdf
Farina M., Marcaccio M., Zavatti A. (Eds.) (2014). Esperienze e prospettive nel monitoraggio delle acque
sotterranee. Il contributo dell’Emilia-Romagna. Pitagora Editrice, Bologna, 560 pp. (ISBN 88-371-1859-7)

109
Fernandez-Cornejo, J., 1998. Environmental and economic consequences of technology adoption: IPM in
viticulture. Agricultural Economics: The Journal of the International Association of Agricultural Economists.
18, 145-155. http://dx.doi.org/10.22004/ag.econ.174342.
Fohrer, N., Dietrich, A., Kolychalow, O., Ulrich, U., 2014. Assessment of the Environmental Fate of the
Herbicides Flufenacet and Metazachlor with the SWAT Model. Journal of Environmental Quality, Special
Section Applications of the Swat Model. 43, 75–85. https://doi.org/10.2134/jeq2011.0382.
Gimsing, A.L., Agert, J., Baran, N., Arnaud, B., Ferrari, F., Gibson, R., Hammond, L., Helger, F., Jones, L.R.,
König, W., Kreuger, J., van der Linden, T., Liss, D., Loiseau, L., Massey, A., Miles, B., Monrozies, L.,
Newcombe, A., Poot, A., Reeves, G.L., Reichenberger, S., Rosenbom, A.E., Staudenmaier, H., Sur, R.,
Schwen, A., Stemmer, M., Tüting, W., Ulrich, U., 2019. Conducting groundwater monitoring studies in Europe
for pesticide active substances and their metabolites in the context of Regulation (EC) 1107/2009. Journal of
Consumer Protection and Food Safety. 14, 1–93. https://doi.org/10.1007/s00003-019-01211-x.
Herrero-Hernández, E., Andrades, M. S., Álvarez-Martín, A., Pose-Juan, E., Rodríguez-Cruz, M. S., &
Sánchez-Martín, M. J. 2013. Occurrence of pesticides and some of their degradation products in waters in a
Spanish wine region. Journal of Hydrology, 486, 234–245. https://doi.org/10.1016/j.jhydrol.2013.01.025
Herrero-Hernández, E., Simon-Egea, A.B., Sánchez-Martín, M. J. Rodríguez-Cruz, M. S, Andrades, M. S
(2020) Monitoring and environmental risk assessment of pesticide residues and some of their degradation
products in natural waters of the Spanish vineyard region included in the Denomination of Origin Jumilla.
Environmental Pollution, 264, 114666. https://doi.org/10.1016/j.envpol.2020.114666
Hosseini, M., Saremi, A., 2018. Assessment and Estimating Groundwater Vulnerability to Pollution Using a
Modified DRASTIC and GODS Models (Case Study: Malayer Plain of Iran). Civil Engineering Journal. 4.
http://dx.doi.org/10.28991/cej-0309103.
Ippisch O, Vogel HJ, Bastian P., 2006. Validity limits for the van Genuchten–Mualem model and implications
for parameter estimation and numerical simulation. Adv Water Resour; 29:1780–9.

110
Khadri, S.F.R., Pande, C., 2016. Ground water flow modelling for calibrating steady state using MODFLOW
software: a case study of Mahesh River basin, India. Model. Earth Syst. Environ. 2, 39.
https://doi.org/10.1007/s40808-015-0049-7.
Khan, M.S., Qadir, A., Javed, A., Mahmood, K., Amjad, M., A., Shehzad, S., 2016. Assessment of aquifer
intrinsic vulnerability using GIS based Drastic model in Sialkot area, Pakistan. Int. j. econ. environ. geol. 7(1),
73-84. ISSN: 2223-957X, www.econ-environ-geol.org.
Kourakos, G., Klein, F., Cortis A., Harter, T., 2012. A groundwater nonpoint source pollution modeling
framework to evaluate long-term dynamics of pollutant exceedance probabilities in wells and other discharge
locations. Water Resources Research. 48. https://doi.org/10.1029/2011WR010813.
Lebon, E., Dumas, V., Pieri, P., & Schultz, H. R. 2003. Modelling the seasonal dynamics of the soil water
balance of vineyards. Functional Plant Biology, 30(6), 699–710. https://doi.org/10.1071/FP02222
Ligget, J.E., Talwar, S., 2009. Groundwater Vulnerability Assessments and Integrated Water Resource
Management. Peer-reviewed Synthesis Article, Watershed Management Bulletin. 13/1.
Magnani, F., Nolè, A., Ripullone, F., & Grace, J. 2009. Growth patterns of Pinus sylvestris across Europe: A
functional analysis using the HYDRALL model. IForest, 2(OCTOBER), 162–171.
https://doi.org/10.3832/ifor0516-002
Martínez-Navarrete, C., Jiménez-Madrid, A., Sánchez-Navarro, I., Carrasco-Cantos, F., Moreno-Merino, L.,
2011. Conceptual Framework for Protecting Groundwater Quality. International Journal of Water Resources
Development. 27:1, 227-243. https://doi.org/10.1080/07900627.2010.532476.
Mottes, C., Lesueur-Jannoyer, M., Charlier, J.B., Carles, C., Guéné, M., Le Bail, M., Malézieux, E., 2015.
Hydrological and pesticide transfer modeling in a tropical volcanic watershed with the WATPPASS model.
Journal of Hydrology. 529, Part 3, 909-927. https://doi.org/10.1016/j.jhydrol.2015.09.007.
Ogden, T. L., (2010). Handling results below the level of detection, The Annals of Occupational Hygiene, 54-
3, 255–256, https://doi.org/10.1093/annhyg/mep099

111
Parris, K., 2011. Impact of Agriculture on Water Pollution in OECD Countries: Recent Trends and Future
Prospects. International Journal of Water Resources Development. 27:1, 33-52.
https://doi.org/10.1080/07900627.2010.531898.
Pertot, I., Caffi, T., Rossi, V., Mugnai, L., Hoffmann, C., Grando, M.S., Gary, C., Lafond, D., Duso, C., Thiery,
D., Mazzoni, V., Anfora, G., 2017. A critical review of plant protection tools for reducing pesticide use on
grapevine and new perspectives for the implementation of IPM in viticulture. Crop Protection, 97, 70-84.
https://doi.org/10.1016/j.cropro.2016.11.025.
Rabiet M., Margoum ,C., Gouy, V., Carluer, N., Coquery M. 2010. Assessing pesticide concentrations and
fluxes in the stream of a smallvineyard catchment – Effect of sampling frequency. Environmental Pollution,
158, 737–748. https://doi.org/10.1016/j.envpol.2009.10.014
Regione Emilia-Romagna (2010). Approvazione delle attività della Regione Emilia-Romagna riguardanti
l’implementazione della Direttiva 2000/60/CE ai fini della redazione e adozione dei Piani di Gestione dei
Distretti idrografici Padano, Appennino settentrionale e Appennino centrale". Delibera di Giunta della Regione
Emilia-Romagna n. 350 del 8/02/2010 (in Italian). Available on: http://ambiente.regione.emilia-
romagna.it/it/acque/approfondimenti/normativa/DGR_350_2010_All2.pdf (accessed on 25 May 2020)
Suciu, A.N., Ferrari, T., Ferrari, F., Trevisan, M., Capri, E., 2011. Pesticide removal from waste spray-tank
water by organoclay adsorption after field application to vineyards. Environ Sci Pollut Res. 18, 1374-1383.
https://doi.org/10.1007/s11356-011-0494-4.
Tan, Q., Huang, G.H., Cai, Y.P., 2011. Radial interval chance-constrained programming for agricultural non-
point source water pollution control under uncertainty. Agricultural Water Management. 98, 10, 1595– 1606.
https://doi.org/10.1016/j.agwat.2011.05.013.
European Parliament and the Council of the European Union, 2009a. Directive of the European Parliament
and of the Council of 21 October 2009 establishing a framework for Community action to achieve the
sustainable use of pesticides. 2009/128/EC.
112
European Parliament and the Council of the European Union, 2006. Directive of the European Parliament and
of the Council of 12 December 2006 on the protection of groundwater against pollution and deterioration,
2006/118/EC.
European Parliament and the Council of the European Union, 2006. Annex I of the directive of the European
Parliament and of the Council of 12 December 2006 on the protection of groundwater against pollution and
deterioration, 2006/118/EC.
European Parliament and the Council of the European Union, 2009b. Regulation (EC) of the European
Parliament and of the Council of 21 October 2009 concerning the placing of plant protection products on the
market and repealing Council Directives 79/117/EEC and 91/414/EEC, No 1107/2009.
European Parliament and the Council of the European Union, 2000. Directive of the European Parliament and
of the Council of 23 October 200 establishing a framework for Community action in the field of water policy,
2000/60/EC.
Tomei, F., Antolini, G., Bittelli, M., Marletto, V., Pasquali, A., Van Soetendael, M., 2007. Validazione del
modello di Bilancio idrico CRITERIA. Italian Journal of Agrometerology. 1. AIAM, 10° Convegno nazionale
di Agrometeorologia: Quaderno degli Abstract.
Vischetti, C., Cardinali, A., Monaci, E., Nicelli, M., Ferrari, F., Trevisan, M., Capri, E., 2008. Measures to
reduce pesticide spray drift in a small aquatic ecosystem in vineyard estate. Science of The Total Environment.
389, 2-3, 497-502. https://doi.org/10.1016/j.scitotenv.2007.09.019.
Wachniew, P., Zurek, A.J., Stumpp, C., Gemitzi, A., Gargini, A., Filippini, M., Rozanski, K., Meeks, J.,
Kværner L., Witczak S., 2016. Toward operational methods for the assessment of intrinsic groundwater
vulnerability: A review. Critical Reviews in Environmental Science and Technology. 46:9, 827-884.
https://doi.org/10.1080/10643389.2016.1160816.
WWAP (United Nations World Water Assessment Programme), 2015. The United Nations World Water
Development Report 2015: Water for a Sustainable World. Paris, UNESCO.
113
Zambito Marsala, R., Capri, E., Russo, E., Bisagni, M., Colla, R., Lucini, L., Gallo, A., Suciu, N., 2020. A first
evaluation of pesticides occurrence in groundwater of Tidone Valley, an area with intensive viticulture.
Science of the Total Environment.https://doi.org/10.1016/j.scitotenv.2020.139730
Zamboni, M., 2006. Le zonazioni viticole in Emilia-Romagna. Bollettino dell’Associazione Italiana Pedologi
(AIP), Il Suolo, Convegno Suolo e Vino, numero 37-39.

114
Chapter 3 Influence of nitrogen-based fertilization on nitrates occurrence in groundwater of hilly vineyards
Roberta Zambito Marsalaaf, Ettore Caprif, Elisabetta Russob, Lia Barazzonib, Emanuela Peroncinib, Marcello De
Cremab, Raul Carrey Labartac, Neus Oteroce, Ruggero Collad, Maura Callieraf, Maria Chiara Fontanellaa, Nicoleta
Alina Suciuaf
a Università Cattolica del Sacro Cuore, Department for Sustainable Food Process, Via Emilia Parmense 84,
29122 Piacenza, PC, Italy
b ARPAE – Regional Agency for Prevention, Environment and Energy of Emilia Romagna, Via XXI Aprile 48,
29121 Piacenza, PC, Italy
c Grup MAiMA, SGR Mineralogia Aplicada, Geoquímica i Geomicrobiologia, Departament de Mineralogia,
Petrologia i Geologia Aplicada, Facultat de Ciències de la Terra, Universitat deBarcelona, Institut de Rederca
de l'Aigua (IDRA), UB, C/Martí i Franquès, s/n, 08028 Barcelona, Spain
d Phytosanitary consortium of Piacenza, Via Cristoforo Colombo 35, 29122 Piacenza, PC, Italy
e Serra Hunter Fellowship, Generalitat de Catalunya, Spain
f European Observatory on sustainable agriculture (OPERA), Università Cattolica del Sacro Cuore, Via
Emilia Parmense 84, 29122 Piacenza, PC, Italy
https://doi.org/10.1016/j.scitotenv.2020.144512
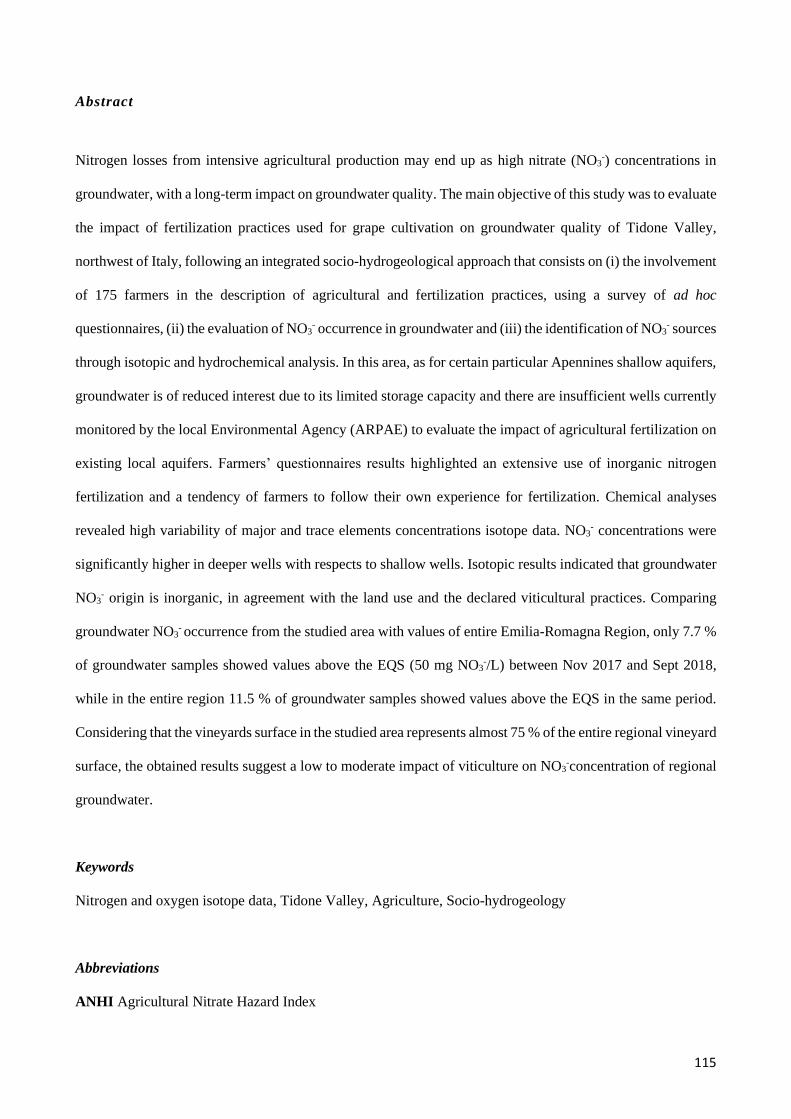
115
Abstract
Nitrogen losses from intensive agricultural production may end up as high nitrate (NO3-) concentrations in
groundwater, with a long-term impact on groundwater quality. The main objective of this study was to evaluate
the impact of fertilization practices used for grape cultivation on groundwater quality of Tidone Valley,
northwest of Italy, following an integrated socio-hydrogeological approach that consists on (i) the involvement
of 175 farmers in the description of agricultural and fertilization practices, using a survey of ad hoc
questionnaires, (ii) the evaluation of NO3- occurrence in groundwater and (iii) the identification of NO3
- sources
through isotopic and hydrochemical analysis. In this area, as for certain particular Apennines shallow aquifers,
groundwater is of reduced interest due to its limited storage capacity and there are insufficient wells currently
monitored by the local Environmental Agency (ARPAE) to evaluate the impact of agricultural fertilization on
existing local aquifers. Farmers’ questionnaires results highlighted an extensive use of inorganic nitrogen
fertilization and a tendency of farmers to follow their own experience for fertilization. Chemical analyses
revealed high variability of major and trace elements concentrations isotope data. NO3- concentrations were
significantly higher in deeper wells with respects to shallow wells. Isotopic results indicated that groundwater
NO3- origin is inorganic, in agreement with the land use and the declared viticultural practices. Comparing
groundwater NO3- occurrence from the studied area with values of entire Emilia-Romagna Region, only 7.7 %
of groundwater samples showed values above the EQS (50 mg NO3-/L) between Nov 2017 and Sept 2018,
while in the entire region 11.5 % of groundwater samples showed values above the EQS in the same period.
Considering that the vineyards surface in the studied area represents almost 75 % of the entire regional vineyard
surface, the obtained results suggest a low to moderate impact of viticulture on NO3-concentration of regional
groundwater.
Keywords
Nitrogen and oxygen isotope data, Tidone Valley, Agriculture, Socio-hydrogeology
Abbreviations
ANHI Agricultural Nitrate Hazard Index
116
ARPAE Regional Agency for Prevention, Environment and Energy
BMP Best Management Practices
CAP Common Agriculture Policy
EQS Environmental Quality Standard
GLM Generalized Linear Model
ICP-MS Inductively Coupled Plasma Mass Spectrometry
IRMS Isotope Ratio Mass Spectrometer
MM Mitigation measures
NVZ Nitrate Vulnerable Zone
OES Optical Emission Spectrometry
PPP Plant Protection Product
WFD Water Framework Directive
1. Introduction
Today more than half of the world’s population depend on agricultural outputs that have been produced
applying artificial fertilizers (Hansen et al., 2017). Throughout the world, nitrogen (N) losses from intensive
agricultural production may end up as undesirably high nitrate concentrations in groundwater, with a long-
term impact on groundwater quality (Bryan et al., 2012; Puig et al. 2017; Hansen et al., 2017; Ahmed et al.,
2017). Nitrate occurrence in groundwater represent a big issue because they can persist for decades and
accumulate to high levels as more nitrogen is applied to the land surface every year (Nolan et al., 2002). Waters
containing high nitrate concentration can lead to health problems both in humans and animals. Nitrate,
however, is not directly toxic for humans, but their possible reduction to nitrite (NO2-) and a following reaction
with secondary or tertiary amines can result in the formation of carcinogenic N-nitrosamines in adults and can
produce methahemoglobinemia in infants (Pham et al., 2018). For this reason, since 1998 the Council of
European Union, through the Directive 98/83/EC, established a nitrate concentration threshold in drinking
water of 50 mg/L. In Italy the implementation of Directive 98/83/EC relating to the quality of water intended
for human consumption is made by the Legislative Decree 31/2001. Indeed, in Europe nitrate pollution is still
a major threat for groundwater quality as the maximum nitrate concentration allowed for human consumption

117
is exceeded in 18 % of groundwater bodies (EEA, 2018). Besides, about 50 % of drinking water supply at
European level, including many large cities, rely on groundwater to fulfil their needs (EEA, 2018).
At European level, the measures taken in the last few decades under the Nitrates Directive (EU, 1991), aimed
to protect water quality, have resulted in a reduction in the use of mineral fertilizer, and nutrient surpluses of
agricultural origin have progressively decreased in the EU (EEA, 2018). Between 2000 and 2013, agricultural
nitrogen surplus decreased by 7 %, while phosphorus surplus decreased by 50 % (EC, 2017). Nevertheless,
the overall level of fertilization remains high in parts of Europe. Large variations exist between Member States
in nitrogen and phosphorus surplus (Eurostat, 2016) and, on average, fertilizer use has started increasing again
in the last few years. Nutrient balances at river basin level are now used in several countries to define nutrient
load reduction targets to support the achievement of European Water Framework (Directive (WFD) (EU, 2000)
objectives. The WFD aimed to achieve a good chemical status for the groundwater bodies in Europe by the
year 2015. Since 2015, every six years new national objectives have to be established and included in the River
Basin Management Plan. During the last years, Member States have taken measures at national level or at the
River Basin level (e.g. general binding rules, taxes, manure surplus management), while other measures are
more local (e.g. protection of areas with wells used for drinking water supply). Most of the EU countries
developed maps for the “Nitrate Vulnerable Zones” (NVZ), territories that drain into waters and thereby can
cause a risk of water pollution by nitrate. Emilia Romagna Region recently issued the new delimitation of the
NVZ, adopted with DGR No. 619 (2020), following the infringement procedure on nitrates that involved Italy.
Recently, the European Commission presented its legislative proposals on the future of food and farming, i.e.
the Common Agriculture Policy (CAP) for the period 2021-27. With its new legislative proposals, the EU
Commission is proposing that EU countries introduce a Farm Sustainability Tool for Nutrients for farmers
(https://ec.europa.eu/info/food-farming-fisheries/key-policies/common-agricultural-policy/future-
cap_en ). Such a Nutrient Management Tool should not be based on the quantity of nutrients applied,
but rather on the nutrient use efficiency. Therefore, the CAP post-2020 must promote knowledge-intensive
farming and tap into the potential of the increasing amount of data available, in order to enable all types of
farmers in Europe to become more competitive and have a better environmental performance at the same time.
Furthermore, involving the local farmers in the water governance process is increasingly seen as a way of
strengthening the likelihood of implementing more effective management practices for water protection.

118
Indeed, sustainable agriculture is the result of complex “systemic interactions” between different subjects
involved in various ways, such as researchers, farmers, entrepreneurs, regional and national organizations etc.
All of them have different forms of knowledge (practical, scientific, policy based, etc.) and there is the need
to create conditions for interaction between them combining their knowledge, perspectives, resources, and
experiences, to identify and discuss solutions and new ideas (Calliera et al., 2020). It is obviously challenging
to identify the most effective approach, but one of the key elements is to ensure that groundwater management
strategies are based on a full understanding of local peculiarities and needs. Indeed, adopting a more holistic
approach by combining geosciences and social sciences clearly facilitates the assessment of the relations
between groundwater and society (Re, 2015).
A full understanding of the natural concentration, identification of pollution sources and biogeochemical
transformation of nitrate are important for a successful groundwater management strategy (Kim et al., 2015;
Elisante et al., 2017). The occurrence of nitrate in groundwater may be affected by considerable temporal
variations, depending on precipitation, hydrogeological conditions and land-use (Capri et al. 2009, Menciò et
al., 2011, Groenendijk et al. 2014). Several studies report the development and successful use of parametric
approaches, as the Agricultural Nitrate Hazard Index (ANHI), to assess potential risk of nitrate contamination
in groundwater (Padovani and Trevisan, 2000; Capri et al. 2009).
The inflow of N into groundwater in agricultural areas can be attributed to multiple sources such as organic
and inorganic fertilizers, manure, soil organic N, sewage (e.g. septic wastewater), and atmospheric
precipitations (Kaushal et al., 2011; Biddau et al., 2019). N originating from each source is characterized with
distinct ranges of 15N-NO3 isotopic values, which can be used to determine its origin, and to estimate to some
extent the relative contribution of the different NO3− sources (Nikolenko et al., 2018; Valiente et al., 2018;
Chae et al., 2009). The organic and inorganic fertilizers, indeed, are characterized by different isotopic
signatures, which is explained by their production processes. According to Nikolenko et al. (2018), the lowest
values of δ15N-NO3− are typical for inorganic fertilizers, followed by NO3
− derived from soil organic matter,
while the highest values are usually related to the impact of manure and/or wastewater.
In a study conducted by Martinelli et al., (2018) on nitrate impact in the Po Plain area, northwest of Italy,
manure represents one of the main nitrate sources in groundwater from agriculture, the other being synthetic
fertilizers. This is in agreement with data reported by Viaroli et al. (2018) in a work on space and time

119
variations of watershed N and P budgets in the Po River basin. In the northwest of Emilia Romagna Region
(province of Piacenza), part of Po River basin, monitoring studies of groundwater of three small catchments,
in an area known as Tidone Valley and characterized by intensive viticulture, show nitrate concentrations that
exceed the threshold of 50 mg/L (ARPAE, 2017). Furthermore, ISTAT data reports an increase of 45 % in the
period 2012-2017 with respect to 2007-2011s (https://webbook.arpae.it/indicatore/Uso-di-fertilizzanti-
00001/?espandi=grafici) of synthetic nitrogenous fertilizers and organic manure use in Emilia Romagna
Region. However, the existing monitoring network, of the local Environmental Agency, did not allow to
adequately evaluate the local stressors due to a limited and unsuitable number of groundwater wells.
In this context, the main objective of this study, part of the EU H2020 WaterProtect Project, is to evaluate the
impact of fertilization practices used for grape cultivation on groundwater quality of Tidone Valley, in the
northwestern part of Italy, following an integrated socio-hydrogeological approach that consists in (i) the
involvement of all stakeholders in the farmers engagement for the description of agricultural and fertilization
practices, (ii) evaluation of NO3- occurrences in groundwater and the (iii) identification of NO3
- sources
through isotopic and hydrochemical analysis. The present study is the first of its kind in the study area, on one
side there is a lack of previous studies since shallow groundwater in the Apennines is not an important resource
due to the limited storage capacity, and on the other side, the stakeholder involvement in the investigation,
known as socio-hydrogeological approach (Re, 2015), was not been carried out before to the authors
knowledge.
2. Materials and methods
2.1 Study area
The study area is in Tidone Valley, northwestern of Italy, Emilia Romagna Region, Province of Piacenza (Fig.
1), described in detail by Zambito Marsala et al. (2020), Suciu et al. (2020) and Calliera et al. (2021). To be
concise, the area covers 206.72 km2 and includes part of Tidone Torrent catchment and the catchments of the
two streams Lora-Carogna and Carona-Boriacco. It is a hilly zone with an elevation level between 100 m and
350 m above sea level, 2941 hectares of vineyard in 2016 (ISTAT, 2016). As shown in Figure 1, the Nitrate
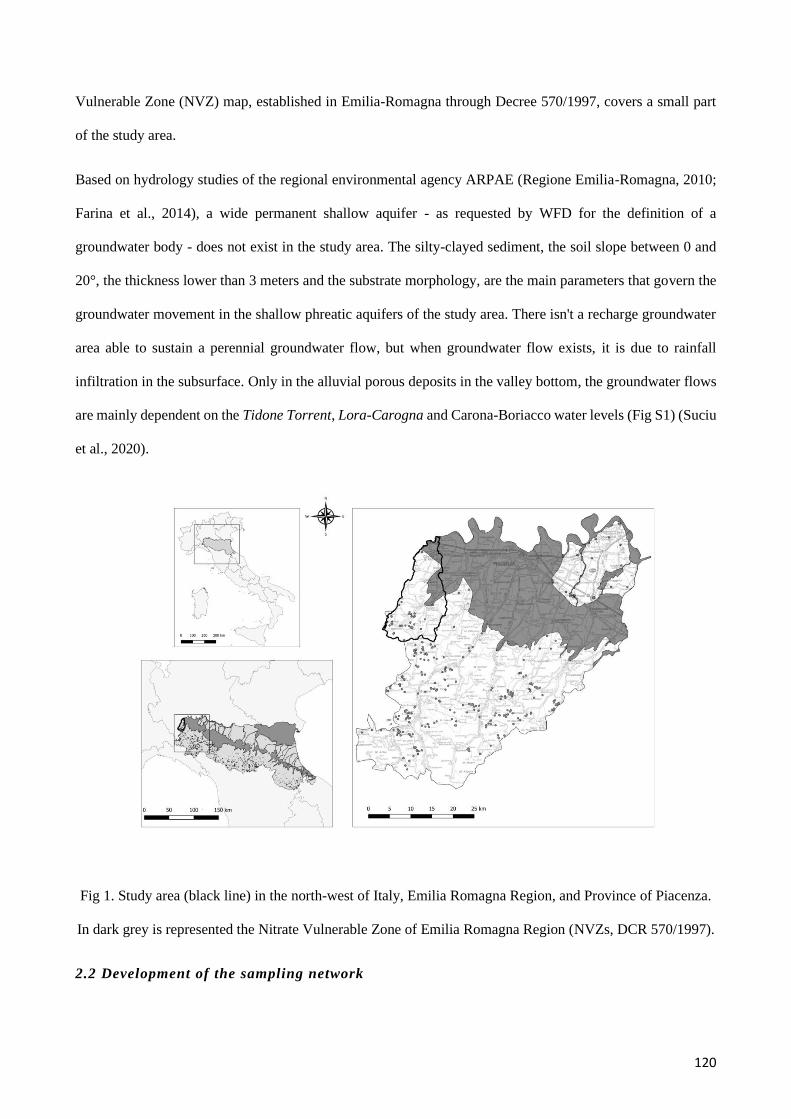
120
Vulnerable Zone (NVZ) map, established in Emilia-Romagna through Decree 570/1997, covers a small part
of the study area.
Based on hydrology studies of the regional environmental agency ARPAE (Regione Emilia-Romagna, 2010;
Farina et al., 2014), a wide permanent shallow aquifer - as requested by WFD for the definition of a
groundwater body - does not exist in the study area. The silty-clayed sediment, the soil slope between 0 and
20°, the thickness lower than 3 meters and the substrate morphology, are the main parameters that govern the
groundwater movement in the shallow phreatic aquifers of the study area. There isn't a recharge groundwater
area able to sustain a perennial groundwater flow, but when groundwater flow exists, it is due to rainfall
infiltration in the subsurface. Only in the alluvial porous deposits in the valley bottom, the groundwater flows
are mainly dependent on the Tidone Torrent, Lora-Carogna and Carona-Boriacco water levels (Fig S1) (Suciu
et al., 2020).
Fig 1. Study area (black line) in the north-west of Italy, Emilia Romagna Region, and Province of Piacenza.
In dark grey is represented the Nitrate Vulnerable Zone of Emilia Romagna Region (NVZs, DCR 570/1997).
2.2 Development of the sampling network

121
As described in detail by Zambito et al. (2020), a sampling network with 26 wells was developed, selected
from groundwater wells already existent in the study area. The wells were selected taking into consideration
the upstream and downstream of the small water bodies crossed by tributaries (Vallicola) of Tidone Torrent
and of two Streams Lora-Carogna and Carona-Boriacco, where the vineyards are treated with pesticides and
fertilizers. The upstream well should be the one not contaminated while the downstream well should collect
all the residues of the treatments due to run-off at soil surface and transport of surface water body and drainage
to groundwater. The wells selected are coded from WP01 to WP32 and include 3 wells used for drinking water
and part of the network of the Regional Environmental Agency (ARPAE) and the water supply company
(IRETI) (Table 1). The other selected wells are in the middle of vineyards or in the farms and have depths
between 2 m and 34 m (Fig. 2, Table S1).
Fig 2. Sampling network distribution in the territory

122
2.3 Stakeholders involvement
For the development of the sampling network and the characterization of the territorial agricultural and
fertilization practices, two survey campaigns were conducted between August 2017 and June 2018, by the use
of ad hoc questionnaires and involving 175 farmers form the study area. The farmers involved were from:
Ziano Piacentino, 50.3 %, Alta Val Tidone, 16 %, Castel San Giovanni, 9.7 %, Pianello Val Tidone, 6.9 %,
Borgonovo Val Tidone, 4.6 %, and other regions and municipalities, 12.5 %. (Calliera et al., 2020, submitted
for this special issue). For farmers’ involvement, the support of farmers’ organization Cantina Sociale
Vicobarone, of farmers’ unions Coldiretti, Confagricoltura and CIA (farmer’s association) and also of
farmers’ consultancy organization Consorzio Fitosanitario Provinciale, was fundamental. In the present study,
the stakeholder involvement was conceptualized as an "active engagement", through bilateral and multi-actor
conversations and selecting strategic places and time periods, as for example during grape delivery to the
Social Winery by the farmers. A complete description of stakeholder engagement is provided by Calliera et al.
(2020).
In particular, in the first survey, taken by 175 farmers, questions related to the use and type of fertilizers,
existence of groundwater wells in the farm, implementation in the farms of best management practices (BMPs)
and mitigation measures (MM) to avoid point source water contamination, existence of nitrates monitoring
data, were made. For the second survey, based on the outputs of the first survey, fifty farmers were involved
and specific questions were made concerning the timing of fertilization, the specific use of manure, the
availability of analysis for organic matter and major elements (N, P, K) contents in soil, the use of specific
decision support for fertilization and the need and willingness of implementation of new BMPs and MMs.
Finally, in November 2018, at the end of the surveys and after three sampling campaigns, all collected data
and information were presented to the farmers and all the other actors involved in water use and governance
in order to have their feedback and to find together the most sustainable solutions.
2.4 Groundwater sampling
During three years’ time (2017–2019), a total of 130 groundwater samples were collected from the 26 network
wells. Five sampling campaigns were carried out: November 2017, July and September 2018 and July and
September 2019. The sampling periods were chosen based on grapevine treatments, in particular after

123
pesticides and fertilizers spraying. Before sampling, wells were purged for several minutes to avoid the effects
of stagnant water. The temperature and the static groundwater level of the wells were measured in the field
using a digital thermometer and a portable acoustic water level meter, respectively.
The samples were collected and filled into 10 mL plastic tubes for nitrates analysis (in triplicate), into 1 liter
plastic bottles for pH and electrical conductivity and into 50 mL for water and N and O isotopic composition
of dissolved nitrate leaving no air space in order to avoid bubbles formation and to prevent any further
fractionation. All groundwater samples were kept in the fridge at 4 °C and analyzed within 72 h. Before the
analysis the samples were thawed at room temperature. For analysis of chemical composition, the groundwater
samples were collected in 50 ml plastic tubes and, filtered through a 0.45-μm glass membrane and acidified
by adding 1% of nitric acid within 12 h. Until analysis the samples were stored at 4 °C.
2.5 Hydrochemical and isotopic analysis
Electrical conductivity and pH were analyzed after sample filtration through a 0.45 mm cellulose membrane
filters. For pH determination a pH-meter with a resolution of 0.01 pH units was used, while electrical
conductivity (µS/cm) was measured with a Mettler Toledo probe with an automatic temperature compensation.
The electrical conductivity is referred to 20 ° C.
Nitrate concentration was measured following an ultraviolet spectrophotometric screening method, which
involves the use of “Cuvette test LCK 339 Nitrate" kit for samples with expected concentrations between 0.23
and 13.5 mg/L NO3-N, corresponding to 1.0 to 60.0 mg/L of NO3-, and the "Cuvette Test LCK 340 Nitrate"
kit for samples with expected concentrations between 5.0 and 35.0 mg/L NO3-N, corresponding to 22.0 to
155.0 mg/L of NO3-. The instrument used was Spectrophotometer DR6000 (Hach-Lange, Milan, Italy). The
technical data for cuvette test LCK339 and LCK340 were determined in conformity with ISO 8466-1 and DIN
38402 A51 “Calibration of analysis methods” and are available in the website of the producer
(https://it.hach.com/asset-get.download.jsa?id=2559362544). The analyses were carried out in triplicate for
each sample and a stock solution of 1 mg/L of NO3- , obtained using KNO3, was used to control the kit’s
performance. The robustness and validity of the kit test was also demonstrated by Dimitrova et al., (2013),
124
highlighting its particular advantages, such as lower sample volumes, lower chemical reagents need and less
waste production.
Elemental analyses were carried out by Inductively Coupled Plasma Mass Spectrometry (ICP-MS, 7800
Agilent) for Li, Ti, V, Cr, Mn, Fe, Co, Ni, Cu, As, Se, Rb, Sr, Mo, Ag, Cd, Sb, Ba, Tl, Pb with the exception
of chlorine (ICP-QQQ, 8900 Agilent) and Optical Emission Spectrometry (ICP-OES, 5800 Agilent) for main
major elements (Al, Ca, Fe, K, Mg, Na, P, S, Zn, Cl). These analyses were performed on samples of the two
last monitoring campaigns (July and September 2019; n = 52).
For δ15N and δ18O of NO3−a total of 25 groundwater samples were analyzed, twelve collected in May 2019 and
thirteen collected in September 2019. The samples were selected based on their nitrate concentrations and
according to the upstream-downstream criterion described above. The δ15N-NO3- and the δ18O-NO3
- analyses
were performed following the Cd reduction method (McIlvin and Altabet, 2005) with an automatic pre-
concentrator (Pre-Con, Thermo Scientific) coupled to an isotope ratio mass spectrometer (IRMS) (Finnigan
MAT-253, Thermo Scientific). The δ2H H2O and δ18O H2O were measured using 2H and CO2 equilibrium
techniques, respectively, following standard methods (Epstein and Mayeda, 1953). δ2H H2O and δ18O H2O
were measured by use of a Delta V Advantage isotope ratio mass spectrometer (IRMS) (Thermo Fisher)
coupled with an automatic Gasbench II Thermo Fisher. The system requires a preliminary conditioning: the
vials containing the water samples are flushed with a mixture of He/H2 and He/CO2, to measure the isotopic
ratios D/H and 18O/16O respectively, followed by a balance between the aqueous phase of the sample and the
gas mixture introduced. Subsequently, the balanced gaseous fraction is injected into a gas chromatographic
column and sent for mass analysis.
According to Coplen (2011), several international and laboratory standards were interspersed among samples
for normalization of analyses. Three international standards (USGS 32, 34 and 35) and one internal laboratory
standard (CCIT-IWS (δ15N = +16.9 ‰ and δ18O = +28.5 ‰)) were employed to correct δ15N-NO3- and δ18O-
NO3- values. Results are expressed in δ (‰) values relative to international standards, atmospheric N2 (AIR)
for δ15N, and Vienna Standard Mean Ocean Water (V-SMOW) for δ18O and δ2H.
Samples for isotopic analyses of δ15N-NO3-, δ18O-NO3
- and δ15N-NH4+ were prepared at the laboratory of the
MAiMA-UB research group and analyzed at the Centres Científics i Tecnològics of the Universitat de

125
Barcelona (CCiT-UB), whereas δ2H H2O and δ18O H2O were analyzed at Environmental Isotope Laboratory,
ARPAE, Piacenza.
2.6 Statistical analysis of nitrates concentration
A statistical analysis was performed in order to investigate if i) the location of the wells, ii) the slope of the
soil in which the wells are located and iii) the wells depth, may affect groundwater NO3-contamination. The
normal distribution of the data was verified by using UNIVARIATE procedure (SAS Inst. Inc., Cary, NC;
release 8.0) by NORMAL option. Data were not normally distributed, and a log normal transformation was
applied to satisfy normality and homogeneity of variance assumptions underlying linear models. Through the
text, in tables and graphs, the average data were presented in their original scale, whereas pooled error terms
(i.e., root means square error or √MSE) were associated to log normal transformed data (Petrie and Watson,
2006). The experimental design corresponded to a completely randomized design with a 2 x 2 x 4 factorial
arrangement of treatments. A generalized linear model (GLM procedure) was applied to log transformed data
and main tested effects in the model were the location of the wells (Stream, n=2; upstream vs downstream),
the degree of the slope of the soil in which the wells are located (Slope, n=2) and the wells depth (Deep, n=4).
Two slope levels were defined, slope level I, with a slope between 0 and 3 ° and slope level II, with a slope >
3°. Based on the wells depth, four levels were defined, level I, with a depth < 6m, level II, with a depth between
6 and 10 m, level III, with a depth between 10 and 15 m and level IV, with a depth > than 30 m. First and
second order interactions of main tested effects were also included in the model
3. Results and discussion
3.1 Farmers interviews
The results of the first survey, in which 175 farmers were interviewed, revealed that in 107 farms there is a
groundwater well, used for drinking (8 %), irrigation (18 %), for mixture for pesticide treatments (80 %) and
not used (4 %). However, just 14 % of the 175 farmers interviewed are aware about the existence of nitrate
monitoring data on the ARPAE portal. Concerning fertilization practices, 118 farmers (67 %) use nitrogen-

126
based fertilizers in their vineyards. In particular, 22 % of them only use manure, 10 % fertilize every two years,
while 2.6 % fertilize every 3/4 years. The remaining 65.4% didn’t give details about the type and use of
fertilizer.
The results of the second survey, in which 50 of the 175 farmers previously interviewed were involved, have
shown that 20 % of farmers decide the fertilization scheme based on consultant technical support, 26 % based
on soil chemical analysis, 40 % based on personal experience and leaf vigor of grapevine, 12 % don’t use
fertilizers in the vineyards and 2% didn’t give an answer. Manure is used in 28 % of the vineyards after grape
harvest while 30 % of famers declared to use it just for the planting of a new vineyard. 50 % of famers carry
out analysis for organic matter and major elements (N, P, K) contents in soil and 84 % considers these analyses
an important data to avoid groundwater contamination by nitrates. However, 8 % considers that the grapevine
is able to adsorb all the fertilizers given. Based on these survey results, the introduction of a Farm Sustainability
Tool for Nutrients, as proposed by European Commission, would increase the knowledge concerning
fertilization efficiency and induce a harmonization of fertilization practices. The prevalent use of inorganic
nitrogen fertilization, declared by the farmers, is in line with previous studies (Martinelli et al., 2018), which
highlight the habit of farmers in Piacenza area to use inorganic fertilizers, which are more practical, more
comfortable to manage and have a higher performance than the organic fertilizers. Furthermore, in a study
conducted by Musacchio et al., (2020) in Lombardy region on the support given by local groundwater
governance for the correct implementation of Nitrate Directive, the stakeholder network analysis has shown
that the governance framework does not support knowledge dissemination and changes in farmers’ attitudes,
hindering water quality improvements. Moreover, all interviewees reported that control-based strategies
represent the only real tool to guarantee the adoption of sustainable practices by farmers but, at the same time,
it is extremely difficult to perform systematic and widespread controls due to the number of farms and the
associated costs. Farmers observed that recurrent controls may be a life-long learning opportunity if associated
to structured capacity building and to a mutual trust relationship between farmers and authorities. Therefore,
the authors highlight the need for Member States to provide to EU commission not only environmental
monitoring data but also an assessment of governance dynamics supporting the Directive implementation.
3.2 Hydrochemical data

127
The analysis of chemical elements in groundwater and additional physicochemical parameters such as pH,
electrical conductivity, temperature, static level, δ2H and δ18O and the study of their change over time
(seasonality) allow to characterize the investigated aquifer. Tables S1 and S2 in supplementary materials show
the mean, the minimum and the maximum values for temperature, static level (Table S1) and electrical
conductivity (EC), pH, δ2H and δ18O (Table S2) of 130 groundwater samples monitored during the five
sampling campaigns. In general, the average temperature values ranged from 13 to 18 ° C. A constant
temperature value in a well over time represents an indicator of quality (Memberg et al., 2014) suggesting that
the aquifer is protected from outside, and therefore just slightly affected by air temperature changes. As the
depth of the well increases, the temperature remains constant, with values around 14 - 15 ° C. The wells with
constant temperature were WP04, WP07, WP08 and WP32 with a depth of 8 m, 34 m, 30 m and 12 m
respectively. This high heterogeneity of wells depth is due to the presence of more than one shallow aquifer in
the area, as reported by Suciu et al. 2020. The pH values vary from 7.0 to 8.0 indicating a neutral to slightly
alkaline water, typical of the Tidone valley (ARPAE, 2017). The groundwater electrical conductivity shows a
high variation between wells, with values between 52 and 2341 µS/cm.
A summary of average concentrations of major and trace elements for groundwater sampled in 2019, is
provided in Table 2, while detailed values are provided in Tables S3 and S4 of supplementary material. As a
general trend, a high variation between wells and between sampling periods was observed for both major and
trace element concentrations in groundwater, as confirmed by the high standard deviations. Furthermore, for
most of the elements analyzed, higher values were observed in September 2019.
Very high concentrations were observed for Na, with values ranging from 1 to 260 mg/L, suggesting a strong
water–aquifer interaction related to direct cation exchange between groundwater and the clay fraction of the
aquifer material and/or pollution from wastewater (Wayland et al., 2003). Indeed, the area is characterized by
clay and clay-silty type of soils (Suciu et al, 2020). The highest Na:K ratio was obtained for well WP 18 while
a Na:K below one was observed for well WP 26, for both sampling campaigns. This relatively abundance of
K may indicate the presence of sedimentary rather than igneous rocks. However, the main source of K in the
area could be weathering of potash silicate minerals and/or agro-chemicals (K fertilizers are used for grapevine
cultivation). The source of Na ion may be due to its displacement from absorbed complex of rocks and soils
128
by Ca and Mg. Ca and Mg show high concentrations in groundwater, with values between 8 and 135 mg/L
and 2 and 53.7 mg/L, respectively.
Soluble anions, as chloride, sulfur, phosphate, show values in groundwater in the range of 0.2–622 mg/L, 1-
109 mg/L and 0.001 – 0.685 mg/L, respectively, indicating a high variability between wells and salty water in
some cases.
Concerning the trace elements, the results indicated high values for Mn, and Fe, between 0.1 and 484.3 µg/L,
and 0.6 and 200 µg/L, respectively, (Table S4), and a significant increase from July to September (R2Mn
correlation = 0.88 and R2Fe correlation = 0.76), suggesting a significant susceptibility of land surface to
agricultural practices (Devic et al., 2014). This is in agreement with a study on PTEs distribution and origin in
soil of Lombardy Region, Northern Italy, conducted by Sacchi et al., 2020, who reports lower concentrations
of Mn in soil during cropping seasons and an increase of both Fe and Mn concentrations in groundwater.
Furthermore, Mn show values above the Emilia Romagna Region quality standards for GW (50 µg/L) in 20 %
of the samples, while for Fe the Emilia Romagna Region quality standard (200 µg/L) was exceed in one
sample. Monitoring data of Emilia Romagna Region between 1988 and 2008 reported values for Mn and Fe
in groundwater of Conoide Tidone-Luretta - confinato inferiore above the quality standards in 5 % and 5.1 %,
respectively, of groundwater samples monitored. Beside these two elements, Ni was reported, by the above-
mentioned monitoring data, with values above the Emilia Romagna Region quality standard (20 µg/L) in 2.8
% of groundwater samples monitored. In our study, no groundwater sample shows Ni values above the quality
standard of Emilia Romagna Region.

129
Table 2. Summary of major and trace elements in groundwater of Tidone Valley
Elements Measure unit July 2019
Sept 2019
mean SD mean SD
Al mg L-1 0.01 0.01 0.02 0.01
Ca mg L-1 59.96 32.48 97.83 44.87
K mg L-1 5.27 11.95 10.43 17.12
Mg mg L-1 24.08 15.99 20.66 13.66
Na mg L-1 42.42 38.96 52.22 58.34
P mg L-1 0.06 0.14 0.08 0.21
S mg L-1 33.00 24.90 28.96 28.26
Zn mg L-1 0.09 0.11 0.12 0.06
Cl mg L-1 114.58 149.99 75.00 115.41
Li μg L-1 13.23 12.63 23.87 23.16
Ti μg L-1 0.19 0.18 0.49 0.75
V μg L-1 2.65 5.02 2.89 4.73
Cr μg L-1 1.64 4.05 1.07 1.49
Mn μg L-1 24.17 50.00 58.89 111.77
Fe μg L-1 4.11 3.63 34.06 56.16
Co μg L-1 0.12 0.15 0.19 0.26
Ni μg L-1 1.61 1.28 2.36 2.65
Cu μg L-1 8.02 19.38 11.40 25.89
As μg L-1 0.48 0.48 0.57 0.62
Se μg L-1 1.25 1.78 1.04 1.67
Rb μg L-1 2.48 2.64 3.95 4.46
Sr μg L-1 647.58 445.53 1116.43 717.11
Mo μg L-1 0.67 0.67 0.49 0.39
Ag μg L-1 0.04 0.03 0.06 0.03
Cd μg L-1 0.03 0.02 0.01 0.01
Sb μg L-1 0.18 0.08 0.12 0.11
Ba μg L-1 259.46 263.39 1072.96 551.49
Pb μg L-1 0.12 0.11 0.21 0.16
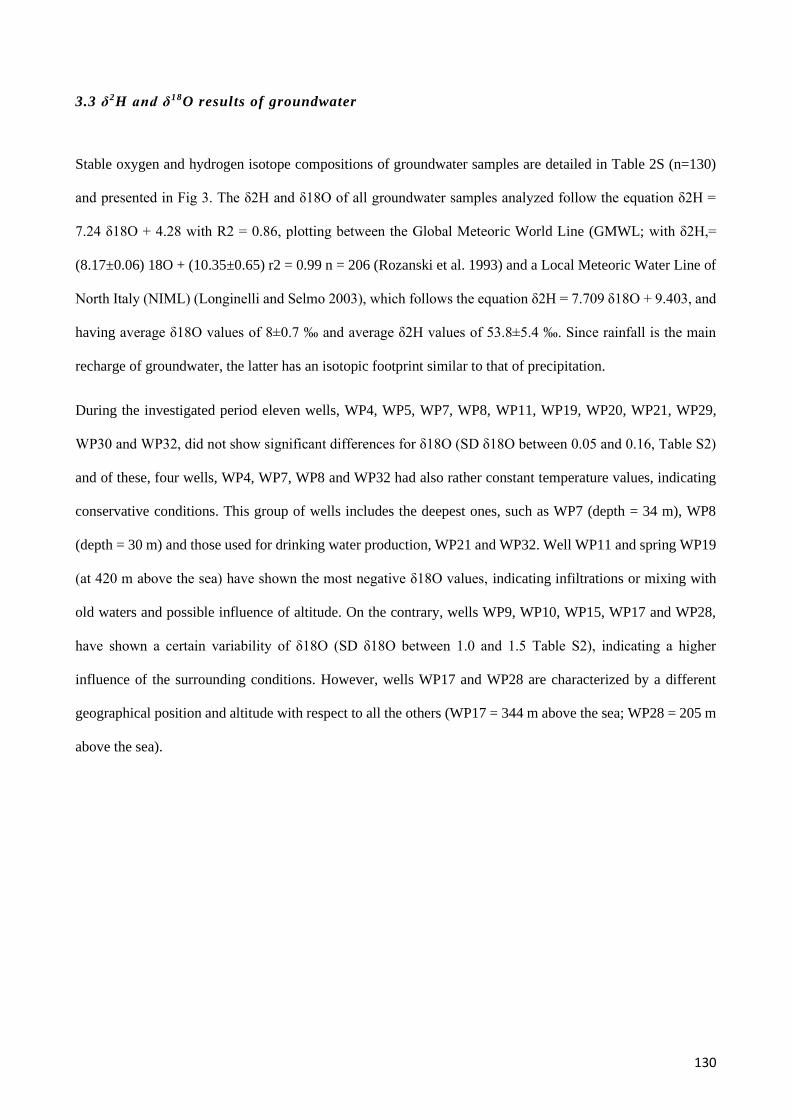
130
3.3 δ2H and δ18O results of groundwater
Stable oxygen and hydrogen isotope compositions of groundwater samples are detailed in Table 2S (n=130)
and presented in Fig 3. The δ2H and δ18O of all groundwater samples analyzed follow the equation δ2H =
7.24 δ18O + 4.28 with R2 = 0.86, plotting between the Global Meteoric World Line (GMWL; with δ2H,=
(8.17±0.06) 18O + (10.35±0.65) r2 = 0.99 n = 206 (Rozanski et al. 1993) and a Local Meteoric Water Line of
North Italy (NIML) (Longinelli and Selmo 2003), which follows the equation δ2H = 7.709 δ18O + 9.403, and
having average δ18O values of 8±0.7 ‰ and average δ2H values of 53.8±5.4 ‰. Since rainfall is the main
recharge of groundwater, the latter has an isotopic footprint similar to that of precipitation.
During the investigated period eleven wells, WP4, WP5, WP7, WP8, WP11, WP19, WP20, WP21, WP29,
WP30 and WP32, did not show significant differences for δ18O (SD δ18O between 0.05 and 0.16, Table S2)
and of these, four wells, WP4, WP7, WP8 and WP32 had also rather constant temperature values, indicating
conservative conditions. This group of wells includes the deepest ones, such as WP7 (depth = 34 m), WP8
(depth = 30 m) and those used for drinking water production, WP21 and WP32. Well WP11 and spring WP19
(at 420 m above the sea) have shown the most negative δ18O values, indicating infiltrations or mixing with
old waters and possible influence of altitude. On the contrary, wells WP9, WP10, WP15, WP17 and WP28,
have shown a certain variability of δ18O (SD δ18O between 1.0 and 1.5 Table S2), indicating a higher
influence of the surrounding conditions. However, wells WP17 and WP28 are characterized by a different
geographical position and altitude with respect to all the others (WP17 = 344 m above the sea; WP28 = 205 m
above the sea).
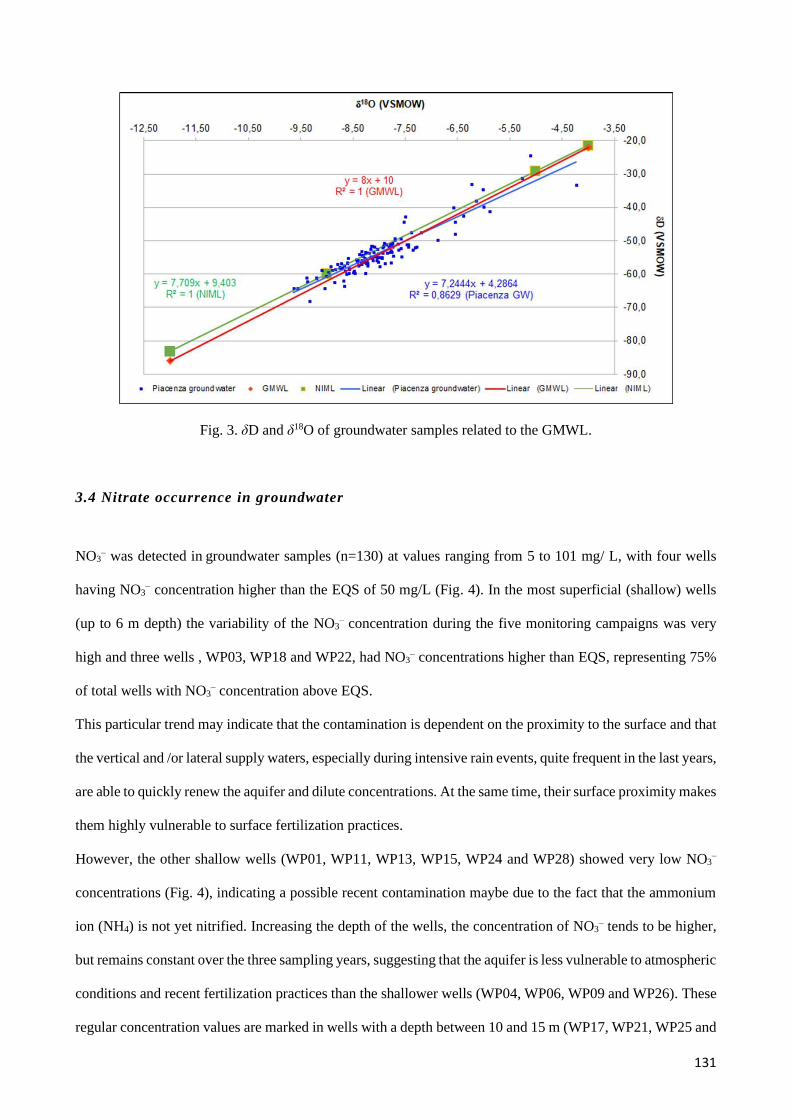
131
Fig. 3. δD and δ18O of groundwater samples related to the GMWL.
3.4 Nitrate occurrence in groundwater
NO3– was detected in groundwater samples (n=130) at values ranging from 5 to 101 mg/ L, with four wells
having NO3– concentration higher than the EQS of 50 mg/L (Fig. 4). In the most superficial (shallow) wells
(up to 6 m depth) the variability of the NO3– concentration during the five monitoring campaigns was very
high and three wells , WP03, WP18 and WP22, had NO3– concentrations higher than EQS, representing 75%
of total wells with NO3– concentration above EQS.
This particular trend may indicate that the contamination is dependent on the proximity to the surface and that
the vertical and /or lateral supply waters, especially during intensive rain events, quite frequent in the last years,
are able to quickly renew the aquifer and dilute concentrations. At the same time, their surface proximity makes
them highly vulnerable to surface fertilization practices.
However, the other shallow wells (WP01, WP11, WP13, WP15, WP24 and WP28) showed very low NO3–
concentrations (Fig. 4), indicating a possible recent contamination maybe due to the fact that the ammonium
ion (NH4) is not yet nitrified. Increasing the depth of the wells, the concentration of NO3– tends to be higher,
but remains constant over the three sampling years, suggesting that the aquifer is less vulnerable to atmospheric
conditions and recent fertilization practices than the shallower wells (WP04, WP06, WP09 and WP26). These
regular concentration values are marked in wells with a depth between 10 and 15 m (WP17, WP21, WP25 and
132
WP32) and confirmed by well WP08, characterized by a 30 m depth. Well WP07, characterized by a 34 m
depth and without a declared use, showed the highest NO3– concentration during the five monitoring
campaigns, probably due to the non-renewal of the water. Well WP19 is a spring used for drinking purposes
and, considered as the "blank" well of the study, due to its location upstream of the whole viticultural territory.
Groundwater’s flow has a South West-North East direction, as all the tributaries of the right bank of Po River
(Fig S2 in supplementary material). Indeed, WP19 showed very low NO3– concentration (<4.5 mg/L) during
all monitoring campaigns. On the contrary, well WP20, which represents the downstream well of the study,
due to its location at the end of the area covered by vineyards, showed a NO3– concentration values around 40
mg/L during all monitoring campaigns. It may collect the residues of all fertilization treatments of the upstream
area. Furthermore, the well is located in a livestock farm and this may influence NO3– concentration.
Comparing NO3– concentration in groundwater of the present well network with that of Emilia Romagna
Region network, a lower NO3– concentration in groundwater of Tidone valley was observed. Indeed, in Tidone
Valley only 7.7 % of groundwater samples showed values above the EQS between Nov 2017 and Sept 2018,
while in the entire Emilia Romagna Region 11.5% of groundwater samples showed values above the EQS in
the same period, suggesting a low to moderate impact of the viticulture on NO3– concentration of regional
groundwater. It must be kept in mind that the vineyards surface in the study area represents almost 75% of the
entire vineyard surface of Emilia Romagna Region (ISTAT, 2016).
A statistical analysis was performed in order to evaluate the influence of soil slope surrounding the wells, of
wells depth and of wells location (upstream vs downstream) on NO3- groundwater contamination. Table 3
reports the three variables in relation to the root mean squared error (√MSE) and the P values, while the values
represent the average NO3- concentrations (mg/L) in all 26 wells during the five monitoring campaigns (n =
130).
The slope of the soil and the interaction between the wells location with the soil slope and the depth did not
show a significant effect on NO3- concentration (P > 0.05), while well depth seems to affect significantly NO3
-
concentration (P < 0.05). Indeed, NO3- concentration increases when increasing the depth (14.6; 13.8; 19.1;
45.3), suggesting a higher contamination of deeper aquifers. This contradicts the general assumption that
shallow aquifers are more vulnerable to pollution, due to their proximity to the surface (Sacchi et al., 2013),
but reflects the local reality. Indeed, Suciu et al. (2020) reports the presence of more than one aquifer in the
133
study area and a low recharge rate of deeper aquifers due to the very low water flow. Therefore, this higher
contamination of deeper aquifers is probably the result of historical fertilization of vines, being vines a
perennial crop.
The wells location (upstream vs downstream) and the interaction between the soil slope and the depth showed
to affect slightly the NO3- concentration (P = 0.1). In fact, the concentration decreases in the downstream wells
and increases in the upstream wells, in discordance with the upstream-downstream approach that suggests that
wells located downstream should collect the residues of the treatments due to run-off at soil surface, transport
of surface water body and drainage to groundwater, as stated by Zambito Marsala et al., (2020). However, also
the soil type may affect groundwater NO3- concentration. Indeed, soils with clay contents greater than 20 %,
seem to retain NO3-, possibly by inhibiting leaching and recharge (Sacchi et al., 2013).
Therefore, the distribution on the territory of the wells with the higher NO3– concentrations does not seem to
be related to any specific groundwater flow direction. This could be explained by the presence of more than
one aquifer in the study area and their distinct recharge areas, and also by the mixing of waters from distinct
origins and qualities in the well. Indeed, Suciu et al. (2020) showed a low drainage and lateral water movement
in the clayey soils of the area for the period 2017-2018 and pointed out that point source contamination has an
important contribution to groundwater contamination by pesticides.
The presentation of surveys and analytical results during the Workshop organized in November 2018, that had
seen the participation of all actors involved in water use and governance of Tidone Valley, pointed out that
farmers and their organizations do not feel responsible for NO3– groundwater contamination, as that other
sources, as for example wastewater discharges, could have an influence and should be analyzed. Indeed, the
samples collected during 2019 were used for isotopic analysis to determine the sources of NO3- in groundwater.

134
Fig 4. Results of nitrates occurrence in groundwater (expressed only with the number that characterized the
code). The wells are ordered according to their depth in ascending order.
Table 3. Effect of the wells location (upstream vs downstream), the slope degree of the soil (type 1= 0°-3°;
type 2 = >3°) and wells depth (type 1= less than 6 meters; type 2 = 6-10 meters; type 3= 10-15 meters; type
4= over 30 meters) on NO3- concentration.
Stream Slope Deep √MSE P of the model
1 2 1 2 1 2 3 4 Stream Slope Deep Stream*Slope Stream*Deep Slope*Deep
21.2 16.1 25.1 15.3 14.6 13.8 19.1 45.3 1.1 0.1 0.2 0.0006 0.2 0.3 0.1
3.5 Source of nitrates through dual isotopic analysis
Nitrogen and oxygen isotopes in groundwater were analyzed in order to determine the sources of NO3- in the
study area and to find correlation between the use of nitrogen-based fertilizers and NO3-. In 2019 the NO3
-
concentration in GW ranged from 5.1 to 87.9 mg/L, in May, and from 6.5 to 101.2 in September.
135
Fig. 5 shows the δ15N and δ18O analyzed in the groundwater samples in two monitoring campaigns (May and
September 2019). In the groundwater samples collected in May 2019 (n=12), isotopic values ranged between
+4.2 ‰ and +20.5 ‰ for δ15N, and between +1.5 ‰ and +18.7 ‰ for δ18O. In particular, groundwater samples
of two wells (WP11 and WP20) presented δ15N and δ18O values compatible with organic fertilizers and sewage,
suggesting the use of manure for the fertilization of vineyard or discharge of household wastewater. Indeed,
according to Xue et al. (2009), δ15N values of NO3− originating from manure usually range between + 5 ‰ to
+ 25 ‰, and that originating from household sewage vary between + 4‰ and + 19 ‰. The owner of well WP
11 doesn’t use manure as fertilizer, therefore accidental household wastewater discharge could be the source
of NO3− occurrence.
Most of the groundwater samples (WP6; WP17; WP25; WP26; WP28; WP32) presented δ15N ranging between
+4.2 ‰ and +8.8 ‰, and δ18O ranging between +6.2 ‰ and 18.7 ‰ suggesting that NO3− may originate from
NH4+ and NO3
− fertilizers or soil organic nitrogen. Furthermore, the samples with δ18O-NO3 not fully
equilibrated with the δ18O of groundwater, suggesting a low residence time in the soil and a fast contamination
transfer to groundwater. The origin of NO3- in these samples may be potentially related to the application of
ammonium fertilizers nitrified to NO3- in the unsaturated zone. Furthermore, values of δ15N between +5 ‰
and +8 ‰, can also be derived from nitrification of soil nitrogen or from mixing between synthetic fertilizers
and anthropogenic organic matter, being most probably the origin in samples with NO3- concentration below
10 mg/L (Chae et al., 2009), except for WP26 and WP32. However, groundwater samples of the wells WP07,
WP05 and WP13 show δ15N values between +11‰ and +20.5 ‰, and δ18O values between +6.3 ‰ and +12.5
‰, indicating the uncertain origin of NO3- and an influence of denitrification process. Denitrification is the
transformation of nitrate into gaseous N2. It is considered the main natural process attenuating nitrate
concentration in groundwater. This requires the presence of denitrifying bacteria and electron donors (organic
carbon, reduced sulphur and/or reduced iron), abundant presence of NO3− and an anaerobic environment (Koba
et al., 1997, Rivett et al., 2008). Furthermore, although the isotopic fractionation (ε) for the study area was not
characterized, the denitrification percentage was estimated based on bibliographic values. Table 4 represents
a simplified model for denitrification based on literature isotopic fractionation values (Grau-Martinez et al.,
2017). The model assumes a closed system and calculates the isotopic composition of the remaining nitrate if
denitrification is taking place.
136
In September 2019, the groundwater of well WP22 was also analyzed for isotope data as NO3- concentration
in the last two monitoring campaigns were higher than the EQS of 50 mg/L (58 mg/L and 53.3 mg/L
respectively; Fig.4). The isotopic results of the total 13 GW samples showed NO3− isotope composition ranging
between -5.8 ‰ and +19.3 ‰ for δ15N, and between +4.3 ‰ and +41.3 ‰ for δ18O.
Comparing the isotopic results of the two sampling campaigns, a similar isotopic composition was observed
for wells WP05, WP06, WP07, WP13, WP17, WP18, WP20, WP25 and WP26, and an NO3- inorganic origin,
as a mix between NH4+ and NO3
- fertilizers (Fig 6), for three of them (WP06, WP17 and WP25). According to
Mengis et al. (2001) in soils with high microbial activity the δ18O of dissolved NO3- fertilizers is modified
through the recycling of NO3- in soil in a process abbreviated as MIT (mineralization-immobilization-
turnover). When this process takes place, it shifts the δ18O of dissolved NO3- from +23.5‰ to values similar
to those produced by nitrification of NH4+ fertilizers. Therefore, the observed values in wells WP06, WP17
and WP25 can also be attributed to the partial recycling of NO3- fertilizers in the soil.
Wells WP05, WP07, WP13 and WP18 showed an uncertain origin influenced by denitrification processes (Fig.
5). Since denitrification processes shifts the isotopic composition of both N and O with a slope ε18O/ε15N
varying from 0.5 to 1 (Böttcher et al., 1990; Wunderlich et al., 2013), when this process takes place, it can
hinder the interpretation of the nitrate source. In any case, a significant denitrification, highlighted by a
progressive enrichment in δ15N and δ18O of NO3-, was identified in wells WP07, WP05, WP13, and, to a lesser
extent in WP18, suggesting that a natural attenuation of nitrate pollution is taking place in these wells. Finally,
isotopic data of the wells WP20 and WP26, with similar δ15N and δ18O values in the two campaigns, fall in the
field of soil nitrogen.
On the other hand, wells WP 11 and WP 32 show completely different values in the two monitoring campaigns.
As plotted in Fig. 5, well WP11 shows an NO3- origin linked to sewage/manure in May and an NO3
- uncertain
origin in September, influenced by denitrification, while well WP32 shows an NO3- origin linked to NO3
-
fertilizers in the May and linked to soil NO3- in September.
With regards to the correlation between nitrates and isotopic data, the high NO3- concentration detected in
samples WP07, WP18, WP22 (higher than 50 mg/L) (Fig. 5) suggests a contribution from inorganic fertilizers
rather than a soil nitrate contribution, but in the present cases denitrification processes hinder the interpretation
of isotopic data. As stated by Hosono et al. (2013), groundwater samples with moderate to high NO3-

137
concentrations tended to have narrow isotope compositions (δ15N = +2 – +8‰ and δ18O = −3 – +5‰). In
contrast, the samples with the lowest NO3- concentrations tended to have higher isotopic compositions (δ15N=
+8 – +46 ‰ and δ18O= +5 – +48‰), suggesting the occurrence of denitrification. This principle, however, is
not in agreement for samples of well WP07, in which the highest NO3- concentration was detected, coupled
with high δ15N (+17.6 ‰ and +19.3 ‰) and δ18O (+10.1 ‰ and +11.3 ‰). This suggests that if denitrification
processes stop, NO3- concentration in well WP07 would be higher, and thus the contamination is very
significant. Thus, despite the significant denitrification and the lack of renewable water, the high NO3-
concentration within the well WP07, is likely due to local pollution or to historical fertilization of vines, as
stated in the paragraph 3.4.
According to Lasagna and De Luca (2017) a positive correlation, especially in the shallow aquifer, between
the NO3- concentrations and δ15N-NO3
- would support the presence of a nitrification process in aquifer.
However, in this case study, a positive correlation between δ15N-NO3- and NO3
- was not observed.
Furthermore, despite Martinelli et al. (2018) reported that in the Po Plain, of which our study area is part of,
the main source of NO3- in groundwater was manure, with δ15N median values significantly correlated with
the pig density, followed by synthetic fertilization, in the present work the main source of NO3- in groundwater
was inorganic fertilizers. This is in agreement with the land use and viticulture practices declared by most of
the farmers during the surveys. Indeed, in the study area, no significant livestock farming was reported, with
the exception of the cattle livestock where well WP 20 is located.

138
Fig 5. δ15N and δ18O of NO3- in groundwater of Tidone Valley.
4. Conclusions
In this work, the influence of nitrogen-based fertilization on nitrates occurrence in groundwater of Tidone
Valley, a hilly area with intensive viticulture activity, was evaluated for the first time. First, for the
characterization of the territorial agricultural and fertilization practices, two survey campaigns, involving 175
farmers and other stakeholders, were conducted by use of ad hoc questionnaires. The survey results revealed
an extensive use of inorganic nitrogen fertilizers, whereas the organic fertilization with manure is manly used
for planting of new vineyards.
Secondly, for aquifer characterization and its interaction with land surface, water isotope data, hydrochemical
and NO3- analyses were carried out. The results have shown a high variability of water isotope values and of
major and trace elements concentrations in most of the wells, suggesting the presence of more than one aquifer
in the area under study. Furthermore, Mn and Fe have shown high concentrations in groundwater and a
significant increase from July to September, suggesting a certain susceptibility of land surface to agricultural
139
practices. This is in accordance with NO3- analyses results, which revealed high variability during the five
monitoring campaigns in shallow wells, in which NO3- used as fertilizer for grapevine cultivation could readily
drain. In the deeper wells NO3- concentration was higher but constant in time, suggesting that the aquifer is
more protected and less vulnerable to external conditions. Indeed, statistical analysis showed a significant
influence of well’s depth on NO3- concentration, with higher values in the deeper ones. However, just 4 out of
26 groundwater wells have shown values above EQS, three of them being shallow wells, while the deeper ones
show constant values around 40 mg/L, confirming the vulnerability of the zone to NO3- contamination.
Lastly, nitrogen and oxygen isotopes in groundwater were analyzed in order to determine the sources of NO3-
in groundwater. The results have shown that most of the NO3- found in the groundwater samples is derived
from the use of inorganic nitrogen fertilizers, in agreement with the land use and viticulture practices declared
by most of the farmers during the surveys.
Comparing NO3– concentration in groundwater of the present well network with that of Emilia Romagna
Region network, a lower NO3– concentration in groundwater of Tidone valley was observed. Indeed, in Tidone
Valley just 7.7% of groundwater samples have shown values above the EQS between Nov 2017 and Sept 2018,
while in the entire Emilia Romagna Region 11.5% of groundwater samples have shown values above the EQS
in the same period. Considering that the vineyards surface in the study area represents almost 75% of the entire
vineyard surface of Emilia Romagna Region, the obtained results suggest a low to moderate impact of
viticulture on NO3– concentration of Emilia Romagna Region groundwater.
Finally, as survey results indicated a tendency of farmers to follow their own experience for fertilization, the
introduction of a Farm Sustainability Tool for Nutrients, as proposed by European Commission, as well as the
assessment of governance dynamics supporting the Directive implementation by Member States, as suggested
by previous literature studies, would increase the knowledge concerning fertilization efficiency and facilitate
the achievement of a fully resilient socio-environmental system.

140
Supplementary material
Table S1. Depth, Temperature (T) and Static Level (SL) of groundwater monitored during the five sampling
campaigns, Nov 2017, Jul 2018, Sep 2018, Jul 2019 and Sep 2019
Sample Depth (m) T (° C) SL (m)
Mean Min Max Mean Min Max
WP01 2.0 17.5 12.4 19.3 -1.21 -1.23 -1.14
WP03 6.0 15.3 11.6 17.0
WP04 8.1 14.2 13.7 14.7 -6.00 -6.22 -5.42
WP05 3.0 16.0 11.9 18.6 -1.78 -2.18 -1.48
WP06 7.0 17.2 15.0 19.6 -3.69 -5.82 -2.47
WP07 34.0 14.0 13.4 14.3 -31.19 -31.38 -31.1
WP08 30.1 14.2 13.4 14.6 -21.29 -21.61 -21.03
WP09 6.2 15.5 12.0 17.0 -3.21 -4.98 -2.20
WP10 9.0 18.0 14.0 19.8 -1.49 -1.57 -1.43
WP11 5.7 14.9 14.0 15.8 -3.22 -3.72 -2.97
WP13 5.4 16.5 14.5 17.9 -3.25 -3.72 -3.00
WP14 4.5 16.0 11.4 17.4 -2.88 -3.75 -2.24
WP15 4.6 15.7 12.3 17.0 -2.99 -3.43 -2.60
WP17 11.4 15.3 10.4 17.5 -2.08 -2.18 -1.98
WP18 3.5 15.3 10.1 17.0 -2.22 -2.95 -1.60
WP19 * 16.4 13.0 21.0
WP20 117.0 16.1 15.1 17.7
WP21 11.0 13.2 11.8 14.0 -3.74 -4.20 -3.10
WP22 5.3 16.6 15.2 17.7 -2.17 -2.90 -1.27
WP24 3.7 14.9 12.4 17.0 -2.97 -3.71 -1.67
WP25 11.2 16.2 12.4 18.7 -3.07 -3.52 -2.80
WP26 8.8 15.9 12.7 19.6 -2.20 -4.88 -0.68
WP28 4.9 17.4 15.3 19.0 -1.70 -2.10 -1.23
WP29 2.9 16.2 14.9 17.0 -1.78 -2.08 -1.22
WP30 7.8 14.8 14.0 16.0 -3.61 -5.12 -2.55
WP32 12.0 13.1 13.0 13.3 -8.83 -11.07 -6.80
* Water source has no depth
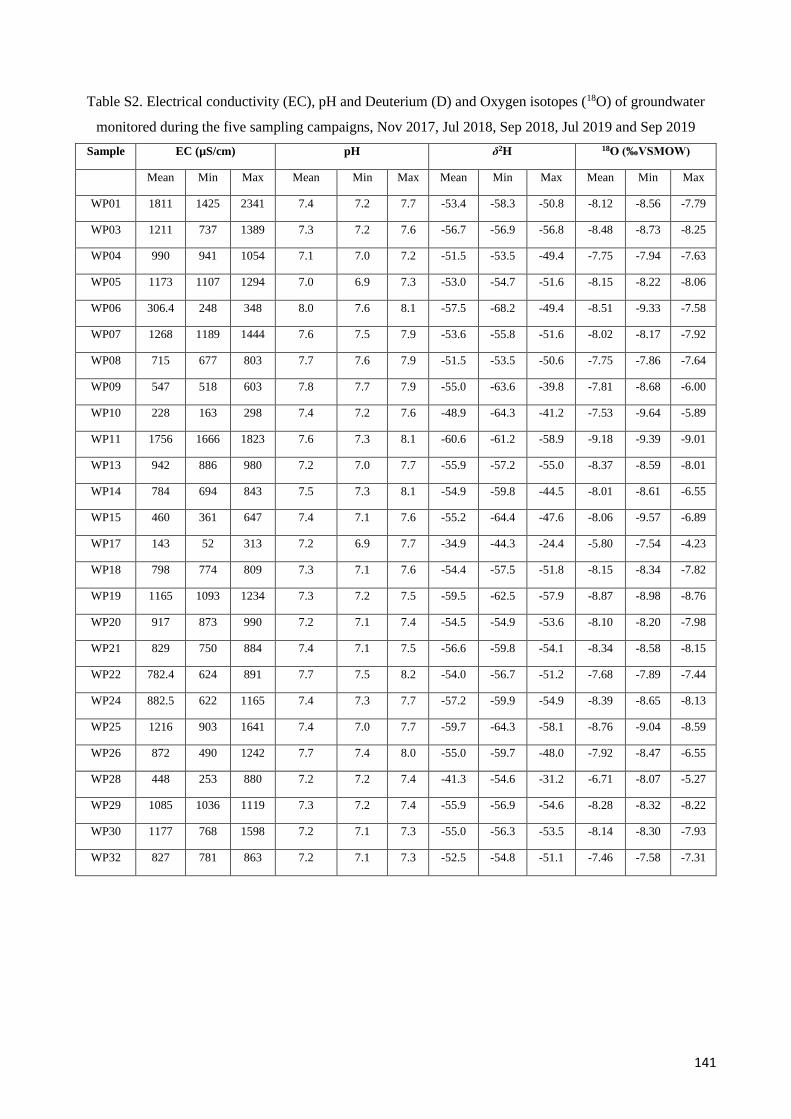
141
Table S2. Electrical conductivity (EC), pH and Deuterium (D) and Oxygen isotopes (18O) of groundwater
monitored during the five sampling campaigns, Nov 2017, Jul 2018, Sep 2018, Jul 2019 and Sep 2019
Sample EC (µS/cm) pH δ2H 18O (‰VSMOW)
Mean Min Max Mean Min Max Mean Min Max Mean Min Max
WP01 1811 1425 2341 7.4 7.2 7.7 -53.4 -58.3 -50.8 -8.12 -8.56 -7.79
WP03 1211 737 1389 7.3 7.2 7.6 -56.7 -56.9 -56.8 -8.48 -8.73 -8.25
WP04 990 941 1054 7.1 7.0 7.2 -51.5 -53.5 -49.4 -7.75 -7.94 -7.63
WP05 1173 1107 1294 7.0 6.9 7.3 -53.0 -54.7 -51.6 -8.15 -8.22 -8.06
WP06 306.4 248 348 8.0 7.6 8.1 -57.5 -68.2 -49.4 -8.51 -9.33 -7.58
WP07 1268 1189 1444 7.6 7.5 7.9 -53.6 -55.8 -51.6 -8.02 -8.17 -7.92
WP08 715 677 803 7.7 7.6 7.9 -51.5 -53.5 -50.6 -7.75 -7.86 -7.64
WP09 547 518 603 7.8 7.7 7.9 -55.0 -63.6 -39.8 -7.81 -8.68 -6.00
WP10 228 163 298 7.4 7.2 7.6 -48.9 -64.3 -41.2 -7.53 -9.64 -5.89
WP11 1756 1666 1823 7.6 7.3 8.1 -60.6 -61.2 -58.9 -9.18 -9.39 -9.01
WP13 942 886 980 7.2 7.0 7.7 -55.9 -57.2 -55.0 -8.37 -8.59 -8.01
WP14 784 694 843 7.5 7.3 8.1 -54.9 -59.8 -44.5 -8.01 -8.61 -6.55
WP15 460 361 647 7.4 7.1 7.6 -55.2 -64.4 -47.6 -8.06 -9.57 -6.89
WP17 143 52 313 7.2 6.9 7.7 -34.9 -44.3 -24.4 -5.80 -7.54 -4.23
WP18 798 774 809 7.3 7.1 7.6 -54.4 -57.5 -51.8 -8.15 -8.34 -7.82
WP19 1165 1093 1234 7.3 7.2 7.5 -59.5 -62.5 -57.9 -8.87 -8.98 -8.76
WP20 917 873 990 7.2 7.1 7.4 -54.5 -54.9 -53.6 -8.10 -8.20 -7.98
WP21 829 750 884 7.4 7.1 7.5 -56.6 -59.8 -54.1 -8.34 -8.58 -8.15
WP22 782.4 624 891 7.7 7.5 8.2 -54.0 -56.7 -51.2 -7.68 -7.89 -7.44
WP24 882.5 622 1165 7.4 7.3 7.7 -57.2 -59.9 -54.9 -8.39 -8.65 -8.13
WP25 1216 903 1641 7.4 7.0 7.7 -59.7 -64.3 -58.1 -8.76 -9.04 -8.59
WP26 872 490 1242 7.7 7.4 8.0 -55.0 -59.7 -48.0 -7.92 -8.47 -6.55
WP28 448 253 880 7.2 7.2 7.4 -41.3 -54.6 -31.2 -6.71 -8.07 -5.27
WP29 1085 1036 1119 7.3 7.2 7.4 -55.9 -56.9 -54.6 -8.28 -8.32 -8.22
WP30 1177 768 1598 7.2 7.1 7.3 -55.0 -56.3 -53.5 -8.14 -8.30 -7.93
WP32 827 781 863 7.2 7.1 7.3 -52.5 -54.8 -51.1 -7.46 -7.58 -7.31

142
Table S3. Average major elements concentration in groundwater of Tidone Valley in Jul and Sep 2019
Well
Al Ca K Mg Na P S Zn Cl
mg L-1 mg L-1 mg L-1 mg L-1 mg L-1 mg L-1 mg L-1 mg L-1 mg L-1
Jul2019
Sep 2019
Jul2019
Sep 2019
Jul2019
Sep 2019
Jul2019
Sep 2019
Jul2019
Sep 2019
Jul2019
Sep 2019
Jul2019
Sep 2019
Jul2019
Sep 2019
Jul2019
Sep 2019
WP01
0.051
0.073 63 135 0.34 25.0 8.7 23.0 14 260 0.00
4 0.968 12 9.73
0.286
0.130 25 540
WP03
0.022
58 49.66
48.6 28.0 68 0.002
55 0.376
123
WP04
0.010
0.030 27 130 0.72 1.5 36.1 39 36. 0.00
1 0.002 17 17.92
0.156
0.330 407 100
WP05
0.019
0.023 69 114 0.98 1.7 53.7 33.7 40 27 0.00
1 0.008 57 44.49
0.166
0.182 317 65
WP06
0.022
0.023 16 35 6.97 15.1 3.1 3.1 19 23 0.08
8 0.032 7 9.15
0.117
0.045 56 38
WP07
0.016
0.027 36 83 1.30 3.0 39.3 40.7 112 110 0.00
6 0.006 43 43.01
0.169
0.084 307 164
WP08
0.014
0.026 27 60 1.23 3.3 10.2 9.5 65 67 0.08
2 0.031 26 28.77
0.119
0.086 205 109
WP09
0.012
0.027 38 70 1.63 3.8 13.5 10.4 21 32 0.01
4 0.019 24 32.88
0.195
0.079 30 18
WP10
0.019
0.033 18 26 2.57 11.7 2.0 4.9 7 12 0.68
5 0.434 3 0.88
0.262
0.098 15 10
WP11
0.031
0.020 65 135 39.8
4 73.4 53.6 48.1 156 134
0.012
0.007 97 108.9
2 0.26
7 0.110 622 235
WP13
0.005
0.010 134 105 0.18 2.8 26.1 26.0 15 125 0.00
8 0.001 34 26.52
0.015
0.108 50 24
WP14
0.004
0.022 111 159 0.80 2.3 12.3 10.3 12 12 0.00
1 0.006 22 22.81
0.026
0.158 21 18
WP15
0.006
0.028 40 61 1.88 5.0 6.6 7.5 8 15 0.10
4 0.097 5 3.92
0.012
0.097 8 10
WP17
0.008
0.023 8 14 0.57 1.9 0.6 0.9 1 4 0.19
7 0.066 1 1.58
0.040
0.087 0.2 5
WP18
0.004
0.012 48 107 0.09 0.9 24.2 21.1 32 34 0.00
2 0.002 15 13.38
0.005
0.090 17 18
WP19
0.005
0.022 81 159 0.86 0.8 27.4 21.5 121 18 0.00
1 0.009 68 60.68
0.007
0.140 54 39
WP20
0.001
0.007 68 113 0.61 1.6 31.7 22.0 44 36 0.00
1 0.004 18 13.51
0.010
0.083 106 63
Wp21
0.003
0.011 56 101 1.71 4.5 26.1 26.3 41 46 0.00
1 0.004 47 2.45
0.017
0.137 20 39
WP22
0.009
0.019 114 135 1.87 3.7 20.3 17.8 17 20 0.00
6 0.006 42 36.82
0.022
0.087 68 49
WP24
0.001
- 100 - 0.35 - 32.8 - 83 - 0.01
8 - 56 -
0.010
- 137 -
WP25
0.004
0.017 64 111 6.88 35.4 28.6 46.8 29 65 0.03
0 0.040 58 89.38
0.010
0.126 11 30
WP26
0.004
0.013 33 96 9.36 34.3 7.5 14.9 6 14 0.15
1 0.063 7 13.94
0.032
0.115 9 16
WP28
0.002
0.030 41 20 5.18 3.5 14.5 3.8 19 9 0.03
7 0.021 8 1.79
0.010
0.079 21 8
WP29
0.002
- 99 - 0.25 - 49.0 - 64 - 0.00
7 - 70 -
0.005
- 204 -
WP30
0.004
0.026 75 165 0.64 2.7 28.2 34.5 44 70 0.00
5 0.005 37 56.45
0.026
0.158 86 82
WP32
0.005
0.013 70 116 0.57 2.0 21.5 20.3 26 32 0.00
3 0.001 29 26.99
0.022
0.101 60 45
Note: Bolded numbers represents values above EQS for GW
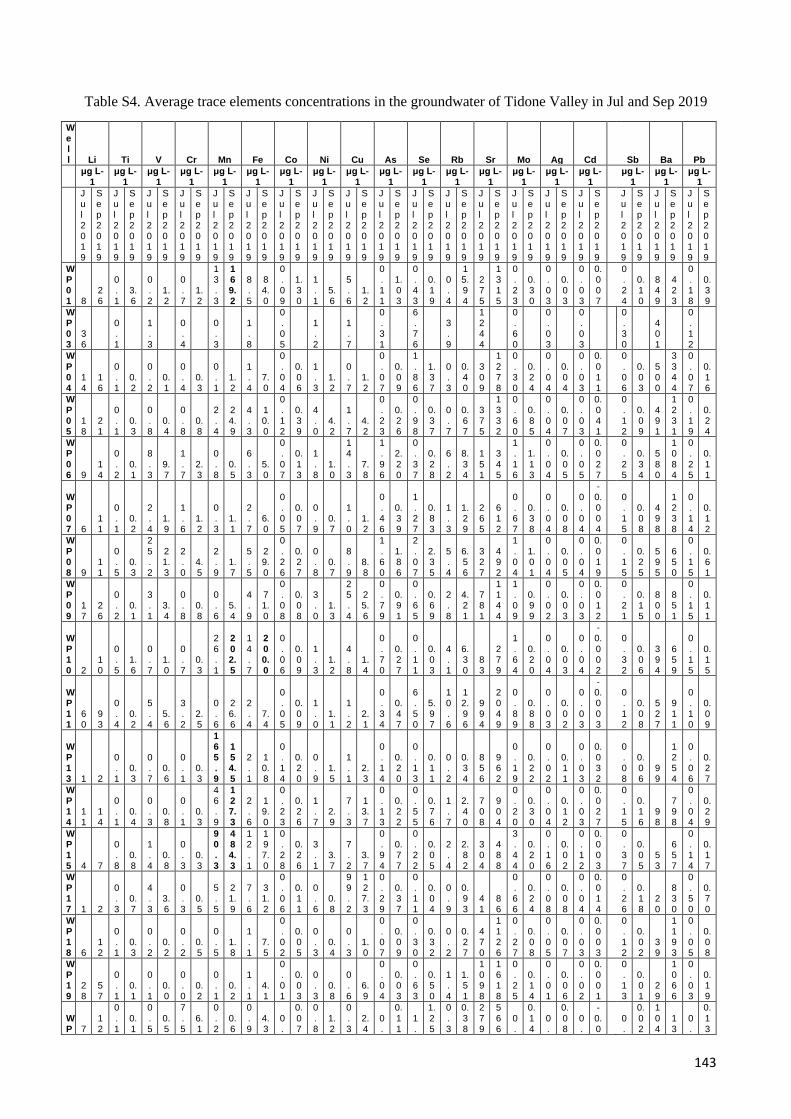
143
Table S4. Average trace elements concentrations in the groundwater of Tidone Valley in Jul and Sep 2019
Well Li Ti V Cr Mn Fe Co Ni Cu As Se Rb Sr Mo Ag Cd
Sb Ba Pb
μg L-
1 μg L-
1 μg L-
1 μg L-
1 μg L-
1 μg L-
1 μg L-
1 μg L-
1 μg L-
1 μg L-
1 μg L-
1 μg L-
1 μg L-
1 μg L-
1 μg L-
1 μg L-
1 μg L-
1 μg L-
1 μg L-
1
Jul2019
Sep 2019
Jul2019
Sep 2019
Jul2019
Sep 2019
Jul2019
Sep 2019
Jul2019
Sep 2019
Jul2019
Sep 2019
Jul2019
Sep 2019
Jul2019
Sep 2019
Jul2019
Sep 2019
Jul2019
Sep 2019
Jul2019
Sep 2019
Jul2019
Sep 2019
Jul2019
Sep 2019
Jul2019
Sep 2019
Jul2019
Sep 2019
Jul2019
Sep 2019
Jul2019
Sep 2019
Jul2019
Sep 2019
Jul2019
Sep 2019
WP01 8
26
0.1
3.6
0.2
1.2
0.7
1.2
13.3
169.2
8.5
84.0
0.09
1.30
1.1
5.6
5.6
1.2
0.11
1.03
0.43
0.19
0.4
15.94
275
1315
0.23
0.30
0.03
0.03
0.03
0.007
0.24
0.10
849
423
0.18
0.39
WP03
36
0.1
1.3
0.4
0.3
1.8
0.05
1.2
1.7
0.31
6.76
3.9
1244
0.60
0.03
0.03
0.30
401
0.12
W
P04
14
16
0.1
0.2
0.2
0.1
0.4
0.3
0.1
1.2
1.4
7.0
0
.04
0.06
1.3
1.2
0.7
1.2
0
.07
0.09
1
.86
1.37
0.3
0.40
309
1
278
0
.30
0.24
0
.04
0.04
0
.03
0.
011
0
.06
0.03
500
3
344
0
.07
0.16
WP05
18
21
0.1
0.3
0.8
0.4
0.8
0.8
2.4
24.9
4.3
10.0
0.12
0.39
4.0
4.2
1.7
4.2
0.23
0.26
0.98
0.37
0.7
0.67
375
1332
0.60
0.85
0.04
0.07
0.03
0.041
0.12
0.09
491
1231
0.19
0.24
WP06 9
14
0.2
0.1
8.3
9.7
1.7
2.3
0.8
0.5
6.3
5.0
0.07
0.13
1.8
1.0
14.3
7.8
1.96
2.20
0.37
0.28
6.2
8.34
151
345
1.16
1.13
0.04
0.05
0.05
0.027
0.25
0.34
580
1084
0.25
0.11
WP07 6
11
0.1
0.2
2.4
1.9
1.6
1.2
0.3
1.1
2.7
6.0
0.05
0.07
0.9
0.7
1.0
1.2
0.46
0.39
1.27
0.83
1.3
1.29
265
612
0.67
0.38
0.04
0.08
0.04
-0.004
0.15
0.08
498
1238
0.14
0.12
WP08 9
11
0.5
0.3
25.2
21.3
2.0
4.5
2.9
1.7
5.5
29.0
0.26
0.27
0.8
0.7
8.9
8.8
1.60
1.86
2.07
2.35
5.4
6.56
327
492
1.04
1.01
0.04
0.05
0.04
0.019
0.15
0.25
595
650
0.15
0.61
WP09
17
26
0.2
0.1
3.1
3.4
0.8
0.8
0.6
5.4
4.9
71.0
0.08
0.08
3.0
1.3
25.4
25.6
0.79
0.91
0.65
0.69
2.8
4.21
781
1144
1.09
0.99
0.02
0.03
0.03
0.012
0.21
0.15
800
851
0.15
0.11
WP10 2
10
0.5
1.6
0.7
1.0
0.7
0.3
26.1
202.5
14.7
200.0
0.06
0.09
1.3
1.2
4.8
1.4
0.70
0.27
0.11
0.03
4.1
6.30
83
279
1.64
0.20
0.04
0.03
0.04
-0.002
0.32
0.06
394
659
0.15
0.15
WP11
60
93
0.4
0.2
5.4
5.6
3.2
2.5
0.6
26.6
2.4
7.4
0.05
0.09
1.0
1.1
1.2
2.1
0.34
0.47
6.50
5.97
10.6
12.96
994
2049
0.89
0.88
0.03
0.02
0.03
-0.003
0.12
0.08
527
911
0.10
0.09
WP13 1 2
0.1
0.3
0.7
0.6
0.1
0.3
165.9
154.5
2.1
10.8
0.14
0.20
0.9
1.5
1.1
2.3
0.14
0.20
0.13
0.11
0.2
0.34
856
962
0.19
0.22
0.02
0.11
0.03
0.032
0.08
0.06
99
1254
0.06
0.27
WP14
11
14
0.1
0.4
0.3
0.8
0.1
0.3
46.9
127.3
2.6
19.0
0.23
0.26
1.7
2.9
7.3
13.7
0.13
0.22
0.55
0.76
1.7
2.40
708
904
0.20
0.30
0.04
0.12
0.03
0.027
0.15
0.16
98
798
0.04
0.29
WP15 4 7
0.8
0.8
1.4
0.8
0.3
0.3
90.3
484.3
12.1
197.0
0.28
0.26
3.1
3.7
7.2
3.7
0.94
0.77
0.22
0.05
2.4
2.82
304
488
3.44
0.20
0.16
0.02
0.12
0.003
0.37
0.05
53
657
0.14
0.17
WP17 1 2
0.3
0.7
4.3
3.6
0.3
0.5
5.5
21.9
7.6
31.2
0.06
0.11
0.6
0.8
99.2
127.3
0.29
0.37
0.11
0.04
0.9
0.93
41
86
0.66
0.24
0.08
0.08
0.04
0.014
0.26
0.18
20
830
0.50
0.70
WP18 6
12
0.1
0.3
0.2
0.2
0.2
0.5
0.5
1.8
1.1
7.5
0.02
0.05
0.3
0.4
0.3
1.0
0.07
0.09
0.30
0.32
0.2
0.27
470
1126
0.27
0.08
0.05
0.07
0.03
0.003
0.12
0.02
39
1193
0.05
0.08
WP19
28
57
0.1
0.1
0.1
0.0
0.0
0.2
0.1
0.2
1.1
4.1
0.01
0.03
0.3
0.8
0.6
6.9
0.04
0.03
0.63
0.50
1.4
1.51
1098
1618
0.25
0.14
0.01
0.06
0.02
0.001
0.13
0.01
29
1066
0.03
0.19
WP 7
12
0.1
0.1
0.5
0.5
7.5
6.1
0.2
0.6
0.9
4.3
0.
0.07
0.8
1.2
0.3
2.4
0.
0.11
1.
1.25
0.3
0.38
279
566
0.
0.14
0.
0.08
0.
-0.0
0.
0.02
104
13
0.
0.13

144
20
05
08
38
24
02
03
05
12
33
03
Wp21
20
41
0.1
0.1
0.0
0.0
0.0
0.2
0.1
0.4
5.4
4.2
0.02
0.09
0.6
8.3
0.4
5.1
0.05
0.06
0.77
1.01
0.8
0.86
967
1780
0.59
0.44
0.04
0.04
0.02
0.018
0.13
0.03
35
1150
0.03
0.22
WP22
15
28
0.2
0.3
0.5
0.5
20.0
0.2
0.6
1.3
2.8
8.9
0.05
0.15
1.2
1.9
8.2
9.2
0.27
0.42
0.22
0.13
1.2
1.20
1199
1797
0.37
0.42
0.06
0.07
0.03
0.003
0.17
0.13
81
1095
0.16
0.16
WP24 6
0.1
1.3
0.3
89.8
1.6
0.74
2.9
1.6
0.71
0.23
1.6
645
0.43
0.04
0.03
0.16
50
0.28
WP25
22
77
0.1
0.3
3.9
6.4
0.4
0.8
0.2
3.0
2.4
7.6
0.04
0.08
2.1
1.0
3.6
4.3
0.61
1.54
2.61
6.08
3.2
8.52
1556
2926
0.76
1.34
0.04
0.02
0.03
0.003
0.15
0.16
33
805
0.03
0.08
WP26 7
26
0.1
0.3
4.2
5.0
0.3
0.4
0.6
1.6
1.7
6.7
0.05
0.12
0.6
1.2
4.0
7.5
0.84
1.30
0.32
0.56
6.6
10.02
265
992
0.72
1.13
0.05
0.06
0.03
0.015
0.32
0.49
140
955
0.06
0.12
WP28 5 3
0.1
0.3
2.2
2.6
0.2
0.5
175.6
42.2
8.7
46.0
0.35
0.11
1.5
0.6
3.5
4.0
0.41
0.33
0.15
0.11
6.4
2.65
520
267
0.40
0.27
0.05
0.10
0.03
0.011
0.17
0.15
53
856
0.03
0.21
WP29
12
0.1
1.0
0.1
0.6
0.9
0.04
0.7
1.9
0.21
3.16
0.5
1582
0.26
0.05
0.02
0.20
39
0.02
WP30
10
21
0.1
0.5
0.5
0.7
0.4
0.1
4.1
81.9
2.0
14.0
0.04
0.19
5.8
10.9
3.0
7.2
0.90
0.19
0.21
0.16
1.1
1.74
1022
2294
0.15
0.20
0.04
0.07
0.03
0.006
0.14
0.10
95
1321
0.05
0.14
WP32
10
19
0.1
0.1
0.2
0.2
0.2
0.3
0.1
0.4
1.4
2.7
0.16
0.16
2.4
2.1
0.9
14.1
0.09
0.11
0.56
0.76
0.4
0.48
521
1026
0.25
0.21
0.02
0.07
0.03
0.005
0.15
0.02
143
974
0.05
0.17
Note: Bolded numbers represents values above EQS for GW
Figure S1: Conceptual model of shallow aquifer (CMA) (for more details see Suciu et al. 2020)

145
Figure S2 Piezometric maps of groundwater in Nov 2017 (a), Jul 2018 (b), Sep 2018 (c), Jul 2019 (d), Sep
(e).
Acknowledgments
This research is part of the WaterProtect project and has received funding from the European Union’s Horizon
2020 Research and Innovation Program under grant agreement No. 727450.
The authors thanks Milena Repetti and Barbara Braghi (ARPAE, Environmental Isotope Laboratory,
Piacenza), for supporting the isotopic analysis (δD and δ18O) carried out on all the samples collected, Antonio
Gallo (Università Cattolica del Sacro Cuore, Piacenza) for supporting statistical analysis and Marco Marcaccio
(ARPAE, Arpae Emilia-Romagna - Direzione Tecnica, Monitoraggio stato ambientale acque sotterranee) for
hydrology study support.
References
Ahmed, M., Rauf, M., Akhtar, M., Mukhtar, Z., Saeed, N., A. 2020. Hazards of nitrogen fertilizers and ways
to reduce nitrate accumulation in crop plants. Environmental Science and Pollution Research.
https://doi.org/10.1007/s11356-020-08236-y
146
Ahmed, M., Rauf, M., Mukhtar, Z., Saeed, N., A. 2017. Excessive use of nitrogenous fertilizers: an
unawareness causing serious threats to environment and human health. Environmental Science and Pollution
Research, 24, 26983–26987.
ARPAE, 2017, Report risorse idriche sotterranee 2010-2013
https://www.arpae.it/dettaglio_documento.asp?id=6623&idlivello=1788
Biddau, R., Cidu, R., Da Pelo, S., Carletti, A., Ghiglieri, G., Pittalis, D. 2019. Source and fate of nitrate in
contaminated groundwater systems: Assessing spatial and temporal variations by hydrogeochemistry and
multiple stable isotope tools. Science of the Total Environment, 647, 1121-1136.
https://doi.org/10.1016/j.scitotenv.2018.08.007
Bottcher, J., Strebel, O., Voerkelius, S., & Schmidt, H. L. (1990). Using Isotope Fractionation of Nitrate
Nitrogen and Nitrate Oxygen for Evaluation of Microbial Denitrification in a Sandy Aquifer. Journal of
Hydrology, 114(3–4), 413–424. https://doi.org/Doi 10.1016/0022-1694(90)90068-9
Bryan, N., S., Alexander, D., D., Coughlin, J., R., Milkowski, A., L., Boffetta, P.. 2012. Ingested nitrate and
nitrite and stomach cancer risk: an updated review. Food Chem. Toxicol., 50, 3646-3665.
Calliera, M., Suciu, N., A., Zambito Marsala, R., Russo, E., Bisagni, M., Colla, R., Capri, E. 2020. The role of
Risk Communication and Stakeholders involvement in the adoption of Best Management Practices and for a
sustainable use of pesticides in hilly vineyards. In submission in this VSI. Science of The Total Environment.
Capri, E., Civita, M., Corniello, A., Cusimano, G., De Maio, M., Ducci, D., Fait, G., Fiorucci, A., Hauser, S.,
Pisciotta, A., Pranzini G., Trevisan M., Delgado Huertas, A., Ferrari, F., Frullini, R., Nisi, B., Offi, M., Vaselli,
O., Vassallo, M. 2009. Assessment of nitrate contamination risk: The Italian experience. Journal of
Geochemical Exploration, 102, 71–86.
Chae, G., Yun, S., Mayer, B., Choi, B., Kim, K., Kwon, J., Yu, S. 2009. Hydrochemical and stable isotopic
assessment of nitrate contamination in an alluvial aquifer underneath a riverside agricultural field. Agricultural
Water management, 96, 1819-1827. https://doi.org/10.1016/j.agwat.2009.08.001
Coplen, T., B. 2011. Guidelines and recommended terms for expression of stable‐isotope‐ratio and gas‐ratio
measurement results. Rapid Communications in in Mass Spectrometry, 25 (17), 2538-2560.
https://doi.org/10.1002/rcm.5129

147
Devic, G., Djordjevic, D., Sakan, S. 2014. Natural and anthropogenic factors affecting the groundwater quality
in Serbia. Science of The Total Environment, 468-469, 933-942.
https://doi.org/10.1016/j.scitotenv.2013.09.011
Dimitrova, S., Taneva, N., Bojilova, K., Zaharieva, V., Lazarova, S., Kaleva, M., Arsov, R., Venelinov, T.
2013. Comparison of spectrophotometric methods using cuvette tests and national standard methods for
analysis of wastewater samples. Water Resources and Environmental Engineering, 5, 482-488.
https://doi.org/10.5897/IJWREE2012.0405
DGR 619 08/06/2020. New designation of new Nitrate Vulnerable Zones of agricultural origin. New
designation of areas vulnerable to nitrates of agricultural origin, in implementation of directive 91/676 /EEC
on the protection of waters from pollution caused by nitrates from agricultural sources.
European Environment Agency (EEA). 2018. European waters. Assessment of status and pressures 2018.
doi:10.2800/303664
EC, 2017, Commission Staff Working Document — Agriculture and Sustainable Water Management in the
EU (SWD(2017) 153 final), European Commission, Brussels.
Elisante, E., Muzuka, A.N.N. 2017. Occurrence of nitrate in Tanzanian groundwater aquifers: A review. Appl
Water Sci 7, 71–87 (2017). https://doi.org/10.1007/s13201-015-0269-z
Epstein, S., Mayeda, T., 1953. Variation of O18 content of waters from natural sources. Geochim. Cosmochim.
Acta 4 (5):213–224. https://doi.org/10.1016/0016-7037(53)90051-9
EU, 1991, Council Directive 91/676/EEC of 12 December 1991 concerning the protection of waters against
pollution caused by nitrates from agricultural sources (OJ L 375, 31.12.1991, pp. 1-8) (http://eur-
lex.europa.eu/legal-content/EN/ TXT/?uri=CELEX:31991L0676) accessed 17 April 2018.
European Commission (EC), (2000). Directive 2000/60/EC of the European Parliament and of the Council
establishing a framework for the Community action in the field of water policy. Water Framework Directive.
http://data.europa.eu/eli/dir/2000/60/oj
European Environment Agency (EEA). 2018. European waters. Assessment of status and pressures 2018.
doi:10.2800/303664
Eurostat, the statistical office of the European Union. Reference Metadata in Euro SDMX Metadata Structure
(ESMS). 2016. Gross nutrient balance (aei_pr_gnb).

148
M. Farina, M. Marcaccio, A. Zavatti (Eds.), Esperienze e prospettive nel monitoraggio delle acque sotterranee.
Il contributo dell’Emilia-Romagna, Pitagora Editrice, Bologna (2014) (560 pp. (ISBN 88-371-1859-7)
Feast, N., A., Hiscock, K.. M., Dennis, P., F., Andrews, J., N. 1998. Nitrogen isotope hydrochemistry and
denitrification within the Chalk aquifer system of north Norfolk, UK. Journal of Hydrology, 211, 233-252.
https://doi.org/10.1016/S0022-1694(98)00245-5
Foster, S., Chilton, J. 2003. Groundwater: the process and global significance of aquifer degradation. Philos
Trans R Soc B 358:1957–1972.
Grau-Martinez, A., Torremto, C., Carrey, R., Rpdriguez-Escales, P., Domenech, C., Ghiglieri, G., Soler, A.,
Otero, N. 2017. Feasibility of two low-cost organic substrates for inducing denitrification in artificial recharge
ponds: Batch and flow-through experiments. Journal of Contaminant Hydrology, 198, 48-58.
https://doi.org/10.1016/j.jconhyd.2017.01.001
Groenendijk, P., Heinen, M., Klammler, G., Fank, J., Kupfersberger, H., Pisinaras, V., Gemitzi, A., Pena-Haro,
S., Garcia-Prats, A., Pulido-Velazquez, M., Perego, A., Acutis, M., Trevisan, M. 2014. Performance
assessment of nitrate leaching models for highly vulnerable soils used in low-input farming based on lysimeter
data. Science of The Total Environment, 499, 463-480. https://doi.org/10.1016/j.scitotenv.2014.07.002
Hansen, B., Thorling, L., Schullehner, J., Termansen, M., Dalgaard, T. 2017. Groundwater nitrate response to
sustainable nitrogen management. Sci. Rep. 10.1038/s41598-017-07147-2
Hosono, T., Tokunaga, T., Kagabu, M., Nakata, H., Orishikida, T., Lin, I., Shimada, J. 2013. The use of δ15N
and δ18O tracers with an understanding of groundwater flow dynamics for evaluating the origins and
attenuation mechanisms of nitrate pollution. Water Research, 47, 2661-2675.
https://doi.org/10.1016/j.watres.2013.02.020
Jamshidzadeh, Z., Mirbagheri, S., A. 2011. Evaluation of groundwater quantity and quality in the Kashan
Basin, Central Iran. Desalination, 270, 23-30. https://doi.org/10.1016/j.desal.2010.10.067
Kaushal, S., S., Groffman, P., M., Band, L., E., Elliott, E., M., Shields, C., A., Kendall, C. 2011. Tracking
Nonpoint Source Nitrogen Pollution in Human-Impacted Watersheds, Environmental Science & Technology
2011 45 (19), 8225-8232. https://doi.org/10.1021/es200779e

149
Kim, H., Kaown, D., Mayer, B., Lee, J., Y., Hyun, Y., Lee, K., K. 2015. Identifying the sources of nitrate
contamination of groundwater in an agricultural area (Haean basin, Korea) using isotope and microbial
community analyses. Sci Total Environ. 2015 Nov 15;533:566-75. doi: 10.1016/j.scitotenv.2015.06.080
Koba, K., Tokuchi, N., Wada, E., Nakajima, T., Iwatsubo, G. 1997. Intermittent denitrification: The application
of a 15N natural abundance method to a forested ecosystem. Geochimica et Cosmochimica Acta, 61, 5043-
5050. https://doi.org/10.1016/S0016-7037(97)00284-6
Lasagna, M., De Luca, D., A. 2017. Evaluation of sources and fate of nitrates in the western Po plain
groundwater (Italy) using nitrogen and boron isotopes. Environmental Science and Pollution Research, 26,
2089-2104. https://doi.org/10.1007/s11356-017-0792-6
Longinelli, A., Selmo, E. 2003. Isotopic composition of precipitation in Italy: a first overall map. Journal of
Hydrology, 270, 75-88. https://doi.org/10.1016/S0022-1694(02)00281-0
Martinelli, G., Dadomo, A., De Luca, D., A., Mazzola, M., Lasagna, M., Pennisi, M., Pilla, G., Sacchi, E.,
Saccon, P. 2018. Nitrate sources, accumulation and reduction in groundwater from Northern Italy: Insights
provided by a nitrate and boron isotopic database. Applied Geochemistry, 91, 23-35.
https://doi.org/10.1016/j.apgeochem.2018.01.011
McIlvin, M., Altabet, M., A. 2005. Chemical Conversion of Nitrate and Nitrite to Nitrous Oxide for Nitrogen
and Oxygen Isotopic Analysis in Freshwater and Seawater. Analytical Chemistry, 77, 5589-5595.
https://doi.org/10.1021/ac050528s
Menciò, A., Boy, M., Mas-Pla, J. 2011. Analysis of vulnerability factors that control nitrate occurrence in
natural springs (Osona Region, NE Spain). Science of The Total Environment, 409, 3049-3058.
https://doi.org/10.1016/j.scitotenv.2011.04.048
Mengis, M., Walther, U., Bernasconi, S. M., & Wehrli, B. (2001). Limitations of using δ18O for the source
identification of nitrate in agricultural soils. Environmental Science and Technology, 35(9), 1840–1844.
https://doi.org/10.1021/es0001815
Musacchio, A., Re, V., Mas-Pla, J., Sacchi, E. EU Nitrates Directive, from theory to practice: Environmental
effectiveness and influence of regional governance on its performance (2020) Ambio, 49 (2), pp. 504-516.
DOI: 10.1007/s13280-019-01197-8.
150
Nikanorov, A., M., Brazhnikova, L., V. 2012. Types and Properties of Water II: Water Chemical Composition
of Rivers, Lakes and Wetlands.
Nikolenko, O., Jurado, A., Borges, A., V., Knoller, K., Brouyѐre, S. 2018. Isotopic composition of nitrogen
species in groundwater under agricultural areas: A review. Science of The Total Environment, 621, 1415-1432.
https://doi.org/10.1016/j.scitotenv.2017.10.086
Nolan, B., T., Hitt, K., J., Ruddy, B., C. 2002 Probability of Nitrate Contamination of Recently Recharged
Groundwaters in the Conterminous United States. Environmental Science and Technology, 36, 2138-2145.
DOI: 10.1021/es0113854
Padovani, L., Trevisan, M. 2000 I nitrati di origine agricola nelle acque sotterranee. Un indice parametrico per
l’individuazione di aree vulnerabili. Pitagora Editrice, Bologna.
Petrie, A., and P. F. Watson. (2006). Statistics for veterinary and animal science. Second edition. Blackwell
Publishing Ltd., Oxford, UK.
Pham, V., P., Nakano, A., Van Der Star, W., R., L., Heimovaara, T., J., Van Paassen, L., A. 2018. Applying
MICP by denitrification in soils: a process analysis. Environmental Geotechnics, 5-2, 79-93.
https://doi.org/10.1680/jenge.15.00078
Pradhan, B., Pirasteh, S. 2011. Hydro-Chemical Analysis of the Ground Water of the Basaltic Catchments:
Upper Bhatsai Region, Maharastra. The Open Hydrology Journal, 5, 51-57.
DOI: 10.2174/1874378101105010051
Puig, R., Soler, A., Widory, D., Mas-Pla, J., Domenech, C., Otero, N. 2017. Characterizing sources and natural
attenuation of nitrate contamination in the Baix Ter aquifer system (NE Spain) using a multi-isotope approach.
Science of the Total Environment, 580, 518-532. https://doi.org/10.1016/j.scitotenv.2016.11.206
Re V. 2015. Incorporating the social dimension into hydrogeochemical investigations for rural development:
the Bir Al-Nas approach for socio-hydrogeology. Hydrogeology Journal, 23 (7), pp. 1293-1304. DOI:
10.1007/s10040-015-1284-8
Regional Regulation n. 3/2017 - Commencement of the ban on agronomic use of farm effluents; clarifications
and further technical standards regarding the agronomic use of farmed effluents, digestate and waste water.
Regione Emilia-Romagna, 2015. Delibera di Giunta n. 1781, “Aggiornamento del quadro conoscitivo di
riferimento (carichi inquinanti, bilanci idrici e stato delle acque) ai fini del riesame dei Piani di Gestione
151
Distrettuali 2015-2021”. http://ambiente.regione.emilia-
romagna.it/acque/informazioni/documenti/aggiornamento-del-quadro-conoscitivo-di-riferimento-carichi-
inquinanti-bilanci-idrici-e-stato-delle-acque-ai-fini-del-riesame-dei-piani-di-gestione-distrettuali-2015-2021.
Regione Emilia-Romagna Approvazione delle attività della Regione Emilia-Romagna riguardanti
l'implementazione della Direttiva 2000/60/CE ai fini della redazione e adozione dei Piani di Gestione dei
Distretti idrografici Padano, Appennino settentrionale e Appennino centrale. Delibera di Giunta della Regione
Emilia-Romagna n. 350 del 8/02/2010 (in Italian) Available on http://ambiente.regione.emilia-
romagna.it/it/acque/approfondimenti/normativa/DGR_350_2010_All2.pdf (2010), Accessed 25th May 2020.
Rivett, M., O., Buss, S., R., Morgan, P., Smith, J., W., N., Bemment, C., D. 2008. Nitrate attenuation in
groundwater: A review of biogeochemical controlling processes. Water Research, 42, 4215-4232.
https://doi.org/10.1016/j.watres.2008.07.020
Rozanski, K., Araguás-Araguás, L., & Gonfiantini, 1993. R. Isotopic Patterns in Modern Global Precipitation.
(1993) Climate Change in Continental Isotopic Records.
https://eur03.safelinks.protection.outlook.com/?url=https%3A%2F%2Fdoi.org%2Fdoi%3A10.1029%2FGM
078p0001&data=02%7C01%7Cettore.capri%40unicatt.it%7C0611fa20fc6b4c6b241f08d858b3efca%7
Cb94f7d7481ff44a9b5886682acc85779%7C0%7C0%7C637356877141457148&sdata=LhMFJIr8%2B
%2B6VXmKMkdCFGkNyl7MX4V1EDvDbX3EIC78%3D&reserved=0
Sacchi, E., Acutis, M., Bartoli, M., Brenna, S., Delconte, C., A., Laini, A., Pennisi, M. 2013. Origin and fate
of nitrates in groundwater from the central Po plain: Insights from isotopic investigations. Applied
Geochemistry, 34, 164-180. https://doi.org/10.1016/j.apgeochem.2013.03.008
Sacchi, E.; Brenna, S.; Fornelli Genot, S.; Leoni, A.; Sale, V.; Setti, M. 2020. Potentially Toxic Elements
(PTEs) in Cultivated Soils from Lombardy (Northern Italy): Spatial Distribution, Origin, and Management
Implications. Minerals, 10(4), 298;
https://eur03.safelinks.protection.outlook.com/?url=https%3A%2F%2Fdoi.org%2F10.3390%2Fmin1004029
8&data=02%7C01%7Cettore.capri%40unicatt.it%7C0611fa20fc6b4c6b241f08d858b3efca%7Cb94f7d7
481ff44a9b5886682acc85779%7C0%7C0%7C637356877141457148&sdata=BeWpDvgRr8EDUEI9td
DLUdEdA5Q8o3gfRuXF3DbH3Xk%3D&reserved=0.

152
Suciu, N., A., Farolfi, C., Zambito Marsala, R., Russo, E., De Crema, M., Peroncini, E., Tomei, F., Antolini,
G., Marcaccio, M., Mrletto, V., Colla, R., Gallo, A., Capri, E. 2020. Evaluation of groundwater contamination
sources by Plant Protection Products in hilly vineyards of Northern Italy. In submission for this VSI. Science
of The Total Environment.
Valiente, N., Carrey, R., Otero, N., Soler, A., Sanz, D., Munoz-Martin, A., Jirsa, F., Wanek, W., Gomez-Alday,
J., J. 2018. A multi isotopic approach to investigate the influence of land use on nitrate removal in a highly
saline lake-aquifer system. Science of The Total Environment, 631-632, 649-659.
https://doi.org/10.1016/j.scitotenv.2018.03.059
Viaroli, P., Soana, E., Pecora, S., Laini, A., Naldi, M., Fano, E.A., Nizzoli, D. Space and time variations of
watershed N and P budgets and their relationships with reactive N and P loadings in a heavily impacted river
basin (Po river, Northern Italy) (2018) Science of The Total Environment, 639, pp. 1574-1587 DOI:
10.1016/j.scitotenv.2018.05.233.
Wayland, K., G., Long, D., T., Hyndman, D., W., Pijanowski, B., C., Woodhams, S., M., Haack, S., K. 2003.
Identifying Relationships between Baseflow Geochemistry and Land Use with Synoptic Sampling and R‐
Mode Factor Analysis. Journal of Environmental Quality, 32, 180-190. https://doi.org/10.2134/jeq2003.1800.
Xue, D., Botte, J., De Baets, B., Accoe, F., Nestler, A., Taylor, P., Van Cleemput, O., Berglund, M., Boeckx,
P. 2009. Present limitations and future prospects of stable isotope methods for nitrate source identification in
surface- and groundwater. Water Research, 43, 1159-1170. https://doi.org/10.1016/j.watres.2008.12.048.
Wunderlich, A., Meckenstock, R.U., Einsiedl, F., 2013. A mixture of nitrite-oxidizing and denitrifying
microorganisms affects the δ18O of dissolved nitrate during anaerobic microbial denitrification depending on
the δ18O of ambient water. Geochim. Cosmochim. Acta 119, 31–45.
https://doi.org/10.1016/J.GCA.2013.05.028
Zambito Marsala, R., Capri, E., Russo, E., Colla, R., Lucini, L., Gallo, A., Suciu, N., A. 2020. First evaluation
of pesticides occurrence in groundwater of Tidone Valley, an area with intensive viticulture. Science of the
Total environment. https://doi.org/10.1016/j.scitotenv.2020.139730
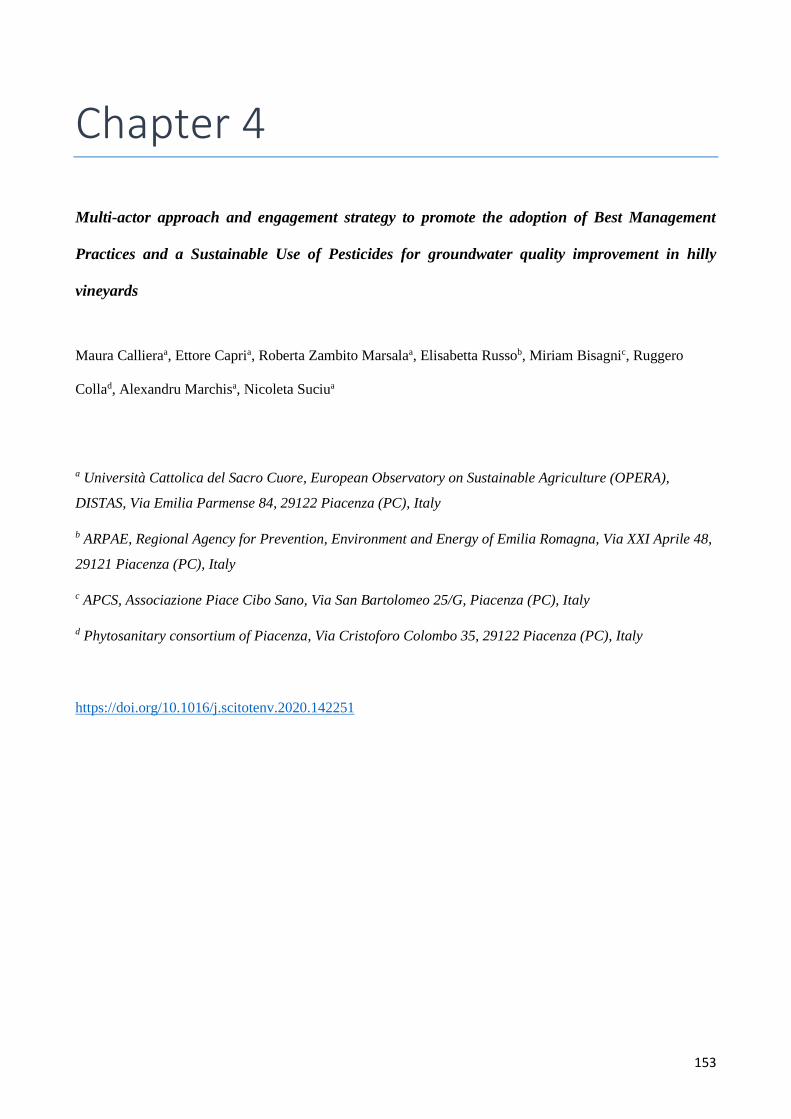
153
Chapter 4
Multi-actor approach and engagement strategy to promote the adoption of Best Management
Practices and a Sustainable Use of Pesticides for groundwater quality improvement in hilly
vineyards
Maura Callieraa, Ettore Capria, Roberta Zambito Marsalaa, Elisabetta Russob, Miriam Bisagnic, Ruggero
Collad, Alexandru Marchisa, Nicoleta Suciua
a Università Cattolica del Sacro Cuore, European Observatory on Sustainable Agriculture (OPERA),
DISTAS, Via Emilia Parmense 84, 29122 Piacenza (PC), Italy
b ARPAE, Regional Agency for Prevention, Environment and Energy of Emilia Romagna, Via XXI Aprile 48,
29121 Piacenza (PC), Italy
c APCS, Associazione Piace Cibo Sano, Via San Bartolomeo 25/G, Piacenza (PC), Italy
d Phytosanitary consortium of Piacenza, Via Cristoforo Colombo 35, 29122 Piacenza (PC), Italy
https://doi.org/10.1016/j.scitotenv.2020.142251

154
Abstract
The adoption of pesticide mitigation measures and innovation at farm level, are seen as a drivers to reach the
sustainable water policy objectives. With the aim to prevent the pesticide pressure of hilly vineyards on
groundwater contamination, a stepwise approach in Tidone Valley was applied using different consultation
mechanisms and involvement strategies throughout the overall process. Face to face meetings, direct surveys,
participatory monitoring and planning of several activities aiming to inform, educate, improve skills, change
of individual behavior or raise awareness, or even initiatives to build institutional trust or support for new
investment in innovation are some examples. These activities allowed us to involve key actors of water use
and governance (such as farmers, advisors, representatives of drinking water management, farmer's
associations, Winemaking cooperatives, local Health Authority), and to have a deeper knowledge of the
context agricultural practices, of farmer's knowledge and skills concerning factors influencing water
contamination and also to promote the most suitable Best Management Practices aimed at limiting the pesticide
occurrence in groundwater. Indeed, the survey’s results highlighted that the majority of the farms are small
(64% of vineyards <10 ha), that most of the farmers (62%) are not aware of the current legislation on water,
even if 64% of them declare to participate regularly to training courses for the prevention of water
contamination and that there is a low to moderate level of adoption of Best Practices able to prevent
contamination by pesticides. At the end of the overall process, it can be stated that the multi-actor approach
and engagement strategy adopted were successful in improving attitudes to more sustainable practices. This is
supported also by the monitoring data that show in 2019 a decrease by 44% of pesticides occurrences and a
fall by 68% of values above EQSgw if compared with the period 2017–2018.
Keywords
Sustainable pesticide use, Engagement, Point source contamination, Groundwater
Abbreviations
SUD Directive on Sustainable pesticide Use
WFD Water Framework Directive

155
BMPs Best Management Practices
MM Mitigation Measure
PPPs Plant Protection Products
EQSgw Environmental Quality Standards groundwater
1. Introduction
Sustainable agriculture is a key objective of the European Union and a focus of its sustainable development
policies. In this framework, adequate solutions are considered necessary to contrast negative impacts to human
health and the environment, connected with the use of chemicals as pesticides. (COM 2003). At present,
approaches are mainly based on regulatory interventions including the approval for placing on the market,
after a very comprehensive risk assessment,, each active substance as well as the products containing that
substance, with Regulation 1107/2009/EC, (EU 2009a) and for the use phase of pesticides in agriculture with
the Directive on Sustainable pesticide Use (SUD), (EU 2009b), and the required National Action Plans,
adopted by Member States that should contain quantitative objectives, targets, measurements and timetables
to reduce the risks and impacts of pesticide use. This legal framework gives the possibility of implementing
risk-mitigation measures to supplement the product approval conditions, with the aim to set specific practices
of application of the products that will further limit human and environmental exposure. Awareness and
understanding of the implication of labelling instructions is a critical factor, to ensure that products are applied
according to the conditions designed in the risk evaluation process, so that to ensure that safety rules and
protection goals are met (Alix et al. 2018). In parallel, the Water Framework Directive (WFD) is the principal
legislative instrument for protecting water resources and to endorse sustainable water resource management at
European level. Main challenges addressed by WFD are also found in other of the policy-oriented
sustainability assessment approaches such as those promoted to achieve the sustainable use of pesticides (EU,
2000). The implementation of such legislation influences the production in the agricultural sector, but the
effectiveness of these laws can be reduced or slowed by several factors. As stated in the latest report of
Commission (COM 587/2017) the National Action Plans set in conformity the SUD "suffer from delays, are

156
developed mechanically to strictly comply with a pre-set list of measures, resulting in minimal changes in
practices and with not sufficient impact to preserve or restore water quality". Member States are currently
working on reviewing their first plans although there has been substantial progress, the report identifies that
there are significant gaps in many areas of the plans, for example in relation to [..] "information to the public,
the gathering of information regarding poisoning cases, measures to protect the aquatic environment" (COM
587/2017). In Italy, despite the various measures taken to prevent or to minimize the impact of agricultural
activity on water contamination, the results of pesticides water monitoring reveal, in several cases, an
inadequate quality of the aquifers and surface water, limiting the achievement of national WFD objectives.
Some compulsory measures like training, storage, equipment inspections or respect of non-spray zones are in
place at national level, but their effectiveness cannot really be assessed since it is not possible to understand if
they have been implemented properly by all farmers. UC Davis Agricultural Sustainability Institute states that
"making the transition to sustainable agriculture is a process. For farmers, the transition to sustainable
agriculture normally requires a series of small, realistic steps. Family economics and personal goals influence
how fast or how far participants can go in the transition"(Feenstra, 2016). Recent review on factors influencing
farmer's adoption of Best Management Practices suggest to focus on study scale, including micro (farms) scale,
on measuring and modelling of adoption as a continuous process, and on incorporation of social norms and
uncertainty into decision-making (Tingting Liu, 2018). The adoption of mitigation measures and innovation at
farm level, is seen as a strategy or driver to reach the sustainable policy objectives. But different problems in
addressing the challenges are present, especially at farm level. It is supported by a recent growing body of
literature, that sustainable agriculture is not the result of a simple linear, one-way process that goes from the
scientific production of technics or knowledge to its application, but the result of complex "systemic
interactions" between different subjects involved in various ways (GCSA, 2014). The community involved in
pesticide risk analysis and pesticide use is highly diverse, including all interested and affected parties such as
regulatory risk assessors, risk managers and risk communicators as well as applicants for product authorization,
the wider scientific community, consultants and farmers. Several EU research projects (eg. BROWSE,
HEROIC), given the enormous variability and uncertainty associated with the behavioral component that
characterizes the pesticide use activity, agreed that there is a need for improvement in measuring different
stakeholders risk perception to increase trust in the pesticide risk evaluation process, and then the pesticide use

157
according to the conditions designed in the risk evaluation process and in the labels. Research in HEROIC
project highlight that socio-behavioral aspects are not generally addressed except for very few cases, and
commonly, it is argued that engagement in unsafe pesticide use and disposal practices is the result of a lack of
knowledge and misperceptions of the risks associated with pesticides amongst operators and workers (Calliera,
2016). Research in EU Browse project regarding Operators, revealed several short-comings in terms of
appropriate behaviour (mainly concerning wearing appropriate PPE, use of the recommended spray volume,
compliance with wind speed limits and applying of measures to avoid and address unintended events during
application, variable linked to climate condition) (Sacchettini, 2015). Recent works analyse farmer’s risk
perceptions regarding pesticide use (Remoundou, K,2014) to stimulate their sustainable behaviour and
compliance to Good Agriculture Practice (GAP) as written in the pesticide labels. In all these projects and
research, a participative and inclusive approach is considered as necessary in all phases of the relationship with
stakeholders, in a bottom up perspective starting from a deep understanding of the farmers realities and
behaviour of the various actors, to more interactive communication and demonstration strategies, up to training
activities that overcome the traditional top-down (from expert to farmers) approach and consider local
knowledge as an important key for the transition towards sustainability (Calliera, 2018). This paper
complements this stream of works by evaluating the farmers intentions to adopt sustainable agricultural
practices to limit or prevent water contamination and by analysing the bottlenecks in their implementation.
The study is part of a broader project on water governance, funded under the EC program H2020,
WATERPROTECT, which aims to contribute to a better knowledge and understanding of how water
governance is organized at catchment level and how the agricultural activities can be improved in order to
limit their impact on drinking water. The Italian case study considers three catchments in Tidone Valley,
northern Italy, characterised by an intensive viticulture production. In particular, the present study aims to
develop a communication and engagement strategy effective in providing good agriculture practices and a
comprehensive and acceptable list of pesticide mitigation measures able to prevent or limit the pressure of
hilly vineyard cultivation on groundwater contamination in Tidone Valley. In the following paragraph will be
described the engagement methodologies, the strategies, the analysis of point source and diffuse source of
water contamination at context level and also the strategies adopted to reduce the water contamination.
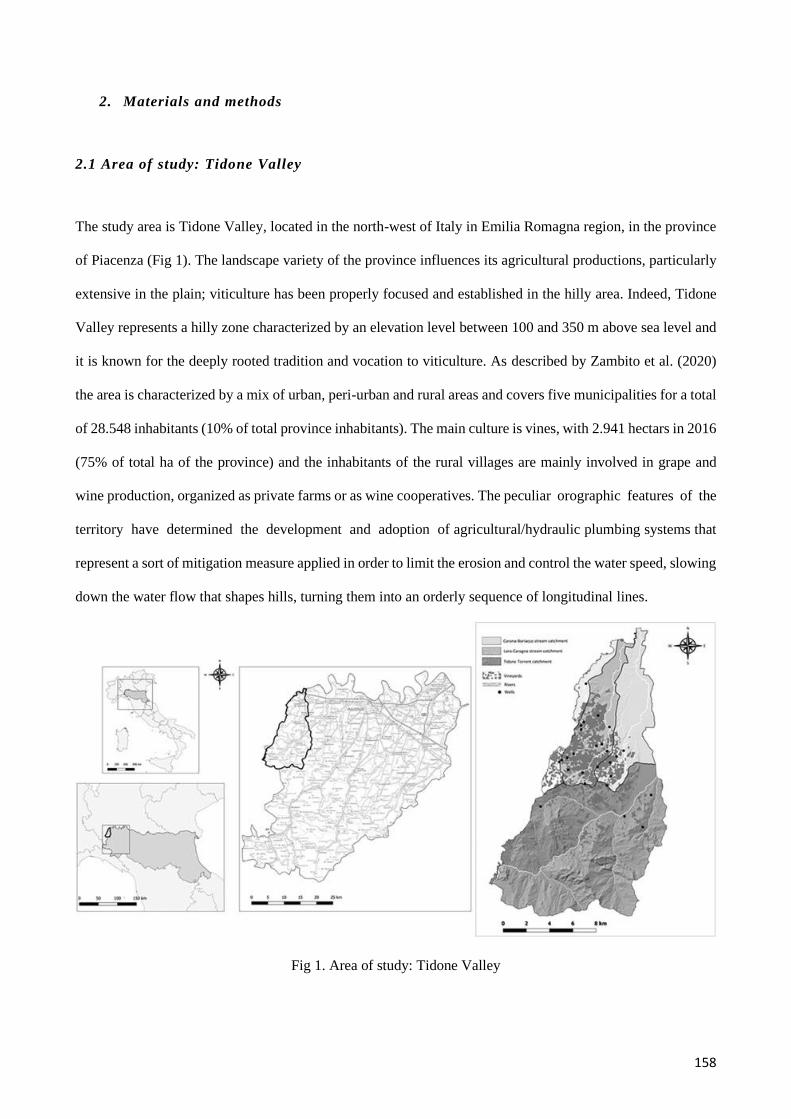
158
2. Materials and methods
2.1 Area of study: Tidone Valley
The study area is Tidone Valley, located in the north-west of Italy in Emilia Romagna region, in the province
of Piacenza (Fig 1). The landscape variety of the province influences its agricultural productions, particularly
extensive in the plain; viticulture has been properly focused and established in the hilly area. Indeed, Tidone
Valley represents a hilly zone characterized by an elevation level between 100 and 350 m above sea level and
it is known for the deeply rooted tradition and vocation to viticulture. As described by Zambito et al. (2020)
the area is characterized by a mix of urban, peri-urban and rural areas and covers five municipalities for a total
of 28.548 inhabitants (10% of total province inhabitants). The main culture is vines, with 2.941 hectars in 2016
(75% of total ha of the province) and the inhabitants of the rural villages are mainly involved in grape and
wine production, organized as private farms or as wine cooperatives. The peculiar orographic features of the
territory have determined the development and adoption of agricultural/hydraulic plumbing systems that
represent a sort of mitigation measure applied in order to limit the erosion and control the water speed, slowing
down the water flow that shapes hills, turning them into an orderly sequence of longitudinal lines.
Fig 1. Area of study: Tidone Valley

159
In total 455 farms were present in 2017 in the study area (CCIAA, 2017 https://www.pc.camcom.it/, data
available on request). Two types of farms structures are present:
1. Vineyard with a cellar. In this case, grape transformation into wine and wine retail is independent.
This is the case for 25% of the total vineyards present on the investigated area;
2. Vineyard without a cellar. In this case, grape growers deliver their grapes to wine cooperatives. This
is the case for 75% of the total vineyard surface present on the investigated area. The situation is
characterized by many farms with small/medium vineyard area and few farms with a very large
vineyard area.
The groundwater in the area is rather susceptible to this production, as demonstrated by Zambito et al. (2020)
that shows the occurrence of pesticides used for grape cultivation in 80% of a total of twenty-six groundwater
wells monitored in the period November 2017 – September 2018. In addition, 30% of the twenty-six
groundwater wells have values for seven pesticides above the Environmental Quality Standard (EQS) for
groundwater. Suciu et al. (2020) highlighted that these occurrences and concentrations are related to both
diffuse and point source contamination, with the point source having an important contribution for the wells
located in low slope soil, where the water drainage and its lateral movement are low.
2.2 Community engagement and stakeholders participation at the scale of stu dy area
A complex socio-ecological issue such as water quality related to agriculture cannot be solved by just one actor
but rather from a multi-actor approach perspective (Els Belmans, 2018). As stated in the introduction,
sustainable agriculture is the results of complex "systemic interactions" between different subjects involved in
various ways , such as researchers, farmers, entrepreneurs, regional and national organizations etc. All of them
have different forms of knowledge (practical, scientific, policy based, etc.) and there is the need to create
conditions for interaction between them and combine their knowledge, perspectives, resources, and
experiences, to identify and discuss solutions and new ideas. Therefore, in the present study, all actors
considered to have an influence on, or that are influenced by, the water and the farming systems were engaged
in the study activities. Since it is recognized that at context level an "ideal approach do not exist ", in our study
the engagement design was conceptualized as an "active engagement". All stakeholders that adequately
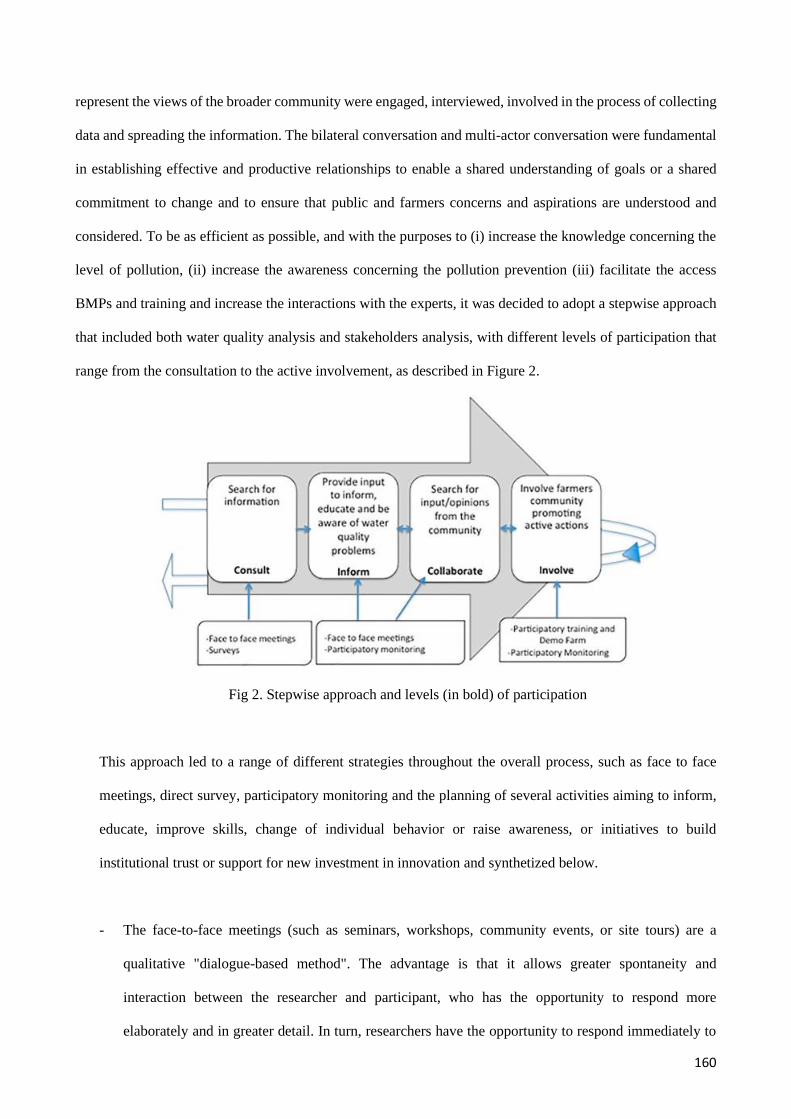
160
represent the views of the broader community were engaged, interviewed, involved in the process of collecting
data and spreading the information. The bilateral conversation and multi-actor conversation were fundamental
in establishing effective and productive relationships to enable a shared understanding of goals or a shared
commitment to change and to ensure that public and farmers concerns and aspirations are understood and
considered. To be as efficient as possible, and with the purposes to (i) increase the knowledge concerning the
level of pollution, (ii) increase the awareness concerning the pollution prevention (iii) facilitate the access
BMPs and training and increase the interactions with the experts, it was decided to adopt a stepwise approach
that included both water quality analysis and stakeholders analysis, with different levels of participation that
range from the consultation to the active involvement, as described in Figure 2.
Fig 2. Stepwise approach and levels (in bold) of participation
This approach led to a range of different strategies throughout the overall process, such as face to face
meetings, direct survey, participatory monitoring and the planning of several activities aiming to inform,
educate, improve skills, change of individual behavior or raise awareness, or initiatives to build
institutional trust or support for new investment in innovation and synthetized below.
- The face-to-face meetings (such as seminars, workshops, community events, or site tours) are a
qualitative "dialogue-based method". The advantage is that it allows greater spontaneity and
interaction between the researcher and participant, who has the opportunity to respond more
elaborately and in greater detail. In turn, researchers have the opportunity to respond immediately to

161
what participants say by tailoring subsequent questions to information the participant has provided
(Calliera, 2016). This method was adopted throughout the project to obtain information, provide
information and knowledge, give adequate and accessible information on the project and on the course
of the process, and also to exchange opinions.
- Surveys are questionnaire-based quantitative tools, where stakeholders are requested to individually
answer questions by choosing from a limited number of provided answers. Because there are only
multiple-choice questions, it represents an efficient way to obtain sufficient data in a short time.
However, as a passive consultation method, it doesn’t allow a deeper discussion (Calliera, 2016). The
surveys in the study were conducted by trained survey operators, to ensure the ‘consistency’ of the
responses. This methodology was adopted in the first phase of the project in order to obtain information
on the existence in the study area of groundwater wells, on best management practices and pesticide
mitigation measures already implemented to avoid diffuse and point sources water contamination and
on the willingness to implement new proposals, but also on the interest of farmers to participate in the
project.
- Participatory monitoring. In Italy monitoring is usually conducted by environmental agencies (in our
case ARPAE) and designed for the status evaluation and trend assessment of water bodies in respect
to WFD and are not planned to assess the effectiveness of the measures introduced to prevent or limit
the inputs of pollutants. The engagement of farmers in the design and the setup of water monitoring,
as well as in the results of the monitoring through the appropriate ICT tools and monitoring apps
available in the project website (https://water-protect.eu/en), are fundamental to increase the
credibility of the monitoring data and help to reduce the information gap between farmers and
monitoring agencies (Els Belmans, 2018).
- Participatory training approach and demonstration farm. In Italy a system of compulsory certified
trainings for professional users, distributors and advisors is established by the National Action Plan as
requested by the Directive on Sustainable pesticide Use 2009/128/EC (EC, 2009). The competent
Regional or Provincial authorities shall assess the knowledge acquired by course participants by means
of an examination. However, as reported in the Standing Committee on Agricultural Research (SCAR;
2015) report, this method of teaching does not necessarily imply a change of behaviour or adoption of

162
innovation, especially in agriculture. Indeed, traditionally, for farmers the changing of farming
management practices is full of risks (eg. economic) that have to be managed. To be effective, a context
specific training should understand how farmers make up their decisions and link knowledge to actions
to identify the so-called training need that is “the gap between what is and what should be in terms of
incumbents’ knowledge, skills, attitudes, and behaviour for a particular situation at one point in time"
(FarmPath project; 2014). These activities have also been associated with recreational events such as
dinners, concerts, scientific coffees; this is to encourage the aggregation and sharing of different
experience (students, professionals, citizens, etc.) and to increase the awareness of the community
about the efforts and commitment necessary to achieve a more equitable and sustainable future, where
at the centre there is the figure of a responsible farmer.
2.3 Stakeholders involved
The stakeholders involved as key actors were met individually during the first phase. This occurred thanks to
the presence in the working group of individuals operating in the area who have a good reputation and
credibility from previous work carried out in the territory, like the regional environmental Agency - ARPAE-
ER, the consumer Association PiaceCiboSano – APCS and the Catholic University - UCSC.
The key actors engaged were: the regional drinking water management company – IRETI, the provincial
plant health farmers consultancy - Consorzio Fitosanitario Provinciale, the three farmers’ associations present
on the territory - Confagricoltura, Coldiretti and CIA, the local manager of irrigation water in Val Tidone
catchment - Consorzio di Bonifica, one of the two Wine cooperatives present in the territory - Vicobarone,
the farmers’ organization Consorzio Vini Doc Colli Piacentini and the local Health Authority - AUSL. All
were contacted by phone or by email, interviewed and involved in the process of collecting data, of contacting
and engaging grape growers, spreading both the information and the work progress as well as the outputs.
Finally, with their contribution were involved 175 grapegrowers, coming from: Ziano Piacentino, 50.3%,
Alta Val Tidone, 16%, Castel San Giovanni,9.7%, Pianello Val Tidone, 6.9%, Borgonovo Val Tidone,
4.6%, and other areas and municipalities, 12.5%. However the selection of strategic places and time periods
was fundamental for farmers engagement. Indeed, in the first phase 97 farmers were met during the grape

163
delivery at the Wine cooperative Vicobarone, in the structures of the social cellar, while 40 farmers were met
in the offices of farmers unions Coldiretti, Confagricoltura and CIA, during the declaration of the quantity of
grapes produced. Finally, the remaining 38 were met directly in the estates or by phone. Also newsletters and
media campaigns, with articles in local newspapers were used as instruments for information purposes on the
initiatives.
In a second step, the regional and catchment leaders of water governance, Emilia-Romagna Region and
catchment Authority of Po River, ADPO, were involved. For their involvement, the use of preliminary data
from groundwater monitoring and surveys about farmer’s practices was fundamental.
2.4 Strategies adopted for farmer engagement and the analysis related to sustainable use of
pesticide
2.4.1 Surveys - conceptual framework
Sustainable water management shall ensure the achievement and maintenance of the good water status,
meeting legal and/or agreed quality standards in all affected river basins, as requested by WFD (EC, 2000).
Water pollution is a global challenge and agriculture represents in many cases a pressure on water quality,
mainly due to the use of pesticides. Water contamination by pesticides used in agriculture could be caused by
both diffuse and point sources contamination, the latter should to be considered mostly accidental. Good
Agriculture Practices and Mitigation Measures are key components in defining the conditions of use of
pesticides in crop protection strategies. They are specific to the type of risk they intend to mitigate, for example,
they may consist in a recommendation for special protection for users while handling the product, or to adjust
the conditions of use to minimize transfers to groundwater.
Based on the conceptual framework, in the project several hypotheses are put forward to be tested. The list of
the hypotheses is as follows:
• viticulture could be a source of water quality pressure the study area;
• farmers are not aware of the current and local legislation on water;
• farmers are not aware of local monitoring data for pesticides and nitrates in surface and groundwater;
164
• farmers are not aware of good practices and mitigation measures efficacy in limiting or preventing water
contamination;
• compulsory training courses on sustainable pesticide use needs to be improved.
In detail, water contamination by pesticides could be caused by both diffuse and point sources
contamination, the latter should to be considered mostly accidental. In order to understand the contribution
that the farming system of our study area can have on water quality, two survey campaigns were carried out.
The first was undertaken between August - November 2017, and the second - in the period of March - May
2018. The dates on which the surveys were carried out are directly connected to the starting time of
WaterProtect project and to the availability of the farmers, who were more available in that period as the work
in the vineyards is less pressing. Questions related to the type of grape cultivation (following the integrated
pest management), number of PPP applications and type of PPPs (insecticides, fungicides and herbicides) and
the management of point sources contamination were included in the questionnaire submitted in the first survey
while the second survey focused mainly on mitigation measures and good agricultural practices for limiting or
preventing drift and runoff for hilly vineyards (with a slope> 2%) .
2.4.2 Survey 1
Data collection took place through face-to-face interviews conducted by trained survey operators and involving
175 farmers, 38.5% of the total farms acting in the study area. The respondents were informed about the survey
goals before the interview and farmers were interviewed on the basis of their willingness to participate in the
project. To reach a higher number of respondents, a mixed tools and approach were adopted (such as direct
interviews in farms, in the Cellars, indirect interviews by phone call, one line questionnaire...). Indeed, 97
farmers were interviewed during the grape delivery to the Wine cooperative Vicobarone, in the structures of
the social cellar, while 40 farmers were interviewed in the offices of farmers unions Coldiretti, Confagricoltura
and CIA, during the declaration of the quantity of grapes produced. Finally, the remaining 38 were interviewed
directly in the estates, by phone and for farmers whose familiarity with IT tools was known, an on-line

165
questionnaire was submitted. The questionnaire was composed by 24 multiple-choice questions and was
divided in the following four different parts:
- Presence of wells, depth, use of well water;
- Fertilization and phytosanitary treatments: use and frequency;
- Sustainable pesticide use and prevention - respect of good practices and mitigation measures;
- Knowledge and awareness of the problem (possible pressure of viticulture on ground water quality).
The frequencies of the observations for homogeneous groups was analysed using Microsoft Excel. Observation
of BMPs, correct behaviors in the pesticide management at farm level and adoption of innovative technologies
as bioremediation systems were selected as measures with high level of efficacy to limit or prevent point source
contamination. Some measures, such as sprayer technical inspection, were not taken into account in the survey,
as mandatory under Directive 128/2009/EU and subject to official inspections and sanctions. Indeed, regular
technical inspection of pesticide application equipment is compulsory by Article 12 of Legislative Decree
150/2012, and shall be performed by dedicated Test Centres. In addition to that, professional users shall
conduct adjustments and calibrations of equipment used, in order to ensure pesticide mixtures spraying in
correct amounts and equipment’s proper working conditions, thus guaranteeing high level of safety and
protection for both human health and environment. For this reasons questions on these topics were not included
in the questionnaire.
2.4.3 Survey 2
Out of the 175 farmers involved in the first survey, fifty farmers were selected and involved in the second
survey, based on the interest showed for the present research and the size of their vineyards, possibly adjacent
to the monitoring wells. In particular, 30 farmers have vineyards with less than 10 ha surface area (62% of
total farmers), 18 in between 11 and 40 ha (36% of total farmers) and only 1 farmer has a vineyard with a
surface area higher than 40 ha. The total acreage of land whose owners responded to the questionnaire was
599 ha. The frequencies of the observations for homogeneous groups was analysed using Microsoft Excel.
MMs selection was carried out using as reference the MagPie toolbox (MAGPIE SETAC; 2017) and the latest
available version of the Italian Ministry of Health Guidance Document on the topic (Azimonti, 2017) and

166
following four main criteria: (i) applicability at our landscape conditions, (ii) availability for
implementation, (iii) sufficient knowledge/level of confidence and strength of scientific evidence, and (iv)
possibility to demonstrate or measure the efficacy of the GAPs and MMs to support their implementation.
The MMs and BMPs selected and suggested in the survey to limit or prevent diffuse contamination in vineyard
with slope >2% are listed in the Table 1. The runoff MMs selected and monitored in the survey have a high
level of efficacy as they are located near the runoff source or where runoff/erosion starts (as for Vegetated
Filter Strip), and/or may provide additional benefits for soil conservation and erosion prevention and for
reduction of nitrate leaching. For drift two type of drift reduction strategies were identified: no spray zones
and use of spray drift reduction technology. As stated in literature, the selected and monitored mitigation
measure allow high percentage of drift reduction (MAGPIE SETAC; 2017).

167
Table 1. MMs and GAPs selected and suggested to farmers reduce water contamination due to run off and
drift at catchment level.
Therefore, the survey's aim was to select the measures most fitting to our vineyard conditions and to obtain
information for:
• Farmers knowledge about factors influencing run off and drift and skills or ability to identify specific
risk situations. The knowledge of the factors involved in the contamination processes allow to adopt
behaviours or structural changes aimed at limiting and controlling the occurrence.
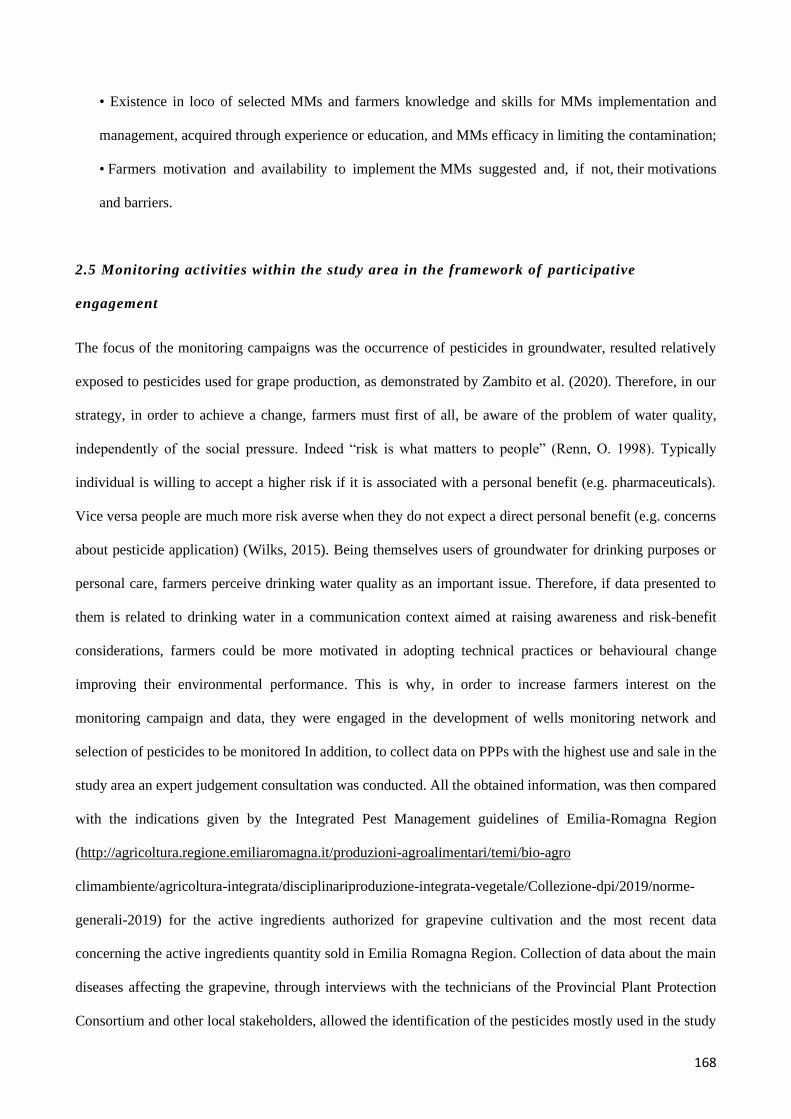
168
• Existence in loco of selected MMs and farmers knowledge and skills for MMs implementation and
management, acquired through experience or education, and MMs efficacy in limiting the contamination;
• Farmers motivation and availability to implement the MMs suggested and, if not, their motivations
and barriers.
2.5 Monitoring activities within the study area in the framework of participative
engagement
The focus of the monitoring campaigns was the occurrence of pesticides in groundwater, resulted relatively
exposed to pesticides used for grape production, as demonstrated by Zambito et al. (2020). Therefore, in our
strategy, in order to achieve a change, farmers must first of all, be aware of the problem of water quality,
independently of the social pressure. Indeed “risk is what matters to people” (Renn, O. 1998). Typically
individual is willing to accept a higher risk if it is associated with a personal benefit (e.g. pharmaceuticals).
Vice versa people are much more risk averse when they do not expect a direct personal benefit (e.g. concerns
about pesticide application) (Wilks, 2015). Being themselves users of groundwater for drinking purposes or
personal care, farmers perceive drinking water quality as an important issue. Therefore, if data presented to
them is related to drinking water in a communication context aimed at raising awareness and risk-benefit
considerations, farmers could be more motivated in adopting technical practices or behavioural change
improving their environmental performance. This is why, in order to increase farmers interest on the
monitoring campaign and data, they were engaged in the development of wells monitoring network and
selection of pesticides to be monitored In addition, to collect data on PPPs with the highest use and sale in the
study area an expert judgement consultation was conducted. All the obtained information, was then compared
with the indications given by the Integrated Pest Management guidelines of Emilia-Romagna Region
(http://agricoltura.regione.emiliaromagna.it/produzioni-agroalimentari/temi/bio-agro
climambiente/agricoltura-integrata/disciplinariproduzione-integrata-vegetale/Collezione-dpi/2019/norme-
generali-2019) for the active ingredients authorized for grapevine cultivation and the most recent data
concerning the active ingredients quantity sold in Emilia Romagna Region. Collection of data about the main
diseases affecting the grapevine, through interviews with the technicians of the Provincial Plant Protection
Consortium and other local stakeholders, allowed the identification of the pesticides mostly used in the study

169
area. For more details on pesticides selection and monitoring outputs refer to Zambito et al (2020). However,
the list of pesticides monitored, the application frequency and amounts, the occurrences and amounts in
groundwater, as above or below the Environmental Quality Standard for groundwater (EQSgw), and the
information on their hazardousness for both human health and environment are summarised in Tables 2 and 3.
The ISTAT data, elaborated by AAAF (Gruppo di lavoro Fitofarmaci) group, concerning the active ingredients
quantity sold in Emilia Romagna Region in 2012 (no other recent data was available) confirm the high use of
our monitored PPPs in Emilia-Romagna Region, with values ranging between 16 kg (Cyflufenamid) and
117069 Kg (Chlorpyrifos)
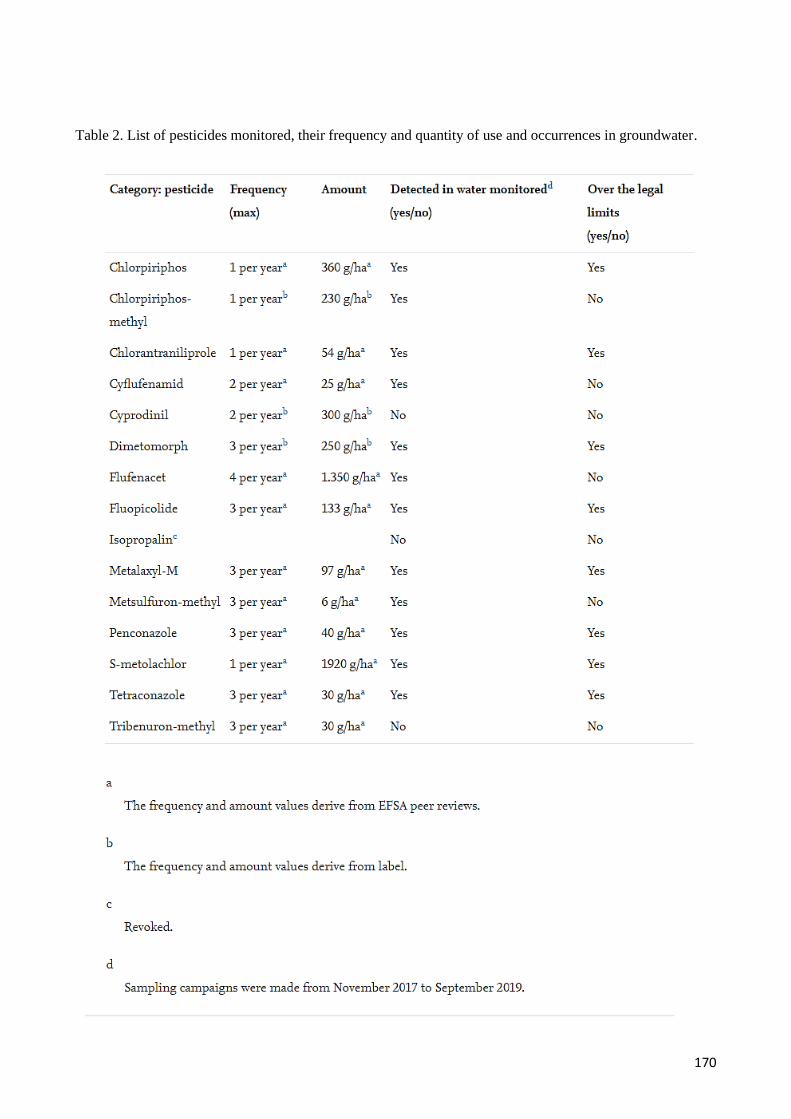
170
Table 2. List of pesticides monitored, their frequency and quantity of use and occurrences in groundwater.
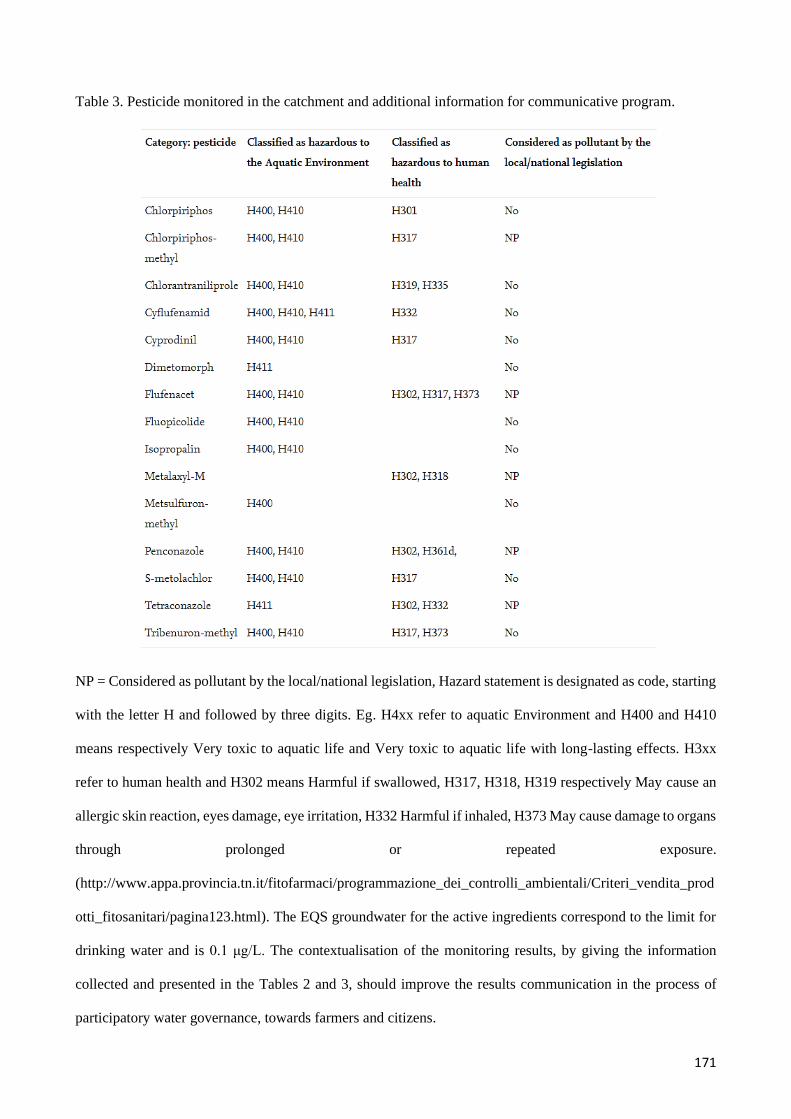
171
Table 3. Pesticide monitored in the catchment and additional information for communicative program.
NP = Considered as pollutant by the local/national legislation, Hazard statement is designated as code, starting
with the letter H and followed by three digits. Eg. H4xx refer to aquatic Environment and H400 and H410
means respectively Very toxic to aquatic life and Very toxic to aquatic life with long-lasting effects. H3xx
refer to human health and H302 means Harmful if swallowed, H317, H318, H319 respectively May cause an
allergic skin reaction, eyes damage, eye irritation, H332 Harmful if inhaled, H373 May cause damage to organs
through prolonged or repeated exposure.
(http://www.appa.provincia.tn.it/fitofarmaci/programmazione_dei_controlli_ambientali/Criteri_vendita_prod
otti_fitosanitari/pagina123.html). The EQS groundwater for the active ingredients correspond to the limit for
drinking water and is 0.1 μg/L. The contextualisation of the monitoring results, by giving the information
collected and presented in the Tables 2 and 3, should improve the results communication in the process of
participatory water governance, towards farmers and citizens.
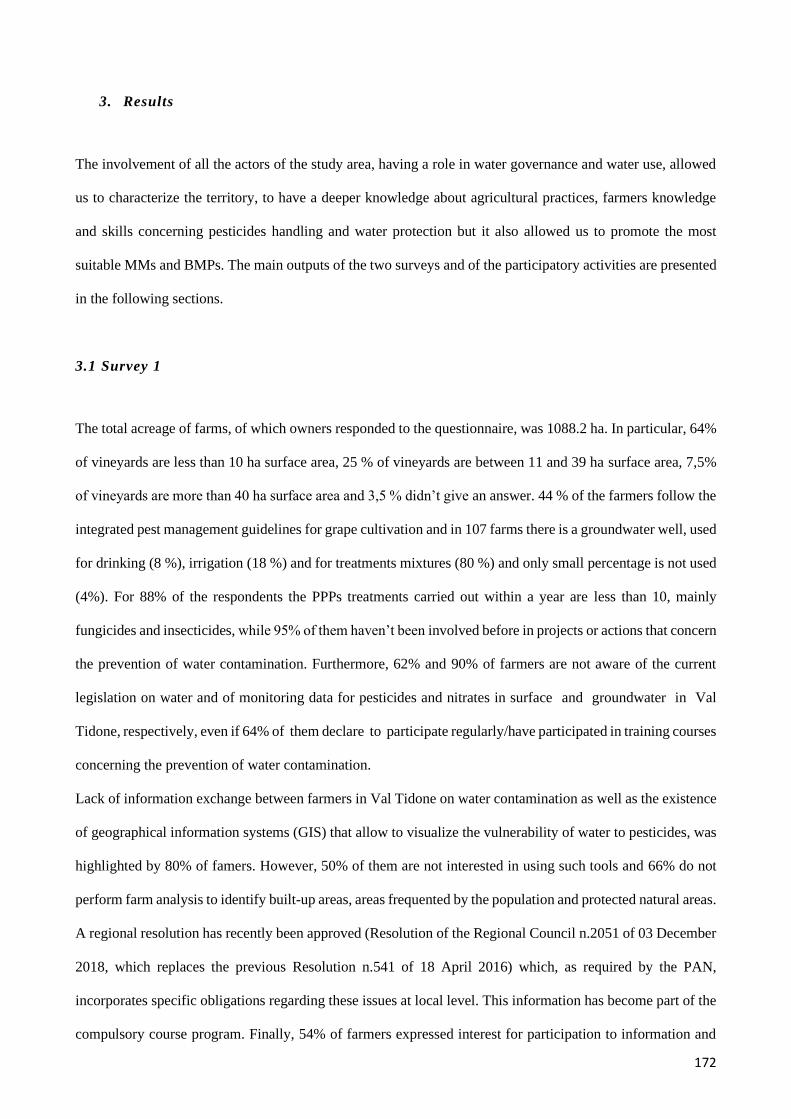
172
3. Results
The involvement of all the actors of the study area, having a role in water governance and water use, allowed
us to characterize the territory, to have a deeper knowledge about agricultural practices, farmers knowledge
and skills concerning pesticides handling and water protection but it also allowed us to promote the most
suitable MMs and BMPs. The main outputs of the two surveys and of the participatory activities are presented
in the following sections.
3.1 Survey 1
The total acreage of farms, of which owners responded to the questionnaire, was 1088.2 ha. In particular, 64%
of vineyards are less than 10 ha surface area, 25 % of vineyards are between 11 and 39 ha surface area, 7,5%
of vineyards are more than 40 ha surface area and 3,5 % didn’t give an answer. 44 % of the farmers follow the
integrated pest management guidelines for grape cultivation and in 107 farms there is a groundwater well, used
for drinking (8 %), irrigation (18 %) and for treatments mixtures (80 %) and only small percentage is not used
(4%). For 88% of the respondents the PPPs treatments carried out within a year are less than 10, mainly
fungicides and insecticides, while 95% of them haven’t been involved before in projects or actions that concern
the prevention of water contamination. Furthermore, 62% and 90% of farmers are not aware of the current
legislation on water and of monitoring data for pesticides and nitrates in surface and groundwater in Val
Tidone, respectively, even if 64% of them declare to participate regularly/have participated in training courses
concerning the prevention of water contamination.
Lack of information exchange between farmers in Val Tidone on water contamination as well as the existence
of geographical information systems (GIS) that allow to visualize the vulnerability of water to pesticides, was
highlighted by 80% of famers. However, 50% of them are not interested in using such tools and 66% do not
perform farm analysis to identify built-up areas, areas frequented by the population and protected natural areas.
A regional resolution has recently been approved (Resolution of the Regional Council n.2051 of 03 December
2018, which replaces the previous Resolution n.541 of 18 April 2016) which, as required by the PAN,
incorporates specific obligations regarding these issues at local level. This information has become part of the
compulsory course program. Finally, 54% of farmers expressed interest for participation to information and

173
training courses and 40% allow the use of their well for monitoring PPPs and nitrates occurrences in
groundwater.
Regarding the answers to questions related to point source contamination, the results pointed out that:
- Sprayers washing in dedicated areas equipped with waste water recovery or disposal systems are
present in 39% of farms;
- Dedicated areas for mixing and filling sprayers are present in 44% of the farms. Of these, 19% are
used for both sprayer washing and waste management at the end of the treatment while 28% are used
just for external sprayer washing;
- Storage of pesticides in appropriate places and proper disposal of containers are applied by 90% of
respondents. Correct handling and appropriate storage of plant protection products and for treatment
of their packaging and remnants is compulsory. By 1 January 2015 all professional users have to
comply with provisions of Annex VI of the Italian National Action Plan; these obligations are easily
controllable and linked to sanctions for non-compliance;
- 40% of farmers are interested in the adoption of bio purification system to treat the wastewater
collected after sprayer washing. It is significant that almost half of farmers are willing to do more to
protect the environment going beyond existing rules.
3.2 Survey 2
he results of the second survey, in which questions about 14 MM and BMPs able to reduce diffuse sources
contamination of groundwater were made, highlighted that:
- 88% of respondents are familiar with factors that affect runoff, eg. slope and soil type and 58%
recognize the need for a water body/well to be safeguarded from a runoff. In Italy professional farmers
undertake compulsory trainings in these issues by certified training companies; before 2016, the
legislation reserved the purchase of pesticide classified and labelled as very toxic, toxic and harmful
exclusively to people holding the authorisation to purchase and use them. From that date on, through
the compulsory courses (every 5 years) foreseen by National Action Plan and in line with the contents
of Directive 2009/128/EC, it was possible to start raising awareness about environmental issues
of all professional pesticide users.

174
- The Vegetated filter strip at edge-of-field is applied in 52% of farms. However, in some cases it is
used for passage of vehicles (inaccurate knowledge) while in other cases it was already present as
hydraulic arrangements;
- Vegetated ditches are present in 78% of farms and are considered effective in containing runoff. In
general respondents are not concerned about runoff that is perceived of moderate intensity.
Respondents believe that measures taken (hydraulic arrangement, drainage channels, good field
practice such as Inter-row processing and weeding on the row) are sufficient to contain the
phenomenon;
- Barriers are present in 24% of farms and are considered effective in containing drift;
- A buffer strip of size (width) not less than 5 meters and not more than 15 meters is applied by 97% of
respondents. Non spray buffer zone is compulsory in Italy if specifically indicated in the label;
- Air injection drift reducing nozzles are used by 52% of the respondents. In general, technical devices
for drift reduction and special equipment to reduce spray drift are considered effective in reducing
drift exposure although adoption is not always easy due to the widespread use of pneumatic sprayers
in the area;
- Nutrient soils analysis for pH, macro elements, organic matters and C/N are performed by almost 50%
of respondents and are used for fertilization planning;
- Weed control is undertaken by 44% of farmers. Of these, 73% apply a good practice of inter-row
processing and weeding on the row, while the rest use permanent grassing in the inter row and weeding
on the row. Grassing between rows (at least alternate) is increasingly popular and is adopted for
quicker and more effective phytoiatric strategy and thus to reduce the number and use of pesticides.
3.3 Participatory monitoring, participatory training approach and demonstration farm
Based on the results from Zambito Marsala et al. (2020) and Suciu et al. (2020), that evaluated the occurrence
of the 15 PPPs in groundwater and the possible contamination sources, an impact of end-users behavior on
PPPs concentration in groundwater was highlighted. However, even if after three sampling campaigns,
between November 2017 and September 2018, 153 occurrences of PPPs were observed in the 78 collected

175
samples (38 values were above EQSgw), in the last two sampling campaigns, between July and September
2019, just 69 occurrences of PPPs were monitored in the 53 collected samples, with 9 values above EQSgw.
Therefore, in 2019 a decrease by 44 % of PPPs occurrences and by 68% of values above EQSgw were
observed. In the framework of participatory monitoring strategy, maps, results and graphs are produced and
are all available on the project platform at the link: (https://water-protect.eu/en). Indeed, a GIS Platform was
developed within the project, in which it is possible to consult the results of the monitoring studies. These data,
together with the survey outputs, were presented during participatory training events, organized with the scope
to facilitate the spread of sustainable practices, to prevent point sources contamination and, at the same time,
to promote a coherent and harmonized approach that can facilitate the birth of useful collaborations and
tangible synergies.
A high percentage of farmers use well water for pesticide treatments and still a fairly high percentage of farmers
of the area under study don’t have a dedicated area for mixing and filling the sprayers. The participatory
training events were organized in a "demonstration farm" where an impermeable and mobile platform for
filling and washing sprayers was implemented. Here, new technical solutions for correct management of
wastewater (spillage or water resulting from the external machine cleaning) were presented and
communication material prepared in the form of card games, posters and info-graphics of BMPGAPs, designed
to getting farmers familiar to the problems and relative solutions, including how to use the well water without
contamination risk, were prepared and distributed. The presentation of monitoring data motivated farmers to
participate to these events and stimulated them to implement and to adopt the innovative and sustainable
measures proposed and change behaviours. Commonly, the platforms used for washing sprayers and filling
are made in concrete, often waterproofed with resin. This solution could have maintenance problems especially
if located in geographical areas where temperatures in winter fall below the freezing level, as it is our case.
Therefore, it has been decided the use of a mobile platform, available on the market, cheaper and very easy to
use, durable (double layer UV resistant PVC) and that can be easily protected during the winter. The collected
pesticide polluted water should be stored in a storage tank, transferred with a pump or gravitationally. Storage
must ensure double retention, so that any leaks can always be recovered. Finally, the stored polluted water
should be delivered directly to a specialized company, even if the costs are quite high for large volumes.
Indeed, several alternatives were taken into account and presented, as for example the re-use of the stored
176
water after a chemical /physical treatment for the external sprayer washing, or the installation of
bioremediation systems. These solutions were not implemented in the “demonstration farm” because both are
not legally approved (at the time of the project). In fact, legal contradictions restrict the application at national
level of the physical/chemical/bio-purification systems, even if it could represent a BMP and a technically
viable alternative MM of point source contamination, enabling the treatment of PPPs contaminated liquids
directly in the farm.
In this context, the leader for water governance, Emilia - Romagna Region, was directly involved through
sharing of research outputs (monitoring data, survey outputs, hydrological data), which highlighted the
possible impact of end-user behaviour on groundwater contamination in the study area. This increased the
awareness and sensibility of the Region to find together with the farmers and partners of the project the most
suitable solution.
4. Discussion and conclusion
The effectiveness of engagement initiatives may depend more on how the initiative is implemented, rather than
the choice of method used (Dean et al., 2016). It is generally assumed that face-to-face methods increase
awareness and knowledge in attendees, facilitate the gathering of community opinion and preferences and also
provide input for researchers. In our study, different consultation mechanism and strategies throughout the
overall project, such as face to face meeting, direct survey, participatory monitoring and the planning of several
training activities, were adopted. The low level of trust of the farmers, was the highest barrier at the beginning
of the project. The involvement of key people, like representative of farmer's consultancy, of farmer's
organizations or of farmer's associations, was fundamental to gain farmers trust and further involvement.
Therefore, our perception, supported also by the results of the monitoring campaigns, which show a decrease
trend in the contamination of the aquifer examined, is that the level of awareness of farmers, concerning water
pollution in the study area, increased but we cannot say that most of them are aware of the problem. An
important number of farmers, the ones that follow most the activity of the project and participate to all the face
to face meetings, are now showing a high interest and are willing to take actions in order to avoid pollution.
177
However, some sustainable practices or innovations which could potentially match the incentives of rural
development policy are discredited for several reasons because:
• are not always compatible with farmers work organisation and landscape situations;
• their impact is not ensured, farmers need more information;
• are not economically feasible;
• the legislative contradictions as for example for physical/chemical/bio-purification systems, with the result
to have CAP measures inapplicable for farmers.
Furthermore, even if training is compulsory and operators need a certificate to use pesticides, and despite the
quality level of the regional training system, the training is entirely theoretical and does not include
demonstrative activities and sharing of experiences. A very high percentage of interviewed farmers are
unaware of the existence of monitoring data on pesticides and nitrates in surface and groundwater even though
64% declare to participate regularly or have participated in training courses concerning the prevention of water
contamination. Therefore, to link environment and farmers and increase their awareness, the organisation of
demo farming participatory events, as proposed in this work, results as mandatory. The knowledge of the
factors involved in the contamination processes and of the context monitoring data allow to adopt behaviours
or structural changes aimed at limiting and controlling the contamination. There is a growing interest by
farmers and operators in more “modern” communication approaches—experimental, demonstrative, and
participatory (Sacchettini and Calliera, 2016). An improvement of the training system is recommended with
the use a combination of lessons and group discussions, followed by practical demonstrations, which allow
“learning” through practice and promote the understanding of the issues addressed.
To link back the experience we have gathered during this exercise to the effectiveness of the policy
implementation in protecting water resources, we can definitely conclude that proactive provision of
information on the challenges in water quality and their potential cause are essential to ensure awareness at
farm level, and understanding the positive contribution farmers can make. Currently, information is often
unclear, scattered or not easily accessible. In many cases farmers rely on informal channels (farmer
associations, media, extension consultants, etc.) to obtain such information.
178
The positive contribution to sustainable water management of agriculture, including through implementing
BMPs and MMs should be evaluated, recognized and communicated. Perception on costs vs. benefits of
implementation of various BMPs or MMs have an important impact on the willingness of farmers to implement
them. Hence, direct information, know-how and as well as support for actual investments needed for
implementation of will play a key role in the future uptake of such measures by farmers.
Link environment and farmers and Demo farming participatory events. It is also important to improve the
“farmer image and proudness” and restore public confidence in farmer's activities, the sensibility of farmers to
social pressure, and their investments and commitments to pro-environmental actions in line with the
Sustainable Development Goals (SDGs) n.6 on water. Participatory events fostered the community's
understanding of the added value of the commitment of farmers that, with the application of mitigation
measures and respect for good practices, contribute to collective well-being by acting on all ecosystem services
and common goods.
A set of indicators that highlight the contribution agriculture has into water management (able to capture
positive and/or negative trends) will help involvement of farmers and will stimulate ownership of the process.
At the end of the overall process, we can affirm that the multi-actor approach adopted was successful in
increasing knowledge and improving attitudes to more sustainable water practices. The different consultation
mechanisms and involvement strategies applied throughout the overall process, could be expanded to other
areas with similar environmental and agricultural conditions. However, there is no evidence whether these
increases in knowledge and positive attitudes can be maintained over time. Therefore, further targeted
communication campaigns and actions should be taken into account in order to reach a more sustainable
pesticide use, to maintain a good water status and to solve contradictions, both communicative and legislative,
which make the recommended rules or MMs inapplicable.
179
Acknowledgements
This research is part of the WaterProtect project and has received funding from the European Union's Horizon
2020 Research and Innovation Program under grant agreement No. 727450.
References
Anne Alix and Ettore Capri, Modern Agriculture in Europe and the Role of Pesticides, In Advances in chemical
pollution, environmental management and protection. Vol 2 Sustainable Use of Chemicals in Agriculture
Edited by Ettore Capri and Anne Alix, Academic Press (2018) ISBN: 978-0-12-812866-4 ISSN: 2468-
9289ISBN: 978-0-12-812866-4 ISSN: 2468-9289
Annual Report of the Government Chief Scientific Adviser 2014. Innovation: Managing Risk, Not Avoiding
It The Government Office for Science, London. URN: GS/14/1190
Azimonti Giovanna et al., Documento di orientamento - Prodotti fitosanitari Misure di mitigazione del rischio
per la riduzione della contaminazione dei corpi idrici superficiali da deriva e ruscellamento e allegati- Comitato
tecnico per la nutrizione e la sanit. animale Sezione consultiva per i fitosanitari 15 marzo 2017 [Doc.MinSal-
luglio2009_rev1-15 marzo 2017
BROWSE project, FP7 Theme: environment (including climate change), bystanders, residents, operators and
workers exposure models for plant protection products, grant agreement no: 265307, Project start date: 1st
January 2011, Project end date: 31st December 2013, www.browseproject.eu.
Calliera M., Lastorina A., The Role of Research, Communication, and Education for a Sustainable Use of
Pesticides. In Advances in chemical pollution, environmental management and protection. Vol 2 Sustainable
Use of Chemicals in Agriculture Edited by Ettore Capri and Anne Alix, Academic Press (2018) ISBN: 978-0-
12-812866-4 ISSN: 2468-9289
COM 338/2003 A European Environment and Health Strategy, communication from the Commission to the
Council, the European Parliament and the European Economic and Social Committee. COM (2003) 338 final,
Brussels.

180
COM 587/2017 REPORT FROM THE COMMISSION TO THE EUROPEAN PARLIAMENT AND THE
COUNCIL On Member State National Action Plans and on progress in the implementation of Directive
2009/128/EC on the sustainable use of pesticides. CELEX 52017DC0587.
Dean AJ, Fielding KS, Ross H and Newton F. (2016) Community Engagement in the Water Sector: An
outcome-focused review of different engagement approaches. Melbourne, Australia: Cooperative Research
Centre for Water Sensitive Cities.
EC. Regulation (EC) No 1107/2009 of the European Parliament and of the council of 21 October 2009
concerning the placing of plant protection products on the market and repealing council directives 79/117/EEC
and 91/414/EEC. OJ L 309, 24.11.200920091.
EC. Directive 2009/128/EC of the European Parliament and of the council of 21 October 2009, establishing a
framework for community action to achieve the sustainable use of pesticides. OJ L 309, 24.11.2009200971.
Els Belmans. The Multiactor Approach Enabling Engagement of Actors in Sustainable Use of Chemicals in
Agriculture. In Advances in chemical pollution, environmental management and protection. Vol 2
Sustainable Use of Chemicals in Agriculture Edited by Ettore Capri and Anne Alix, Academic Press (2018)
ISBN: 978-0-12-812866-4 ISSN: 2468-9289.
EU SCAR (2015), Agricultural knowledge and innovation systems (AKIS) towards the future—a foresight
paper, BRUSSELS. ISBN 978-92-79-54548-1. https://doi.org/ 10.2777/324117. ISSN 1831-9424 KI-NA-27-
692-EN-N.
FarmPath, (Farming transitions: pathways towards regional sustainability of agriculture in Europe)
KBBE.2010.1.4-03—assessment of transition pathways to sustainable agriculture and social and
technological innovation needs—call: FP7-KBBE-2010-4 ID 265394.
Gabriele Sacchettini, Maura Calliera, Alexandru Marchis, Richard Glass, Clare Butler Ellis, Kyriaki Machera,
Rianda Gerritsen-Ebben, Pieter Spanoghe, Ettore Capri (2015) New risk indicator approach for
Operators,Workers, Bystanders and Residents for a sustainable use of plant protection products,
Environmental Science and Pollution Research, DOI 10.1007/s11356-015-4889-5, published on line 05 July
2015
181
Gail Feenstra, http://asi.ucdavis.edu/programs/sarep/about/what-is-sustainable-agriculture
HEROIC project, FP7 Theme: Research, technological development and demonstration, Health and
Environmental Risks: Organisation, Integration and Cross-fertilisation of Scientific Knowledge, grant
agreement no: 282896. Project start date: 1st October 2011, Project end date: 30th September 2014,
www.heroic-fp7.eu
Maura Calliera, Alex Marchis, Gabriele Sacchettini & Ettore Capri, (2016) Stakeholder consultations and
opportunities for integrating socio- behavioural factors into the pesticide risk analysis process,
Environmental Science and Pollution Research, 23 (3), 2937-2947 10.1007/s11356-015-5553-9 Mitigating
the Risks of Plant Protection Products in the Environment: MAgPIE SETAC May 2017 ISBN: 978-1-880611-
99-9
Remoundou, K., Brennan, M., Hart, A. and Frewer, L. (2014). Pesticide Risk Perceptions, Knowledge, and
Attitudes of Operators, Workers, and Residents: A Review of the Literature. Human and Ecological Risk
Assessment: An International Journal, 20(4), pp.1113--1138.
Renn, O., Three decades of risk research: accomplishments and new challenges. (1998) Journal of Risk
Research. Vol. 1, No. 1, pp. 49–71
Sacchettini, G., Calliera, M., Link practical-oriented research and education: New training tools for a
sustainable use of plant protection products, Sci Total Environ (2016),
http://dx.doi.org/10.1016/j.scitotenv.2016.10.166
Suciu, N., A., Farolfi, C., Zambito Marsala, R., Russo, E., De Crema, M., Peroncini, E., Tomei, F., Antolini,
G., Marcaccio, M., Marletto, V., Colla, R., Gallo, A., Capri, E. (2020). Evaluation of groundwater
contamination sources by plant protection products in hilly vineyards of Northern Italy. Science of The Total
Environment; DOI: 10.1016/j.scitotenv.2020.141495
Sustainable Development Goal 6 - Ensure availability and sustainable management of water and sanitation for
all. https://sustainabledevelopment.un.org/sdg6
182
Tingting Liu, ID , Randall J. F. Bruins, and Matthew T. Heberling, Factors Influencing Farmers’ Adoption of
Best Management Practices: A Review and Synthesis Sustainability (2018), 10, 432;
doi:10.3390/su10020432
Water Framework Directive (WFD) 2000/60/EC of the European Parliament and the Council of 23 October
2000 establishing a framework for Community action in the field of water policy.
Wilks MF, Roth N, Aicher L, Faust M, Papadaki P, Marchis A, Calliera M, Ginebreda A, Kühne R,
Schüürmann G. White paper on the promotion of an integrated risk assessment concept in European regulatory
frameworks for chemicals, (2015) Science of the Total Environment 521–522 pages 211–218
Zambito Marsala, R., Capri, E., Russo, E., Bisagni, M., Colla, R., Lucini, L., Gallo, A., Suciu, N., (2020). First
evaluation of pesticides occurrence in groundwater of Tidone Valley, an area with intensive viticulture,
Science of The Total Environment. https://doi.org/10.1016/j.scitotenv.2020.139730
183
Chapter 5
General conclusions
Water is an essential resource for human health, agriculture, energy production, transport and nature, but
securing sustainable management of water and of aquatic and water-dependent ecosystems and ensuring that
enough high-quality water is available for all purposes, remains one of the key challenges of our time in
Europe.
Agricultural production has become increasingly intensive, with high inputs of fertilizers and pesticides
leading to the emission of large amounts of pollutant loads into the water environment.
The main object of this thesis was to evaluate the impact of viticulture on groundwater quality by PPPs and
nitrates in a hilly area, situated in the North-West of Italy, investigating the contamination sources in order to
develop the best management practices and mitigation measures to avoid groundwater and environmental
pollution. The quality of groundwater in this area was never investigated before.
Hence, water protection is the priority of this project.
The results of monitoring studies from 2017 to 2019, showed a contamination of groundwater by pesticides
and nitrate and thus an evaluation of PPPs and nitrates source contamination was carried out through isotopic
studies of N and O of NO3-, and through hydrologic analysis by use of the model CRITERIA 3D.
The evaluation of the contamination sources was significant in order to find the best solutions to prevent
groundwater contamination and consequently to protect the environment.
Furthermore, these monitoring results were presented to the farmers and all stakeholders of the study area in
order to involve them into the project and to raise their awareness.
As one of the main conclusion of the present work, it can be stated that the occurrence of PPPs in groundwater
in areas with intensive agricultural activities cannot be related just to chemical environmental fate properties
or pedoclimatic conditions, but also to end-user behavior. Based on the results obtained, in fact, the
contamination source evaluated resulted to be due to both diffuse and point-source contamination.
In this specific case, considering the particularity of the shallow aquifers where the wells are located, an
increase of atmospheric temperature and decrease of precipitations can determinate a concentration rise of
184
PPPs in groundwater. Furthermore, intensive rainfall events, that occurred frequently in recent summers, could
result in an interaction between these shallow aquifers, due to lateral water movement in the first layer of the
soil, posing a risk of contamination of the protected drinking water wells.
On the other hand, the influence of nitrogen-based fertilization on nitrates occurrence in groundwater was
evaluated. Moreover, in order to characterize the investigated aquifer and to evaluate the influence of nitrogen
fertilization of vineyards on nitrates occurrence, isotopic and hydrochemical analyses were carried out. The
results obtained showed a high vulnerability of the aquifer to external changes. Isotopic investigations showed
that most of the NO3- detected in the groundwater samples of the wells, derived from the use of inorganic
nitrogen fertilizers, in agreement with the land use and viticulture practices declared by the farmers during the
interviews. Moreover, the survey results indicated a tendency of farmers to follow their own experience for
fertilization and therefore, the introduction of a Farm Sustainability Tool for Nutrients, as proposed by
European Commission, would increase the knowledge concerning fertilization efficiency and induce a
harmonization of fertilization practices.
In this regard, the adoption of PPPs mitigation measures and innovation at farm level, represent a drivers to
reach the sustainable water policy objectives. With the aim to prevent the pesticide pressure of hilly vineyards
on groundwater contamination, a stepwise approach in Tidone Valley was applied by use of different
consultation mechanisms and involvement strategies throughout the overall process. Furthermore, a
waterproof platform for sprayer washing, equipped with wastewater recovery and disposal system
implemented in a farm was successful among farmers of the area and the several demonstration activities
organized showed its functionality and promoted a diffuse use in Tidone Valley. The proposed approach,
moreover, could be used to assess possible effects of climate change and even transferred to other similar
territorial realities.
Moreover, in this study, different consultation mechanism and strategies throughout the overall project, such
as face to face meeting, direct surveys, participatory monitoring and the planning of several training activities,
were adopted. The involvement of key people, like representative of farmer’s consultancy, farmer’s
organizations or farmer’s associations, was fundamental to gain farmers trust and their involvement in the
project. Therefore, our perception, supported also by the results of the monitoring campaigns, is that the level
of awareness of farmers, concerning water pollution in the study area, increased but we cannot say that most

185
of them are aware of the problem. The most important result of the study, however, was that at the end of the
overall process, the multi-actor approach and engagement strategy adopted were successful in improving
attitudes to more sustainable practices. This is supported also by the monitoring data that show in 2019 a
decrease by 44% of PPPs occurrences and a fall by 68% of values above EQSgw if compared with the period
2017–2018.
Hence, we can state that the multi-actor approach adopted was successful in increasing knowledge and
improving attitudes to more sustainable water practices. The different consultation mechanisms and
involvement strategies applied throughout the overall process, could be expanded to other areas with similar
environmental and agricultural conditions. Therefore, further targeted communication campaigns and actions
should be considered in order to reach a more sustainable pesticides use, to maintain a good water status and
to solve contradictions, both communicative and legislative, which make the recommended rules or MMs
inapplicable. Besides, a multi-actor approach and a participatory monitoring perspective with a strictly
cooperation, planning together for the right solutions, lead to the achievement of more sustainable objectives.
To conclude, actually, the sustainable water management has become a major issue in Europe. In 2000 the
European Union approved the Water Framework Directive (WFD, 60/2000), the purpose of which was to
provide a reference framework for water management in Europe for the coming decades. In summary, the
main objectives of the WFD concern the preservation, protection and improvement of water quality, as well
as a rational use of water resources by different economic sectors (urban centers, industry, agriculture and
energy). It is based on the principle of preventive action, the reduction of damages, at both the source and the
sink, and the ‘polluter pays principle (Viaggi et al., 2010). This objective should reflect a common objective
of everyone and we must sustain it in order to preserve the environment system and particularly the Earth.
186
References
D. Viaggi, M. Raggi, F. Bartolini, V. Gallerani. 2010. Designing contracts for irrigation water under
asymmetric information: Are simple pricing mechanisms enough? Agricultural Water Management, Volume
97, Issue 9, Pages 1326-1332. https://doi.org/10.1016/j.agwat.2010.03.014
Water Framework Directive (WFD) 2000/60/EC: Directive 2000/60/EC of the European Parliament and of the
Council of 23 October 2000 establishing a framework for Community action in the field of water policy.
187
Acknowledgements
First of all I want to thank professor Ettore Capri, for giving me the great opportunity of doing this PhD under
his supervision, for being willing to give advice at any time, for her knowledge, ideas, guidance and also for
giving me the opportunity to develop, to gain autonomy and to realize my ideas.
Now I would like to thank Nicoleta very much for guiding me during these three years, for being an excellent
supervisor not only from a professional point of view but also friendly, for all her valuable advice, for helping
and making me grow professionally and for all amazing adventures spent together as at Barcelona or Ghent
during the IUPAC Congress.
The second wave of thanks goes to the all team of the project: Elisabetta, Emanuela and Marcello from ARPAE
thank you for all the advices, for the laughs, for guiding me and for the time spent together; and then Miriam,
Silvia and Maura thank you very much for teaching and for every precious advice.
The third thanks go to my supervisor of the two months spent abroad within the research teams at the
Universidad de Barcelona– Dr. Raul Carrey Labarta.
Another precious thanks goes to the people who have endured me during this journey and who have become
special friends: Maria, Maria Chiara, Mattia and Michelangelo, thank you very much for every moment spent
together and for all the support you have given me, I will never forget it.
And last but not least, I wish to thank the most important people in my life that contribute to my personal well-
being, that support and inspire me, that represent my strength and my pillars: mum, dad, sister and my partner
Alessandro.