Embed Size (px)
Citation preview
IMPACT ASSESMENT OF CLIMATE CHANGE ON CROP
PRODUCTION SYSTEM IN PUNJAB, PAKISTAN
MUHAMMAD WAQAR YASIN
14-arid-500
INSTITUTE OF GEO-INFORMATION & EARTH OBSERVATION
PIR MEHR ALI SHAH
ARID AGRICULTURE UNIVERSITY RAWALPINDI
PAKISTAN
2018
ii
IMPACT ASSESMENT OF CLIMATE CHANGE ON CROP
PRODUCTION SYSTEM IN PUNJAB, PAKISTAN
by
MUHAMMAD WAQAR YASIN
(14-Arid-500)
A thesis submitted in partial fulfillment of
the requirement for degree of
Doctor of Philosophy
in
Remote Sensing & GIS
INSTITUTE OF GEO-INFORMATION & EARTH OBSERVATION
PIR MEHR ALI SHAH
ARID AGRICULTURE UNIVERSITY RAWALPINDI
PAKISTAN
2018
CERTIFICATION
iii
CERTIFICATION
I hereby undertake that this research is an original one and no part of this
thesis falls under plagiarism, If found otherwise at any stage, I will be responsible
for the consequences.
Name: Muhammad Waqar Yasin Signature: ______________
Registration Number: 14-ARID-500 Date: ______________
Certified that the contents and form of thesis entitled Impact Assessment
of Climate Change on Crop Production System” submitted by “Muhammad
Waqar Yasin” has been found satisfactory for requirements of the degree.
Supervisor: ____________________
(Prof. Dr. Mobushir Riaz Khan)
Member: _______________________
(Prof. Dr. Rai Niaz Ahmad)
Member: _______________________
(Prof. Dr. Muhammad Yasin)
Director: _________________________
Director Advanced Studies: ___________________________

iv
DEDICATION
I dedicate this thesis to my beloved wife “Humaira Waqar” who has
shared in all my joys and sorrows, whose love, care and devotion has
been the strength of my striving
v
vi
vii
viii
ix
CONTENTS
List of Abbreviations xii
List of Tables xi
List of Figures xiv
Acknowledgements xvii
Abstract xviii
Chapter 1 Introduction 1
1.1 CLIMATE CHANGE 1
1.1.1 Extreme Weather Events 3
1.1.2 Carbon Dioxide Increase 4
1.2 IMPACTS OF CLIMATE CHANGE 4
1.2.1 Reduced Nutrient Levels of Produce 5
1.2.2 Increased Competition of Pests 5
1.2.3 Irrigation and Rainfall 5
1.2.4 Global Food Security Challenges 6
1.3 PROBLEM STATEMENT 7
1.3.1 Floods and Droughts 7
1.3.2 Shift in Spatial Boundaries of Crop Potential Areas 7
1.3.3 Changes in Productivity 7
1.3.4 Reduced Water Availability 8
1.3.5 Changes in Cropping Pattern 8
1.3.6 Changes in Land Use Pattern 8
1.3.7 Coastal Agriculture 9
1.4 OBJECTIVES 9
1.4.1 Assessment of Climate Change 10
1.4.2 Impact Assessment of Climate Change on Agriculture 10
1.4.3 Unsupervised classification 11
1.4.4 Supervised Classification 11
1.5 FINDING RESILIENCE IN CROP AREAS VERSUS CLIMATE
CHANGE 12
x
Chapter 2 REVIEW OF LITERATURE 14
2.1 CLIMATE CHANGE 14
2.1.1 Greenhouse Gases 15
2.2 CAUSES OF CLIMATE CHANGE 16
2.2.1 Globalization 16
2.2.2 Natural Causes 16
2.2.3 Droughts 16
2.3 GENERAL IMPACTS OF CLIMATE CHANGE 17
2.3.1 Impact on Human Migration 17
2.3.2 Impact on Coral Reefs 18
2.3.3 Impact on Specie Extinction 18
2.4 IMPACT ASSESSMENT OF CLIMATE CHANGE ON
AGRICULTURE 18
2.5 ADAPTATIONS AND MITIGATIONS 21
2.6 ADAPTATIONS TO CLIMATE CHANGE W.R.T AGRICULTURE 22
2.7 MONITORING OF AGRICULTURE 24
2.7.1 Monitoring and Management of Agriculture with Remote Sensing 25
2.8 RESILIENCE OF CROPS AND CLIMATE 26
Chapter 3 MATERIALS AND METHODS 28
3.1 DATA USED 28
3.1.1 Moderate Resolution Imaging Spectroradiometer - Normalized
Difference Vegetation Index 28
3.1.2 Climate Data 29
3.1.3 The Administrative Map 30
3.1.4 Specific Crop Data 30
3.1.5 Crop Calendar Data 30
3.2 INTERPOLATION OF CLIMATIC DATA 30
3.3 CROP MAPPING AND MONITORING 32
3.3.1 ISODATA Algorithm 32
3.3.2 Selection of Optimal Classification Map of NDVI 34
3.3.3 Signature Output 34
3.3.4 Linking Vegetation Behavior with Crop Calendar 34
xi
3.3.5 Area of NDVI Classes per District 35
3.3.6 Mapping Specific Crops 35
3.4 INFLUENCE OF CLIMATIC CHANGES ON CROP
PERFORMANCE 36
3.4.1 Impact of Climatic Change on Crop Performance 36
Chapter 4 RESULTS AND DISCUSSION 49
4.1 CLIMATE CHANGE IN PUNJAB 49
4.2 IMAGE CLASSIFICATION 52
4.3 LINKING VEGETATION BEHAVIOR WITH CROP CALENDAR 60
4.4 MAPPING SPECIFIC CROPS 60
4.4.1 Wheat Area Map of Punjab 60
4.4.2 Maize Area Map of Punjab 62
4.4.3 Sugarcane Area Map of Punjab 64
4.4.4 Cotton Area Map of Punjab 65
4.4.5 Gram Area Map of Punjab 65
4.4.6 Validation-Remote Sensing Vs Reported Data Of Wheat Crop 66
4.4.7 Validation – Remote Sensing vs Reported Data- of Maize Crop 66
4.4.8 Validation – Remote Sensing vs Reported Data- of Cotton Crop 66
4.4.9 Validation – Remote Sensing vs Reported Data- of Sugarcane Crop 66
4.4.10 Validation – Remote Sensing vs Reported Data- of Gram Crop 67
4.4.11 Impact of the Rainfall on Wheat Vegetation 67
4.4.12 Impact of the Rainfall on Wheat Vegetation 67
4.4.13 Impact of Climate Change on Crop Performance 67
SUMMARY 82
LITRETURE CITED 85
xii
LIST OF ABBREVIATIONS
GIS
RS
Geographic Information System
Remote Sensing
MODIS Moderate Resolution Imaging Spectro-Radiometer
NDVI Normalized Difference Vegetation Index
NOAA National Oceanic and Atmospheric Administration
NASA National Aeronautics and Space Administration
CSA Climate Smart Agriculture
GPS Global Positioning System
IWSR Irrigation Water Supply Safety
IPCC Intergovernmental Panel On Climate Change
UNFCCC United Nations Framework Convention On Climate Change
PMD Pakistan Metrological Department
IDW Inverse Distance Weighting
ISODATA Iterative Self Organizing Data Analysis Technique
LULC Land Use/Land Cover
SPSS Statistical Package For The Social Sciences

xiii
LIST OF TABLES
Table 4-1: Stepwise Linear Regression results to map wheat 61
Table 4-2: Stepwise Linear Regression results to map maize 62
Table 4-3: Stepwise Linear Regression results to map sugarcane 64
Table 4-4: Stepwise Linear Regression results to map cotton 65
Table 4-5: Stepwise Linear Regression results to map gram 65
Table 4-6: Showing Impact of climate variables on Kharif crop production 78
xiv
LIST OF FIGURES
Figure 1-1: Conceptual Diagram of the research 13
Figure 3-1: Stacked Image of NDVI (2000 – 2014) 29
Figure 3-2: District Map of Punjab Along with Weather Stations 32
Figure 3-3: General Crop Calendar for field crops of Pakistan 33
Figure 3-4: General Crop Calendar for field crops in Districts of Punjab 33
Figure 3-5: Monthly Comparison of Average Rainfall January 36
Figure 3-6: Monthly Comparison of Average Rainfall February 37
Figure 3-7: Monthly Comparison of Average Rainfall March 37
Figure 3-8: Monthly Comparison of Average Rainfall April 38
Figure 3-9: Monthly Comparison of Average Rainfall May 38
Figure 3-10: Monthly Comparison of Average Rainfall June 39
Figure 3-11: Monthly Comparison of Average Rainfall July 39
Figure 3-12: Monthly Comparison of Average Rainfall August 40
Figure 3-13: Monthly Comparison of Average Rainfall September 40
Figure 3-14: Monthly Comparison of Average Rainfall October 41
Figure 3-15: Monthly Comparison of Average Rainfall November 41
Figure 3-16: Monthly Comparison of Average Rainfall December 42
Figure 3-17: Monthly Comparison of Average Temperature January 42
Figure 3-18: Monthly Comparison of Average Temperature February 43
Figure 3-19: Monthly Comparison of Average Temperature March 43
Figure 3-20: Monthly Comparison of Average Temperature April 44
Figure 3-21: Monthly Comparison of Average Temperature May 44
Figure 3-22: Monthly Comparison of Average Temperature June 45
Figure 3-23: Monthly Comparison of Average Temperature July 45
Figure 3-24: Monthly Comparison of Average Temperature August 46
Figure 3-25: Monthly Comparison of Average Temperature September 46
Figure 3-26: Monthly Comparison of Average Temperature October 47
Figure 3-27: Monthly Comparison of Average Temperature November 47
Figure 3-28: Monthly Comparison of Average Temperature December 48
Figure 4-1: Average Rainfall (mm) 1951 – 1980 map of Punjab 50
xv
Figure 4-2: Average Rainfall (mm) 1981 – 2015 map of Punjab 50
Figure 4-3: Average Temperature Map (0C) 1951 – 1980 map of Punjab 51
Figure 4-4: Average Temperature Map (0C) 1981 – 2015 map of Punjab 51
Figure 4-5: Rainfall Change (mm) 1951 – 2015 map of Punjab 53
Figure 4-6: Temperature Change (0C) 1951 – 2015 map of Punjab 53
Figure 4-7: Average divergence of classification runs 54
Figure 4-8: Map of NDVI classes representing a (mix) land cover/land use data 54
Figure 4-9: Grouping of NDVI classes representing Group-1 55
Figure 4-10: Grouping of NDVI classes representing Group-2 55
Figure 4-11: Grouping of NDVI classes representing Group-3 55
Figure 4-12: Grouping of NDVI classes representing Group-4 56
Figure 4-13: Grouping of NDVI classes representing Group-5 56
Figure 4-14: Grouping of NDVI classes representing Group-6 56
Figure 4-15: Grouping of NDVI classes representing Group-7 57
Figure 4-16: Grouping of NDVI classes representing Group-8 57
Figure 4-17: Grouping of NDVI classes representing Group-9 57
Figure 4-18: Grouping of NDVI classes representing Group-10 58
Figure 4-19: Grouping of NDVI classes representing Group-11 58
Figure 4-20: Grouping of NDVI classes representing Group-12 58
Figure 4-21: Grouping of NDVI classes representing Group-13 59
Figure 4-22: Grouping of NDVI classes representing Group-14 59
Figure 4-23: Grouping of NDVI classes representing Group-15 59
Figure 4-24: Grouping of NDVI classes representing Group-16 60
Figure 4-25: Wheat area map of Punjab 61
Figure 4-26: Maize area map of Punjab 62
Figure 4-27: Sugarcane area map of Punjab 63
Figure 4-28: Cotton area map of Punjab 63
Figure 4-29: Gram area map of Punjab 64
Figure 4-30: Validation – Remote Sensing vs Reported data 68
Figure 4-31: Validation – Remote Sensing vs Reported Data 69
Figure 4-32: Validation – Remote Sensing vs Reported Data 69
Figure 4-33: Validation – Remote Sensing vs Reported Data 70
xvi
Figure 4-34: Validation – Remote Sensing vs Reported Data 70
Figure 4-35: Impact of Rainfall on wheat Vegetation 71
Figure 4-36: Impact of Temperature on wheat Vegetation 75
Figure 4-37: Impact of Climate Change on Crop Performance 72
Figure 4-38: Impact of Climate Change on Crop Performance 73
Figure 4-39: Impact of Rainfall on Crop Performance in Bahawalnagar 73
Figure 4-40: Impact of Temperature on Crop Performance in Bahawalnagar 74
Figure 4-41: Impact of Climate Change on Crop Performance 74
Figure 4-42: Impact of Climate Change on Crop Performance in Jhang 75
Figure 4-43: Impact of Climate Change on Crop Performance 75
Figure 4-44: Impact of Climate Change on Crop Performance 76
Figure 4-45: Impact of Climate Change on Crop Performance in Chakwal 76
Figure 4-46: Impact of Climate Change on Crop Performance in Chakwal 77
Figure 4-47: Comparison of area and production of Gram crops 79
xvii
ACKNOWLEDGEMENTS
I feel pleasure to extend my deep sense of gratitude to my kind supervisor Prof.
Dr. Mobushir Riaz Khan, Institute of Geo-Information & Earth Observation,
PMAS Arid Agriculture University, Rawalpindi, Pakistan for his immense
guidance, suggestions, significant insight and unswerving encouragement
throughout the course of study as it was just because of his motivation and drive
with I was able to complete my work. I would always remain indebted to his
kindness.
I have no words to express thanks to Supervisory committee members, Prof.
Dr. Rai Niaz Ahmad and Prof. Dr. Muhammad Yasin for extending their keen
interest, sincere guidance, continuous encouragement and sympathetic attitude that
enabled me to complete these studies. I am highly obliged for indemonstrable and
endearment guidance and support of my teachers at Institute of Geo-Information &
Earth Observation, PMAS-AAUR.
I wish to thank, Institute of Geo-Information & Earth Observation for providing
me an opportunity to conduct a part of PhD research at his laboratory, learning
advanced. I also appreciate Mr. Muhammad Amin as an amazing man for giving
me great inspiration to step ahead towards this achievement. I could not find better
advisors for my Ph.D. study. I am also blessed to have love and support of
Muhammad Usman, Ramsha Malik, Mobashir Ali, Kashif, Col Saif, Col Tahir, my
brothers Yasir, Rizwan and Numan.
xviii
ABSTRACT
Climate Change is undeniable fact with pronounced effects on human life
especially food produce. Agricultural policy makers require accurate and timely
information regarding crop performance, shifting of cropping patterns and allied
information pertaining to changing climate. A method was developed to efficiently
monitor and predict changes in crop pattern with the changing climate in the
province of Punjab using satellite data process and GIS. In this research firstly,
changes in temperature and rainfall from 1980 to 2015 were assessed at district
level in comparison with the data of 1951 to 1980. Secondly, using multi-temporal
remote sensing in combination with crop statistics crop area maps was developed.
Thirdly, remote sensing based crop profiles were generated from 2000 till 2014.
Lastly, the changes in crop performance were compared with temperature and
rainfall variations. The outcomes demonstrated that increase in temperature
influences production of crops and a critical adverse relationship on yield and
production was found with temperature rise or fall. Punjab province was divided
into three equivalent imaginary parts (Northern, Central and Southern divisions)
and was found that the most extreme increment in the temperature occurred in the
Southern division i.e. lower Punjab (DG khan, Rahim Yar Khan, Rajanpur). In
Central portion i.e. Faisalabad, likewise raised temperature was observed. While in
Northern Punjab temperature remained less than the normal range. As far as
precipitation is concerned, increase in precipitation took place in Central Eastern
and Northern segment i.e. Gujrat, Lahore, Sheikhupura and Kasur; while extreme
decline in precipitation happened in Central Western and Southern potions i.e.
Bahawalnagar, Sargodha, Chiniot and Pakpattan. Enormous negative effects of
temperature increase were found on cotton crop in July and August. For maize,
adverse effect of expanding temperature in the month of May was observed; while
rain in the period of September positively contributed. Rise in November
temperature has a positive impact on wheat; however, December temperature has a
negative impact on wheat production. Major important facts like mentioned above
can be easily derived from this study and may be taken as guide line for various
agriculture departments to predict their crop production / yield very accurately at
every stage of crop cycle through remote sensing images and GIS. Farmers and

xix
agriculturists may be educated about the effects of these variables i.e. temperature
and rainfall on crop growth from sowing to harvesting, even on monthly basis. This
would entail better crop monitoring, requirement of water at every stage of crop
cycle, accurate estimation of yield and better adaption / mitigation strategies for the
future.
xx
CHAPTER 1
INTRODUCTION
1.1 CLIMATE CHANGE
Warming of the climate system is undeniable and marked by increased global
average air and ocean temperatures, melting of snow and rising global average sea
levels (Metz, 2007).
Globalization has its own advantages and disadvantages; adverse changes in
environment is one of the greatest challenges associated with the fate changing
globalization (Cowens, 2009). Most of the states are making an effort to convert
their rural economy to the industrial while setting aside the environmental concerns
(Nasir & Rehman, 2011). Now the question is that which practices are causing
abrupt climatic changes. Humans are mainly responsible for emerging CO2
enriched and warm world giving least consideration to the environmental impact
assessments of industrial and development projects. Global warming has many ill
effects such as human migration, depleting water resources, shifts in crop patterns,
declining yields and threats of food insecurity. Climate change can be treated as a
free factor that can influence the generation of agriculture items as well as bothers
the financial unfaltering quality, influencing the free market activity adjust of
sustenance (Leichenko, Thomas, & Barnes, 2010).
Climate change is the fundamental driver of food insecurity since it influences
the profitability of the agribusiness, its steadiness, and different segments of the
nourishment framework, including capacity, access, and use. Environmental
change impacts on farming and discovering adoption techniques through evaluating
the size and nature of these effects on trim efficiency. This is also true in case of
developed countries as well because, technology to mitigate adverse effects of
climate change is either still under development or very expensive. This
necessitates looking for various adaptation strategies to changing climates in all
domains of life (Abid, Schneider, & Scheffran, 2016).
1
2
Climate change is a global phenomenon yet the developing and least developed
states are more prone to the climatic changes. Pakistan is not only a developing
country but also an agrarian economy; therefore, climate change can be a serious
hurdle in its progress. Since, Pakistan is a developing country with less
technological expertise which can be used as an alternative approach to counter
greenhouse emissions. Normal reserve of Pakistan is arable land output of which is
contributing 21 percent in GDP through agriculture. Two most important crop
seasons in Pakistan are Rabi and kharif requiring certain levels of rainfall and
precipitation which if exceeds or decreases than the required amount our
agricultural productivity is reduced due to droughts and floods (Naheed & Rasul,
2010).
Monsoon is a season comprised of rainfalls and considered as one of the
biggest natural blessing as it provides ample water needed for the production of
crops. Inter annual fluctuations occur during monsoon (dry seasons/flood events)
causing a genuine test for the maintainable harvest generation. Pakistan's
hydrological administration upstream and downstream is exponentially associated
with north getting excess of water from precipitation or snow melting. Many a
times, it instantly keeps running down to the low height fields of Punjab and Sind
flooding the developed grounds and devastating standing field crops. If there
should be an occurrence of powerless rainstorm and less precipitation in the
northern-half, again the farming fields of south endures a great deal because of
higher water requirement due to high temperatures and yet less accessible water.
Another threat associated with the climate change is increased use of input
restricting healthy competition among the poor farmers. Like other countries,
edibles security is a main concern of Pakistan's relevant authorities. Wheat, rice,
and maize are the primary edible crops with cotton and sugarcane as significant
cash crops of Pakistan. In this way, sustenance security strategy basically
concentrates on the creation of these harvests. Subsequently, it is critical to look at
the nexus between evolving atmosphere (temperature, precipitation, mugginess,
and daylight) and the yield of significant products including wheat, rice, maize, and
sugarcane (Ali et al., 2017).
3
Impacts of climate change on crop production (both developed and the least
developed) has been studied numerous times (Ayub, 2010). The common climate
change variables in such studies are temperature and rainfall. Change in growing
season and shifting of cropping patterns as a consequence of changing temperatures
have also been studied. Research also reveals some alarming adverse effects of
climate on crop production in Asia. It is perceived that temperature can rise to 30
C
by the year 2040 and 5°C - 6°C by the end of 21ST
century due to unhealthy
economic practices. This temperature increase can challenge the fate of few crops
forever. To state an example, due to the existing scenario of deteriorating
environment and climate Asia’s wheat production will be lowered to half (Singh &
Bantilan, 2009).
Climate research on agriculture depicts both the negative and positive
relationships between climate change and crop production. For example, no crucial
negative impacts of environmental change on wheat production in Pakistan (Janjua,
Samad, Khan, & Nasir, 2010) but another study conducted in 2011 proved negative
impact of temperature rise on agriculture production. It has also been found that
rain fall changes in Pakistan affects agriculture production. The vulnerability of
Pakistan’s agrarian sector needs serious consideration especially after experiencing
regular floods in 2010, 2011 and 2012 (Schütte & Kreutzmann, 2016). This raises
key concerns among the policy makers of the state; whether cultivate level
adjustment is satisfactory to manage environmental change impacts on agricultural
profitability.
1.1.1 Extreme Weather Events
Some scientists assume that environmental changes will incite more
phenomenal atmospheric events such as heat waves, dry seasons, strong breezes
and overpowering deluges. Environment of models have reliably predicted such
atmospheric events due to climatic deviations. For example, models don't surrender
to whether the amount of tempests in a more sizzling world would be essentially
than ebb and flow regards, however, analysts also concluded that the nature of
ocean storms will change along with time span of ocean storm season.
4
Dry seasons are immediate aftereffects of climatic changes and cause severe
shortage of water available to plants. Dry seasons have been accountable for a bit
of the more real starvations on the planet, sociological components are also
indispensable (Keshavarz, Karami, & Vanclay, 2013). Heat waves can cause
phenomenal strains in crops and thereby reduces yields particularly when occur in
the midst of particular conditions of the plant’s life-cycle (preparation, unit or
natural item set). Also, heat waves can achieve wilted plants (as a result of raised
transpiration rates) which can cause yield adversely if not checked by water
framework. Strong breezes can cause leaf and member hurt, and what's more
"sandblasting" of the earth against the foliage. Considerable deluges that routinely
achieve flooding can, in like manner be ruining to crops and to soil structure
(Jovanovic & Stikic, 2012). Several Plants can't make dew in deferred waterlogged
conditions in light of the way that the roots need to unwind. Besides, flooding can
crumble topsoil from prime creating ranges; achieving irreversible living space
hurt. Generous breezes joined with precipitation can uproot trees, destroy houses,
and other structures.
1.1.2 Carbon Dioxide Increase
Researchers are also in agreement that the levels of ambient CO2 (carbon
dioxide) have expanded from 280 to 380 ppmv. These levels have been
consistently expanding by 1.9 ppm on every year basis since 2000 to a great extent
because of petroleum derivative consuming.
1.2 IMPACTS OF CLIMATE CHANGE
Climate change has marked influence on food security around the world,
neighborhood, and close-by level. Environmental transformation can disturb food
access both in terms of quantity and quality. Expected additions in temperatures,
changes in precipitation, changes in exceptional atmosphere events, and abatements
in water openness may all result in decreased agricultural yield. Additions in the
repeat and reality atmospheric events can similarly meddle with food movement,
and rise in sustenance costs after phenomenal events are required to be more
5
progressive later on. Extending temperatures can add to squander and polluting
(Wheeler & Von Braun, 2013).
1.2.1 Reduced Nutrient Levels of Produce
Carbon dioxide is basis of photosynthetic process and thus important for flora
expansion. Little but optimal additions in carbon dioxide cause more plant
advancement dut to enhances assimilation of CO2. It is expected that higher levels
of CO2 will attain higher harvestable products. In any case, this depends essentially
on the availability of sufficient water and supplements for plant growth. A couple
of analysts assume that one interruption to this extended productivity with less
nutrient levels. Accepting certified, this could have an huge influence on human
prosperity if additional manures were not joined into trim age (Atta-Krah &
Sumberg, 1988).
1.2.2 Increased Competition of Pests
Whilst crops are required to react to expanded CO2 with solid vegetative
expansion, different flora are additionally thought to react in a comparative design.
Weeds have ended up being more gainful and are required to assault new living
spaces as worldwide temperature alteration increments. For instance, scientists
found that toxin ivy is really ending up more toxic environmental carbon dioxide
levels. Studies also demonstrated that herbicides end up being less intense in a
higher carbon dioxide condition, implying that higher rates of herbicides will be
important to accomplish similar levels of control. On the off chance that
deteriorates life more and duplicate all the more every year, it is conceivable that
they could spread harvest maladies into new generation ranges. It is additionally
conceivable that increments in temperature, dampness and carbon dioxide could
bring about higher populaces of damaging nuisances.
1.2.3 Irrigation and Rainfall
Alter in environment may in like manner influence the water availability and
water requirement for agricultural consumption. In case temperature augmentations
6
and more sporadic precipitation events result from an unnatural climate change, it
is possible that water framework needs could augment later on. Precipitation in
south-east of US states has extended around 10% over the previous century.
Regardless, some part of this development may be a result of changes in the repeat
of tropical tornados. Tornados generally speaking outcome in precipitation events
more unmistakable than 2 sneaks in a day which occur at erratic between times; in
this less important in a green sense than are precipitation events that happen
additional constantly, even with cut down collections (Rost et al., 2009). Plants
creating more carbon dioxide condition may have cut down water needs. Moreover,
no matter how you look at it extended dampness will direct transpiration,
furthermore diminishing the necessity for water. In any case, these points of
interest will probably be obscured by the nonappearance of available water as a
result of extended dry seasons and warmth waves. The yields will happen more
seriously than when below "common" creating environments, and would possible
need additional water to comply with these climactic variations. In retribution of
movements, plant reproducers are starting at now endeavoring to grow new
collections of harvests that are believed to be dry season lenient, and extra
adaptable to fluctuating stages of temperature (Barrow, 2014).
1.2.4 Global Food Security Challenges
Universally, these things of normal change on cultivating and support source
are apparently going to look like those initiated in the United States. Regardless,
unique stressors, for example, masses development might exposed up the things of
natural variation on nutrition safety. In production countries, modification options
identical changes in trim institute or cultivating practices, or changes up to water
outline are extra bound in the United States other than industrialized nations
(Change, 2014). Climate associated agitating impact to nutrition spread and
transport, generally or locally, may perfectly affect prosperity and quality and also
on food availability. For example, the sustenance transportation system in the
United States as regularly as conceivable moves broad volumes of grain by water.
By virtue of a remarkable atmosphere event, there are barely any substitute
pathways for transport. Transportation changes, for instance, lessen the limit of
7
farmers to exchange their grains to all-inclusive markets, and can impact overall
food costs (Handmer et al., 2012). High temperatures and an inadequacy of rain in
the mid-year of 2012 incited a champion among the most outrageous summer dry
seasons the nation has seen and acted bona fide impacts to the Mississippi River
watershed, an imperative cross-country delivering course for Midwestern
cultivating. This drought realized basic sustenance and financial hardships in view
of abatements in cargo transport development, the volume of stock passed on, and
the amount of Americans used by the tugboat business.
1.3 PROBLEM STATEMENT
Although Pakistan is amongst the lowest contributing nation for global
greenhouse gas emissions but is amongst the one of the most vulnerable countries.
Followings are major climate change effects on agriculture of Pakistan:
1.3.1 Floods and Droughts
Increased intensity and recurrence of extraordinary climate occasions,
especially during the last decade, is causing floods and droughts. Both the natural
phenomena have direct or indirect impact on agriculture and have serious
consequences on food security.
1.3.2 Shift in Spatial Boundaries of Crop Potential Areas
Global changing in climate (higher temperature and reduced soil moisture) is
affecting the length of growing period and resultantly affecting quantity and quality
of biomass, maladies and involve spatial moves in potential ranges of agrarian
products.
1.3.3 Changes in Productivity
The worth and amount of harvest yield is being influenced by environmental
changing in two ways: a) immediate impacts from changing in temperature, less
water availability, CO2 fixations and extraordinary occasions; and b) circuitous
8
impacts through variations in circulation, recurrence and seriousness of irritation
and infection episodes, rate of flame, weed invasion, or through changes in soil
properties.
1.3.4 Reduced Water Availability
Our maximum water supply depends upon glaciated northern areas of Hindu
Kush Hamalaya (HKH) which are under the phenomena of recession owing to
enhanced global warming. The increment in temperature has coordinate impact on
yield evapotranspiration and thrashing of soil dampness. The expansion in crop
evapotranspiration when joined by less precipitation in rain fed situations comes
about into diminish in crop evapo-transpiration because of constrained accessibility
and utilization of soil dampness by crops. Owing to this factor, there is increased
stress among upper and lower riparian farmers and irrigation managers of canal
command areas of Pakistan.
1.3.5 Changes in Cropping Pattern
An ascent in hotness, decrease and moves in precipitation might expand the net
water system, water prerequisites and other info needs of yields, along these lines,
constraining agriculturists to roll out improvements in cropping examples to
conform to environmental change.
1.3.6 Changes in Land Use Pattern
An earth-wide temperature boost, climatic boundaries and CO2 concentrations
would lead towards changes in arrive utilize frameworks because of change in the
developing period of products. The climatic variations in dry atmospheres would
come about expanded saltiness and additionally water logging; which would
absolutely interest for combination of ranger service and aquaculture with the yield
based cultivating frameworks.
9
1.3.7 Coastal Agriculture
Saline water intrusion from Sea to the Indus delta has also affected costal
agriculture, mangroves and breeding habitats of fish. This saline water intrusion is
happening due to climate change.
Additional issues have occurred because of an increment the planet’s typical
temperature. A more blazing world has recently achieved modification of surface
physical properties and a couple of areas which in this manner provoked changes in
water and temperature regimes, conduit stream and reinforcing of land debasement.
Each one of these movements has successfully impacted human prosperity,
agribusiness, open arable grounds and boondocks resources, sensible progression
and life of people.
Crop production is affected by changing in climate is an extensive variety of
ways which requires programs to counter the threat posed by climate change to
agriculture. Efficiency, alleviation and adjustment moves can make put at various
innovative, authoritative, institutional and political levels (Arakelyan, Moran, &
Wreford, 2017).
Precision agriculture is an integrated solution to address with these inter-linked
problems of nourishment security and environmental change that explicitly goes
for financially extending agrarian benefit while modifying and gathering
adaptability of provincial systems to ecological change. CSA works at various
levels while lessening ozone depleting substance outflows from agribusiness
including products, animals and fisheries (Lipper et al., 2014).
1.4 OBJECTIVES
Keeping in view the aforementioned threats of changing climate on agriculture,
it is imperative to look for various options to counter them in order to maintain
food security of the country in a sustainable manner. As mentioned earlier, there
are two ways to combat the adverse climate change effects on crops, viz,
technological inventions and adaptation actions. As Pakistan is less technically
10
advanced country, therefore, we should concentrate on adaptability measures while
performing research and development for mitigation technologies.
The proposed study makes use of satellite data, GIS and weather stations’ data
to evaluate the effect of climate change on agricultural land use in Punjab,
Pakistan. In this proposed study, aimed at detecting resilience in agricultural land
uses of Pakistan in order to find options for changing in climate adaptations. The
objective of study is to development of remote sensing and GIS based methods,
showing change in agricultural land use of Punjab, Pakistan over a period of time
and then linking it to climatic change.
1.4.1 Assessment of Climate Change
Before embarking upon the adaption of changing in climate in the field of
crops, it is important to know the quantum of changing climate and where exactly
these changes are happening. Further, what are the adverse impacts of such
changes and which areas witnessed changes in climate but are resilient in terms of
agricultural productivity.
1.4.2 Impact Assessment of Climate Change on Agriculture
In order to study changes in agricultural land use in response to changing
climate, it is required to know what is grown, how much is grown, how it is
performing over time at various places and how much it will produce.
Estimation of crop area is main components of crop production and yield
estimation. To assess crop production correctly, the crop area must be projected
precisely. Some of the usually adopted methods for estimating of crop area are
terrestrial surveying methods, farmers’ evaluation and satellite remote sensing
(Lobell, Ortiz-Monasterio, Asner, Naylor, & Falcon, 2005). The information on
crop area statistics forms the backbone of an agricultural statistical system. The
crop area should cover the entire area under each crop and statistical evaluations
are generally obtained through survey of sampling sights which are then upscale to
administrative levels using statistical methods. As farmers grow crops under
11
diverse cropping classifications, such as mono-cropping, mixed cropping,
continuous cropping or repeated cropping, a comprehensive method is mandatory
to attain the area under a specific crop. This can be attained with comparative ease
when a single crop is grown in a ground in a specific season, but it becomes
difficult under mixed cropping or intercropping. In this case, at least twice a year
sampling is done in the field. It develops even more problematic in areas where the
land archives and crop records are not sustained properly.
Advancements in computer and satellite remote sensing in recent past have led
to the accessibility of dense and high performance computing technology that are
well suited to the demands of remote sensing and geographic information system
(Mather & Koch, 2011). In geographic information system and remote sensing data
advantageous because of the vast area and repeated reporting during a cropping
season (Leckie, 1990). A quantity of methods are available for providing land
estimates for main crops by use of satellite data. Remote sensing and geographic
information system (GIS) technologies are also being used for crop area estimation
(Menon & Bawa, 1997) . Global Positioning System (GPS) and remote sensing is
being used to identify the two noteworthy classifications of image arrangement
procedures incorporate unsupervised (ascertained by programming) and supervised
(human-guided) classification.
1.4.3 Unsupervised classification
Where results (groupings of pixels with regular qualities) rely upon the item
examination of an image without the user providing case classes. The PC utilizes
strategies to make sense of which pixels are associated and groups them into
classes. The customer can indicate which calculation to be utilized and the coveted
number of yield classes.
1.4.4 Supervised Classification
Relies upon the likelihood that a user can pick test pixels in a picture that are
illustrative of specific classes and after that direct the picture planning
programming to use these arrangement goals as references for the gathering of each
12
and every other pixel in the photo. Preparing locales (otherwise called testing sets
or information classes) are picked in perspective of the learning of the customer.
The customer similarly sets the cut-off points for how practically identical diverse
pixels must be to pack them together. These breaking points are consistently set in
light of the other worldly qualities of the preparation territory, give or take a
specific augmentation (frequently in view of "shine" or quality of appearance in
particular ghostly groups). The client likewise assigns the quantity of classes that
the picture is grouped into. Numerous examiners utilize a mix of directed and
unsupervised characterization procedures to create last yield examination and
grouped maps.
1.5 FINDING RESILIENCE IN CROP AREAS VERSUS CLIMATE
CHANGE
Climate-smart agriculture (CSA) is an integrative method to deal with address
these interlinked problems of nourishment safety and climate change, that
specifically points economically expanding rural profitability, to help fair
increments in cultivate livelihoods, sustenance security and advancement, adjusting
and constructing versatility of horticultural and sustenance security frameworks to
environmental change at numerous levels; and diminishing ozone depleting
substance emanations from farming including harvests, animals and fisheries
(Lipper et al., 2014).
Agriculture influenced by environmental change is an extensive variety of
courses and there are various passage focuses for starting CSA programs or
improving existing exercises. Efficiency, relief and adjustment moves can make
put at various mechanical, hierarchical, institutional and political levels.
(Arakelyan et al., 2017). Thus, following objectives of the presented study were
coined to assist policy makers and researchers working in agriculture and food
safety.
13
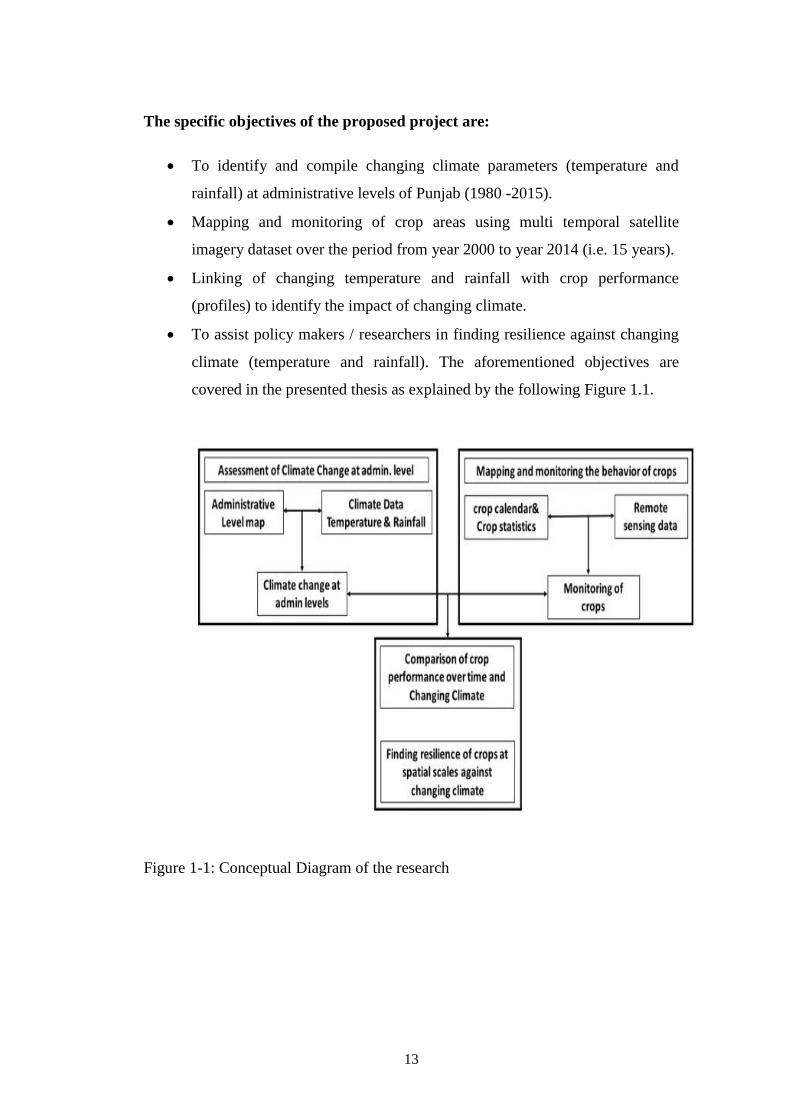
The specific objectives of the proposed project are:
To identify and compile changing climate parameters (temperature and
rainfall) at administrative levels of Punjab (1980 -2015).
Mapping and monitoring of crop areas using multi temporal satellite
imagery dataset over the period from year 2000 to year 2014 (i.e. 15 years).
Linking of changing temperature and rainfall with crop performance
(profiles) to identify the impact of changing climate.
To assist policy makers / researchers in finding resilience against changing
climate (temperature and rainfall). The aforementioned objectives are
covered in the presented thesis as explained by the following Figure 1.1.
Figure 1-1: Conceptual Diagram of the research
14
CHAPTER 2
REVIEW OF LITERATURE
2.1 CLIMATE CHANGE
Climate change results from the long haul weather designs that portray the
areas of the world. The expression "weather" allude to the fleeting (every day)
changes in temperature, wind, as well as precipitation of an area (Moran et al.,
1998).
During the consume time season, practically climatic models have expected
hail to increase. The Himalayan glaciers (75%) are expected to retire and will go to
the bottom by 2035. The slump or escalation in length can handle to droughts and
flooding. Climate climax will affect productivity and thus create food insecurity
problems (Gagné, 2016).
By 2050, the planet will have expanding crop production to feed an anticipated
9 billion individuals who have the changing examples of ingestion, the results of
neighborhood climate move and furthermore the expanding shortage of real land
and water (Godfray et al., 2010).
Change in climate is relied upon to have antagonistic result on Pakistan. This is
unexpected for a nation, which positions 135th on the planet as far as worldwide
greenhouse gasses (GHG) outflows per capita, yet positions sixteenth as far as
powerlessness to environmental change. Environmental change represents a
noteworthy danger to all measurements of reasonable improvement and has
boundless effects crosswise over different divisions and biological communities,
for example, nourishment, water and vitality; woods and biodiversity; seaside and
marine condition; and in addition on the event and power of atmosphere related
perils, for example, surges and dry spell. It additionally conveys potential for
inward and outer clashes.
15
2.1.1 Greenhouse Gases
“Greenhouse gases” got their name since they trap warm (vitality) like a green
house in the lower some portion of the air. As a result greater amount of these
gasses are added to the air, more warmth is caught. This additional warmth prompts
higher air temperatures close to the Earth's surface, changes climate and raises the
temperature of the seas.
There is solid proof that greenhouse gasses have just started to warm the
planet. If this situation remains the same, it is expected that the supply of
greenhouse gases will grow mostly from the burning of vestige, but also from the
change in landuse over the next century. This in turn will lead to changes in
precipitation patterns, and thus, changing regional climate and ecological zones.
Although various impacts on a range of domains are expected from the global
climate change, the agriculture sector would be affected largely as it is directly
depending on the climatic variables such as temperature and precipitation
(Nordhaus, 1991).
Every single climatic model demonstrates a rising temperature. The
precipitation design has changed with lessened precipitation over South and
Southeast Asia. Since the 1970s, more exceptional and delayed dry seasons have
happened. Everlasting snow cover has fallen both on the level and additionally in
the profundity of the snow cover. The worldwide mean ocean level is relied upon
to ascend by 0.18 to 0.59 m before the century is over (Mahato, 2014).
The danger of substantial scale change in climate is one of the focal problems
confronting the world. There is across the board agreement among mainstream
researchers that the planet is being warmed, that this warming is caused by living
being discharges of nursery gasses (GHGs), and that the outcomes of kept warming
are probably going to be extreme. There is likewise worldwide worry about the
issue: in a current Pew survey, greater parts in every one of the 40 countries
surveyed said that environmental change was a significant issue, and a worldwide
middle of 54% said that it was an intense issue (Carle, 2015).
16
2.2 CAUSES OF CLIMATE CHANGE
2.2.1 Globalization
Globalization has its own particular points of interest and impediments;
environmental change is one of the greatest disservices related with the destiny
evolving globalization (Cowen, 2009). The vast majority of the countries are trying
to change over their agrarian economy to the mechanical and putting aside the
ecological concerns (Nasir & Rehman, 2011).
Climate is primarily produced by the issue of heat-trapping gases, mainly
carbon dioxide, generated by vehicles, industrial processes, power stations and
deforestation. The gases we emit today will remain in the atmosphere for decades.
The longer we wait to take action to reduce emissions, the steeper and more costly
the emission reductions must be in the future to prevent dangerous rates of global
climate change.
2.2.2 Natural Causes
Vast changes in the recurrence and power of tropical violent winds obstruct
the waves and also their distribution to expanding barometrical greenhouse gasses.
Pattern discovery is additionally hampered by noteworthy impediments in the
accessibility and nature of worldwide chronicled records of tropical typhoons. It
stays questionable, subsequently, regardless of whether past variations in tropical
violent wind action have surpassed the fluctuation anticipated from common
reasons (Knutson et al., 2010).
Anthropogenic factors are controllable, however, these being commanding
characteristics, because of which global warming has been aggravated and more
heat has been caught in the biosphere than normally required to direct the life
forms.
2.2.3 Droughts
More exceptional and longer dry spells observed over more extensive
territories since 1970s, especially in the tropics and subtropics. Expanded aeration
17
connected by means of high temperatures and less rainfall has added to changes in
dry season. Changes in sea surface temperatures (SST), wind directions,
diminished snow cover have additionally been connected to dry spells.
2.3 GENERAL IMPACTS OF CLIMATE CHANGE
Worldwide climate change is just one of the bigger arrangement of
destabilizing ecological changes, each of them mirroring the expanding human
settlement of the ecosphere. These incorporate major worldwide changes, for
example, stratospheric ozone consumption, biodiversity misfortune, overall land
debasement, freshwater exhaustion, and others, for example, the disturbance of the
basic cycles of nitrogen and sulfur, and the worldwide spread of diligent natural
contaminations. All have awesome results for the maintainability of environmental
frameworks: sustenance creation; human monetary exercises and human populace
wellbeing.
Myers (2002), for instance, evaluated that in 1995 there were around 25
million individuals uprooted as an outcome of ecological change. Further, he
anticipated that by 2050 this number would ascend to roughly 200 million,
considering statistic change and falling apart natural conditions.
2.3.1 Impact on Human Migration
By focusing on the ecological danger and individual choices, the calculated
models outputs show trends of relocation in numerous areas due to natural
anxieties and anticipated future change. This originates from the expository
concentrate on danger, as opposed to considering relocation to be a social marvel
and entrenched arrangement of social and statistic communication and change. This
is a critical point, since affirmation of existing relocation infers that natural drivers
should be considered close by different drivers. This is expressly acknowledged by
(Kolmannskog, 2010) ,who take note of the many-sided quality of relocation as a
human procedure, despite the fact that they keep on focusing on the scan for a
meaning of 'ecological transients', as unmistakable from different sorts of vagrants.
18
2.3.2 Impact on Coral Reefs
Oceanic temperatures in various tropical areas have extended by 1°C, over
the span of late decades, and are at the present time growing at ~1– 2°C
consistently. Coral whitening happens when the warm versatility of corals and their
photosynthetic symbionts (zooxanthellae) is outperformed. Mass coral blurring has
occurred in association with lifted sea temperatures throughout late years and
incorporates the loss of the zooxanthellae following unending photo-inhibition. The
rate of the progressions that are anticipated shows a noteworthy issue for tropical
marine biological communities and recommends that excessive warming can't
happen without the misfortune and corruption of coral reefs on a worldwide scale
(Hoegh-Guldberg, 1999).
The connection of water, imperativeness, cultivating and climate is an
essential one. Regularly increasing degree, that association is reducing out of
change gambling food, water and essentialness safety. Natural changing is ponder
we can never again reject as its things have over up being dynamically evident
around the world. On the once-over of most sultry years on record, for all intents
and purposes reliably since 1992 is fused and, as demonstrated by NASA and
NOAA data, 2015 was the most bursting.
2.3.3 Impact on Specie Extinction
High temperature is most likely going to be the best clarification behind
species decimations in this century. The Intergovernmental Panel on Climate
Change says a 1.5°C increasing may put 20-30% of classes in threat of destruction.
In situation the planet warms by more than 3°C, most situations will struggle.
Many of the world's undermined species live in ranges that will be extremely
influenced by environmental change. Furthermore, environmental change is going
on too rapidly to alter their live cycles for adoption to such change.
2.4 IMPACT ASSESSMENT OF CLIMATE CHANGE ON AGRICULTURE
Global Climate change is probably going to globally effect of food security
situation, as food production is mainly related to the agriculture sector. Increment
19
in the mean temperature can lessen the span of many harvests and consequently,
decrease the yields of many crops. In territories where temperatures are near the
physiological maxima for crops, warming will largely affect their yields.
Climate change circumstances result from rise in temperatures, changes in
precipitation, and higher CO2 obsessions. There are three courses in which the
nursery impact is basic of agribusiness. At first, extended natural CO2 centers can
straightforwardly influence the improvement rate of product plants and weeds.
Besides, CO2 impelled variations of atmosphere may adjust levels of temperature,
precipitation and solar radiation that can affect plant and animal gainfulness
(Mahato, 2014).
Another threat related with change in climate is that the use of inputs would be
increased, thus limiting healthy competition for the poor fellows. Like other
countries, food security is one of the most prominent policies of the Pakistani
government. Wheat, rice and maize are the most important crops with cotton and
sugarcane as large currency deposits of Pakistan. This is why food strategy focuses
on the production of these crops. Thus it is important to examine the correlation
between the changing climate (temperature, precipitation, humidity and sunshine)
and the yield of the most important crops counting wheat, rice, corn and sugar cane
(Wheeler & Von Braun, 2013).
With the help of harvest reproduction models, these research showed that the
yields of grain in many countries would drop with increase in temperature. The
economists have also been concerned that crops in many developing countries
would be more complex to the climate than in the US (Mendelsohn, Dinar, &
Williams, 2006).
The climate change on horticulture and human prosperity is: 1) the organic
effect on trim yields; (2) the subsequent effect on the outcomes, including costs,
generation and utilization; and 3) the effect on per capita calorie utilization and
infant sustenance. The biophysical impacts of environmental change on
horticulture prompt changes underway and cost, which are changing without
anyone else's input, for example, agriculturists and other market members,
20
changing the harvest blend, input usage, creation, sustenance request, nourishment
utilization and exchange, notwithstanding the adjustments in precipitation, the
higher temperatures affected by climate change additionally increment the water
request of the yields. The proportion of water utilization to prerequisites is alluded
to as irrigation water supply safety (IWSR). The littler the proportion, the more
noteworthy the water stack on inundated gather yields (Backlund, Janetos, &
Schimel, 2008).
Food security is specifically and in a roundabout way associated to climate
change. Any adjustments in the climatic parameters, for example, temperature and
stickiness that decide plant development will specifically influence the measure of
sustenance delivered. Circuitous linkage alludes to cataclysmic occasions, for
example, surge and dry spell, which are expanding because of climate change,
bringing about an incredible harvest calamity and sendoff extensive patches of
arable land which are unsatisfactory for development and along these lines
undermine nourishment security. The net effect of food security relies upon
introduction to worldwide natural changes and the capacity to adapt to worldwide
ecological change and recuperate it. On a global scale, gradually eccentric climate
conditions will prompt a diminishment in farming generation and higher
sustenance charges, instigation nourishment weakness (Mahato, 2014).
The effects of change in climate on plant production in different countries;
both developed and least developed has been the subject of many research. The
common climate change variables in such studies are temperature and precipitation.
Changes in the vegetation period and shifting of patterns as a result of changing
temperatures were also investigated. The research also shows some alarming
statistics on the effects of climate change on plant production in Asia. It is
perceived that the temperature can rise to 30 ° C by the end of this century due to
unhealthy economic practices until 2040 and 5 ° C to 6 ° C. This temperature
increase can challenge the fate of a few harvests forever. For example, due to the
existing scenario of the deteriorating environment and the climate.
Half of the total populace (2.9 billion individuals) lives not exactly $ 2 every
day. Effectively 800 million individuals are undernourished and sustenance
21
creation needs to twofold in the following 35 years to address future issues. These
advances must be accomplished even with environmental change, the current
accord that it will influence our lives from numerous points of view. The effect on
individuals' work will be most noteworthy in the tropics and subtropics,
particularly in Africa, primarily in light of the fact that numerous poor little
ranchers rely upon horticulture and have couple of options (M. Parry et al., 2001).
Heat waves can cause outrageous hotter environment which can decrease the
yields when they happen amid critical times of the vegetation's cycle (fertilization,
husk or natural product amount). Warmth waves can likewise prompt non
domesticated plants (because of expanded transpiration rates) which can cause loss
of yield on the off chance that they are not neutralized by water system. Solid
breezes can cause leaf and appendage harm and also "sand impacting" of the dirt
against the foliage. Substantial downpour, which regularly prompts flooding, can
likewise be hindering to yields and earth arrangement (Jovanovic & Stikic, 2012).
An assortment of potential effects (and potential advantages) of climate change
on urban areas have been distinguished up until now. Various late surveys have
portrayed these, including the IPCC Third and Fourth Assessment, their accord is
that the principle effects of environmental change on urban areas are likely: effect
of ocean level ascent on beach front urban areas (counting the impacts of tempest
surges); Effects of outrageous occasions on manufactured frameworks (e.g. wind
tempests and tempest surges, surges of overwhelming precipitation occasions,
warm emissions and dry spells); Effects on well-being (warmth and icy related
mortality and bleakness, nourishment and water borne malady, vector-borne
ailment) coming about because of higher normal temperatures and/or extraordinary
occasions; Effects on vitality utilization (warming and cooling, vitality for water);
Impact on water accessibility and assets (Hoegh-Guldberg, 1999).
2.5 ADAPTATIONS AND MITIGATIONS
Adaptation is an essential aspect countering ex devours for the effects of
climate and the appraisal of the risk and is one of the strategic alternatives (Smit et
al., 1999). The vital part of the modification as a political reaction of the
administration was perceived universally. Article 4.1b of the United Nations
22
Framework Convention on Climate Change (UNFCCC, 1992) states that the
gatherings "are obliged to figure and execute national and, where suitable,
territorial projects, alleviation measures and measures to encourage fitting
adjustment to environmental change "The Kyoto Protocol (Article 10) obliges the
gatherings to advance and encourage adjustment and to utilize adjustment
innovations to handle environmental change (Halvorssen, 2007).
Soil carbon sequestration is a technique to alleviate climate change.
Unsustainable land use climate practices have increased the attentiveness of carbon
dioxide in to the atmosphere. Effects of climate change and global warming are
increasing at unprecedented rate. Current research has recommended that proper
management practices can reduce this risk up to some extent. (Lal, 2004).
Work on adaptation option to climate change is assessed. These are largely
focused on development of topology of adaptation and classify and characterize
most suitable option. It basically highlights the adaptation of all different sectors to
cope with the adverse impacts of Climate change. The study was carried out in
Canadian agriculture fields and the results reveled that with the proper policy
management and implementation of environmental friendly risk of climate change
on crop sector and food scarcity can be minimized (Shahid, 2011).
2.6 ADAPTATIONS TO CLIMATE CHANGE W.R.T AGRICULTURE
Many potential adjustment options for agricultural adjustments have been
proposed which are measures or practices that could be practiced to diminish the
normal antagonistic effect. They include an extensive variety of structures
(specialized, budgetary, administrative), scales (worldwide, local, neighbourhood)
and members (governments, businesses, agriculturists) (Smithers and Smit 1997,
Skinner et al., 2001). A large portion of them speak to conceivable or potential or
adjustment measures, as opposed to those really embraced. The impacts of
environmental change frequently influence certain adjustments, in spite of the fact
that the alteration procedure itself stays hazy (Smit & Skinner, 2002).
It is important to comprehend what sorts and types of adjustment are
conceivable, possible and plausible; who might be engaged with their execution;
23
and what is required to encourage or advance their improvement or reception. A
fundamental initial phase in tending to these worries is the distinguishing proof and
portrayal of adjustment conceivable outcomes in agriculture (McCalla & sh, 2006).
Despite the significant impact of climate change, including changeability and
extremes, change in agriculture does not work and creates in connection to these
climatic boosts alone. Non-climatic powers, for example, monetary conditions,
governmental issues, nature, society and innovation unmistakably significantly
affect horticultural basic leadership, including versatile basic leadership (M. L.
Parry, Rosenzweig, Iglesias, Livermore, & Fischer, 2004).
Primary climate change affect appraisals did not study any modification. With
the possibility to adjust the negative effects of environmental change, adjustment is
imperious for evaluating the effect of environmental change (Reilly, 1995). In spite
of the fact that farming is a standout amongst the most vigorously examined
divisions in connection to the impacts of environmental change the adjustment in
agribusiness has not yet been unequivocally considered in the effect evaluation
writing. This is expected to a limited extent to the way that many investigations
don't go past the estimation of the collect pay responses and basically overlook
human basic leadership in the farming segment. Customary, situation based
investigations that accommodate forecasts of potential impacts in agribusiness have
driven the adjustment for the most part through suppositions about human reactions
(Adger, Brooks, Bentham, Agnew, & Eriksen, 2005).
Recognizing that climate change could negatively affect rural generation has
communicated the desire to incorporate flexibility with horticultural frameworks.
An objective and financially savvy technique can be the usage of expanded farming
dietary enhancement. Nourishment expansion can enhance strength in an
assortment of routes: by making a more noteworthy capacity to control bother
episodes and to moderate pathogen transmission that may compound under future
climatic situations, and also by buffering plant generation from the impacts of more
prominent atmosphere fluctuation and extraordinary occasions. Such focal points
point to the undeniable estimation of the presumption of product expansion to
enhance protection, yet the suspicion was moderate (M. L. Parry et al., 2004).
24
Natural changes can influence a wide range of parts of rural generation. With
more prominent atmosphere inconsistency, moving temperature and precipitation
designs, and other worldwide change segments, we expect a progression of harvest
and biological system reactions that will influence the vital agrarian procedures.
These impacts incorporate changes in supplement cycling and soil dampness, and
also moves in nuisance and malady infections, all of which unequivocally influence
nourishment creation and sustenance security (Fuhrer et al., 2003). These
progressions are relied upon to increment abiotic and biotic anxiety and power
farming frameworks to meddle all the more unequivocally later on.
Another threat linked with climate change is that the use of inputs would be
increased, thus limiting healthy competition for the poor fellows. Like other
countries, food security is one of the most prominent policies of the Pakistani
government. Wheat, rice and maize are the most important food crops with cotton
and sugar cane as large cash deposits of Pakistan. This is why food policy is on the
production of these crops. Thus it is important to examine the correlation between
the changing climate (temperature, precipitation, humidity and sunshine) and the
yield of the most important crops including wheat, rice, maize and sugar cane.
2.7 MONITORING OF AGRICULTURE
Varieties of agricultural ecosystems have turned out to be more essential for
farming, as environmental change has expanded. Study has demonstrated that
product yields are exceptionally touchy to changes in temperature and
precipitation, particularly amid blooming and natural product improvement stages.
Temperature maxima and minima and additionally regular movements can greatly
affect plant development and creation. A more noteworthy inconstancy of
precipitation, including surges, dry season and outrageous precipitation occasions
has influenced nourishment security in many parts of the world (M. Parry,
Rosenzweig, & Livermore, 2005).
Such watched agriculture susceptibilities to temperature and precipitation
changes recommend the need to create flexible frameworks that can support plants
against atmosphere inconstancy and outrageous atmosphere occasions, particularly
25
in vital formative stages, for example, anthesis. There are assortments of courses in
which enhanced cultivating frameworks demonstrate that all the more
fundamentally complex frameworks can relieve the impacts of climate change on
plant creation (Adams, Glyer, & McCarl, 1989).
A similar investigation of agriculture frameworks in Sweden and Tanzania,
two locales where horticulture has experienced environmental change and
outrageous occasions, has demonstrated that agrarian assorted variety has expanded
the strength of generation frameworks. Sweden endured frosty resilience issues,
while Tanzania experienced issues of warmth resistance and sporadic El Niño
cycles. The two areas encountered a noteworthy regular dry season. In these cases,
examine demonstrated that fruitful administration rehearses fit for buffering and
moderating environmental change frameworks were those that were by and large
biologically unpredictable and wild assortments coordinated into the farming
framework and the fleeting and spatial decent variety of the way of life (Tengö &
Belfrage, 2004).
Managing the numerous obstructions to compelling adjustment requires an
exhaustive and dynamic strategy approach that envelops a scope of scales and
issues, for instance, from the comprehension of ranchers to change the hazard
profiles to build up proficient markets that encourage reaction procedures. Science
should likewise adjust. Multidisciplinary issues require multidisciplinary
arrangements, H. Concentrate on incorporated and non-disciplinary science and
reinforce the interface with chiefs. A key component of this approach is the usage
of adjustment appraisal structures which are significant, powerful and simple to
work by all partners, experts, government officials and researchers (Howden et al.,
2007).
2.7.1 Monitoring and Management of Agriculture with Remote Sensing
The inborn properties of agriculture makes remote sensing a perfect skill for
observing and administration (Chen et al., 2004). These attributes include: (a)
farming exercises are by and large done in expansive spatial areas, which
influences the regular field to review or evaluation tedious and normally costly; (b)
the agrarian generation per unit isn't so huge contrasted with different ventures; (c)
26
Most yields are yearly herbs with various development and improvement organizes
in various seasons, which implies that horticultural exercises have clear
phonological rhythms and the intra-yearly change can be extremely extraordinary;
(d) Agriculture is unequivocally influenced by human exercises and administration
where opportune and exact observing data is required. These inborn qualities of
agribusiness require novel methods for observing plant development and rural
generation (Chen et al., 2008).
Remote sensing innovation meets these prerequisites by its speed, precision,
economy, timing, dynamic and redundant observing limit. Remote detecting
innovation has been connected in agribusiness widely since its beginning time in
the 1960s. Presently a few worldwide and national operational frameworks of
observing agriculture with remote sensing has been worked. The quantity of
comparable operational frameworks at provincial scale is much more. These
frameworks give auspicious and significant data to agrarian generation,
administration and arrangement making. Then again, the requests emerging from
the applications in farming divisions have likewise upgraded the advance and
development in remote detecting innovation. The primary uses of remote detecting
in agribusiness administration and observing include: trim recognizable proof and
cropland mapping, edit development checking and yield estimation/forecast,
reversal of key biophysical, biochemical and natural parameters, trim harm/debacle
observing, accuracy cultivating, and so on (Chen et al., 2008).
2.8 RESILIENCE OF CROPS AND CLIMATE
Resilience is characterized as the affinity of a framework to hold its
hierarchical arrangement and efficiency subsequent an irritation (Holling, 1973)
.Subsequently, a versatile agro ecosystem will keep on providing an imperative
administration, for example, nourishment generation if tested by extreme dry
season or by a substantial diminishment in precipitation. In agrarian frameworks,
crop biodiversity may give the connection amongst stress and flexibility on the
grounds that a decent variety of life forms is required for biological systems to
work and give administrations (Heal, 2000).
27
Acknowledgment that climate change could have negative results for farming
creation wants to incorporate strength with horticultural frameworks. One
levelheaded and financially savvy strategy might be the execution of expanded
horticultural harvest broadening. Yield broadening can enhance strength in an
assortment of routes: by inducing a more noteworthy capacity to stifle bother flare-
ups and hose pathogen transmission, which may intensify under future atmosphere
situations, and in addition by buffering crop generation from the impacts of more
noteworthy atmosphere fluctuation and extraordinary occasions. Such advantages
point toward the conspicuous benefit of embracing crop enhancement to enhance
versatility, yet selection has been moderate (Lobell et al., 2008).
Unmistakably farmers are looked with expanding worry from climate change
and that the expanded execution of enhanced rural frameworks can be a beneficial
approach to incorporate versatility with agriculture frameworks. The difficulties for
the expanding reception of broadened agrarian administration techniques are both
logically and politically arranged. In the logical field, the selection of expanded
cultivating frameworks could be fortified if agriculturists could have a superior
thought of how to improve an enhanced structure to augment generation and
benefits. Reap and scene reenactment models that can display a progression of
atmosphere situations and scene demonstrating with agriculture gainfulness
situations would enable agriculturists to discover ideal techniques to keep up
generation and benefit. Partner based participatory research would likewise be
extremely valuable as the specialists could display techniques that appear to be
conceivable to agriculturists (Fan & Pandya-Lorch, 2012).
In agriculture frameworks, crop biodiversity may give the connection amongst
stress and strength in light of the fact that a decent variety of creatures is required
for biological systems to work and give administrations (Heal, 2000). Evacuating
entire utilitarian gatherings of species or expelling whole trophic levels can make
biological systems move from a coveted to less-wanted state, influencing their
ability to produce environment administrations (Folke et al., 2004). This impact
features the likelihood that rural frameworks as of now might be in a less-wanted
state for the proceeded with conveyance of biological community administrations.
28
CHAPTER 3
MATERIALS AND METHODS
Agriculture remains one of the main human activities and is being affected by
changing climate. In this context, policy makers need updated information on the
changing climate and its impacts on agricultural produce. Thus, there is need to
acquired regular and up-to-date spatial information about important climatic
variables, their influence crop producing areas to improve decision making in this
regard. Following material and methods were used to develop means to provide the
requisite information.
3.1 DATA USED
Following data have been used to study the impact of changing climate on crop
productions systems of Punjab, Pakistan:
3.1.1 Moderate Resolution Imaging Spectro-Radiometer - Normalized
Difference Vegetation Index
MODIS instrument offers new potential regional crop mapping by giving a
close every day worldwide scope of remote sensing, transitional resolution (250 m)
information since February 2000 at no cost to the end client (Justice and
Townshend, 2002). MODIS information empowers unmistakable multi-temporal
VI signs of particular yields to be identified at the 250 m pixel level.
MOD13Q1 NDVI product of MODIS sensor of TERRA satellite at 250 m
resolution has been used for this research. A 16-date time cycle of MODIS 250 m
NDVI data (MOD13Q1,) across 2000-2014 was downloaded and stacked for
District Punjab. For this purpose, 334 images of NDVI (Figure 3-1) were extracted
from those HDF files which were re-projected in GCS-WGS-84 projection system
and batch processing was used to subset the study area. A solitary 250 m pixel
found totally inside each field limits was chosen to speak to each site. A solitary
pixel was utilized instead of a pixel window (e.g., 2×2 pixels) to dispense with
blended edge pixels made out of different LULC sorts from being incorporated into
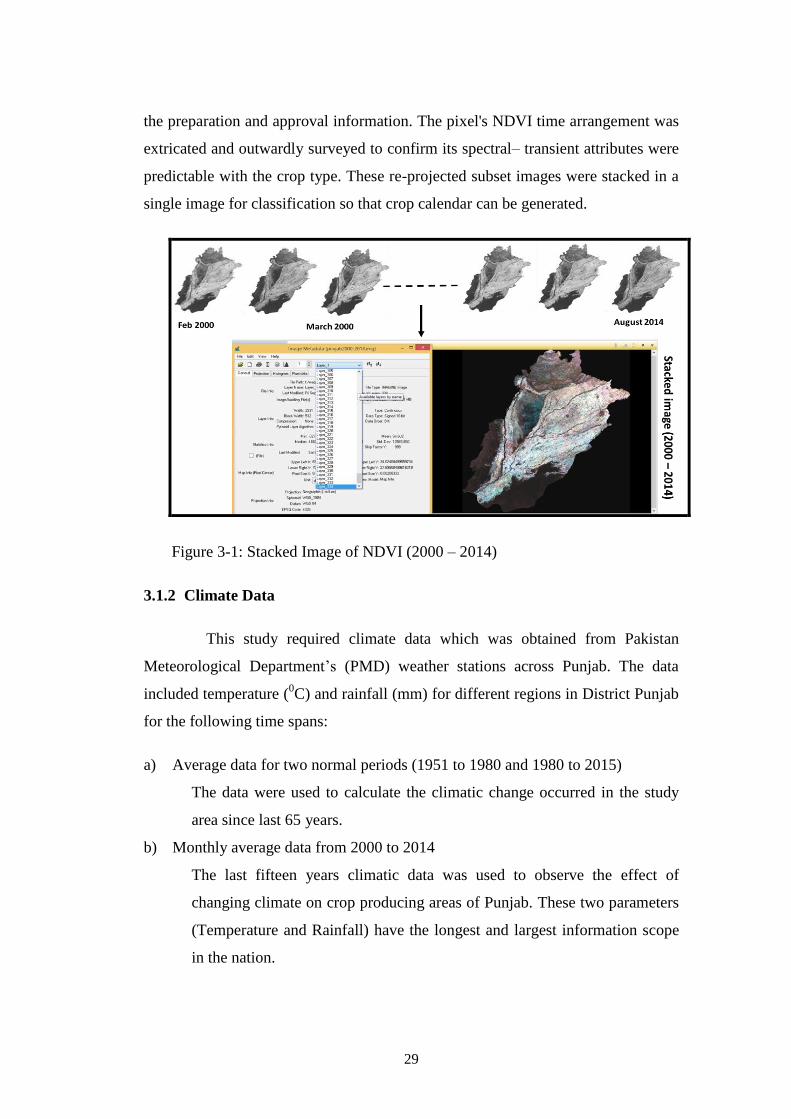
29
the preparation and approval information. The pixel's NDVI time arrangement was
extricated and outwardly surveyed to confirm its spectral– transient attributes were
predictable with the crop type. These re-projected subset images were stacked in a
single image for classification so that crop calendar can be generated.
Figure 3-1: Stacked Image of NDVI (2000 – 2014)
3.1.2 Climate Data
This study required climate data which was obtained from Pakistan
Meteorological Department’s (PMD) weather stations across Punjab. The data
included temperature (0C) and rainfall (mm) for different regions in District Punjab
for the following time spans:
a) Average data for two normal periods (1951 to 1980 and 1980 to 2015)
The data were used to calculate the climatic change occurred in the study
area since last 65 years.
b) Monthly average data from 2000 to 2014
The last fifteen years climatic data was used to observe the effect of
changing climate on crop producing areas of Punjab. These two parameters
(Temperature and Rainfall) have the longest and largest information scope
in the nation.
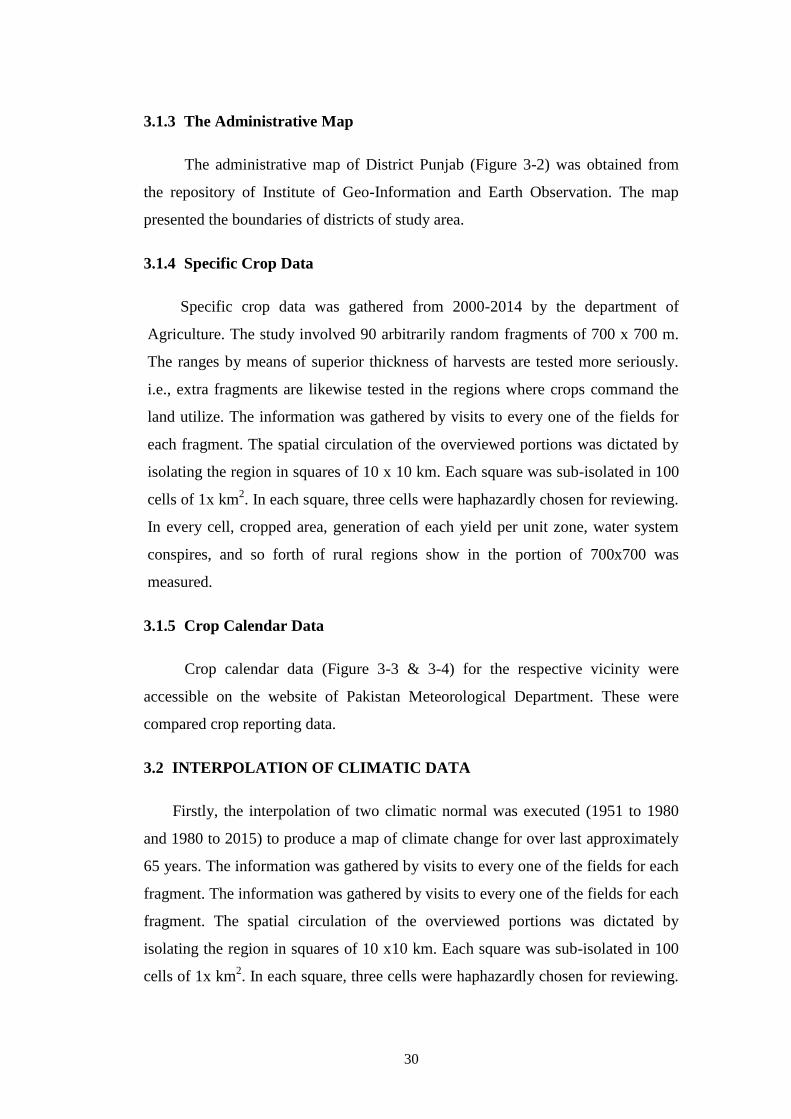
30
3.1.3 The Administrative Map
The administrative map of District Punjab (Figure 3-2) was obtained from
the repository of Institute of Geo-Information and Earth Observation. The map
presented the boundaries of districts of study area.
3.1.4 Specific Crop Data
Specific crop data was gathered from 2000-2014 by the department of
Agriculture. The study involved 90 arbitrarily random fragments of 700 x 700 m.
The ranges by means of superior thickness of harvests are tested more seriously.
i.e., extra fragments are likewise tested in the regions where crops command the
land utilize. The information was gathered by visits to every one of the fields for
each fragment. The spatial circulation of the overviewed portions was dictated by
isolating the region in squares of 10 x 10 km. Each square was sub-isolated in 100
cells of 1x km2. In each square, three cells were haphazardly chosen for reviewing.
In every cell, cropped area, generation of each yield per unit zone, water system
conspires, and so forth of rural regions show in the portion of 700x700 was
measured.
3.1.5 Crop Calendar Data
Crop calendar data (Figure 3-3 & 3-4) for the respective vicinity were
accessible on the website of Pakistan Meteorological Department. These were
compared crop reporting data.
3.2 INTERPOLATION OF CLIMATIC DATA
Firstly, the interpolation of two climatic normal was executed (1951 to 1980
and 1980 to 2015) to produce a map of climate change for over last approximately
65 years. The information was gathered by visits to every one of the fields for each
fragment. The information was gathered by visits to every one of the fields for each
fragment. The spatial circulation of the overviewed portions was dictated by
isolating the region in squares of 10 x10 km. Each square was sub-isolated in 100
cells of 1x km2. In each square, three cells were haphazardly chosen for reviewing.
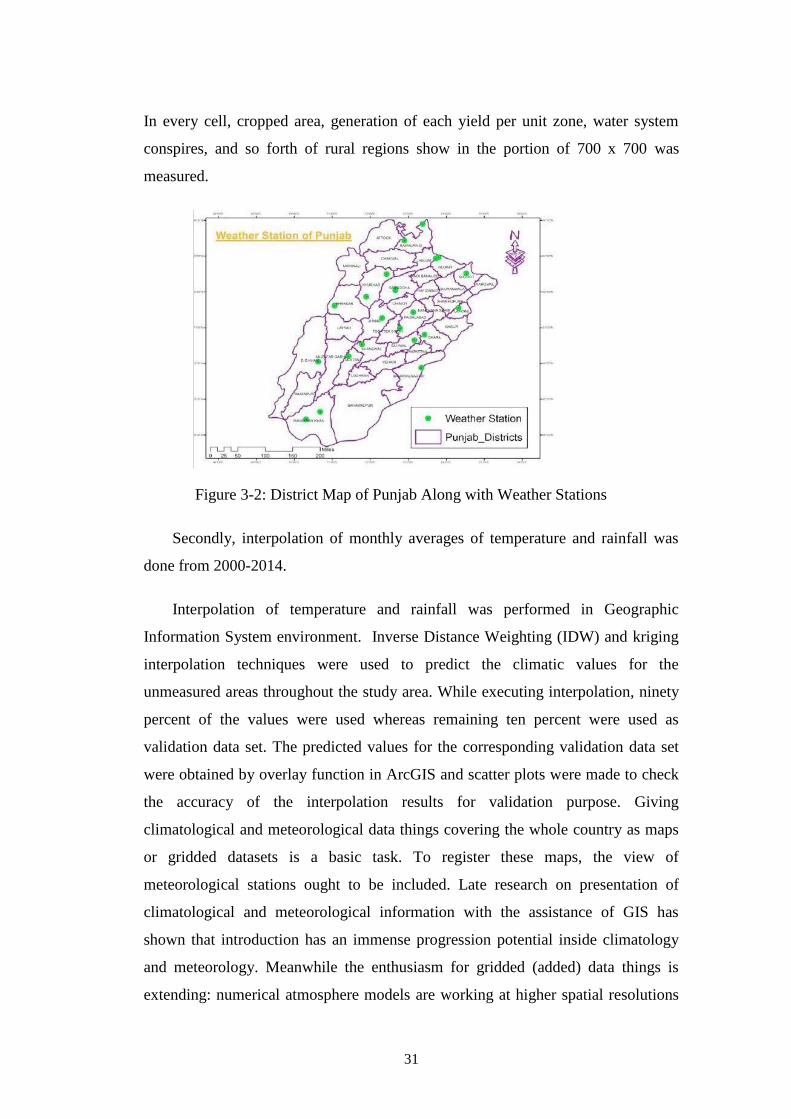
31
In every cell, cropped area, generation of each yield per unit zone, water system
conspires, and so forth of rural regions show in the portion of 700 x 700 was
measured.
Figure 3-2: District Map of Punjab Along with Weather Stations
Secondly, interpolation of monthly averages of temperature and rainfall was
done from 2000-2014.
Interpolation of temperature and rainfall was performed in Geographic
Information System environment. Inverse Distance Weighting (IDW) and kriging
interpolation techniques were used to predict the climatic values for the
unmeasured areas throughout the study area. While executing interpolation, ninety
percent of the values were used whereas remaining ten percent were used as
validation data set. The predicted values for the corresponding validation data set
were obtained by overlay function in ArcGIS and scatter plots were made to check
the accuracy of the interpolation results for validation purpose. Giving
climatological and meteorological data things covering the whole country as maps
or gridded datasets is a basic task. To register these maps, the view of
meteorological stations ought to be included. Late research on presentation of
climatological and meteorological information with the assistance of GIS has
shown that introduction has an immense progression potential inside climatology
and meteorology. Meanwhile the enthusiasm for gridded (added) data things is
extending: numerical atmosphere models are working at higher spatial resolutions
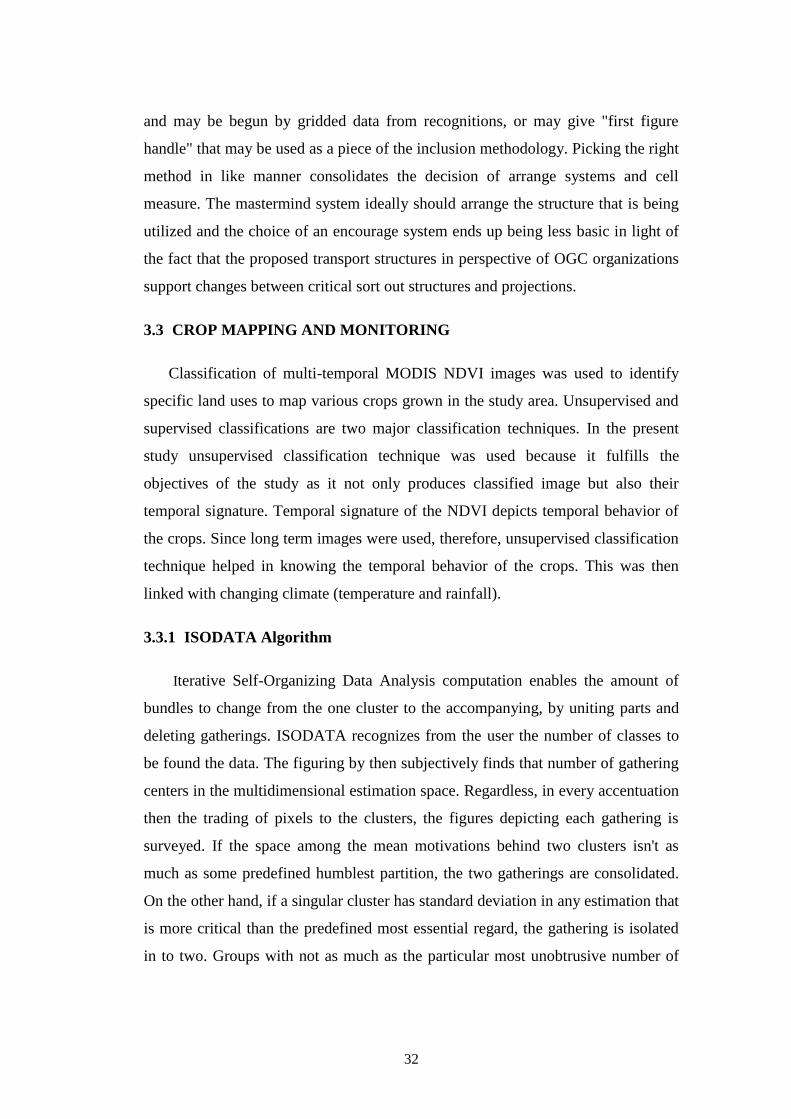
32
and may be begun by gridded data from recognitions, or may give "first figure
handle" that may be used as a piece of the inclusion methodology. Picking the right
method in like manner consolidates the decision of arrange systems and cell
measure. The mastermind system ideally should arrange the structure that is being
utilized and the choice of an encourage system ends up being less basic in light of
the fact that the proposed transport structures in perspective of OGC organizations
support changes between critical sort out structures and projections.
3.3 CROP MAPPING AND MONITORING
Classification of multi-temporal MODIS NDVI images was used to identify
specific land uses to map various crops grown in the study area. Unsupervised and
supervised classifications are two major classification techniques. In the present
study unsupervised classification technique was used because it fulfills the
objectives of the study as it not only produces classified image but also their
temporal signature. Temporal signature of the NDVI depicts temporal behavior of
the crops. Since long term images were used, therefore, unsupervised classification
technique helped in knowing the temporal behavior of the crops. This was then
linked with changing climate (temperature and rainfall).
3.3.1 ISODATA Algorithm
Iterative Self-Organizing Data Analysis computation enables the amount of
bundles to change from the one cluster to the accompanying, by uniting parts and
deleting gatherings. ISODATA recognizes from the user the number of classes to
be found the data. The figuring by then subjectively finds that number of gathering
centers in the multidimensional estimation space. Regardless, in every accentuation
then the trading of pixels to the clusters, the figures depicting each gathering is
surveyed. If the space among the mean motivations behind two clusters isn't as
much as some predefined humblest partition, the two gatherings are consolidated.
On the other hand, if a singular cluster has standard deviation in any estimation that
is more critical than the predefined most essential regard, the gathering is isolated
in to two. Groups with not as much as the particular most unobtrusive number of
33
pixels are cleared. Groups with not as much as the particular most unobtrusive
number of pixels are cleared.
Figure 3-3: General Crop Calendar for field crops of Pakistan
Figure 3-4: General Crop Calendar for field crops in Districts of Punjab
Finally, all pixels are then re-arranged into the balanced course of action of
gatherings, and the change rehashes, until either there is no basic alteration in the
group experiences or some most outrageous number of emphases is come to. It
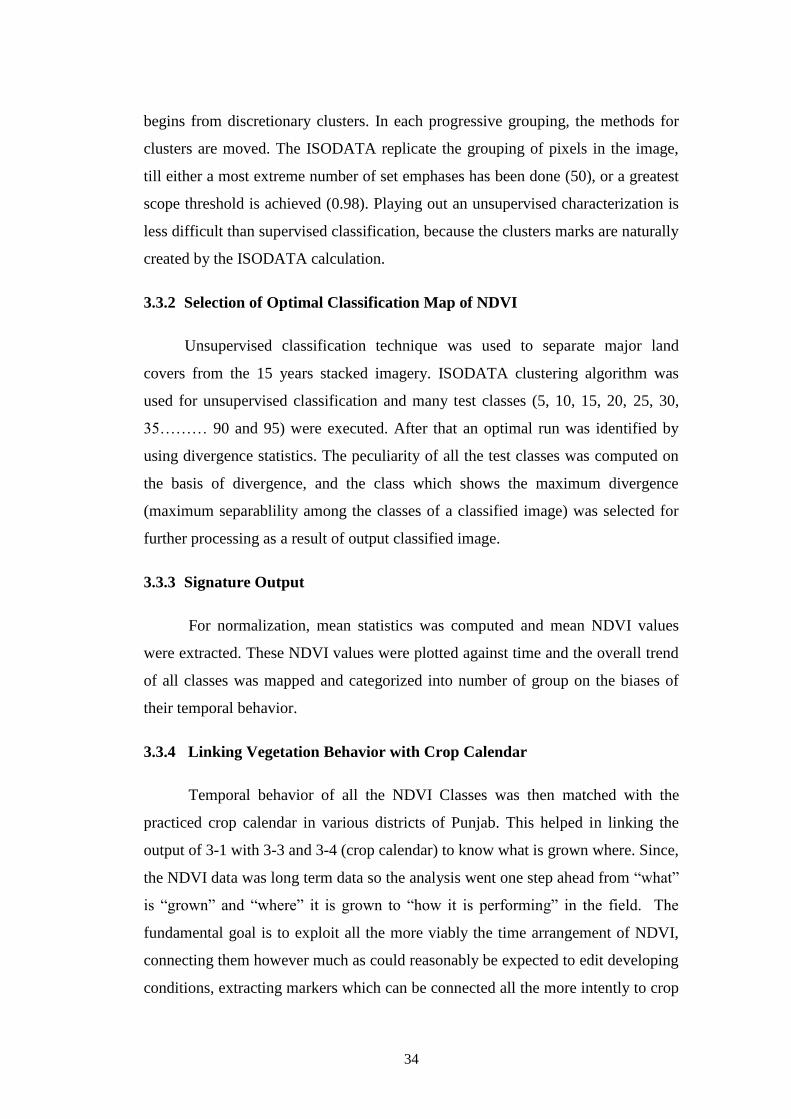
34
begins from discretionary clusters. In each progressive grouping, the methods for
clusters are moved. The ISODATA replicate the grouping of pixels in the image,
till either a most extreme number of set emphases has been done (50), or a greatest
scope threshold is achieved (0.98). Playing out an unsupervised characterization is
less difficult than supervised classification, because the clusters marks are naturally
created by the ISODATA calculation.
3.3.2 Selection of Optimal Classification Map of NDVI
Unsupervised classification technique was used to separate major land
covers from the 15 years stacked imagery. ISODATA clustering algorithm was
used for unsupervised classification and many test classes (5, 10, 15, 20, 25, 30,
35……… 90 and 95) were executed. After that an optimal run was identified by
using divergence statistics. The peculiarity of all the test classes was computed on
the basis of divergence, and the class which shows the maximum divergence
(maximum separablility among the classes of a classified image) was selected for
further processing as a result of output classified image.
3.3.3 Signature Output
For normalization, mean statistics was computed and mean NDVI values
were extracted. These NDVI values were plotted against time and the overall trend
of all classes was mapped and categorized into number of group on the biases of
their temporal behavior.
3.3.4 Linking Vegetation Behavior with Crop Calendar
Temporal behavior of all the NDVI Classes was then matched with the
practiced crop calendar in various districts of Punjab. This helped in linking the
output of 3-1 with 3-3 and 3-4 (crop calendar) to know what is grown where. Since,
the NDVI data was long term data so the analysis went one step ahead from “what”
is “grown” and “where” it is grown to “how it is performing” in the field. The
fundamental goal is to exploit all the more viably the time arrangement of NDVI,
connecting them however much as could reasonably be expected to edit developing
conditions, extracting markers which can be connected all the more intently to crop
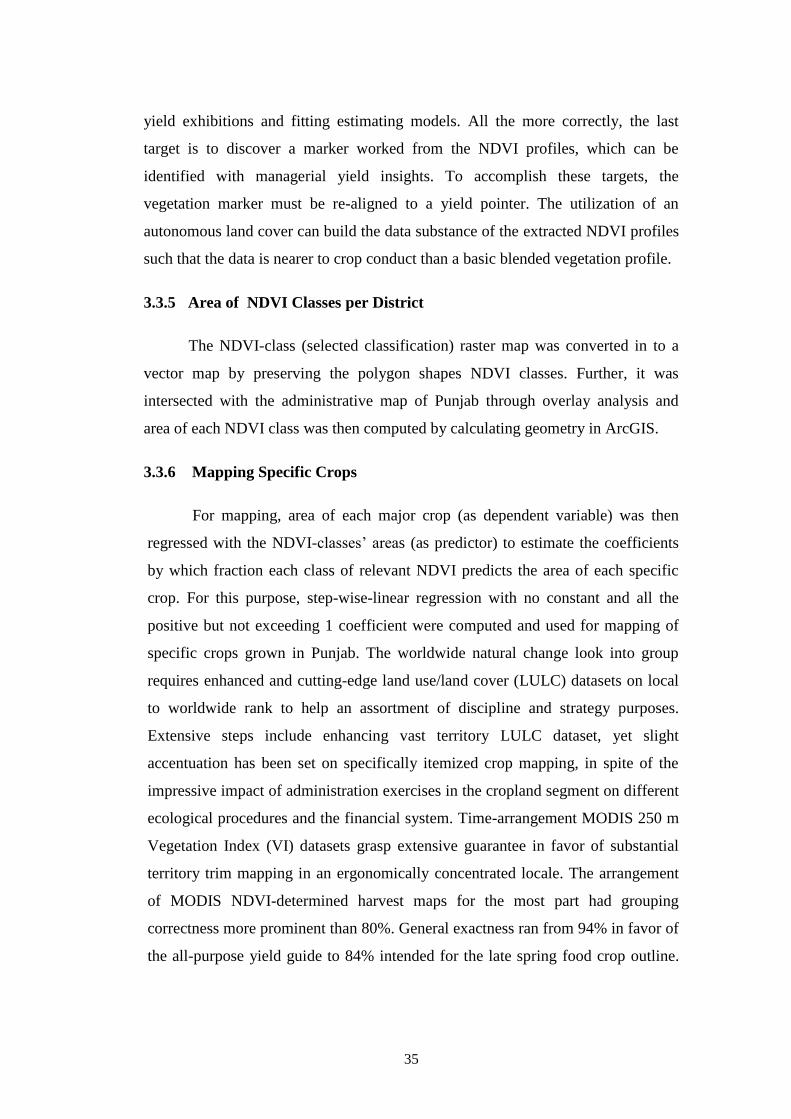
35
yield exhibitions and fitting estimating models. All the more correctly, the last
target is to discover a marker worked from the NDVI profiles, which can be
identified with managerial yield insights. To accomplish these targets, the
vegetation marker must be re-aligned to a yield pointer. The utilization of an
autonomous land cover can build the data substance of the extracted NDVI profiles
such that the data is nearer to crop conduct than a basic blended vegetation profile.
3.3.5 Area of NDVI Classes per District
The NDVI-class (selected classification) raster map was converted in to a
vector map by preserving the polygon shapes NDVI classes. Further, it was
intersected with the administrative map of Punjab through overlay analysis and
area of each NDVI class was then computed by calculating geometry in ArcGIS.
3.3.6 Mapping Specific Crops
For mapping, area of each major crop (as dependent variable) was then
regressed with the NDVI-classes’ areas (as predictor) to estimate the coefficients
by which fraction each class of relevant NDVI predicts the area of each specific
crop. For this purpose, step-wise-linear regression with no constant and all the
positive but not exceeding 1 coefficient were computed and used for mapping of
specific crops grown in Punjab. The worldwide natural change look into group
requires enhanced and cutting-edge land use/land cover (LULC) datasets on local
to worldwide rank to help an assortment of discipline and strategy purposes.
Extensive steps include enhancing vast territory LULC dataset, yet slight
accentuation has been set on specifically itemized crop mapping, in spite of the
impressive impact of administration exercises in the cropland segment on different
ecological procedures and the financial system. Time-arrangement MODIS 250 m
Vegetation Index (VI) datasets grasp extensive guarantee in favor of substantial
territory trim mapping in an ergonomically concentrated locale. The arrangement
of MODIS NDVI-determined harvest maps for the most part had grouping
correctness more prominent than 80%. General exactness ran from 94% in favor of
the all-purpose yield guide to 84% intended for the late spring food crop outline.
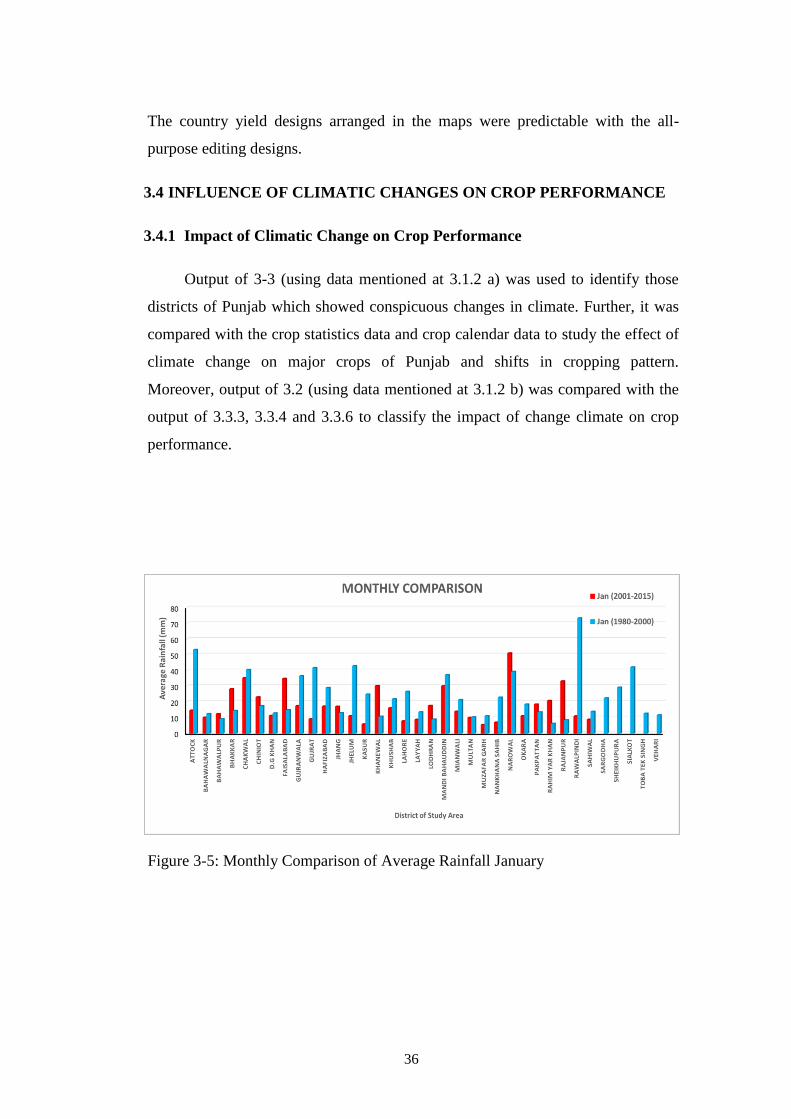
36
The country yield designs arranged in the maps were predictable with the all-
purpose editing designs.
3.4 INFLUENCE OF CLIMATIC CHANGES ON CROP PERFORMANCE
3.4.1 Impact of Climatic Change on Crop Performance
Output of 3-3 (using data mentioned at 3.1.2 a) was used to identify those
districts of Punjab which showed conspicuous changes in climate. Further, it was
compared with the crop statistics data and crop calendar data to study the effect of
climate change on major crops of Punjab and shifts in cropping pattern.
Moreover, output of 3.2 (using data mentioned at 3.1.2 b) was compared with the
output of 3.3.3, 3.3.4 and 3.3.6 to classify the impact of change climate on crop
performance. Output of 3.3.3, 3.3.4 and 3.3.6 to identify the impact of change
Figure 3-5: Monthly Comparison of Average Rainfall January
37
Figure 3-6: Monthly Comparison of Average Rainfall February
Figure 3-7: Monthly Comparison of Average Rainfall March
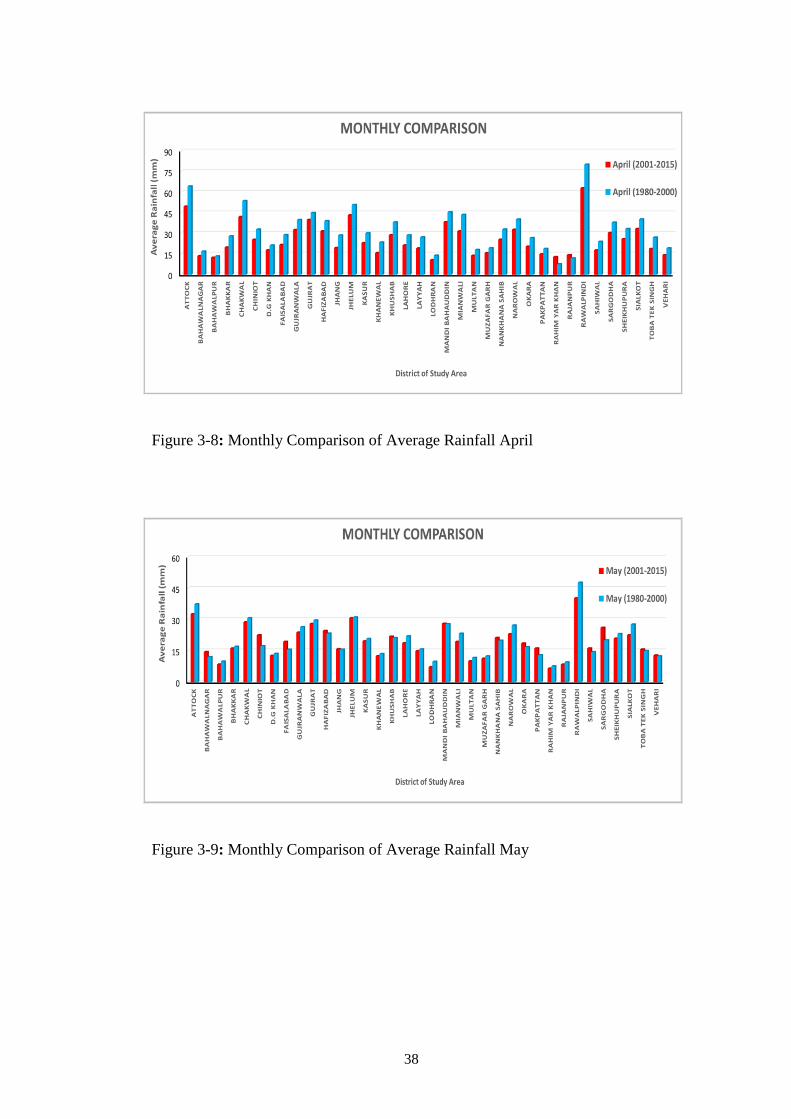
38
Figure 3-8: Monthly Comparison of Average Rainfall April
Figure 3-9: Monthly Comparison of Average Rainfall May
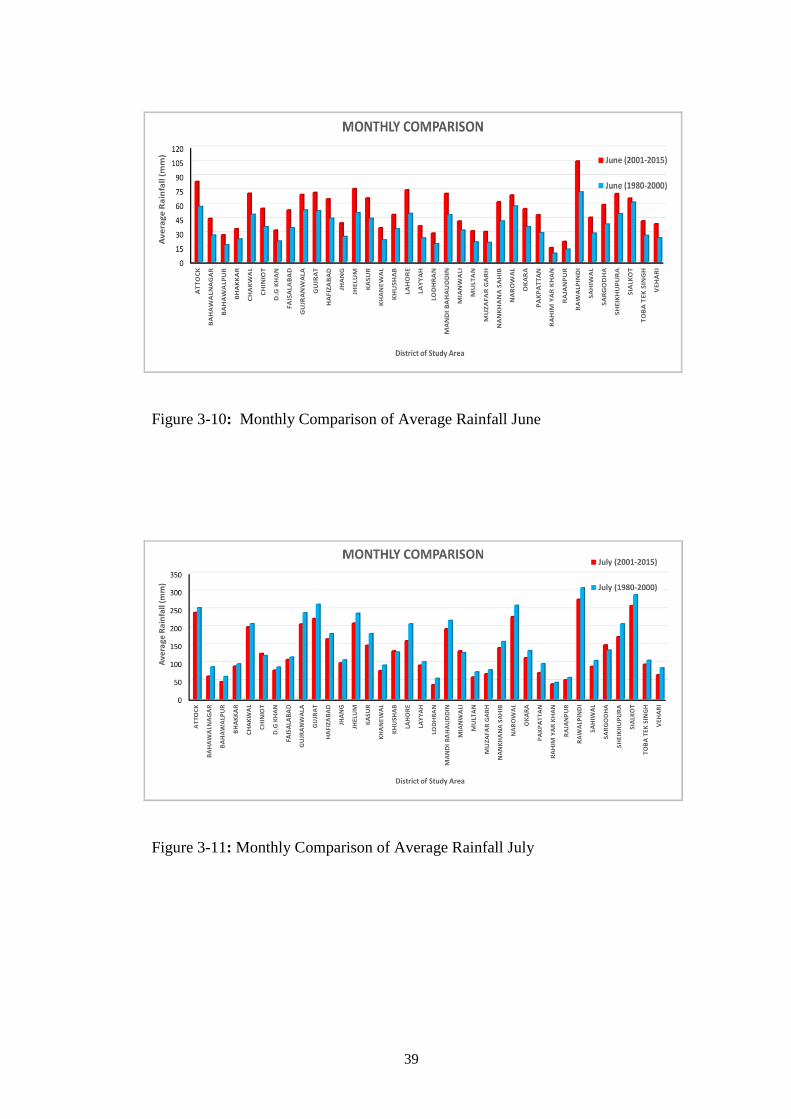
39
Figure 3-10: Monthly Comparison of Average Rainfall June
Figure 3-11: Monthly Comparison of Average Rainfall July
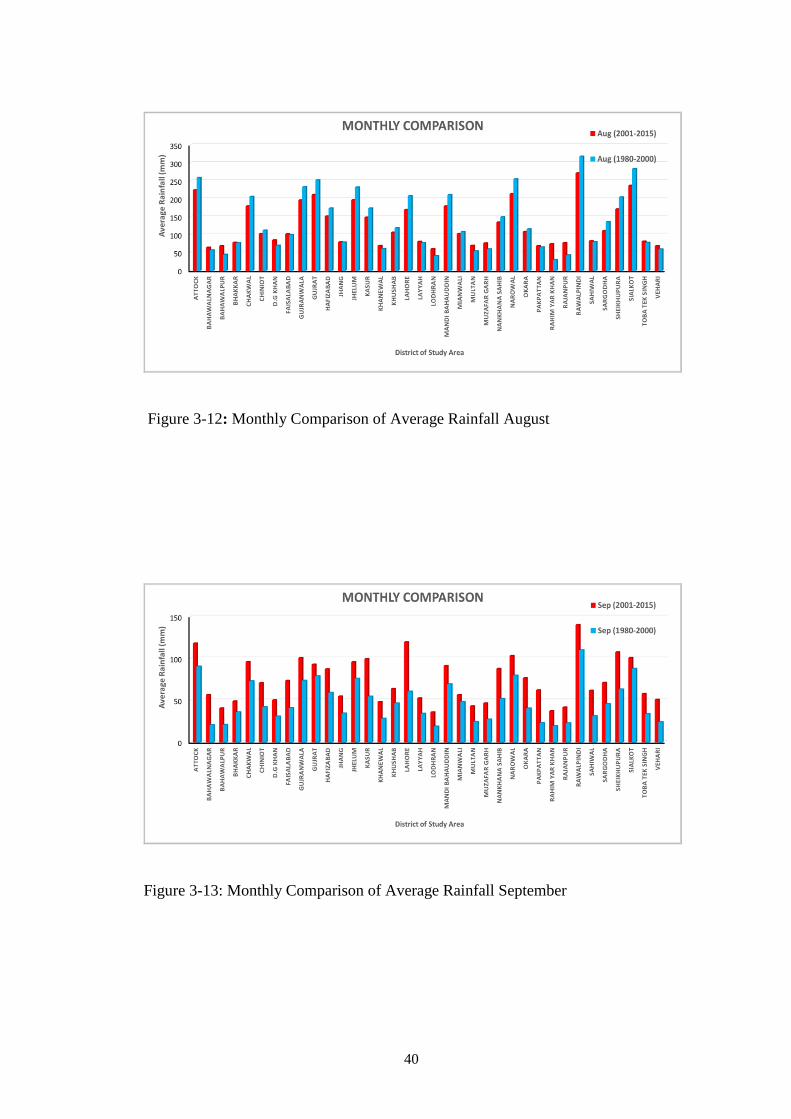
40
Figure 3-12: Monthly Comparison of Average Rainfall August
Figure 3-13: Monthly Comparison of Average Rainfall September
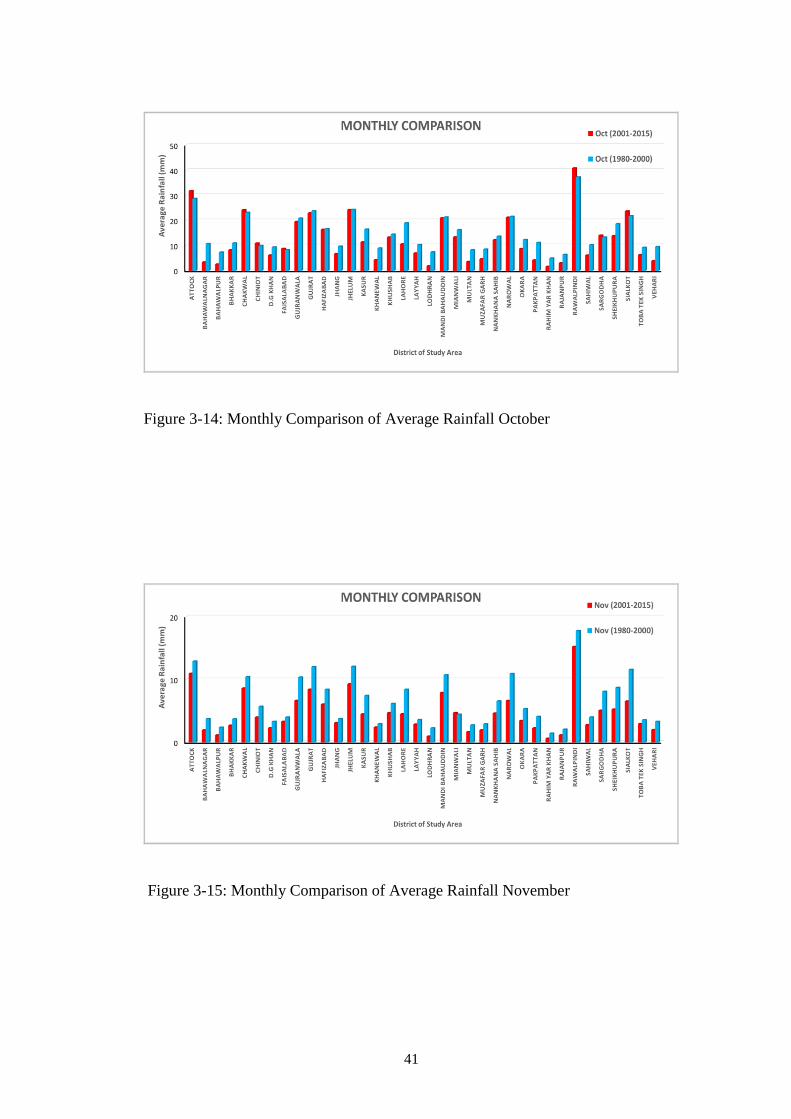
41
Figure 3-14: Monthly Comparison of Average Rainfall October
Figure 3-15: Monthly Comparison of Average Rainfall November
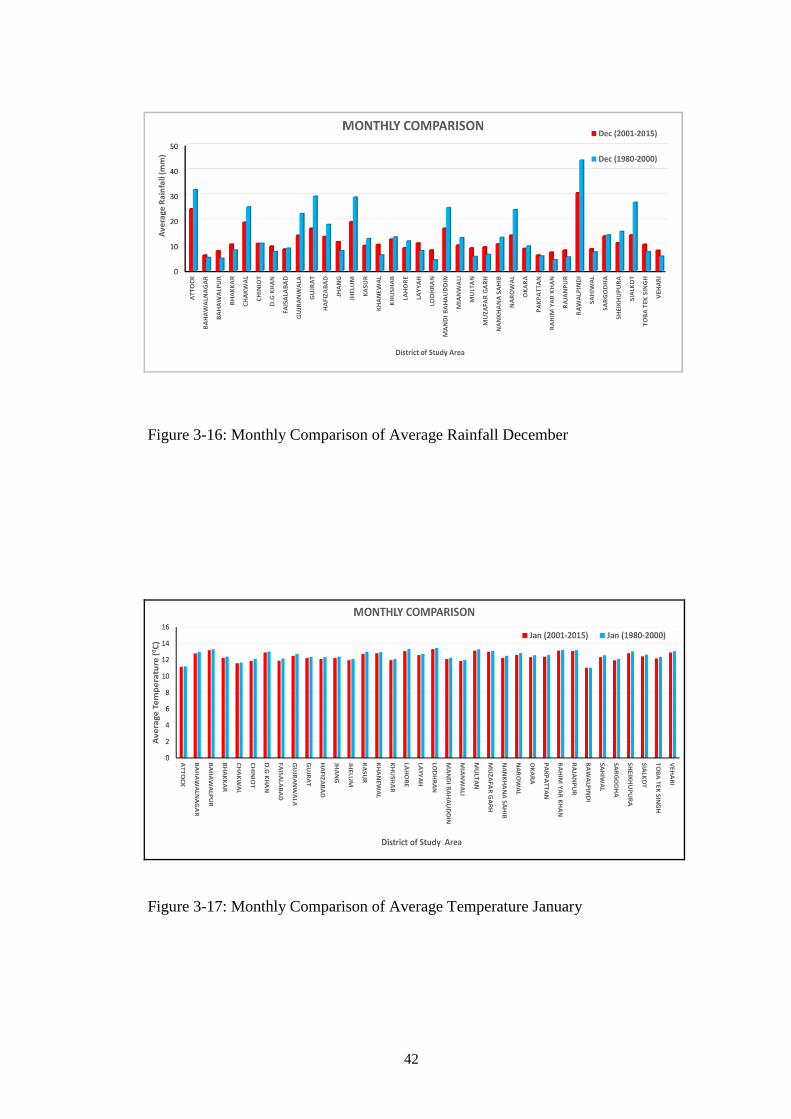
42
Figure 3-16: Monthly Comparison of Average Rainfall December
Figure 3-17: Monthly Comparison of Average Temperature January
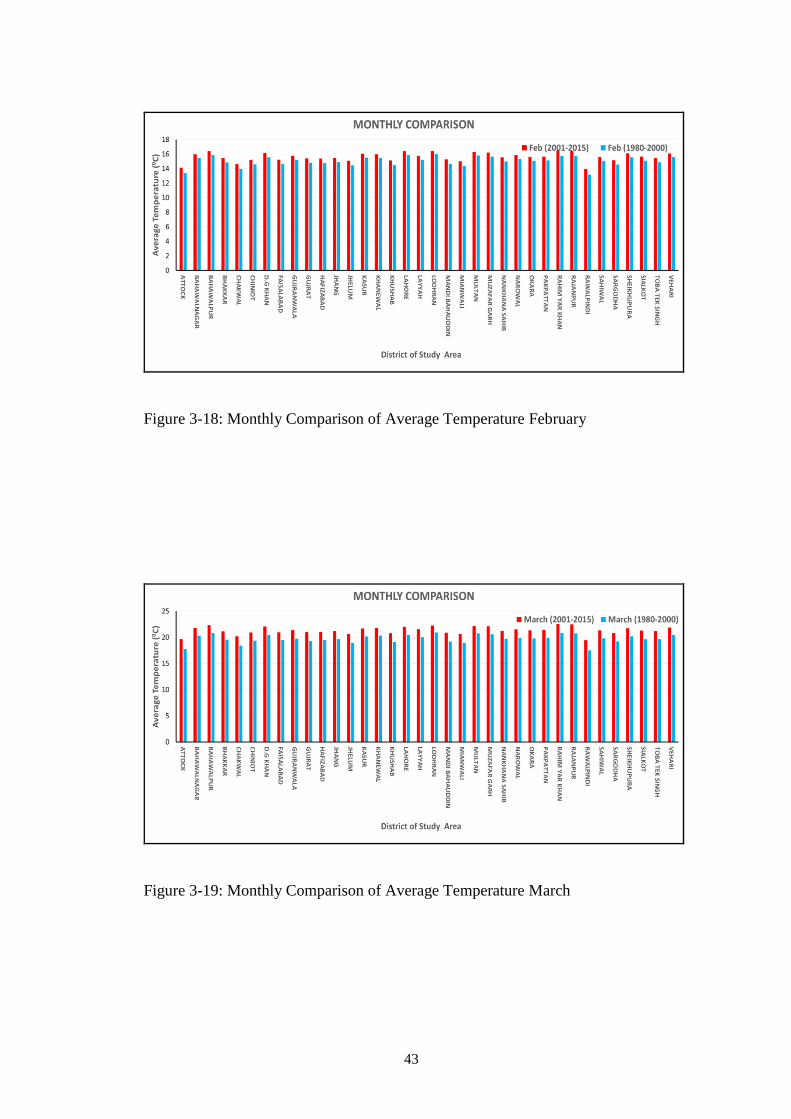
43
Figure 3-18: Monthly Comparison of Average Temperature February
Figure 3-19: Monthly Comparison of Average Temperature March
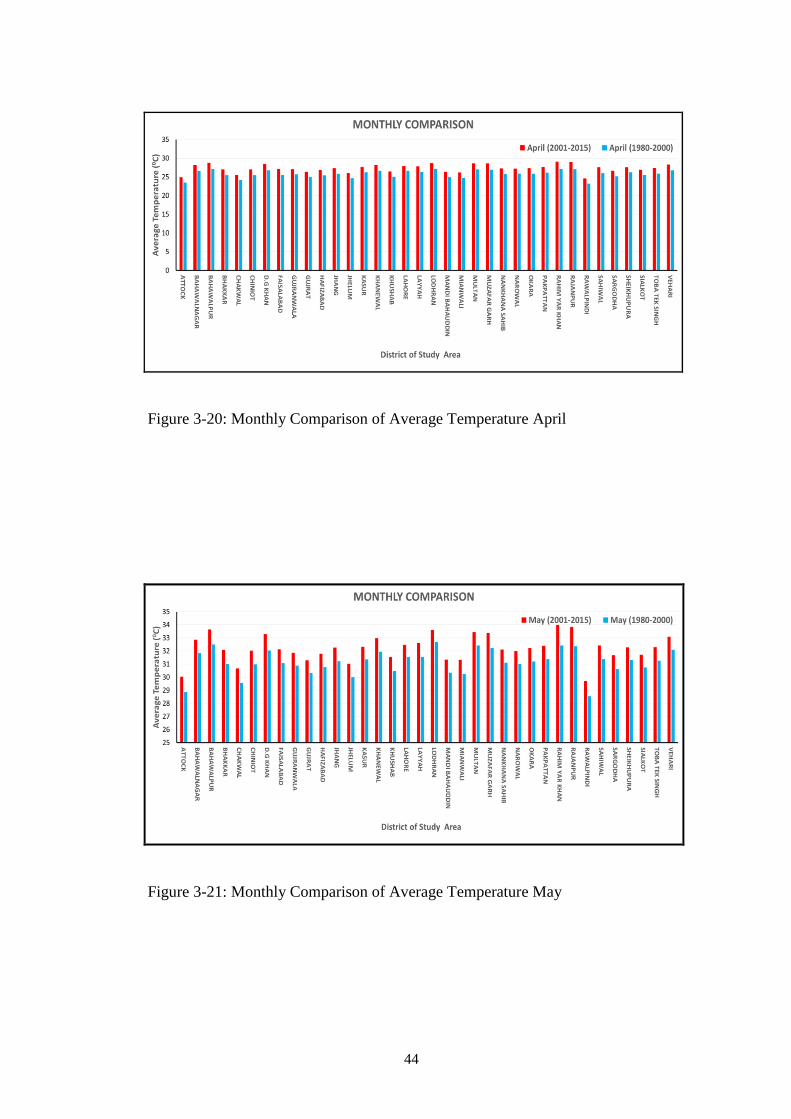
44
Figure 3-20: Monthly Comparison of Average Temperature April
Figure 3-21: Monthly Comparison of Average Temperature May
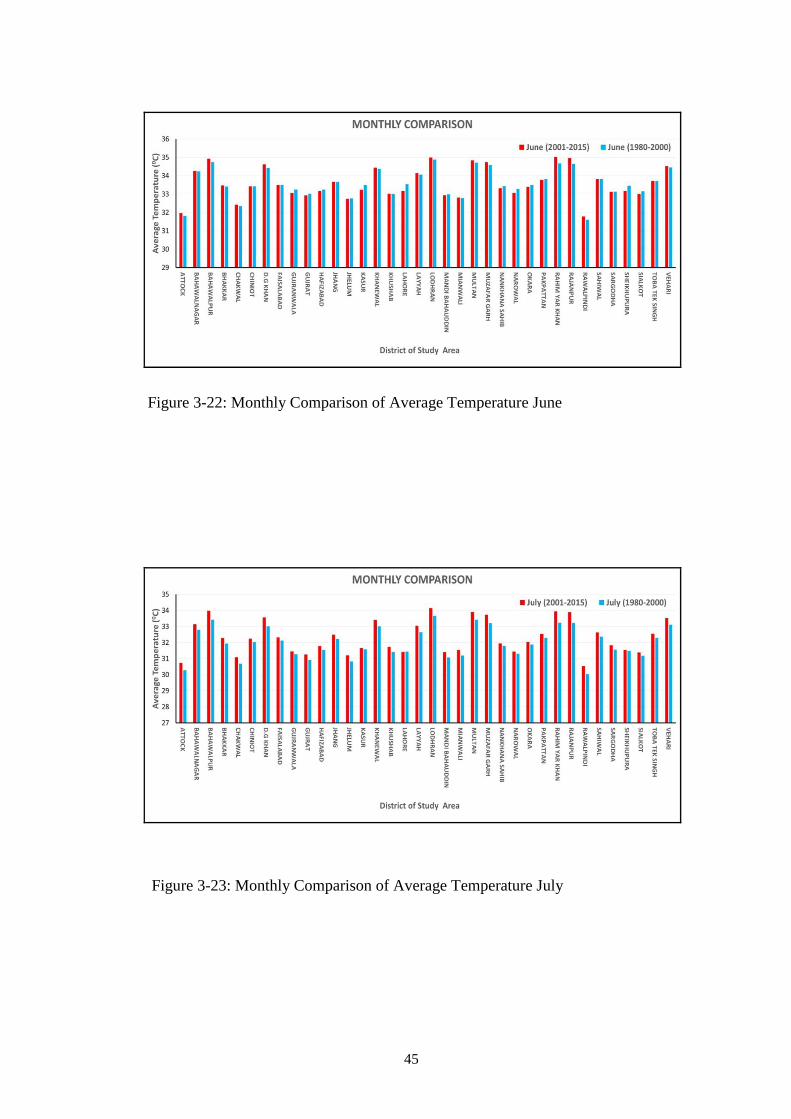
45
Figure 3-22: Monthly Comparison of Average Temperature June
Figure 3-23: Monthly Comparison of Average Temperature July
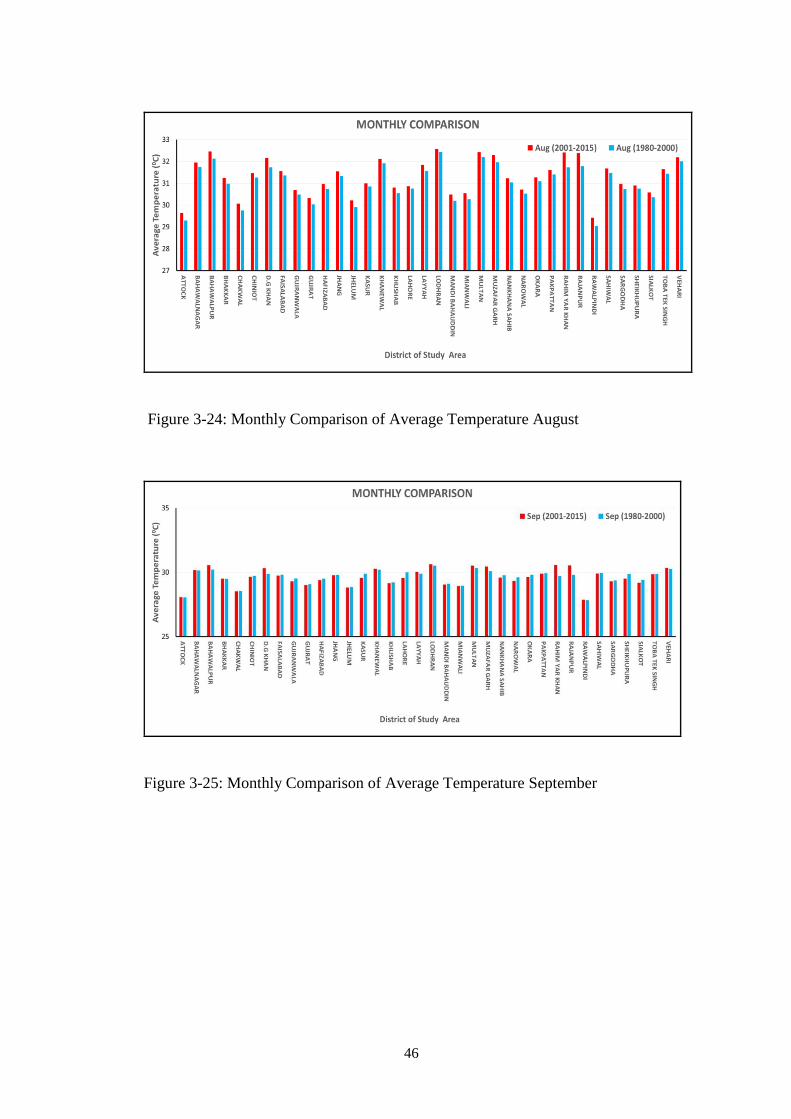
46
Figure 3-24: Monthly Comparison of Average Temperature August
Figure 3-25: Monthly Comparison of Average Temperature September
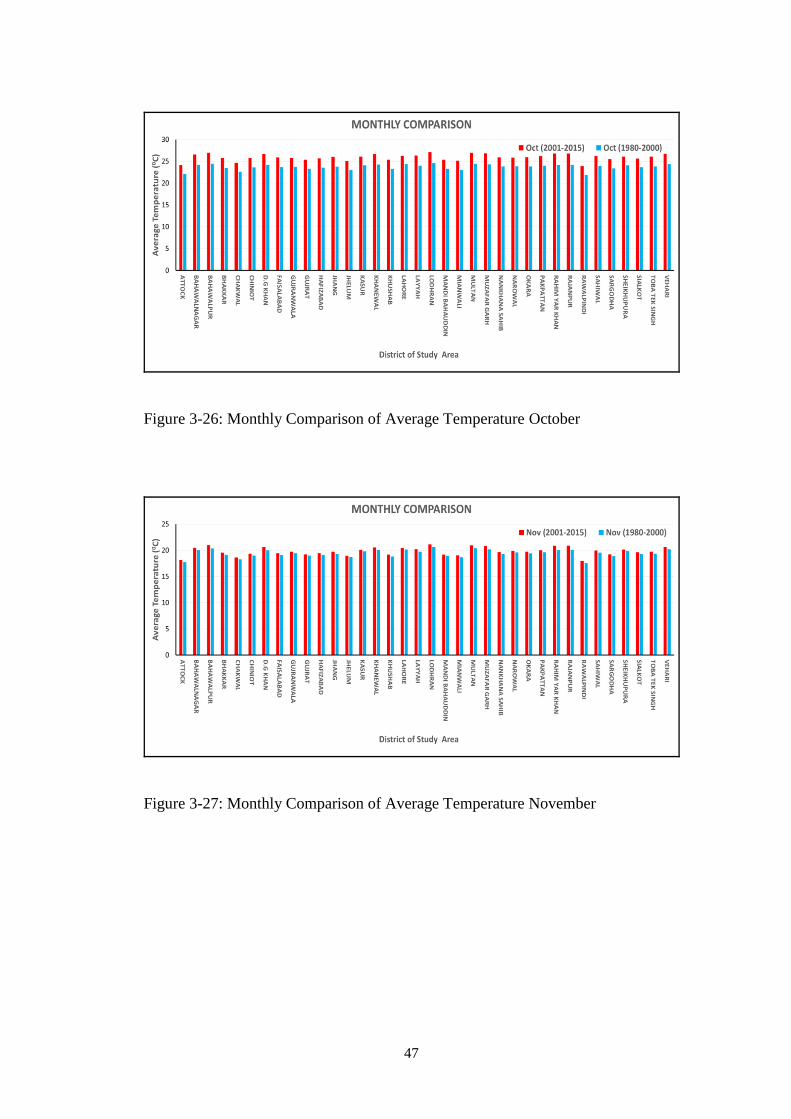
47
Figure 3-26: Monthly Comparison of Average Temperature October
Figure 3-27: Monthly Comparison of Average Temperature November
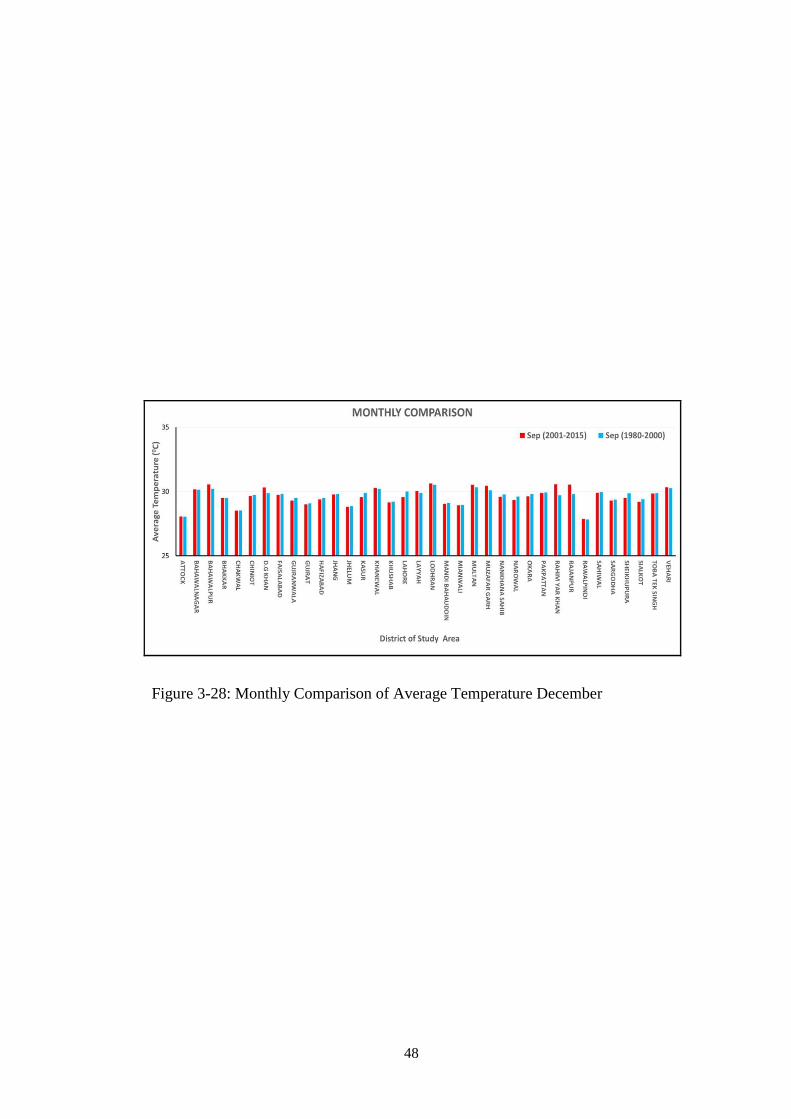
48
Figure 3-28: Monthly Comparison of Average Temperature December
49
CHAPTER 4
RESULTS AND DISCUSSION
4.1 CLIMATE CHANGE IN PUNJAB
Figures 4-1 to 4-6 show the climate change between the two normal time
spans i.e. 1951 to 1980 and 1980 to 2015. Figures 4-5 and 4-6 show the change in
rainfall and temperature respectively over various districts of Punjab.
Figure 4-1 shows the Average Rainfall in the period of first climate normal
(1951-80) showed that Rawalpindi (1073.686 mm), Attock (862.293 mm), Jhelum
(829.066 mm) and Gujrat (808.808 mm) were the wettest districts of Punjab.
Whereas, Rahimyar Khan (137.674 mm), Rajanpur (197.092 mm), Lodhran
(205.276 mm) and Bahawalpur (227.270 mm) were the driest districts of Punjab.
Average Rainfall in the period of second climate normal (1980-15) showed that
Rawalpindi (1024.626 mm), Lahore (960.177 mm), Gujrat (870.646 mm) and
Sheikhupura (827.209 mm) were the wettest districts of Punjab. Whereas,
Rahimyar Khan (125.099 mm), Rajanpur (171.937 mm), Lodhran (187.092 mm)
and Bahwalpur (190.781 mm) were the driest districts of Punjab.
Figure 4-3 shows the Average temperature in the period of first climate normal
(1951-80) showed that Lodhran (25.810 0C), Bahwalpur (25.437
0C), Multan
(25.386 0C) and Rahim Yar Khan (25.148
0C) were the hottest districts of Punjab.
Whereas, Rawalpindi (19.684 0C), Attock (21.780
0C), Jehlum (22.653
0C) and
Gujrat (22.934 0C) were the coldest districts of Punjab.
Figure 4-4 shows the Average temperature in the period of second climate
normal (1980-15) showed that Rahim Yar Khan (26.419 0C), Lodhran (26.199
0C),
Rajanpur (26.107 0C) and Bahwalpur (26.013
0C) were the hottest districts of
Punjab. Whereas, Rawalpindi (20.209 0C), Attock (21.754
0C), Sialkot (22.322
0C)
and Jehlum (22.454 0C) were the coldest districts of Punjab.
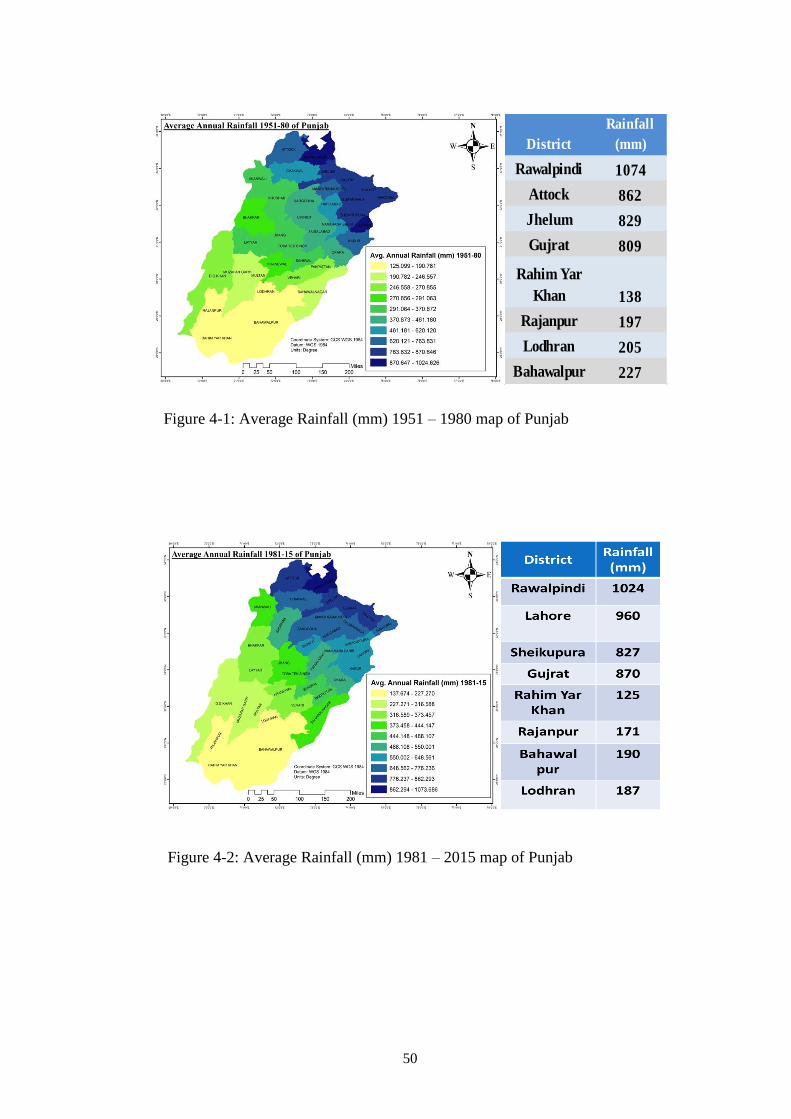
50
District
Rainfall
(mm)
Rawalpindi 1074
Attock 862
Jhelum 829
Gujrat 809
Rahim Yar
Khan 138
Rajanpur 197
Lodhran 205
Bahawalpur 227
Figure 4-1: Average Rainfall (mm) 1951 – 1980 map of Punjab
Figure 4-2: Average Rainfall (mm) 1981 – 2015 map of Punjab
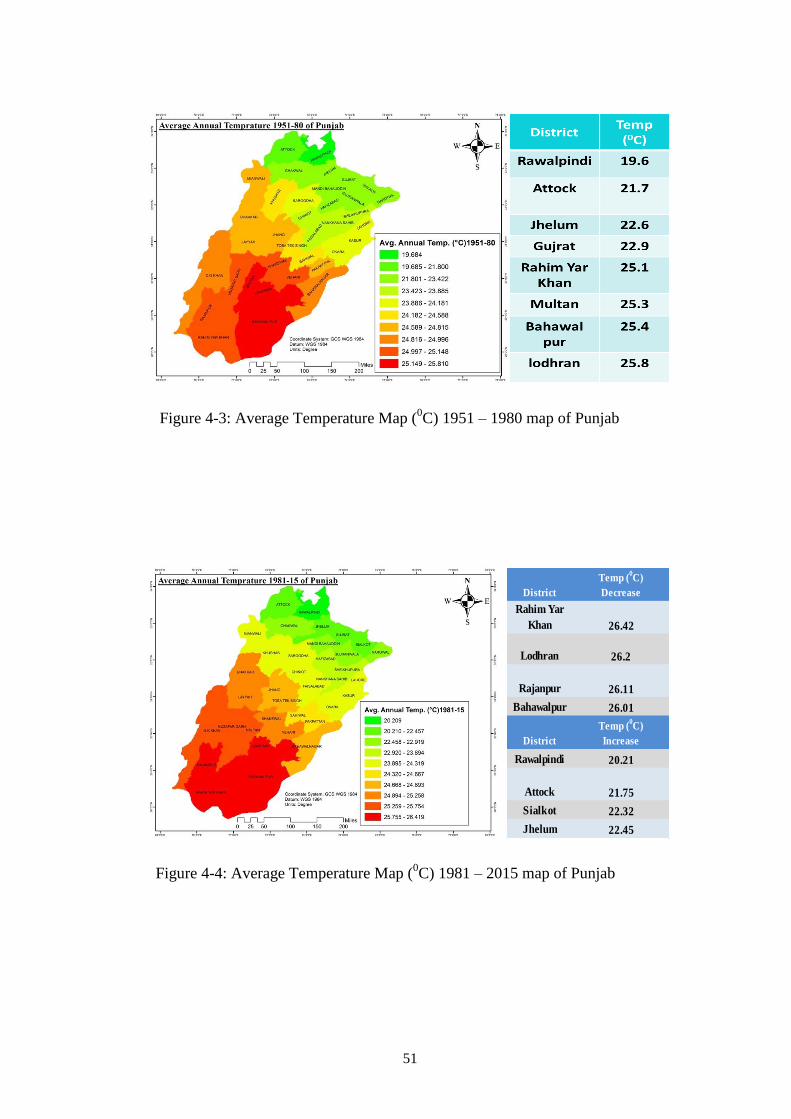
51
Figure 4-3: Average Temperature Map (0C) 1951 – 1980 map of Punjab
District
Temp (0C)
Decrease
Rahim Yar
Khan 26.42
Lodhran 26.2
Rajanpur 26.11
Bahawalpur 26.01
District
Temp (0C)
Increase
Rawalpindi 20.21
Attock 21.75
Sialkot 22.32
Jhelum 22.45
Figure 4-4: Average Temperature Map (0C) 1981 – 2015 map of Punjab
52
Figure 4-5 shows the Maximum increase in rainfall was observed in Lahore
(359.637 mm), Sheikhupura (178.647 mm), Kasur (132.967 mm) and Gujrat
(61.838 mm). Whereas, Sargodha (316.185 mm), Chiniot (230.778 mm),
Pakpattan (225.682 mm) and Bahwalnagar (205.086 mm) showed maximum
decrease in rainfall.
Figure 4-6 shows the Maximum increase in temperature was observed in
Rahim Yar Khan (1.271 0C), Rajanpur (0.987
0C), Faisalabad (0.600
0C), and
D.G.Khan (0.582 0C). Whereas, maximum decrease in temperature was observed
in Sialkot (0.8710C), Narowal (0.616
0C), Mianwali (0.610
0C), and Gujrat (0.477
0C).
4.2 IMAGE CLASSIFICATION
Unsupervised classification technique was used to separate major land
covers from the 15 years stacked imagery. ISODATA clustering algorithm was
used for unsupervised classification and many test classes (5, 10, 15, 20, 25, 30,
35……… 90, 95,100, 105 and 110) were executed. Threshold was set to 0.98 and
number of iterations was set to 50 in each class. The divergence showed clear peak
for the classification run with 90 classes (Figure 4-7). Divergence is a measure of
separability of classes present in the classes of a classified image and the run with
maximum divergence shows maximum separabiltiy. Therefore, 90 class images
and its signature was selected and it showed that Punjab can be classified into 90
different mix of land cover /land uses from 2000-14 at 250 m resolution (Figure 4-
8). This image was used for further analyses to map and monitor crop producing
areas of Punjab. As mentioned earlier, there are two outputs of ISODATA
clustering algorithm, out of which one is the classified image and second is the
signature which is temporal behavior of each NDVI class. All 90 Signatures were
then plotted and grouped into similar behaving NDVI class signatures (also known
as profiles). Figure 4-9 to Figure 4-24 show, 15 different and distinct groups of
NDVI classes. Figure 4-9 to figure 4-24 show the grouping of similar behaving
NDVI classes in to 16 distinct groups.
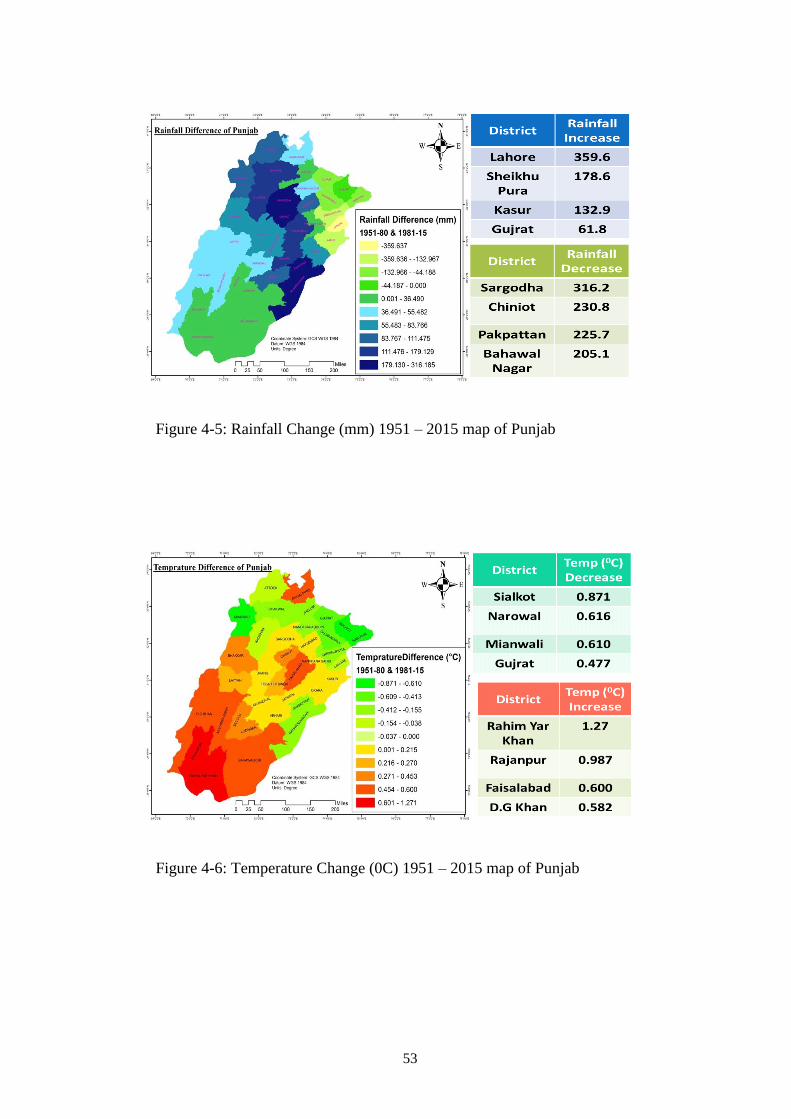
53
Figure 4-5: Rainfall Change (mm) 1951 – 2015 map of Punjab
Figure 4-6: Temperature Change (0C) 1951 – 2015 map of Punjab
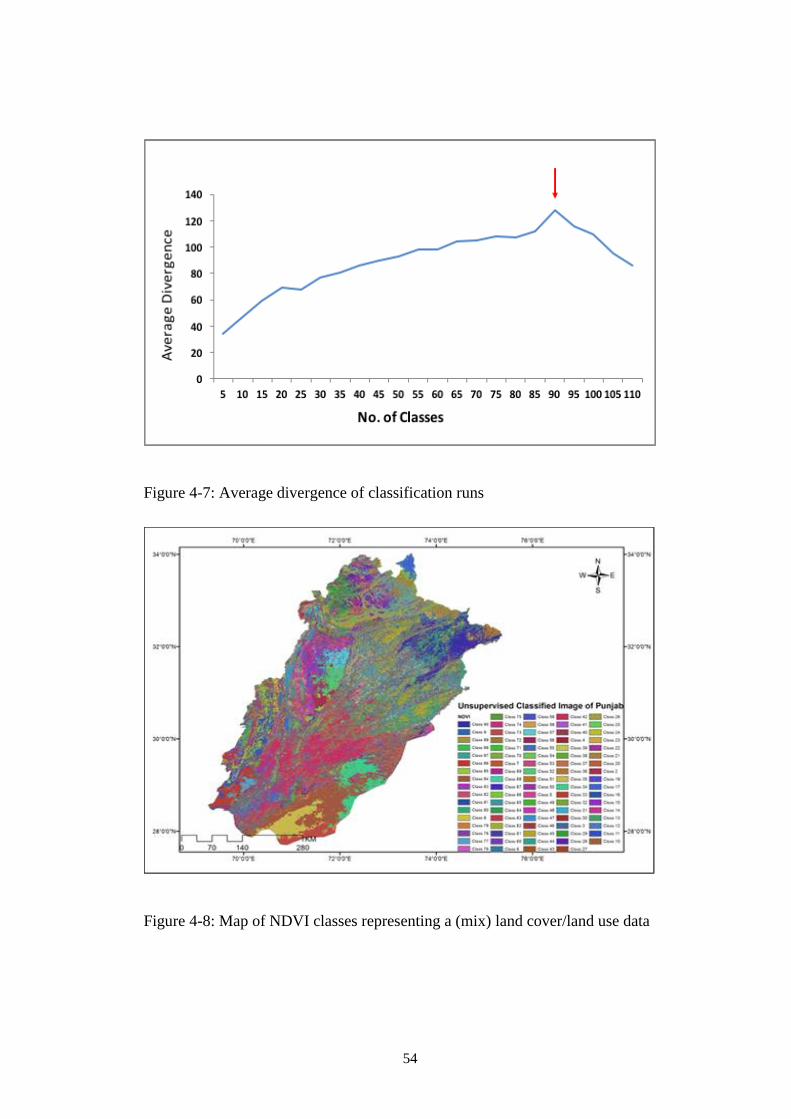
54
Figure 4-7: Average divergence of classification runs
Figure 4-8: Map of NDVI classes representing a (mix) land cover/land use data
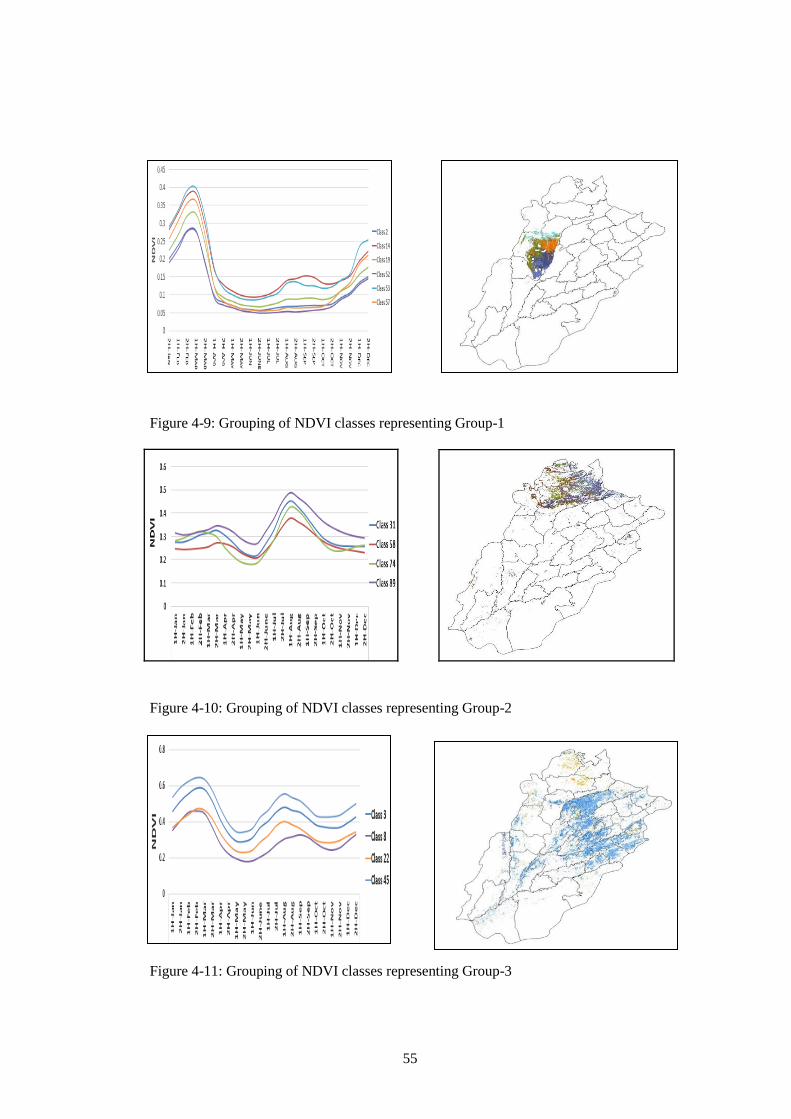
55
Figure 4-9: Grouping of NDVI classes representing Group-1
Figure 4-10: Grouping of NDVI classes representing Group-2
Figure 4-11: Grouping of NDVI classes representing Group-3
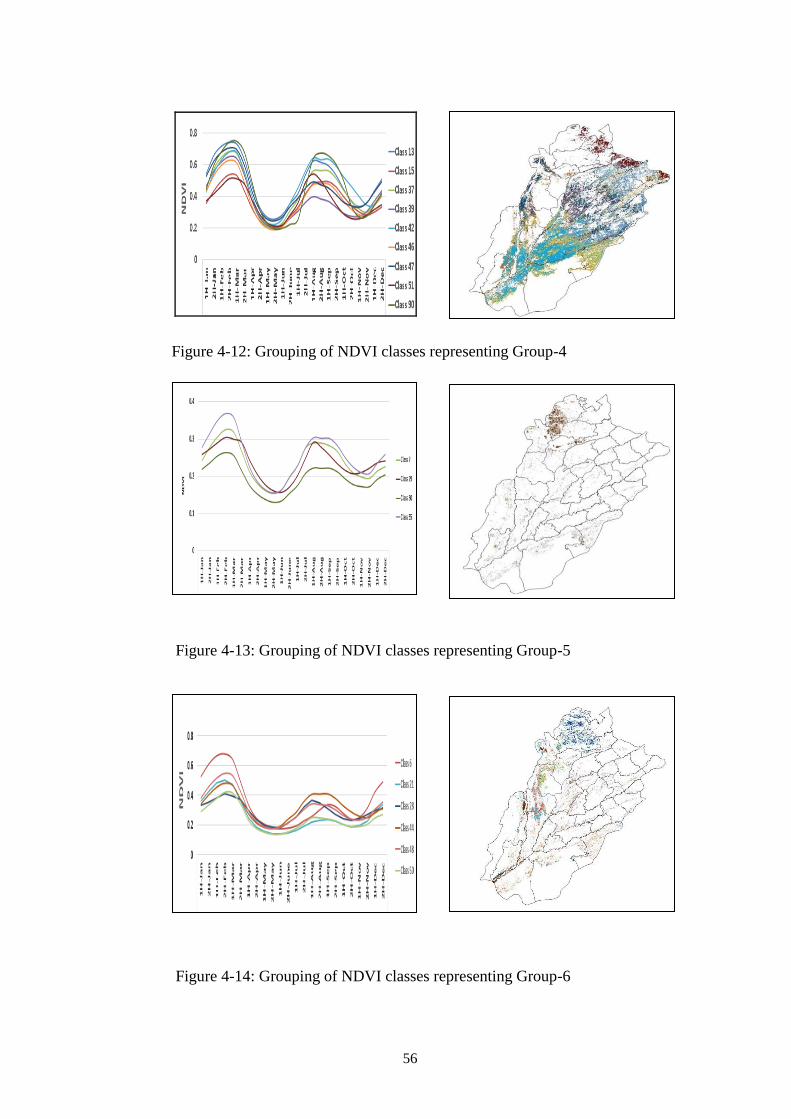
56
Figure 4-12: Grouping of NDVI classes representing Group-4
Figure 4-13: Grouping of NDVI classes representing Group-5
Figure 4-14: Grouping of NDVI classes representing Group-6
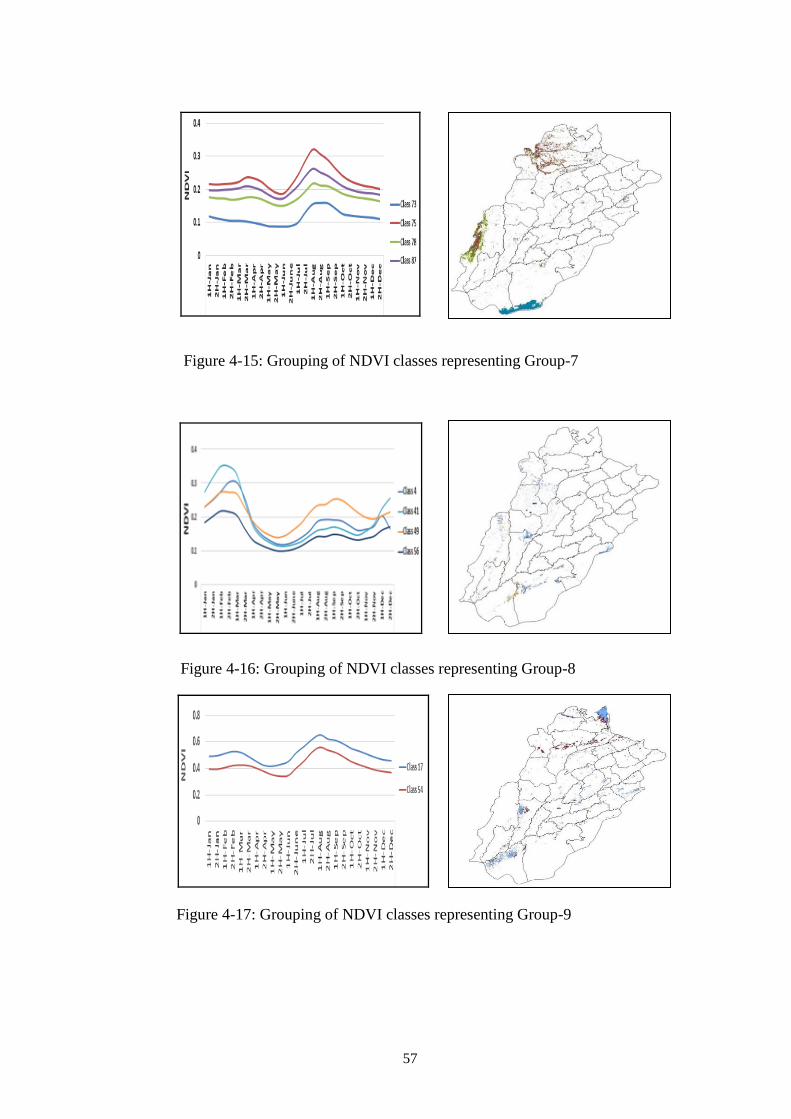
57
Figure 4-15: Grouping of NDVI classes representing Group-7
Figure 4-16: Grouping of NDVI classes representing Group-8
Figure 4-17: Grouping of NDVI classes representing Group-9
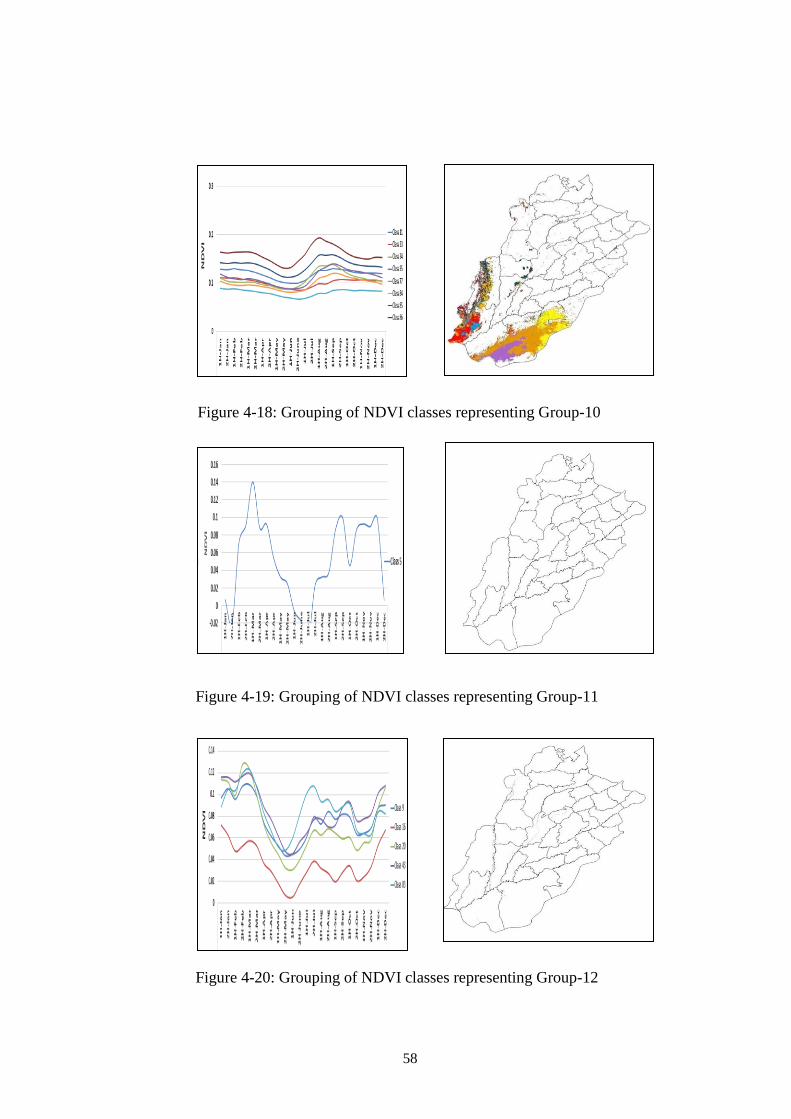
58
Figure 4-18: Grouping of NDVI classes representing Group-10
Figure 4-19: Grouping of NDVI classes representing Group-11
Figure 4-20: Grouping of NDVI classes representing Group-12
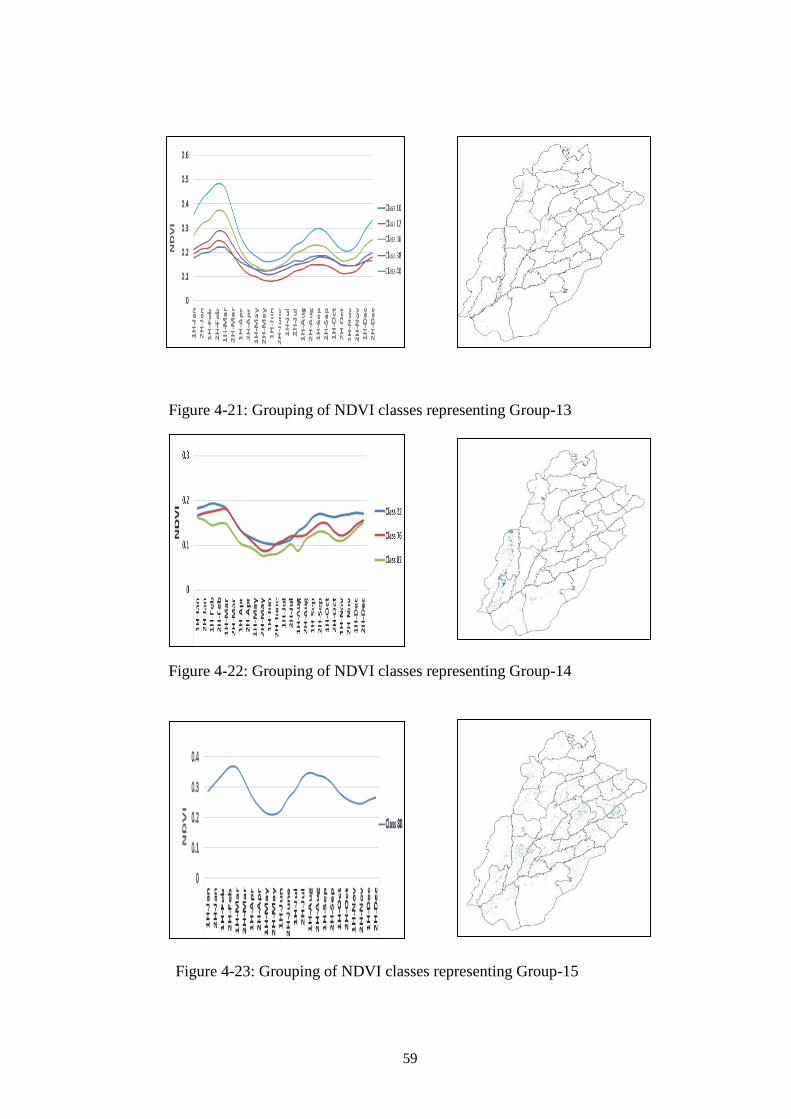
59
Figure 4-21: Grouping of NDVI classes representing Group-13
Figure 4-22: Grouping of NDVI classes representing Group-14
Figure 4-23: Grouping of NDVI classes representing Group-15
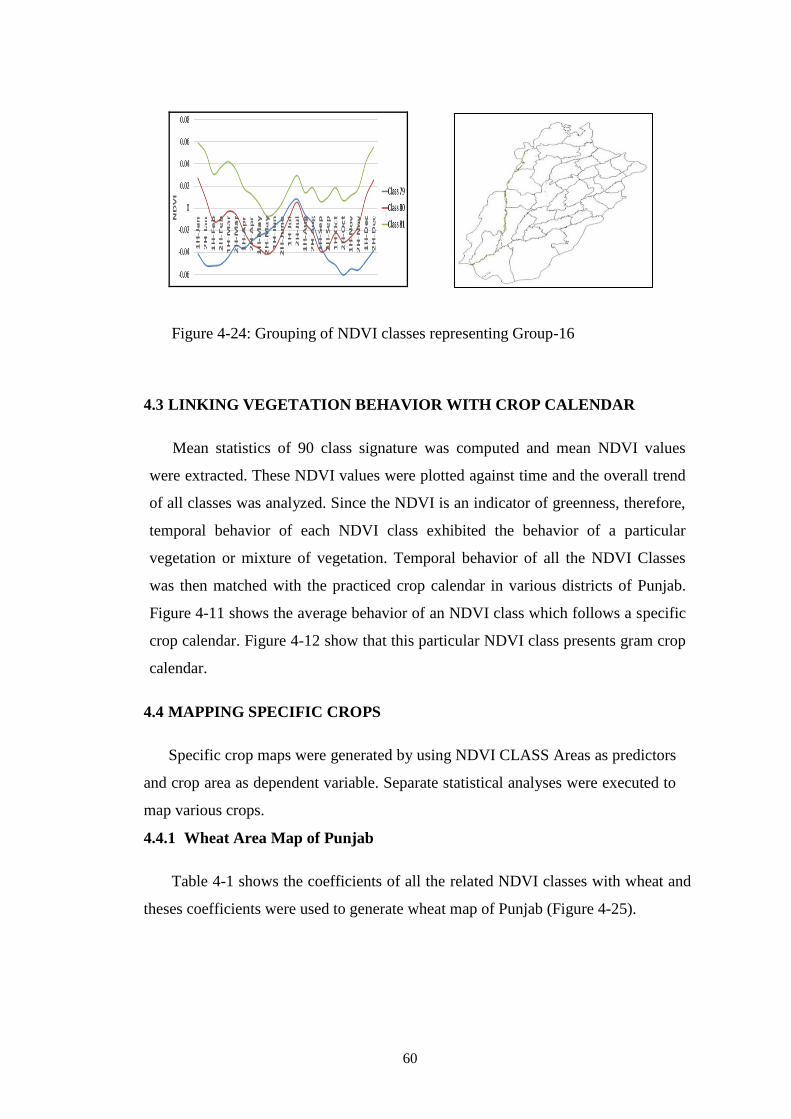
60
Figure 4-24: Grouping of NDVI classes representing Group-16
4.3 LINKING VEGETATION BEHAVIOR WITH CROP CALENDAR
Mean statistics of 90 class signature was computed and mean NDVI values
were extracted. These NDVI values were plotted against time and the overall trend
of all classes was analyzed. Since the NDVI is an indicator of greenness, therefore,
temporal behavior of each NDVI class exhibited the behavior of a particular
vegetation or mixture of vegetation. Temporal behavior of all the NDVI Classes
was then matched with the practiced crop calendar in various districts of Punjab.
Figure 4-11 shows the average behavior of an NDVI class which follows a specific
crop calendar. Figure 4-12 show that this particular NDVI class presents gram crop
calendar.
4.4 MAPPING SPECIFIC CROPS
Specific crop maps were generated by using NDVI CLASS Areas as predictors
and crop area as dependent variable. Separate statistical analyses were executed to
map various crops.
4.4.1 Wheat Area Map of Punjab
Table 4-1 shows the coefficients of all the related NDVI classes with wheat and
theses coefficients were used to generate wheat map of Punjab (Figure 4-25).
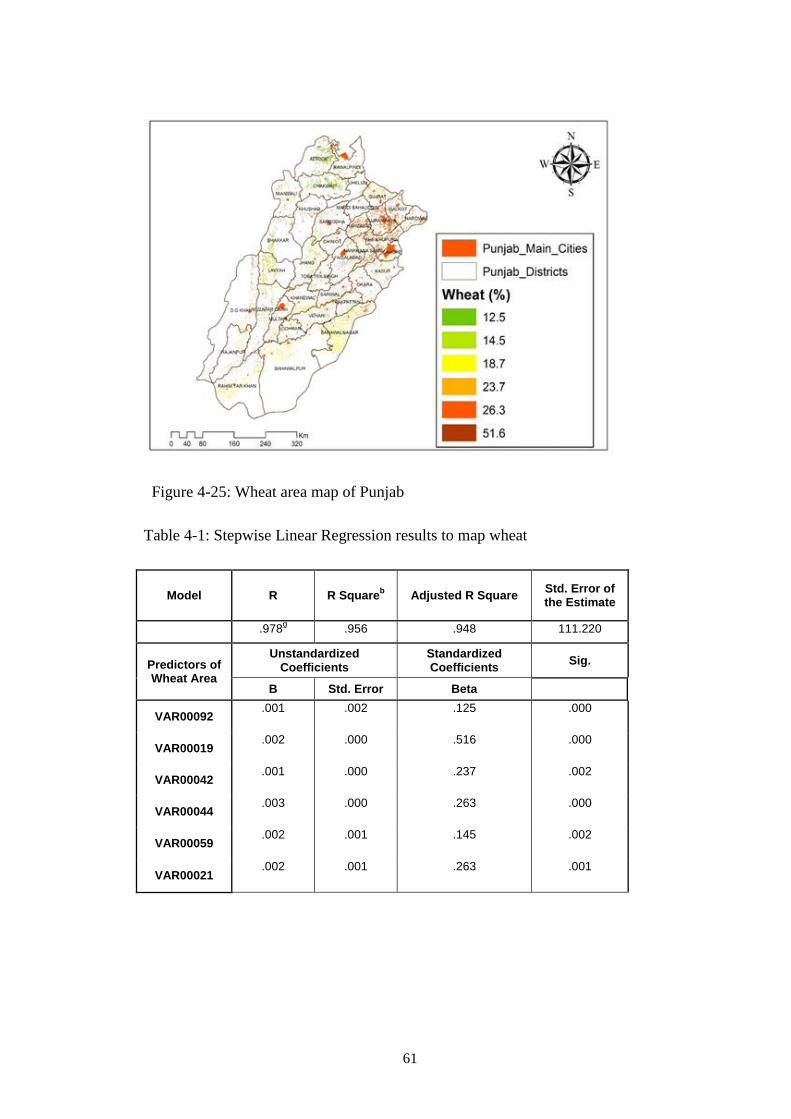
61
Figure 4-25: Wheat area map of Punjab
Table 4-1: Stepwise Linear Regression results to map wheat
Model R R Squareb Adjusted R Square
Std. Error of the Estimate
.978g .956 .948 111.220
Predictors of Wheat Area
Unstandardized Coefficients
Standardized Coefficients
Sig.
B Std. Error Beta
VAR00092 .001 .002 .125 .000
VAR00019 .002 .000 .516 .000
VAR00042 .001 .000 .237 .002
VAR00044 .003 .000 .263 .000
VAR00059 .002 .001 .145 .002
VAR00021 .002 .001 .263 .001
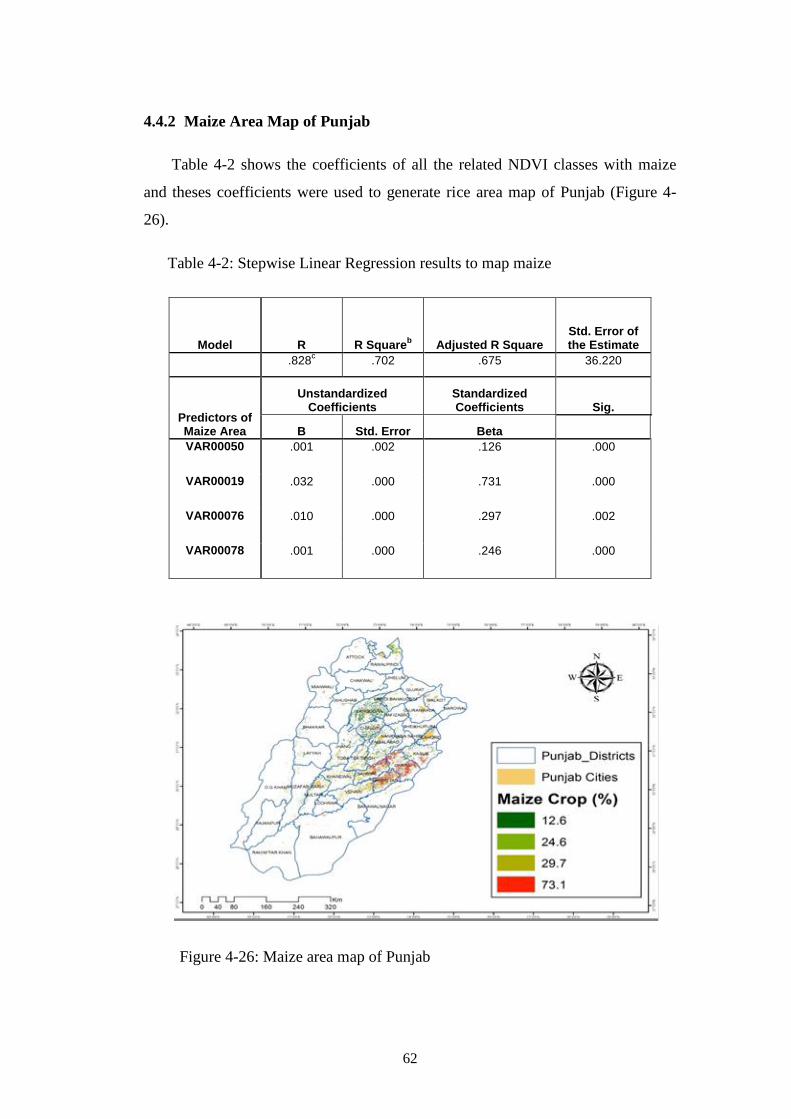
62
4.4.2 Maize Area Map of Punjab
Table 4-2 shows the coefficients of all the related NDVI classes with maize
and theses coefficients were used to generate rice area map of Punjab (Figure 4-
26).
Table 4-2: Stepwise Linear Regression results to map maize
Model R R Squareb Adjusted R Square
Std. Error of the Estimate
.828c .702 .675 36.220
Predictors of Maize Area
Unstandardized Coefficients
Standardized Coefficients Sig.
B Std. Error Beta VAR00050 .001 .002 .126 .000
VAR00019 .032 .000 .731 .000
VAR00076 .010 .000 .297 .002
VAR00078 .001 .000 .246 .000
Figure 4-26: Maize area map of Punjab
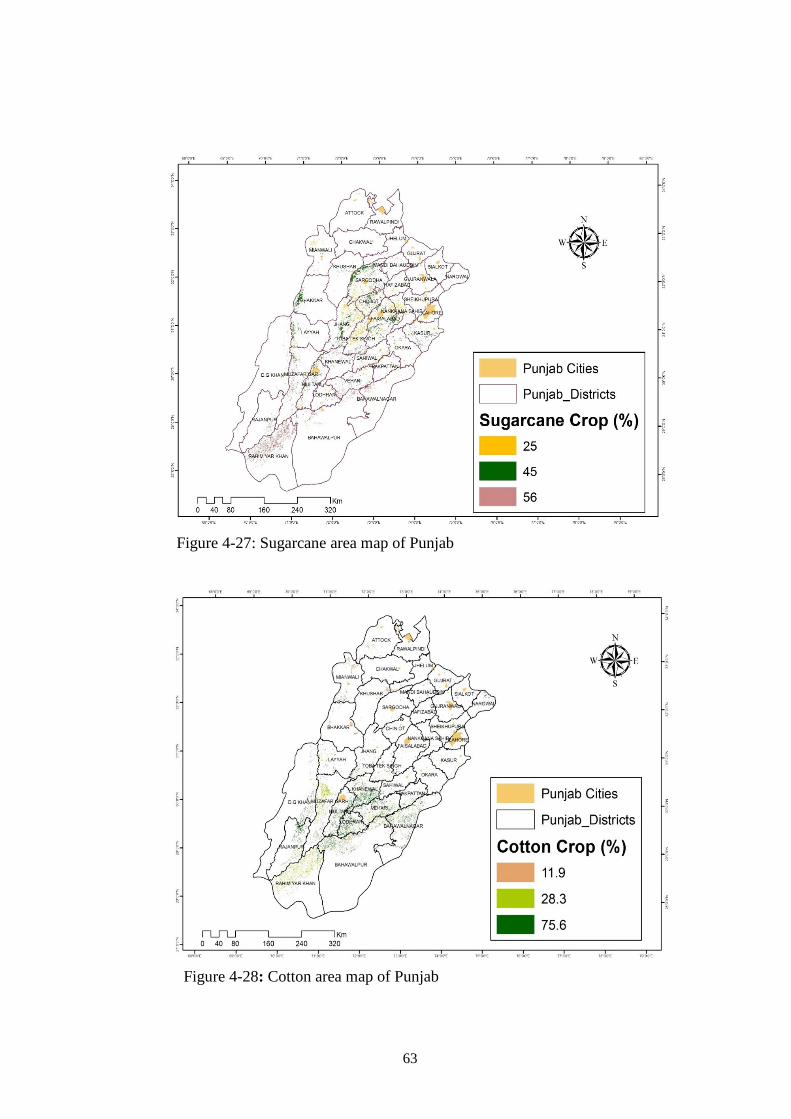
63
Figure 4-27: Sugarcane area map of Punjab
Figure 4-28: Cotton area map of Punjab
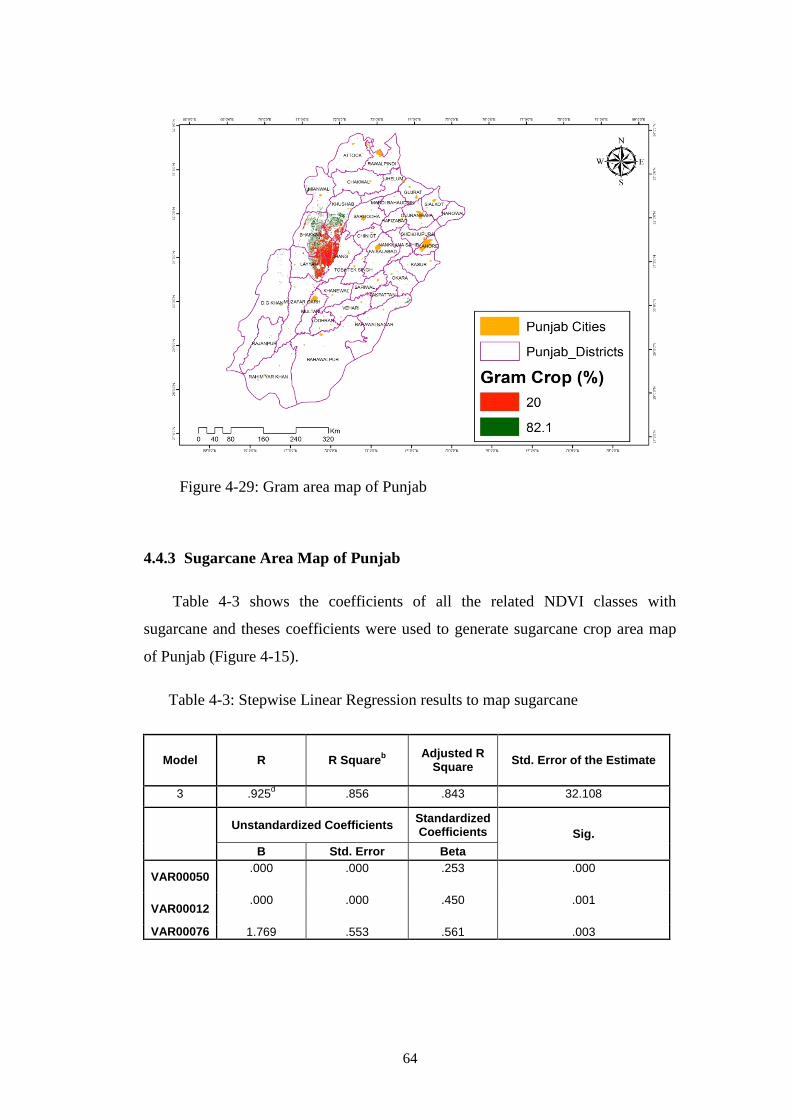
64
Figure 4-29: Gram area map of Punjab
4.4.3 Sugarcane Area Map of Punjab
Table 4-3 shows the coefficients of all the related NDVI classes with
sugarcane and theses coefficients were used to generate sugarcane crop area map
of Punjab (Figure 4-15).
Table 4-3: Stepwise Linear Regression results to map sugarcane
Model R R Squareb
Adjusted R Square
Std. Error of the Estimate
3 .925d .856 .843 32.108
Unstandardized Coefficients Standardized Coefficients Sig.
B Std. Error Beta
VAR00050 .000 .000 .253 .000
VAR00012 .000 .000 .450 .001
VAR00076 1.769 .553 .561 .003
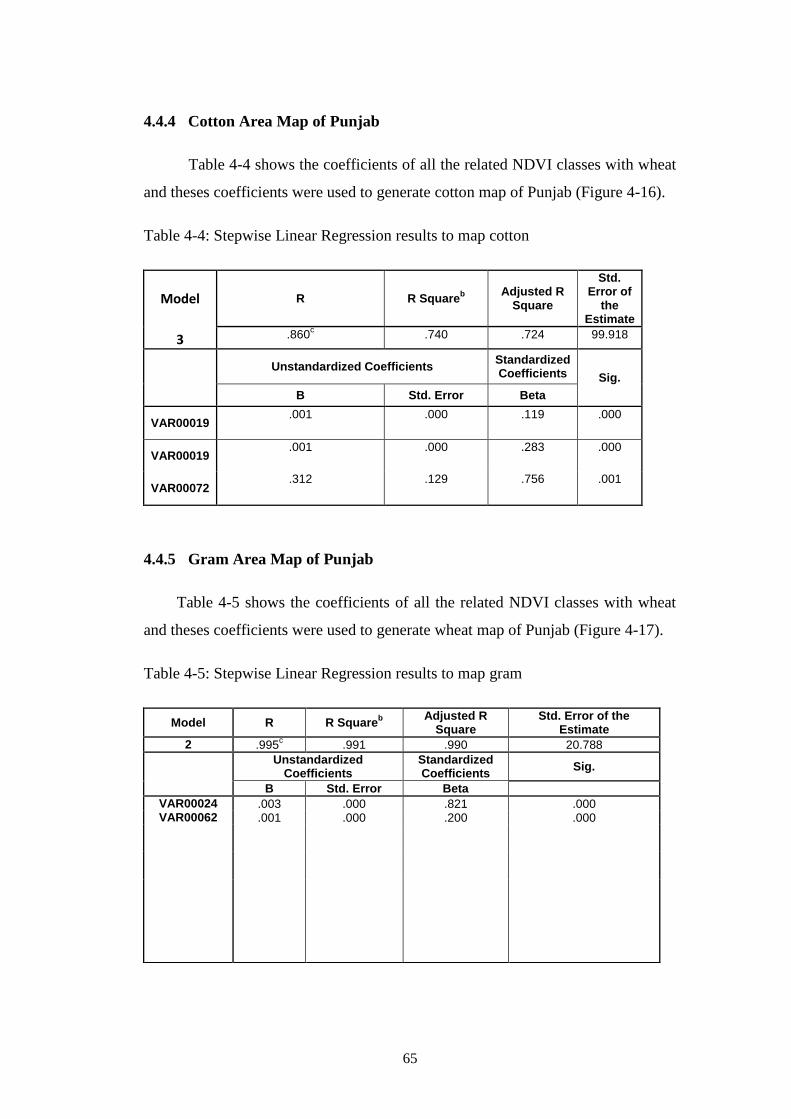
65
4.4.4 Cotton Area Map of Punjab
Table 4-4 shows the coefficients of all the related NDVI classes with wheat
and theses coefficients were used to generate cotton map of Punjab (Figure 4-16).
Table 4-4: Stepwise Linear Regression results to map cotton
Model R R Squareb
Adjusted R Square
Std. Error of
the Estimate
3 .860c .740 .724 99.918
Unstandardized Coefficients Standardized Coefficients Sig.
B Std. Error Beta
VAR00019 .001 .000 .119 .000
VAR00019 .001 .000 .283 .000
VAR00072 .312 .129 .756 .001
4.4.5 Gram Area Map of Punjab
Table 4-5 shows the coefficients of all the related NDVI classes with wheat
and theses coefficients were used to generate wheat map of Punjab (Figure 4-17).
Table 4-5: Stepwise Linear Regression results to map gram
Model R R Squareb
Adjusted R Square
Std. Error of the Estimate
2 .995c .991 .990 20.788
Unstandardized Coefficients
Standardized Coefficients
Sig.
B Std. Error Beta
VAR00024 .003 .000 .821 .000 VAR00062 .001 .000 .200 .000
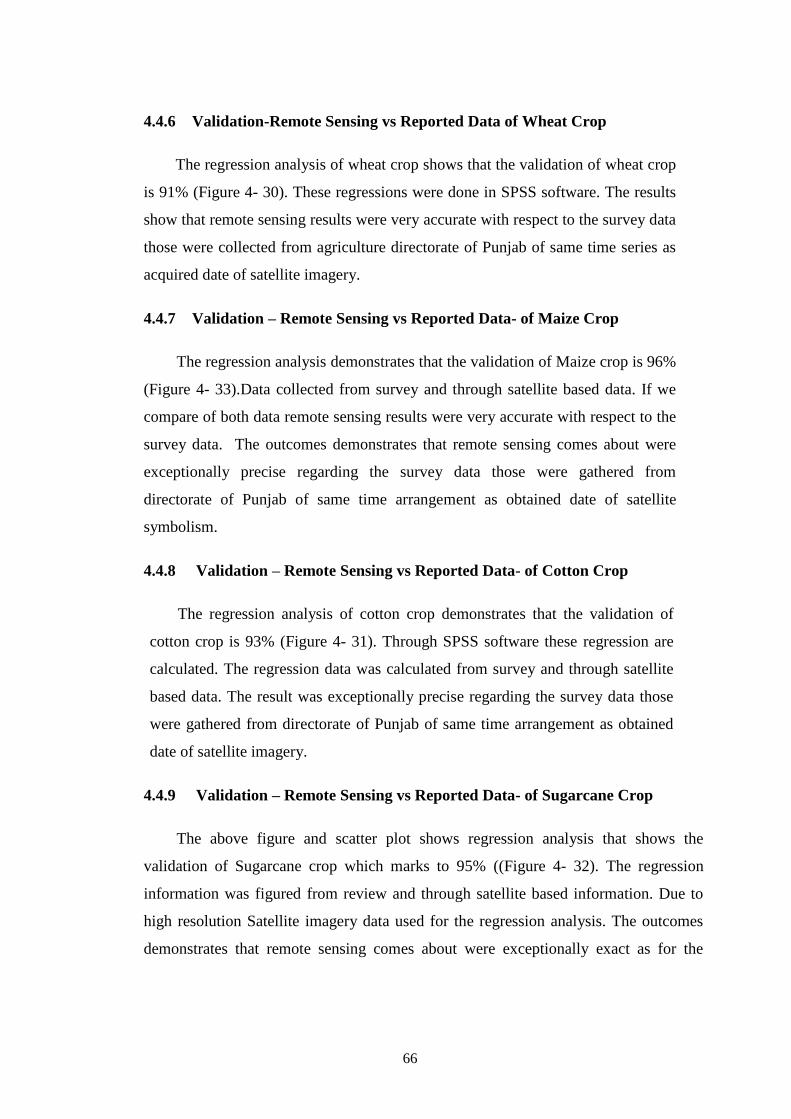
66
4.4.6 Validation-Remote Sensing vs Reported Data of Wheat Crop
The regression analysis of wheat crop shows that the validation of wheat crop
is 91% (Figure 4- 30). These regressions were done in SPSS software. The results
show that remote sensing results were very accurate with respect to the survey data
those were collected from agriculture directorate of Punjab of same time series as
acquired date of satellite imagery.
4.4.7 Validation – Remote Sensing vs Reported Data- of Maize Crop
The regression analysis demonstrates that the validation of Maize crop is 96%
(Figure 4- 33).Data collected from survey and through satellite based data. If we
compare of both data remote sensing results were very accurate with respect to the
survey data. The outcomes demonstrates that remote sensing comes about were
exceptionally precise regarding the survey data those were gathered from
directorate of Punjab of same time arrangement as obtained date of satellite
symbolism.
4.4.8 Validation – Remote Sensing vs Reported Data- of Cotton Crop
The regression analysis of cotton crop demonstrates that the validation of
cotton crop is 93% (Figure 4- 31). Through SPSS software these regression are
calculated. The regression data was calculated from survey and through satellite
based data. The result was exceptionally precise regarding the survey data those
were gathered from directorate of Punjab of same time arrangement as obtained
date of satellite imagery.
4.4.9 Validation – Remote Sensing vs Reported Data- of Sugarcane Crop
The above figure and scatter plot shows regression analysis that shows the
validation of Sugarcane crop which marks to 95% ((Figure 4- 32). The regression
information was figured from review and through satellite based information. Due to
high resolution Satellite imagery data used for the regression analysis. The outcomes
demonstrates that remote sensing comes about were exceptionally exact as for the
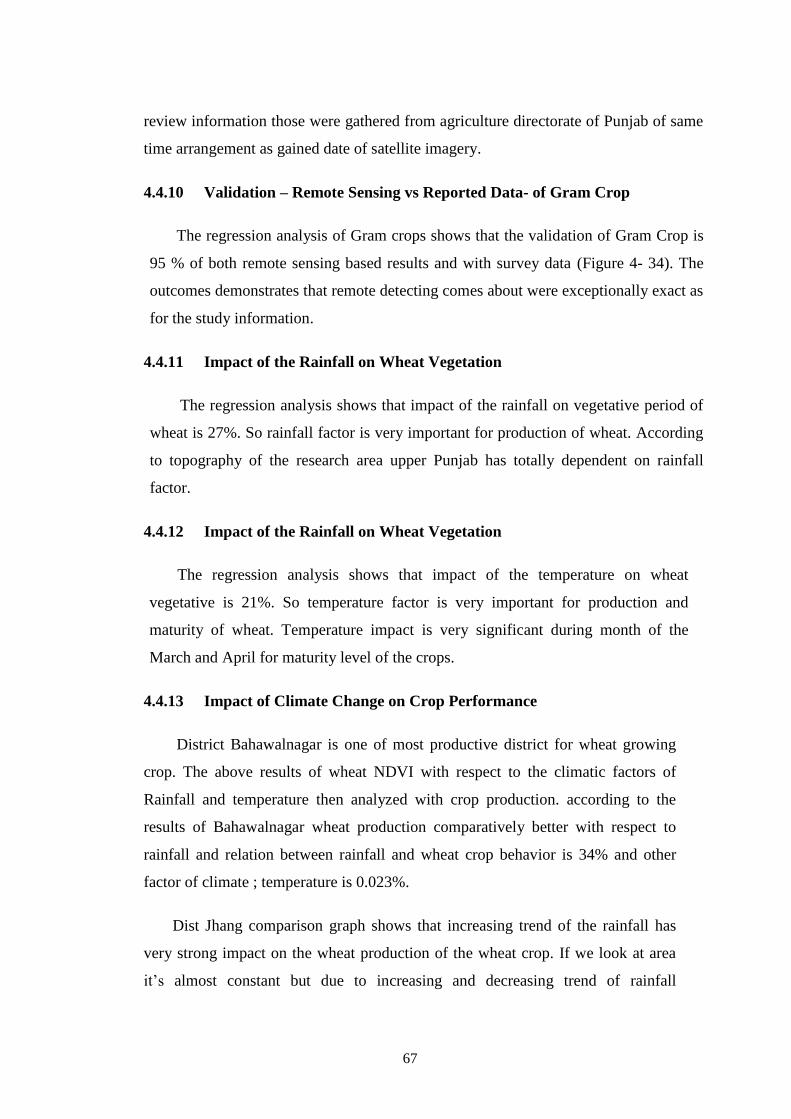
67
review information those were gathered from agriculture directorate of Punjab of same
time arrangement as gained date of satellite imagery.
4.4.10 Validation – Remote Sensing vs Reported Data- of Gram Crop
The regression analysis of Gram crops shows that the validation of Gram Crop is
95 % of both remote sensing based results and with survey data (Figure 4- 34). The
outcomes demonstrates that remote detecting comes about were exceptionally exact as
for the study information.
4.4.11 Impact of the Rainfall on Wheat Vegetation
The regression analysis shows that impact of the rainfall on vegetative period of
wheat is 27%. So rainfall factor is very important for production of wheat. According
to topography of the research area upper Punjab has totally dependent on rainfall
factor.
4.4.12 Impact of the Rainfall on Wheat Vegetation
The regression analysis shows that impact of the temperature on wheat
vegetative is 21%. So temperature factor is very important for production and
maturity of wheat. Temperature impact is very significant during month of the
March and April for maturity level of the crops.
4.4.13 Impact of Climate Change on Crop Performance
District Bahawalnagar is one of most productive district for wheat growing
crop. The above results of wheat NDVI with respect to the climatic factors of
Rainfall and temperature then analyzed with crop production. according to the
results of Bahawalnagar wheat production comparatively better with respect to
rainfall and relation between rainfall and wheat crop behavior is 34% and other
factor of climate ; temperature is 0.023%.
Dist Jhang comparison graph shows that increasing trend of the rainfall has
very strong impact on the wheat production of the wheat crop. If we look at area
it’s almost constant but due to increasing and decreasing trend of rainfall
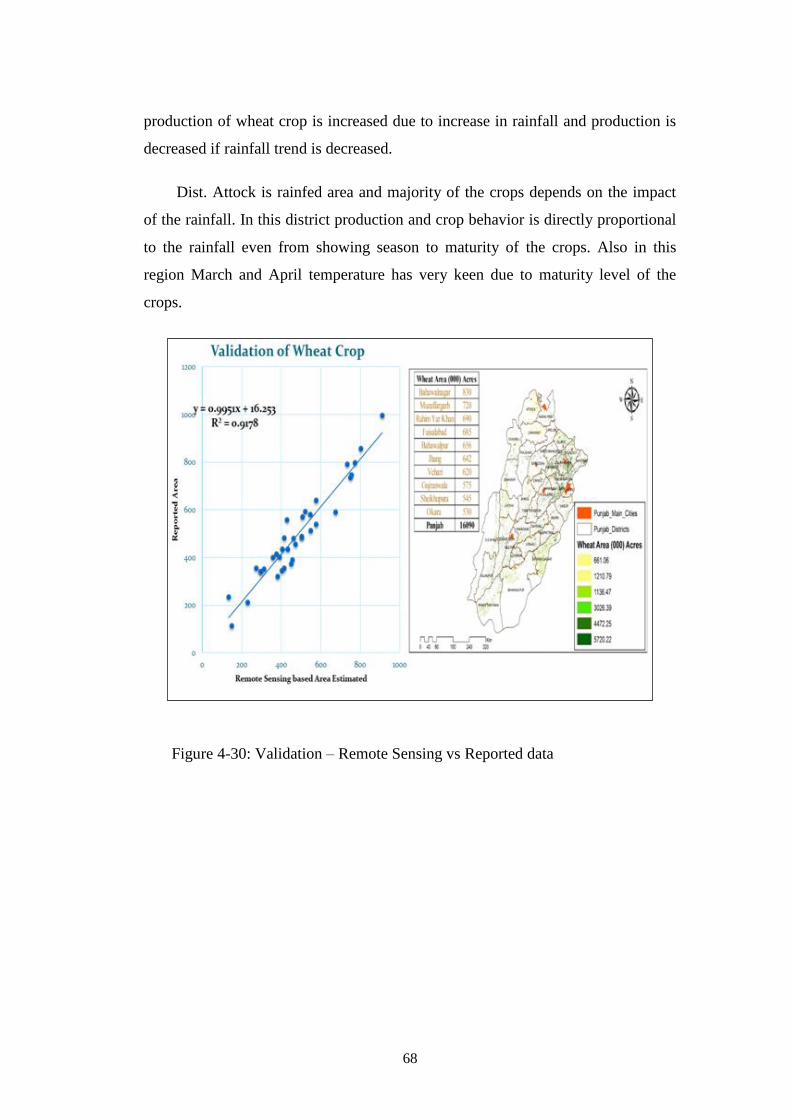
68
production of wheat crop is increased due to increase in rainfall and production is
decreased if rainfall trend is decreased.
Dist. Attock is rainfed area and majority of the crops depends on the impact
of the rainfall. In this district production and crop behavior is directly proportional
to the rainfall even from showing season to maturity of the crops. Also in this
region March and April temperature has very keen due to maturity level of the
crops.
Afall. In this area production and crop behavior is directly proportional to the
Figure 4-30: Validation – Remote Sensing vs Reported data
69
Figure 4-31: Validation – Remote Sensing vs Reported Data
Figure 4-32: Validation – Remote Sensing vs Reported Data
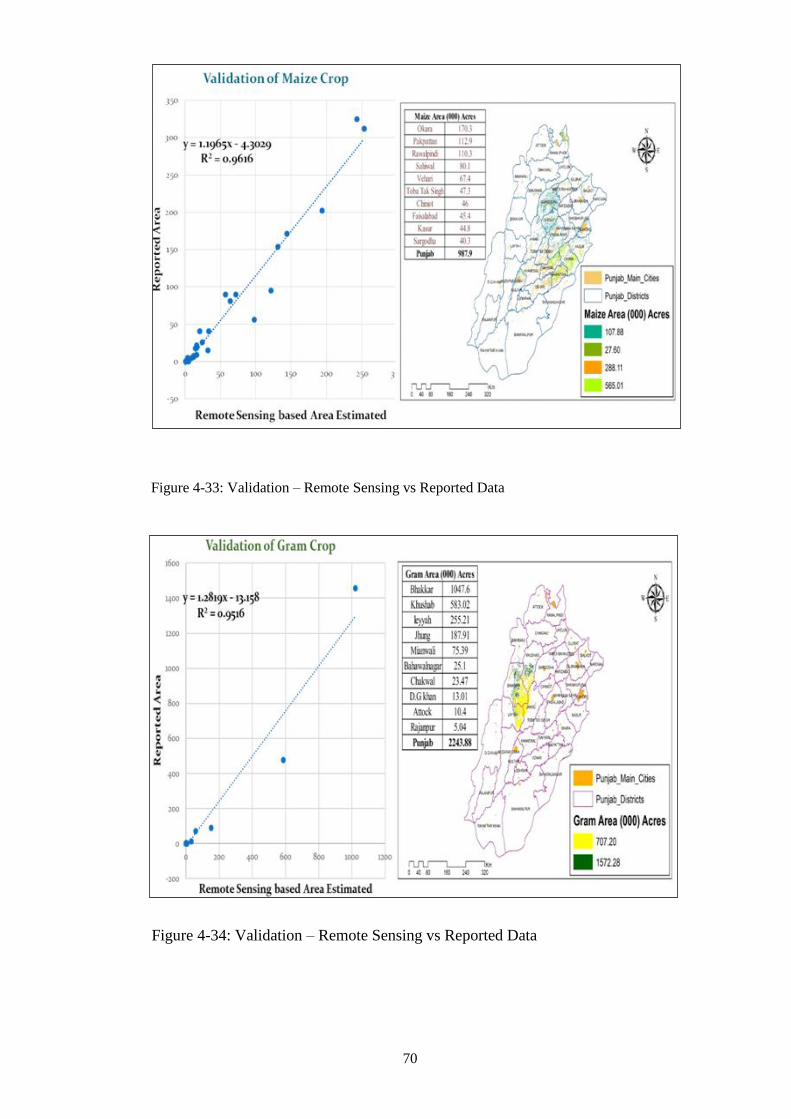
70
Figure 4-33: Validation – Remote Sensing vs Reported Data
Figure 4-34: Validation – Remote Sensing vs Reported Data
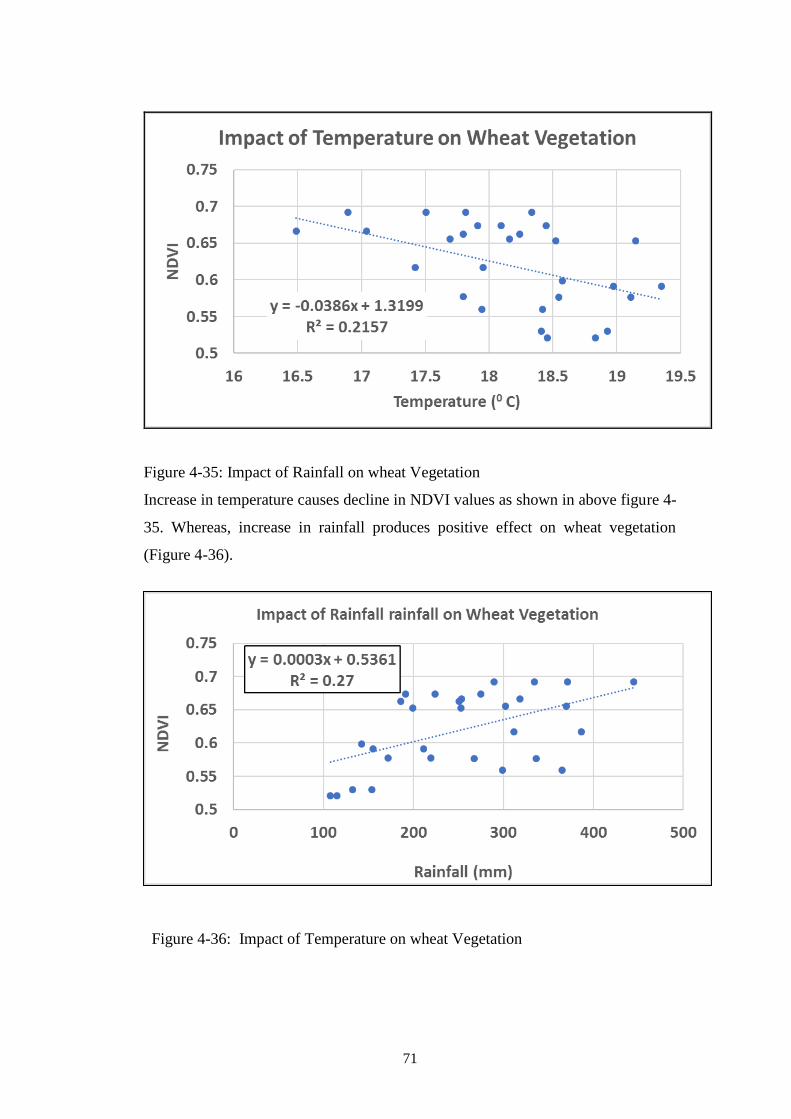
71
Figure 4-35: Impact of Rainfall on wheat Vegetation
Increase in temperature causes decline in NDVI values as shown in above figure 4-
35. Whereas, increase in rainfall produces positive effect on wheat vegetation
(Figure 4-36).
Figure 4-36: Impact of Temperature on wheat Vegetation
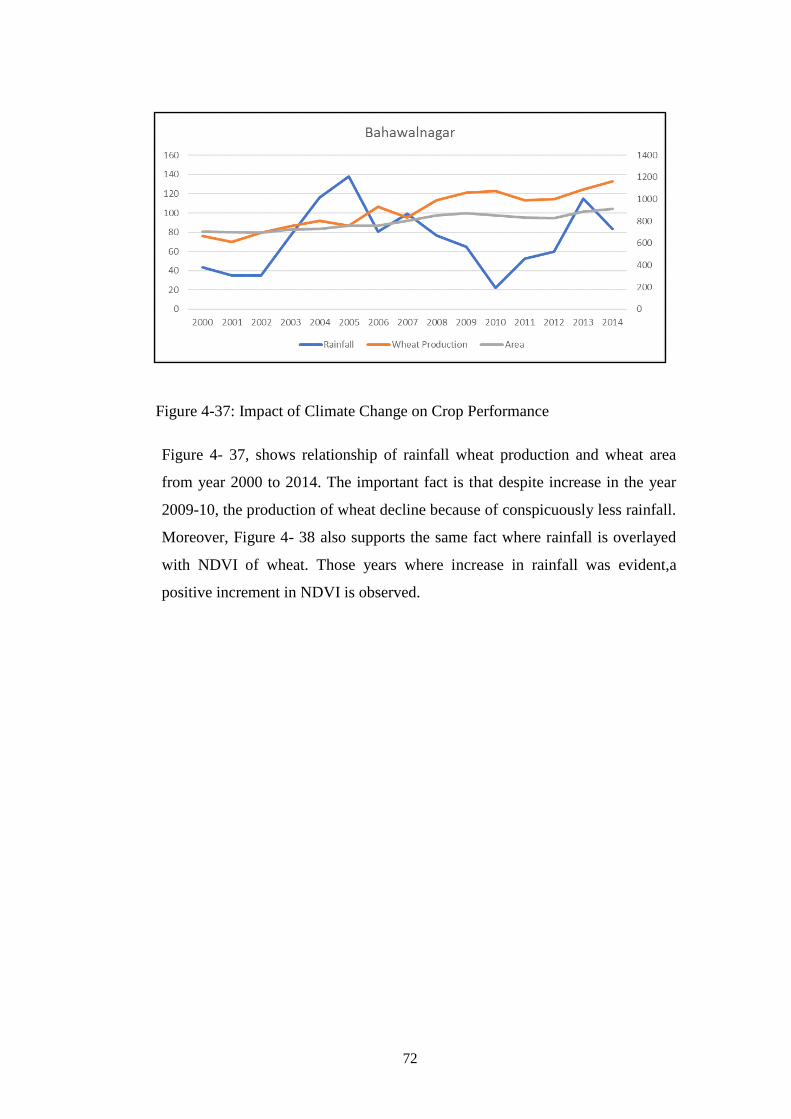
72
Figure 4-37: Impact of Climate Change on Crop Performance
Figure 4- 37, shows relationship of rainfall wheat production and wheat area
from year 2000 to 2014. The important fact is that despite increase in the year
2009-10, the production of wheat decline because of conspicuously less rainfall.
Moreover, Figure 4- 38 also supports the same fact where rainfall is overlayed
with NDVI of wheat. Those years where increase in rainfall was evident,a
positive increment in NDVI is observed.
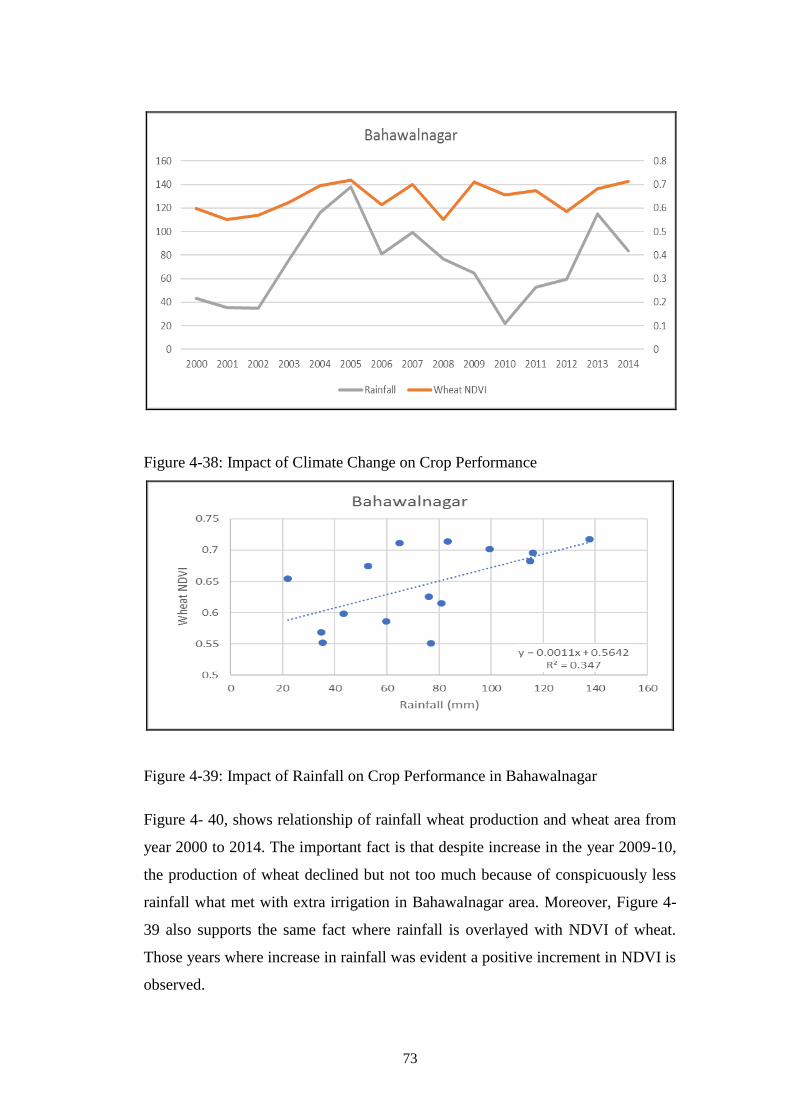
73
Figure 4-38: Impact of Climate Change on Crop Performance
Figure 4-39: Impact of Rainfall on Crop Performance in Bahawalnagar
Figure 4- 40, shows relationship of rainfall wheat production and wheat area from
year 2000 to 2014. The important fact is that despite increase in the year 2009-10,
the production of wheat declined but not too much because of conspicuously less
rainfall what met with extra irrigation in Bahawalnagar area. Moreover, Figure 4-
39 also supports the same fact where rainfall is overlayed with NDVI of wheat.
Those years where increase in rainfall was evident a positive increment in NDVI is
observed.
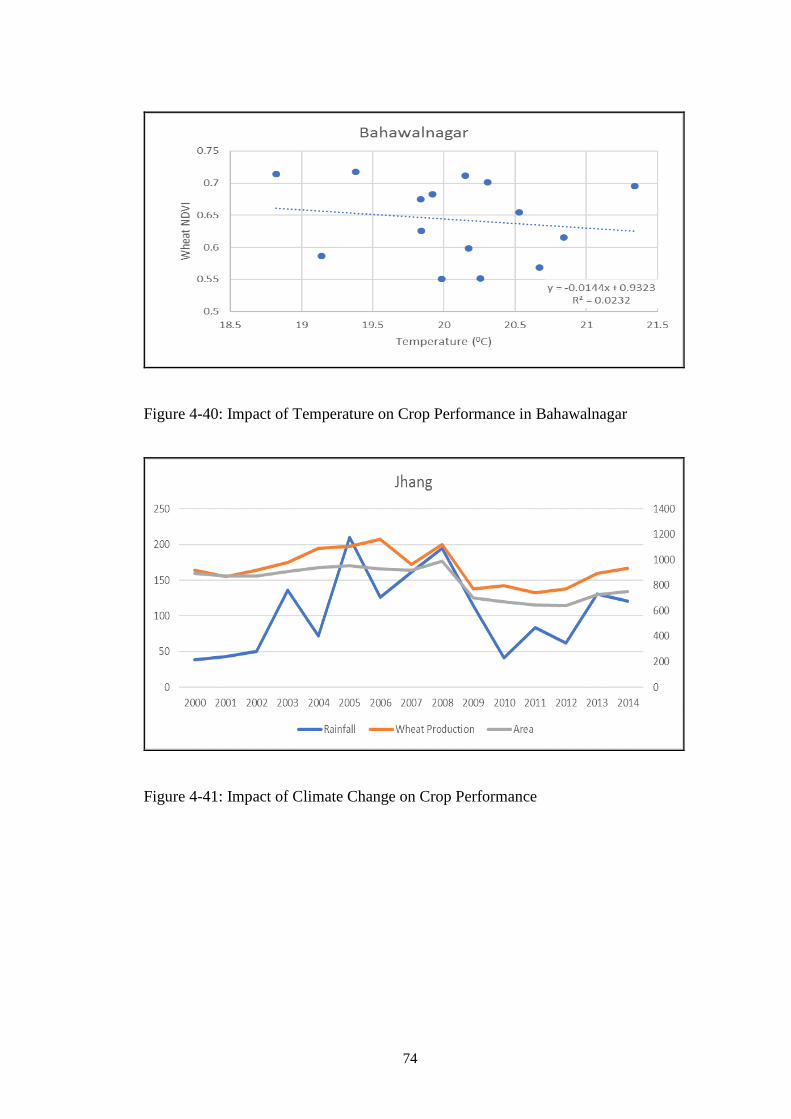
74
Figure 4-40: Impact of Temperature on Crop Performance in Bahawalnagar
Figure 4-41: Impact of Climate Change on Crop Performance
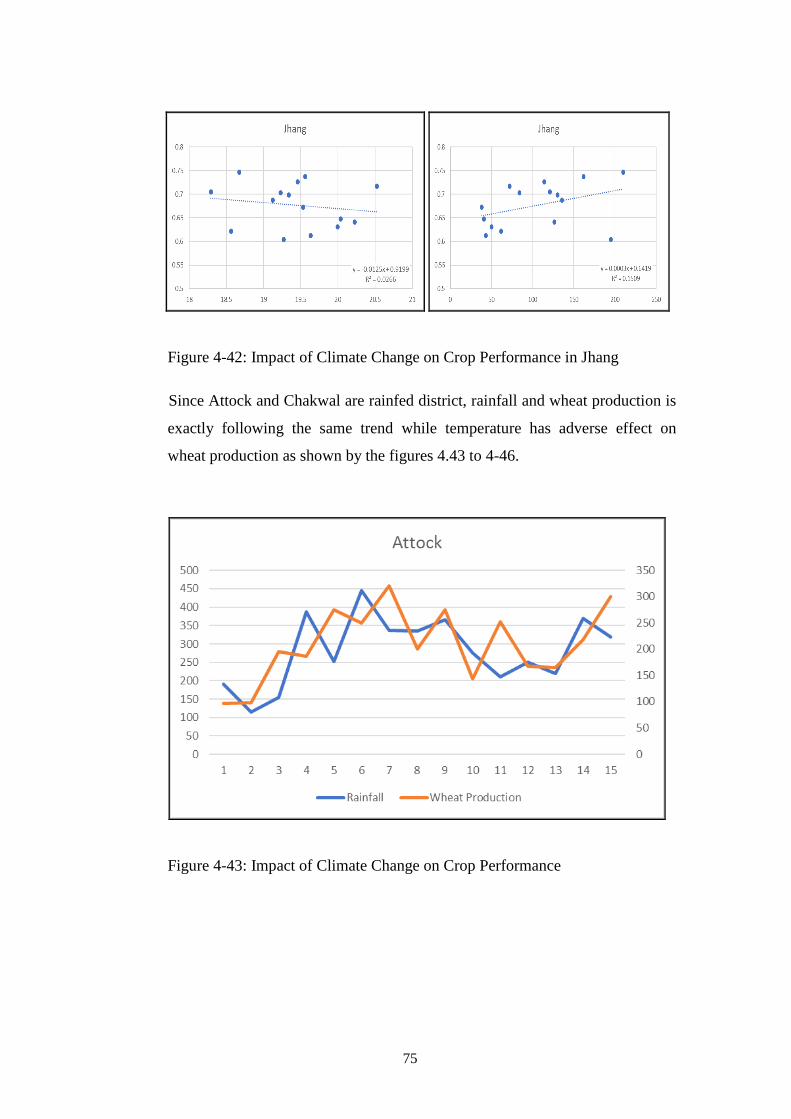
75
Figure 4-42: Impact of Climate Change on Crop Performance in Jhang
Since Attock and Chakwal are rainfed district, rainfall and wheat production is
exactly following the same trend while temperature has adverse effect on
wheat production as shown by the figures 4.43 to 4-46.
Figure 4-43: Impact of Climate Change on Crop Performance
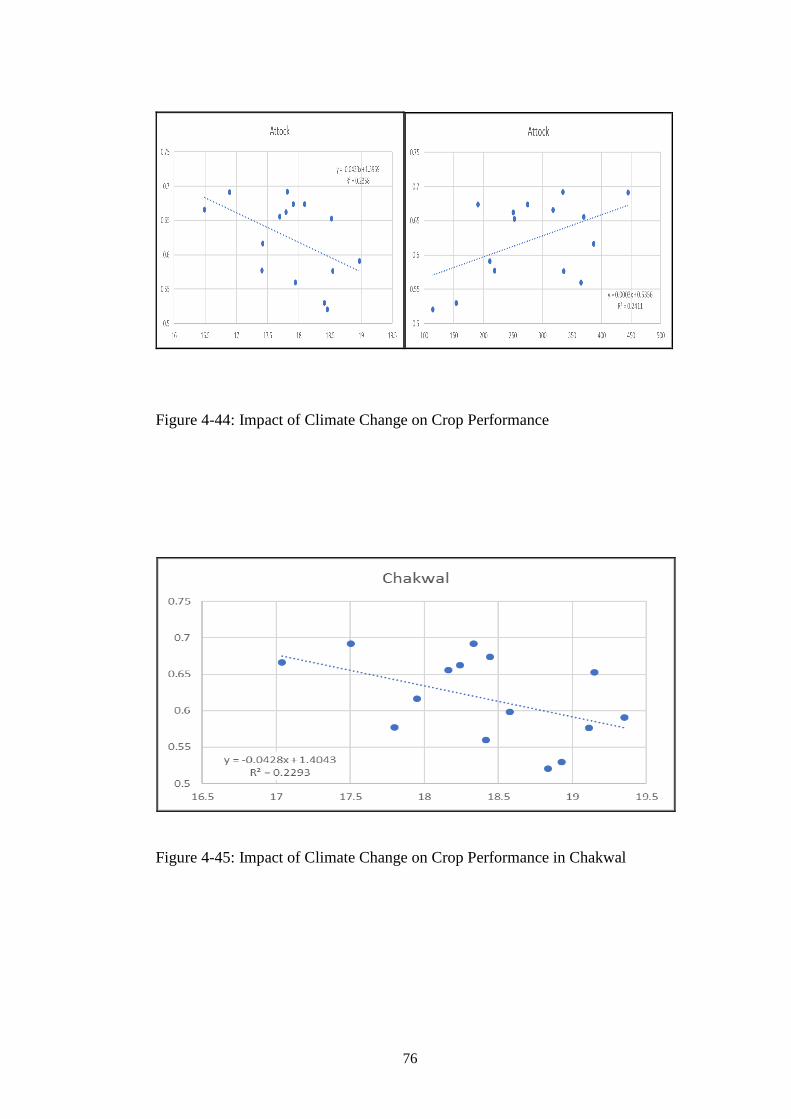
76
Figure 4-44: Impact of Climate Change on Crop Performance
Figure 4-45: Impact of Climate Change on Crop Performance in Chakwal
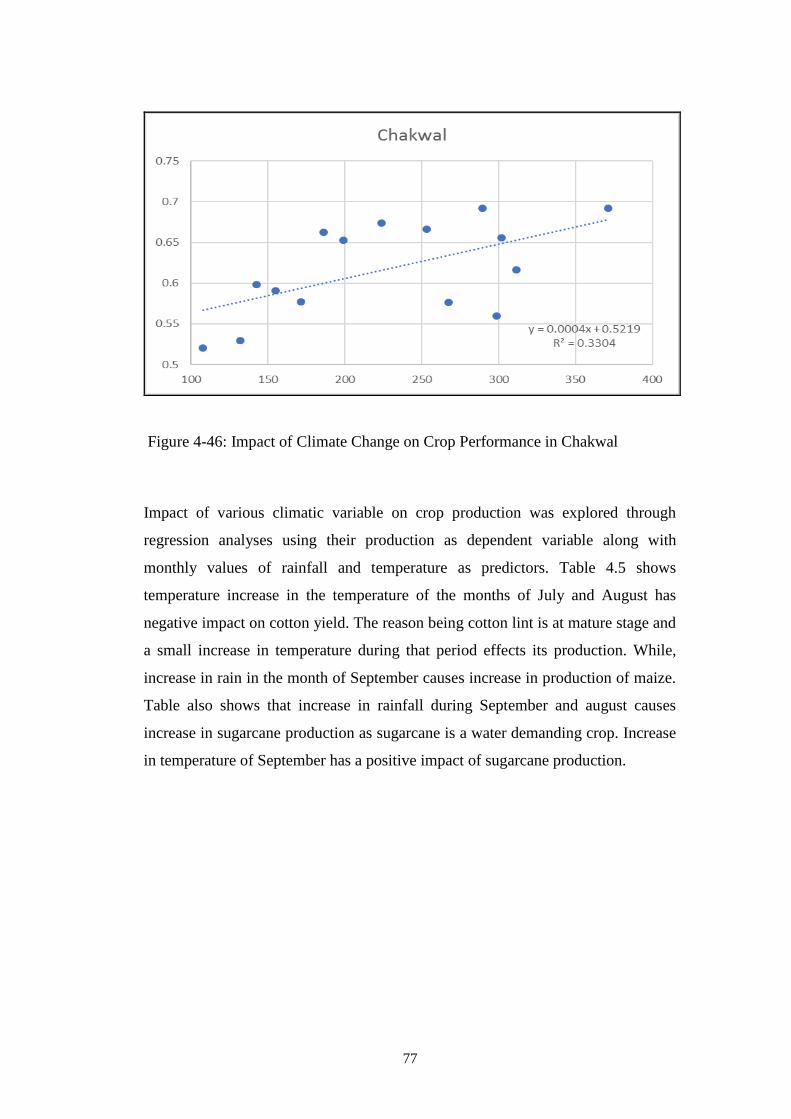
77
Figure 4-46: Impact of Climate Change on Crop Performance in Chakwal
Impact of various climatic variable on crop production was explored through
regression analyses using their production as dependent variable along with
monthly values of rainfall and temperature as predictors. Table 4.5 shows
temperature increase in the temperature of the months of July and August has
negative impact on cotton yield. The reason being cotton lint is at mature stage and
a small increase in temperature during that period effects its production. While,
increase in rain in the month of September causes increase in production of maize.
Table also shows that increase in rainfall during September and august causes
increase in sugarcane production as sugarcane is a water demanding crop. Increase
in temperature of September has a positive impact of sugarcane production.
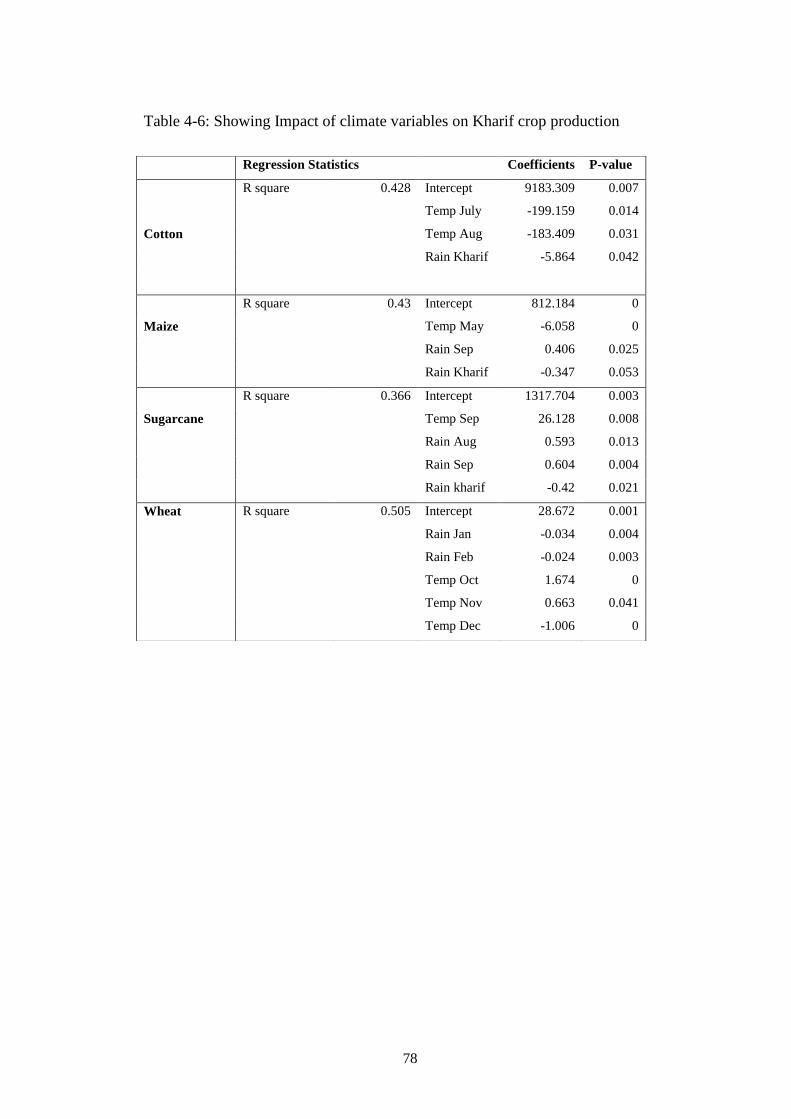
78
Table 4-6: Showing Impact of climate variables on Kharif crop production
Regression Statistics Coefficients P-value
R square 0.428 Intercept 9183.309 0.007
Temp July -199.159 0.014
Cotton Temp Aug -183.409 0.031
Rain Kharif -5.864 0.042
R square 0.43 Intercept 812.184 0
Maize Temp May -6.058 0
Rain Sep 0.406 0.025
Rain Kharif -0.347 0.053
R square 0.366 Intercept 1317.704 0.003
Sugarcane Temp Sep 26.128 0.008
Rain Aug 0.593 0.013
Rain Sep 0.604 0.004
Rain kharif -0.42 0.021
Wheat R square 0.505 Intercept 28.672 0.001
Rain Jan -0.034 0.004
Rain Feb -0.024 0.003
Temp Oct 1.674 0
Temp Nov 0.663 0.041
Temp Dec -1.006 0
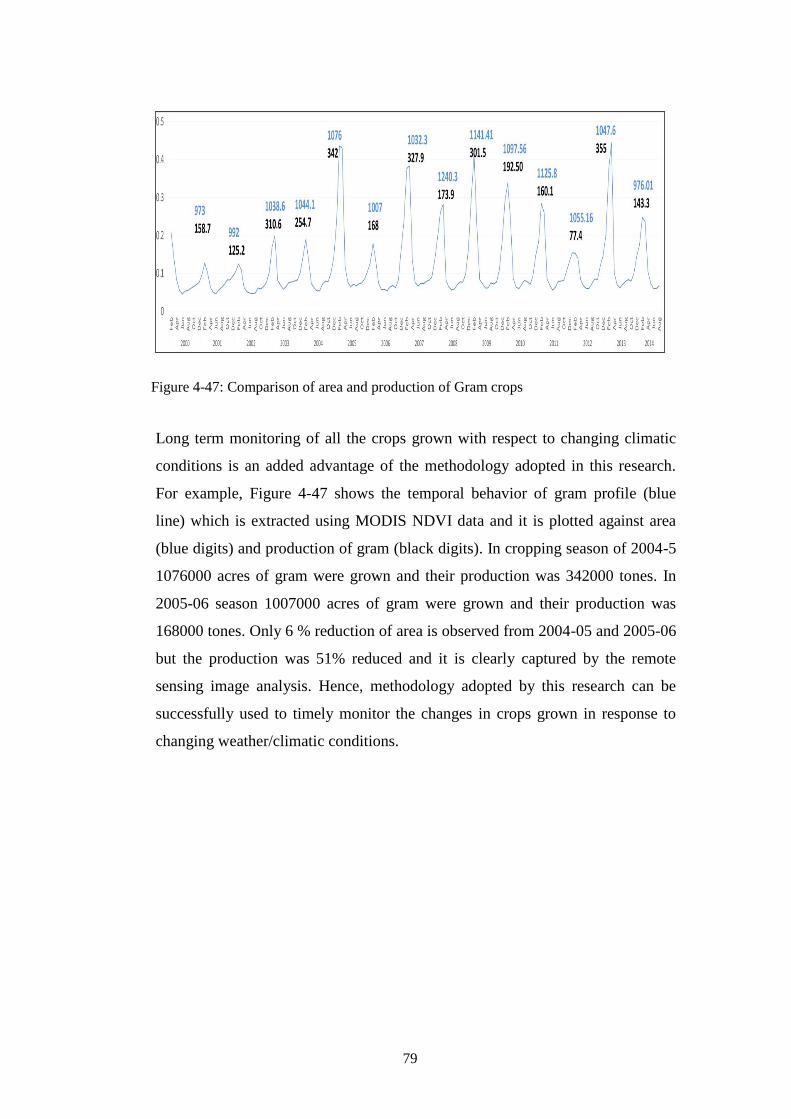
79
Figure 4-47: Comparison of area and production of Gram crops
Long term monitoring of all the crops grown with respect to changing climatic
conditions is an added advantage of the methodology adopted in this research.
For example, Figure 4-47 shows the temporal behavior of gram profile (blue
line) which is extracted using MODIS NDVI data and it is plotted against area
(blue digits) and production of gram (black digits). In cropping season of 2004-5
1076000 acres of gram were grown and their production was 342000 tones. In
2005-06 season 1007000 acres of gram were grown and their production was
168000 tones. Only 6 % reduction of area is observed from 2004-05 and 2005-06
but the production was 51% reduced and it is clearly captured by the remote
sensing image analysis. Hence, methodology adopted by this research can be
successfully used to timely monitor the changes in crops grown in response to
changing weather/climatic conditions.
80
CONCLUSIONS AND RECOMMENDATIONS
Apportioning Punjab into three equal portions (upper, middle and lower portion)
, it is evident that maximum increase in temperature occurred in the lower
portion i.e. south Punjab (Rahim Yar Khan, Rajanpur and DG Khan)
To some extent in the in middle portion i.e. Faisalabad, increase in temperature
is observed
Maximum decrease in temperature occurred only in upper portion of Punjab
While considering the Rainfall, maximum increase occurred in middle eastern
portion and upper portion i.e. Lahore, Sheikhupura, Kasur and Gujrat; whereas
maximum decrease occurred in middle western and lower portions i.e
Sargodha, Chinot, Pakpattan and Bahawalnagar
NDVI values when compared with the Crop Calendar, gives a very clear match
and using multi-temporal / multispectral data set, vegetation change can very
easily be detected
Multi-temporal continuous satellite images is now available to be used for
long-term monitoring of crop producing areas
Currently, crop areas are being compiled by statistical up scaling and the
validation results show that NDVI images can be used as a stratum while
producing crop area estimates
The study focused on the effect of changes in climatic indicators on major
crops production in Punjab
The Results shows that increase in temperature is expected to affect the
crops production as significant negative correlation is found between
temperature and crop production
For cotton a significant negative impact of rainfall is reported by the results
of this study
81
For cotton significant adverse impact of temperature increase in the months
of July and August is shown
For maize a significant negative impact of increasing temperature in the
month of May; whereas rain in the month of Sep positively contributed
For wheat crop, Nov temperature has positive impact whereas Dec
temperature has negative impact. Rainfall in the month of Feb has
negligible adverse impact on wheat production
In Potohar region rainfall has significant positive impacts on crop
production
In Potohar region temperature has significant negative impacts on crop
production
This research has a major contribution in providing a monitoring framework
for researchers and policy makers, both at spatial and temporal scale
Location specific monitoring provides opportunity to evaluate performance
of various crops at various locations; whereas long term monitoring helps
in analyzing the impact of variations in climate.
82
SUMMARY
This study ponders the effect of changes in rainfall and temperature of Punjab,
Pakistan on the production of five major crops viz. wheat (triticum), maize (zea
mayes), cotton (gossypium), sugarcane (Saccharum officinarum) and gram (Cicer
arietinum). Firstly, changes in mean temperature and rainfall from 1980 to 2015
were assessed at district level in comparison with the data of 1951 to 1980.
Secondly, the changes in crop performance were computed through remote sensing
and crop reporting data obtained from the agriculture department, Government of
Punjab, Pakistan. Lastly, changes in crop performance were compared with
changes in studied climate variables (temperature and rainfall). It was found that
increased in mean annual temperature decreased the crop yield. In addition, the
climatic variation imparts negatively on studied crop production in the Central
Punjab (i.e. Jhang) and southern Punjab (i.e. Bahawalnagar) parts and a positive
effect in the northern Punjab (i.e. Attock and Chakwal). It is therefore, suggested
that various agriculture departments be educated regarding outcomes / conclusions
of this study so that formers be trained to take necessary precautions while looking
after their crops at different stages of crop cycle regarding these climatic variables
i.e. temperature and rainfall. This would entail better crop monitoring, requirement
of water at every stage of crop cycle, accurate estimation of yield and better
adaption / mitigation strategies for the future.
83
LITERATURE CITED
Abid, M., Schneider, U. A., & Scheffran, J. (2016). Adaptation to climate change
and its impacts on food productivity and crop income: Perspectives of
farmers in rural Pakistan. Journal of rural studies, 47, 254-266.
Adams, R., Glyer, J. D., & McCarl, B. (1989). The economic effects of climate
change on US agriculture: a preliminary assessment. The Potential Effects
of Global Climate Change on the United States, 1, 4.1-4.56.
Adger, W. N., Brooks, N., Bentham, G., Agnew, M., & Eriksen, S. (2005). New
indicators of vulnerability and adaptive capacity: Tyndall Centre for
Climate Change Research Norwich.
Ali, S., Liu, Y., Ishaq, M., Shah, T., Ilyas, A., & Din, I. U. (2017). Climate change
and its impact on the yield of major food crops: Evidence from Pakistan.
Foods, 6(6), 39.
Arakelyan, I., Moran, D., & Wreford, A. (2017). CLIMATE SMART
AGRICULTURE. Making Climate Compatible Development Happen, 66.
Atta-Krah, A., & Sumberg, J. (1988). Studies withGliricidia sepium for
crop/livestock production systems in West Africa. Agroforestry systems,
6(1-3), 97-118.
Ayub, Z. (2010). Effect of temperature and rainfall as a component of climate
change on fish and shrimp catch in Pakistan. The Journal of
Transdisciplinary Environmental Studies, 9(1), 1-9.
Backlund, P., Janetos, A., & Schimel, D. (2008). The effects of climate change on
agriculture, land resources, water resources, and biodiversity in the United
States. Synthesis and Assessment Product 4.3. Washington, DC: US
Environmental Protection Agency, Climate Change Science Program. 240
p.
Barrow, C. J. (2014). Developing the environment: Problems & management:
Routledge.
Carle, J. (2015). Climate change seen as top global threat. Pew Research Centre, 14.
Change, I. P. O. C. (2014). IPCC. Climate change.
84
Chen, Z., Li, S., Ren, J., Gong, P., Zhang, M., Wang, L., . . . Jiang, D. (2008).
Monitoring and management of agriculture with remote sensing Advances
in land remote sensing (pp. 397-421): Springer.
Cowen, T. (2009). Creative destruction: How globalization is changing the world's
cultures: Princeton University Press.
Fan, S., & Pandya-Lorch, R. (2012). Reshaping agriculture for nutrition and health:
Intl Food Policy Res Inst.
Folke, C., Carpenter, S., Walker, B., Scheffer, M., Elmqvist, T., Gunderson, L., &
Holling, C. S. (2004). Regime shifts, resilience, and biodiversity in
ecosystem management. Annu. Rev. Ecol. Evol. Syst., 35, 557-581.
Gagné, K. (2016). Cultivating Ice over Time: On the Idea of Timeless Knowledge
and Places in the Himalayas. Anthropologica, 58(2), 193-210.
Godfray, H. C. J., Beddington, J. R., Crute, I. R., Haddad, L., Lawrence, D., Muir, J.
F., . . . Toulmin, C. (2010). Food security: the challenge of feeding 9 billion
people. Science, 1185383.
Halvorssen, A. M. (2007). Common, but differentiated commitments in the future
climate change regime-Amending the Kyoto Protocol to include Annex C
and the Annex C Mitigation Fund. Colo. J. Int'l Envtl. L. & Pol'y, 18, 247.
Handmer, J., Honda, Y., Kundzewicz, Z. W., Arnell, N., Benito, G., Hatfield, J., . . .
Sherstyukov, B. (2012). Changes in impacts of climate extremes: human
systems and ecosystems Managing the Risks of Extreme Events and
Disasters to Advance Climate Change Adaptation Special Report of the
Intergovernmental Panel on Climate Change (pp. 231-290):
Intergovernmental Panel on Climate Change.
Heal, G. M. (2000). Nature and the marketplace: capturing the value of ecosystem
services: Island Press.
Hoegh-Guldberg, O. (1999). Climate change, coral bleaching and the future of the
world's coral reefs. Marine and freshwater research, 50(8), 839-866.
Holling, C. S. (1973). Resilience and stability of ecological systems. Annual review
of ecology and systematics, 4(1), 1-23.
85
Howden, S. M., Soussana, J.-F., Tubiello, F. N., Chhetri, N., Dunlop, M., & Meinke,
H. (2007). Adapting agriculture to climate change. Proceedings of the
national academy of sciences, 104(50), 19691-19696.
Janjua, P. Z., Samad, G., Khan, N. U., & Nasir, M. (2010). Impact of climate change
on wheat production: A case study of Pakistan [with Comments]. The
Pakistan Development Review, 799-822.
Jovanovic, Z., & Stikic, R. (2012). Strategies for improving water productivity and
quality of agricultural crops in an era of climate change Irrigation Systems
and Practices in Challenging Environments: InTech.
Keshavarz, M., Karami, E., & Vanclay, F. (2013). The social experience of drought in
rural Iran. Land Use Policy, 30(1), 120-129.
Knutson, T. R., McBride, J. L., Chan, J., Emanuel, K., Holland, G., Landsea, C., . . .
Sugi, M. (2010). Tropical cyclones and climate change. Nature geoscience,
3(3), 157.
Kolmannskog, V. (2010). Climate change, human mobility, and protection: Initial
evidence from Africa. Refugee Survey Quarterly, 29(3), 103-119.
Leckie, D. G. (1990). Advances in remote sensing technologies for forest surveys and
management. Canadian Journal of Forest Research, 20(4), 464-483.
Leichenko, R., Thomas, A., & Barnes, M. (2010). Vulnerability and adaptation to
climate change. Routledge handbook of climate change and society, 133-
151.
Lipper, L., Thornton, P., Campbell, B. M., Baedeker, T., Braimoh, A., Bwalya, M., . .
. Henry, K. (2014). Climate-smart agriculture for food security. Nature
Climate Change, 4(12), 1068.
Lobell, D. B., Burke, M. B., Tebaldi, C., Mastrandrea, M. D., Falcon, W. P., &
Naylor, R. L. (2008). Prioritizing climate change adaptation needs for food
security in 2030. Science, 319(5863), 607-610.
Lobell, D. B., Ortiz-Monasterio, J. I., Asner, G. P., Naylor, R. L., & Falcon, W. P.
(2005). Combining field surveys, remote sensing, and regression trees to
understand yield variations in an irrigated wheat landscape. Agronomy
Journal, 97(1), 241-249.
86
Mahato, A. (2014). Climate change and its impact on agriculture. International Journal
of Scientific and Research Publications, 4(4), 1-6.
Mather, P. M., & Koch, M. (2011). Computer processing of remotely-sensed images:
an introduction: John Wiley & Sons.
McCalla, A. F., & sh, J. (2006). Reforming Agricultural Trade for Developing
Countries (Vol. 1) Key Issues for a Pro-Development Outcome of the Doha
Round: The World Bank.
Mendelsohn, R., Dinar, A., & Williams, L. (2006). The distributional impact of
climate change on rich and poor countries. Environment and Development
Economics, 11(2), 159-178.
Menon, S., & Bawa, K. S. (1997). Applications of geographic information systems,
remote-sensing, and a landscape ecology approach to biodiversity
conservation in the Western Ghats. Current Science, 134-145.
Metz, B. (2007). Climate change 2007: mitigation: contribution of working group III
to the fourth assessment report of the intergovernmental panel on climate
change: Intergovernmental Panel on Climate Change.
Moran, K. P., Martner, B. E., Post, M., Kropfli, R. A., Welsh, D. C., & Widener, K. B.
(1998). An unattended cloud-profiling radar for use in climate research.
Bulletin of the American Meteorological Society, 79(3), 443-456.
Naheed, G., & Rasul, G. (2010). Projections of crop water requirement in Pakistan
under global warming. Pakistan Journal of Meteorology, 7(13).
Nasir, M., & Rehman, F. U. (2011). Environmental Kuznets curve for carbon
emissions in Pakistan: an empirical investigation. Energy Policy, 39(3),
1857-1864.
Nordhaus, W. D. (1991). To slow or not to slow: the economics of the greenhouse
effect. The economic journal, 101(407), 920-937.
Parry, M., Arnell, N., McMichael, T., Nicholls, R., Martens, P., Kovats, S., . . .
Fischer, G. (2001). Millions at risk: defining critical climate change threats
and targets. Global environmental change, 11(3), 181-183.
Parry, M., Rosenzweig, C., & Livermore, M. (2005). Climate change, global food
supply and risk of hunger. Philosophical Transactions of the Royal Society
of London B: Biological Sciences, 360(1463), 2125-2138.
87
Parry, M. L., Rosenzweig, C., Iglesias, A., Livermore, M., & Fischer, G. (2004).
Effects of climate change on global food production under SRES emissions
and socio-economic scenarios. Global environmental change, 14(1), 53-67.
Rost, S., Gerten, D., Hoff, H., Lucht, W., Falkenmark, M., & Rockström, J. (2009).
Global potential to increase crop production through water management in
rainfed agriculture. Environmental Research Letters, 4(4), 044002.
Schütte, S., & Kreutzmann, H. (2016). Social Vulnerability in Sindh. Recent Floods as
Amplifiers of Social Crisis in Pakistan. Internationales Asienforum, 43(3-
4), 199-221.
Shahid, S. (2011). Impact of climate change on irrigation water demand of dry season
Boro rice in northwest Bangladesh. Climatic change, 105(3-4), 433-453.
Singh, N., & Bantilan, M. (2009). Climate Change Resilience in Agriculture:
Vulnerability and Adaptation Concerns of Semi-Arid Tropics in Asia.
Smit, B., & Skinner, M. W. (2002). Adaptation options in agriculture to climate
change: a typology. Mitigation and adaptation strategies for global change,
7(1), 85-114.
Tengö, M., & Belfrage, K. (2004). Local management practices for dealing with
change and uncertainty: a cross-scale comparison of cases in Sweden and
Tanzania. Ecology and Society, 9(3).
Wheeler, T., & Von Braun, J. (2013). Climate change impacts on global food security.
Science, 341(6145), 508-513.