Embed Size (px)
Citation preview

REPORT TO THE
JOINT LEGISLATIVE AUDIT AND REVIEW COMMISSION
Impact Assessment of State-Level
Economic Development Grants
NICOLE GAFFEN XINGCHEN WANG
JARED WILKERSON DECEMBER 2011

1
ACKNOWLEDGEMENTS:
Dr. Greg Rest and Massey S. J. Whorley, JLARC
Professor Eric Jensen and Professor David Finifter, College of William & Mary,
Course Instructors
Professor Elaine McBeth and Professor John McGlennon, College of William & Mary,
Faculty Advisors
Rui Pereira, College of William & Mary, assistance with IMPLAN
Any opinions expressed here are those of the authors and not Joint Legislative Audit
and Review Commission staff. Any errors or omissions are the sole responsibility of
the authors.

2
TABLE OF CONTENTS
I. EXECUTIVE SUMMARY ............................................................................................................................ 5
II. INTRODUCTION ..................................................................................................................................... 6
A. Directive from the General Assembly ............................................................................................... 6
B. Overview of JLARC Special Report on Development Grants ............................................................. 7
1. Key Findings and Recommendations ............................................................................................. 7
C. Non-Grant Economic Development Incentives ................................................................................. 8
1. Tax Incentives ................................................................................................................................ 9
2. Technology Zones .......................................................................................................................... 9
3. Financial Assistance ....................................................................................................................... 9
4. Managing and Technical Support ................................................................................................ 10
D. Economic Development Grants ...................................................................................................... 10
1. Governor’s Opportunity Fund (GOF) ........................................................................................... 10
2. Virginia Investment Partnership (VIP) Grant ............................................................................... 11
3. Major Eligible Employer (MEE) Grant .......................................................................................... 12
4. Virginia Economic Development Incentive Grant (VEDIG) .......................................................... 12
5. Clean Energy Manufacturing Incentive Grant (CEMIG) ............................................................... 12
6. Virginia Jobs Investment Program (VJIP) ..................................................................................... 13
7. Economic Development Access Program (EDAP) ........................................................................ 13
8. Rail Industrial Access Program (RIAP) .......................................................................................... 13
9. Transportation Partnership Opportunity Fund (TPOF) ................................................................ 14
10. Tobacco Region Opportunity Fund (TROF) ................................................................................ 14
III. EVALUATION OF JOB CREATION ........................................................................................................ 15
A. Rationale ......................................................................................................................................... 15
B. Methodology ................................................................................................................................... 15
1. Job Projections Database ............................................................................................................ 16
2. Job Creation Database ................................................................................................................. 16
C. Job Creation ..................................................................................................................................... 18
1. Evaluation Conducted on Original Data ...................................................................................... 19
2. Evaluation Conducted under Bracketing System ........................................................................ 20
D. Job Creation by Sector .................................................................................................................... 24

3
1. Performance of Manufacturing Sectors ...................................................................................... 25
2. Performance of White Collar Sectors .......................................................................................... 26
3. Average Salary by Sector ............................................................................................................. 26
4. Sector Economic Multipliers ........................................................................................................ 28
IV. STATE-LEVEL GRANT EXPENDITURES & TAX REVENUES .................................................................... 30
A. State-Level Grant Expenditures....................................................................................................... 30
1. Aggregate Grant Awards ............................................................................................................. 30
2. Aggregate Grant Expenditures .................................................................................................... 32
B. State-Level Tax Revenues ................................................................................................................ 34
1. Using IMPLAN to Estimate State-Level Tax Revenues ................................................................. 34
2. Sector-Level Analysis of State-Level Tax Revenues ..................................................................... 36
C. Comparison of State-Level Expenditures and Revenues ................................................................. 37
V. CYCLICAL AND COUNTER-CYCLICAL TRENDS ....................................................................................... 39
A. Effect of Business and Election Cycles on Job Projections .............................................................. 39
B. Effect of Business and Election Cycles on Grant Awards ................................................................ 41
VI. CASE STUDIES ..................................................................................................................................... 43
A. Goodyear Automotive Service ........................................................................................................ 43
B. STIHL, Incorporated ......................................................................................................................... 44
C. Barber & Ross Company .................................................................................................................. 45
D. Eli Lilly and Company....................................................................................................................... 46
VII. Recommendations for Further Evaluation ....................................................................................... 48
A. Limitations to Using Input-Output Software ................................................................................... 48
B. Considerations for Current Development Incentive Policies .......................................................... 50
VIII. Conclusion ....................................................................................................................................... 52
APPENDIX 1: GRANT PROGRAM GUIDELINES ............................................................................................. 55
APPENDIX 2: ANNUAL JOBS COMPARISON TABLES .................................................................................... 60
APPENDIX 3: JOB PROJECTIONS AND CREATION BY SECTOR...................................................................... 78
APPENDIX 4: STATE-LEVEL GRANT EXPENDITURES AND REVENUES BY SECTOR ........................................ 87
APPENDIX 5: TOTAL EFFECT ON EMPLOYMENT AND OUTPUT BY SECTOR ................................................ 90
APPENDIX 6: METHODOLOGY OF USING IMPLAN ...................................................................................... 98
References ................................................................................................................................................ 100

4
LIST OF TABLES
TABLE III-A: AVERAGE ANNUAL RATIOS OF JOB CREATION ................................................................................. 18
TABLE III-B: JOB CREATION PERFORMANCE WITHIN FIVE YEARS OF PROJECT ANNOUNCEMENT ..................... 20
TABLE III-C: AGGREGATE JOB CREATION .............................................................................................................. 21
TABLE III-D: JOB CREATION PERFORMANCE (PROJECTS MEETING LESS THAN 75% OF PROJECTIONS) ....... 22
TABLE III-E: JOB CREATION PERFORMANCE (PROJECTS MEETING BETWEEN 75 AND 99.99% OF
PROJECTIONS) ................................................................................................................................................... 23
TABLE III-F: JOB CREATION PERFORMANCE (PROJECTS MEETING OR EXCEEDING PROJECTIONS) .................. 24
TABLE IV-A: AGGREGATE GRANT AWARDS AND PLEDGES .................................................................................... 30
TABLE IV-B: AGGREGATE GRANT EXPENDITURES FOR QUANTIFIED GRANTS ..................................................... 33
TABLE IV-C: AGGREGATE GRANT EXPENDITURES.................................................................................................. 34
TABLE IV-D: STATE AND LOCAL TAX REVENUES ................................................................................................... 36
TABLE IV-E: STATE-LEVEL EXPENDITURES AND REVENUES ................................................................................. 37
TABLE V-A: BUSINESS CYCLES, 1999-2007 ....................................................................................................... 40
TABLE V-B: STATE-WIDE ELECTION CYCLES, 1999-2007 ................................................................................ 41
TABLE 3A: JOBS COMPARISON (SECTORS EXCEEDING JOB CREATION PROJECTIONS) ..................................78
TABLE 3B: JOBS COMPARISON (SECTORS MEETING STANDARD GRANT REPAYMENT CUTOFF) ......................79
TABLE 3C: JOBS COMPARISON (SECTORS MEETING BETWEEN 50-74.99% OF PROJECTIONS) ...................80
TABLE 3D: JOBS COMPARISON (SECTORS MEETING LESS THAN 50% OF JOB CREATION PROJECTIONS) .....81
TABLE 3E: ECONOMIC MULTIPLIERS BY SECTOR ...........................................................................................82
TABLE 3F-1: HIGHEST PERFORMING DEVELOPMENT PROJECTS (JOB CREATION RATIO) ...............................83
TABLE 3F-2: HIGHEST PERFORMING DEVELOPMENT PROJECTS (NET JOBS) .................................................84
TABLE 3G: AVERAGE HOURLY WAGE BY SECTOR ..........................................................................................85
TABLE 3H: GRANT AWARDS BY SECTOR........................................................................................................86
LIST OF FIGURES
FIGURE III-A: JOBS COMPARISON .…………………………………………………………………………………………………20
FIGURE V-A: BUSINESS AND ELECTION CYCLE TRENDS (JOB CREATION PROJECTIONS) …………………………40
FIGURE V-B: BUSINESS AND ELECTION CYCLE TRENDS (GRANT AWARDS)……………………………………………42

5
I. EXECUTIVE SUMMARY
Virginia offers numerous economic development incentives to
businesses contemplating relocation to or expansion within the state. A
report on the effectiveness of these grant programs conducted by JLARC
in 2002 followed the results of development projects announced in 1997
and 1998. The report revealed that over-performing companies
compensated for both under-performing and non-performing companies in
terms of job creation. Additionally, these jobs produced individual income
tax revenues that allowed the state to recover the costs of GOF and
workforce service training grants within two and a half years.
The current update examines development projects announced
over nine years (1999-2007), which includes periods of recession and
expansion, as well as Republican and Democrat control of the
governorship. Job projections resulting from the development projects
exceeded 131,000. A bracketing system was applied to projects for which
data could not be obtained, resulting in job creation estimates ranging
from approximately 58,845 to 94,825 – a finding notably distinct from the
result of the 2002 report. If the indirect and induced effects of direct job
creation are factored in, however, projections are well exceeded.
Manufacturing companies tended to come closest to meeting metrics
established in performance agreements, while companies creating non-
manufacturing jobs brought the highest net number of jobs to the state.
The state promised $346.32 million in quantifiable grants to the
490 development projects announced within this timeframe. Estimated
expenditures ranged from $204.27 million under the lower bound of the
bracketing system to $234.93 million under the upper bound. Despite the
lower rate of job creation than present in the 2002 report, however,
estimated state-level tax revenues more than matched grant expenditures.
Revenues were estimated for jobs created by direct, indirect, and induced
effects over a two to three year period; as a result, estimates are likely low.
Even so, tax revenues significantly exceed expenditures – estimated state
collections range from $460.52 million under the lower bound to $1.11
billion under the upper bound.
Incentive grants appear to be a revenue-enhancing policy that
provides added benefits for the state in terms of lower unemployment and
the maintenance of a highly ranked business climate. It is in Virginia’s
best interest to maintain these grant programs to more effectively compete
with regional and national competitors. There is room, however, for a
thorough re-evaluation of the policies governing grant programs.
Additionally, the state should consider targeting grants to sectors that tend
to meet performance metrics (briefly examined in this study).
STUDY HIGHLIGHTS
Timeframe: 1999-2007
Development Projects:
490
Total Job Projections:
131, 767
Estimated Job Creation:
Lower Bound - 58,845
Mid-Level - 87,787
Upper Bound - 94,825
Total Grant Awards:
$346.32 million
Total Grant
Expenditures:
Lower- $238.79 million
Mid- $268.61 million
Upper- $275.51 million
State-Level Tax Revenue:
Lower- $460.52 million
Mid- $1,081.08 million
Upper- $1,110.45 million
Net State Revenue: Lower- $78.75 million
Mid- $695.41 million
Upper- $723.55 million
Projects Exceeding Job
Projections: 112
Projects Achieving Job
Projections: 20
6
II. INTRODUCTION
The effects of the most recent recession are still being felt in Virginia, particularly for the
nearly 300,000 unemployed who comprise a ―jobs gap‖ between pre-recession and post-
recession employment levels.1 While economic development incentives cannot alone bridge the
gap, effective programs can bring high-paying jobs to localities and needed employment to areas
of economic decline, such as Southwestern Virginia. Consequently, the Virginia General
Assembly has directed that a study be undertaken to evaluate the effectiveness of current grant
incentive programs – this study provides an initial examination of the program policies, the
resulting impacts of economic development supported by grants, and avenues of future
consideration for the year-long study to be conducted by the Joint Legislative Audit and Review
Commission (JLARC).
A. Directive from the General Assembly
In February 2011, the General Assembly directed JLARC to evaluate the effectiveness of
state-level economic development grants. Senate Joint Resolution 329 noted the substantial
increase in funds such programs have received over the past decade, in addition to an increase in
the number of programs themselves (such as the establishment of the Clean Energy
Manufacturing Incentive Grant in 2011). An important aspect of evaluating program
effectiveness is whether, in light of other factors impacting company decisions to locate or
expand in the Commonwealth, economic development grants provide Virginia with an advantage
over competing states.2
The legislature mandated that the report include three elements. First, identify grant
programs currently offered by Virginia and the extent to which businesses make use of these
incentives. Second, evaluate the extent to which each grant program fulfills the public policies
―for which the grant programs were established.‖3 Third, recommend a method for conducting
ongoing analysis of the effectiveness of these incentive programs.4 The present study will focus
on the first and third elements, providing an update to JLARC’s 2002 Special Report, ―State
Business Incentive Grant Programs.‖ This report will first provide a broad overview of economic
development incentives, as well as a detailed examination of the major development grants

7
offered by the State of Virginia. Following is an analysis of the effectiveness of major economic
development grant programs in Virginia based on job creation performance. A cost-effectiveness
analysis is also conducted, weighing grant expenditures against state-level tax revenues. For both
of these measures of effectiveness, a sector-level analysis is also conducted, revealing which
industry sectors are highest performing. Next, an examination of business and election cycles
reveals whether there are cyclical or counter-cyclical effects on employment or grants. This
report then discusses four specific development projects in-depth, providing additional insight
into why certain projects are more successful than others. Finally, this report provides
recommendations for future evaluation of development grants and suggests several policies that
should be re-examined in light of the findings.
B. Overview of JLARC Special Report on Development Grants
The 2002 JLARC report examined economic development projects announced over a two
year period, 1997-1998. All eighty-nine projects received incentive grants from the
Commonwealth; their record of job creation was tracked for five years following the
announcement. Over the course of the report, JLARC implemented two fundamental
assumptions: (1) but for the promised grants, Virginia would not have received the investment of
companies to whom the grants were promised, and (2) all jobs created following the
announcement of a development project could be attributed to the initial promise of grant funds.5
This study continues to rely on those assumptions. This study will also evaluate current findings
against those contained in the 2002 report to assess whether program effectiveness remained
constant over the past decade.
1. Key Findings and Recommendations
A principal finding of the original report revealed that while many companies did not
create the number of jobs promised, those that exceeded performance agreements created enough
jobs to meet the total of annually announced projections.6 Several over-performing companies
created as many as three to four times the number of jobs initially projected, thereby
compensating for under-performing or non-performing companies. This study will examine
certain characteristics of over-performing companies that may allow state officials to better

8
target grant funds. Recommendations following from this analysis may allow the state to better
target grant awards to businesses that are more likely to meet performance metrics.
JLARC also found that estimated individual income tax revenues collected from jobs
directly created by development projects outweighed grant expenditures within three years of the
project announcement.7 Such an estimate was conservative because it did not include increased
revenue from other state-level taxes (such as corporate or sales taxes), leading to greater
certainty that financial benefits outweighed program costs. Consequently, JLARC recommended
that the two major grant programs, GOF and Workforce Services, remain functional - a
recommendation based on the conclusion that negative long-term consequences would result if
Virginia eliminated these programs. Among these negative impacts would be the creation of
fewer new jobs due to businesses deciding to locate in competing states. In the two or three years
following such a cut, ―the State’s resulting loss of individual income tax revenues would likely
be more than the amount that was saved by cutting these programs.‖8 This study will conduct a
similar cost-effectiveness analysis, although it makes use of a different method to estimate tax
revenue that more broadly reflects overall revenues collected by the state. Such a method will
provide a more detailed measure of the extent to which grant programs are revenue-enhancing
for the state.
There was a negative finding of the special report, however: some grant recipients may
pose risks that outweigh the positive impacts of job creation and capital investment.9 Such
impacts include undesirable business practices, which result in negative externalities for the state
and its citizens.A
Consequently, JLARC concluded that additional screening should be
implemented before the state awards grant funds.10
The case studies presented within this report
also examine the likelihood of local or state-level economic development officials detecting risks
before grants are awarded.
C. Non-Grant Economic Development Incentives
Virginia offers a wide variety of incentives targeted at businesses locating or expanding
in the state in an effort to successfully compete nationally and internationally. As development
A Examples of negative externalities include pollution and health-related impacts. Additionally, the 2002 report
uncovered a telemarketing firm that engaged in deceptive trade practices – before Virginia awarded the business
grant money, approximately twenty states initiated legal proceedings against it.

9
grants are just one of the Commonwealth’s many economic enticements, this section frames the
broad incentives available to qualifying businesses by briefly introducing non-grant incentives.
1. Tax Incentives
Virginia offers three types of tax incentives: corporate income, property, and sales and
use. Corporate income tax credits are not targeted towards all businesses; rather, they incentivize
certain behaviors. Thus, credits are available for businesses that create green jobs or a significant
number of new jobs, manufacturers purchasing recycling equipment, businesses that retrain
workers or invest in research and development, entities that increase their port volume, and
companies that use rail or barges instead of highways to transport goods.11
Property tax incentives are implemented solely at the local level. Localities have the
option to fully or partially waive taxes for property such as recycling equipment, rehabilitated
real estate, solar energy devices, and environmental restoration sites. Furthermore, localities can
reduce tax rates on items such as research and development property, semiconductor
manufacturing machinery, clean-fuel vehicles, and energy-efficient buildings.12
Finally, Virginia offers sales and use tax exemptions for the purchase or lease of certain
goods, such as semiconductor clean rooms, internet access charges, custom computer software,
and certain utilities.13
2. Technology Zones
Technology zones are created by local ordinances to attract technology-oriented
businesses. Qualifying businesses in these zones may receive fee waivers, local tax incentives,
and exemption from ordinances.14
3. Financial Assistance
The Virginia Small Business Financing Authority, a branch of the Virginia Department
of Business Assistance (VDBA), provides programs to make capital available to expanding
businesses and communities. These programs include the issuing of industrial development
bonds, guaranteeing loans to small businesses, and subsidizing loan portfolio insurance to
business-lending banks.15

10
4. Managing and Technical Support
The Center for Innovative Technology (CIT) provides two service lines to aid small
companies when accessing investment opportunities. First, CIT Entrepreneur connects
innovative companies with early-stage investors. Second, CIT R&D helps researchers transition
federally-funded and other research projects into commercial products and, ultimately, into
businesses or licensing opportunities. Additionally, the Virginia Small Business Development
Center Network, the Virginia Economic Development Partnership (VEDP)’s Division of
International Trade, and the Virginia Leaders in Export Trade program all assist their target
constituencies in achieving goals by strengthening small businesses and increasing international
trade.16
These diverse economic incentives often work in tandem with the subject of this report,
economic development grants, to encourage businesses to locate or expand in Virginia.
D. Economic Development Grants
The state offers a number of grant programs – some are available to any company that
can meet eligibility requirements based on capital investment and job creation, while others are
highly specialized and only offered to companies providing certain services or belonging to
specific industries. This section outlines ten major development programs; of these, the
Governor’s Opportunity Fund and Virginia Jobs Investment Partnership are the largest in terms
of both the number and size of grants awarded.
1. Governor’s Opportunity Fund (GOF)
The Virginia General Assembly established the GOF as a ―deal closer‖ that
provides performance grants to relocating or expanding businesses
deciding between several competing states.17
The governor exercises
discretion when offering funds to businesses, although recipients must meet
eligibility requirements, and projects must ―bring additional income into
the Commonwealth.‖18
The governor also maintains final approval of the
amount of the grant itself, considering recommendations made by VEDP
and negotiations conducted by the Secretary of Commerce and Trade with
the prospective recipient.19

11
The grant is given to localities—which provide matching funds—and then
applied towards site preparation, the expansion of utilities, and
infrastructure development.20
VEDP gives priority to projects in localities
with high unemployment rates, which must receive at least one-third of
total funds.21
The limit on grant payments per development project is $1.5
million, although the governor may approve a higher payout for projects
that ―are of statewide or regional interest.‖22
One vetting mechanism
applies to businesses that have ―closed, downsized, consolidated, or laid off
employees within the past 30 months‖ prior to applying for a grant,
although such actions do not necessarily preclude these businesses from
receiving funds.23
2. Virginia Investment Partnership (VIP) Grant
The General Assembly established VIP through the Virginia Investment
Partnership Act (VIPA) to benefit Virginia businesses maintaining at least
a five-year presence in the Commonwealth.24
Funds are intended for
manufacturing companies or associated research and development
operations to support increased production capacity and productivity,
facility modernization, and the development and implementation of
advanced technology.25
Grant payments per project are generally limited to
$3 million, subject to eligibility requirements (including a restriction on
receiving other state-level incentive grants). Grants of up to $5 million are
available for projects meeting more rigorous performance standards. An
increase in grant payments is also possible following the creation of new
jobs.26
VIP grant amounts are based on recommendations by VEDP and
negotiations conducted by the Secretary of Commerce and Trade, then
subject to final approval by the governor.27
Grants are paid with funds
appropriated by the General Assembly, and there is a program ceiling of $6
million in any given year.28
In FY 2010, four VIP
grants were awarded to
businesses, totaling $4.85
million. These businesses
announced new capital
investment of $500.5
million and the
anticipated creation of
681 new jobs and the
retention of 150 existing
jobs.
Source: VEDP
The General Assembly has
appropriated more than
$216 million to the Fund
since its inception in
1992.
In FY 2010, sixteen GOF
grants were awarded to
businesses, totaling $6.37
million. These businesses
announced new capital
investments of $288.9
million and the
anticipated creation of
2,998 jobs.
Source: VEDP

12
3. Major Eligible Employer (MEE) Grant
VIPA also established the MEE program, a discretionary performance
incentive geared towards existing Virginia manufacturers and non-
manufacturing basic employers.29
Eligibility requirements are more
rigorous than with VIP, although recipients are also prohibited from
simultaneously receiving other state-level grants.30
The MEE grant award
is based on VEDP recommendations and negotiations led by the Secretary
of Commerce and Trade. The governor retains final approval of all
payments.31
Funds for MEE grants are subject to appropriations by the
General Assembly, and payments cannot exceed $25 million per project.
Businesses must complete capital investment and job creation within five
years, although extensions are possible.32
4. Virginia Economic Development Incentive Grant (VEDIG)
VEDIG was also established by VIPA.33
Funds are targeted towards
Virginia businesses seeking to locate ―significant headquarters,
administrative or service sector operations‖ in the state.34
The governor
reserves final approval of each grant awarded based on recommendations
made by VEDP and negotiations conducted by the Secretary of Commerce
and Trade.35
Eligibility requirements differ based on locality; businesses
are ineligible if they simultaneously benefit from other state grant programs
or receive VIP or MEE funds.36
The VEDIG program is limited to annual
payouts of $6 million, and aggregate outstanding awards may not exceed
$30 million.37
5. Clean Energy Manufacturing Incentive Grant (CEMIG)
The General Assembly established CEMIG in 2011; program funds are
subject to annual appropriations.38
CEMIG is targeted towards clean energy
manufacturers seeking to locate or expand their business in the
Commonwealth and is intended to improve business performance, not fund
initial site preparation or infrastructure development.39
CEMIG limits the
maximum grant awarded to $9 million for eligible businesses, although the
In FY 2010, no businesses
were awarded MEE
grants.
Source: VEDP
In FY 2010, VEDIG funds
were awarded to one
business, which
announced new capital
investment of $25 million
and the anticipated
creation of 1,200 jobs.
Source: VEDP

13
governor is able to authorize a higher payout ―for projects with significant
state or regional interest.‖40
6. Virginia Jobs Investment Program (VJIP)
VJIP provides partial reimbursement for customized recruiting and training
services to companies creating new jobs or experiencing technological
change.41
Eligibility requirements ensure that a company is for-profit and
pays a minimum wage of $10 per hour (this requirement may be waived in
some localities due to high unemployment rates). Additionally, only certain
businesses are eligible: manufacturers, distribution centers, corporate
headquarters, call centers, informational technology services, and research
and development facilities. VJIP offers three programs to better serve
businesses with different workforce training needs: the New Jobs Program,
the Small Business New Jobs Program, and the Retraining Program.42
7. Economic Development Access Program (EDAP)
EDAP is a state-funded program administered by the Virginia Department
of Transportation (VDOT) and allocated by the Commonwealth
Transportation Board (CTB). The program provides funds to localities for
road improvements needed for adequate access for new or substantially
expanding qualifying projects. The award amount is determined by the
eligible capital investment of the company and the estimated cost of the
access road.43
The maximum award for an economic development access
road is $0.5 million; however, an additional $0.15 million is available but
must be matched dollar-for-dollar by the locality.
8. Rail Industrial Access Program (RIAP)
Administrated by the Virginia Department of Rail and Public
Transportation, RIAP operates in a similar manner to EDAP—funds are
appropriated to construct railroad tracks for new or substantially expanding
industrial and commercial projects. Eligible localities can receive awards of
In FY 2010,721
businesses received funds
from VJIP to train or
retrain employees.
Workforce training
reimbursements totaled
nearly $7 million.
Source: VEDP
In FY 2010, five grants
were awarded for road
improvements, totaling
$2.65 million.
Source: VEDP
In FY 2010, six grants
were awarded for rail
improvements, totaling
$1.31 million.
Source: VEDP

14
up to $450,000 per fiscal year.44
Up to two-thirds of the grant payment can
be unmatched; the remainder must be matched dollar-for-dollar by the
recipient or from other non-program sources. Each application for funds
must be accompanied by a resolution from the local governing body
requesting an allocation.
9. Transportation Partnership Opportunity Fund (TPOF)
Although VDOT also administers TPOF, the governor awards payments in
the form of grants, revolving loans, or other financing tools and equity
contributions. TPOF can only be granted to supplement activities
associated with eligible transportation projects, which must meet the
minimum criteria established in the GOF Guidelines. Additionally, projects
must address the needs identified in the appropriate state, region or local
transportation plan.45
Once funded by TPOF and completed, transportation
development projects become or remain public property.
10. Tobacco Region Opportunity Fund (TROF)
Administered by the Tobacco Indemnification and Community
Revitalization Commission, TROF provides performance-based grants at
the Commission’s discretion to localities in the tobacco producing region
(thirty-four counties and seven cities located in Southside and
Southwestern Virginia). TROF grants support job creation and capital
investments associated with the establishment or expansion of a business.
The grant amount varies based on local unemployment rate, prevailing
wage rate, capital investment level, industry type, and other factors chosen
by the Commission.46
In FY 2010, one TPOF
grant was awarded to a
business, totaling $3
million.
Source: VEDP
In FY 2010, twenty-five
grants and loans from
TROF were provided to
businesses, totaling $4.86
million.
Source: VEDP

15
III. EVALUATION OF JOB CREATION
A. Rationale
Economic impact assessments often ―enumerate outcomes and . . . assume that any new
activities of assisted firms must be attributable to the economic development program.‖47
Although this study does not assess the impact that many other factors can exert on job creation
numbers (e.g., natural business expansion due to increased sales), and thus cannot determine
strict causation, such enumeration can provide general (although limited) insight into the
effectiveness of development grants. One method of evaluation revealing whether economic
development grants led to job creation is a comparison of the number of jobs projected by each
company and the number of jobs directly created. B
In this case, effectiveness was measured
according to the following categories:
1. Businesses exceeding projections within five years of a project’s announcement
2. Businesses meeting projections within five years
3. Businesses failing to meet projections but still created jobs
4. Businesses failing to meet projections and did not create any jobs
A thorough analysis of the results follows, which includes an examination of the number and
types of businesses that fall into each category.
B. Methodology
A comparison of the projected number of jobs and the actual number of jobs created by a
business resulted from the comparison of two unique databases developed for this report: one
containing job projections (―Job Projections database‖) and another containing the number of
jobs directly created (―Job Creation database‖). Both will be described in detail below.
Examining the performance of companies in meeting job creation projections provides a useful
measure of program effectiveness based upon the most fundamental intent of the grant programs
– to provide employment opportunities for citizens of the Commonwealth.
B Saved jobs were included in the total job projection and creation numbers because VDBA includes them when
making these calculations. Additionally, by saving jobs, the state ensures that employment and tax revenues remain
constant. All further mention of job projections and creation throughout the report will implicitly include the number
of jobs saved as well.

16
1. Job Projections Database
This database included information from press releases publicly announcing development
projects from the Office of Governor between January 1999 and December 2007.48
For each
project announcement, the following information was recorded: (1) the name of the grant
recipient and the location of the economic development, (2) the number of jobs projected to be
created or saved, (3) the value of each grant awarded or pledged, and (4) a description of the
industry in which the jobs would be created.
The press releases covered 497 project announcements between January 1999 and
December 2007, the years for which job creation data allowed an accurate assessment of both
short-term (one to two years following the announcement) and long-term (three to five years
following the announcement) job creation.C From this set of projects, seven were eliminated
because they were awarded to state agencies, did not project job creation, or were not promised
grant funds.D Thus, the final database contained 490 projects.
2. Job Creation Database
Three data sources were used to estimate the number of jobs created or saved. The initial
data source for this study came from the National Establishment Time Series (NETS) database,
which annually tracks the number of employees at each business location in Virginia.49
Approximately half of development projects from the Job Projection Database remained without
employment information after importing the data, due primarily to an inability to find businesses
in the NETS database. Such gaps indicate the presence of a name discrepancy between the press
release and the NETS data or the failure of projects promising to create business locations in
Virginia. Other explanations include companies for which multiple business locations matched
the location given in the press releases, and subsidiaries or company mergers that were listed
under alternative names in NETS. All possible discrepancies were resolved but more than twenty
percent of projects were still without job creation information. Data from VDBA was later
incorporated; the agency provided information on job creation, grant expenditures, and hourly C Dropping 2008-2011 projects from this evaluation allows more accurate comparison among projects incorporating
both short-term and long-term effects. Projects from 2008 may have (at most) four full years of employment data,
depending on the month in which the project was announced – projects announced later have even fewer full years
of employment data. By standardizing the length of time encompassed by long-term effects to five years, direct
comparisons between job creation numbers become more reliable. D These projects are: eToys Inc. (August 23, 2000), DuPont (April 23, 2001), Leica Microsystems (April 25, 2001),
Port of Virginia (October 18, 2001), VEDP (May 27, 2003), Merck & Co., Inc. (February 4, 2005), and Indage
Group (April 25, 2007).

17
wages on companies for which VDBA has records of VJIP training reimbursements. The final
source of job creation data came from the Secretary of Commerce and Trade (SCT), which
provided employment numbers for projects receiving GOF grants.E
To correct for the problem of overlapping and contradictory data, the three data sources
were ranked to fill in job creation information: (1) VDBA (271 projects); (2) SCT (30 projects);
and (3) NETS (87 projects). VDBA data was seen as most reliable, since the information came
directly from the companies and was verified by the state. The same was true of SCT data,
although these reports did not divide job creation between the short- and long-term.F NETS data
often differed from the state data; however, the annual employment numbers provided a more
detailed picture of employment trends.G Using this system filled in job creation information for
388 of the 490 projects from the Job Projection database.
To correct for the problem of missing data for the remaining twenty-one percent of
projects, a bracketing system was applied (lower bound of job creation, mid-level, and upper
bound) to estimate job creation. Under the lower bound estimate – the worst-case scenario – the
condition was imposed that none of the remaining development projects created jobs. Under the
upper bound estimate – the best-case scenario – the condition was imposed that job projections
were fully met for each development project. Finally, under the mid-level estimate, the number
of jobs created for a particular project was assumed to be proportionate to the annual average
E SCT data came from the Secretary’s annual Reports on Business Incentives, 2004-2010. Each report tracks the
performance of GOF funded development projects based on job projections and job creation, in addition to tracking
grant promises, average salaries, and company performance on capital investment. The reports also included
information on projects receiving VIP grants; these employment numbers were not incorporated due to the
inconsistent timeframe over which job creation was measured. For example, Nylstar announced a development
project in April 2000 – the SCT data measures job creation from this point until fiscal year 2010, a nine-year
timeframe. On the other hand, Hershey Chocolate announced a development project in April 2007 – the SCT data
measures job creation from this point until fiscal year 2010, a three-year timeframe. To continue to maintain reliable
comparability between job creation numbers, this information was not included in the database. F These job creation numbers were classified as long-term, since the SCT reports were issued more than two years
after the development projects had been announced. G There is a noteworthy discrepancy between VDBA and NETS data on employment. VDBA data and NETS data
were both available for a total of 181 projects, associated with 43,113 job projections. Aggregating job creation
numbers among all these projects, VDBA data shows the creation of 33,772 jobs within five years, while only
11,192 jobs were created according to NETS. Consequently, we calculated the ratio of job projections to job
creation per project to be .78 from VDBA data and .26 from NETS data. By excluding outliers (where the job
creation to projection ratio is greater than 10 – over 1,000%), the average ratio becomes 0.97 from VDBA data and
0.44 from NETS. Although this gap is still substantial, we placed a floor (0 jobs) on the lowest employment values
that NETS provided for a project. Because NETS recorded negative employment values indicating lost jobs, and
VDBA only provided non-negative employment values, such action standardized the two data sources according to
the state agency data. Consequently, the two ratios of job creation to projections converge slightly: the ratio becomes
0.51 from NETS (after excluding outliers), while the VDBA ratio remains 0.97.
18
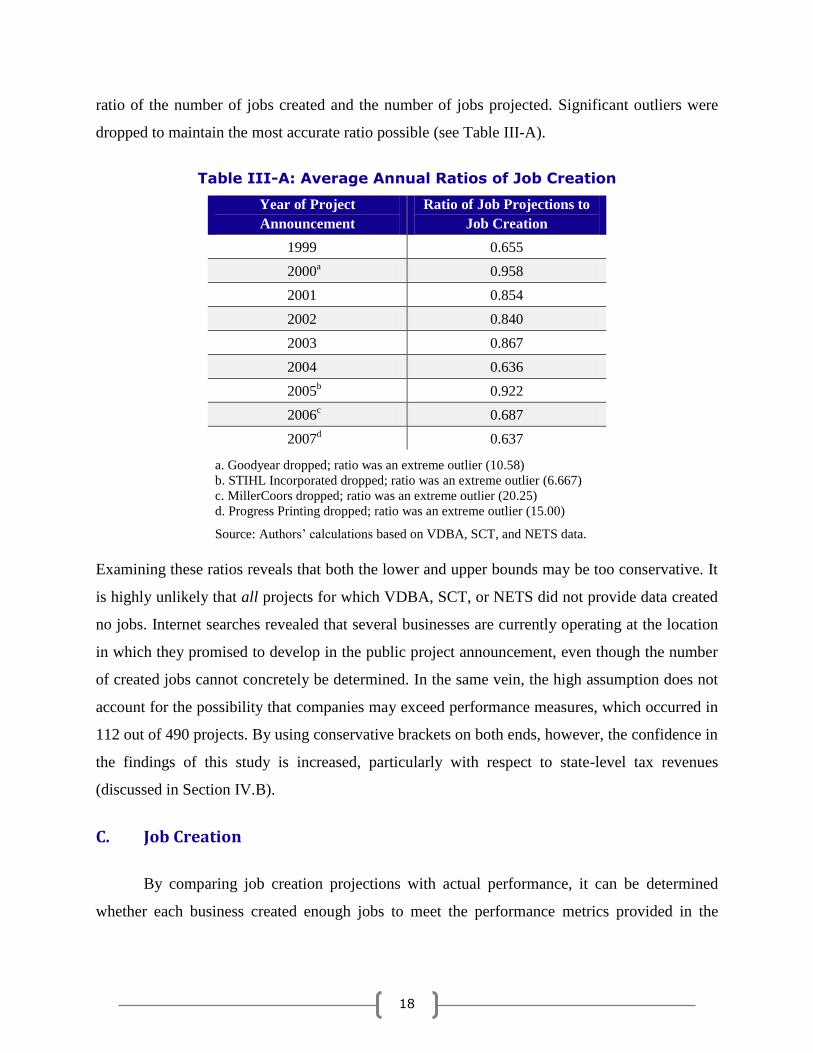
ratio of the number of jobs created and the number of jobs projected. Significant outliers were
dropped to maintain the most accurate ratio possible (see Table III-A).
Table III-A: Average Annual Ratios of Job Creation
Year of Project
Announcement
Ratio of Job Projections to
Job Creation
1999 0.655
2000a 0.958
2001 0.854
2002 0.840
2003 0.867
2004 0.636
2005b 0.922
2006c 0.687
2007d 0.637
a. Goodyear dropped; ratio was an extreme outlier (10.58)
b. STIHL Incorporated dropped; ratio was an extreme outlier (6.667)
c. MillerCoors dropped; ratio was an extreme outlier (20.25)
d. Progress Printing dropped; ratio was an extreme outlier (15.00)
Source: Authors’ calculations based on VDBA, SCT, and NETS data.
Examining these ratios reveals that both the lower and upper bounds may be too conservative. It
is highly unlikely that all projects for which VDBA, SCT, or NETS did not provide data created
no jobs. Internet searches revealed that several businesses are currently operating at the location
in which they promised to develop in the public project announcement, even though the number
of created jobs cannot concretely be determined. In the same vein, the high assumption does not
account for the possibility that companies may exceed performance measures, which occurred in
112 out of 490 projects. By using conservative brackets on both ends, however, the confidence in
the findings of this study is increased, particularly with respect to state-level tax revenues
(discussed in Section IV.B).
C. Job Creation
By comparing job creation projections with actual performance, it can be determined
whether each business created enough jobs to meet the performance metrics provided in the

19
public announcement of the development project. This evaluation was conducted both without
and with the bracketing system to ensure that results remained consistent across scenarios.
1. Evaluation Conducted on Original Data
Job creation projections were not met by businesses that announced development projects
within the nine year timeframe of this study (see Figure III-A). Performance ranged decidedly
among cohorts – projects announced during 2001 had the lowest overall rate of job creation
(29.78%), while projects announced during 2005 had the highest overall rate of job creation
(88.97%).
Figure III-A: Jobs Comparison
Source: VDBA, SCT, and NETS data.
Consequently, within no cohort did the job creation of over-performing companies fully
compensate for under-performing or non-performing companies—a far different conclusion from
JLARC’s 2002 report. A small number of individual projects were often responsible for the
drastic difference between projections and job creation – see Appendix 2 for project-specific
information among cohorts.
Additionally, examining the number of development projects within each of the four
categories described in the introduction to this section reveals both positive outcomes and areas
for improvement. Nearly thirty-five percent of projects exceeded initial job creation projections
within five years of the development project announcement (see Table III-B).
1999 2000 2001 2002 2003 2004 2005 2006 2007
Total job projections 12,75 11,96 13,24 9,624 11,60 17,65 9,019 4,637 5,016
Total job creation 5,005 10,54 3,943 6,467 8,604 10,07 8,024 3,171 3,008
-
2,000
4,000
6,000
8,000
10,000
12,000
14,000
16,000
18,000
20,000
Nu
mb
er o
f J
ob
s
Year of Announcement

20
Table III-B: Job Creation Performance within Five Years of Project Announcement
Year of
Project
Announcement
Exceeded
Projections
Achieved
Projections
Failed to Meet Projections
TOTAL Created Jobs
Created No
Jobs
1999 8 0 23 4 35
2000 15 1 21 3 40
2001 9 2 16 3 30
2002 13 3 26 7 49
2003 23 3 25 7 58
2004 11 2 39 5 57
2005 15 7 24 5 51
2006 8 2 18 7 35
2007 10 0 15 8 33
Total 112 20 207 49 388
Source: Press releases from Office of the Governor; VDBA, SCT, and NETS data.
However, nearly two-thirds of development projects failed to achieve job creation projections.
One positive finding is that a significant majority (81%) of these unsuccessful development
projects did create jobs, even if not the number initially anticipated. On the other hand, nearly
fifty projects failed to create any jobs. Interviews conducted with several regional economic
development officials for the four case studies included in this report (see Section VI) may
provide limited insight into whether a stricter screening process is needed. Although beyond the
scope of this study, a more detailed examination of all forty-nine projects that did not manifest
may reveal whether a re-evaluation of existing screening procedures for grant applicants is
necessary.
2. Evaluation Conducted under Bracketing System
Applying the bracketing system revealed similar results; aggregate job projections were
not met by any cohort under any scenario (see Table III-C). Average job creation across cohorts
ranged from 47.68% under the lower bound estimate to 77.59% under the upper bound estimate.
There was a wide disparity among cohorts in terms of job creation performance, which remained
relatively consistent across the different scenarios. Under the lower bound estimate, job creation
ranged from a low of 24.30% among cohorts from 2001 to a high of 66.81% among 2003
cohorts. These percentages increased significantly under the mid-level estimate. The lowest
percentage of job creation occurred among the 1999 cohorts (46.40%), while the highest

21
occurred among the 2000 cohorts (91.69%). The upper bound estimate reveals similar findings,
although the lowest percentage of job creation is even lower than under the mid-level estimate,
occurring among 2001 cohorts (44.53%). The cohorts in 2006 achieve the highest percentage of
job creation among those in the upper bound estimate (96.29%).
Table III-C: Aggregate Job Creation
Year of
Project
Announcement
Job
Projections
Job Creation
Lower
Bound
% Jobs
Created
Mid-
Level
% Jobs
Created
Upper
Bound
% Jobs
Created
1999 18,450 5,005 27.13% 8,561 46.40% 10,731 58.16%
2000 22,419 10,544 47.03% 20,555 91.69% 21,129 94.25%
2001 16,226 3,943 24.30% 6,492 40.01% 7,226 44.53%
2002 12,840 6,467 50.37% 9,168 71.4% 10,616 82.68%
2003 12,878 8,604 66.81% 9,704 75.35% 10,561 82.01%
2004 25,260 10,079 39.90% 14,918 59.06% 18,631 73.76%
2005 12,279 8,024 65.35% 11,030 89.83% 11,560 94.14%
2006 5,769 3,171 54.97% 3,949 68.45% 5,555 96.29%
2007 5,646 3,008 53.28% 3,409 60.38% 4,091 72.46%
TOTALa 131,767 58,845 47.68% 87,786 66.95% 100,100 77.59%
a. Value for the percentage of jobs created represents an annual average under each scenario.
Source: Job projections from Office of the Governor. Job creation numbers from VDBA, SCT, NETS, and
authors’ calculations.
Moreover, a substantial shortfall of jobs exists under each scenario. The lower bound estimate
yields a shortfall of approximately 73,000 jobs, which decreases to approximately 44,000 jobs
under the mid-level estimate. Even under the upper bound estimate, however, a shortfall of more
than 32,000 jobs exists. This finding implies that over-performing companies did not compensate
for the under-performing companies as they did in the 2002 report. A more detailed evaluation of
the extent to which businesses met performance metrics concerning job creation follows.
Companies receive grant money with the understanding that they will meet 100% of
agreed-upon performance measures, including the number of new or saved jobs. A more refined
analysis of the four categories measuring grant effectiveness under the bracketing system
provides additional information about company performance (see Table III-D).

22
Table III-D: Job Creation Performance within Five Years of Project Announcement
(Development Projects Meeting Less Than 75% of Job Projections)
Estimate Percentage of
Job Creation
Total Jobs
Projected
Total Jobs
Created
Number of
Projects
Lower Bound
0.00% 49,688 0 151
0.01 – 10.00% 9,032 618 27
10.01 – 20.00% 7,950 1,227 15
20.01 – 30.00% 6,546 1,635 21
30.01 – 40.00% 4,459 1,547 23
40.01 – 50.00% 2,715 1,165 18
50.01 – 60.00% 7,747 4,360 30
60.01 – 70.00% 7,717 5,079 29
70.01 – 74.99% 2,287 1,632 6
TOTAL 320
Mid-Level
0.00% 13,708 0 49
0.01 – 10.00% 9,032 618 27
10.01 – 20.00% 7,950 1,227 15
20.01 – 30.00% 6,546 1,635 21
30.01 – 40.00% 4,459 1,547 23
40.01 – 50.00% 2,715 1,165 18
50.01 – 60.00% 7,747 4,360 30
60.01 – 70.00% 22,517 14,653 68
70.01 – 74.99% 2,287 1,632 6
TOTAL 257
Upper Bound
0.00% 13,708 0 49
0.01 – 10.00% 9,032 618 27
10.01 – 20.00% 7,950 1,227 15
20.01 – 30.00% 6,546 1,635 21
30.01 – 40.00% 4,459 1,547 23
40.01 – 50.00% 2,715 1,165 18
50.01 – 60.00% 7,747 4,360 30
60.01 – 70.00% 7,717 5,079 29
70.01 – 74.99% 2,287 1,632 6
TOTAL 218
Source: VDBA, SCT, NETS, and authors’ calculations.
Under all three estimates, a substantial number of companies failed to reach the standard
threshold to avoid grant re-payment (see Appendix 1 for additional information on grant
clawback policies for each program). Under the lower bound estimate, this number was inflated
due to the number of development projects for which no concrete employment information could
be obtained – the 151 projects in this category represents nearly half of all projects that failed to
reach the seventy-five percent threshold. The remaining categories contain a fairly even

23
distribution of projects, with two exceptions: projects creating between sixty and seventy percent
of projected jobs under the mid-level estimate and projects creating between seventy and
seventy-five percent under all estimates. The former can be explained by the average annual
ratios calculated for the 1999, 2004, 2006, and 2007 cohorts (see Table III-A). The latter is an
unexpected finding – a larger clustering of projects below seventy-five percent would be
expected, as businesses that did not meet projections attempt to avoid the clawback of grant
funds.
A more positive finding concerns the number of projects which met the repayment
threshold (see Table III-E).
Table III-E: Job Creation Performance
within Five Years of Project Announcement
(Development Projects Meeting Between 75% and 99.99% of Job Projections)
Estimate Percentage of
Job Creation
Total Jobs
Promised
Total Jobs
Created
Number of
Projects
Lower Bound
75.00 – 80.00% 5,409 4,076 12
80.01 – 90.00% 6,743 5,678 16
90.01 – 99.99% 2195 2,129 10
TOTAL 38
Mid-Level
75.00 – 80.00% 5,409 4,281 12
80.01 – 90.00% 13,613 11,489 49
90.01 – 99.99% 15,905 15,146 38
TOTAL 99
Upper Bound
75.00 – 80.00% 5,409 4,281 12
80.01 – 90.00% 6,143 5,678 16
90.01 – 99.99% 2,195 2,129 10
TOTAL 38
Source: VDBA, SCT, NETS, and authors’ calculations.
Approximately forty projects met this threshold under the lower and upper bound estimates – this
number increases to nearly one hundred under the mid-level estimates. Of note, however, is the
increased number of projects clustered above the seventy-five percent threshold (twelve)
compared with the number clustered below (six). Such a finding may substantiate the above
hypothesis and show that businesses are more successful at reaching such a threshold when job
creation approaches seventy-five percent.
Twenty projects met job creation projections under both the lower bound and mid-level
estimates (see Table III-F).

24
Table III-F: Job Creation Performance within Five Years of Project Announcement
(Development Projects Meeting or Exceeding Job Creation Projections)
Estimate Percentage of
Job Creation
Total Jobs
Promised
Total Jobs
Created
Number of
Projects
Lower Bound 100% 3,714 3,714 20
over 100% 15,565 25,780 112
TOTAL 132
Mid-Level 100% 3,714 3,714 20
over 100% 15,565 25,780 112
TOTAL 132
Upper Bound 100% 39,694 39,694 122
over 100% 15,565 25,780 112
TOTAL 234
Source: VDBA, SCT, NETS, and authors’ calculations.
The number of projects meeting this threshold under the upper level estimate is much higher
(112 projects) due to the condition of full job creation imposed on this scenario. A very positive
finding concerns the number of development projects exceeding initial
projections, however. Approximately twenty-three percent of all
development projects announced between 1999 and 2007 created more
jobs than initially anticipated, resulting in an additional 10,000 jobs
state-wide. While beyond the scope of this study, the state would benefit
from further analysis of the types of development projects that are high performing. The results
of such an analysis would allow the state to better target grants to businesses that will provide
added value in the form of additional jobs and tax revenues.
D. Job Creation by Sector
Examining sector-level output may provide beneficial guidelines as to which sectors
generally meet (or exceed) performance measurements and which offer the highest-quality jobs
for localities. These factors are important to consider when evaluating the effectiveness of
economic development grants. Additionally, knowledge about sector performance may help state
officials to target grants towards companies that are more likely to be successful, however that
term is defined.
Number of projects
exceeding job creation
projections: 112
Number of additional jobs
created: 10,215

25
Ten sectors exceeded total job creation projections for the sector based on mid-level
estimates (see Appendix 3, Table 3A). These sectors represent seventy-eight development
projects projecting the creation of 8,645 jobs and directly creating 10,530 jobs. Several of these
sectors had a low number of projects (between one and three), indicating that a few over-
performing companies positively impacted the high ratio of job creation. Half of the sectors,
however, contained enough projects to be able to assert, with some degree of certainty, that they
represent a positive investment for the state; manufacturing is well-represented among these high
performers.
1. Performance of Manufacturing Sectors
Transportation Equipment Manufacturing (sector 336) contained the highest number of
development projects which exceeded 200% of job creation projections
– eight projects that originally projected 739 jobs but created 2,043 jobs
(see Appendix 3, Table 3F). Plastics and Rubber Products
Manufacturing (sector 326) contained six projects that also met this
threshold of job creation. The performance of one business heavily
influenced this outcome – Essel Propack America undertook four
development projects that anticipated creating 206 jobs but delivered
515 jobs.
The two most successful development projects over the nine year
timeframe of this study in terms of the ratio of projections to creation and the highest number of
net jobs exceeding projections belonged to manufacturing sectors (see
Appendix 3, Tables 3F-1 and 3F-2). The former belongs to Beverage and
Tobacco Product Manufacturing (sector 312). MillerCoors (then Coors
Brewing) announced a development project in 2006 projecting the
creation of eight jobs – within five years, 162 had been created. The
latter belongs to Machinery Manufacturing (sector 333). In 2005,
STIHL, Inc. projected the creation of 150 jobs through the course of
their development project. Job creation reached 1,000 jobs within five
years (see Section VI.B for a detailed case study of the 2005 STIHL
development project).
Highest Performing
Development Project
(Ratio of Projection to
Creation)
MillerCoors (2006)
Jobs Projected: 8
Jobs Created: 162
Ratio: 20.25
Highest Performing
Development Project
(Most Net Jobs
Exceeding Projections)
STIHL, Inc. (2006)
Jobs Projected: 150
Jobs Created: 1,000
Net Difference: 850

26
Such successes are positive for localities due to increased employment and economic
activity, and the state also benefits from increased tax revenues that are not counterbalanced by
additional grant expenditures. These high-performing projects offset to some degree the projects
that significantly underperformed or failed to create jobs; as discussed in Sections III.C.1 and
III.C.2, however, these projects could not fully compensate for the shortfalls in job creation.
2. Performance of White Collar Sectors
White collar sectors had the highest overall projections for job
creation, although their performances were often not as successful as that
of the manufacturing sectors discussed above. Development projects
initiated by businesses in Professional, Scientific, and Technical Services
(sector 541) projected overall job creation of 24,625 jobs (see Appendix
3, Table 3C). Under the lower bound estimate, these projects created
approximately 10,000 jobs – the highest net number of jobs among any
sector, even though this figure represents a forty percent job creation
rate. The upper bound reveals a more positive outcome: an eighty-one
percent job creation rate yields approximately 20,000 jobs under this scenario. Additionally,
these jobs are among the highest-paying with an average salary of $37.57 (see Appendix 3, Table
G).H
Telecommunications (sector 517) projected the second highest job creation among all
sectors - 12,718 jobs. The ratio of job creation was low, however, ranging from seventeen
percent under the lower bound to twenty-five percent under the upper bound. The poor
performance of this sector can be directly attributed to one development project, however:
WorldCom projected the creation of 8,000 jobs that never materialized due to the fraud-induced
bankruptcy of the company shortly after the December 2001 announcement of the development
project.
3. Average Salary by Sector
The state currently takes the average hourly wage of jobs created by development
projects into account when choosing grant recipients.I An analysis of the average hourly wage
H Expenditures, revenues, and hourly wages are calculated in 2008 dollars throughout the report.
I See individual program guidelines for eligibility requirements.
Sector with Highest Net
Job Creation
Professional, Scientific,
and Technical Services
Jobs Projected: 24,625
Jobs Created, Lower
Bound: 9,927
Jobs Created, Upper
Bound: 19,993

27
associated with each sector offers insight into the sectors that perform well in this aspect (see
Appendix 3, Table 3G). This analysis included 284 projects (representing forty-six out of the
fifty-nine sectors in this study) for which information on hourly wages was available.J The
average hourly wage for each sector was calculated based on project-
specific information and then creating a weighted average for each
sector.K
Of the forty-six sectors included in this analysis, six pay
average hourly wages that provide an annual salary higher than the
state-wide median income of $61,064 in 2008.50
The average hourly
wages of these sectors range from $31.48 for Textile Product Mills
(sector 314) to a high of $54.26 for Beverage and Tobacco Product
Manufacturing (sector 312). These six sectors had seventy-seven
development projects that anticipated the creation of approximately
28,000 jobs; applying the bracketing system estimates the creation of
between 13,000 and 24,000 jobs.
It is important to note that the average hourly wage of the two highest-paying sectors is
driven by two development projects: Philip Morris in Beverage and
Tobacco Product Manufacturing (sector 312), and Meristar
Hospitality in Accommodation (sector 721). The average hourly
wage at Philip Morris was $77.81 across 500 created jobs, increasing
the average salary of that sector significantly. Additionally, Meristar
was the only project in the Accommodation sector; the company paid
an average hourly wage of $43.29. In contrast, the average hourly
wage ($37.57) for the third highest paying sector, Professional,
Scientific, & Technical Services (sector 541), was based on the
hourly wages of 10,000 jobs across 59 development projects and is
J VDBA data provided hourly wage information for 240 projects. SCT provided salary information for twenty-four
additional projects, which was converted into hourly wages. In some sectors, no companies sought reimbursement,
so there is no estimate of an average salary. K The weighted average salary was created according to the following steps: (1) multiplying the average hourly
wage of each project by the total number of jobs created by that project (from VDBA, NETS, and SCT data); (2)
summing the average hourly wage of each project across the sector; and (3) dividing that number by the total
number of jobs created the companies for which hourly wage information existed in the sector.
Sectors with Highest Average
Hourly Wages
Beverage & Tobacco: $54.26
Accommodation: $43.29
Professional, Scientific, and
Technical: $37.57
Financial Investment: $36.61
Insurance: $32.76
Textile Mills: $31.48
Sectors with Lowest Average
Hourly Wages
Non-Store Retailers: $9.05
Administrative & Support
Services: $9.12
Paper Manufacturing: $10.27
Food & Beverage Stores:
$10.33

28
thus a more reliable estimate.
The five sectors with lower average hourly wages (ranging from $9.05 to $10.53) also
created fewer jobs compared to original job projections. Thirty-nine projects among these sectors
announced the expected creation of approximately 14,300 jobs. Between approximately 5,000
and 10,500 jobs were created under the lower and upper bound estimates. Thus, it appears that
the higher-paying sectors tend to have higher job creation performance than their lower-paying
counterparts. This finding offers one area in which the state can seek to improve strategies
concerning development grants. Although the state seeks to attract development projects that
create higher-paying jobs, a slight disconnect currently exists between outcomes and policy as
evidenced by the above results. A more detailed analysis of the location of the development
projects paying lower wages may reveal that they are located in southwestern Virginia. As
encouraging economic development in this region is a primary consideration for the state (and
thus high paying wages becomes a secondary consideration), these projects may require
additional assistance from the state in order to successfully perform. For example, it may be that
additional time is needed to meet performance metrics. Additionally, efforts to target businesses
within these higher-paying and -performing sectors should be increased.
4. Sector Economic Multipliers
A brief examination of the economic multipliers associated with each sector also provides
state officials with useful information to consider when weighing
between potential grant recipients (see Appendix 3, Table 3E).
Sectors with higher multipliers provide additional benefits for the
state in terms of jobs created through indirect and induced effects.
Higher total job creation leads to higher state and local tax revenues
in the form of income taxes, sales taxes, and other related taxes.
Many of these sectors with higher multipliers are manufacturing
sectors, which makes sense intuitively. Manufacturing firms require
inputs from many different industries, which in turn create additional
jobs. For example, the multiplier for the Beverage and Tobacco
Product Manufacturing sector (312) is 5.29, which indicates that for
every job directly created by a business in that sector, another 4.29
jobs are created throughout the local economy (in this case, the state of Virginia) through indirect
Sector with Highest Economic
Multiplier
Beverage & Tobacco Mfg
Multiplier: 5.29
Sectors with Lowest Economic
Multiplier
Nonmetallic Mineral Product
Manufacturing; Store Retailers
Multiplier: 1.16

29
and induced effects. Service-oriented industries, in contrast, rely heavily on the human capital of
their employees to provide a product to customers – fewer ancillary jobs are created as a result.
Consequently, Store Retailers (sector 453) have the lowest economic multiplier among sectors
with development projects examined in this study. Nonmetallic Mineral Product Manufacturing
also shares this low multiplier, although it represents the only manufacturing sector with a
multiplier below 1.5.
30
IV. STATE-LEVEL GRANT EXPENDITURES & TAX REVENUES
A. State-Level Grant Expenditures
1. Aggregate Grant Awards
Many grant awards are provided upfront to either the locality, through programs such as
GOF or TROF, or the business itself, through programs such as VIP (see Appendix 1). The
amount awarded through these programs was provided by the Office of the Governor and
incorporated in the Job Projections database.L However, grants requiring reimbursement, such as
VJIP, and those awarded from smaller grant programs, such as RIAP or EDAP, were generally
not quantified. The former issue was largely resolved through receipt of the VDBA data. The
state agency provided information on initial budget projections for the workforce training
programs, as well as the final reimbursement amount for many of the projects that had been
pledged VJIP funds. Expenditures related to the remaining projects without VJIP information, as
well as the smaller unquantified grants, will be discussed below in Section IV.A.2.a).
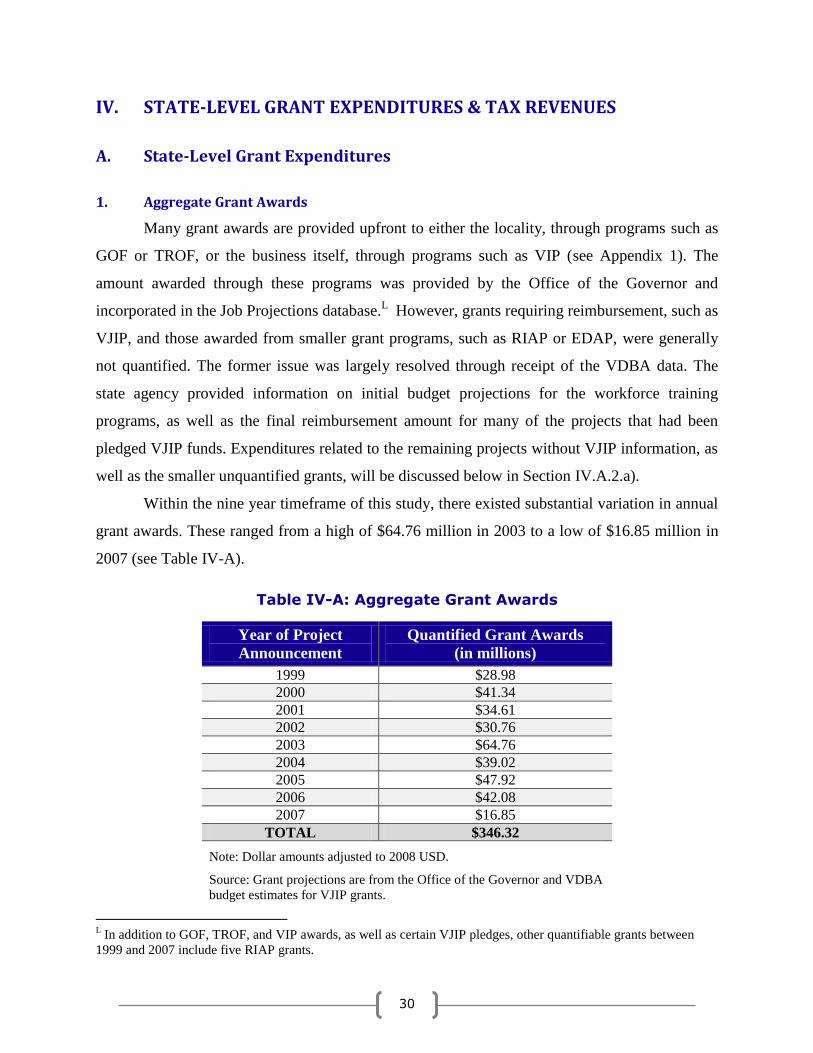
Within the nine year timeframe of this study, there existed substantial variation in annual
grant awards. These ranged from a high of $64.76 million in 2003 to a low of $16.85 million in
2007 (see Table IV-A).
Table IV-A: Aggregate Grant Awards
Year of Project
Announcement
Quantified Grant Awards
(in millions)
1999 $28.98
2000 $41.34
2001 $34.61
2002 $30.76
2003 $64.76
2004 $39.02
2005 $47.92
2006 $42.08
2007 $16.85
TOTAL $346.32
Note: Dollar amounts adjusted to 2008 USD.
Source: Grant projections are from the Office of the Governor and VDBA
budget estimates for VJIP grants.
L In addition to GOF, TROF, and VIP awards, as well as certain VJIP pledges, other quantifiable grants between
1999 and 2007 include five RIAP grants.

31
A more detailed analysis of grant awards and pledges according to projects and sectors will
reveal more information about the industries that are awarded the highest number of grants and
the most grant money.
a) Project-Level Analysis of Grant Awards
Only three development projects announced between 1999 and 2007 were awarded
incentive grants totaling more than $10 million. Philip Morris received the largest total grant
award over this timeframe for a 2003 development project in Henrico County - $3 million in
GOF grant money and $25 million in VIP grants. The company was also the recipient of another
significant payment in 2005 for a development project in the City of Richmond – a $3 million
GOF grant and $12 million in VIP funds. In 2008 dollars, grant payments to the tobacco
manufacturer totaled $49.30 million. Job creation for the 2003 project reached 500 within five
years, while the 2005 project created 450 jobs within five years – a 100% job creation rate for
the two projects combined. The other substantial grant award during this timeframe went to
WorldCom, which was pledged $11 million in VIP fund ($13.37 million in 2008 USD) in return
for job creation projections of 8,000 jobs. As discussed in Section III.D.2, however, the
WorldCom development project did not materialize.
b) Sector-Level Analysis of Grant Awards
The sector projecting the highest number of jobs created – Professional, Scientific, and
Technical Services (sector 541) – also received the highest total amount of grant awards and
pledges: $45.42 million (see Appendix 3, Table 3H). The sector also had the highest number of
development projects (fifty-seven) that received grant funds, however, resulting in an average
grant of $0.80 million per-project. Transportation Equipment Manufacturing (sector 336) had the
second highest number of development projects that received grant funds: thirty-one projects
received $23.83 million. As with Professional, Scientific, and Technical Services, however,
average per-project awards and pledges were low ($0.77 million).
Large aggregate grant awards and pledges were also given to several manufacturing
sectors, which comprised the next five highest recipient sectors. The 2003 Philip Morris grant
awards, discussed above, significantly impacted the overall total of the eight development
projects belonging to the Beverage and Tobacco Product Manufacturing sector (312). With the
Philip Morris grants factored in, the per-project average of the sector is $4.82 million, the highest

32
per-project average of any sector; without the grants, the per-project average drops to $1.48
million, which is still the sixth highest average among all sectors. Telecommunications (sector
517) was also impacted by the WorldCom grant, discussed above. The sector received a total of
$19.44 million, only $6.07 million of which went to thirteen other development projects initiated
by companies in the sector. The substantial impact can be seen in the drastic decrease in per-
project awards: $0.47 million without the WorldCom grant, compared to $1.39 million with the
grant included.
2. Aggregate Grant Expenditures
a) Methodology for Calculating Expenditures
To estimate state expenditures on grant payments for all 490 development projects, a
formula was developed to predict total grant payments a project would receive given the
performance of the business in terms of job creation.M
A positive relationship exists between the
proportion of projected jobs that were created and the proportion of grant money the state
provides a development project, which is reflected in the formula for estimating grant
expenditures:N
, i = project 1, 2, …, 490
Where the formula predicted a ratio greater than one of grant payments to grant promises (in the
case of projects that over-performed), estimated grant payments were limited to the amount of
the initial grant promises. The formula was applied across all projects within the lower bound,
mid-level, and upper bound scenarios. Within the nine-year timeframe of this study, grant
payments (based on the quantified awards and pledges discussed in the previous section) fell
between $204.27 million and $234.93 million (see Table IV-B).
M
This formula was developed collaboratively with JLARC. N ―Grant payment‖ represents all quantified grants (except VJIP reimbursements) received by a particular project.
―Grant Awards and Pledges‖ represents the total amount of quantified grants a project was promised. ―Jobs Created‖
indicates the total number of jobs created by a project. ―Job Creation Projections‖ indicates the total number of jobs
a project promised to save or create.

33
Table IV-B: Aggregate Grant Expenditures for Quantified Grants
Year of Project
Announcement
Lower Bound
(in millions)
Mid-Level
(in millions)
Upper Bound
(in millions)
1999 $11.84 $15.24 $17.03
2000 $28.21 $35.07 $35.37
2001 $11.69 $14.86 $15.40
2002 $13.62 $18.42 $19.33
2003 $57.63 $58.61 $58.76
2004 $19.19 $21.80 $22.75
2005 $32.00 $34.31 $34.51
2006 $14.05 $15.79 $16.58
2007 $15.11 $15.17 $15.21
TOTAL $204.27 $229.25 $234.93
Note: Dollar amounts have been adjusted to 2008 USD.
Source: Grant expenditures are from VDBA data and authors’ calculations.
Thirty-one projects remained without a VJIP reimbursement amount, however; these
were projects for which data on employment had not been obtained. Calculating an average cost
of workforce training per employee within a sector allowed the estimation of VJIP
reimbursements within the bracketing system.O Estimated VJIP reimbursements totaled $20.23
million under the lower bound, $24.13 million under the mid-level, and $25.36 million under the
upper bound estimate. Additionally, twenty-three grants awarded under RIAP and twenty grants
awarded under EDAP were not quantified in the development project announcements. Average
per-project expenditures were calculated using data from the Secretary of Commerce and Trade’s
annual Report on Business Incentives.51P
As a result, unquantified EDAP awards totaled an
estimated $7.1 million over the nine year timeframe of this study, while unquantified RIAP
O A sector-level estimate was generated due to the different training needs among sectors, which would impact the
cost of providing these services. The 271 projects for which VDBA provided workforce training reimbursement
information were sorted by sector; the total reimbursements for each sector were then summed and divided by the
number of jobs associated with the development projects in a sector to create a per-job cost of reimbursement. For
the projects without VDBA reimbursement information, the applicable sector per-job cost of reimbursement was
multiplied by the lower bound, mid-level, and upper bound estimates to calculate the VJIP expenditure per project.
Project estimates were then summed to create a total estimate of unquantified VJIP reimbursement. P The average per-project award was calculated using a four year average of awards granted between fiscal years
2006 and 2009. Using this timeframe (which included periods of both recession and expansion) provided a more
accurate assessment of the average grant awarded from each program. This method produced an average award of
$357,437 for EDAP grants and $350,747 for RIAP grants.

34
awards totaled an estimated $8.1 million. Adding the estimated VJIP, RIAP, and EDAP awards
yields unquantified grant expenditures ranging between $35.45 million under the lower bound
and $40.58 million under the upper bound. Consequently, estimated aggregate grant expenditures
are between $238.79 million under the lower bound and $275.51 million under the upper bound.
Table IV-C: Aggregate Grant Expenditures
Year of
Project
Announcement
Quantified Expenditures Unquantified
EDAP / RIAP
Expenditures
(in millions)
Unquantified VJIP
Reimbursements
(in millions)
Total Grant Expenditures
(in millions)
Lower
Bound
Mid-Level Upper
Bound
Lower
Bound
Mid-
Level
Upper
Bound
Lower
Bound
Mid-
Level
Upper
Bound
1999 $11.84 $15.24 $17.03 $1.42 $2.31 $2.68 $2.78 $15.57 $19.34 $21.23
2000 $28.21 $35.07 $35.37 $2.48 $6.36 $7.35 $7.43 $37.05 $44.90 $45.28
2001 $11.69 $14.86 $15.40 $0.36 $1.30 $2.35 $2.92 $13.35 $17.57 $18.68
2002 $13.62 $18.42 $19.33 $2.13 $3.86 $3.88 $3.88 $19.61 $24.43 $25.34
2003 $57.63 $58.61 $58.76 $2.13 $2.72 $2.98 $3.01 $62.48 $63.72 $63.90
2004 $19.19 $21.80 $22.75 $0.70 $0.96 $1.29 $1.39 $20.85 $23.79 $24.84
2005 $32.00 $34.31 $34.51 $2.47 $1.28 $1.62 $1.72 $35.75 $38.40 $38.70
2006 $14.05 $15.79 $16.58 $2.47 $1.05 $1.30 $1.40 $17.57 $19.56 $20.45
2007 $15.11 $15.17 $15.21 $1.05 $0.40 $0.68 $0.83 $16.56 $16.90 $17.09
TOTAL $204.27 $229.25 $234.93 $15.22 $20.23 $24.13 $25.36 $238.79 $268.61 $275.51
Note: Dollar amounts adjusted to 2008 USD.
Source: Grant projections are from the Office of the Governor and VDBA
budget estimates for VJIP grants.
B. State-Level Tax Revenues
1. Using IMPLAN to Estimate State-Level Tax Revenues
IMPLAN calculated economic output and estimated state-level tax revenues across each
of the three jobs creation scenarios (lower bound, mid-level, and higher bound assumptions)
following three steps. Before running the software, each project was assigned to an economic

35
sector corresponding with a NAICS code.Q IMPLAN did not offer NAICS codes for six sectors,
so the corresponding IMPLAN sector code was assigned for these projects.R
The first step was to total all employment within a sector that was created as a result of
the development grants. This study relied upon Virginia-specific data for IMPLAN, which
included the amount of economic activity associated with each job in a sector. IMPLAN
estimated the direct effect by multiplying average economic activity by the number of jobs
created (see Appendix 5). In the second step, the direct effect estimate from Step 1 was
multiplied by an economic multiplier indicating the amount of total economic activity generated
in a local economy (in this case, the economy of the state of Virginia) as a result of one job
created by a development project (see Appendix 3, Table 3E for the multipliers used by
IMPLAN).S IMPLAN then used this total economic output (summed across direct, indirect, and
induced effects) when calculating tax revenues in the final step.
a) Distinguishing between Local- and State-Level Tax Revenues
IMPLAN reported state and local taxes without clearly distinguishing the two. Several of
the tax categories generated by IMPLAN (see Table IV-D) could not be easily divided between
state and local revenues. The following four-step method was used to calculate state-level tax
revenues from the output provided by the software. T
First, IMPLAN output categories were divided between state and local revenues
according to the percentage of each tax that is collected by either the state or the locality. The
percentages from this first step were then applied to the tax outputs generated by IMPLAN for
six of the largest sectors (Wholesale Trade; Professional, Scientific, & Technical Services;
Telecommunications; Administrative & Support Services; Merchant Wholesalers, Durable
Q Sector codes were assigned based on NAICS codes contained in the Virginia Announcements Database,
maintained by VEDP at http://virginiascan.yesvirginia.org/ResourceCenter/AnnouncementsWeb.aspx. For
development projects that were not listed in VAD, industry descriptions from the press released were used, in
addition to matching the information with sector descriptions found on the NAICS website:
http://www.naics.com/search.htm#naicsdrill. R The following NAICS sector codes were assigned with IMPLAN sector codes: NAICS sector 236 was coded as
IMPLAN sector 37, NAICS sector 315 was coded as IMPLAN sector 86, NAICS sectors 423, 424, and 425 were
coded as IMPLAN sector 319, NAICS sector 488 was coded as IMPLAN sector 338, and NAICS sector 711 was
coded as IMPLAN sector 402. Conversion data for 2007 NAICS codes obtained from IMPLAN Bridges Tables:
http://www.implan.com/V4/index.php?option=com_docman&task=doc_download&gid=110&Itemid=7. S The version of IMPLAN used contained 2009 data, which included the most current multipliers available.
T This methodology was developed in conjunction with a project advisor.
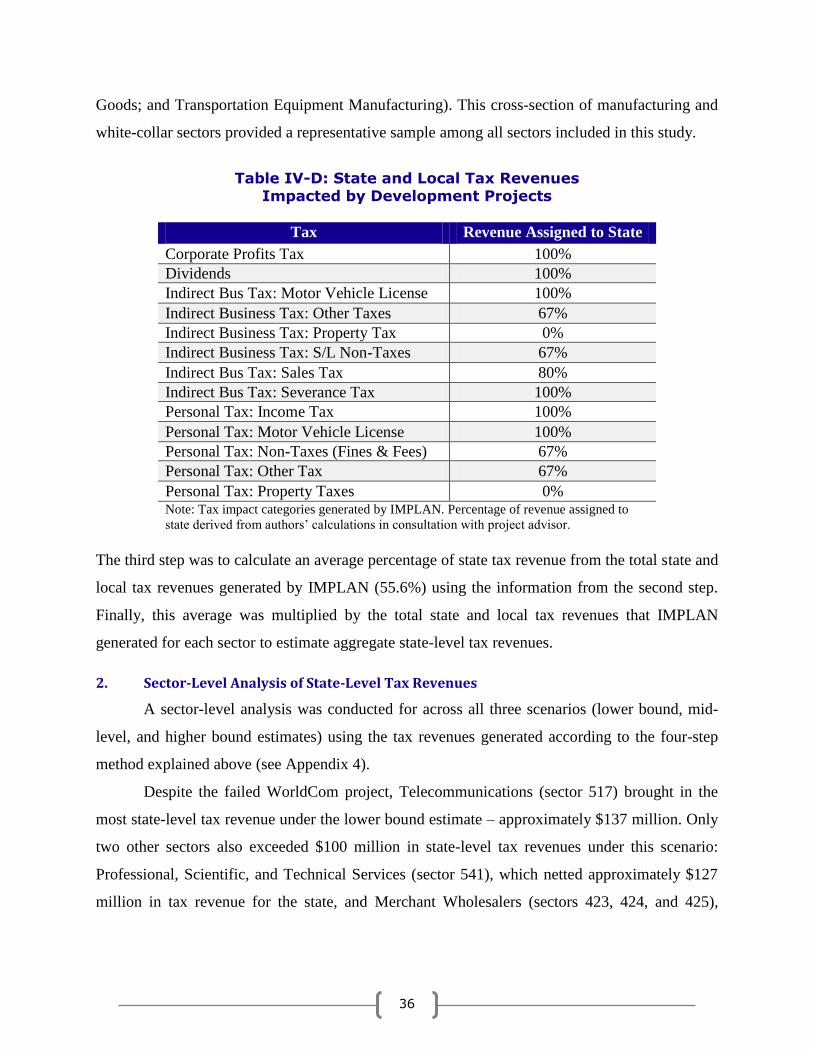
36
Goods; and Transportation Equipment Manufacturing). This cross-section of manufacturing and
white-collar sectors provided a representative sample among all sectors included in this study.
Table IV-D: State and Local Tax Revenues Impacted by Development Projects
Tax Revenue Assigned to State
Corporate Profits Tax 100%
Dividends 100%
Indirect Bus Tax: Motor Vehicle License 100%
Indirect Business Tax: Other Taxes 67%
Indirect Business Tax: Property Tax 0%
Indirect Business Tax: S/L Non-Taxes 67%
Indirect Bus Tax: Sales Tax 80%
Indirect Bus Tax: Severance Tax 100%
Personal Tax: Income Tax 100%
Personal Tax: Motor Vehicle License 100%
Personal Tax: Non-Taxes (Fines & Fees) 67%
Personal Tax: Other Tax 67%
Personal Tax: Property Taxes 0% Note: Tax impact categories generated by IMPLAN. Percentage of revenue assigned to
state derived from authors’ calculations in consultation with project advisor.
The third step was to calculate an average percentage of state tax revenue from the total state and
local tax revenues generated by IMPLAN (55.6%) using the information from the second step.
Finally, this average was multiplied by the total state and local tax revenues that IMPLAN
generated for each sector to estimate aggregate state-level tax revenues.
2. Sector-Level Analysis of State-Level Tax Revenues
A sector-level analysis was conducted for across all three scenarios (lower bound, mid-
level, and higher bound estimates) using the tax revenues generated according to the four-step
method explained above (see Appendix 4).
Despite the failed WorldCom project, Telecommunications (sector 517) brought in the
most state-level tax revenue under the lower bound estimate – approximately $137 million. Only
two other sectors also exceeded $100 million in state-level tax revenues under this scenario:
Professional, Scientific, and Technical Services (sector 541), which netted approximately $127
million in tax revenue for the state, and Merchant Wholesalers (sectors 423, 424, and 425),

37
which produced approximately $113 million in tax revenue. Seven sectors did not produce any
tax revenue for the state under this scenario.
Five sectors generated more than $100 million in tax revenue across both the mid-level
and upper bound estimates. In addition to the aforementioned sectors, the Beverage and Tobacco
Product Manufacturing sector (312) generated nearly $400 million in tax revenues under the
upper bound estimate, while Management of Companies (sector 551) generated close to $180
million. These sectors together generated approximately sixty percent of the state-level tax
revenue under the upper bound estimate.
C. Comparison of State-Level Expenditures and Revenues
State-level tax revenues were then aggregated across all sectors for each scenario to
create a total estimate of tax revenues generated by the development projects announced between
1999 and 2007. Incorporating the estimates of grant expenditures for each scenario from Section
IV.A.2.a permitted an analysis of total net revenues to the state (see Table IV-E).
Table IV-E: State-Level Expenditures and Revenues
Expenditures Revenues Net Revenue
Lower Bound
(in millions) $239.72 $460.52 $78.75
Mid-Level
(in millions) $385.67 $1,081.08 $695.41
Upper Bound
(in millions) $386.90 $1,110.45 $723.55
Note: Dollar amounts adjusted to 2008 USD.
Source: Expenditure estimates from Table IV-C. Revenue estimates from IMPLAN and
adjusted by authors to remove local tax revenues.
The key finding from this analysis is that revenues outweigh expenditures under each scenario of
job creation. Under the lower bound estimate, revenues exceed expenditures by approximately
$79 million. Under the other estimates, net revenue is between $695 million and $724 million. It
is important to note, however, that tax revenues were estimated only in the short term. IMPLAN
generates tax revenues within a time period necessary for the direct, indirect, and induced effects
to occur, between two and three years. Thus, the revenue estimates in this study are very
conservative, as many of the jobs created by development projects exist, and remain, beyond the

38
short term. Consequently, the long-term direct, indirect, and induced effects on state-level tax
revenues are likely much larger than those shown in the table. Such a conservative estimate of
tax revenues provides further weight to the finding that economic development grants are
revenue-enhancing for the state.

39
V. CYCLICAL AND COUNTER-CYCLICAL TRENDSU
Business and election cycles were examined in relation to job projections and grant
promises, based on two differing hypotheses:
1. A counter-cyclical trend related to economic conditions: during recessions, job
projections and the amount of grants awarded to development projects will increase to
compensate for poor economic conditions.
2. A cyclical trend related to political conditions: leading up to state-wide political
elections, there will be more grants and higher job projections to persuade voters that the
economic policies of the governor’s party are effective.
A. Effect of Business and Election Cycles on Job Projections
A correlation exists between state-wide unemployment rates and monthly job creation
projections, although it is largely cyclical and not counter-cyclical (see Figure V-A).
Source: Dates of national business cycles from the National Bureau of Economic Research. Monthly unemployment
rates from the Bureau of Labor Statistics’ Local Area Unemployment Statistics Program. Dates of state-wide
elections from the Virginia State Board of Elections.
U This analysis is conducted only on projects for which VDBA, SCT, or NETS provided concrete employment
information. Including projects for which employment information had been estimated under the bracketing system
would have been inappropriate due to the cyclical nature of both the questions of interest and the manner in which
the mid-level estimates were calculated - any distinguishable trends would have been obscured through such
inclusion.
0
0.5
1
1.5
2
2.5
3
3.5
4
4.5
5
0
2,000
4,000
6,000
8,000
10,000
12,000
14,000
VA
Un
emp
loy
men
t Ra
te J
ob
Cre
ati
on
Pro
jecti
on
s
Month
Figure V-A: Business and Election Cycle Trends Job Creation Projections
Monthly Job Creation Projections Unemployment Rate
EXPANSION EXPANSION RECESSION
State-Wide Election Cycle

40
A noticeable decline in job projections occurred during the 2001 recession (see Table V-A for
business cycles). Prior to March 2001, average monthly projections totaled approximately 970
jobs; between March and November 2001, monthly projections dropped to approximately 540
jobs. The end of the 2001 recession was accompanied by a significant spike in projections in
December 2001, even though unemployment rates remained above four percent. During this
period of expansion, monthly projections increased to approximately 1,270 jobs through the end
of 2004. These findings provide support for a cyclical, and not counter-cyclical, hypothesis.
Table V-A: Business Cycles, 1999-2007
Timeframe Business Cycle
January 1999 – March 2001 Expansion
March 2001 – November 2001 Recession
November 2001 – December 2007 Expansion
December 2007 Recession
Source: National Bureau of Economic Research.
Of note is the decline in job projections beginning in 2005, even though the nation
remained in a period of expansion and unemployment rates were decreasing. Monthly
projections declined further in 2006 and 2007, however, as economic conditions worsened and
unemployment rates began to rise. Such findings provide some support for the counter-cyclical
hypothesis introduced at the beginning of this section. It may be that economic conditions
proceeding the 2007-2009 recession were much worse than those leading up to the 2001
recession, which is not captured through monthly unemployment rates during this timeframe.
Such conditions may impact the job projections of businesses looking to avoid grant clawback
due to unsuccessful performance.
A significant spike in job creation projections in October 2000 appeared to substantiate
the second hypothesis introduced above. However, other substantial spikes in job creation
projections occurred after elections (see Table V-B for election information): December 2001
and November 2004. Although only one of the November 2004 development projects was
announced before the election, it is possible that officials were expecting to announce many of
these projects prior to November 2nd.

41
Table V-B: State-Wide Election Cycles, 1999-2007
Election Date Contested Positions
November 2000 President, Senate, House of Representatives
November 2001 Governor, Lieutenant Governor, Attorney General
November 2002 Senate, House of Representatives
November 2004 President, House of Representatives
November 2005 Governor, Lieutenant Governor, Attorney General
November 2006 Senate, House of Representatives
Source: Virginia State Board of Elections.
B. Effect of Business and Election Cycles on Grant Awards
A strong relationship between state-wide unemployment rates and monthly grant
promises exists (see Figure V-B).
Source: Dates of national business cycles from the National Bureau of Economic Research Monthly unemployment
rates from the Bureau of Labor Statistics’ Local Area Unemployment Statistics Program. Dates of state-wide
elections from the Virginia State Board of Elections.
As unemployment rates increased, so did average monthly grant awards. Prior to the 2001
recession, the average monthly total was $2.75 million; during the recession, this amount
dropped to $2.00 million. As the recession ended with a substantial increase in job projections,
so too did it end with a spike in grant awards in December 2001. During the 2001-2007
0 0.5 1 1.5 2 2.5 3 3.5 4 4.5 5
0
5
10
15
20
25
30
35
40
45 VA
Un
emp
loy
men
t Ra
te
Pro
mis
ed G
ran
ts (
in m
illi
on
s)
Month
Figure V-B: Business and Election Cycle Trends Grant Awards
Promised Grants (in millions) Unemployment Rate State-Wide Election Cycle
RECESSION EXPANSION EXPANSION

42
expansion, grant awards increased dramatically. The average monthly award granted between
December 2001 and December 2006 totaled nearly $4 million – almost double the monthly
awards granted during the recession. Two development projects undertaken by Philip Morris
during this time period were given substantial awards (discussed at length in Section IV.A.1.a)),
which impacts the findings slightly. Removing these two projects still yields high average
monthly awards, totaling $3.25 million. A significant flattening in grant awards began in 2007
(two years later than the impact on job projections) as unemployment rates again begin to rise.
During the last year of project announcements included in this study, average monthly grant
awards dropped below those of the 2001 recession, reaching a low of $1.41 million.
An examination of the effect of state-wide election cycles on grant awards revealed no
relationship. Major spikes in total monthly grant awards generally occurred one to four months
after an election: December 2000, December 2001, March 2003, and February 2006. It is
unlikely that these projects were intended to be announced prior to elections but took longer than
expected to finalize, due to the length of time separating them from election dates.

43
VI. CASE STUDIES
A. Goodyear Automotive Service
On April 13, 2000, Governor Jim Gilmore announced investment in a new Goodyear
maintenance training facility in the City of Danville. Goodyear is a global manufacturer of tires,
transportation products, rubber chemicals and engineered products that originally located to
Danville in 1966. The development project was awarded a $200,000 grant from GOF in
exchange for the creation of fifty new jobs and capital investment of $50 million in an existing
Danville manufacturing plant. Workforce training services would also be provided through
VJIP.52
Danville typically concentrates its economic development efforts towards attracting the
relocation or start-up of companies belonging to the plastics and polymer industries, such as
Goodyear. Companies within these manufacturing industries create jobs which are labor-
intensive, which is consistent with the skills of the city’s labor force. Local development officials
expect high school graduates will gain employment and work experience through these
companies, an additional benefit. 53
Although Goodyear was well-established in the city by 2000
due to its long-standing manufacturing facility, it had a proven performance record. Such a factor
was not the only driving force in the city’s decision to assist the company’s expansion: Goodyear
(the largest private employer in Danville) pays among the highest of industrial wages in the Dan
River Region.54
Following the announcement of the development project in 2000, 529 new jobs
were successfully created within two years – more than ten times the company’s original
projection.55
Goodyear currently employs a total of 2,250 people in its various Danville
facilities.56
The city’s relationship with the company remains attune to the differing needs of the
community and the local economic development strategy. Goodyear recently began development
in Danville of a tire research laboratory, which cooperates with the Institute for Advanced
Learning & Research (a regional learning and research center from Virginia Tech).57
Although
local officials would like to assist Goodyear with further expansion of its manufacturing plant,
the establishment of a research lab creates job opportunities for local residents with higher
education. The development of such a facility would therefore provide long-term sustainable
growth in Danville.

44
The Goodyear development project announced in 2000 was a success, for both the
company and the locality. The company continued to be high-performing; this was aided by a
lack of significant market changes that would affect production. Danville economic development
officials continue to work actively to meet the company’s needs through the locality’s strengths,
especially through the labor force and by providing additional workforce training services at the
local level.
B. STIHL, Incorporated
On December 21, 2005, Governor Mark Warner announced the expansion of a
manufacturing facility owned by STIHL, Inc. in Virginia Beach following international
competition with Germany and Brazil for the development project. STIHL anticipated capital
investment of $78.4 million and the creation of 150 new jobs in exchange for an award of
$150,000 from GOF and workforce training services through VJIP.58
Virginia Beach targets specific industries and types of development through its economic
policies, including high performance manufacturing, defense contractors, headquarters locations,
biomedical companies, research facilities, and professional services.59
In addition to substantial
capital investment, these industries tend to produce stable, high-paying jobs and strong tax
revenues for the locality, thereby providing the local workforce with quality employment
opportunities and generating revenue for the city to improve its operations.
Like Goodyear, STIHL (pronounced ―steel‖), a manufacturer of handheld power tools,
had an established location in the locality prior to the announcement of the 2005 development
project. The company’s Virginia Beach location began as a sales office in 1974, later expanded
into warehouse operations, and finally became a manufacturing facility.60
Within two years of
the project announcement, STIHL had created 1,000 new jobs – more than six times the original
job projections.61
STIHL currently employs approximately 2,000 people at its Virginia Beach
manufacturing plant.62
Virginia Beach and STIHL continue to take part in a symbiotic relationship. Over the
course of nearly four decades, the city has provided many development incentives to STIHL, in
addition to seeking state incentives on the company’s behalf, such as the Governor’s Opportunity
Fund grant STIHL received for its 2005 expansion. In return, STIHL continues to provide
benefits for the locality and its residents. Not only does the company pay property and sales

45
taxes to Virginia Beach, it has built business parks, consistently produced high-paying jobs, and
even attracted other companies, such as small gear manufacturers and packaging enterprises,
which generate additional economic activity with the community.63
Thus, Virginia Beach takes an aggressive approach to economic development, offering its
own incentives as well as brokering deals with the state. STIHL is another example of the
success that can be achieved over time when localities and the state work with a stable,
consistent performer.
C. Barber & Ross Company
On September 16, 2003, Governor Warner announced the relocation and expansion of
Barber & Ross Company headquarters from Leesburg to Winchester, both located within
Frederick County. Barber & Ross is a manufacturing firm that produces windows and other
millwork products. The 2003 development project promised to save 375 jobs already belonging
to Virginia employees and create another 100 jobs through the expansion.64
Frederick County concentrates their development efforts (through the allocation of
resources) on businesses already located within the county that have proven performance
records. Development policies seek to ensure that these businesses continue to expand and grow,
providing continual benefits for businesses and the county.65
From the 1960s until 2003, Barber
& Ross has maintained its headquarters in Leesburg, Virginia – its prior record of job creation
was well-established, and the firm’s plans for expansion corresponded with the county’s
economic development goals. Additionally, company headquarters are a desirable asset for
localities due to the higher wages that employees often receive, the types of jobs that are
available, and the substantial ties to the community that such development creates.
Initially, Barber & Ross met almost all of the conditions of its performance agreement
with the state.66
At the time that grants were awarded to the company and the development
project commenced, manufacturing (a core industry in Frederick County) was performing well.
By June 2007, however, the company had filed for bankruptcy and closed its headquarters,
leaving 400 unemployed.67
The economic downturn affected the company in a way that could
not have been foreseen by development officials when the project was announced in 2003,
particularly since past performance had been positive. Although the company owed more than
$80,000 in local back taxes at the time of its closure, funds from the sale of the Winchester site

46
were later used to reimburse the locality.68
Consequently, despite the lost employment,
Winchester and the state received tax revenues that compensated for the grant expenditures used
to fund the development project initially.69
The 2003 Barber & Ross development project is one of mixed success. Although
performance metrics were largely met and the project proved cost neutral for the locality and
state, the loss of hundreds of jobs (and future revenues) is not an ideal outcome. It is apparent
that the locality took every precaution to prevent a negative outcome, however, and such
rigorous examination of prospective grant recipients should be incorporated into the procedures
of economic development agencies, if it is not already. The information taken from this case
study is among the most valuable for state and local officials to consider when deciding whether
to change economic development policies. Despite the best intentions of officials (and due
diligence in evaluating the prospects for success), development projects can fail as a result of
unforeseen and unpreventable circumstances.
D. Eli Lilly and Company
On May 3, 2002, Governor Mark R. Warner announced the expansion of Eli Lilly and
Company (Lilly) in Prince William County. Lilly is a global pharmaceutical company that
discovers, develops, manufactures, and sells pharmaceutical products.70
Lilly anticipated the
creation of more than 700 high-technology jobs and capital investment of $425 million for a new
insulin manufacturing facility – this substantial capital investment would have been among the
ten largest in the state’s history.71
In return, the state awarded a $2.25 million GOF grant and
pledged EADP and VJIP funds. The company also qualified for a $3 million VIP grant.72
In 2002, Prince William County focused its development efforts on attracting
pharmaceutical companies. The timing was convenient for Lilly, which decided to expand in the
community at that time – the development project established the company’s first manufacturing
facility outside of Indiana. The county had made great efforts to prepare for and assist Lilly’s
decision: in addition to the state incentives provided, the county awarded a $2-million grant from
its Economic Development Opportunity Fund.73
However, in January 2007, Lilly suddenly halted construction on the site and dismissed
over 100 recently hired employees, due to changes negatively impacting the pharmaceutical
market. The Prince William County location was not the only one impacted by the downturn in

47
the market – the company also halted construction in various other locations. Lilly repaid all
state and local grants due to the clawback policy, and Prince William Country put the building
left by the company on the market.74
To compensate for the loss of Lilly, local officials worked
with George Mason University to continue development in the county’s Innovation Technology
research park in an effort to bring in new companies. Nine months later, Covance, a drug
development and animal test company, announced the purchase of the former Lilly property.
With Covance’s decision, the county appeared to be on the receiving end of a larger investment
and additional job opportunities. However, also due to continued downturns in the
pharmaceutical market, the company did not move ahead as anticipated and closed the Vienna
facility. The county, again, seeks to identify new potential users of the property.75
The county is in the process of broadening the industries that are targeted by its
development policies. Currently, Prince William is targeting companies in the information
technology industry, which has been a success to local economic development.76
The Eli Lilly and Company development can be classified as unsuccessful, with caveats.
Abrupt changes that led to the halt of the development project were unexpected. Although there
were no direct financial costs due to the clawback of grant funds, however, the loss of
employment due to the failed development projects of Lilly (and later Covance) impacts the
number of employment opportunities available to area residents, as well as cutting off a source of
tax revenue for both the locality and state. One positive finding, however, is the flexibility
certain localities maintain in their development policies: change with the market, look for new
target industries, and work actively to compensate for the loss from unusual circumstances.

48
VII. Recommendations for Further Evaluation
There are substantial benefits to conducting an economic impact analysis, including
gaining an understanding of how economic development projects ―will affect the wider local or
regional economy.‖77
When evaluating incentives, such as grants, the primary consideration is
whether a project will add value to the local community. During our analysis, we defined value
as employment created directly and indirectly by the project, output generated by the business as
a result of job creation, and tax revenues collected by the locality and state as a result of direct
and indirect job creation. Economic impact modeling through IMPLAN generated the indirect
and induced effects of employment; the total effect of the development project on employment
was then used to generate estimated output and revenues.
A. Limitations to Using Input-Output Software
There are several limitations to using software such as IMPLAN, however. The first
concern is a result of the assumptions incorporated into the models – these impact the validity of
the results. While the bracketing system imposed fairly conservative estimates of job creation,
the average annual ratios of job creation may have still been impacted by other outliers that were
not removed from the calculations. This discrepancy, in turn, would have been compounded by
the economic multipliers used in IMPLAN.
A second limitation is that input-output models ―do not explicitly consider possible
displacement impacts‖ resulting from direct competition with an existing firm.78
If a firm
relocates to a locality where several other businesses are already established that sell the same or
very similar products or services, they will be competing for the same consumer base. The
resulting impact on direct and induced employment as a result of the project will be smaller, as
will the firm’s output and tax revenues. An additional concern is that a higher displacement
impact is likely within certain sectors, such as retail.79
We were unable to account for such a
possibility within our analysis. One possibility for improvement may be to consider the number
and size of existing firms within a particular locality that directly compete with a business that is
relocating and create a weight to adjust for possible displacement impacts. Businesses that are
expanding rather than relocating do not contribute as greatly to displacement impacts, so it may
not be as important to perform such a correction for these types of development projects.

49
A more significant limitation of input-output modeling is that costs to local and state
governments (beyond grant expenditures or workforce training reimbursements) are not
considered. Not all newly created jobs are filled by unemployed workers living in the locality.
Employees may come from other parts of the state or even from outside the state to fill available
positions. Local governments then face an increased demand for public services, such as
infrastructure, education, and safety, which is not directly captured through input-output
modeling.80
Local government costs directly related to a development project include infrastructure
expenditures, such as road construction, and economic incentives, such as matching grants.81
These costs are easily quantifiable. What are not so readily quantifiable, however, are the costs
―associated with the expected growth that will occur… due to the development project‖ – those
that stem from an increased demand for public services.82
One recommendation for overcoming
this limitation is to utilize fiscal impact analysis, in conjunction with economic impact analysis,
to best evaluate all costs and benefits associated with an economic development project.
Using an average cost approach, the current average cost per person (or household) ―of
providing a local government service‖ is calculated.83
This average cost is then considered across
the additional number of people (or households) that are coming into the locality as a result of
the economic development project. Three methods can be used: per-capita-multiplier (costs are
assumed to be the same for each person/household), service standard (different costs are
calculated for each public service), and proportional valuation.84
The average cost approach is not appropriate to use in areas experiencing rapid growth
rates, such as Northern Virginia, with much higher costs of providing services than other areas in
the state. Conversely, the average cost approach is also not appropriate for areas of economic
decline, such as Southwestern Virginia, which have much lower costs for public services due in
part to under-utilized existing infrastructure. In these situations, a marginal cost approach is more
appropriate. This approach ―considers the capacity of a jurisdiction’s infrastructure and capital
facilities in determining the incremental cost of serving one more‖ person or household.85
Marginal costs are most commonly calculated using case study analysis, in which excess
capacity for public services and infrastructure – or strain – is identified, as are the costs to
expanding services.86

50
Additional costs and benefits of an economic development project may not be captured
through either economic impact analysis or fiscal impact analysis, however, although such
omission should not discount the importance of performing such analyses. Omitted qualitative
impacts include restoring self-respect to the unemployed and renewing a sense of hope among
communities in economic decline – ―socio-psychological benefits of development‖ that cannot
be quantified.87
Negative externalities, such as increased traffic congestion and pollution, are
also not quantified through these analyses.88
B. Considerations for Current Development Incentive Policies
One concern raised about economic development incentives is that ―hyper-competition‖
causes politicians to irresponsibly offer funds to attract a business to their state.89
Incentives may
be offered in the form of ―massive, even highly liquid cash grants and tax abatements.‖90
In
return, however, the business may create jobs with low wages, or very few jobs. Additionally, a
small positive impact on the local economy or a negative impact on the environment may
occur.91
One reform measure that the State of Virginia has currently implemented is that of
clawbacks, where the state requires that the grant recipient pay back a portion (or all) of the grant
if projections of capital investment and job creation are not met (see Appendix 1 for clawback
requirements).92
The response to this measure has been mixed, and often additional costs are
incurred by the state and localities as a result. One publicized example of such a negative
outcome occurred in Carroll County. In November 2008, the county sued AmerLink to regain
control of 32.4 acres of land and obtain reimbursement of $600,000 in state grant money, paid in
2005 with the expectation that 200 jobs would be created (by then, AmerLink had created one
job).93
Although the county eventually settled out of court, the protracted ordeal lasted until
January 2011 and consumed many resources, both fiscal and human capital.94
Local economic development officials caution, however, against eliminating upfront
grant awards and shifting to rewards for performance. The Commonwealth is currently at a
disadvantage compared to neighboring states, which can offer much larger incentives and grants
– Virginia counties and cities that border these states (such as Frederick County and Danville)
are better able to compete as a result of upfront grant payments and targeted programs, such as
TROF. The evolution of performance agreements over the past decade has resulted in a better

51
understanding between the state and businesses concerning development incentives. Businesses
are well aware that it is taxpayer money funding the awards they receive and have become much
more understanding and conservative about the performance metrics upon which they agree.
Additionally, the attitudes of state and local officials about the strict clawback deadlines have
shifted due to the present economic conditions – there is an increased willingness to provide
extensions as long as the business is continue to head towards performance metrics.95
A second concern about economic development incentives is that they do not require
―accountability on the part of businesses to remain in a community after they receive
incentives.‖96
While many of the state-level incentive grants require a business to remain in a
locality for a certain length of time, the requirements are generally between 2 to 3 years. The
VDBA data we received from the state indicates that 229 out of 271 projects receiving grants
created jobs only in the short-term (within two years of the project’s announcement). We cannot
determine how many of these businesses simply maintained the jobs in long-term, as opposed to
going bankrupt, closing, relocating, or merging with another entity. It would be beneficial to gain
a better understanding of company behavior in the long-run, to ensure that grant funds are being
spent on companies that continue to provide benefits for the Virginia economy.

52
VIII. Conclusion
This study made several key findings. The first is that the 490
development projects announced between 1999 and 2007 did not, on the
whole, meet performance metrics concerning job creation. This finding
was true based on an analysis of VDBA, SCT, and NETS data, as well as
an analysis applying a bracketing system to estimate job creation. Results
from the latter revealed a jobs shortfall ranging from 32,000 under the
upper bound to 73,000 under the lower bound. Over-performing
companies did create approximately 10,000 more jobs than originally
anticipated, although this finding differs significantly from that of the
2002 JLARC report. In that case, over-performing companies were able to
compensate for their under- and non-performing counterparts.
The second finding is that the economic multiplier of companies in
manufacturing sectors is generally higher than the multiplier associated
with white collar sectors. As a result, a higher number of jobs are created
within the state through indirect and induced effects for every job created
by a manufacturer than for every job created by a white collar business.
Such a finding yields positive benefits for the state only if manufacturers
achieve projected job creation numbers. This study reveals evidence of
that: manufacturing sectors had the highest number of over-performing
development projects, in addition to the two most successful projects
completed within the timeframe of this study: MillerCoors (2006) and
STIHL (2005).
However, white collar industries tend to generate the most tax
revenue for the state. This study found that despite lower job creation
rates, the three sectors generating the highest amount of tax revenue for
the state were all non-manufacturing under the lower bound estimate; they
represent four out of the top five producers of tax revenue for the state
under the upper bound.
Due in part to the higher tax-revenue generating sectors, this study
found positive net revenue for the state under all three estimates – $79
million under the lower bound and more than $1 billion under the mid-
level and upper bound estimates – despite the failure to meet aggregate job
projections. This finding supports the 2002 report’s finding, although the
analysis was not conducted on the project level in this study.
The above findings suggest an important consideration for state
officials. One goal of economic development incentives is to create jobs
for state residents. The evidence uncovered by this study suggests that
manufacturing companies tend to achieve (or come much closer to) this
Key Findings
1. Aggregate job creation
did not meet job creation
projections.
2. Manufacturing sectors
generally have higher
economic multipliers than
white collar sectors.
3. White collar sectors
typically generate more
state-level tax revenue
than manufacturing
sectors.
4. Economic development
grants are revenue-
enhancing for the state.
5. Some companies
continue to pose a risk to
the Commonwealth and its
residents.

53
goal than other companies, in addition to creating other jobs throughout
the community. One caveat, however, is that state officials generally seek
to create high-paying jobs. This study found that non-manufacturing
sectors paid among the highest hourly wages – only the Beverage and
Tobacco Manufacturing sector paid higher wages.
As the case studies of Goodyear and STIHL revealed, economic
development succeeds when a symbiotic relationship exists between
company and locality. Unforeseen changes within industries can impact
the potential for success, however. A positive existing relationship
between Frederick County development officials and Barber & Ross could
not prevent the 2007 economic downturn from negatively impacting the
company and causing it to close its headquarters in Winchester.
What the case studies did not reveal, and internet searches did, was
that certain companies receiving grants pose a risk to the Commonwealth
that outweigh the benefits of the economic development and tax revenue
they may generate. Several companies have since violated state laws
against pollution, one was fined by the federal government for animal
cruelty, and several others have had lawsuits brought against them by
localities to clawback grant funds.V
In light of this information, we
recommend a re-evaluation of the process currently in place to screen
grant applicants, as the 2002 report recommended.
This study conducted a limited analysis that could not account for
additional factors impacting expenditures and qualitative factors
associated with development projects funded by incentive grants. We
recommend that a more rigorous evaluation of the effectiveness of state-
level incentive grants is needed. Additionally, when multiple grants are
awarded to one development project, it is difficult to ascertain the impact
of each on job creation and tax revenues. Such impacts may be revealed
through a more detailed study.
Virginia remains the top location for business in the United States.
While the Commonwealth does not provide incentive grants that are as
substantial as those of neighboring states, there are many other positive
qualities that increase its relative competitiveness. The incentive grants it
does provide, however, serve as an important source of funding to many
companies who would be harmed by an elimination of grant programs or
the shift to a system of grants that reward, rather than incentivize,
development and job creation. In conclusion, we recommend that the long-
V Polluters include: Celanese Acetate LLC, Reline America, Dynax America, Banker Steel, and MW Manufacturers
(DEQ). Covance was fined for animal cruelty by the US Department of Agriculture in 2006 (Arizona Business
Gazette). Lawsuits or negotiations to retrieve grant funds were taken up against companies including: AmerLink
(the Carroll News) and StarTrek (AP).
Key Recommendations
1. Re-evaluate the
screening process for
grant applicants.
2. Include additional
factors, such as increased
cost of public services, in
future evaluations.
3. Do not eliminate GOF
or VJIP; carefully
consider what types of
business or development
other grant programs are
targeted towards.

54
term impacts of eliminating the two major state-level incentive programs
(GOF and VJIP) would be negative. The lost revenue and lost job
opportunities may not be made up by businesses that have no such
incentives to engage in economic development within the Commonwealth,
particularly in tough economic times.

55
APPENDIX 1: GRANT PROGRAM GUIDELINES
Grant GOF VIP
Recipient Locality Business
Payment of
State Funds
Upon entering into Performance Agreement
Locality must request disbursement within
3-4 months of project’s public
announcement
Project must be on file for 36 months prior
to payments (24 months for fiscally
stressed localities)
Payments made in 5 equal, annual
installments
Company
Requirements
Maintain capital investment and jobs
created through ―Performance Date‖ (36
months after date by which locality needs
to request funds)
If ―break-even-point‖ occurs after the
―Performance Date,‖ jobs created must be
maintained through this date
Provide annual notice to VEDP of progress
towards meeting performance goals
Notify VEDP within 90 days of completing
capital investment in ―Initial Company
Notification‖ (VEDP prefers completion
within 5 years of signing of ―Performance
Agreement‖)
Certify whether a net reduction in
employment has occurred one year
following the ―Initial Company
Notification‖
Contractual
Obligation to
Grant Funds
If company does not meet statutory
minimums for capital investment and jobs
created, it must repay 100% of grant
If 90% of predicted value not met,
repayment is proportionate to
underperformance (extension of 15 months
may be granted)
Grant awarded only if company meets
statutory minimum for capital investment
or steady employment in one-year period
Grant not awarded if company does not
reach at least 50% of projected capital
investment and does not reach projected
jobs creation
In general, 75% of each grant is allocated
to capital investment and 25% to jobs
creation – partial achievement of projected
capital investment / jobs creation impacts
grant payment proportionately
Repayment of
Grant
Locality responsible for requesting
repayment of grant and returning money to
state if Performance Agreement not met
−
GOF Sources: VEDP GOF Guidelines, Virginia Code § 2.2-115
VIP Sources: VEDP VIP Guidelines, Virginia Code § 2.2-5100-§ 2.2-5104

56
Grant MEE VEDIG
Recipient Business Business
Payment of State
Funds
Project must be on file for 6 years (4
years for fiscally stressed localities)
Payments made in 5 to 7 equal, annual
installments
Project must be on file for 36 months
prior to payments
Payments made in no fewer than 5
installments
Company
Requirements
Notify VEDP within 90 days of
completing capital investment and job
creation
Performance Agreement establishes end-
date for achieving targeted capital
investment and job creation (VEDP
prefers completion within 5 years signing
of Performance Agreement)
Notify VEDP within 90 days of
completing capital investment and job
creation
Performance Agreement establishes end-
date for achieving targeted capital
investment and job creation (VEDP
prefers completion within 5 years
signing of Performance Agreement)
Contractual
Obligation to
Grant Funds
No grant awarded if statutory minimum
for capital investment and job creation
are unmet
No grant awarded if at least 50% of
capital investment or jobs creation
projections are unmet, even if statutory
minimums are attained
Grant awarded on sliding scale if
company attains statutory minimums and
achieves between 50-100% of capital
investment and job creation projections
In general, 50% of MEE is allocated to
capital investment and 50% to jobs
creation – partial achievement of
projected capital investment / jobs
creation impacts grant payment
proportionately
No grant awarded if statutory minimum
capital investment OR 50% of projected
capital investment projections are unmet
No grant awarded if statutory minimum
job creation with average salaries at least
50-100% greater than locality’s average
prevailing wage OR 50% of projected
job creation with average salaries at least
50-100% greater than locality’s average
prevailing wage
If company creates capital investment or
job creation above minimums but below
projected goals, grant will be awarded on
sliding scale
Repayment of
Grant − −
MEE Sources: VEDP MEE Guidelines
VEDIG Sources: VEDP VEDIG Guidelines

57
Grant CEMIG VJIP
Recipient Business Business
Payment of State
Funds
2-6 annual installments (may be paid in
1annual installment if significant state or
regional interest exists)
Payment generally not paid earlier than
one year after performance metrics are
met (may be paid upon completion if
significant state or regional interest
exists)
Funding reimbursable 90 days after
trainee is hired (New Jobs Program) or
upon completion of retraining (Retraining
Programs)
Company
Requirements
Performance Agreement establishes end-
date for achieving targeted capital
investment and job creation (VEDP
prefers completion within 3-5 years of
signing; extensions are possible at
VEDP’s discretion)
Submit Reimbursement Form to VEDP
Contractual
Obligation to
Grant Funds
No grant awarded if statutory minimums
for capital investment and job creation
are unmet
No grant awarded if at least 50% of
capital investment or jobs creation
projections are unmet, even if statutory
minimums are attained
Grant awarded on sliding scale if
company attains statutory minimums and
achieves between 50-100% of capital
investment and job creation projections
In general, 50% of CEMIG is allocated to
capital investment and 50% to jobs
creation – partial achievement of
projected capital investment / jobs
creation impacts grant payment
proportionately
New Jobs Program: companies must
create at least 25 jobs within 1 year of
date of first hire and make capital
investment of at least $1 million
Small Business New Jobs Program:
companies must create at least 5 jobs
within 1 year of date of first hire and at
least 5 jobs for three consecutive years, as
well as make new capital investment of at
least $1 million
Retraining Program: companies must
retrain at least 10 full-time employees and
make new capital investment of at least
$500,000
Small Business Retraining Program:
retrain at least 5 full-time employees and
make new capital investment of at least
$50,000
Under all programs: minimum entry-level
hourly wage of $10
Repayment of
Grant
Business returns installments made
before end-date if statutory minimum for
capital investment and job creation is
unmet OR does not reach 50% of
projected capital investment or jobs
creation
−
CEMIG Sources: VEDP CEMIG Guidelines, VA Code § 59.1-284.25-§ 59.1-284.27
VJIP Sources: VDBA VJIP Guidelines, VDBA VJIP Program Description

58
Grant EDAP RIAP
Recipient Locality Locality
Payment of State
Funds
For regular access projects, allocations
are expected to be committed by contract
or under construction within two years
from date of Commonwealth
Transportation Board (CTB) approval
For bonded access projects, maximum
time limit for bond is five years
Maximum unmatched allocation to any
project within any fiscal year is $300,000
(funds in excess of $300,000 are matched
dollar-for-dollar from non-program
sources, up to $150,000)
Completed project costs reimbursed after
60-day (maximum) field review and
Department inspection
Company
Requirements
Business must make Qualifying
Investment (cost of land, building,
manufacturing or processing equipment)
Performance Agreement metrics
(Employment and Annual Carload
Performance) reported annually following
date of project acceptance
Contractual
Obligation to
Grant Funds
Qualifying Establishment must provide
locality and VDOT with a preliminary
plan and a letter of request to the
appropriate local governing body
Upon completion, Grantee must report
performance annually on fiscal year
schedule beginning July 1 following date
of project acceptance by Department
Grantees must give Commonwealth a 15-
year contingent interest in portions of
track and facilities built or improved with
the funds, to be exercised upon non-
performance
Landowner or using business must
provide continuous maintenance and
assume liability of tracks and facilities
Repayment of
Grant
Locality must return any funds owed to
VDOT for expenditures not justified by
the investment (voluntarily or by
forfeiture of the surety)
De-allocation of funds is possible if
project is not underway within 2 years of
CTB approval
DRPT repaid its contribution to cost of
construction and materials, less
depreciation, if project tracks are
abandoned, relocated or sold
DRPT repaid its contribution to cost of
access track if: Employment Performance
commitment for first two years or Annual
Carloads for first five years is
significantly below commitment levels;
rail use is no longer for its intended
purpose; or track is unused
EDAP Sources: VDOT Local Assistance Division EDAP Program Guide
RIAP Sources: DRPT RIAP Application Guidance & Procedures

59
Grant TPOF TROF
Recipient Agency or political subdivision of the
Commonwealth; certain private entities Locality (in tobacco producing regions)
Payment of State
Funds
Disbursement of financial assistance
begins following execution of Financing
Agreement and submission of request for
disbursement to VDOT
May be allowed in one lump sum
Limited to three per county per fiscal year
Grants of less than $50,000 will not be
offered, except for motorsports grants
(which will not be offered at less than
$10,000)
Company
Requirements
Project must meet GOF criteria
Meet bi-annual reporting requirements as
outlined in Financing Agreement
Performance Agreement must be executed
within 90 days
Application for a GOF grant is required
Periodic auditing and verification of the
Performance Agreement by the
Commission
Contractual
Obligation to
Grant Funds
For transportation projects associated with
economic development, recipients must
reach and maintain specified job creation
and capital investment levels within and
through 30 months after disbursement of
funds or until Commonwealth reaches its
―break even‖ point, whichever is later
Entitled to receive disbursement following
written request for funds
Repayment of
Grant
For transportation projects associated with
economic development, private entity
repays if performance criteria unmet
(partial grant or total waiver to repayment
or extend performance period may be
applied to some projects have certain
economic benefits to locality)
If performance metrics are not met, full or
pro-rated repayment of grant occurs
TPOF Sources: VDOT TPOF Guidelines and Criteria, VA Code § 33.1-221.1:8
TROF Sources: TICRC TROF Grant Program Guidelines, VEDP Business Incentives Guide 2011-2012

60
APPENDIX 2: ANNUAL JOBS COMPARISON TABLES
1999 Development Projects Locality
Job
Creation
Projections
Job Creation
Lower
Bound Ratio
Mid-
Level Ratio
Upper
Bound Ratio
Precision Bed Rail Mfg. Co. Appomattox County 100 34 0.34 34 0.34 34 0.34
Best Doctors, Inc. Arlington County 50 31 0.62 31 0.62 31 0.62
Koyo Steering Systems of USA,
Inc. Botetourt County 200 129 0.65 129 0.65 129 0.65
Ball Corp. Bristol 40 83 2.08 83 2.08 83 2.08
Data Services America, Inc. Buchanan County 50 21 0.42 21 0.42 21 0.42
Icicon Electronics India, Ltd. Buchanan County 80 0 0.00 52 0.65 80 1.00
Sherwood Brands Charlotte County 150 0 0.00 0 0.00 0 0.00
Innovations in Transportation,
Inc.a Chesapeake 100 0 0.00 66 0.66 100 1.00
Eternal Technology Corporationa
Chesterfield County 100 40 0.40 40 0.40 40 0.40
Capital One Financial Corp. Chesterfield, Fairfax,
Henrico, & Spotsylvania Co. 3,075 533 0.17 533 0.17 533 0.17
Pharming Healthcare, Inc.a
Craig & Montgomery Co. 88 0 0.00 58 0.66 88 1.00
Toll Integrated Systems Emporia 150 210 1.40 210 1.40 210 1.40
Ahold USA Fairfax County 100 3 0.03 3 0.03 3 0.03
Intel Online Services, Inc. Fairfax County 250 167 0.67 167 0.67 167 0.67
Science Applications Int’l Corpa
Fauquier County 150 0 0.00 98 0.65 150 1.00
HP Hood Frederick County 170 102 0.60 102 0.60 102 0.60
Tritex, LLC Grayson County 30 60 2.00 60 2.00 60 2.00
Annin & Co. Halifax County 160 85 0.53 85 0.53 85 0.53
Gatewaya
Hampton 1,200 0 0.00 786 0.66 1,200 1.00
Nextel Communicationsa Hampton 700 0 0.00 459 0.66 700 1.00
Rapid Rack Hampton 100 0 0.00 0 0.00 0 0.00
Cavalier Telephone Co. Hampton Roads; Richmond
City 200 315 1.58 315 1.58 315 1.58
Outsourcing Solutions Inc.a
Henrico County 440 0 0.00 288 0.66 440 1.00
Stanley Furniture Co. and
American of Martinsvillea Henry County 700 0 0.00 459 0.66 700 1.00

61
1999 Development Projects Locality
Job
Creation
Projections
Job Creation
Lower
Bound Ratio
Mid-
Level Ratio
Upper
Bound Ratio
Blue Ridge Technology Inc. Henry County 100 0 0.00 0 0.00 0 0.00
John Deere James City County 300 189 0.63 189 0.63 189 0.63
Super Sack Bag, Inc. Lee County 180 200 1.11 200 1.11 200 1.11
America Online, Inc. Loudoun & Prince William
Co. 1,375 118 0.09 118 0.09 118 0.09
National Catalog Corporation Martinsville 250 413 1.65 413 1.65 413 1.65
Synerject Co Newport News 107 76 0.71 76 0.71 76 0.71
Energy Recovery, Inc. Northampton County 50 0 0.00 0 0.00 0 0.00
eToys Inc. Pittsylvania County 330 196 0.59 196 0.59 196 0.59
Perdue Farms, Inc. Prince George County 175 50 0.29 50 0.29 50 0.29
Ameriserve Food Distribution,
Inc.a Prince William County 250 0 0.00 164 0.66 250 1.00
Covad Communications Prince William County 1,000 233 0.23 233 0.23 233 0.23
Avenir, Inc.a
Prince William County 166 0 0.00 109 0.66 166 1.00
Volvo Trucks North America Pulaski County 1,277 450 0.35 450 0.35 450 0.35
Aspen Motion Technologies Radford 171 190 1.11 190 1.11 190 1.11
Innotech Roanoke City 600 201 0.34 201 0.34 201 0.34
Process Integration Co.a
Russell County 50 0 0.00 33 0.66 50 1.00
Tempur-Pedic, Inc. Scott County 1,200 300 0.25 300 0.25 75 0.06
VFP, Inc.a
Scott County 100 90 0.90 90 0.90 90 0.90
Dynamarketinga
Spotsylvania County 200 0 0.00 131 0.66 200 1.00
Capital One Financial Corp.a
Spotsylvania County 1,200 0 0.00 786 0.66 1,200 1.00
Dominion Pictures Suffolk 130 231 1.78 231 1.78 231 1.78
CBF, LLCa
Tazewell County 40 0 0.00 26 0.65 40 1.00
Coastal Training Technologies Virginia Beach 366 67 0.18 67 0.18 67 0.18
21st Century Containers, Ltd. Washington County 120 113 0.94 113 0.94 113 0.94
Morrill Motors, Inc.a
Washington County 65 0 0.00 43 0.66 65 1.00
Utility Trailer Mfg. Co. Washington County 265 75 0.28 75 0.28 300 1.13
TOTALb
18,450 5005 0.27 8,563 0.46 10,434 0.57
a: Employment information not obtained from VDBA, SCT, or NETS – lower bound, mid-level, and upper bound estimates for employment apply
b: Ratios are an annual average across all development projects
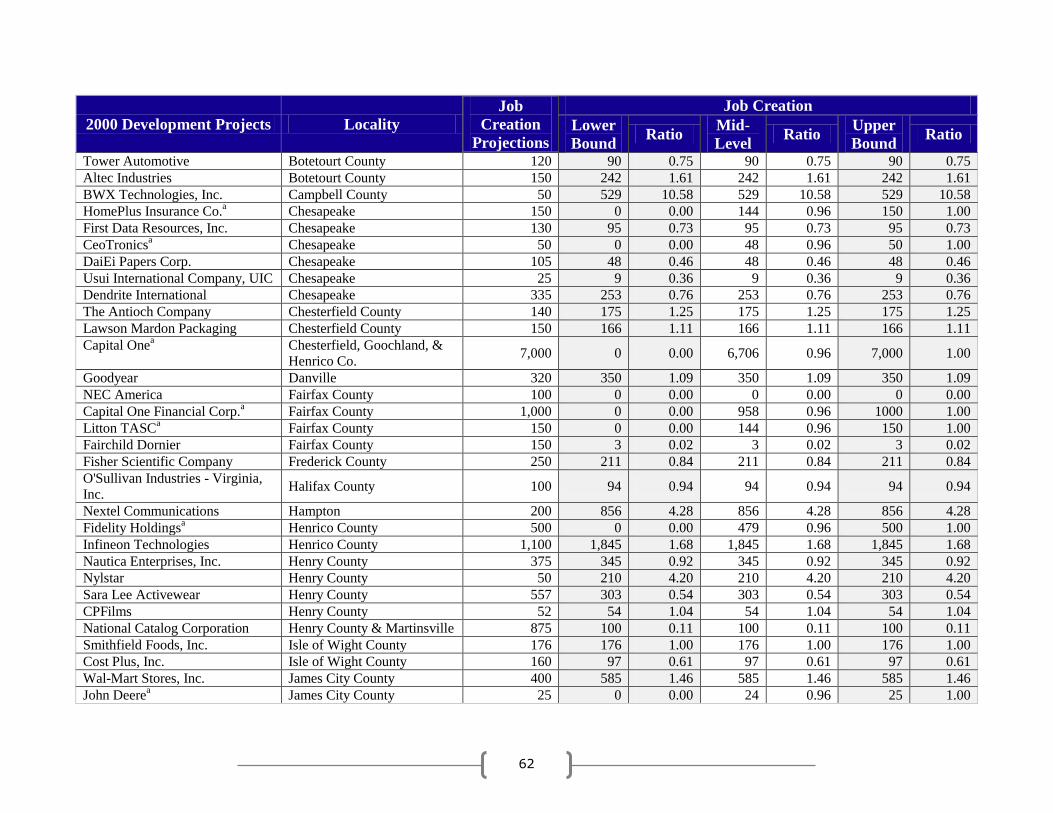
62
2000 Development Projects Locality
Job
Creation
Projections
Job Creation
Lower
Bound Ratio
Mid-
Level Ratio
Upper
Bound Ratio
Tower Automotive Botetourt County 120 90 0.75 90 0.75 90 0.75
Altec Industries Botetourt County 150 242 1.61 242 1.61 242 1.61
BWX Technologies, Inc. Campbell County 50 529 10.58 529 10.58 529 10.58
HomePlus Insurance Co.a
Chesapeake 150 0 0.00 144 0.96 150 1.00
First Data Resources, Inc. Chesapeake 130 95 0.73 95 0.73 95 0.73
CeoTronicsa
Chesapeake 50 0 0.00 48 0.96 50 1.00
DaiEi Papers Corp. Chesapeake 105 48 0.46 48 0.46 48 0.46
Usui International Company, UIC Chesapeake 25 9 0.36 9 0.36 9 0.36
Dendrite International Chesapeake 335 253 0.76 253 0.76 253 0.76
The Antioch Company Chesterfield County 140 175 1.25 175 1.25 175 1.25
Lawson Mardon Packaging Chesterfield County 150 166 1.11 166 1.11 166 1.11
Capital Onea
Chesterfield, Goochland, &
Henrico Co. 7,000 0 0.00 6,706 0.96 7,000 1.00
Goodyear Danville 320 350 1.09 350 1.09 350 1.09
NEC America Fairfax County 100 0 0.00 0 0.00 0 0.00
Capital One Financial Corp.a
Fairfax County 1,000 0 0.00 958 0.96 1000 1.00
Litton TASCa
Fairfax County 150 0 0.00 144 0.96 150 1.00
Fairchild Dornier Fairfax County 150 3 0.02 3 0.02 3 0.02
Fisher Scientific Company Frederick County 250 211 0.84 211 0.84 211 0.84
O'Sullivan Industries - Virginia,
Inc. Halifax County 100 94 0.94 94 0.94 94 0.94
Nextel Communications Hampton 200 856 4.28 856 4.28 856 4.28
Fidelity Holdingsa
Henrico County 500 0 0.00 479 0.96 500 1.00
Infineon Technologies Henrico County 1,100 1,845 1.68 1,845 1.68 1,845 1.68
Nautica Enterprises, Inc. Henry County 375 345 0.92 345 0.92 345 0.92
Nylstar Henry County 50 210 4.20 210 4.20 210 4.20
Sara Lee Activewear Henry County 557 303 0.54 303 0.54 303 0.54
CPFilms Henry County 52 54 1.04 54 1.04 54 1.04
National Catalog Corporation Henry County & Martinsville 875 100 0.11 100 0.11 100 0.11
Smithfield Foods, Inc. Isle of Wight County 176 176 1.00 176 1.00 176 1.00
Cost Plus, Inc. Isle of Wight County 160 97 0.61 97 0.61 97 0.61
Wal-Mart Stores, Inc. James City County 400 585 1.46 585 1.46 585 1.46
John Deerea
James City County 25 0 0.00 24 0.96 25 1.00

63
2000 Development Projects Locality
Job
Creation
Projections
Job Creation
Lower
Bound Ratio
Mid-
Level Ratio
Upper
Bound Ratio
Sterling Semiconductor, Inc. Loudoun County 172 0 0.00 0 0.00 0 0.00
FlashVision, LLCa
Manassas 600 0 0.00 575 0.96 600 1.00
Nationwide Homesa
Martinsville 170 0 0.00 163 0.96 170 1.00
Investors Corporationa
Martinsville 380 0 0.00 364 0.96 380 1.00
EchoStar Communications Corp. Montgomery County 1,400 1,147 0.82 1,147 0.82 1,147 0.82
ACT MicroDevicesa
Montgomery County 300 0 0.00 287 0.96 300 1.00
Evercel Newport News 180 43 0.24 43 0.24 43 0.24
ArborTech Forest Products Nottoway County 50 51 1.02 51 1.02 51 1.02
Engineered Building Components
Internationala Nottoway County 100 0 0.00 96 0.96 100 1.00
Von Holtzbrinck Publishing
Services Orange County 50 130 2.60 130 2.60 130 2.60
EMCO Page County 343 344 1.00 344 1.00 344 1.00
Boehringer Ingelheim Corp Petersburg 104 246 2.37 246 2.37 246 2.37
CFW Communications, d/b/a
NTELOS Portsmouth 250 11 0.04 11 0.04 11 0.04
SMI Steel Products Prince Edward County 150 62 0.41 62 0.41 62 0.41
SMI Steel Products Prince Edward County 30 12 0.40 12 0.40 12 0.40
America Online, Inc. Prince William County 1,325 897 0.68 897 0.68 897 0.68
Ethan Allen Pulaski County 446 0 0.00 0 0.00 0 0.00
Precision Technology Group Roanoke City 100 15 0.15 15 0.15 15 0.15
SYSCO Foodservice Suffolk 650 150 0.23 150 0.23 150 0.23
Raleigh Mine and Industrial
Supply Tazewell County 249 80 0.32 80 0.32 80 0.32
Sykes Interprises, Inc. Wise County 400 520 1.30 520 1.30 520 1.30
Somic Ishiwakaa
Wythe County 25 0 0.00 24 0.96 25 1.00
TOTALb
22,419 10,544 0.47 20,556 0.92 20,994 0.94
a: Employment information not obtained from VDBA, SCT, or NETS – lower bound, mid-level, and upper bound estimates for employment apply
b: Ratios are an annual average across all development projects

64
2001 Development Projects Locality
Job
Creation
Projections
Job Creation
Lower
Bound Ratio
Mid-
Level Ratio
Upper
Bound Ratio
McKee Foods Augusta County 200 320 1.60 320 1.60 320 1.60
Hershey Foods Corporation Augusta County 100 38 0.38 38 0.38 38 0.38
Bristol Brass Bristol 125 0 0.00 0 0.00 0 0.00
Atlanta Pulp & Paper Companya Brunswick County 282 0 0.00 241 0.86 282 1.00
Transfer Specialtiesa Buena Vista 250 0 0.00 214 0.86 250 1.00
Harris-Tarkett, Inc.a
Campbell County 100 0 0.00 85 0.85 100 1.00
ERNI Components, Inc. Chesterfield County 550 140 0.26 140 0.26 140 0.26
The Rochester Corporation Culpeper County 35 20 0.57 20 0.57 20 0.57
Travelocity.com Dickenson County 500 291 0.58 291 0.58 291 0.58
Centrivity Fairfax 45 63 1.40 63 1.40 63 1.40
Creative Technology Incorporated Fairfax County 108 150 1.39 150 1.39 150 1.39
Invicta Networks Fairfax County 100 0 0.00 0 0.00 0 0.00
Biovail Technologies, Inc. Fairfax County 40 9 0.23 9 0.23 9 0.23
Kraft Foods Frederick County 75 272 3.63 272 3.63 272 3.63
VIMCO Inc. Hanover County 150 25 0.17 25 0.17 25 0.17
Alfa Laval Henrico County 100 100 1.00 100 1.00 100 1.00
Institute for Computational Genomics, Inc. James City County 20 3 0.15 3 0.15 3 0.15
WorldCom Loudoun County 8,000 0 0.00 0 0.00 0 0.00
Wal-Mart Stores, Inc.a
Louisa County 600 0 0.00 512 0.85 600 1.00
Carlisle Motion Control Mecklenburg County 110 119 1.08 119 1.08 119 1.08
International Cold Storagea
Nelson County 147 0 0.00 126 0.86 147 1.00
Symantec Corp. Newport News 300 25 0.08 25 0.08 25 0.08
Ferguson Enterprises Newport News 400 550 1.38 550 1.38 550 1.38
Zim-American Israeli Shipping Co., Inc.a Norfolk 235 0 0.00 201 0.86 235 1.00
Ford Motor Company Norfolk 200 572 2.86 572 2.86 572 2.86
Zim-American Israeli Shipping Co., Inc. Norfolk 235 235 1.00 235 1.00 235 1.00
proVENTO Internationala
Northampton County 25 0 0.00 21 0.84 25 1.00
LaJobi Industries, Inc.a
Nottoway County 110 0 0.00 94 0.86 110 1.00
K-B Toys a
Pittsylvania County 150 0 0.00 128 0.85 150 1.00
NTELOS a
Portsmouth 250 0 0.00 214 0.86 250 1.00
Hanmi International Corporationa
Portsmouth 170 0 0.00 145 0.85 170 1.00
ASTROLINK International LLCa
Prince William County 250 0 0.00 214 0.86 250 1.00
Boehringer Ingelheima
Richmond City 16 0 0.00 14 0.88 16 1.00

65
2001 Development Projects Locality
Job
Creation
Projections
Job Creation
Lower
Bound Ratio
Mid-
Level Ratio
Upper
Bound Ratio
Maple Leaf Bakery Roanoke City 45 133 2.96 133 2.96 133 2.96
Advance Auto Parts Roanoke City 234 125 0.53 125 0.53 125 0.53
Novozymes Biologicals, Inc. Roanoke County 90 79 0.88 79 0.88 79 0.88
TeleCorp PCS, Inc. a
Russell County 300 0 0.00 256 0.85 300 1.00
Petals, Inc. Suffolk 250 5 0.02 5 0.02 5 0.02
Sara Lee Coffee & Tea Suffolk 100 102 1.02 102 1.02 102 1.02
AFFINA Suffolk 450 307 0.68 307 0.68 307 0.68
VeriSign, Inc.a
Tazewell County 100 0 0.00 85 0.85 100 1.00
Universal Companies, Inc. Washington County 104 56 0.54 56 0.54 56 0.54
Bristol Compressors Washington County 350 78 0.22 78 0.22 78 0.22
V&S Bristol Galvanizing, LLC Washington County 25 11 0.44 11 0.44 11 0.44
Northwood Manufacturing Winchester 200 115 0.58 115 0.58 115 0.58
TOTALSb
16,226 3,943 0.24 6,493 0.40 6,928 0.43
a: Employment information not obtained from VDBA, SCT, or NETS – lower bound, mid-level, and upper bound estimates for employment apply
b: Ratios are an annual average across all development projects

66
2002 Development Projects Locality
Job
Creation
Projections
Job Creation
Lower
Bound Ratio
Mid-
Level Ratio
Upper
Bound Ratio
Interstate Hotels & Resorts / MeriStar
Hospitality
Arlington 270 270 1.00 270 1.00 270 1.00
Barr Laboratories, Inc. Bedford County 75 235 3.13 235 3.13 235 3.13
Ross Products Division of Abbott Laboratories Campbell County 443 0 0.00 0 0.00 0 0.00
Dan River Inc. Campbell Co. & Danville 30 50 1.67 50 1.67 50 1.67
Magnolia Manufacturing Carroll County 61 0 0.00 0 0.00 0 0.00
Kentucky Derby Hosiery Carroll County 72 70 0.97 70 0.97 70 0.97
Visteon Corporation Chesapeake 42 90 2.14 90 2.14 90 2.14
TDS US Chesapeake 210 204 0.97 204 0.97 204 0.97
DuPonta
Chesterfield County 20 0 0.00 17 0.85 20 1.00
AttoTek Culpeper County 40 2 0.05 2 0.05 2 0.05
Competitive Innovations, LLC Culpeper County 40 5 0.13 5 0.13 5 0.13
EsselPropack America, LLC Danville 81 187 2.31 187 2.31 187 2.31
Universal Leaf Tobacco Company, Inc. a
Danville 38 0 0.00 32 0.84 38 1.00
Creative Playthings Emporia 275 229 0.83 229 0.83 229 0.83
BAE SYSTEMS Fairfax County 1,000 999 1.00 999 1.00 999 1.00
Interstate Worldwide Relocation Fairfax County 135 176 1.30 176 1.30 176 1.30
Daston Corporationa
Fairfax County 30 0 0.00 25 0.83 30 1.00
The Boeing Company a
Fairfax County 100 0 0.00 84 0.84 100 1.00
WAM!NET Fairfax County 200 0 0.00 0 0.00 0 0.00
Microsoft Fairfax County 100 0 0.00 0 0.00 0 0.00
BAE SYSTEMSa
Fairfax County 1,000 0 0.00 840 0.84 1,000 1.00
STG, Inc. Fairfax County 700 85 0.12 85 0.12 85 0.12
Dreaming Creek Timber Frame Homes, Inc. Floyd County 30 36 1.20 36 1.20 36 1.20
Trinity Packaging Corporation Franklin County 300 175 0.58 175 0.58 175 0.58
American Plastics, Inc. Greensville County 108 108 1.00 108 1.00 108 1.00
Danaher Power Solutions Henrico County 180 54 0.30 54 0.30 54 0.30
Nautica Enterprises, Inc. Henry County 300 260 0.87 260 0.87 260 0.87
Cerxon Microtechnologies, LLC a
Henry County 250 0 0.00 210 0.84 250 1.00
Knauss Snack Food Company Henry County 105 124 1.18 124 1.18 124 1.18
Activewear, Inc. Henry County 190 81 0.43 81 0.43 81 0.43
Greenridge Environmental Corporationa
Lunenburg County 165 0 0.00 139 0.84 165 1.00
Frito-Lay Lynchburg 125 0 0.00 0 0.00 0 0.00
Bausch & Lomb Lynchburg 35 45 1.29 45 1.29 45 1.29
Norcraft Companies, LLCa
Lynchburg 155 0 0.00 130 0.84 155 1.00

67
2002 Development Projects Locality
Job
Creation
Projections
Job Creation
Lower
Bound Ratio
Mid-
Level Ratio
Upper
Bound Ratio
Axiom Technologiesa
Martinsville 250 0 0.00 210 0.84 250 1.00
Basalt Fiber Companya
Mecklenburg County 55 0 0.00 46 0.84 55 1.00
Trinity Packaging Corporationa
Mecklenburg County 150 0 0.00 126 0.84 150 1.00
Star Scientific, Inc. a
Mecklenburg County 315 0 0.00 265 0.84 315 1.00
Red Oak E-Commerce Solutions, Inc. (ROES) Mecklenburg County 40 4 0.10 4 0.10 4 0.10
Sherwood Brands Mecklenburg County 250 250 1.00 250 1.00 250 1.00
Siemens VDO Automotive Newport News 55 300 5.46 300 5.46 300 5.46
Wako Chemicals USA, Inc. Northampton County 5 10 2.00 10 2.00 10 2.00
Keystone Dyeing & Finishing Orange County 100 102 1.02 102 1.02 102 1.02
Lohmann Corporation Orange County 30 0 0.00 0 0.00 0 0.00
Narroflex, Inc. Patrick County 450 268 0.60 268 0.60 268 0.60
Unique Industries, Inc. Pittsylvania County 420 329 0.78 329 0.78 329 0.78
Service Center Metals (SCM) Prince George County 100 43 0.43 43 0.43 43 0.43
Noland Company Prince George County 40 5 0.13 5 0.13 5 0.13
Eli Lilly and Company Prince William County 700 83 0.12 83 0.12 83 0.12
Comcast Cable Communications, Inc. Prince William County 375 300 0.80 300 0.80 300 0.80
Power Systems International, Inc. Rockbridge County 64 15 0.23 15 0.23 15 0.23
AT&T Wirelessa
Russell County 300 0 0.00 252 0.84 300 1.00
U.S. Foodservice Salem 200 206 1.03 206 1.03 206 1.03
Unilever Suffolk 65 28 0.43 28 0.43 28 0.43
Target Corporation Suffolk 500 362 0.72 362 0.72 362 0.72
SafeCard ID Inc. Virginia Beach 55 14 0.26 14 0.26 14 0.26
Cendant Corporation Virginia Beach 100 166 1.66 166 1.66 166 1.66
SYSCO Corporationa
Warren County 388 0 0.00 326 0.84 388 1.00
Rubbermaid Commercial Products Winchester 250 0 0.00 0 0.00 0 0.00
EnVirtue Biotechnologies, Inc. Winchester 12 1 0.08 1 0.08 1 0.08
Verizon Wise County 61 25 0.41 25 0.41 25 0.41
Klöckner Pentaplast of America, Inc. Wythe County 405 328 0.81 328 0.81 328 0.81
The Pepsi Bottling Group, Inc. Wythe County 200 143 0.72 143 0.72 143 0.72
TOTALSb
12,840 6,467 0.50 9,169 0.71 9,683 0.75
a: Employment information not obtained from VDBA, SCT, or NETS – lower bound, mid-level, and upper bound estimates for employment apply
b: Ratios are an annual average across all development projects

68
2003 Development Projects Locality
Job
Creation
Projections
Job Creation
Lower
Bound Ratio
Mid-
Level Ratio
Upper
Bound Ratio
Hyosung America Inc. Albemarle County 100 100 1.00 100 1.00 100 1.00
Advanced Information Services (AIS) Alexandria 125 147 1.18 147 1.18 147 1.18
Lear Corporation Alleghany County 200 250 1.25 250 1.25 250 1.25
AES Corporation Arlington County 115 0 0.00 0 0.00 0 0.00
ABB Inc. Bland County 75 95 1.27 95 1.27 95 1.27
Metalsa Botetourt County 70 140 2.00 140 2.00 140 2.00
Framatome ANP (Advanced Nuclear
Power)
Campbell Co. &
Lynchburg
300 91 0.30 91 0.30 91 0.30
Schrader Bridgeport International Inc. Campbell County 50 55 1.10 55 1.10 55 1.10
Care Rehab and Orthopaedic Products,
Inc.
Charlotte County 50 69 1.38 69 1.38 69 1.38
Chesapeake Hardwood Products Chesapeake 50 25 0.50 25 0.50 25 0.50
Hudd Distribution Chesapeake 260 304 1.17 304 1.17 304 1.17
HCA Chesterfield County 200 219 1.10 219 1.10 219 1.10
DuPont Engineering Polymers Chesterfield County 20 25 1.25 25 1.25 25 1.25
Continental Teves, Inc. Culpepper County 29 35 1.21 35 1.21 35 1.21
Essel Propack America LLC Danville 50 110 2.20 110 2.20 110 2.20
Sunrise Senior Livinga
Fairfax County 140 0 0.00 121 0.84 140 1.00
Unisys Corporation Fairfax County 900 363 0.40 363 0.40 363 0.40
Money Mailer Franklin 160 110 0.69 110 0.69 110 0.69
MW Manufacturers Franklin County 130 259 1.99 259 1.99 259 1.99
The Home Depot Frederick County 30 10 0.33 10 0.33 10 0.33
Ford Motor Company Frederick County 95 0 0.00 0 0.00 0 0.00
Trex Company, Inc. Frederick County 475 0 0.00 0 0.00 0 0.00
Barber & Ross Company Frederick County 36 107 2.97 107 2.97 107 2.97
CarMax, Inc. Goochland County 600 400 0.67 400 0.67 400 0.67
Harvest Pharmaceuticals Inc. Grayson County 30 9 0.30 9 0.30 9 0.30
D&R USA, Inc. Halifax County 40 68 1.70 68 1.70 68 1.70
Virginia Brands, LLC Halifax County 35 23 0.66 23 0.66 23 0.66
Sunshine Mills, Inc. Halifax County 8 0 0.00 0 0.00 0 0.00
Gray Hawk Systems, Inc. Hampton Roads &
Northern Virginia
200 244 1.22 244 1.22 244 1.22
Wachovia Securities LLC Henrico Co. & Richmond
City
1,200 849 0.71 849 0.71 849 0.71
Philip Morris USA Henrico County 450 500 1.11 500 1.11 500 1.11

69
James River Insurance Company Henrico County 42 2 0.05 2 0.05 2 0.05
Globaltex Inc.a
Henry County 154 0 0.00 134 0.87 154 1.00
Goldschmidt Chemical Corporation Hopewell 28 0 0.00 0 0.00 0 0.00
Augusta Lumber Company King William County 65 34 0.52 34 0.52 34 0.52
WaveLight Laser Technologie AG Loudon County 30 11 0.37 11 0.37 11 0.37
RR Donnelleya
Lynchburg 50 0 0.00 43 0.86 50 1.00
MZM, Inc. Martinsville 250 43 0.17 43 0.17 43 0.17
DRS Group Mecklenburg County 115 200 1.74 200 1.74 200 1.74
APT, Inc.a
Mecklenburg County 375 0 0.00 325 0.87 375 1.00
Liebherr Newport News 134 170 1.27 170 1.27 170 1.27
Siemens VDO Automotive Newport News 75 40 0.53 40 0.53 40 0.53
Boehringer Ingelheim Corporation Petersburg 165 165 1.00 165 1.00 165 1.00
Intertape Polymer Group Inc. Pittsylvania County 65 65 1.00 65 1.00 65 1.00
Carbone Kirkwood LLC Prince Edward County 50 44 0.88 44 0.88 44 0.88
Standard Motor Products, Inc Prince George County 107 92 0.86 92 0.86 92 0.86
General Dynamics Land Systems Prince William County 170 400 2.35 400 2.35 400 2.35
Global Contact Services, LLC Pulaski County 300 170 0.57 170 0.57 170 0.57
Grucci Radford 53 0 0.00 0 0.00 0 0.00
Dominion Richmond City 110 2 0.02 2 0.02 2 0.02
The Vidette Groupa
Roanoke City 500 0 0.00 434 0.87 500 1.00
Marvin Windows and Doors Roanoke County 100 58 0.58 58 0.58 58 0.58
Cardinal Glass Industries Roanoke County 160 75 0.47 75 0.47 75 0.47
Wal-Mart Stores, Inc. Rockingham County 1,600 902 0.56 902 0.56 902 0.56
Teleflex Automotive Russell County 175 0 0.00 0 0.00 0 0.00
General Dynamics Smyth County 120 174 1.45 174 1.45 174 1.45
Lockheed Martina
Suffolk 50 0 0.00 43 0.86 50 1.00
STIHL Inc. Virginia Beach 80 84 1.05 84 1.05 84 1.05
Cendant Corporation Virginia Beach 187 41 0.22 41 0.22 41 0.22
AMERIGROUP Corporation Virginia Beach 858 755 0.88 755 0.88 755 0.88
AFG Industries Washington County 200 71 0.36 71 0.36 71 0.36
Carry-On Trailer Corporation Westmoreland County 140 161 1.15 161 1.15 161 1.15
Wytheville Technologies, Inc. Wythe County 102 215 2.11 215 2.11 215 2.11
Musser Lumber Sales, Inc. Wythe County 45 23 0.51 23 0.51 23 0.51
TOTALSb
12,878 8604 0.67 9,704 0.75 9,873 0.77
a: Employment information not obtained from VDBA, SCT, or NETS – lower bound, mid-level, and upper bound estimates for employment apply
b: Ratios are an annual average across all development projects

70
2004 Development
Projects Locality
Projected
Job
Creation
Job Creation
Lower
Bound Ratio
Mid-
Level Ratio
Upper
Bound Ratio
Science Applications
International Corporationa (Multiple locations) 4,515 0 0.00 2,872 0.64 4,515 1.00
Corporate Executive Boarda
Arlington County 2,500 0 0.00 1,590 0.64 2,500 1.00
SRA International Arlington Co.; Fairfax Co. 1,400 1,127 0.81 1,127 0.81 1,127 0.81
Hershey Chocolate of VA, Inc. Augusta County 110 125 1.14 125 1.14 125 1.14
Arkay Packaging Corporation Botetourt County 75 0 0.00 0 0.00 0 0.00
Crowley Foods Bristol 96 29 0.30 29 0.30 29 0.30
Snack Alliance, Inc. Bristol 180 104 0.58 104 0.58 104 0.58
Rage Corporation Campbell County 25 21 0.84 21 0.84 21 0.84
M.C. Dean, Inc. Caroline County 150 44 0.29 44 0.29 44 0.29
Merillat Industries, Inc. Culpepper County 140 237 1.69 237 1.69 237 1.69
Luna Innovations Danville 54 15 0.28 15 0.28 15 0.28
Telvista, Inc. Danville 500 800 1.60 800 1.60 800 1.60
Columbia Flooring Danville 200 135 0.68 135 0.68 135 0.68
Knight-Celotex, LLC Danville 145 88 0.61 88 0.61 88 0.61
Nestlé Refrigerated Foods Danville 50 21 0.42 21 0.42 21 0.42
Franklin Braid Emporia 25 44 1.76 44 1.76 44 1.76
Charah, Inc. Emporia 290 89 0.31 89 0.31 89 0.31
Toll Integrated Systems Emporia; Greensville Co. 28 10 0.36 10 0.36 10 0.36
Cam Communications, Inc. Fairfax County 31 83 2.68 83 2.68 83 2.68
IBM Corporation Fairfax County 1250 124 0.10 124 0.10 124 0.10
PricewaterhouseCoopers Fairfax County 600 600 1.00 600 1.00 600 1.00
Booz Allen Hamilton Fairfax County 3,700 2,953 0.80 2,953 0.80 2,953 0.80
AgustaWestland, Inc. Fairfax County 300 15 0.05 15 0.05 15 0.05
CTS&I Millwork, Inc.a
Franklin County 40 0 0.00 25 0.63 40 1.00
M&H Plastics Frederick County 57 33 0.58 33 0.58 33 0.58
HP Hood Inc.a
Frederick County 55 0 0.00 35 0.64 55 1.00
Executive Protection Systems Frederick County 30 17 0.57 17 0.57 17 0.57
Guardian Industries Corp.a
Galax 54 0 0.00 34 0.63 54 1.00
Celanese Acetate LLC Giles County 65 104 1.60 104 1.60 104 1.60
Universal Food and Beverage
Company, Inc.
Grayson County 151 31 0.21 31 0.21 31 0.21
Veggie Patcha
Greenville County 80 0 0.00 51 0.64 80 1.00
ABB, Inc. Halifax County 375 200 0.53 200 0.53 200 0.53
Infineon Technologies Richmond Henrico County 2,000 200 0.10 200 0.10 200 0.10
Virginia Credit & Finance Henrico County 150 107 0.71 107 0.71 107 0.71

71
Saxon Capital, Inc. Henrico County 234 33 0.14 33 0.14 33 0.14
America Online, Inc.a
Henrico County & Norton 107 0 0.00 68 0.64 107 1.00
MasterBrand Cabinets, Inc. Henry County 700 196 0.28 196 0.28 196 0.28
HT Motorsportsa
Henry County 75 0 0.00 48 0.64 75 1.00
StarTek, Inc. Henry County 500 693 1.39 693 1.39 693 1.39
Cost Plus, Inc Isle of Wight County 190 100 0.53 100 0.53 100 0.53
Wal-Mart Stores, Inc. James City County 125 121 0.97 121 0.97 121 0.97
StarTek, Inc. Lynchburg 542 333 0.61 333 0.61 333 0.61
Microwave Circuits, Inc. Lynchburg 200 27 0.13 27 0.14 27 0.14
SEA Systems Group, Inc. Mecklenburg County 25 7 0.28 7 0.28 7 0.28
Basic Sportswear Mecklenburg County 40 20 0.50 20 0.50 20 0.50
Southern Textile Service, Inc. and
RD Group Mecklenburg County
55 74 1.35 74 1.35 74 1.35
CMA-CGM Norfolk 116 68 0.59 68 0.59 68 0.59
Trader Publishing Company Norfolk 1,150 197 0.17 197 0.17 197 0.17
Ride-Away Corporation Norfolk & Richmond City 45 15 0.33 15 0.33 15 0.33
Aerojet Orange County 149 121 0.81 121 0.81 121 0.81
Hopkins Lumber Company Patrick County 50 0 0.00 0 0.00 0 0.00
APM Terminals Portsmouth 210 6 0.03 6 0.03 6 0.03
Geo-Centers, Inc.a
Prince William County 10 0 0.00 6 0.60 10 1.00
General Dynamics Future Combat
Systems Prince William County 150 70 0.47 70 0.47 70 0.47
Mediatech, Inc. Prince William County 100 5 0.05 5 0.05 5 0.05
Kollmorgen Corporation Radford 71 2 0.03 2 0.03 2 0.03
Ashford Court Richmond City 105 64 0.61 64 0.61 64 0.61
Morningstar Food Rockingham County 50 57 1.14 57 1.14 57 1.14
MillerCoors Rockingham County 4 0 0.00 0 0.00 0 0.00
Joy Mining Machinery Scott County 45 53 1.18 53 1.18 53 1.18
Midpaco Scott County 60 60 1.00 60 1.00 60 1.00
RJJ Tire Co., Inc. Shenandoah County 28 0 0.00 0 0.00 0 0.00
Utility Trailer Mfg. Co. Smyth County 100 200 2.00 200 2.00 200 2.00
Merillat Corporationa
Smyth County 173 0 0.00 110 0.64 173 1.00
Global Contact Services Smyth Co.; Washington Co. 200 130 0.65 130 0.65 130 0.65
Windsor Mill Surry County 70 0 0.00 0 0.00 0 0.00
Blue Ridge Wood Products, Inc. Tazewell County 160 71 0.44 71 0.44 71 0.44
TOTALSb
25,260 10,079 0.40 14,918 0.59 17,688 0.70
a: Employment information not obtained from VDBA, SCT, or NETS – lower bound, mid-level, and upper bound estimates for employment apply
b: Ratios are an annual average across all development projects

72
2005 Development Projects Locality Job Creation
Projection
Job Creation
Lower
Bound Ratio
Mid-
Level Ratio
Upper
Bound Ratio
Princeton BioMeditech
Corporationa Albemarle County 115 0 0.00 106 0.92 115 1.00
TransCorea
Alleghany County 60 0 0.00 55 0.92 60 1.00
Specialty Blades, Inc. Augusta County 25 40 1.60 40 1.60 40 1.60
Koyo Steering Systems of USAa
Botetourt County 96 0 0.00 89 0.93 96 1.00
AmerLink, Inc. Carroll County 200 0 0.00 0 0.00 0 0.00
BT Conferencing, Inc. Chesapeake 150 2 0.01 2 0.01 2 0.01
American Funds Service Co.a
Chesapeake 250 0 0.00 231 0.92 250 1.00
Pearson Government Solutionsa
Chesterfield County 800 0 0.00 738 0.92 800 1.00
Merit Medical Systems Inc.a
Chesterfield County 200 0 0.00 184 0.92 200 1.00
Redemtech, Inc. Chesterfield County 80 60 0.75 60 0.75 60 0.75
Bureau of National Affairs, Inc.a
Crystal City 1,000 0 0.00 922 0.92 1,000 1.00
Yorktowne Cabinetry, Inc. Danville 540 294 0.54 294 0.54 294 0.54
TWM Cabling Solutions, Inc Danville 58 40 0.69 40 0.69 40 0.69
Essel Propack America, LLC Danville 40 109 2.73 109 2.73 109 2.73
EIT, Inc. Danville 250 290 1.16 290 1.16 290 1.16
SI International Dickenson County 100 120 1.20 120 1.20 120 1.20
BAE Systems Fairfax County 700 614 0.88 614 0.88 614 0.88
OPTIMUS Corporation Fairfax County 234 234 1.00 234 1.00 234 1.00
Mod-U-Kraf Homes, LLC Franklin County 50 40 0.80 40 0.80 40 0.80
Turman Hardwood Flooring, Inc. Galax 40 134 3.35 134 3.35 134 3.35
Lindstrand USA, Inc. Hailfax County 50 32 0.64 32 0.64 32 0.64
Pacific Headwear, Inc. Halifax County 25 33 1.32 33 1.32 33 1.32
ADi Motorsports Halifax County 860 571 0.66 571 0.66 571 0.66
Newmarket Trading Group, Ltda
Hanover County 100 0 0.00 92 0.92 100 1.00
Texturing Services Inc. Henry County 150 91 0.61 91 0.61 91 0.61
Ridgeway Furniture Products Henry County 134 110 0.82 110 0.82 110 0.82
Gerdau Ameristeel King George County 50 57 1.14 57 1.14 57 1.14
KCG Call Centers, LLC Lee County 100 109 1.09 109 1.09 109 1.09
Framatome ANP, Inc. Lynchburg 32 0 0.00 0 0.00 0 0.00
Aurora Flight Services
Corporation Manassas 100 33 0.33 33 0.33 33 0.33
Micron Technology, Inc. Manassas 130 387 2.98 387 2.98 387 2.98
Peebles Mecklenburg County 107 226 2.11 226 2.11 226 2.11
Narricot Industries, LP Mecklenburg County 138 337 2.44 337 2.44 337 2.44
Home Care Delivered, Inc.a
Mecklenburg County 147 0 0.00 136 0.93 147 1.00
Wolseley Newport News 400 0 0.00 0 0.00 0 0.00

73
2005 Development Projects Locality Job Creation
Projection
Job Creation
Lower
Bound Ratio
Mid-
Level Ratio
Upper
Bound Ratio
U.S. Gypsum Companya
Norfolk 25 0 0.00 23 0.92 25 1.00
Virtus Marketing Norton 35 1 0.03 1 0.03 1 0.03
Ten Oaks, LLC Patrick County 200 123 0.62 123 0.62 123 0.62
StarTek, Inc. Petersburg 500 341 0.68 341 0.68 341 0.68
Lindab USA Portsmouth 57 0 0.00 0 0.00 0 0.00
Paris Ceramics USA, Inc. Prince Edward County 30 38 1.27 38 1.27 38 1.27
Service Center Metals Prince George County 32 50 1.56 50 1.56 50 1.56
Sterling Gelatin, America, Inc.a
Prince George County 20 0 0.00 18 0.90 20 1.00
Reyes Holdings, LLC Prince George County 120 0 0.00 0 0.00 0 0.00
Goya Foods, Inc. Prince George County 60 38 0.63 38 0.63 38 0.63
James Hardie Pulaski 200 200 1.00 200 1.00 200 1.00
BondCote Corporation Pulaski County 27 17 0.63 17 0.63 17 0.63
Lumbee Enterprises Pulaski County 50 16 0.32 16 0.32 16 0.32
Philip Morris USA Richmond City 500 450 0.90 450 0.90 450 0.90
FreightCar America, Inc. Roanoke City 400 400 1.00 400 1.00 400 1.00
UnitedHealth Group Roanoke City 250 250 1.00 250 1.00 250 1.00
Tecton Products LLC Roanoke County 50 50 1.00 50 1.00 50 1.00
ITT Industries Night Visiona Roanoke County 200 0 0.00 184 0.92 200 1.00
Dynamic Aviation Rockingham County 206 206 1.00 206 1.00 206 1.00
Designer Wood Tile & Finishing
Inc. Russell County
155 1 0.01 1 0.01 1 0.01
CGI Group, Inc. Russell County 300 169 0.56 169 0.56 169 0.56
Call Evolution Company Scott County 250 150 0.60 150 0.60 150 0.60
McGill-Leprechauna
Sussex County 25 0 0.00 23 0.92 25 1.00
Clinch River Forest Products,
Inc.a Tazewell County
102 0 0.00 94 0.92 102 1.00
STIHL Incorporated Virginia Beach 150 1000 6.67 1000 6.67 1000 6.67
Interbake Foods LLC Warren County 381 248 0.65 248 0.65 248 0.65
Strongwell Corporation Washington County 65 50 0.77 50 0.77 50 0.77
K-VA-T Food Stores, Inc. Washington County 110 110 1.00 110 1.00 110 1.00
Universal Fiber Systems Washington County 94 100 1.06 100 1.06 100 1.06
Pepsi Beverages Companya
Wythe County 120 0 0.00 111 0.93 120 1.00
Klöckner Pentaplast of America,
Inc. Wythe County
54 53 0.98 53 0.98 53 0.98
TOTALSb
12,279 8,024 0.65 11,030 0.90 11,284 0.92
a: Employment information not obtained from VDBA, SCT, or NETS – lower bound, mid-level, and upper bound estimates for employment apply
b: Ratios are an annual average across all development projects

74
2006 Development
Projects Locality
Job
Creation
Projection
Job Creation
Lower
Bound Ratio
Mid-
Level Ratio
Upper
Bound Ratio
MW Manufacturers Inc. Bland County 175 197 1.13 197 1.13 197 1.13
Tier Technologies Botetourt County 77 2 0.03 2 0.03 2 0.03
Corning Botetourt County 50 0 0.00 0 0.00 0 0.00
Merillat, Inc. Bristol 150 0 0.00 0 0.00 0 0.00
U.S. Components, LLC Buckingham County 104 97 0.93 97 0.93 97 0.93
Intermet Corporation Campbell County 175 0 0.00 0 0.00 0 0.00
Visador Holding
Corporationa
Campbell County 100 0 0.00 69 0.69 100 1.00
Tosoh Quartz Caroline County 27 0 0.00 0 0.00 0 0.00
FERIDIES® Chesapeake 25 14 0.56 14 0.56 14 0.56
Clinch Mountain Finishing &
Logisticsa Chesterfield County
220 0 0.00 151 0.69 220 1.00
Telvista, Inc. Danville 250 590 2.36 590 2.36 590 2.36
Reline America, Inc. Danville 25 19 0.76 19 0.76 19 0.76
Banker Steel Company, LLC Danville 110 110 1.00 110 1.00 110 1.00
Holston Medical Group
(HMG) Danville 40 0 0.00 0 0.00 0 0.00
Water World Fiberglass
Pools, N.E. Inc.a
Danville & Pittsylvania
County 100 0 0.00 69 0.69 100 1.00
Arrow Truck Sales, Dex
Division Fairfax County 25 2 0.08 2 0.08 2 0.08
Oran Safety Glass Floyd County 50 128 2.56 128 2.56 128 2.56
E.I. DuPont de Nemours &
Co., Inc.a Franklin County 50 0 0.00 34 0.68 50 1.00
Arista Tubes, UK Franklin County 145 54 0.37 54 0.37 54 0.37
Jennmar Corporation of
Virginia, Inc. Greensville County 70 49 0.70 49 0.70 49 0.70
ABB Inc. Halifax County 30 40 1.33 40 1.33 55 1.83
ABB Inc. James City County 127 55 0.43 55 0.43 40 0.32
NYK Logistics Inc.a
King William County 100 0 0.00 69 0.69 100 1.00
Lockheed Martin Corporation Loudoun County 200 234 1.17 234 1.17 234 1.17

75
Prime Choice Foods, Inc. Lynchburg, Roanoke
Co. & Rockingham Co. 35 33 0.94 33 0.94 33 0.94
AVID Medical Inc. Manassas 303 163 0.54 163 0.54 163 0.54
Lees Commercial Carpets Martinsville 25 25 1.00 25 1.00 25 1.00
American Industrial Heat
Transfer, Inc.a Mecklenburg County 85 47 0.55 47 0.55 47 0.55
Federal-Mogul Corporation Montgomery County 71 38 0.54 38 0.54 38 0.54
Philip Morris USAa
Montgomery County 75 0 0.00 52 0.69 75 1.00
Raytheon Companya
Orange County 15 0 0.00 10 0.67 15 1.00
Diversified Information
Technologiesa Radford 200 0 0.00 137 0.69 200 1.00
Unarco Industries, Inc. Richmond City 194 131 0.68 131 0.68 131 0.68
MeadWestvaco Corporation Rockbridge County 400 589 1.47 589 1.47 589 1.47
MillerCoors Rockingham County 8 162 20.25 162 20.25 162 20.25
R.R. Donnelley & Sons Co.a
Russell County 139 0 0.00 95 0.68 139 1.00
Virginia Cobia Farms LLC Scott County 60 24 0.40 24 0.40 24 0.40
Dynax America Corporation Shenandoah County 52 131 2.52 131 2.52 131 2.52
The Mennel Milling
Companya
Smyth County;
Washington County 33 0 0.00 23 0.70 33 1.00
Swedwood North America Smyth County;
Washington County 740 50 0.07 50 0.07 50 0.07
Command Information Southampton County 400 4 0.01 4 0.01 4 0.01
Amcor Rigid Plastics Suffolk 144 115 0.80 115 0.80 115 0.80
M.C. Dean, Inc.a
Tazewell County 100 0 0.00 69 0.69 100 1.00
McAirlaid’s Vliesstoffe
GmbH & Co. KG Wise County 160 68 0.43 68 0.43 68 0.43
The Timken Company Wythe County 50 0 0.00 0 0.00 0 0.00
Smorgon Steel Group Ltd. York County 55 0 0.00 0 0.00 0 0.00
TOTALSb
5,769 3,171 0.55 3,949 0.69 4,303 0.75
a: Employment information not obtained from VDBA, SCT, or NETS – lower bound, mid-level, and upper bound estimates for employment apply
b: Ratios are an annual average across all development projects

76
2007 Development
Projects Locality
Job
Creation
Projection
Job Creation
Lower
Bound Ratio
Mid-
Level Ratio
Upper
Bound Ratio
H2Gen Innovations, Inc. Alexandria 50 51 1.02 51 1.02 51 1.02
GridPoint, Inc. Arlington County 250 98 0.39 98 0.39 98 0.39
The Hershey Company Augusta County 150 200 1.33 200 1.33 200 1.33
Universal Impact, Inc. Augusta County 50 5 0.10 5 0.10 5 0.10
Carded Graphics, LLC,
(CGL) Augusta County 121 177 1.46 177 1.46 177 1.46
Innovative Wireless
Technologies (IWT) Bedford County 50 6 0.12 6 0.12 6 0.12
The Matrixx Group Bedford County;
Bedford City 40 10 0.25 10 0.25 10 0.25
Progress Printing Campbell County 10 150 15.00 150 15.00 150 15.00
Alderman Railcar Services,
Inc. Charlotte County 110 0 0.00 0 0.00 0 0.00
INIT Innovations in Traffic
Systems AG Chesapeake 13 0 0.00 0 0.00 0 0.00
Dollar Tree Stores, Inc. Chesapeake 100 102 1.02 102 1.02 102 1.02
Capital Group Companies Chesapeake 250 0 0.00 0 0.00 0 0.00
Terremark Worldwide, Inc. Culpepper County 250 92 0.37 92 0.37 92 0.37
Nestlé USA Danville 50 0 0.00 0 0.00 0 0.00
Essel Propack Danville 35 109 3.11 109 3.11 109 3.11
Volkswagen of America, Inc. Fairfax County 400 269 0.67 269 0.67 269 0.67
Quality Culvert Inc. Greensville County 50 0 0.00 0 0.00 0 0.00
Criticon Harrisonburg 25 0 0.00 0 0.00 0 0.00
Ariake USA, Inc Harrisonburg 25 27 1.08 27 1.08 27 1.08
Bostwick Laboratories Henrico County 600 5 0.01 5 0.01 5 0.01
Synergy Biofuels LLCa
Lee County 30 0 0.00 19 0.63 30 1.00
Lignetics Lunenburg County 35 22 0.63 22 0.63 22 0.63
Filtration Specialties Inc. Mecklenburg County 10 7 0.70 7 0.70 7 0.70
Showbest Fixture
Corporation Nottoway County 104 40 0.39 40 0.39 40 0.39
Aerial Machine and Tool
Corp Patrick County 75 188 2.51 188 2.51 188 2.51

77
2007 Development
Projects Locality
Job
Creation
Projection
Job Creation
Lower
Bound Ratio
Mid-
Level Ratio
Upper
Bound Ratio
Rolls-Roycea
Prince George County 550 0 0.00 350 0.64 550 1.00
Covance Inc. Prince William County 500 121 0.24 121 0.24 121 0.24
Merck & Co., Inc. Rockingham County 70 133 1.90 133 1.90 133 1.90
International Automotive
Components Group North
America Inc. (IAC)
Russell County 26 0 0.00 0 0.00 0 0.00
Rogers Foam Corporationa
Scott County 50 0 0.00 32 0.64 50 1.00
International Automotive
Components Group North
America Inc. (IAC)
Shenandoah County 35 27 0.77 27 0.77 27 0.77
Gates Corporation Smyth & Washington
Co. 172 78 0.45 78 0.45 78 0.45
Wellborn Cabinet, Inc. Smyth County 100 0 0.00 0 0.00 0 0.00
American Wood Fibers Smyth County 60 45 0.75 45 0.75 45 0.75
Bristol Compressors
International Washington County 1,000 1,028 1.03 1,028 1.03 1,028 1.03
Pinnacle Wood Products of
Virginia, Inc. Wise County 200 18 0.09 18 0.09 18 0.09
TOTALSb
5,646 3,008 0.53 3,409 0.60 3,638 0.64
a: Employment information not obtained from VDBA, SCT, or NETS – lower bound, mid-level, and upper bound estimates for employment apply
b: Ratios are an annual average across all development projects

78
APPENDIX 3: JOB PROJECTIONS AND CREATION BY SECTOR
Table 3A: Jobs Comparison Sectors Exceeding Job Creation Projections
Sector Sector Description Projects
Job
Creation
Projections
Direct Job Creation
Lower
Bound Ratio
Mid-
Level Ratio
Upper
Bound Ratio
524 Insurance Carriers &
Related Activities 2 42 757 18.02 757 18.02 757 18.02
711
Performing Arts,
Spectator Sports, &
Related Industries
2 415 856 2.06 904 2.18 931 2.24
236 Construction of
Buildings 1 30 36 1.20 36 1.20 36 1.20
333 Machinery
Manufacturing 14 2,899 3,138 1.08 3,282 1.13 3,288 1.13
312
Beverage & Tobacco
Product
Manufacturing
8 1,300 1,118 0.86 1,415 1.09 1,471 1.13
327
Nonmetallic Mineral
Product
Manufacturing
7 559 551 0.99 608 1.09 630 1.13
326
Plastics & Rubber
Products
Manufacturing
27 2,615 2,485 0.95 2,716 1.04 2,790 1.07
493 Warehousing &
Storage 2 360 304 0.84 373 1.04 404 1.12
445 Food & Beverage
Stores 3 425 275 0.65 439 1.03 525 1.24
551
Management of
Companies &
Enterprises
12 9,421 1,778 0.19 9,526 1.01 9,953 1.06
Note: Sector refers to NAICS code designation.
Source: Number of projects from Governor’s Press Releases. Lower bound, mid-level, and upper bound estimates for direct job creation from
IMPLAN. Ratios for each scenario from authors’ calculations.

79
Table 3B: Jobs Comparison Sectors Meeting Standard Grant Repayment Cutoff (75-100% of Job Creation Projections)
Sector
Sector
Description Projects
Job
Creation
Projections
Direct Job Creation
Lower
Bound Ratio
Mid-
Level Ratio
Upper
Bound Ratio
721 Accommodation 1 270 270 1.00 270 1.00 270 1.00
323 Printing & Related
Support Activities 3 329 175 0.53 314 0.95 364 1.11
488 Support Activities
for Transportation 2 306 206 0.67 290 0.95 306 1.00
336
Transportation
Equipment
Manufacturing
31 4,638 4,347 0.94 4,395 0.95 4,397 0.95
444
Building Material
& Garden
Equipment &
Supplies Dealers
3 680 147 0.22 627 0.92 702 1.03
332
Fabricated Metal
Product
Manufacturing
22 2,449 1,985 0.81 2,199 0.90 2,235 0.91
316
Leather & Allied
Product
Manufacturing
1 375 0 0.00 325 0.87 375 1.00
623
Nursing &
Residential Care
Facilities
1 140 0 0.00 121 0.86 140 1.00
483 Water
Transportation 3 586 303 0.52 504 0.86 538 0.92
425
Wholesale
Electronic Markets
& Agents &
Brokers
1 147 0 0.00 126 0.86 147 1.00
451
Sporting Goods,
Hobby, Book, &
Music Stores
1 150 0 0.00 128 0.85 150 1.00
562
Waste
Management &
Remediation
Service
1 165 0 0.00 139 0.84 165 1.00
531 Real Estate 1 30 0 0.00 25 0.83 30 1.00
515 Broadcasting
(excludes Internet) 2 1,775 1,447 0.82 1,447 0.82 1,447 0.82
311 Food
Manufacturing 26 2,927 2,304 0.79 2,378 0.81 2,417 0.83
522
Credit
Intermediation &
Related Activities
2 1,234 33 0.03 991 0.80 1033 0.84
424
Merchant
Wholesalers,
Nondurable Goods
20 3,465 1,626 0.47 2,654 0.77 2,831 0.82
314 Textile Product Mills
4 205 154 0.75 154 0.75 154 0.75
Note: Sector refers to NAICS code designation.
Source: Number of projects from Governor’s Press Releases. Lower bound, mid-level, and upper bound estimates for direct job creation from
IMPLAN. Ratios for each scenario from authors’ calculations.

80
Table 3C: Jobs Comparison Sectors Meeting between 50-74.99% of Job Creation Projections
Sector Sector Description Projects
Job
Creation
Projections
Job Creation
Lower
Bound Ratio
Mid-
Level Ratio
Upper
Bound Ratio
813
Religious,
Grantmaking, Civic,
Professional, &
Similar Organizations 2 120 88 0.73 88 0.73 88 0.73
322 Paper Manufacturing 4 950 329 0.35 680 0.72 784 0.83
313 Textile Mills 14 2,202 1,440 0.65 1,574 0.71 1,594 0.72
541
Professional,
Scientific, &
Technical Services 59 24,625 9,927 0.40 16,762 0.68 19,993 0.81
523
Securities, Commodity
Contracts, & Other
Financial Investments
& Related Activities 3 1,830 849 0.46 1,213 0.66 1,229 0.67
334
Computer &
Electronic Product
Manufacturing 9 5,182 2,643 0.51 3,429 0.66 3,493 0.67
112 Animal Production 1 88 0 0.00 58 0.66 88 1.00
443
Electronics &
Appliance Stores 1 1,200 0 0.00 786 0.66 1,200 1.00
561
Administrative &
Support Services 28 11,689 4018 0.34 7,616 0.65 8,618 0.74
339
Miscellaneous
Manufacturing 7 1,818 711 0.39 1,183 0.65 1,211 0.67
811 Repair & Maintenance 2 160 15 0.09 104 0.65 111 0.69
325
Chemical
Manufacturing 27 2,536 1408 0.56 1,620 0.64 1,669 0.66
512
Motion Picture &
Sound Recording
Industries 2 496 298 0.60 298 0.60 298 0.60
423
Merchant
Wholesalers, Durable
Goods 17 3,154 1,553 0.49 1,894 0.60 2,003 0.64
315
Apparel
Manufacturing 2 629 373 0.59 373 0.59 373 0.59
321
Wood Product
Manufacturing 25 3,486 1,494 0.43 1,987 0.57 2,086 0.60
452
General Merchandise
Stores 1 1,600 902 0.56 902 0.56 902 0.56
441
Motor Vehicle & Parts
Dealers 7 1,632 897 0.55 903 0.55 907 0.56
335
Electrical Equipment,
Appliance, &
Component
Manufacturing 14 2,064 904 0.44 1,041 0.50 1,109 0.54
Note: Sector refers to NAICS code designation.
Source: Number of projects from Governor’s Press Releases. Lower bound, mid-level, and upper bound estimates for direct job creation from
IMPLAN. Ratios for each scenario from authors’ calculations.

81
Table 3D: Jobs Comparison Sectors Meeting Less Than 50% of Job Creation Projections
Sector Sector
Description Projects
Job
Creation
Projections
Job Creation
Lower
Bound Ratio
Mid-
Level Ratio
Upper
Bound Ratio
454
Non-store
Retailers 2 1,125 513 0.46 513 0.46 513 0.46
621
Ambulatory
Health Care
Services 3 1,300 523 0.40 523 0.40 523 0.40
337
Furniture &
Related Product
Manufacturing 19 6,089 1,765 0.29 2,317 0.38 2,575 0.42
518
Internet Service
Providers, Web
Search Portals, &
Data Processing
Services 10 2,910 971 0.33 971 0.33 971 0.33
331
Primary Metal
Manufacturing 6 427 110 0.26 136 0.32 150 0.35
517 Telecomm. 12 12,718 2,166 0.17 3,003 0.24 3,173 0.25
511
Publishing
Industries 2 1,450 222 0.15 222 0.15 222 0.15
221 Utilities 3 185 2 0.01 23 0.12 27 0.15
532
Rental & Leasing
Services 2 397 47 0.12 47 0.12 47 0.12
481
Air
Transportation 1 300 15 0.05 15 0.05 15 0.05
Note: Sector refers to NAICS code designation.
Source: Number of projects from Governor’s Press Releases. Lower bound, mid-level, and upper bound estimates for direct job creation from
IMPLAN. Ratios for each scenario from authors’ calculations.

82
Table 3E: Economic Multipliers by Sector
Sector Sector Description Multiplier Sector Sector Description Multiplier
327 Nonmetallic Mineral Product
Manufacturing 1.16 337
Furniture & Related Product
Manufacturing 1.93
453 Miscellaneous Store Retailers 1.16 423-
425 Merchant Wholesalers 1.94
454 Nonstore Retailers 1.18 532 Rental & Leasing Services 1.94
451 Sporting Goods, Hobby, Book, &
Music Stores 1.19 332
Fabricated Metal Product
Manufacturing 2.01
711 Performing Arts, Spectator Sports,
& Related Industries 1.19 541
Professional, Scientific, & Technical
Services 2.02
452 General Merchandise Stores 1.25 562 Waste Management & Remediation
Service 2.03
445 Food & Beverage Stores 1.27 524 Insurance Carriers & Related
Activities 2.05
444 Building Material & Garden
Equipment & Supplies Dealers 1.35 336
Transportation Equipment
Manufacturing 2.10
443 Electronics & Appliance Stores 1.41 236 Construction of Buildings 2.12
561 Administrative & Support Services 1.44 326 Plastics & Rubber Products
Manufacturing 2.12
112 Animal Production 1.45 321 Wood Product Manufacturing 2.29
623 Nursing & Residential Care
Facilities 1.46 335
Electrical Equipment, Appliance, &
Component Manufacturing 2.32
441 Motor Vehicle & Parts Dealers 1.47 481 Air Transportation 2.36
523
Securities, Commodity Contracts, &
Other Financial Investments &
Related Activities
1.48 333 Machinery Manufacturing 2.38
315 Apparel Manufacturing 1.52 551 Management of Companies &
Enterprises 2.56
316 Leather & Allied Product
Manufacturing 1.56 518
Internet Service Providers, Web
Search Portals, & Data Processing
Services
2.60
314 Textile Product Mills 1.59 511 Publishing Industries 2.66
811 Repair & Maintenance 1.59 334 Computer & Electronic Product
Manufacturing 2.90
512 Motion Picture & Sound Recording
Industries 1.60 515 Broadcasting (except Internet) 3.08
488 Support Activities for
Transportation 1.61 517 Telecommunications 3.27
493 Warehousing & Storage 1.62 331 Primary Metal Manufacturing 3.34
721 Accommodation 1.67 322 Paper Manufacturing 3.38
813
Religious, Grantmaking, Civic,
Professional, & Similar
Organizations
1.68 221 Utilities 3.59
313 Textile Mills 1.73 311 Food Manufacturing 3.93
323 Printing & Related Support
Activities 1.80 522
Credit Intermediation & Related
Activities 4.17
339 Miscellaneous Manufacturing 1.81 325 Chemical Manufacturing 4.56
531 Real Estate 1.84 483 Water Transportation 4.96
621 Ambulatory Health Care Services 1.89 312 Beverage & Tobacco Product
Manufacturing 5.29

83
Table 3F-1: Highest Performing Development Projects
(Job Creation Ratio)
Sector Date of Project
Announcement Company Name
Projected
Jobs
Jobs
Created
Job Creation
Ratio
312 1/5/2006 MillerCoors 8 162 20.25
561 7/30/2007 Progress Printing 10 150 15.00
326 4/13/2000 Goodyear 50 529 10.58
333 12/21/2005 STIHL Incorporated 150 1,000 6.67
336 5/14/2002 Siemens VDO Automotive 55 300 5.46
711 2/23/2000 Nextel Communications 200 856 4.28
336 4/14/2000 Nylstar 50 210 4.20
445 12/13/2001 Kraft Foods 75 272 3.63
321 12/2/2005 Turman Hardwood Flooring, Inc. 40 134 3.35
325 3/13/2002 Barr Laboratories, Inc. 75 235 3.13
326 4/26/2007 Essel Propack America, LLC 35 109 3.11
551 11/4/2005 Framatome ANP, Inc 130 387 2.98
325 9/16/2003 Trex Company, Inc. 36 107 2.97
311 6/13/2001 Maple Leaf Bakery 45 133 2.96
336 7/24/2001 Ford Motor Company 200 572 2.86
326 4/29/2005 Essel Propack America, LLC 40 109 2.73
541 7/6/2004 Cam Communications, Inc. 31 83 2.68
551 3/13/2000 Von Holtzbrinck Publishing Services 50 130 2.60
327 8/16/2006 Oran Safety Glass 50 128 2.56
336 4/7/2006 Dynax America Corporation 52 131 2.52
332 8/16/2007 Aerial Machine and Tool Corp 75 188 2.51
313 3/18/2005 Narricot Industries, LP 138 337 2.44
325 3/9/2000 Boehringer Ingelheim Corp 104 246 2.37
561 1/10/2006 Telvista, Inc 250 590 2.36
336 8/26/2003 General Dynamics Land Systems 170 400 2.35
326 7/3/2002 EsselPropack America, LLC 81 187 2.31
326 11/7/2003 Essel Propack America LLC 50 110 2.20
336 8/13/2002 Visteon Corporation 42 90 2.14
332 10/28/2003 Wytheville Technologies, Inc. 102 215 2.11
551 3/9/2005 Peebles 107 226 2.11
326 11/3/1999 Ball Corp. 40 83 2.08
313 2/16/1999 Tritex, LLC 30 60 2.00
336 3/19/2003 Metalsa 70 140 2.00
336 3/9/2004 Utility Trailer Manufacturing Co. 100 200 2.00
424 5/20/2002 Wako Chemicals USA, Inc. 5 10 2.00
Source: VDBA, SCT, and NETS data. Ratios from authors’ calculations.

84
Table 3F-2: Highest Performing Development Projects
(Net Jobs)
Sector Date of Project
Announcement Company Name
Projected
Jobs
Jobs
Created
Net
Difference
333 12/21/2005 STIHL Incorporated 150 1,000 850
334 12/19/2000 Infineon Technologies 1,100 1,845 745
711 2/23/2000 Nextel Communications 200 856 656
326 4/13/2000 Goodyear 50 529 479
336 7/24/2001 Ford Motor Company 200 572 372
561 1/10/2006 Telvista, Inc 250 590 340
517 4/13/2004 Telvista, Inc. 500 800 300
551 11/4/2005 Framatome ANP, Inc 130 387 257
336 5/14/2002 Siemens VDO Automotive 55 300 245
336 8/26/2003 General Dynamics Land Systems 170 400 230
313 3/18/2005 Narricot Industries, LP 138 337 199
445 12/13/2001 Kraft Foods 75 272 197
561 8/9/2004 StarTek, Inc. 500 693 193
551 2/15/2006 MeadWestvaco Corporation 400 589 189
424 3/17/2000 Wal-Mart Stores, Inc. 400 585 185
454 7/7/1999 National Catalog Corporation 250 413 163
325 3/13/2002 Barr Laboratories, Inc. 75 235 160
336 4/14/2000 Nylstar 50 210 160
312 1/5/2006 MillerCoors 8 162 154
423 9/7/2001 Ferguson Enterprises 400 550 150
Source: VDBA, SCT, and NETS data.

85
Table 3G: Average Hourly Wage by Sector
Sector Sector Description Average Hourly Wage
312 Beverage & Tobacco Product Manufacturing $54.26
721 Accommodation $43.29
541 Professional, Scientific, & Technical Services $37.57
523 Securities, Commodity Contracts, & Other Financial Inv. $36.61
524 Insurance Carriers & Related Activities $32.76
314 Textile Product Mills $31.48
551 Management of Companies & Enterprises $28.21
517 Telecommunications $26.85
423 Merchant Wholesalers, Durable Goods $25.82
512 Motion Picture & Sound Recording Industries $24.79
236 Construction of Buildings $24.58
511 Publishing Industries $23.73
334 Computer & Electronic Product Manufacturing $22.65
325 Chemical Manufacturing $21.17
488 Support Activities for Transportation $19.85
518 Internet Service Providers, Web Search Portals & Data Proc. $19.54
522 Credit Intermediation & Related Activities $19.18
441 Motor Vehicle & Parts Dealers $18.09
336 Transportation Equipment Manufacturing $16.94
327 Nonmetallic Mineral Product Manufacturing $16.87
452 General Merchandise Stores $16.38
532 Rental & Leasing Services $16.38
483 Water Transportation $15.76
333 Machinery Manufacturing $15.53
326 Plastics & Rubber Products Manufacturing $14.82
453 Miscellaneous Store Retailers $14.36
444 Building Material & Garden Equipment & Supplies Dealers $14.04
332 Fabricated Metal Product Manufacturing $13.95
424 Merchant Wholesalers, Nondurable Goods $13.95
331 Primary Metal Manufacturing $13.93
621 Ambulatory Health Care Services $13.82
711 Performing Arts, Spectator Sports, & Related Industries $13.13
339 Miscellaneous Manufacturing $13.07
311 Food Manufacturing $12.98
315 Apparel Manufacturing $12.93
335 Electrical Equipment, Appliance, & Component Mfg $12.86
321 Wood Product Manufacturing $12.86
337 Furniture & Related Product Manufacturing $12.58
313 Textile Mills $12.43
493 Warehousing & Storage $12.40
515 Broadcasting (except Internet) $11.70
813 Religious, Grantmaking, Civic, Professional, & Similar Orgs $10.53
445 Food & Beverage Stores $10.33
322 Paper Manufacturing $10.27
561 Administrative & Support Services $9.12
454 Nonstore Retailers $9.05
Source: VDBA and SCT data and authors’ calculations.
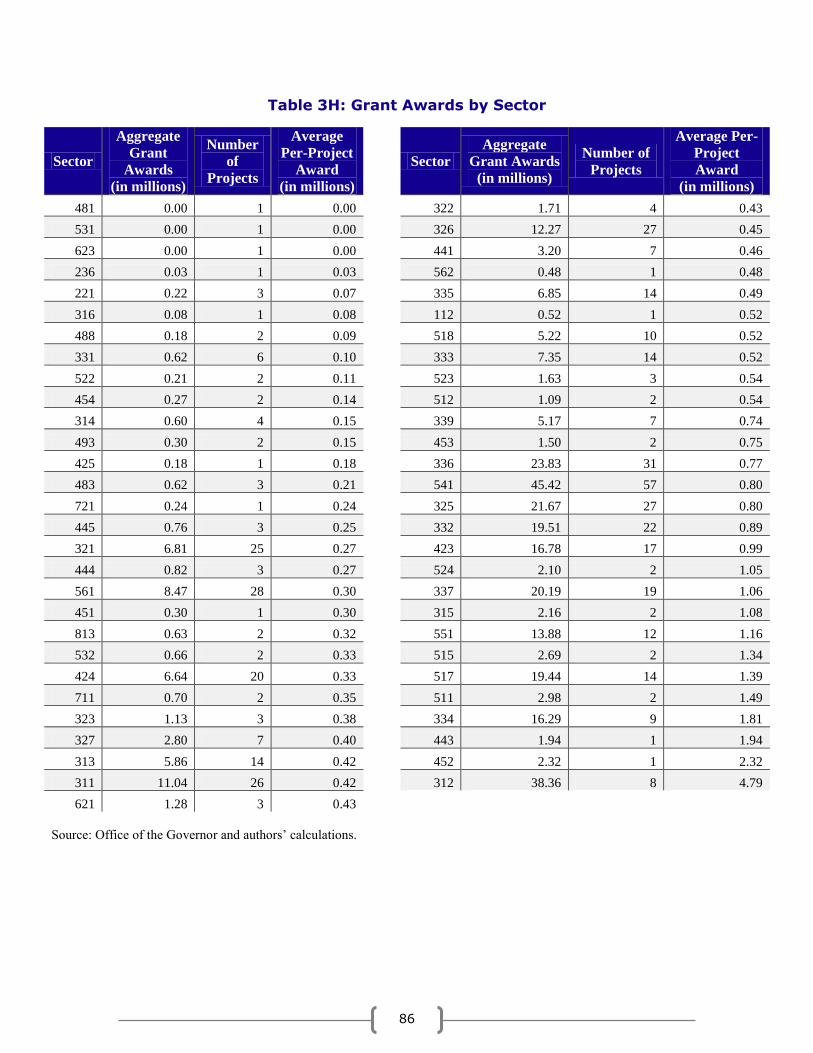
86
Table 3H: Grant Awards by Sector
Sector
Aggregate
Grant
Awards
(in millions)
Number
of
Projects
Average
Per-Project
Award
(in millions)
Sector
Aggregate
Grant Awards
(in millions)
Number of
Projects
Average Per-
Project
Award
(in millions)
481 0.00 1 0.00 322 1.71 4 0.43
531 0.00 1 0.00 326 12.27 27 0.45
623 0.00 1 0.00 441 3.20 7 0.46
236 0.03 1 0.03 562 0.48 1 0.48
221 0.22 3 0.07 335 6.85 14 0.49
316 0.08 1 0.08 112 0.52 1 0.52
488 0.18 2 0.09 518 5.22 10 0.52
331 0.62 6 0.10 333 7.35 14 0.52
522 0.21 2 0.11 523 1.63 3 0.54
454 0.27 2 0.14 512 1.09 2 0.54
314 0.60 4 0.15 339 5.17 7 0.74
493 0.30 2 0.15 453 1.50 2 0.75
425 0.18 1 0.18 336 23.83 31 0.77
483 0.62 3 0.21 541 45.42 57 0.80
721 0.24 1 0.24 325 21.67 27 0.80
445 0.76 3 0.25 332 19.51 22 0.89
321 6.81 25 0.27 423 16.78 17 0.99
444 0.82 3 0.27 524 2.10 2 1.05
561 8.47 28 0.30 337 20.19 19 1.06
451 0.30 1 0.30 315 2.16 2 1.08
813 0.63 2 0.32 551 13.88 12 1.16
532 0.66 2 0.33 515 2.69 2 1.34
424 6.64 20 0.33 517 19.44 14 1.39
711 0.70 2 0.35 511 2.98 2 1.49
323 1.13 3 0.38 334 16.29 9 1.81
327 2.80 7 0.40 443 1.94 1 1.94
313 5.86 14 0.42 452 2.32 1 2.32
311 11.04 26 0.42 312 38.36 8 4.79
621 1.28 3 0.43
Source: Office of the Governor and authors’ calculations.

87
APPENDIX 4: STATE-LEVEL GRANT EXPENDITURES AND REVENUES BY SECTOR
Sector Sector Description
Lower Bound Mid-Level Upper Bound
Tax
Revenues
Grant
Expenditures Tax Revenues
Grant
Expenditures Tax Revenues
Grant
Expenditures
112 Animal Production $0 $0 $219,659 $338,635 $333,578 $517,000
221 Utilities $211,351 $0 $2,352,013 $0 $2,895,323 $0
236 Construction of Buildings $403,099 $30,531 $403,099 $30,531 $403,099 $30,531
311 Food Mfg $46,981,384 $7,259,822 $48,096,686 $7,878,237 $49,285,594 $8,210,762
312 Beverage & Tobacco
Product Mfg $22,797,390 $36,444,204 $354,523,315 $37,549,955 $393,707,859 $37,760,574
313 Textile Mills $14,226,586 $3,443,483 $15,018,682 $3,747,800 $15,748,039 $3,794,483
314 Textile Product Mills $975,423 $447,658 $975,423 $447,658 $975,423 $447,658
315 Apparel Mfg $2,284,561 $1,294,166 $2,284,561 $1,294,166 $2,284,561 $1,294,166
316 Leather & Allied Product
Mfg $0 $0 $1,857,198 $71,007 $2,162,872 $81,900
321 Wood Product Mfg $17,618,683 $2,764,824 $21,872,942 $3,859,507 $24,600,113 $4,107,954
322 Paper Mfg $10,056,739 $425,160 $19,882,157 $1,145,941 $23,964,997 $1,371,010
323 Printing & Related Support $1,567,217 $0 $2,652,466 $784,436 $3,259,809 $1,126,500
325 Chemical Mfg $51,695,947 $13,235,749 $57,067,559 $13,446,146 $61,278,780 $13,516,984
326 Plastics & Rubber Products
Mfg $40,182,655 $9,005,852 $42,424,217 $9,343,391 $45,114,535 $9,432,771
327 Nonmetallic Mineral
Product Mfg $8,281,985 $1,839,372 $8,610,592 $2,456,371 $8,922,161 $2,561,607
331 Primary Metal Mfg $2,905,002 $143,246 $3,599,226 $227,905 $3,961,366 $272,496
332 Fabricated Metal Product
Mfg $24,490,676 $5,687,756 $26,197,191 $5,791,543 $27,575,145 $5,809,286
333 Machinery Mfg $50,533,413 $9,489,388 $50,746,706 $9,489,388 $52,948,972 $9,489,388
334 Computer & Electronic
Product Mfg $66,343,856 $10,026,770 $77,213,849 $11,224,653 $87,680,314 $11,277,170
335 Electrical Equip &
Appliance Mfg $15,755,943 $3,305,644 $17,622,585 $3,360,673 $19,328,916 $3,389,657
336 Transportation Equipment
Mfg $61,161,303 $16,816,395 $61,458,839 $16,906,236 $61,864,801 $16,910,175

88
Sector Sector Description
Lower Bound Mid-Level Upper Bound
Tax
Revenues
Grant
Expenditures Tax Revenues
Grant
Expenditures Tax Revenues
Grant
Expenditures
337 Furniture & Related Product
Mfg $16,994,881 $4,946,697 $21,165,336 $6,040,442 $24,794,234 $6,588,844
339 Miscellaneous Mfg $6,970,675 $2,260,471 $11,104,870 $2,859,413 $11,872,696 $2,885,671
423-425 Merchant Wholesalers $113,029,081 $11,202,563 $159,883,880 $13,009,467 $162,408,690 $13,327,021
441 Motor Vehicle & Parts
Dealers $14,484,111 $2,232,537 $14,599,224 $2,232,537 $14,645,584 $2,232,537
443 Electronics & Appliance
Stores $0 $0 $8,881,135 $1,269,881 $14,222,366 $1,938,750
444 Bldg Material & Gardening
Stores $2,203,095 $175,500 $8,955,154 $732,956 $10,520,905 $820,335
445 Food & Beverage Stores $3,233,450 $761,129 $4,919,372 $761,129 $6,172,950 $761,129
451 Sporting Goods, Book &
Music Stores $0 $0 $961,357 $259,467 $1,182,033 $303,825
452 General Merchandise Stores $10,074,244 $1,519,225 $10,074,244 $1,519,225 $10,074,244 $1,519,225
453 Miscellaneous Store
Retailers $2,263,182 $1,083,078 $2,263,182 $1,083,078 $2,263,182 $1,083,078
454 Nonstore Retailers $5,918,303 $249,344 $5,918,303 $249,344 $5,918,303 $249,344
481 Air Transportation $343,845 $0 $343,845 $0 $343,845 $0
483 Water Transportation $16,231,953 $401,179 $25,353,947 $504,966 $28,821,092 $522,709
488 Support for Transportation $2,437,807 $181,912 $3,252,417 $181,912 $3,621,210 $181,912
493 Warehousing & Storage $2,010,566 $301,567 $2,261,297 $301,567 $2,671,936 $301,567
511 Publishing Industries $4,071,868 $444,059 $4,071,868 $444,059 $4,071,868 $444,059
512 Motion Picture & Sound
Recording $2,187,297 $557,753 $2,187,297 $557,753 $2,187,297 $557,753
515 Broadcasting (except
Internet) $24,950,156 $1,970,328 $24,950,156 $1,970,328 $24,950,156 $1,970,328
517 Telecommunications $137,290,023 $2,966,269 $182,467,568 $4,288,510 $201,117,822 $4,514,561
518 Internet Services & Data
Processing $20,904,513 $2,050,000 $20,904,513 $2,050,000 $20,904,513 $2,050,000
522 Credit Intermediation &
Related $1,467,276 $30,093 $44,062,754 $30,093 $48,606,228 $30,093
523 Securities & Investments $5,208,919 $827,775 $5,541,892 $1,067,352 $7,202,188 $1,077,855
524 Insurance Carriers &
Related $15,641,444 $1,757,846 $15,641,444 $1,757,846 $15,641,444 $1,757,846

89
Sector Sector Description
Lower Bound Mid-Level Upper Bound
Tax
Revenues
Grant
Expenditures Tax Revenues
Grant
Expenditures Tax Revenues
Grant
Expenditures
531 Real Estate $0 $0 $1,151,800 $0 $1,444,864 $0
532 Rental & Leasing Services $1,001,159 $54,896 $1,001,159 $54,896 $1,001,159 $54,896
541 Professional, Scientific &
Technical $126,611,329 $33,326,033 $200,899,197 $35,324,386 $254,995,487 $36,018,613
551 Management of Companies $31,949,294 $8,444,517 $160,419,993 $13,289,461 $178,847,763 $13,639,977
561 Administrative & Support
Services $20,949,033 $3,578,847 $37,372,807 $6,296,362 $44,932,496 $6,875,427
562 Waste Management &
Remediation $0 $0 $2,187,075 $402,091 $2,718,225 $478,680
621 Ambulatory Health Care
Services $4,971,309 $1,036,300 $4,971,309 $1,036,300 $4,971,309 $1,036,300
623 Nursing & Residential Care $0 $0 $656,046 $0 $814,123 $0
711 Performing Arts, Spectator
Sports $2,060,057 $548,874 $2,299,026 $585,123 $2,367,692 $605,869
721 Accommodation $3,435,640 $239,340 $3,435,640 $239,340 $3,435,640 $239,340
811 Repair & Maintenance $204,876 $28,685 $1,349,461 $28,685 $1,516,088 $28,685
813 Religious, Civic &
Professional Organizations $737,294 $631,578 $737,294 $631,578 $737,294 $631,578
TOTAL $460,517,650 $205,468,415 $1,081,083,807 $230,453,723 $1,110,450,889 $236,129,878
Source: Office of the Governor, VDBA, SCT, IMPLAN, and authors’ calculations.

90
APPENDIX 5: TOTAL EFFECT ON EMPLOYMENT AND OUTPUT BY SECTOR
Sector
Lower-Bound Mid-Level Upper-Bound
Impact Type Employment Output Impact Type Employment Output Impact Type Employment Output
112 Direct Effect 0.0 $0.00 Direct Effect 58.0 $4,404,056.00 Direct Effect 88.0 $6,470,441.00
112 Indirect Effect 0.0 $0.00 Indirect Effect 20.7 $2,871,563.00 Indirect Effect 30.4 $4,218,901.70
112 Induced Effect 0.0 $0.00 Induced Effect 6.3 $726,239.00 Induced Effect 9.2 $1,066,991.60
112 Total Effect 0.0 $0.00 Total Effect 84.9 $8,001,858.00 Total Effect 127.6 $11,756,334.30
221 Direct Effect 2.0 $1,651,088.00 Direct Effect 23.0 $18,374,170.50 Direct Effect 27.0 $22,289,694.60
221 Indirect Effect 2.3 $373,635.00 Indirect Effect 25.2 $4,158,006.30 Indirect Effect 30.6 $5,044,074.80
221 Induced Effect 2.9 $333,276.00 Induced Effect 32.1 $3,708,872.80 Induced Effect 39.4 $4,550,892.30
221 Total Effect 7.2 $2,358,000.00 Total Effect 80.3 $26,241,049.50 Total Effect 97.0 $31,884,661.60
236 Direct Effect 36.0 $6,574,839.00 Direct Effect 36.0 $5,795,631.00 Direct Effect 36.0 $6,574,839.00
236 Indirect Effect 20.3 $2,387,559.35 Indirect Effect 20.3 $2,266,339.60 Indirect Effect 23.0 $2,571,043.20
236 Induced Effect 16.0 $2,014,049.32 Induced Effect 16.0 $1,914,507.60 Induced Effect 17.3 $2,067,128.70
236 Total Effect 72.3 $10,976,447.68 Total Effect 72.3 $9,976,478.20 Total Effect 76.3 $11,213,010.90
311 Direct Effect 2,304.0 $958,229,149.00 Direct Effect 2,378.0 $995,766,301.90 Direct Effect 2,417.0 $1,005,225,630.20
311 Indirect Effect 4,812.2 $707,901,585.00 Indirect Effect 5,000.7 $735,632,540.70 Indirect Effect 5,048.2 $742,620,716.30
311 Induced Effect 1,945.5 $225,424,120.00 Induced Effect 1,978.2 $229,210,224.00 Induced Effect 2,040.9 $236,480,077.70
311 Total Effect 9,061.7 $1,891,554,854.00 Total Effect 9,356.9 $1,960,609,066.70 Total Effect 9,506.1 $1,984,326,424.10
312 Direct Effect 1,118.0 $464,974,030.00 Direct Effect 1,415.0 $1,847,099,564.70 Direct Effect 1,471.0 $2,297,406,007.60
312 Indirect Effect 2,335.1 $343,504,321.00 Indirect Effect 3,134.5 $676,328,777.30 Indirect Effect 3,898.7 $841,211,716.90
312 Induced Effect 944.0 $109,385,487.00 Induced Effect 2,044.4 $236,924,066.40 Induced Effect 2,414.6 $279,823,411.30
312 Total Effect 4,397.1 $917,863,837.00 Total Effect 6,593.9 $2,760,352,408.40 Total Effect 7,784.3 $3,418,441,135.90
313 Direct Effect 1,440.0 $313,278,694.00 Direct Effect 1,574.0 $338,449,894.40 Direct Effect 1,594.0 $346,782,086.50
313 Indirect Effect 444.9 $91,243,565.00 Indirect Effect 480.6 $98,574,769.50 Indirect Effect 492.4 $101,001,550.90
313 Induced Effect 610.0 $70,713,918.00 Induced Effect 642.3 $74,466,996.60 Induced Effect 675.2 $78,276,373.20
313 Total Effect 2,494.8 $475,236,177.00 Total Effect 2,696.9 $511,491,660.40 Total Effect 2,761.6 $526,060,010.70
314 Direct Effect 154.0 $17,754,224.00 Direct Effect 154.0 $17,475,778.10 Direct Effect 154.0 $17,754,224.10
314 Indirect Effect 46.5 $6,426,314.00 Indirect Effect 45.7 $6,325,527.50 Indirect Effect 46.5 $6,426,313.70
314 Induced Effect 46.0 $5,329,774.00 Induced Effect 44.4 $5,143,259.90 Induced Effect 45.1 $5,225,208.70
314 Total Effect 246.5 $29,510,312.00 Total Effect 244.2 $28,944,565.50 Total Effect 245.6 $29,405,746.60

91
Sector
Lower Bound Mid Level Upper Bound
Impact Type Employment Output Impact Type Employment Output Impact Type Employment Output
315 Direct Effect 373.0 $50,513,160.00 Direct Effect 373.0 $49,844,508.00 Direct Effect 373.0 $50,513,160.00
315 Indirect Effect 94.7 $14,810,685.00 Indirect Effect 93.4 $14,614,633.20 Indirect Effect 94.7 $14,810,684.90
315 Induced Effect 102.4 $12,259,517.00 Induced Effect 98.6 $11,798,557.10 Induced Effect 99.9 $11,956,831.80
315 Total Effect 570.1 $77,583,362.00 Total Effect 565.0 $76,257,698.20 Total Effect 567.6 $77,280,676.80
316 Direct Effect 0.0 $0.00 Direct Effect 325.0 $36,377,044.00 Direct Effect 375.0 $41,973,512.00
316 Indirect Effect 0.0 $0.00 Indirect Effect 94.3 $17,310,574.90 Indirect Effect 108.8 $19,973,740.10
316 Induced Effect 0.0 $0.00 Induced Effect 85.7 $9,928,353.20 Induced Effect 100.1 $11,590,780.50
316 Total Effect 0.0 $0.00 Total Effect 505.0 $63,615,972.20 Total Effect 583.9 $73,538,032.60
321 Direct Effect 1,494.0 $287,380,289.00 Direct Effect 1,987.0 $350,689,761.60 Direct Effect 2,086.0 $401,255,169.80
321 Indirect Effect 1,095.8 $160,389,917.00 Indirect Effect 1,337.2 $195,723,589.80 Indirect Effect 1,530.0 $223,944,668.10
321 Induced Effect 837.5 $96,948,362.00 Induced Effect 1,043.1 $120,752,373.50 Induced Effect 1,169.3 $135,364,299.90
321 Total Effect 3,427.2 $544,718,569.00 Total Effect 4,367.2 $667,165,724.90 Total Effect 4,785.3 $760,564,137.80
322 Direct Effect 329.0 $186,365,726.00 Direct Effect 680.0 $370,298,587.30 Direct Effect 784.0 $444,105,562.30
322 Indirect Effect 409.7 $69,792,777.00 Indirect Effect 814.0 $138,674,462.30 Indirect Effect 976.2 $166,314,704.30
322 Induced Effect 374.8 $43,403,316.00 Induced Effect 740.8 $85,796,043.60 Induced Effect 893.0 $103,429,179.40
322 Total Effect 1,113.4 $299,561,819.00 Total Effect 2,234.7 $594,769,093.20 Total Effect 2,653.2 $713,849,446.10
323 Direct Effect 175.0 $28,010,866.00 Direct Effect 314.0 $46,770,700.00 Direct Effect 364.0 $58,262,604.00
323 Indirect Effect 55.6 $8,480,630.00 Indirect Effect 92.8 $14,160,397.30 Indirect Effect 115.6 $17,639,710.80
323 Induced Effect 83.8 $9,707,640.00 Induced Effect 142.2 $16,481,148.30 Induced Effect 174.2 $20,191,893.00
323 Total Effect 314.3 $46,199,136.00 Total Effect 549.0 $77,412,245.60 Total Effect 653.8 $96,094,207.70
325 Direct Effect 1,408.0 $1,133,428,510.00 Direct Effect 1,620.0 $1,256,369,697.20 Direct Effect 1,669.0 $1,343,531,171.50
325 Indirect Effect 2,691.6 $529,044,320.00 Indirect Effect 2,983.6 $586,428,915.90 Indirect Effect 3,190.6 $627,112,807.80
325 Induced Effect 2,313.8 $268,029,482.00 Induced Effect 2,551.9 $295,614,851.60 Induced Effect 2,742.7 $317,713,875.40
325 Total Effect 6,413.4 $1,930,502,312.00 Total Effect 7,155.5 $2,138,413,464.70 Total Effect 7,602.3 $2,288,357,854.60
326 Direct Effect 2,485.0 $771,701,954.00 Direct Effect 2,716.0 $838,118,914.30 Direct Effect 2,790.0 $866,417,986.40
326 Indirect Effect 1,149.1 $251,479,059.00 Indirect Effect 1,248.0 $273,122,744.90 Indirect Effect 1,290.2 $282,344,730.10
326 Induced Effect 1,624.8 $188,358,026.00 Induced Effect 1,713.9 $198,687,060.40 Induced Effect 1,824.2 $211,476,439.20
326 Total Effect 5,258.9 $1,211,539,039.00 Total Effect 5,677.9 $1,309,928,719.50 Total Effect 5,904.4 $1,360,239,155.60
327 Direct Effect 551.0 $147,308,543.00 Direct Effect 608.0 $151,544,142.90 Direct Effect 630.0 $29,494,144.00
327 Indirect Effect 351.0 $57,420,344.00 Indirect Effect 361.1 $59,071,366.10 Indirect Effect 60.1 $8,221,075.80
327 Induced Effect 372.9 $43,199,805.00 Induced Effect 388.4 $44,995,981.20 Induced Effect 42.0 $4,867,761.80
327 Total Effect 1,274.9 $247,928,693.00 Total Effect 1,357.5 $255,611,490.20 Total Effect 732.1 $42,582,981.60

92
Sector
Lower Bound Mid-Level Upper Bound
Impact Type Employment Output Impact Type Employment Output Impact Type Employment Output
331 Direct Effect 110.0 $63,810,740.00 Direct Effect 136.0 $81,960,912.60 Direct Effect 150.0 $87,014,640.70
331 Indirect Effect 139.4 $22,110,436.00 Indirect Effect 179.1 $28,399,474.30 Indirect Effect 190.1 $30,150,592.20
331 Induced Effect 118.5 $13,735,624.00 Induced Effect 146.6 $16,984,097.00 Induced Effect 161.6 $18,730,395.10
331 Total Effect 367.9 $99,656,800.00 Total Effect 461.6 $127,344,484.00 Total Effect 501.7 $135,895,628.00
332 Direct Effect 1,985.0 $528,290,914.00 Direct Effect 2,199.0 $578,426,242.50 Direct Effect 2,235.0 $594,826,306.60
332 Indirect Effect 790.5 $126,794,945.00 Indirect Effect 865.5 $138,827,909.90 Indirect Effect 890.1 $142,764,084.40
332 Induced Effect 1,215.2 $140,863,120.00 Induced Effect 1,294.8 $150,081,036.10 Induced Effect 1,368.3 $158,604,071.00
332 Total Effect 3,990.7 $795,948,979.00 Total Effect 4,359.3 $867,335,188.40 Total Effect 4,493.3 $896,194,461.90
333 Direct Effect 3,138.0 $1,045,324,837.00 Direct Effect 3,282.0 $1,060,229,476.70 Direct Effect 3,288.0 $1,095,292,643.80
333 Indirect Effect 1,931.6 $356,760,196.00 Indirect Effect 1,959.2 $361,847,018.90 Indirect Effect 2,023.9 $373,813,770.20
333 Induced Effect 2,384.8 $276,410,207.00 Induced Effect 2,390.0 $277,016,437.40 Induced Effect 2,498.8 $289,622,952.90
333 Total Effect 7,454.4 $1,678,495,240.00 Total Effect 7,631.2 $1,699,092,933.00 Total Effect 7,810.7 $1,758,729,366.90
334 Direct Effect 2,643.0 $1,156,734,048.00 Direct Effect 3,429.0 $1,716,368,208.00 Direct Effect 3,493.0 $1,528,744,533.30
334 Indirect Effect 1,963.6 $397,750,348.00 Indirect Effect 2,913.7 $590,184,108.60 Indirect Effect 2,595.2 $525,668,516.40
334 Induced Effect 3,062.6 $354,602,125.00 Induced Effect 4,028.5 $466,443,259.90 Induced Effect 4,047.5 $468,643,644.30
334 Total Effect 7,669.2 $1,909,086,521.00 Total Effect 10,371.1 $2,772,995,576.50 Total Effect 10,135.7 $2,523,056,694.00
335 Direct Effect 904.0 $335,943,454.00 Direct Effect 1,041.0 $385,355,998.10 Direct Effect 1,109.0 $412,125,310.00
335 Indirect Effect 510.8 $101,659,167.00 Indirect Effect 585.9 $116,611,796.80 Indirect Effect 626.6 $124,712,404.00
335 Induced Effect 684.6 $79,384,657.00 Induced Effect 762.6 $88,427,353.80 Induced Effect 839.9 $97,386,705.70
335 Total Effect 2,099.4 $516,987,278.00 Total Effect 2,389.6 $590,395,148.60 Total Effect 2,575.5 $634,224,419.60
336 Direct Effect 4,347.0 $1,438,883,108.00 Direct Effect 4,395.0 $1,397,669,539.40 Direct Effect 4,397.0 $1,455,433,636.90
336 Indirect Effect 1,681.8 $322,192,127.00 Indirect Effect 1,633.6 $312,963,658.60 Indirect Effect 1,701.1 $325,898,091.80
336 Induced Effect 3,119.4 $361,684,132.00 Induced Effect 3,008.9 $348,869,975.50 Induced Effect 3,155.3 $365,844,347.70
336 Total Effect 9,148.2 $2,122,759,368.00 Total Effect 9,037.5 $2,059,503,173.60 Total Effect 9,253.4 $2,147,176,076.40
337 Direct Effect 1,765.0 $288,345,595.00 Direct Effect 2,317.0 $357,803,257.30 Direct Effect 2,575.0 $420,674,200.20
337 Indirect Effect 787.1 $126,844,761.00 Indirect Effect 976.7 $157,399,556.00 Indirect Effect 1,148.4 $185,056,818.20
337 Induced Effect 852.5 $98,800,120.00 Induced Effect 1,062.6 $123,154,360.20 Induced Effect 1,243.7 $144,141,829.50
337 Total Effect 3,404.6 $513,990,476.00 Total Effect 4,356.3 $638,357,173.50 Total Effect 4,967.1 $749,872,847.90

93
Sector
Lower Bound Mid Level Upper Bound
Impact Type Employment Output Impact Type Employment Output Impact Type Employment Output
339 Direct Effect 711.0 $121,763,435.00 Direct Effect 1,183.0 $195,902,452.70 Direct Effect 1,211.0 $207,391,733.00
339 Indirect Effect 226.4 $38,754,689.00 Indirect Effect 364.3 $62,351,547.80 Indirect Effect 385.7 $66,008,339.20
339 Induced Effect 350.7 $40,632,463.00 Induced Effect 557.8 $64,627,275.80 Induced Effect 597.4 $69,206,629.50
339 Total Effect 1,288.2 $201,150,587.00 Total Effect 2,105.2 $322,881,276.30 Total Effect 2,194.1 $342,606,701.70
423-
425 Direct Effect 3,179.0 $616,563,200.00 Direct Effect 4,674.0 $951,040,576.00 Direct Effect 4,674.0 $906,516,608.00
423-
425 Indirect Effect 1,192.8 $162,347,300.00 Indirect Effect 1,839.9 $250,418,562.20 Indirect Effect 1,753.7 $238,694,953.00
423-
425 Induced Effect 1,949.1 $233,368,009.00 Induced Effect 2,783.9 $333,323,541.50 Induced Effect 2,653.6 $317,718,648.20
423-
425 Total Effect 6,320.8 $1,012,278,510.00 Total Effect 9,297.8 $1,534,782,679.70 Total Effect 9,081.3 $1,462,930,209.20
441 Direct Effect 897.0 $68,413,472.00 Direct Effect 903.0 $67,180,216.00 Direct Effect 907.0 $69,176,168.00
441 Indirect Effect 63.3 $9,301,987.00 Indirect Effect 62.2 $9,134,304.50 Indirect Effect 64.0 $9,405,688.50
441 Induced Effect 358.2 $41,454,566.00 Induced Effect 343.8 $39,786,465.90 Induced Effect 362.2 $41,916,714.90
441 Total Effect 1,318.5 $119,170,025.00 Total Effect 1,308.9 $116,100,986.40 Total Effect 1,333.2 $120,498,571.40
443 Direct Effect 0.0 $0.00 Direct Effect 786.0 $52,473,560.00 Direct Effect 1,200.0 $82,128,672.00
443 Indirect Effect 0.0 $0.00 Indirect Effect 50.9 $7,470,611.30 Indirect Effect 79.7 $11,692,581.70
443 Induced Effect 0.0 $0.00 Induced Effect 260.1 $30,152,572.60 Induced Effect 416.5 $48,279,181.20
443 Total Effect 0.0 $0.00 Total Effect 1,097.0 $90,096,743.90 Total Effect 1,696.2 $142,100,434.90
444 Direct Effect 147.0 $10,291,281.00 Direct Effect 627.0 $42,817,776.00 Direct Effect 702.0 $49,146,120.00
444 Indirect Effect 9.4 $1,371,811.00 Indirect Effect 38.9 $5,707,540.20 Indirect Effect 44.7 $6,551,098.20
444 Induced Effect 42.1 $4,883,837.00 Induced Effect 171.4 $19,868,001.80 Induced Effect 201.2 $23,322,814.70
444 Total Effect 198.5 $16,546,929.00 Total Effect 837.3 $68,393,318.00 Total Effect 947.9 $79,020,032.90
445 Direct Effect 275.0 $15,357,523.00 Direct Effect 439.0 $23,914,288.00 Direct Effect 525.0 $29,318,908.00
445 Indirect Effect 14.4 $2,098,037.00 Indirect Effect 22.4 $3,267,002.10 Indirect Effect 27.4 $4,005,343.30
445 Induced Effect 61.1 $7,083,325.00 Induced Effect 93.1 $10,785,975.80 Induced Effect 116.7 $13,522,710.70
445 Total Effect 350.5 $24,538,885.00 Total Effect 554.5 $37,967,265.90 Total Effect 669.1 $46,846,962.10
451 Direct Effect 0.0 $0.00 Direct Effect 128.0 $4,761,028.50 Direct Effect 150.0 $5,719,758.50
451 Indirect Effect 0.0 $0.00 Indirect Effect 4.6 $663,812.60 Indirect Effect 5.6 $797,484.80
451 Induced Effect 0.0 $0.00 Induced Effect 18.4 $2,130,060.40 Induced Effect 22.6 $2,616,704.60
451 Total Effect 0.0 $0.00 Total Effect 151.0 $7,554,901.50 Total Effect 178.2 $9,133,947.90

94
Sector
Lower Bound Mid Level Upper Bound
Impact Type Employment Output Impact Type Employment Output Impact Type Employment Output
452 Direct Effect 902.0 $47,633,880.00 Direct Effect 902.0 $46,464,404.00 Direct Effect 902.0 $47,633,880.00
452 Indirect Effect 43.7 $6,327,605.00 Indirect Effect 42.7 $6,172,253.90 Indirect Effect 43.7 $6,327,605.10
452 Induced Effect 189.1 $21,932,364.00 Induced Effect 180.4 $20,919,611.40 Induced Effect 184.9 $21,446,143.40
452 Total Effect 1,134.9 $75,893,849.00 Total Effect 1,125.1 $73,556,269.30 Total Effect 1,130.7 $75,407,628.50
453 Direct Effect 367.0 $11,626,109.00 Direct Effect 367.0 $11,340,673.00 Direct Effect 367.0 $11,626,109.00
453 Indirect Effect 12.1 $1,728,885.00 Indirect Effect 11.8 $1,686,438.70 Indirect Effect 12.1 $1,728,885.10
453 Induced Effect 49.5 $5,724,587.00 Induced Effect 47.2 $5,460,775.20 Induced Effect 48.4 $5,598,218.70
453 Total Effect 428.6 $19,079,581.00 Total Effect 426.0 $18,487,886.90 Total Effect 427.5 $18,953,212.80
454 Direct Effect 513.0 $27,537,000.00 Direct Effect 513.0 $26,860,930.00 Direct Effect 513.0 $27,537,000.00
454 Indirect Effect 27.0 $3,921,428.00 Indirect Effect 26.3 $3,825,152.20 Indirect Effect 27.0 $3,921,428.50
454 Induced Effect 65.3 $7,551,186.00 Induced Effect 62.4 $7,214,314.50 Induced Effect 64.0 $7,395,893.50
454 Total Effect 605.3 $39,009,615.00 Total Effect 601.7 $37,900,396.60 Total Effect 604.0 $38,854,322.00
481 Direct Effect 15.0 $4,281,126.00 Direct Effect 15.0 $3,737,980.30 Direct Effect 15.0 $4,281,126.00
481 Indirect Effect 8.9 $1,224,461.00 Indirect Effect 7.7 $1,069,113.80 Indirect Effect 8.9 $1,224,460.90
481 Induced Effect 10.8 $1,255,747.00 Induced Effect 10.0 $1,164,429.10 Induced Effect 11.5 $1,333,626.10
481 Total Effect 34.7 $6,761,334.00 Total Effect 32.8 $5,971,523.20 Total Effect 35.4 $6,839,213.00
483 Direct Effect 303.0 $204,512,960.00 Direct Effect 504.0 $311,927,808.00 Direct Effect 538.0 $363,128,608.00
483 Indirect Effect 620.4 $76,271,109.00 Indirect Effect 946.3 $116,330,426.40 Indirect Effect 1,101.6 $135,425,264.20
483 Induced Effect 579.0 $67,125,375.00 Induced Effect 901.8 $104,547,215.30 Induced Effect 1,028.1 $119,186,305.90
483 Total Effect 1,502.5 $347,909,444.00 Total Effect 2,352.1 $532,805,449.70 Total Effect 2,667.7 $617,740,178.10
488 Direct Effect 206.0 $19,141,302.00 Direct Effect 290.0 $24,713,354.00 Direct Effect 306.0 $28,433,196.00
488 Indirect Effect 39.9 $4,411,235.00 Indirect Effect 51.5 $5,695,349.40 Indirect Effect 59.3 $6,552,610.60
488 Induced Effect 85.3 $10,204,640.00 Induced Effect 113.7 $13,605,175.50 Induced Effect 126.7 $15,158,349.10
488 Total Effect 331.2 $33,757,177.00 Total Effect 455.2 $44,013,878.90 Total Effect 492.0 $50,144,155.70
493 Direct Effect 304.0 $28,654,656.00 Direct Effect 373.0 $29,889,502.00 Direct Effect 404.0 $38,080,528.00
493 Indirect Effect 71.2 $9,139,180.00 Indirect Effect 74.2 $9,533,024.40 Indirect Effect 94.6 $12,145,488.50
493 Induced Effect 118.0 $13,682,569.00 Induced Effect 134.8 $15,632,135.80 Induced Effect 156.8 $18,183,413.10
493 Total Effect 493.2 $51,476,405.00 Total Effect 582.0 $55,054,662.20 Total Effect 655.4 $68,409,429.70
511 Direct Effect 222.0 $63,300,410.00 Direct Effect 222.0 $65,508,078.50 Direct Effect 222.0 $63,300,410.40
511 Indirect Effect 180.8 $23,231,127.00 Indirect Effect 187.1 $24,041,336.70 Indirect Effect 180.8 $23,231,126.80
511 Induced Effect 199.0 $23,041,592.00 Induced Effect 195.2 $22,601,595.40 Induced Effect 188.7 $21,839,905.80
511 Total Effect 601.9 $109,573,129.00 Total Effect 604.4 $112,151,010.60 Total Effect 591.5 $108,371,443.10

95
Sector
Lower Bound Mid Level Upper Bound
Impact Type Employment Output Impact Type Employment Output Impact Type Employment Output
512 Direct Effect 298.0 $36,438,640.00 Direct Effect 298.0 $31,944,800.00 Direct Effect 298.0 $36,438,640.00
512 Indirect Effect 83.3 $10,303,711.00 Indirect Effect 73.0 $9,032,993.10 Indirect Effect 83.3 $10,303,710.90
512 Induced Effect 89.4 $10,354,510.00 Induced Effect 82.9 $9,610,680.30 Induced Effect 94.6 $10,962,664.40
512 Total Effect 470.7 $57,096,861.00 Total Effect 454.0 $50,588,473.50 Total Effect 475.9 $57,705,015.30
515 Direct Effect 1,447.0 $384,794,080.00 Direct Effect 1,447.0 $335,049,568.00 Direct Effect 1,447.0 $384,794,080.00
515 Indirect Effect 1,392.6 $136,310,583.00 Indirect Effect 1,212.6 $118,688,941.10 Indirect Effect 1,392.6 $136,310,582.90
515 Induced Effect 1,508.2 $173,656,217.00 Induced Effect 1,405.1 $161,770,446.70 Induced Effect 1,613.7 $185,788,361.30
515 Total Effect 4,347.8 $694,760,880.00 Total Effect 4,064.7 $615,508,955.80 Total Effect 4,453.3 $706,893,024.20
517 Direct Effect 2,166.0 $1,257,055,232.00 Direct Effect 3,003.0 $1,714,575,104.00 Direct Effect 3,173.0 $1,841,475,456.00
517 Indirect Effect 2,337.1 $399,607,455.00 Indirect Effect 3,187.7 $545,049,236.00 Indirect Effect 3,423.6 $585,389,807.70
517 Induced Effect 2,585.4 $299,636,843.00 Induced Effect 3,455.8 $400,508,937.20 Induced Effect 3,787.4 $438,941,645.90
517 Total Effect 7,088.5 $1,956,299,530.00 Total Effect 9,646.5 $2,660,133,277.20 Total Effect 10,384.0 $2,865,806,909.50
518 Direct Effect 971.0 $336,050,816.00 Direct Effect 971.0 $304,038,624.00 Direct Effect 971.0 $336,050,816.00
518 Indirect Effect 638.3 $99,785,075.00 Indirect Effect 577.5 $90,279,551.70 Indirect Effect 638.3 $99,785,075.40
518 Induced Effect 878.7 $101,829,180.00 Induced Effect 824.4 $95,543,626.30 Induced Effect 911.2 $105,603,403.80
518 Total Effect 2,488.0 $537,665,072.00 Total Effect 2,372.9 $489,861,802.00 Total Effect 2,520.6 $541,439,295.20
522 Direct Effect 33.0 $20,438,552.00 Direct Effect 991.0 $572,705,408.00 Direct Effect 1,033.0 $639,788,544.00
522 Indirect Effect 53.1 $8,250,231.00 Indirect Effect 1,486.9 $231,178,397.70 Indirect Effect 1,661.0 $258,257,191.90
522 Induced Effect 51.7 $5,972,482.00 Induced Effect 1,464.7 $169,329,139.50 Induced Effect 1,617.2 $186,956,775.40
522 Total Effect 137.7 $34,661,265.00 Total Effect 3,942.6 $973,212,945.20 Total Effect 4,311.3 $1,085,002,511.20
523 Direct Effect 849.0 $52,858,520.00 Direct Effect 1,213.0 $101,416,968.00 Direct Effect 1,229.0 $76,517,216.00
523 Indirect Effect 114.4 $16,896,569.00 Indirect Effect 219.6 $32,418,591.50 Indirect Effect 165.7 $24,459,224.30
523 Induced Effect 290.2 $33,617,962.00 Induced Effect 420.7 $48,740,878.10 Induced Effect 420.0 $48,664,867.20
523 Total Effect 1,253.6 $103,373,051.00 Total Effect 1,853.3 $182,576,437.60 Total Effect 1,814.7 $149,641,307.50
524 Direct Effect 757.0 $185,307,899.00 Direct Effect 757.0 $165,693,547.60 Direct Effect 757.0 $185,307,899.10
524 Indirect Effect 284.0 $47,484,386.00 Indirect Effect 253.9 $42,458,289.40 Indirect Effect 284.0 $47,484,386.30
524 Induced Effect 487.8 $56,463,215.00 Induced Effect 457.4 $52,948,199.80 Induced Effect 511.6 $59,216,063.70
524 Total Effect 1,528.8 $289,255,501.00 Total Effect 1,468.4 $261,100,036.90 Total Effect 1,552.6 $292,008,349.10
531 Direct Effect 0.0 $0.00 Direct Effect 25.0 $8,456,165.80 Direct Effect 30.0 $10,290,951.80
531 Indirect Effect 0.0 $0.00 Indirect Effect 13.1 $2,249,178.10 Indirect Effect 16.0 $2,737,196.10
531 Induced Effect 0.0 $0.00 Induced Effect 7.4 $859,097.30 Induced Effect 9.2 $1,059,222.70
531 Total Effect 0.0 $0.00 Total Effect 45.6 $11,564,441.30 Total Effect 55.1 $14,087,370.60
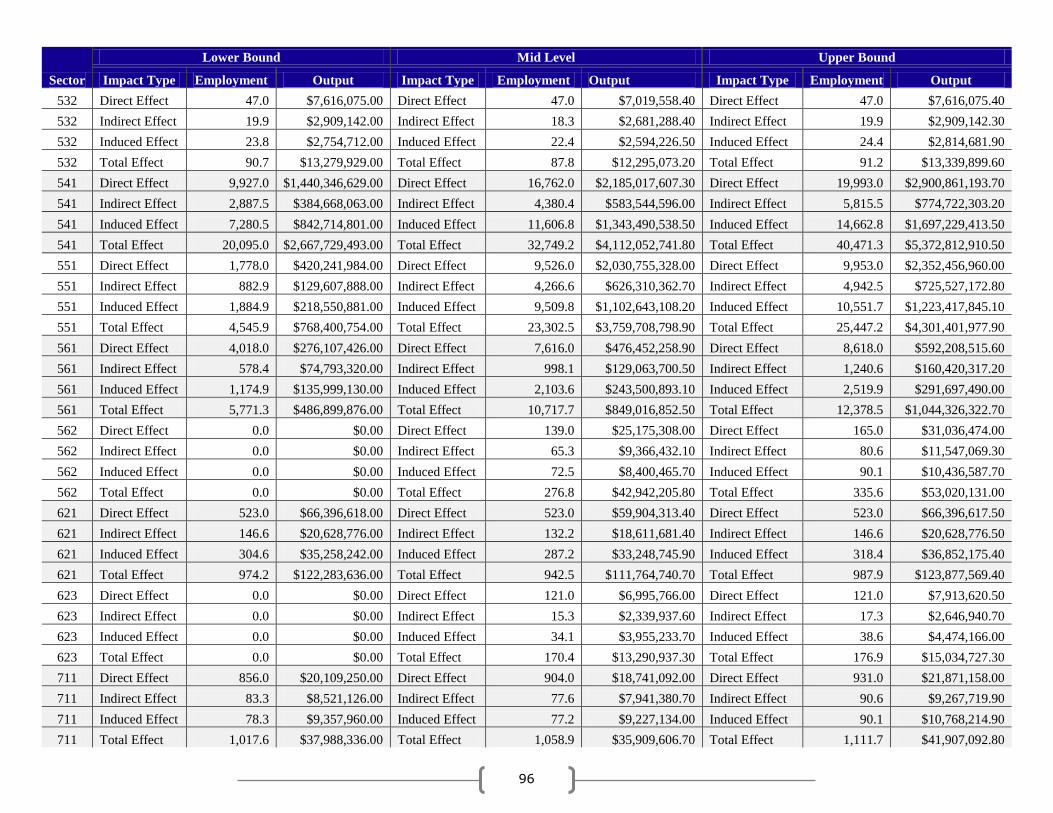
96
Sector
Lower Bound Mid Level Upper Bound
Impact Type Employment Output Impact Type Employment Output Impact Type Employment Output
532 Direct Effect 47.0 $7,616,075.00 Direct Effect 47.0 $7,019,558.40 Direct Effect 47.0 $7,616,075.40
532 Indirect Effect 19.9 $2,909,142.00 Indirect Effect 18.3 $2,681,288.40 Indirect Effect 19.9 $2,909,142.30
532 Induced Effect 23.8 $2,754,712.00 Induced Effect 22.4 $2,594,226.50 Induced Effect 24.4 $2,814,681.90
532 Total Effect 90.7 $13,279,929.00 Total Effect 87.8 $12,295,073.20 Total Effect 91.2 $13,339,899.60
541 Direct Effect 9,927.0 $1,440,346,629.00 Direct Effect 16,762.0 $2,185,017,607.30 Direct Effect 19,993.0 $2,900,861,193.70
541 Indirect Effect 2,887.5 $384,668,063.00 Indirect Effect 4,380.4 $583,544,596.00 Indirect Effect 5,815.5 $774,722,303.20
541 Induced Effect 7,280.5 $842,714,801.00 Induced Effect 11,606.8 $1,343,490,538.50 Induced Effect 14,662.8 $1,697,229,413.50
541 Total Effect 20,095.0 $2,667,729,493.00 Total Effect 32,749.2 $4,112,052,741.80 Total Effect 40,471.3 $5,372,812,910.50
551 Direct Effect 1,778.0 $420,241,984.00 Direct Effect 9,526.0 $2,030,755,328.00 Direct Effect 9,953.0 $2,352,456,960.00
551 Indirect Effect 882.9 $129,607,888.00 Indirect Effect 4,266.6 $626,310,362.70 Indirect Effect 4,942.5 $725,527,172.80
551 Induced Effect 1,884.9 $218,550,881.00 Induced Effect 9,509.8 $1,102,643,108.20 Induced Effect 10,551.7 $1,223,417,845.10
551 Total Effect 4,545.9 $768,400,754.00 Total Effect 23,302.5 $3,759,708,798.90 Total Effect 25,447.2 $4,301,401,977.90
561 Direct Effect 4,018.0 $276,107,426.00 Direct Effect 7,616.0 $476,452,258.90 Direct Effect 8,618.0 $592,208,515.60
561 Indirect Effect 578.4 $74,793,320.00 Indirect Effect 998.1 $129,063,700.50 Indirect Effect 1,240.6 $160,420,317.20
561 Induced Effect 1,174.9 $135,999,130.00 Induced Effect 2,103.6 $243,500,893.10 Induced Effect 2,519.9 $291,697,490.00
561 Total Effect 5,771.3 $486,899,876.00 Total Effect 10,717.7 $849,016,852.50 Total Effect 12,378.5 $1,044,326,322.70
562 Direct Effect 0.0 $0.00 Direct Effect 139.0 $25,175,308.00 Direct Effect 165.0 $31,036,474.00
562 Indirect Effect 0.0 $0.00 Indirect Effect 65.3 $9,366,432.10 Indirect Effect 80.6 $11,547,069.30
562 Induced Effect 0.0 $0.00 Induced Effect 72.5 $8,400,465.70 Induced Effect 90.1 $10,436,587.70
562 Total Effect 0.0 $0.00 Total Effect 276.8 $42,942,205.80 Total Effect 335.6 $53,020,131.00
621 Direct Effect 523.0 $66,396,618.00 Direct Effect 523.0 $59,904,313.40 Direct Effect 523.0 $66,396,617.50
621 Indirect Effect 146.6 $20,628,776.00 Indirect Effect 132.2 $18,611,681.40 Indirect Effect 146.6 $20,628,776.50
621 Induced Effect 304.6 $35,258,242.00 Induced Effect 287.2 $33,248,745.90 Induced Effect 318.4 $36,852,175.40
621 Total Effect 974.2 $122,283,636.00 Total Effect 942.5 $111,764,740.70 Total Effect 987.9 $123,877,569.40
623 Direct Effect 0.0 $0.00 Direct Effect 121.0 $6,995,766.00 Direct Effect 121.0 $7,913,620.50
623 Indirect Effect 0.0 $0.00 Indirect Effect 15.3 $2,339,937.60 Indirect Effect 17.3 $2,646,940.70
623 Induced Effect 0.0 $0.00 Induced Effect 34.1 $3,955,233.70 Induced Effect 38.6 $4,474,166.00
623 Total Effect 0.0 $0.00 Total Effect 170.4 $13,290,937.30 Total Effect 176.9 $15,034,727.30
711 Direct Effect 856.0 $20,109,250.00 Direct Effect 904.0 $18,741,092.00 Direct Effect 931.0 $21,871,158.00
711 Indirect Effect 83.3 $8,521,126.00 Indirect Effect 77.6 $7,941,380.70 Indirect Effect 90.6 $9,267,719.90
711 Induced Effect 78.3 $9,357,960.00 Induced Effect 77.2 $9,227,134.00 Induced Effect 90.1 $10,768,214.90
711 Total Effect 1,017.6 $37,988,336.00 Total Effect 1,058.9 $35,909,606.70 Total Effect 1,111.7 $41,907,092.80

97
Sector
Lower Bound Mid Level Upper Bound
Impact Type Employment Output Impact Type Employment Output Impact Type Employment Output
721 Direct Effect 270.0 $28,230,082.00 Direct Effect 270.0 $25,823,576.00 Direct Effect 270.0 $28,230,082.00
721 Indirect Effect 87.0 $11,394,044.00 Indirect Effect 79.6 $10,422,745.10 Indirect Effect 87.0 $11,394,043.50
721 Induced Effect 92.4 $10,706,148.00 Induced Effect 86.7 $10,045,772.60 Induced Effect 94.8 $10,981,940.80
721 Total Effect 449.5 $50,330,273.00 Total Effect 436.3 $46,292,093.70 Total Effect 451.8 $50,606,066.40
811 Direct Effect 15.0 $1,538,842.00 Direct Effect 104.0 $10,013,110.90 Direct Effect 104.0 $10,669,301.90
811 Indirect Effect 2.5 $371,593.00 Indirect Effect 16.2 $2,417,921.60 Indirect Effect 17.2 $2,576,375.70
811 Induced Effect 6.3 $721,443.00 Induced Effect 41.2 $4,751,143.50 Induced Effect 43.9 $5,062,501.10
811 Total Effect 23.7 $2,631,877.00 Total Effect 161.4 $17,182,176.00 Total Effect 165.1 $18,308,178.60
813 Direct Effect 88.0 $7,962,951.00 Direct Effect 88.0 $7,198,076.90 Direct Effect 88.0 $7,962,951.40
813 Indirect Effect 21.4 $3,076,119.00 Indirect Effect 19.3 $2,780,645.40 Indirect Effect 21.4 $3,076,119.40
813 Induced Effect 36.9 $4,282,527.00 Induced Effect 34.8 $4,034,970.30 Induced Effect 38.5 $4,463,730.10
813 Total Effect 146.3 $15,321,598.00 Total Effect 142.1 $14,013,692.60 Total Effect 147.9 $15,502,800.90
TOTALS 69,285.9 $8,908,242,545.00
143,118.6 $18,574,266,794.70
166,746.0 $22,712,466,793.50

98
APPENDIX 6: METHODOLOGY OF USING IMPLAN
IMPLAN (Impact Analysis for Planning) software conducts economic input-output
modeling. Three major functions are served by IMPLAN: data retrieval, data reduction and
model development, and impact analysis.97
In this report, we used IMPLAN primarily to conduct
impact analysis of economic development grants awarded by the state of Virginia to both re-
locating and expanding businesses. This appendix will specifically introduce the methodology of
using IMPLAN that contributed to our analysis.
The data purchased by the Thomas Jefferson Public Policy Program is the 2009 IMPLAN
State Data Package of Virginia. This data package provides IMPLAN information for each
county and independent city within Virginia, as well as aggregated information at the state level.
Our model is built on the aggregated state-level dataset, which captures the effect of creating one
job within the state economy.
We estimate impacts by sector, using 3-digit NAICS codes. Thus, before running impacts,
we changed the aggregation settings from IMPLAN sector codes to NAICS codes. There were
59 sectors represented by the development projects examined in this report. However, only 52
sectors could be recognized by IMPLAN under 3-digit NAICS codes; as a result, 7 sectors were
aggregated under the IMPLAN sector codes. After selecting the dataset and setting up the
aggregation codes, we constructed multipliers models. These models are Social Accounting
Matrices (SAM) that are ―constructed to show the effects of a given change on the economy of
interest.‖98
They are the framework for building impact analysis questions, and they ―estimate
the magnitude and distribution of economic impacts, and measure three types of effects… [that]
are direct, indirect and induced changes within the economy.‖W
After constructing a model for each sector, we set the default event year as 2008 in order
to ensure consistency among sectors, which incorporated data from development projects that
W
Specifically, ―direct effects are determined defined by the user.‖ These were the number of jobs created by each
development project, aggregated across a sector. ―The indirect effects are determined by the amount of the direct
effect spent within the study region on supplies, services, labor and taxes. Finally the induced effect measures the
money that is re-spent in the study area as a result of spending from the indirect effects.‖
(http://implan.com/V4/index.php?option=com_content&view=article&id=282:what-is-implan&catid=152:implan-
appliance-&Itemid=2).

99
had been announced in different years. With the same logic, the dollar year was also set as 2008
to account for inflation and maintain consistency throughout the report.
In addition, as introduced in the paper, we applied a bracketing system to fill missing
employment data. We created lower and upper bounds for the estimated grant expenditures and
revenues. When using IMPLAN, we constructed three separate models under each of these
scenarios (lower bound, mid-level and upper bound). The impact on employment, output, and tax
revenues for each sector was estimated three times.
Finally, for each sector under each assumption, IMPLAN provides 5 types of impact
results available for download.X
However, we only used and analyzed the estimates from
Summary Results and State/Local Tax Impact for calculations.
X Five types of results are: Summary Results of employment (which includes the number of employment, labor
income, value added and output for direct, indirect and induced effects, respectively, and the total effects of three
types of impact under each category), Top Ten Industries Affected, Industry Impact Detail Results, State/Local Tax
Impact (which provides information on revenues from various taxes) and Federal Tax Impact.

100
References
Accordino, John. ―Economic Development Incentives in Virginia: Principles and Practices,‖
Virginia Issues & Answers, Virginia Tech. Fall 2010 http://www.via.vt.edu/fall10/VIA-
fall2010-feature1.pdf (accessed November 25, 2011).
Alward, Aaron. ―What is IMPLAN?‖ Minnesota IMPLAN Group (MIG). 9 June 2009
http://implan.com/V4/index.php?option=com_content&view=article&id=282:what-is-
implan&catid=152:implan-appliance-&Itemid=2 (accessed November 25, 2011).
―Barber & Ross Headquarters Saved for Virginia.‖ Virginia Economic Development Partnership.
16 September 2003 http://www.yesvirginia.org/about_us/NewsArticle.aspx?newsid=568
(accessed December 1, 2011).
―Barber & Ross Look for Bankruptcy Options.‖ Window and Door. 1 October 2007
http://www.windowanddoor.com/news-item/companies/barber-ross-looks-bankruptcy-
options (accessed December 2, 2011).
Bartik, Timothy J. and Richard D. Bingham. ―Can Economic Development Programs Be
Evaluated?‖ Upjohn Institute for Employment Research, 1995
http://research.upjohn.org/cgi/viewcontent.cgi?article=1046&context=up_workingpapers
&sei (accessed October 23, 2011).
―Eli Lilly and Company.‖ New York Times. 1 October 2011
http://topics.nytimes.com/top/news/business/companies/lilly_eli_and_company/index.ht
ml (accessed December 3, 2011).
―Free NAICS and SIC Code Look Up.‖ NAICS Association.
http://www.naics.com/search.htm#naicsdrill (accessed October 1, 2011).
―Governor’s Development Opportunity Fund Guidelines.‖ Virginia Economic Development
Partnership. 1 July 2011
http://www.virginiaallies.org/assets/files/incentives/GOFGuidelines.pdf (accessed
October 16, 2011).
―Governor Gilmore Approves Grant for Goodyear Training Facility.‖ Virginia Economic
Development Partnership. 13 April 2000
http://www.yesvirginia.org/About_Us/NewsArticle.aspx?newsid=74 (accessed December
2, 2011).
―Governor Warner Announces 150 New Jobs for Virginia Beach.‖ Virginia Economic
Development Partnership. 16 September 2003
http://www.yesvirginia.org/About_Us/NewsArticle.aspx?newsid=766 (accessed
December 3, 2011).

101
―A Guidebook for Local Officials, 2010-2011.‖ Virginia Economic Development Partnership.
http://www.virginiaallies.org/assets/files/publications/ed_handbook.pdf (accessed
October 14, 2011).
―Guidelines for Clean Energy Manufacturing Incentive Grant.‖ Virginia Economic Development
Partnership. 1 July, 2011
http://www.virginiaallies.org/assets/files/incentives/CEMIGGuidelines.pdf (accessed
October 15, 2011).
―Guidelines for Major Eligible Employer Grant.‖ Virginia Economic Development Partnership.
1 July 2011 http://www.virginiaallies.org/assets/files/incentives/MEEGuidelines.pdf
(accessed October 15, 2011).
―Guidelines for Virginia Investment Partnership Grant.‖ Virginia Economic Development
Partnership. 1 July 2011
http://www.virginiaallies.org/assets/files/incentives/VIPGuidelines.pdf (accessed October
15, 2011).
Halstead, Lorraine. ―Frederick will receive Barber and Ross taxes; Sale of business site will pay
firm’s debt.‖ The Winchester Star. http://nl.newsbank.com/nl-
search/we/Archives?p_action=list&p_topdoc=11 (accessed December 2, 2011).
―Household Income for States: 2008 and 2009.‖ US Census Bureau. September 2010
http://www.census.gov/prod/2010pubs/acsbr09-2.pdf (accessed December 10, 2011).
Interview of David Couch, Business Development Manager of Virginia Beach.
Interview of Jeremy Stratton, Director of the City of Danville, Office of Economic Development.
November 23, 2011.
Interview of Jim Gahres, Business Development Manager, The Department of Economic
Development. November 30, 2011.
Interview of Patrick Barker, Executive Director of the Winchester-Frederick County Economic
Development Commission. November 30, 2011.
―Jobs Gap Widens in Virginia.‖ The Commonwealth Institute. 16 September 2011
http://www.thecommonwealthinstitute.org/wp-
content/uploads/2011/09/110916_release_job_gap_widens_bls_data.pdf (accessed
November 28, 2011).
Lyne, Jack. ―Lilly Picks Northern Virginia for $435M, 700-Job Insulin Plant.‖ The Site
Selection, Online Insider. 13 May 2002
http://siteselection.com/ssinsider/bbdeal/bd020513.htm (accessed December 10, 2011).

102
―Major Employers List.‖ Danville Economic Development Office.
http://discoverdanville.com/DocumentView.aspx?DID=344 (accessed December 2,
2011).
Morgan, Jonathan Q. ―Analyzing the Benefits and Costs of Economic Development Projects.‖
Community and Economic Development Bulletin, School of Government, University of
North Carolina at Chapel Hill. No. 7, April 2010
http://sogpubs.unc.edu/electronicversions/pdfs/cedb7.pdf (accessed November 25, 2011).
News Center. Virginia Economic Development Partnership.
http://www.yesvirginia.org/About_Us/News.aspx (accessed September 4, 2011).
―Prince William County Overview/Innovation Technology Park and Lilly/Covance Sites.‖
Presentation slides provided by Jim Gahres.
―Report on Business Incentives 2005–2006.‖ Secretary of Commerce and Trade. 30 October
2006
http://leg2.state.va.us/dls/h&sdocs.nsf/fc86c2b17a1cf388852570f9006f1299/d062b14ccb
1a11a3852570ae004db66f/$FILE/RD261.pdf (accessed December 7, 2011).
―Report on Business Incentives 2006–2007.‖ Secretary of Commerce and Trade. 30 October
2007 http://leg2.state.va.us/dls/h&sdocs.nsf/By+Year/RD2922007/$file/RD292.pdf
(accessed December 7, 2011).
―Report on Business Incentives 2007–2008.‖ Secretary of Commerce and Trade. 30 October
2008 http://www.yesvirginia.org/pdf/FY2008IncentivesReport.pdf (accessed December
7, 2011).
―Report on Business Incentives 2008–2009.‖ Secretary of Commerce and Trade. Oct. 30, 2009
http://www.ltgov.virginia.gov/initiatives/JCC/EconomicallyDistressedAreas/EconDisAre
a_BusinessIncentivesReport_2008-2009.pdf (accessed December 7, 2011).
―Report on Business Incentives 2009-2010.‖ Virginia Economic Development Partnership. 30
October 2010 http://www.yesvirginia.org/pdf/2010incentivesreport.pdf (accessed
October 16, 2011).
Senate Joint Resolution 329. Virginia General Assembly, Legislative Information System. 7
March 2011. http://lis.virginia.gov/cgi-bin/legp604.exe?111+ful+SJ329ER (accessed
October 19, 2011).
―Special Report: State Business Incentive Grant Programs.‖ Joint Legislative Audit and Review
Commission. November 2002 http://jlarc.virginia.gov/reports/Rpt285.pdf (accessed
September 15, 2011).

103
―The Transportation Partnership Opportunity Fund: Guidelines and Criteria.‖ Virginia
Department of Transportation. September 2005
http://www.virginiadot.org/projects/resources/tpofImplementationGuidelines10-2005.pdf
(accessed October 16, 2011).
Virginia Acts of Assembly, § 2.1-51.6:5 (Governor's Development Opportunity Fund). 1996
http://leg1.state.va.us/cgi-bin/legp504.exe?961+ful+HB306+pdf (accessed October 14,
2011).
Virginia Acts of Assembly, Chapter 815. 6 April 2011 http://leg1.state.va.us/cgi-
bin/legp504.exe?111+ful+CHAP0815 (accessed October 15, 2011).
Virginia Acts of Assembly, Chapter 875. 29 March 1999 http://leg1.state.va.us/cgi-
bin/legp504.exe?991+ful+CHAP0875+pdf (accessed October 15, 2011).
Virginia Announcements Database. Virginia Economic Development Partnership.
http://virginiascan.yesvirginia.org/ResourceCenter/AnnouncementsWeb.aspx (accessed
September 29, 2011).
―Virginia Beach Success Grows.‖ StihlUSA.com. http://www.stihlusa.com/stihl-inc.html
(accessed December 3, 2011).
Virginia Code, Chapter 51 (Virginia Investment Partnership Act) § 2.2-5102.1
http://leg1.state.va.us/cgi-bin/legp504.exe?000+cod+2.2-5102.1 (accessed October 15,
2011).
―Virginia Guide to Business Incentives, 2011–2012.‖ Virginia Economic Development
Partnership. 2011
http://www.yesvirginia.org/pdf/guides/BusinessIncentivesGuide2011.pdf (accessed
September 21, 2011).
―What is IMPLAN? Introduction.‖ Minnesota IMPLAN Group (MIG).
http://implan.com/V4/index.php?option=com_kunena&func=view&catid=82&id=52&Ite
mid=35 (accessed November 25, 2011).
―Working with Goodyear.‖ Danville Register and Bee. http://www.ialr.org/news/74-working-
with-goodyear-editorial-danville-register-and-bee (accessed December 2, 2011).
Worrell, Allen ―AmerLink now faces liquidation.‖ The Carroll News. 3 November 2009,
http://www.thecarrollnews.com/view/full_story/4257963/article-AmerLink-now-faces-
liquidation? (accessed November 25, 2011).
Worrell, Allen. ―Carroll settles with AmerLink, Pro-Form.‖ The Carroll News, 19 January 2011,
http://www.thecarrollnews.com/view/full_story/11060564/article-Carroll-settles-with-
AmerLink--Pro-Form? (accessed November 25, 2011).
104
1 ―Jobs Gap Widens in Virginia,‖ The Commonwealth Institute, 16 September 2011,
http://www.thecommonwealthinstitute.org/wp-
content/uploads/2011/09/110916_release_job_gap_widens_bls_data.pdf (accessed November 28, 2011). 2 Senate Joint Resolution 329, Virginia General Assembly, Legislative Information System, 7 March 2011,
http://lis.virginia.gov/cgi-bin/legp604.exe?111+ful+SJ329ER (accessed October 19, 2011). 3 Senate Joint Resolution 329, Virginia General Assembly.
4 Senate Joint Resolution 329, Virginia General Assembly.
5 ―Special Report: State Business Incentive Grant Programs,‖ Joint Legislative Audit and Review Commission,
November 2002, 5 http://jlarc.virginia.gov/reports/Rpt285.pdf (accessed September 15, 2011). 6 ―Special Report: State Business Incentive Grant Programs,‖ 5, 8–10.
7 ―Special Report: State Business Incentive Grant Programs,‖ 8, 11–13.
8 ―Special Report: State Business Incentive Grant Programs,‖ 16.
9 ―Special Report: State Business Incentive Grant Programs,‖ 11, 14.
10 ―Special Report: State Business Incentive Grant Programs,‖ 16.
11 ―Virginia Guide to Business Incentives, 2011–2012,‖ Virginia Economic Development Partnership, 2011, 4–5,
http://www.yesvirginia.org/pdf/guides/BusinessIncentivesGuide2011.pdf (accessed September 21, 2011). 12
―Virginia Guide to Business Incentives,‖ 6. 13
―Virginia Guide to Business Incentives,‖ 6–7. 14
―Virginia Guide to Business Incentives,‖ 9. 15
―Virginia Guide to Business Incentives,‖ 21–22. 16
―Virginia Guide to Business Incentives,‖ 23–24. 17
―A Guidebook for Local Officials, 2010-2011,‖ Virginia Economic Development Partnership, 23,
http://www.virginiaallies.org/assets/files/publications/ed_handbook.pdf (accessed October 14, 2011) and
―Governor’s Development Opportunity Fund Guidelines,‖ Virginia Economic Development Partnership, 1 July
2011, 1 and 2, http://www.virginiaallies.org/assets/files/incentives/GOFGuidelines.pdf (accessed October 16, 2011). 18
―Governor’s Development Opportunity Fund Guidelines,‖ 1. 19
Virginia Acts of Assembly, § 2.1-51.6:5 (Governor's Development Opportunity Fund), 1996, 1
http://leg1.state.va.us/cgi-bin/legp504.exe?961+ful+HB306+pdf (accessed October 14, 2011) and ―A Guidebook for
Local Officials,‖ 16. 20
Virginia Acts of Assembly § 2.1-51.6:5, 1. 21
―Governor’s Development Opportunity Fund Guidelines,‖ 1. 22
―Governor’s Development Opportunity Fund Guidelines,‖ 6. 23
―Governor’s Development Opportunity Fund Guidelines,‖ 7. 24
Virginia Acts of Assembly, Chapter 875, 29 March 1999, 2, http://leg1.state.va.us/cgi-
bin/legp504.exe?991+ful+CHAP0875+pdf (accessed October 15, 2011). 25
―Virginia Guide to Business Incentives,‖ 17. 26
―Guidelines for Virginia Investment Partnership Grant,‖ Virginia Economic Development Partnership, 1 July
2011, 1 and 7, http://www.virginiaallies.org/assets/files/incentives/VIPGuidelines.pdf (accessed October 15, 2011). 27
―Virginia Guide to Business Incentives,‖ 17. 28
―Guidelines for Virginia Investment Partnership Grant,‖ 7 and 8. 29
Virginia Acts of Assembly Chapter 875, 1 and ―Guidelines for Major Eligible Employer Grant,‖ Virginia
Economic Development Partnership, 1 July 2011, 3,
http://www.virginiaallies.org/assets/files/incentives/MEEGuidelines.pdf (accessed October 15, 2011). 30
―Guidelines for Major Eligible Employer Grant,‖ 1. 31
―Virginia Guide to Business Incentives,‖ 17. 32
―Guidelines for Major Eligible Employer Grant,‖ 6 and 7. 33
Virginia Code, Chapter 51 (Virginia Investment Partnership Act) § 2.2-5102.1, http://leg1.state.va.us/cgi-
bin/legp504.exe?000+cod+2.2-5102.1 (accessed October 15, 2011). 34
―Virginia Guide to Business Incentives,‖ 18. 35
―Virginia Guide to Business Incentives,‖ 18. 36
―Virginia Guide to Business Incentives,‖ 18. 37
―Virginia Guide to Business Incentives,‖ 18. 38
Virginia Acts of Assembly, Chapter 815, 6 April 2011, http://leg1.state.va.us/cgi-
bin/legp504.exe?111+ful+CHAP0815 (accessed October 15, 2011).

105
39
―Guidelines for Clean Energy Manufacturing Incentive Grant,‖ Virginia Economic Development Partnership, 1
July, 2011, 1, http://www.virginiaallies.org/assets/files/incentives/CEMIGGuidelines.pdf (accessed October 15,
2011). 40
―Guidelines for Clean Energy Manufacturing Incentive Grant,‖ 5. 41
―Virginia Guide to Business Incentives,‖ 10. 42
―Report on Business Incentives 2009-2010,‖ Virginia Economic Development Partnership, 30 October 2010, 24,
http://www.yesvirginia.org/pdf/2010incentivesreport.pdf (accessed October 16, 2011). 43
―Virginia Guide to Business Incentives,‖ 13. 44
―Virginia Guide to Business Incentives,‖ 13. 45
―The Transportation Partnership Opportunity Fund: Guidelines and Criteria,‖ Virginia Department of
Transportation, September 2005, 3, http://www.virginiadot.org/projects/resources/tpofImplementationGuidelines10-
2005.pdf (accessed October 16, 2011). 46
―Virginia Guide to Business Incentives,‖ 19. 47
Timothy J. Bartik and Richard D. Bingham, ―Can Economic Development Programs Be Evaluated?‖ Upjohn
Institute for Employment Research, 1995, 9,
http://research.upjohn.org/cgi/viewcontent.cgi?article=1046&context=up_workingpapers&sei (accessed October 23,
2011). 48
Press releases from the Virginia Economic Development Partnership News Center:
http://www.yesvirginia.org/About_Us/News.aspx (accessed September 4, 2011). 49
JLARC provided the NETS database. 50
―Household Income for States: 2008 and 2009,‖ US Census Bureau, September 2010, 4,
http://www.census.gov/prod/2010pubs/acsbr09-2.pdf (accessed December 10, 2011). 51
See ―Report on Business Incentives 2005–2006,‖ Secretary of Commerce and Trade, 30 October 2006, 60,
http://leg2.state.va.us/dls/h&sdocs.nsf/fc86c2b17a1cf388852570f9006f1299/d062b14ccb1a11a3852570ae004db66f/
$FILE/RD261.pdf (accessed December 7, 2011); ―Report on Business Incentives 2006–2007,‖ Secretary of
Commerce and Trade, 30 October 2007, 52,
http://leg2.state.va.us/dls/h&sdocs.nsf/By+Year/RD2922007/$file/RD292.pdf (accessed December 7, 2011);
―Report on Business Incentives 2007–2008,‖ Secretary of Commerce and Trade, 30 October 2008, 46,
http://www.yesvirginia.org/pdf/FY2008IncentivesReport.pdf (accessed December 7, 2011); Secretary of Commerce
and Trade, ―Report on Business Incentives 2008–2009,‖ Oct. 30, 2009, 39,
http://www.ltgov.virginia.gov/initiatives/JCC/EconomicallyDistressedAreas/EconDisArea_BusinessIncentivesRepor
t_2008-2009.pdf (accessed 7 Dec. 2011). 52
―Governor Gilmore Approves Grant for Goodyear Training Facility,‖ Virginia Economic Development
Partnership, 13 April 2000, http://www.yesvirginia.org/About_Us/NewsArticle.aspx?newsid=74 (accessed
December 2, 2011). 53
Information obtained through author interview of Jeremy Stratton, Director of the City of Danville, Office of
Economic Development, on November 23, 2011. 54
―Working with Goodyear,‖ Editorial, Danville Register and Bee, http://www.ialr.org/news/74-working-with-
goodyear-editorial-danville-register-and-bee (accessed December 2, 2011). 55
VDBA data. 56
―Major Employers List,‖ Danville Economic Development Office,
http://discoverdanville.com/DocumentView.aspx?DID=344 (accessed December 2, 2011). 57
―Working with Goodyear.‖ 58
―Governor Warner Announces 150 New Jobs for Virginia Beach,‖ Virginia Economic Development Partnership,
16 September 2003, http://www.yesvirginia.org/About_Us/NewsArticle.aspx?newsid=766 (accessed December 3,
2011). 59
Information obtained through author interview of David Couch, Business Development Manager of Virginia
Beach. 60
Author interview of David Couch. 61
VDBA data. 62
―Virginia Beach Success Grows,‖ StihlUSA.com, http://www.stihlusa.com/stihl-inc.html (accessed December 3,
2011). 63
Interview of David Couch. 64
―Barber & Ross Headquarters Saved for Virginia,‖ Virginia Economic Development Partnership, 16 September
2003, http://www.yesvirginia.org/about_us/NewsArticle.aspx?newsid=568 (accessed December 1, 2011).

106
65
Information obtained through author interview of Patrick Barker, Executive Director of the Winchester-Frederick
County Economic Development Commission, on November 30, 2011. 66
Author interview of Patrick Barker. VDBA data shows no employment growth as a result of this project. 67
―Barber & Ross Look for Bankruptcy Options,‖ Window and Door, 1 October 2007,
http://www.windowanddoor.com/news-item/companies/barber-ross-looks-bankruptcy-options (accessed December
2, 2011). 68
Lorraine Halstead, ―Frederick will receive Barber and Ross taxes; Sale of business site will pay firm’s debt,‖ The
Winchester Star, http://nl.newsbank.com/nl-search/we/Archives?p_action=list&p_topdoc=11 (accessed December 2,
2011). 69
Author interview of Patrick Barker. 70
―Eli Lilly and Company,‖ New York Times, 1 October 2011,
http://topics.nytimes.com/top/news/business/companies/lilly_eli_and_company/index.html (accessed December 3,
2011). 71
Jack Lyne, ―Lilly Picks Northern Virginia for $435M, 700-Job Insulin Plant,‖ The Site Selection, Online Insider,
13 May 2002 http://siteselection.com/ssinsider/bbdeal/bd020513.htm (accessed December 10, 2011). 72
―Governor Gilmore Approves Grant for Goodyear Training Facility.‖ 73
Lyne, ―Lilly Picks Northern Virginia for $435M, 700-Job Insulin Plant.‖ 74
Information obtained through author interview of Jim Gahres, Business Development Manager, The Department
of Economic Development, on November 30, 2011. 75
Author interview of Jim Gahres and ―Prince William County Overview/Innovation Technology Park and
Lilly/Covance Sites,‖ Presentation slides provided by Jim Gahres. 76
Information obtained through interview of Jim Gahres. 77
Jonathan Q. Morgan, ―Analyzing the Benefits and Costs of Economic Development Projects,‖ Community and
Economic Development Bulletin, School of Government, University of North Carolina at Chapel Hill, No. 7, April
2010, 2, http://sogpubs.unc.edu/electronicversions/pdfs/cedb7.pdf (accessed November 25, 2011). 78
Morgan, ―Analyzing the Benefits and Costs of Economic Development Projects,‖ 6. 79
Morgan, ―Analyzing the Benefits and Costs of Economic Development Projects,‖ 6. 80
Morgan, ―Analyzing the Benefits and Costs of Economic Development Projects,‖ 7. 81
Morgan, ―Analyzing the Benefits and Costs of Economic Development Projects,‖ 7. 82
Morgan, ―Analyzing the Benefits and Costs of Economic Development Projects,‖ 7. 83
Morgan, ―Analyzing the Benefits and Costs of Economic Development Projects,‖ 7. 84
See Morgan, ―Analyzing the Benefits and Costs of Economic Development Projects,‖ 8, for a more detailed
explanation of each method. 85
Morgan, ―Analyzing the Benefits and Costs of Economic Development Projects,‖ 9. 86
Comparable city analysis and employment anticipation are also techniques that can calculate marginal cost,
although both are rarely used. See Morgan, ―Analyzing the Benefits and Costs of Economic Development Projects,‖
9, for a more detailed explanation of these three methods. 87
Morgan, ―Analyzing the Benefits and Costs of Economic Development Projects,‖ 13. 88
Morgan, ―Analyzing the Benefits and Costs of Economic Development Projects,‖ 14. 89
John Accordino, ―Economic Development Incentives in Virginia: Principles and Practices,‖ Virginia Issues &
Answers, Virginia Tech, Fall 2010, 5, http://www.via.vt.edu/fall10/VIA-fall2010-feature1.pdf (accessed November
25, 2011). 90
Accordino, ―Economic Development Incentives in Virginia: Principles and Practices,‖ 5. 91
Accordino, ―Economic Development Incentives in Virginia: Principles and Practices,‖ 5. 92
Accordino, ―Economic Development Incentives in Virginia: Principles and Practices,‖ 6. 93
Allen Worrell, ―AmerLink now faces liquidation,‖ The Carroll News, 3 November 2009,
http://www.thecarrollnews.com/view/full_story/4257963/article-AmerLink-now-faces-liquidation? (accessed
November 25, 2011). 94
Allen Worrell, ―Carroll settles with AmerLink, Pro-Form,‖ The Carroll News, 19 January 2011,
http://www.thecarrollnews.com/view/full_story/11060564/article-Carroll-settles-with-AmerLink--Pro-Form?
(accessed November 25, 2011). 95
Author interviews of Patrick Barker and Jeremy Stratton. 96
Accordino, ―Economic Development Incentives in Virginia: Principles and Practices,‖ 5.

107
97
―What is IMPLAN? Introduction,‖ Minnesota IMPLAN Group (MIG)
http://implan.com/V4/index.php?option=com_kunena&func=view&catid=82&id=52&Itemid=35 (accessed
November 25, 2011). 98
Aaron Alward, ―What is IMPLAN?‖ Minnesota IMPLAN Group (MIG), 9 June 2009,
http://implan.com/V4/index.php?option=com_content&view=article&id=282:what-is-implan&catid=152:implan-
appliance-&Itemid=2 (accessed November 25, 2011).

Impact Assessment of Economic Development Grants
Nicole Gaffen
Xingchen Wang
Jared Wilkerson

EXECUTIVE SUMMARY
• Timeframe: 1999-2007
• Number of development projects: 490
• Total job projections: 131,767 jobs
• Estimated shortfall: 32,000 jobs - 73,000 jobs
• Estimated expenditures: $239 million - $276 million
• Net revenues: $222 million - $835 million

Agenda
• Job projections vs. jobs created
• State-level expenditures vs. revenues
• Cyclical and counter-cyclical trends
• Case studies
• Policy recommendations
• Conclusion
AGENDA

COMPARISON OF JOB PROJECTIONS
AND JOBS CREATED

Data
• Employment information on 388 projects:
• Department of Business Assistance (271)
• Secretary of Commerce and Trade (30)
• National Employer Time Series Database (87)
DATA

1999 2000 2001 2002 2003 2004 2005 2006 2007
Total number of jobs promised 12,751 11,969 13,241 9,624 11,609 17,651 9,019 4,637 5,016
Total number of jobs created 5,005 10,544 3,943 6,467 8,604 10,079 8,024 3,171 3,008
-
2,000
4,000
6,000
8,000
10,000
12,000
14,000
16,000
18,000
20,000
Nu
mb
er
of
Job
s Figure 1: Jobs Comparison
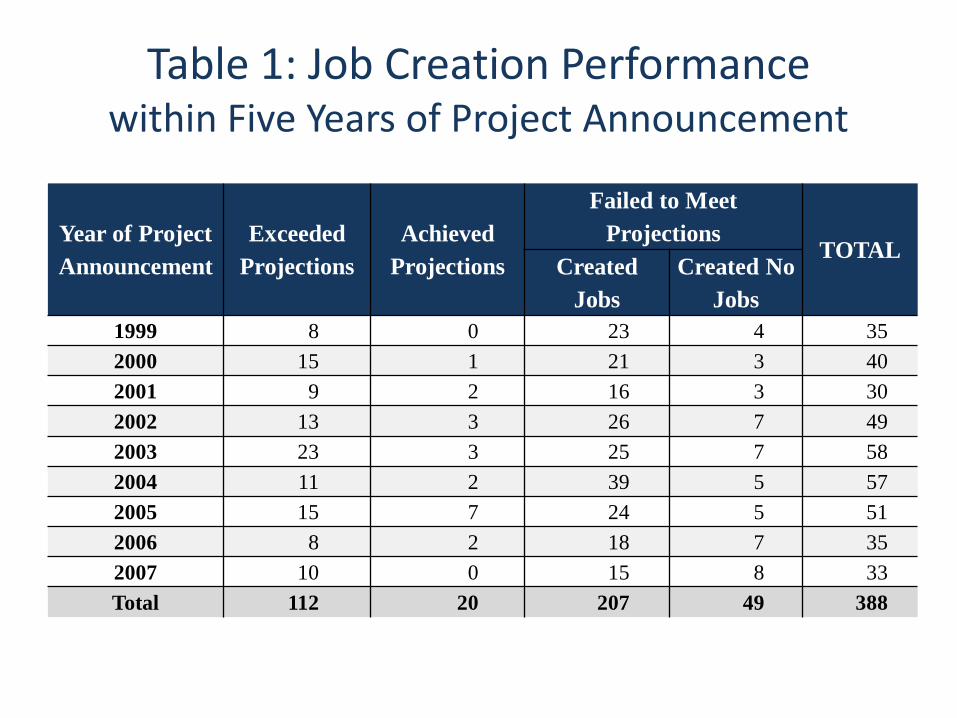
Table 1: Job Creation Performance within Five Years of Project Announcement
Year of Project
Announcement
Exceeded
Projections
Achieved
Projections
Failed to Meet
Projections TOTAL
Created
Jobs
Created No
Jobs
1999 8 0 23 4 35
2000 15 1 21 3 40
2001 9 2 16 3 30
2002 13 3 26 7 49
2003 23 3 25 7 58
2004 11 2 39 5 57
2005 15 7 24 5 51
2006 8 2 18 7 35
2007 10 0 15 8 33
Total 112 20 207 49 388
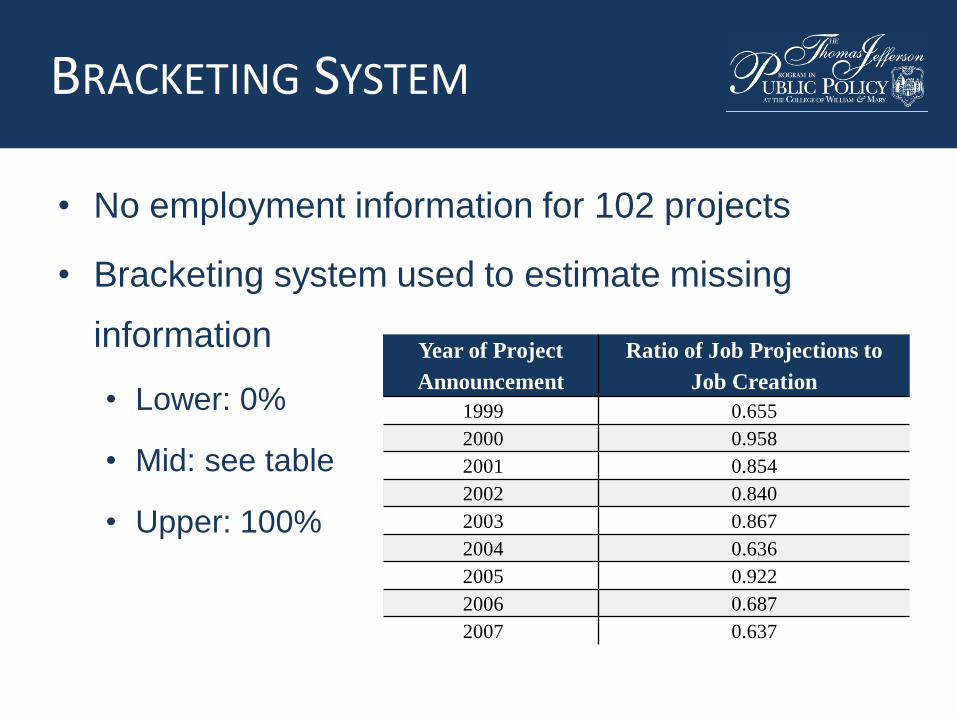
Bracketing System
• No employment information for 102 projects
• Bracketing system used to estimate missing
information
• Lower: 0%
• Mid: see table
• Upper: 100%
Year of Project
Announcement
Ratio of Job Projections to
Job Creation
1999 0.655
2000 0.958
2001 0.854
2002 0.840
2003 0.867
2004 0.636
2005 0.922
2006 0.687
2007 0.637
BRACKETING SYSTEM

Year of Project
Announcement
Job
Projections
Job Creation
Lower
Bound Mid-Level
Upper
Bound
1999 18,450 5,005 8,561 10,731
2000 22,419 10,544 20,555 21,129
2001 16,226 3,943 6,492 7,226
2002 12,840 6,467 9,168 10,616
2003 12,878 8,604 9,704 10,561
2004 25,260 10,079 14,918 18,631
2005 12,279 8,024 11,030 11,560
2006 5,769 3,171 3,949 5,555
2007 5,646 3,008 3,409 4,091
TOTAL 131,767 58,845 87,786 100,100
Table 2: Aggregate Job Creation

• Highest Performing Sectors
• Manufacturing
• Professional, Scientific, and Technical
• Lowest Performing Sectors
• Telecommunications
• Internet Service Providers
JOB CREATION BY SECTOR

• Highest Average Hourly Wages
• Beverage and Tobacco ($54.26)
• Accommodation ($43.29)
• Professional, Scientific, and Technical ($37.57)
• Lowest Average Hourly Wages
• Non-Store Retailers ($9.05)
• Administrative and Support ($9.12)
JOB CREATION BY SECTOR

• Highest Economic Multipliers
• Beverage and Tobacco (5.29)
• Water Transportation (4.96)
• Lowest Economic Multipliers
• Nonmetallic Mineral Product Manufacturing (1.16)
• Store Retailers (1.16)
• Non-Store Retailers (1.18)
JOB CREATION BY SECTOR

COMPARISON OF STATE-LEVEL EXPENDITURES AND REVENUES

Table 3: Aggregate Grant Expenditures
Year of Project
Announcement
Quantified Grant
Expenditures
(in millions)
Unquantified VJIP,
EDAP, and RIAP Grants
(in millions)
Total Grant
Expenditures
(in millions)
Lower
Bound
Upper
Bound
Lower
Bound
Upper
Bound
Lower
Bound
Upper
Bound
1999 $11.84 $17.03 $3.73 $4.20 $15.57 $21.23
2000 $28.21 $35.37 $8.84 $9.91 $37.05 $45.28
2001 $11.69 $15.40 $1.66 $3.28 $13.35 $18.68
2002 $13.62 $19.33 $5.99 $6.01 $19.61 $25.34
2003 $57.63 $58.76 $4.85 $5.14 $62.48 $63.90
2004 $19.19 $22.75 $1.66 $2.09 $20.85 $24.84
2005 $32.00 $34.51 $3.75 $4.19 $35.75 $38.70
2006 $14.05 $16.58 $3.52 $3.87 $17.57 $20.45
2007 $15.11 $15.21 $1.45 $1.88 $16.56 $17.09
TOTAL $204.27 $234.93 $35.45 $40.58 $238.79 $275.51

State Tax Revenues
• Generated in IMPLAN
• Short-term, conservative estimates
• Method of separating state and local taxes:
IMPLAN Category Percent Assigned to State
Revenue
Corporate Profits; Dividends; Income; Severance 100%
Motor Vehicle Licenses 100%
Sales Tax 80%
Other Taxes and Non-Taxes 67%
Property Tax 0%
STATE-LEVEL TAX REVENUES

Table 4: State-Level Expenditures and Revenues
Expenditures
(in millions)
Revenues
(in millions)
Net Revenue
(in millions)
Lower Bound $238.79 $460.52 $221.73
Mid-Level $268.81 $1,081.08 $812.27
Upper Bound $275.51 $1,110.45 $834.94

CYCLICAL AND COUNTER-CYCLICAL TRENDS: BUSINESS AND ELECTION CYCLES

0
0.5
1
1.5
2
2.5
3
3.5
4
4.5
5
0
2,000
4,000
6,000
8,000
10,000
12,000
14,000
VA
Un
em
plo
ymen
t Rate
Job
Cre
atio
n P
roje
ctio
ns
Month
Figure 1: Business and Election Cycle Trends Job Creation Projections
Monthly Job Creation Projections Unemployment Rate
EXPANSION RECESSION EXPANSION
State-Wide Election Cycle

0
0.5
1
1.5
2
2.5
3
3.5
4
4.5
5
0
5
10
15
20
25
30
35
40
45
VA
Un
em
plo
ymen
t Rate
P
rom
ised
Gra
nts
(in
mill
ion
s)
Month
Figure 2: Business and Election Cycle Trends Grant Awards
Promised Grants (in millions) Unemployment Rate
EXPANSION RECESSION EXPANSION
State-Wide Election Cycle

DEVELOPMENT PROJECT CASE STUDIES

Successful Development
• Goodyear Auto Service - Danville (2000)
• Expanded existing location
• Promised 50 jobs, created 529 jobs
• Employment needs consistent with local labor force
• Economic development in Danville
• Locality provides labor force training
• Successful competition with NC
SUCCESSFUL DEVELOPMENT
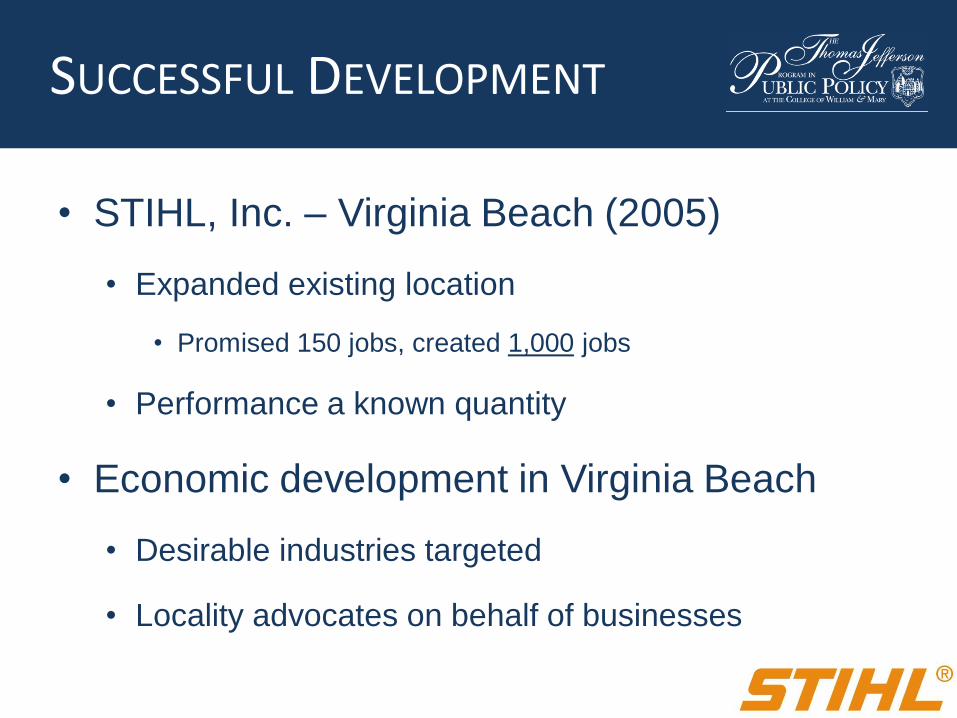
Successful Development
• STIHL, Inc. – Virginia Beach (2005)
• Expanded existing location
• Promised 150 jobs, created 1,000 jobs
• Performance a known quantity
• Economic development in Virginia Beach
• Desirable industries targeted
• Locality advocates on behalf of businesses
SUCCESSFUL DEVELOPMENT

Mixed Success Development
• Barber & Ross – Frederick County (2003)
• Relocated, expanded headquarters
• Promised 100 new / 375 saved jobs – metrics largely met
• Bankruptcy led to closure (2007)
• Economic development in Frederick County
• Focus on existing businesses
• Difficulty competing with other states
MIXED DEVELOPMENT

Unsuccessful Development
• Eli Lilly – Prince William Co. (2002)
• Relocated manufacturing facility
• Promised 700 new jobs
• Ended project in middle of construction (2007)
• Economic development in Prince William Co.
• Cooperates with university and research park
• Adapts to the market and targets new industries
UNSUCCESSFUL DEVELOPMENT

RECOMMENDATIONS FOR FUTURE EVALUATION OF DEVELOPMENT GRANTS

Limitations to IMPLAN
• Displacement impacts
• Existing businesses provide similar goods/services
• Additional costs to local/state governments
• Increased demand for public services
• Qualitative impacts
• Socio-psychological benefits
• Negative externalities
LIMITATIONS OF IMPLAN
Re-Evaluating Existing Policies
• Repayment of grant funds (clawbacks)
• Additional costs may be incurred
• Eliminating upfront payments may place
Commonwealth at a disadvantage
• Requirement to remain in community
• Most job creation occurs in short-term
• Need for greater accountability in long-term
RE-EVALUATING POLICIES

CONCLUSION

Findings
• Aggregate job creation did not meet projections
• Manufacturing sectors were high-performing in terms of job
creation
• Economic development grants are revenue-enhancing
• Non-manufacturing sectors were high-performing in terms of
generating tax revenue
• Business cycles impact job projections and grant awards
KEY FINDINGS