Embed Size (px)
Citation preview
Office of Evaluation
Impact Evaluation of WFP School Feeding Programmes in Kenya (1999-2008): A Mixed-Methods Approach
Vol 2
Annexes
March 2010
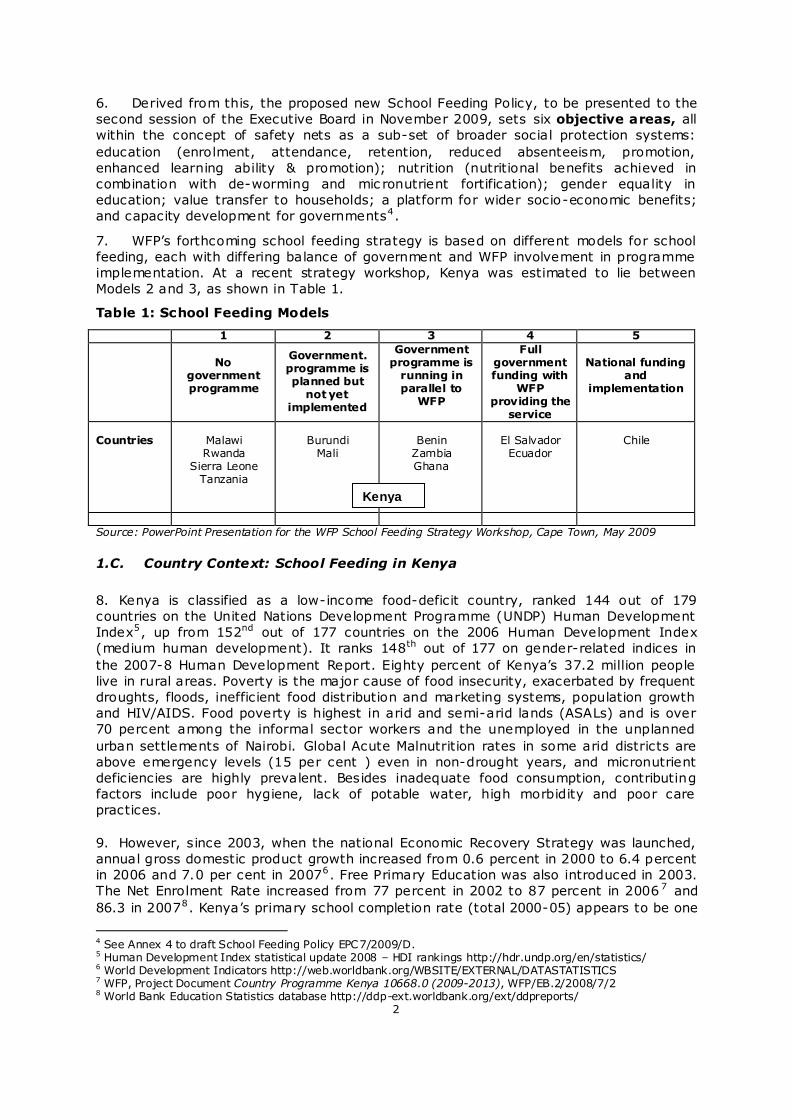
OE/2010/005
Prepared by: Timothy J. Finan, Ph.D Team Leader Arif Rashid (Tango International) Economist Dr. Birgitte Woel Consultant – Educationalist & PIA Specialist Dr. David Arunga (Consultant) PIA Specialist Dr. Sophie Ochola Consultant - Nutritionist Salome Rutere (Ronto Investment) Quantitative Survey Michael Muindi (Ronto Investment) Quantitative Survey
Commissioned by the Office of Evaluation of the World Food Programme
Acknowledgements This evaluation mission has benefited from the support of a wide range of individuals and
institutions. First and foremost, fellow team members and colleagues have come
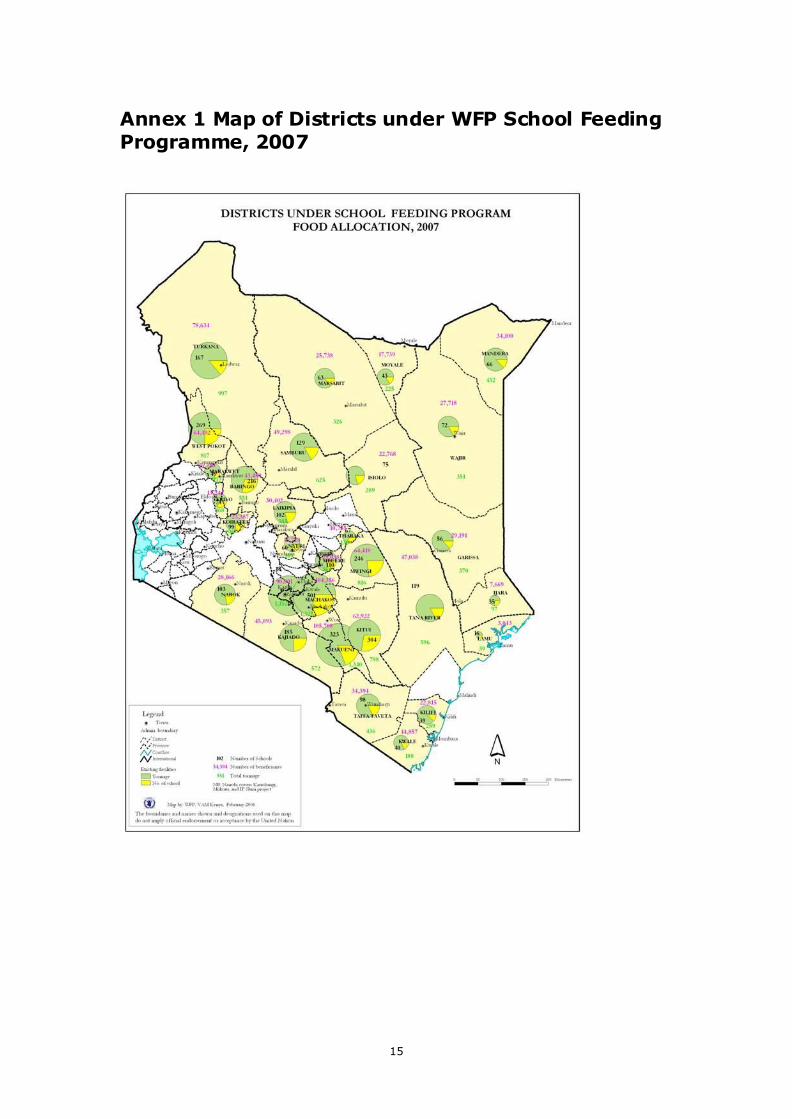
together from their respective areas of professional expertise to share the common
purpose of this endeavour, and to a person they have demonstrated complete dedication
and outstanding competence. A spirit of respect and consensus-building has permeated
all of our interaction. The team relied heavily upon the frank cooperation of the
WFP/Kenya leadership and staff. We recognize the support of the WFP Director, Burkard
Oberle, and the School Feeding Unit head, Rene McGuffin. Essential data access and
logistical support were provided by the School Feeding Unit and the M&E Unit, and it is
important to acknowledge the highly competent participation of Grace Igweta, Barbara
Leseni, and Dennis Tiren. They all demonstrated an active interest in the outcome of this
evaluation and provided insightful feedback. The team acknowledges the time and
information shared by the staff of the Ministry of Education, at the national and district
levels, the Ministry of Public Health and Sanitation, and the Ministry of Agriculture, as
well as other Government officials. A special debt of gratitude and recognition is owed to
the thousands of parents, school administrators, teachers, students, and community
members who participated in this evaluation and shared their invaluable experiences
with the team. It is our hope that this evaluation contributes to the effort to improve
their lives and expand quality education for all in Kenya. Highly-deserved recognition is
owed to Sally Burrows, the OE evaluation manager, whose watchful eye and stimulating
comments have proven so helpful.
Disclaimer The opinions expressed are those of the Evaluation Team, and do not necessarily reflect
those of the World Food Programme. Responsibility for the opinions expressed in this
report rests solely with the authors. Publication of this document does not imply
endorsement by WFP of the opinions expressed.
The designation employed and the presentation of material in the maps do not imply the
expression of any opinion whatsoever on the part of WFP concerning the legal or
constitutional status of any country, territory or sea area, or concerning the delimitation
of frontiers.
Evaluation Management Sally Burrows: Evaluation Manager,
Caroline Heider: Director, OE
Annexes
Annex A. Terms of Reference..................................................................... 3
1. Background.............................................................................................. 1
2. Reason for the Evaluation ....................................................................... 5
3. Scope of the Evaluation .......................................................................... 7
4. Evaluation approach.............................................................................. 10
5. Organisation of the evaluation ............................................................. 12
ANNEX B. Team Profile ............................................................................. 21
Annex C. Specific References .................................................................... 23
Annex D. Details on the Methodology .................................................... 25
Annex E. Sample Schools for the Impact Evaluation School Meals Programme in Kenya ................................................................................. 46
Annex F. Expanded Findings on Health and Nutritional Outcomes ........ 50
Annex G. List of People Consulted ............................................................ 58
Annex A. Terms of Reference Impact Evaluation of WFP School Feeding Programmes in Kenya (1999-2008):
Terms of Reference
Table of Contents
1. Background
1.A.Introduction
1.B.WFP‘s Corporate Approach to School Feeding
1.C.Country Context: School Feeding in Kenya
1.D.WFP‘s School Feeding Programme in Kenya
2. Reason for the Evaluation
2.A.Evaluation Rationale
2.B.Evaluation Objective
2.C.Key Questions
3. Scope of the Evaluation
3.A.Scope
3.B.Evaluability Assessment
3.C.Stakeholders
4. Evaluation approach
4.A.Methodology
4.B.Evaluation Quality Assurance
4.C.Phases and Deliverables
5. Organisation of the evaluation
5.A.Expertise of the Evaluation Team
5.B.Roles and Responsibilities
5.C.Communication
5.D.Budget
Annex 1 Map of Districts under WFP School Feeding Programme, 2007
Annex 2 Map of Kenya Food Security, 2007
Annex 3 Map of Average Percentage Malnutrition Levels (<135 mm), July 2002-06
Annex 4 Key Output Indicators by Operation Category, 2007
Annex 5 Overview of Contributions to School Feeding in Country Programme, 2004-08
1
1. Background
1.A. Introduction
1. The world community has regularly re-stated its commitment to education as a
human right. Access to and quality of education are also regarded as an essential plank
for poverty reduction: human capital – education, knowledge, skills, access to and
understanding of information – is part of the livelihoods approach that recognizes
poverty to go beyond a lack of income. Education is embedded in the Millennium
Development Goals: MDG 2 (achieve universal primary education) and MDG 3 (promote
gender equality and empowers women, with targets for eliminating gender disparity in
education). School feeding also relates to MDG 1 (eradicate poverty and hunger). A
series of multilateral events since 1990 made explicit linkages between education,
nutrition and health and have established action plans and special funds.
2. For the purpose of this evaluation school feeding is understood as programmes
that are implemented through schools as the food distribution point, and can include wet
and dry feeding distributed at any point in time during the school day (breakfast, mid-
morning, lunch) and Take-Home Rations. Operations that focus on pre-school children or
provide food-for-training outside a school context will not be included.
1.B. WFP’s Corporate Approach to School Feeding
3. Overview. School feeding has been cited as one of WFP‘s programme areas since
its establishment in 1963.1 By 1993, pre-primary and primary school feeding accounted
for more than half of WFP‘s development commitments.2 In 2008, as the largest
implementer of school feeding programmes in the world, WFP invested US$475 million
(14per cent of total budget) in some 70 countries, reaching an average of 22 million
children in school, about half of whom are girls. WFP‘s School Feeding Handbook 1999
recognised that there was insufficient evidence that school feeding addresses
malnutrition and therefore explicitly focused on educational outcomes (increasing
enrolment and attendance and improving learning outcomes) and reducing the
opportunity cost of sending children to school, particularly through Take-Home Rations.
4. School feeding was at the core of strategic priority/objective 4 in WFP‘s Strategic
Plans 2004-2008 and 2006-2009 and was clearly aligned with MDG2 and MDG3. The
Indicator Compendium for 2006-20073 concentrates at the outcome level on
enrolment and attendance rates, including a presentation of gender disparity, and ability
of school children to concentrate.
5. New Strategic Plan: In the latest strategic plan (2008-2011), school feeding is
embedded in a broadened Strategic Objective 4, which aims to reduce chronic hunger
and under-nutrition. It sets a goal of increasing levels of education and foresees school
feeding addressing short-term hunger, and thus improve learning abilities, providing a
safety net by ensuring children attend school both through school feeding and take-
home rations, and addressing micro-nutrient deficiencies. By using locally produced
foods, school feeding is also expected to have a positive impact on local markets.
Through a positive contribution to learning results and school completion, it may also
have an effect on the inter-generational cycle of hunger. The Strategic Results
Framework (approved in 2009), flowing from the Strategic Plan, carries forward
indicators from the Indicator Compendium.
1 School Feeding Handbook, WFP, 1999 referencing FAO Conference Resolution 1/61 of 24 Nov.1961. 2 Ibid. 3 WFP Indicator Compendium (Biennium 2006-2007), 2005. http://docustore.wfp.org/stellent/groups/resultsbasedmanagement_content/documents/other/wfp031995.pdf
2
6. Derived from this, the proposed new School Feeding Policy, to be presented to the
second session of the Executive Board in November 2009, sets six objective areas, all
within the concept of safety nets as a sub-set of broader social protection systems:
education (enrolment, attendance, retention, reduced absenteeism, promotion,
enhanced learning ability & promotion); nutrition (nutritional benefits achieved in
combination with de-worming and mic ronutrient fortification); gender equality in
education; value transfer to households; a platform for wider socio-economic benefits;
and capacity development for governments4.
7. WFP‘s forthcoming school feeding strategy is based on different models for school
feeding, each with differing balance of government and WFP involvement in programme
implementation. At a recent strategy workshop, Kenya was estimated to lie between
Models 2 and 3, as shown in Table 1.
Table 1: School Feeding Models
1 2 3 4 5
No
government programme
Government. programme is planned but
not yet implemented
Government programme is
running in parallel to
WFP
Full government funding with
WFP providing the
service
National funding and
implementation
Countries
Malawi Rwanda
Sierra Leone Tanzania
Burundi
Mali
Benin
Zambia Ghana
El Salvador
Ecuador
Chile
Source: PowerPoint Presentation for the WFP School Feeding Strategy Workshop, Cape Town, May 2009
1.C. Country Context: School Feeding in Kenya
8. Kenya is classified as a low-income food-deficit country, ranked 144 out of 179
countries on the United Nations Development Programme (UNDP) Human Development
Index5, up from 152nd out of 177 countries on the 2006 Human Development Index
(medium human development). It ranks 148th out of 177 on gender-related indices in
the 2007-8 Human Development Report. Eighty percent of Kenya‘s 37.2 million people
live in rural areas. Poverty is the major cause of food insecurity, exacerbated by frequent
droughts, floods, inefficient food distribution and marketing systems, population growth
and HIV/AIDS. Food poverty is highest in arid and semi-arid lands (ASALs) and is over
70 percent among the informal sector workers and the unemployed in the unplanned
urban settlements of Nairobi. Global Acute Malnutrition rates in some arid districts are
above emergency levels (15 per cent ) even in non-drought years, and micronutrient
deficiencies are highly prevalent. Besides inadequate food consumption, contributing
factors include poor hygiene, lack of potable water, high morbidity and poor care
practices.
9. However, since 2003, when the national Economic Recovery Strategy was launched,
annual gross domestic product growth increased from 0.6 percent in 2000 to 6.4 percent
in 2006 and 7.0 per cent in 20076. Free Primary Education was also introduced in 2003.
The Net Enrolment Rate increased from 77 percent in 2002 to 87 percent in 2006 7 and
86.3 in 20078. Kenya‘s primary school completion rate (total 2000-05) appears to be one
4 See Annex 4 to draft School Feeding Policy EPC7/2009/D. 5 Human Development Index statistical update 2008 – HDI rankings http://hdr.undp.org/en/statistics/ 6 World Development Indicators http://web.worldbank.org/WBSITE/EXTERNAL/DATASTATISTICS 7 WFP, Project Document Country Programme Kenya 10668.0 (2009-2013), WFP/EB.2/2008/7/2 8 World Bank Education Statistics database http://ddp-ext.worldbank.org/ext/ddpreports/
Kenya
3
of the highest in Sub-Saharan Africa nationally at over 90 per cent9, dropping to 35 per
cent in arid and 74 per cent in semi-arid districts10. However, at the time of the 2007
field visits for the joint review of the Kenya Education Sector Support Programme
(KESSP) 2005-2010, EMIS operations were not without problems, which undermines the
reliability of the data supplied to the central level11. Free Primary Education represents a
significant transfer value to households with children in school, bec ause the household
funds previously spent on school fees is available for other uses.
10. At the highest level, the national Medium Term Plan ‗Vision 2030‘ refers to school
feeding under the ‗Social Pillar‘ as an ongoing initiative contributing to equity in access to
education12. School feeding is included in one of the four areas of improvement in the
KESSP 2005-2010, namely ―enhancing quality and learning achievement‖. GOK is
currently drafting a Strategy on School Health, Nutrition & Feeding. In 2007/8, 31 per
cent of GOK budget was dedicated to the education sector13. School feeding is also
included in the 2007 National Food and Nutrition Policy and the Gender Policy. It is
included in the remit of the Kenya Food Security Group and the Education Donor
Coordination Group.
1.D. WFP’s School Feeding Programme in Kenya
11. WFP has been providing school feeding assistance since it began working in Kenya
in 1980. Since 2002 (the earliest comprehensive comparative data available), the school
feeding programme in Kenya has consistently been one of WFP‘s 2 or 3 largest
globally14. From 2005 to 2007, it delivered food to between 1.7M and 1.8M beneficiaries
each year, accounting for 9 per cent of WFP‘s total global beneficiaries of Food for
Education in 2007. Apart from a few other countries in specific, single years (e.g.
Afghanistan, DPR Korea and Iraq), no other country has more than 1 million
beneficiaries. In 2007, over 80 per cent of approximately 70 countries with school
feeding programmes had under 500,000 beneficiaries.
12. At the peak in 2007, 1.85 million children were benefiting from school feeding
provided by WFP, of which 48 per cent were girls. 5,266 schools were covered in 29
districts (out of around 60) districts with 142 school feeding days across all 3 operations
ongoing at the time15 – see map at Annex 1. There were signif icant disparities between
districts which are not shown here. Figures for each year from 1999 to 2008 will be
gathered during the Design and Inception Phase (Section 5.C below). The most const ant
intended focus over time has been on the Arid and Semi-Arid Lands (ASAL‘s). To put this
in proportion, in 2006 (the nearest year for which figures are available), total enrolment
in primary education in Kenya was 6.1 million (of which 49 per cent girls)16.
13. School feeding has constituted 75 per cent to 81 per cent of the most recent and
current WFP country programmes. It has constituted a significant tonnage and
beneficiaries in the Emergency Operation 10374 for Food Assistance to Drought Affected
People, begun in late 2004 and repeatedly extended until end-2007, though not a major
part of the Operation. There is also a very small component in the PRRO 10258.2 for
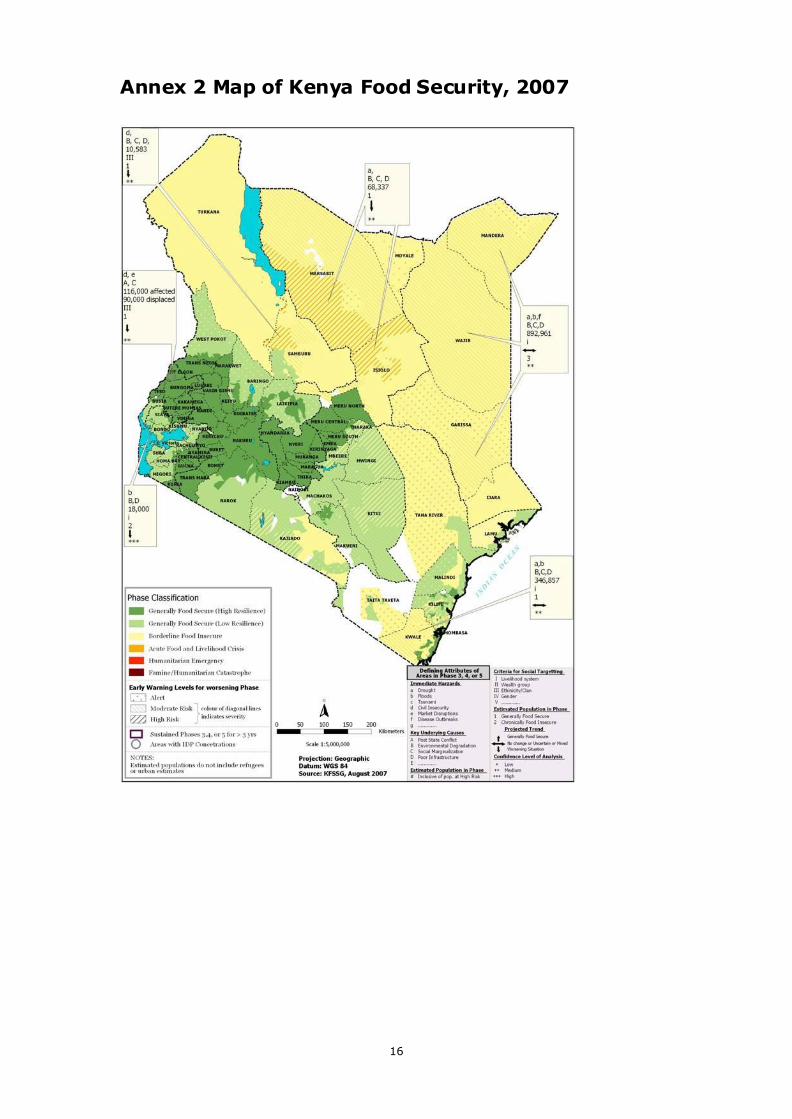
Food Assistance to Somali and Sudanese Refugees (see Table 2 below and Annex 2).
9 World Bank Education Statistics database http://ddp-ext.worldbank.org/ext/ddpreports Source: UNESCO Institute for Statistics (UIS), World Bank, UNAIDS, ILO, Household Surveys, IMF, Country.. 10 WFP, Project Document ‗Country Programme Kenya 10668.0 (2009-2013), WFP/EB.2/2008/7/2 11 e.g. Report of the KESSP Joint Review field visits, Eastern Province, 2007 12 Republic of Kenya, 2007, Kenya Vision 2030: First Medium Term Plan (2208-2012) 13 WFP, Project Document ‗Country Programme Kenya 10668.0 (2009-2013), WFP/EB.2/2008/7/2 14 Source: WFP Standard Project Reports 15 WFP Standard Project Reports 2007 16 Education For All Global Report 2009, Table 5
4
14. At the end of school years in 2007 and 2008 various school districts were phased
out of the EMOP in line with improving food security. No school feeding was included in
the follow-on EMOP 10745 (July 08-April 09). As recommended by the 2007 evaluation,
to improve inter-programme coherence and facilitate external coherence, all school
feeding was included in the Country Programme (CP). The latest PRRO 10666 May 2009
to April 2012 includes an element of school feeding, but it is managed by the CP team.
15. During the same period, the direct costs per metric tonne of providing food 17 rose
from US$347 in 2007 to US$457 in 2008. The total number of beneficiaries from the
WFP school feeding programme fell to 1.2 million. Increasing food prices and transport
costs are said to be necessitating a further significant reduction in WFP coverage from
2009 to an average of 650,000 per annum over 5 years to 2013 (phased in gradually
with 728,000 in 2009). In line with recommendations of the 2007 Evaluation, the 2009
re-targeting exercise targeted assistance to the most food insecure districts with the
lowest education indicators. The GOK has committed US$5 million to provide Home-
Grown School Food for 650,000 children in districts previously assisted by WFP - to begin
in 2009.
Table 2: WFP Operations in Kenya - 2004 to date (evaluation report will cover 1999 to 2008)
Operations From To Total
Operation Budget US$
Budget for school feeding
US$
Total No.of Benfs
(planned)
No.of SF Benfs p.a. (planned)
No.of SF Benfs 2007
(actual)
EMOP 10374 Food Assistance to Drought-Affected People in Kenya
Aug-04
Jul-07 85,801,540
To be provided by
CO 2,971,728* 554,209** 537,706* PRRO 10258.2 Food Assistance to Somali & Sudanese Refugees
Oct-07
Sep-09 108,200,000 489,535 337,000 66,000 47,222
Country Programme 10264.0
Jan-04
Dec-08 83,246,873 68,103,063 1,000,000 1,000,000 1,245,342
Country Programme 10668.0
Jan-09
Dec-13 106,300,000 66,129,658 728,000 650,000 n.a.
Totals: 515,699,711
Source: WFP Project Documents & Standard Project Reports 2007 * March to August 2006 and being maximum numbers of beneficiaries under EMOP 10374 in any one period ** Term III of 2006 being the period corresponding most closely to previous column and the latest period for which figures are available. Source: WFP Kenya Country Office
16. Operations which have included a school feeding component have been supported
by bilateral donors (the biggest donations), including McGovern-Dole, the Government of
Kenya itself (in kind), and various private bodies (both non-profit international and local
as well as for-profit), mostly in kind (see Annex 3).
17. The school feeding programme in Kenya provides food to all children within each
school in the programme to avoid difficulties with stigma, jealousies or logistics, which
might arise if only some children were fed. Past food procurement has been on the basis
of the global rule of purchase of the cheapest. GOK has contributed locally produced
maize in kind18. The programme has diversity in terms of: livelihood zones targeted;
modalities of food assistance (in-school meals, porridge with Corn Soya Blend and
limited experimentation with Take-Home Rations in refugee camps); types of school
(rural/urban; boarding/day); type of operation (CP, PRRO, EMOP); and partners involved
in aspects of implementation, though school feeding is always under MOE supervision.
17 ‗Food costs‘ plus ‗other direct costs‘ from Standard Project Reports of Country Programme 10264.0 18 Only very recently has there been limited introduction of home grown food.
5
18. These characteristics make WFP‘s school feeding programme in Kenya one of the
largest and oldest in the world. It therefore offers potentially rich evidence for learning
to inform future strategy both in Kenya and more widely. The 2007 Evaluation found
little doubt that it had contributed to positive educational outcomes, although there is
need for more evidence about the impact on learning achievements. Further, many
communities have come to regard it as an entitlement and/or public good19. However,
this has raised fundamental concerns about dependence - of communities on school
feeding and of GOK on external assistance to provide it - sustainability and about the
impact of school feeding on the efficiency of the education sector20 and beyond,
especially compared to alternative investments to the same ends.
2. Reason for the Evaluation
2.A. Evaluation Rationale
19. A convergence of three main changes in the context demand a revised focus and
direction for the school feeding programme in Kenya and therefore make this evaluation
timely. First, amongst other factors, increases in food prices and international and local
transport costs without a corresponding increase in resources has meant a reduction in
WFP‘s school feeding coverage in Kenya and creates some urgency to reviewing which
modalities may be most effective and efficient in which circumstances. Second, new GOK
policies, the current KESSP term ending in 2010, and renewed attention to school
feeding create broader opportunities and need for revision and re-focus. Thirdly, the
adoption of WFP‘s new Strategic Plan 2008-2011 has added a new dimension to school
feeding, namely that of being a part of the social safety net. WFP is preparing a new
corporate policy and global strategy on school feeding in the light of this and other new
objectives under the Strategic Plan, such as the transition from a food aid to a food
assistance organization.
20. The evaluation has been requested by the WFP Country Office and is also
welcomed by the school feeding units in WFP HQ. The evaluation will provide the WFP
Country Office and national partners with the basis to strengthen future strategy and
programme. The evaluation is also expected to provide lessons to inform the new
corporate WFP school feeding strategy and the tool-kit for its roll-out, which is planned
from 2010 onwards. In addition, the evaluation is expected to provide useful insights to
GOK actors, NGO‘s and donors involved in review of educ ation sector strategy, the
forthcoming school health, nutrition and feeding strategy and social safety net strategy.
2.B. Evaluation Objective
21. Like all evaluations at WFP, this evaluation serves accountability and learning
purposes. The evaluation will:
(i) evaluate the outcomes and impact21 achieved so far from the various modalities
that have been used in relation to stated educational, gender and nutritional
objectives; and
evaluate outcomes and impact achieved in relation to WFP‘s new social safety
net objectives (even though these were not explicitly included in the
programme design) and assess the extent to which the programme has already
the elements or potential necessary to meet newer GOK and WFP policy
objectives concerning social safety nets and nutrition; and
19 See, for example, WFP, 2008, Evaluation of Kenya Emergency Operation 10374.0 and Country Programme 10264.0 (2004-2008), OEDE/2008/002 20 The underlying assumption is that the higher the entry and completion rate within the regular schooling period, the more efficient the school system is. 21 Impact is defined as: Positive and negative, intended or unintended, primary and secondary long-term effects of the programme, - social, economic, environmental or technical – on individuals, gender and age-groups, communities and institutions. (WFP/DAC).
6
identify changes needed to enable fulfilment of potential to contribute optimally
to GOK objectives and the objectives of the current WFP Strategic Plan and
proposed School Feeding Policy.
22. The programmes cannot be held accountable on point (ii) for achievement of
objectives that were not included in the programme design. However, some unexpected
and/or less explicit outcomes may already have been achieved towards these objectives.
These should be recorded for learning purposes, especially as part of the baseline
assessment upon which future strategy and new programme can be designed, in Kenya
and possibly more widely. For this reason - in evaluation jargon – the evaluation will be
primarily 'formative', rather than 'summative'.
2.C. Key Questions
23. Related to MDG‘s 1, 2 and 3, what impact has WFP‘s work on school feeding
contributed to concerning:
a) the efficiency of the education sector and impact on learning achievements?
b) achievement of planned nutritional objectives?
c) social safety nets in terms of economic, food security or physical protection22 for the
most vulnerable, even though these were not intended at the outset?
24 Within the different livelihood zones (including urban), how have (a) impact and
outcomes (intended and unintended) and (b) costs been affected by differences in the
variables listed below, as distinct from external factors, such as commodity and
transport price rises.
i) nature of food assistance: meal (alone or in combination with Corn Soya Blend
porridge), and snack;
ii) types & size of school (formal/informal, day/boarding 23);
iii) of adding in extra packages (e.g. de-worming, micronutrients & private sector
donations);
iv) level of community involvement;
v) procurement options and potential for working in coordination with other schemes
(e.g. local purchase, home-grown school food)?
vi) types of WFP operation (emergency or development)? How effective and appropriate
is school feeding in an emergency context in Kenya?
25.In what circumstances does school feeding appear to have shown the best ‗return on
investment‘ in terms of cost compared to impact/outcomes for WFP‘s priority
beneficiaries: the most food insecure in areas with the lowest NER for girls?
26. To what extent have WFP‘s targeting strategy (revised in 2009) and modalities for
school feeding been aligned with GOK policy priorities in the education sector, the Kenya
Joint Assistance Strategy and with the UN Development Assistance Framework (UNDAF)
for Kenya? What have been the main factors influencing WFP programme choices
concerning school feeding in practice?
27. In the context of the new policy directions (in Kenya and WFP), what changes might
be required to the design of interventions to increase impact, effectiveness, and
sustainability, tailor-made to the core target groups (including alternatives to the direct
supply of food)?
22
e.g. protecting girls from early marriage 23
Planned activit ies with mobile schools have not yet started.
7
3. Scope of the Evaluation
3.A. Scope
28. Categories. The evaluation will include all school feeding activities under the overall
supervision of the MOE. This includes both Country Programmes and Emergency
Operations. It excludes school feeding activity in the refugee camps (under PRRO‘s),
except where and if the Evaluation team considers it useful for comparison purposes.
These have constituted a very small proportion of the whole (see Table 2 above and
Annex 2) and are of a very different nature, implemented with different partners.
29. Focus on Operations. The evaluation aims to generate evidence and insights from
operational experiences to answer the questions raised in Section 4 of these terms of
reference below. It will focus primarily at the outcome and impact level (since earlier
evaluations have focused more at output level). It will examine school feeding baseline
surveys and other needs assessments, targeting of school feeding, choices of operational
modalities and implementing arrangements, including partnerships, the monitoring and
evaluation of school feeding, and the cost of running school feeding programmes. The
evaluation will not analyze the WFP Handbook and other guidance materials.
30. Timeframe. For assessing effectiveness, the evaluation will consider information
concerning all operations that have included a school feeding component in the 10-year
period from 1999 through 2008. For assessing efficiency, information will be drawn
primarily from the 5-year period 2004-2008. Information for assessing impacts and
longer-term outcomes, however, may concern pre-1999 operations as well.
31. Geographical Scope. During the Inception Phase, a stratified sample of sites for
field work will be selected, based on the composition of the school feeding portfolio and
the different variables mentioned in paragraph 17 above, but with random selection
within each stratum.
3.B. Evaluability Assessment
Evaluability is the extent to which an activity or a programme can be evaluated in a reliable and credible fashion. It necessitates that a policy, intervention or operation provides: (a) a clear description of the situation before or at its start that can be used as reference point to determine or measure change; (b) a clear statement of intended outcomes, i.e. the desired changes that should be observable once implementation is under way or completed; (c) a set of clearly defined and appropriate indicators with which to measure changes; and (d) a defined timeframe by which outcomes should be occurring.
32. WFP does not yet have a formally adopted ―logical framework for school feeding‖
presented in one document. However, the WFP Strategic Results Framework gives
important guidance under Strategic Objective 4 Reduce Chronic Hunger and
Undernutrition, for which Outcome 4.2 concerns school feeding directly. Although not
formally adopted by WFP, the 2006 study Food for Education Works 24, commissioned
by WFP, presented a logic model and programme theory for past programmes. The
model differentiated between initial, intermediate and distant outcomes and combined
(primarily) educational outcomes with others, such as improved micronutrient status and
improved learning capacity.
33. For future programmes, WFP is adopting a logical framework model, currently
available as Annex 4 of the draft School Feeding Policy (yet to be approved).
34. The 1999 Handbook (see paragraph 3 above) has recognized goals and immediate
objectives and the Indicator Compendium has indicators at output and outcome level
(see paragraph 4 above). The relevant Project Documents for Country Programmes each
include a logical framework for that operation and school feeding as an activity. Despite
24 Food for Education Works: A Review of FFE Programme Monitoring and Evaluation 2002-2006, Aulo Gelli for WFP, 2007.
8
some gaps or inconsistencies between various planning documents25, the main expected
outcomes are discernible.
35. The Programme has been evaluated periodically since the mid-1980‘s, most recently
in 2003 and 2007. Impact indicators are not included in the typical monitoring and
evaluation systems of WFP. However, baseline studies for WFP‘s school feeding
programme were made in 2003 and 200826. Recent impact studies of school feeding in
Kenya have been commissioned by other donors/agencies 27 and there was a Review of
the KESSP in 2007. At the household and individual level, further impact data may be
collected using tracer studies. The best approach (in terms of cost, practicalities and
expected lessons from such inquiry) will be determined during the Design and Inception
Phases of the evaluation.
36. Educational Outcomes. The educational objectives of the WFP‘s school feeding
programme are well defined and associated with clear indicators. Enrolment,
retention/drop-out rates attendance rates and (to a lesser extent) cognitive ability are
standard data collected annually. It is disaggregated by gender and geographically down
to district level. This information is available at the WFP Kenya Country Office and in
Headquarters from the Programme Support Unit (school feeding) through the database
(DOMUS), which covers 23 WFP-assisted countries. Therefore, the educational outcomes
should be ‗evaluable‘. The GOK Education Management Information System provides
data on the same outcomes for all schools, enabling comparison.
37. Nutritional Outcomes. For nutritional data, the objectives – reducing micronutrient
deficiency vitamin A, iodine and iron deficiency and reducing the intensity and
prevalence of worm infestation in school age children28 – are clear. Data on only a few
indicators related to these objectives was collected for the school feeding baseline
surveys. Further information may be collected through national health information
systems29. In how far this data can be correlated with the schools where micronutrient
and de-worming programmes has taken place will have to be seen. For beneficiaries of
the EMOP, data on acute malnutrition should be available from periodic surveys
conducted by health agencies The methodology of the evaluation will determine how
data gaps will be filled through fieldwork.
38. Social Safety Outcomes. The social safety net outcomes provide a challenge in that
WFP is only now adopting this objective for school feeding. A new logic model is
currently being developed for the new WFP School Feeding policy (due to be presented
to the Executive Board in November 2009), which incorporates social safety nets. The
team will use this to guide the evaluation in generating evidence of unplanned results
already achieved and assessment of future potential. This is not ‗evaluable‘ for
accountability purposes, but can be used for learning purposes.
39. The final complicating factor is that elements of the Essential Package 30 - intended to
increase effectiveness - have been introduced to the programme gradually over time.
This will need to be taken into account in analysing changes in effectiveness and costs
over time. These elements include de-worming (since 2004) and later water and
sanitation (especially for girls), fuel-efficient stoves and school gardens.
25 See OEDE/2008/002 26 Analysis and report never completed, but data available from the Programme Support Unit at WFP HQ. 27 Including recently by DFID and CARE 28 Project Documents and School Feeding Handbook, WFP, 1999. See Section I.3.3.2 of the Handbook for micronutrient deficiencies, and IV.3.2 for school-based de-worming. 29
Via Ministry of Health, Ministry of Planning and Ministry of Agriculture. 30 The FRESH Essential Package is a joint WFP/UNICEF initiative that includes 12 interventions to address school health and nutrition in a comprehensive way.
9
3.C. Stakeholders
40. There is a fairly large and diverse group, who have an interest in the education
sector and the actual and potential contribution of school feeding as one tool (amongst
many) to contribute to the efficiency of the education sector as well as to nutrition,
food security and social protection. They have an interest in evidence from this
evaluation about the impact and outcomes of school feeding to inform future policy and
strategy. There is also a smaller group – largely within the wider group - who also have
a direct interest in the WFP school feeding programme itself (e.g. programme
partners).
41. Representatives of all stakeholders in the narrower group and a selection of
stakeholders from the wider group will contribute to the evaluation as key informants. A
detailed list of stakeholders in each category will be drawn up during the Inception Phase
with the assistance of the Country Office. Nevertheless, the following are already
evident:
a) School children and their families/households, who receive or have been
receiving school feeding. Their primary interest in school feeding is whether it
addresses the hunger needs of pupils within their family/community or the
opportunity cost of children attending school and thus provides an appropriate
incentive to ensure enrolment and attendance. Improvements to operational design
and implementation would benefit them directly.
b) Parents and teachers, who participate in the management and implementation of
school feeding programmes, be it through school committees or by providing inputs
(time to cook meals, provision of fire wood, etc). Changes resulting from the
evaluation would affect them directly.
Together (a) and (b) will also be able to reflect on the indirect effects of receiving
school feeding and thus inform the evaluation about unintended and unexpected
impact and outcomes (positive or negative).
c) The Ministry of Education (MOE) at district, provincial and national levels:
- as the ministry responsible for the Kenya Education Sector Support Programme;
&
- as the main implementer of school feeding programmes both in partnership with
WFP and separately or with others
- as the Ministry with responsibility for the new strategy on School Health, Nutrition
and Feeding.
Its interest lies in the efficiency and effectiveness of the school feeding
programmes so that they best serve the country‘s needs, the accuracy and fairness
of targeting, and the extent to which national capacities have been developed for
running school feeding programmes without external technical assistance.
d) Other Government of Kenya departments/ministries. These include the PM‘s
office, which has formed a taskforce to oversee Social Protection Policies and
instruments. The Ministry of Finance/Office of the President Special Programmes
has also overseen funding/food assistance set aside for school feeding, both
through in-kind contributions to WFP and through GOK's home-grown school
feeding programme to come on stream in 2009. The Ministry of Agriculture
(through Njaa Marufuku) has an interest in promoting 'home-grown school feeding'
to ensure that the food for school feeding is produced and purchased locally. The
Ministry of Health and other coordinating mechanisms concerned with food security
and nutrition may also have an interest, such as the Kenya Food Security Steering
Group and interest in school gardens as an educational tool.
e) Multilateral agencies. In Kenya, UNICEF has had direct collaboration agreements
with WFP on the school feeding programme (under the Essential Package). UNESCO
10
and the World Bank have strong interests in the education sector and FAO in the
potential for home-grown school feeding.
f) Bilateral agencies have an interest as actors at national level in the relevant
sectors. Some also have a direct interest in the programme as donors (see Annex
3). Internationally, as WFP‘s key funding partners, a broader range of bilateral
agencies also have an interest in the accountability and learning the evaluation
may provide for WFP as a whole;
Both (e) and (f) have an interest in the evaluation evidence to inform their
discussions with WFP about future directions of school feeding and partnerships and
potentially in sector coordination mechanisms (e.g. the Education Sector Donor
Group in Kenya);
g) Private non-profit organisations (both international and local). A very few
have an interest as implementing partners, committing their own resources too –
e.g. Feed the Children (actual). Other non-profit organisations active in the
relevant sectors – including churches – have an interest in the evidence and wider
implications of this evaluation because they are supporting the sector (e.g. VVOB)
and/or because WFP is such a big player in school feeding.
h) Private for-profit organisations (international & local) have an interest in the
programme as donors of cash or in-kind contributions – see Annex 3.
i) WFP at headquarters, regional bureau, and country level, where interests range
from strategic issues on WFP‘s approach to schoo l feeding to advocacy and
fundraising to interest in operational lessons that may apply to other countries.
These Terms of Reference were drawn up on the basis of key literature sources,
consultation with key WFP staff (at all levels) and with key informants in (c) and (d)
above, and with a small sample of representatives from groups (b), (e), (f) and (g)
above.
4. Evaluation approach
4.A. Methodology
42. Mixed Methods. This is a first approach to impact evaluation for WFP within limited,
current evaluation resources and possibilities. In the longer term, the approach to impact
evaluation should be broadened to include longitudinal and quasi-experimental studies
as well. In the meantime, the current evaluation will use a mixed method approach and
draw on the body of existing data and research as far as possible. It will complement
this by collecting additional information from key stakeholders (see Section 3.C above)
and triangulate its findings from a cross-section of sources. The methods for collecting
this information will be decided by the Evaluation Team in the Inception Phase, selected
as appropriate to purpose and participatory, where possible. They are likely to include
semi-structured interviews, focus group discussions, observation as well as methods
appropriate to tracer studies. In the end, a combination of qualitative and quantitative
data will be used to support evaluative assessments and show developments over time.
43. The evaluation will stratify its research according to different livelihood zones
(pastoralists/agro-pastoralists/marginal agriculturalists/urban, most food insecure
areas/less food insecure areas, especially in the Arid and Semi-Arid Lands). Sampling
will be representative and randomised within strata. The evaluation will seek
comparative data with schools in similar settings, which have not received school feeding
(a control group). In the absence of sufficient ‗pure‘ control groups, the evaluation may
compare ‗before and after‘ data for schools where (certain types of) school feeding has
been withdrawn and use data from previous years with schools that have only recently
started school feeding.
11
44. Tracer Studies. In order to obtain key data on impact and outcomes that is not
otherwise available, tracer studies may be used. These are expensive, so the focus will
be carefully selected during the Design and Inception Phases in consultation with the
team leader, based on the following criteria:
o most important data gaps undermining the team‘s ability to answer the
evaluation questions;
o priority issues for informing future strategy on which inadequate secondary
information is available.
45. Using Standards. The evaluation will use established standards to assess WFP‘s
performance. In some areas, the standards may have been set by WFP, as it is the
largest player in the school feeding area. In other areas, standards are not yet defined
and the evaluation team will analyze and evaluate the working tools that WFP has
developed to determine whether these tools meet professional standards. In the area of
social safety nets, the evaluation will use the recent work of the World Bank, which
indicates what makes a good safety net as a benchmark.
46. Evaluation Matrix. The evaluation team will develop, in the inception phase, an
evaluation matrix that expands the key questions and articulates sub-questions,
verif iable indicators to respond to these, and means of verification/data collection.
4.B. Evaluation Quality Assurance
47. WFP has developed an Evaluation Quality Assurance System (EQAS) based on
international good evaluation practice. It sets out process maps and templates for
evaluation products, including checklists for feedback on quality for each of the
evaluation products. EQAS has not yet been adapted to the specifics of impact
evaluation, but the principles and all appropriate content will be systematically applied to
this evaluation. Standards specific to impact evaluation will be developed, as necessary,
on the basis of this pilot experience. OEDE will provide relevant EQAS documents to the
evaluation team.
48. The evaluation team will also make arrangements to ensure data used in the
evaluation report is checked for accuracy and reliability. The evaluation report will clearly
indicate limitations to the conclusions that can be drawn from the evidence.
49. In addition, the evaluation will benefit from an external peer review panel, which will
review and discuss (by video/telephone conference and/or by email) the terms of
reference and draft final report. The panel will be composed of professionals with
experience in school feeding, nutrition and (possibly) social safety nets/social protection.
4.C. Phases and Deliverables
50. The evaluation will take place in five phases, summarized in Table 3 below.
(i) Design phase is to establish and agree on the terms of reference, identify
the evaluation team leader and team members, establish the reference group
and peer review panel, and compile background information for easy access of
the evaluation team during the next phase. The Evalaution Office will provide
team members with an e-library of relevant documents. During this phase the
team leader will work with the consultants responsible for conducting tracer
studies on design so that these can begin early;
(ii) Inception phase is for the evaluation team to arrive at a common
understanding of the terms of reference, develop an evaluation matrix, decide
on the methodologies to be used during the evaluation and site selection for
field work, assign division of responsibilities in the team and determine the
logistics arrangements for field work and the timetable for delivery of the
evaluation report. This will be captured in a brief inception report;
12
(iii) Evaluation phase is to compile the evidence from documents and f ield work.
This phase will take place in two parts: first, desk review in preparation for
fieldwork, so that the evaluation team goes to the field as prepared as
possible; and, second, field visits that will entail discussions with stakeholders
in capitals, at sub-national levels, and at community/school/and household
levels;
(iv) Reporting phase is to present the findings of the evaluation in a concise and
well-substantiated evaluation report, including the quality assurance process.
The team will share the draft report with stakeholders for comments, and
revise the report in as much as comments are justified. Key findings and
evidence may be presented at a national school feeding strategy workshop,
facilitated by WFP/OEDP and currently planned for October/November 2009.
Review by the Peer Review panel will follow. After that, WFP requires one full
evaluation report and one Executive Board summary report (maximum 5000
words).
(v) Presentation to the WFP Executive Board and follow-up, with the
purpose of reacting to and implementing recommendations that the
evaluation will make.
Table 3: Phases and Deliverables for the Evaluation
Phase Timing Expected Outputs
1. Design Phase April-June 2009 Terms of Reference
Preparatory mission End May 2009 Improved draft of TOR Background data collected Consultants for tracer studies identified
Team selection & availability Mid May to mid July Team assembled
Design of tracer study June-mid-July Tracer study design complete
2. Inception Phase 15-31 July Commencement of tracer studies Inception Report
3. Evaluation Phase
Desk review & preparation work
August Report of literature review Logistical plan for field visits
Tracer impact study 15 July-September Report of tracer study
Field work September Overall debriefing
4. Reporting Phase October –November
Evaluation Report (Draft) Comments Matrix EB Summary Report (Draft) Comments Matrix
(possibly) National school feeding workshop
November 2009 Presentation of key findings and evidence
December 2009 Evaluation Report (final) EB Summary Report (final)
5. Executive Board and Follow-up
June 2010 Presentation of EB Summary Report Management Response Follow-up Actions
Notes: schools are closed from 1/8/09 to 2/9/09 WFP-Kenya logistics fully occupied in August
5. Organisation of the evaluation
5.A. Expertise of the Evaluation Team
51. The team leader for the evaluation requires strong evaluation and leadership skills
and technical expertise in one of the technical areas listed below. His/her primary
responsibilities will be (a) setting out the methodology and approach in the inception
report; (b) guiding and managing the team during the evaluation phase and overseeing
the preparation of working papers and tracer studies; (c) consolidating team members‘
inputs to the evaluation products; (d) representing the evaluation team in meetings with
stakeholders; (e) deliver the inception report, draft and final evaluation report, and draft
13
and final Executive Board summary report in line with agreed OEDE standards (EQAS)
and agreed timelines. The full job description is provided separately.
52. The evaluation team members will bring together a complementary combination of
technical expertise in the fields of education, nutrition, social safety nets, food security,
economics (for analysis of cost-effectiveness of different modalities and proportionality of
costs of school feeding in relation to other education sector investments) and gender.
The team leader will be internationally recruited. The remaining team members will be a
mix of international and national recruitment. The blend of technical areas across the
team will depend on that of the team leader first. At least one team member should be
familiar with WFP‘s work in general.
53. The evaluation team members will contribute to the design of the evaluation
methodology in their area of expertise; undertake documentary review prior to
fieldwork, conduct field work to generate additional evidence from a cross-section of
stakeholders, including carrying out site visits, as necessary to collect information;
participate in team meetings, including with stakeholders; prepare inputs in their
technical area for the evaluation products; and contribute to the preparation of the
evaluation report. The full job description is provided separately.
54. A Kenyan consultancy/research organization will be contracted to undertake the
(tracer) impact studies.
55. All members of the evaluation team will abide by the Code of Conduct for evaluators
(attached to individual contracts), ensuring they maintain impartiality and
professionalism.
56. Research support will be provided to collect, compile, and undertake basic data
analysis as requested by the evaluation team leader and evaluation manager. During the
Inception Phase the extent to which this should be provided in WFP Kenya Country Office
or at WFP headquarters will be defined.
5.B. Roles and Responsibilities
57. Reference Group. The evaluation will set up an advisory reference group composed
of WFP stakeholders (from school feeding units in the Policy and Programme Support
Divisions, the regional bureau and key staff in the country office) and key partners in
programme implementation. The purpose of the reference group is to serve as a
sounding board for early feedback on key evaluation products (e.g. the TOR and
evaluation report). The evaluation process, to be presented in the inception report, will
contain milestones for appropriate interaction.
58. WFP Country Office will also (i) provide access to information that is necessary to
prepare and conduct the evaluation; (ii) be available to the evaluation team to discuss
all aspects of the school feeding programme that the evaluation team considers relevant;
(iii) facilitate the evaluation team‘s contacts with stakeholders; (iv) contract Kenyan
consultants selected by OEDE for the evaluation team and/or to conduct tracer studies,
who will report to the Team Leader and OEDE; and (v) arrange in-Kenya meetings and
field visits, and provide logistical support during the fieldwork.
59. WFP HQ and Regional Bureau staff will also be available for discussion with the
evaluation team and provide information.
60. Peer Review Panel. A small peer review panel of recognised experts in the field
(three members) will provide the evaluation team and evaluation manager with feedback
on the evaluation products in terms of their technical validity and soundness. The Panel‘s
views will also be shared with the reference group to assure these stakeholders of the
technical credibility of the evaluation.
61. Evaluation Manager. The evaluation will be managed by Sally Burrows, Senior
Evaluation Officer in the Office of Evaluation (OEDE) of WFP. The evaluation team leader
14
reports to the evaluation manager, who has the following responsibilities: (a) manage
the process of sharing the draft terms of reference with stakeholders to obtain
comments and revise the terms of reference; (b) identify and recruit the evaluation team
leader and in consultation with him/her identify and recruit evaluation team members;
(c) identify and set up the reference group and peer review panel; (d) organize all
communications between the evaluation team and other stakeholde rs (WFP, peer review
panel, reference group, etc.); (e) supervise the research analyst in collecting and
organizing documentation from within and outside WFP and make this information
available to the evaluation team in an organized way; (f) review and exe rcise first level
quality assurance on the evaluation products (inception report, tracer impact study
reports, evaluation, and EB summary report); (g) manage the evaluation within the
given budget and time.
62. Director, OEDE. The evaluation manager reports directly to the Director, OEDE, who
will provide second level quality assurance and guidance on evaluation or technical
issues, as required.
5.C. Communication
63. The evaluation will ensure communications at several milestones in the form of
distributing and discussing: (a) the draft terms of reference; (b) the draft inception
report; (b) brief ing for the WFP Country Office and key partners at the beginning and
end the fieldwork; (c) presentation of findings at the Kenya school feeding strategy
workshop of stakeholders; (d) the evaluation report. In addition, the evaluation results
will be incorporated into OEDE‘s new lessons‘ sharing system, once it is established (to
come on-stream in 2009) to ensure lessons will be accessible to users in and outside
WFP.
5.D. Budget
64. The evaluation will be funded from OEDE‘s Programme Support Budget. The overall
budget figure is US$200,000. Details are in development pending final agreement on
methodology, including tracer study of impact.
15
Annex 1 Map of Districts under WFP School Feeding Programme, 2007
16
Annex 2 Map of Kenya Food Security, 2007
17
Annex 3 Average Percentage Malnutrition Levels (<135 mm), July 2002-2006
18
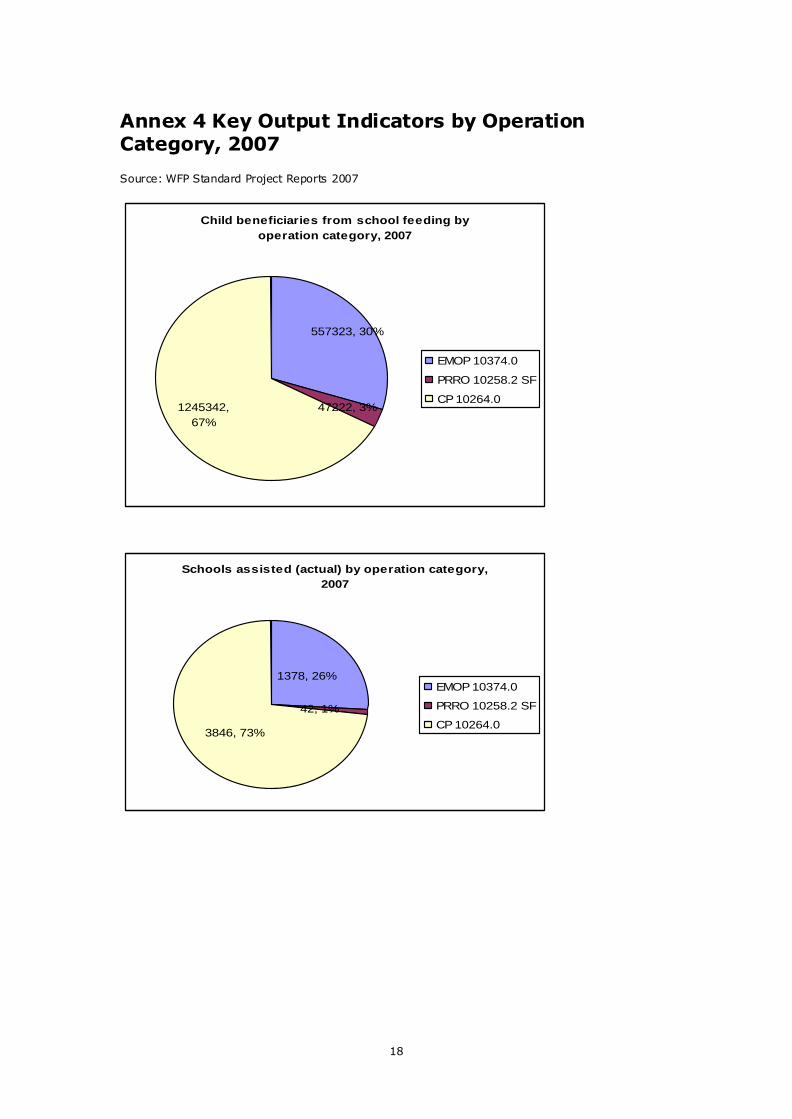
Annex 4 Key Output Indicators by Operation Category, 2007 Source: WFP Standard Project Reports 2007
Child beneficiaries from school feeding by
operation category, 2007
557323, 30%
47222, 3%1245342,
67%
EMOP 10374.0
PRRO 10258.2 SF
CP 10264.0
Schools assisted (actual) by operation category,
2007
1378, 26%
42, 1%
3846, 73%
EMOP 10374.0
PRRO 10258.2 SF
CP 10264.0
19
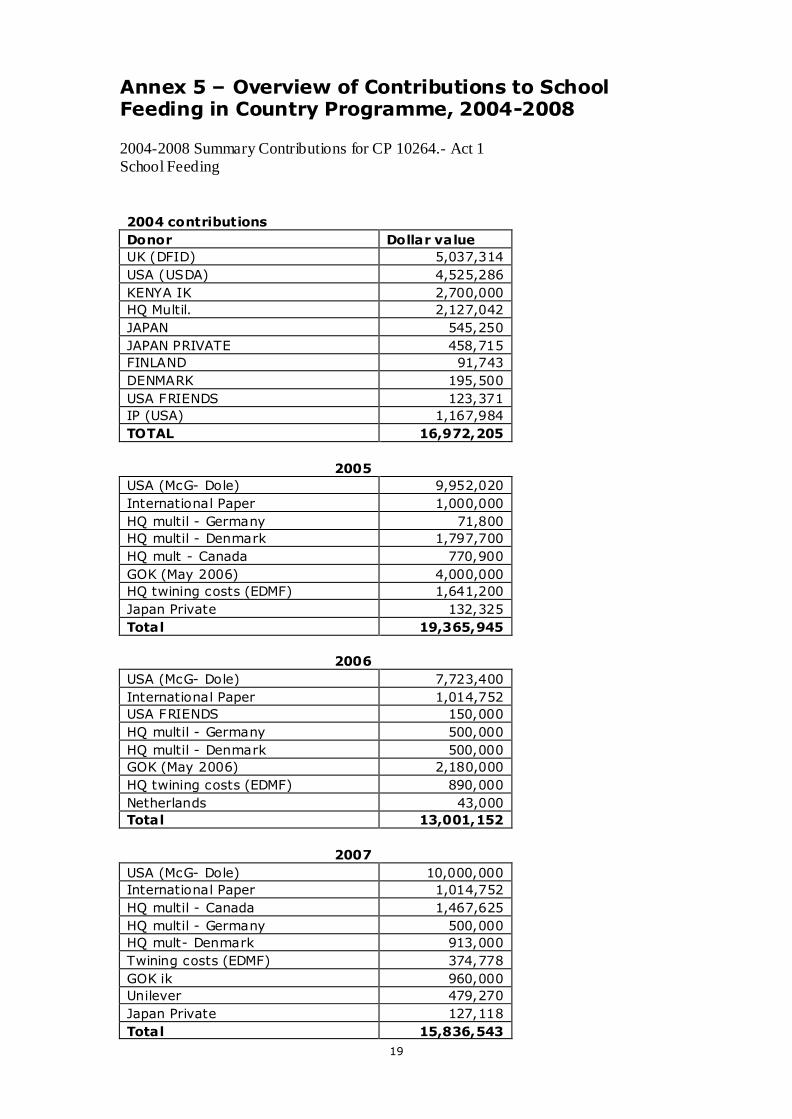
Annex 5 – Overview of Contributions to School Feeding in Country Programme, 2004-2008
2004-2008 Summary Contributions for CP 10264.- Act 1 School Feeding
2004 contributions
Donor Dollar value
UK (DFID) 5,037,314
USA (USDA) 4,525,286
KENYA IK 2,700,000
HQ Multil. 2,127,042
JAPAN 545,250
JAPAN PRIVATE 458,715
FINLAND 91,743
DENMARK 195,500
USA FRIENDS 123,371
IP (USA) 1,167,984
TOTAL 16,972,205
2005
USA (McG- Dole) 9,952,020
International Paper 1,000,000
HQ multil - Germany 71,800
HQ multil - Denmark 1,797,700
HQ mult - Canada 770,900
GOK (May 2006) 4,000,000
HQ twining costs (EDMF) 1,641,200
Japan Private 132,325
Total 19,365,945
2006
USA (McG- Dole) 7,723,400
International Paper 1,014,752
USA FRIENDS 150,000
HQ multil - Germany 500,000
HQ multil - Denmark 500,000
GOK (May 2006) 2,180,000
HQ twining costs (EDMF) 890,000
Netherlands 43,000
Total 13,001,152
2007
USA (McG- Dole) 10,000,000
International Paper 1,014,752
HQ multil - Canada 1,467,625
HQ multil - Germany 500,000
HQ mult- Denmark 913,000
Twining costs (EDMF) 374,778
GOK ik 960,000
Unilever 479,270
Japan Private 127,118
Total 15,836,543
20
2008
USA (McGovern-Dole) 10,000,000
International Paper 900,249
GOK ik 807,000
Twining costs 178,787
Unilever 651,435
Unilever 172,074
Saudi 1st EMMA 5,609,229
Saudi 2nd EMMA 958,649
Private (Drue Barrymore) 500,000
Private (Japan Assoc) 95,239
Total 19,872,662
21
Annex B. Team Profile
Impact Evaluation of WFP’s Work on School Feeding in Kenya (1999-
2008)
TEAM LEADER - Dr. Tim Finan, TANGO International
Tim Finan is the Director of the Bureau of Applied Research in Anthropology
(BARA) and Research Professor at the Department of Anthropology at the
University of Arizona, USA. He received a M.A. in Cultural Anthropology and a
PhD in Cultural Anthropology and Agricultural Economics from the University of
Arizona. Dr.Finan has more than 30 years of experience in food and livelihood
security analysis, poverty assessment, climate-society interactions, global
change, project and program analysis, community-based natural resource
management, and policy analysis. In 2008/9, Dr.Finan led a global assessment of
the impact and potential of the World Vision School Feeding Program. He is a
highly qualif ied specialist in quantitative and qualitative research, including
survey research and participatory methods. Dr. Finan has conducted extensive
research, written numerous publications and performed several consultancies for
organizations such as WFP and CARE. He performs regular services with TANGO
International. He has experience in Anglophone, Lusophone and Francophone
Africa, Brazil, Latin America, Portugal, Saudi Arabia and Bangladesh. He is fluent
in English and Portuguese, and has good knowledge of French, Spanish, and Cape
Verdean Creole.
Economist/Evaluation Specialist - Mr. Arif Rashid, TANGO International
Mr. Rashid is a Specialist in Development Economics at TANGO International Inc.
He holds Masters Degrees in Agricultural and Resource Economics from the
University of Arizona and in Social Welfare from the University of Dhaka,
Bangladesh. He also holds a Certif icate in General Management from the America
Management Association. Mr.Rashid has served a consultant to more than 15 UN
agencies and international NGO‘s. Before joining TANGO International, Mr. Rashid
led the livelihoods programming initiatives in CARE Bangladesh. He was the
Senior Livelihoods Advisor to CARE Bangladesh and has over 15 years of
experience in international development including the areas of food and livelihood
security, monitoring and evaluation and social protection programs. Mr. Rashid
evaluated the World Vision School Feeding Program in Uganda (2008) and
participated in WFP Egypt School Feeding Programme Review (2006). He also
developed a socio-economic prof ile for the WFP priority target populations and
regions in Bangladesh and assisted the C-Safe program in Zimbabwe to develop
the targeting strategy for a safety net program in urban and rural areas. Mr.
Rashid has worked in 16 countries in Asia and Africa and speaks English, Bengali
and Hindi. He has successfully used a mixed method approach in a number of
countries.
Education Specialist – Dr.Birgitte Woel, QM-Consult
Dr.Woel is an educationalist and specialist in planning monitoring and evaluation
methodologies. She holds Bachelor degrees in teaching, educational psychology
and personnel administration and a diploma in adult education. She rec eived her
Ph.D. for developing a rapid, participatory impact assessment methodology.
Dr.Woel has over 30 years of experience developing, presenting and
implementing non-traditional projects in Denmark and Africa She has worked on
the entire project cycle: feasibility studies, needs‘ assessments, project
management, progress reporting and M&E, and evaluation. She is the founder of
QM-Consult, registered in Kenya since 2002. Clients have included a variety of
multilateral and bilateral agencies and international NGO‘s with recent
assignments focusing on children, education and nutrition/health status. Apart
from the consulting f irm, the QM-group consists of two NGOs, working on
combating child labour in Kenya and rehabilitation of vulnerable youth in
22
Southern Sudan. Dr.Woel is resident in Kenya and has conducted numerous
short- and long-term consultancies in East and West Africa.
Nutrition Specialist – Dr.Sophie Ochola
Since 1997, Dr.Ochola has been a consultant and University Lecturer at Kenyatta
University, Department of Nutrition. She holds a Masters degree in Applied
Human Nutrtion and a Ph.D. Dr. Ochola‘s experience as a researcher and lecturer
at Kenyatta University has covered community nutrition problem diagnosis and
assessment, community nutrition surveillance and interventions, nutrition in
emergencies, food security, nutrition education, programme design and
evaluation, and nutrition and HIV/Aids. She has worked on project design and
evaluation, nutrition surveys, trainer in Knowledge, Practice and Coverage (KPC)
and KAP surveys, and data analysis. Dr.Ochola has used both quantitative and
qualitative research methodologies and has extensive experience in the use of
participatory methodologies PRA/PLA in appraising and evaluating community
programs. She has conducted consultancy assignments for a wide range of
mulitalteral and bilateral agencies and international NGO‘s. Dr.Ochola has
presented papers and research reports at various fora, published numerous books
and papers on nutrition and written many high quality technical reports.
Tracer Study Leader – Rutere Salome, Ronto Investment Company
Rutere Salome is the Director of Ronto Investment Company and a part -time
lecturer in Sociology at the University of Nairobi. She has a Masters in Sociology
and over 10 years of development experience in a number of African countries.
She has managed a range of research, baseline surveys, assessments and
evaluation efforts in the areas of food and agriculture, health, education, media,
gender, and labour (including child labour). Ms Salome has participated in three
previous tracer studies, including as Project Manager. Ms. Salome has consulted
for UN, NGO and government agencies. She has also taught gender and
development and research methods at the Catholic Unive rsity of Eastern Africa.
Ronto Investment Company (RIC) was established and registered as a Kenyan
company in 2005, specialising in training and social and market research in
Africa. It has extensive geographical and local knowledge, which aids fieldwork.
23
Annex C. Specific References
Acacia Consultants (2008) Baseline Study on Knowledge, Attitudes, Practices on
Nutrition, Health and Hygiene and Use of Traditional Communication Channels
Among Selected Primary School Pupils in Kenya. WFP-Unilever Partnership
Adelman, S.W.,Alderman, H., Gilligan, D.O., and Lehrer, K. (2008) The Impact of
Alternative Food for Education Programs on Learning Achievement and Cognitive
Development in Northern Uganda. Washington, D.C. The International Food Policy
Research Institute
Sarah W. Adelman, Daniel O. Gilligan, and Kim Lehrer (2008) How Effective are Food for Education Programs? A Critical Assessment of the Evidence from Developing Countries.
Food Policy Review 9. International Food Policy Research Institute. Washington, D.C.
Bundy, Donald, C. Burbano, M. Grosh, A. Gelli, M. Jukes, and L. Drake (2009)
Rethinking School Feeding: Social Safety Nets, Child Development, and the
Educational Sector. The World Bank. Washington, D.C.
Colclough Christopher, P. Rose and M. Tembon (2000), Gender inequalities in
primary schooling: The roles of poverty and adverse cultural practice.
International Journal of Educational Development 20 (1): 5-27
DFID (2007) School Feeding in Kenya. Situational Analysis on the Current Context
and Developments in Related Areas of Ovcs, Social Protection and Emergencies
Policy and Environment In Kenya and Elsewhere. Prepared by Matix Consultants,
Nairobi
Finan, T.J. (2008) Food for Education and Enhanced Development: An
assessment of school feeding programs: programming food for development.
World Vision International, FPMG, Johannesburg
Gertler, P., H. Patrinos, and M. Rubio-Codina (2006) Empowering parents to
improve education: evidence from rural Mexcio. World Bank Policy Research
Working Paper 3935. Washington, D.C.
Government of Kenya (2008) First Medium-Term Plan (2008-12). Kenya
Vision/2030. Nairobi
Kristjansson EA, Robinson V, Petticrew M, MacDonald B, Krasevec J, Janzen L,
Greenhalgh T, Wells G, MacGowan J, Farmer A, Shea BJ, Mayhew A, T ugwell P
(2007) School feeding for improving the physical and psychosocial health of
disadvantaged elementary school children (Review) The Cochrane Collaboration.
John Wiley & Sons, Ltd
Miller Del Rosso, J. (1999) School Feeding Programs: Improving effectiveness and
increasing the benefit to education. A Guide for Program Managers. The
Partnership for Child Development
Miller del Rosso, Joyce (2009) School Feeding Outcomes: What the Research Tells
Us. Internal report to World Food Programme, Rome.
Ministry of Education, Science and Technology (2005) Kenya Education Sector
Support Program (2005-10), Nairobi
Ministry of Public Health and Sanitation/Ministry of Education (2008) Reporton
Primary Schools Health Survey: Northeastern Province. Nairobi
24
Ministry of Public Health and Sanitation/Ministry of Education (2009) National
School Health Policy. Nairobi
UNDAF (1998) KENYA (1999-2003)
UNDAF (2003) KENYA (2004-2008)
UNDP, (2009), Human Development Report 2009. Overcoming Barriers: Human
Mobility and Development. New York: The United Nations Development Program.
USDA-FAS (2009) Assessment of Local Production for School Feeding in Kenya.
USDA Foreign Agricultural Service. Office of Capacity Building and Development. Washington, D.C.
World Bank (2009) World Development Report. Reshaping Economic Geography. Washington, D.C.: The World Bank
World Education Forum (2000) The Dakar Framework for Action. Education for
All: meeting our collective commitments. Dakar, Senegal
The World Food Programme:
1998 Country Programme (1999-2003): CP 10009.0 Rome
2002 Summary Report of the Mid-Term Evaluation of Country
Programme—Kenya (1999–2003)
2002 Country Strategy Outline—Kenya
2003 Country Programme (2004-08): CP 10264.0 Rome
2004 Emergency Operation 10374. Rome
2006 Food for Education. Experts Seminar. Reviewing the evidence.
Rome
2008 Country Programme (2009-13): CP 10668.0 Project document
2008 WFP Strategic Plan (2008-11). Rome
2008 WFP Kenya School Feeding. 2008 School Feeding Baseline Survey.
Nairobi
2008 Evaluation of Kenya Emergency Operation 10374.0 and Country
Programme 10264.0 (2004-2008), OEDE, Rome
2009 WFP School Feeding Policy. Rome
2009 Home-Grown School Feeding Program: a Framework to Link School
Feeding with Local Production. Rome
2000-2008 Standard Project Reports (annual) for relevant EMOP and CP
activities
25
Annex D. Details on the Methodology
D.1 Evaluation Matrix
D.2 Survey Instruments
26
Annex D.1 Evaluation Matrix
Question/Issue Sub-Questions
Main Indicators
Information Sources
1. Related to MDG’s 1, 2 & 3, what impact has the WFP Kenya SFP program had on the following:
See official MDG indicators QUANT, QUAL, DB, DOC
a) student attendance at school and educational performance
To what extent does the presence of school meals attract and retain children in school?
To what extent do children in assisted schools remain there until completion?
attendance rates (by sex) completion rates (by sex)
DB, DOC (e.g. 2008 Baseline)
To what extent do children in assisted schools perform better?
examination scores (by sex) DB, QUANT, QUAL
To what extent do children who have graduated from assisted schools have higher educational achievement?
completion rates of schooling current livelihoods prestige in community
QUANT, QUAL
b) achievement of nutrition objectives To what extent does school feeding improve the nutritional status of children?
To what extent do SFP children have lower rates of illness?
level of daily kcal & protein intake by children receiving meals
quality and diversity of diet morbidity rates extent to which de-worming carried out
in schools
QUANT (HH), QUANT (student) DB
c) social safety nets: economic, food security or physical protection for the most vulnerable
To what extent does school feeding provide a food security benefit to the vulnerable household?
amount of food prepared for the household (when child is in school)
incidence of food sharing of school meal
QUANT (HH), QUAL (parents)
To what extent does the school meal provide an economic benefit to the vulnerable household?
SES of the household (when compared to those without meals)
time allocation patterns reduction in household expenditure patterns of household income
QUANT (HH), QUAL (parents of different income levels)
To what extent does school feeding reduce child labour>
level of child participation in household economy (intensity of tasks)
QUANT (HH), QUANT (Student), QUAL (parents)
What evidence of other unintended impacts/outcomes?
economic, cultural, social, environmental (e.g. increased use of firewood)
QUANT, QUAL
27
2. How have impacts and costs been affected by differences in:
Livelihood system What major differences in program implementation, impact and cost are due to nature of household livelihoods, including cultural variables?
costs of SFP by livelihood zone differences in educational, nutritional,
and social protection outcomes by livelihood
DOC (WFP), DB, QUANT (HH), QUAL (parents, NGOs, leaders)
Quality of school What school quality characteristics influence attendance, retention, and performance in schools with meals and how?
physical infrastructure of school quality of teaching staff type of school
QUANT (school), QUAL (SMC, children, parents), QUANT (HH)
Extra packages How is school feeding used as a platform for other interventions, such as de-worming, hygiene messages, etc.?
# of interventions from Essential Package QUANT (school)
Level of community involvement How active are the PTAs and the School Management Committees? How active are parents in the education of their children
level of participation in school activities QUANT (HH), QUAL (parents, SMC)
3. In what circumstances does school feeding appear to have given the best return on investment for WFP’s priority beneficiaries: the most food insecure in areas with the lowest NER for girls?
To what extent is SF a motivation to attend and stay in school, especially for girls?
What other factors influence the household decision to send children to school?
Why do parents not send some or all of their children to school?
percentage of school age children in school
economic trade-off between school and work (for children)
impact of cultural values level of security at the school costs of education to HH
QUANT (HH), QUAL (parents, SMC)
Is school feeding the most efficient means of obtaining the educational, nutritional, and livelihood protection goals?
cost per beneficiary compared cost of other interventions cost per additional school year
DOC, DB
4. To what extent have WFP’s targeting strategy & modalities for school feeding been aligned with GOK education policy priorities, the Kenya Joint Assistance Strategy & UNDAF
Is there a logical coherence with KESSP, KJAS and UNDAF? Are there clear areas of inconsistency?
DOC
To what extent have planned collaborations been implemented?
What main factors have influenced this?
extent of UNICEF/MOH de-worming Presences of WFP./UNICEF essential
package elements
QUANT (school)
28
5. In the context of the new policy directions (in Kenya & WFP), what changes might be required to the design of interventions to increase impact, effectiveness, and sustainability, tailor-made to the core target groups (including alternatives to the direct supply of food?)
How can SF policy and programs be better designed to meet the needs of households and to fit within the logic of household decision-making?
What non-SF interventions will strengthen the impact of school feeding in achieving the outcomes stated above?
What would be needed to enable that to happen?
What role can SF play in a broader, more livelihood development program?
Where are the potential sources of sustainability at the community level?
to be determined in the analysis rates of improvement in educational,
nutritional, social protection outcomes (see above)
QUANT, QUAL, DOC
6. (Expanded from original TOR): How is school feeding best integrated into the existing dynamics of household livelihood decision-making?
What is the nature of the linkage from school feeding to educational achievement to livelihood improvement?
What constraints inherent in the livelihood system reduce the likelihood of sending children to school
How can schools adjust to better serve local livelihood realities (e.g. mobile schools)?
What public policies can facilitate the integration of education into local livelihoods?
documented career paths for household ―graduates‖
economic differences in HHs with more educational achievement (more children entering and finishing school)
among the impoverished households, the value of child laboUr
cultural perceptions of the role of children and the appropriate pathways to adulthood (e.g. parental attitudes, awareness
QUANT, QUAL, DOC
Sources of Information: QUANT = quantitative survey (Household; Student, School); QUAL = Qualitative field visit;
DB = MOE/WFP data bases; DOC = Document Review
29
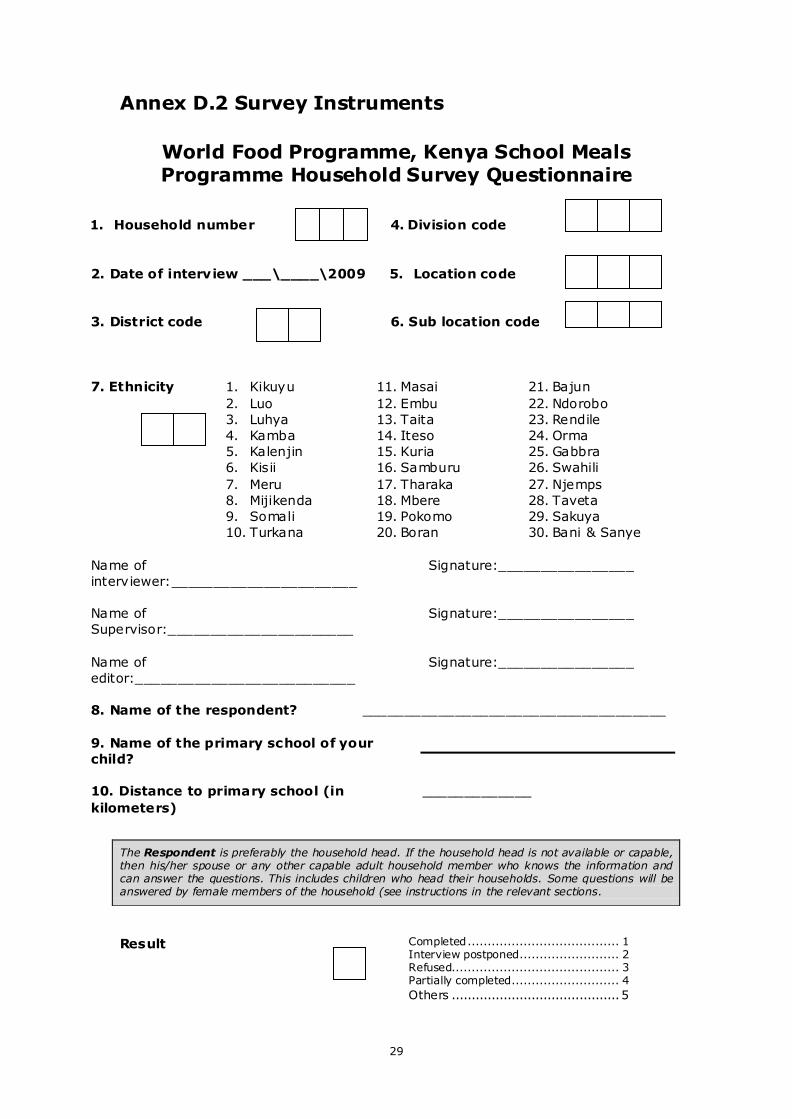
Annex D.2 Survey Instruments
World Food Programme, Kenya School Meals Programme Household Survey Questionnaire
1. Household number
4. Division code
2. Date of interview ___\____\2009
5. Location code
3. District code
6. Sub location code
7. Ethnicity 1. Kikuyu
2. Luo
3. Luhya
4. Kamba
5. Kalenjin
6. Kisii
7. Meru
8. Mijikenda
9. Somali
10. Turkana
11. Masai
12. Embu
13. Taita
14. Iteso
15. Kuria
16. Samburu
17. Tharaka
18. Mbere
19. Pokomo
20. Boran
21. Bajun
22. Ndorobo
23. Rendile
24. Orma
25. Gabbra
26. Swahili
27. Njemps
28. Taveta
29. Sakuya
30. Bani & Sanye
Name of
interviewer:______________________
Signature:________________
Name of
Supervisor:______________________
Signature:________________
Name of
editor:__________________________
Signature:________________
8. Name of the respondent?
____________________________________
9. Name of the primary school of your
child?
10. Distance to primary school (in
kilometers)
_____________
The Respondent is preferably the household head. If the household head is not available or capable, then his/her spouse or any other capable adult household member who knows the information and can answer the questions. This includes children who head their households. Some questions will be answered by female members of the household (see instructions in the relevant sections.
Result Completed ...................................... 1 Interview postponed ......................... 2 Refused.......................................... 3 Partially completed ........................... 4
Others .......................................... 5
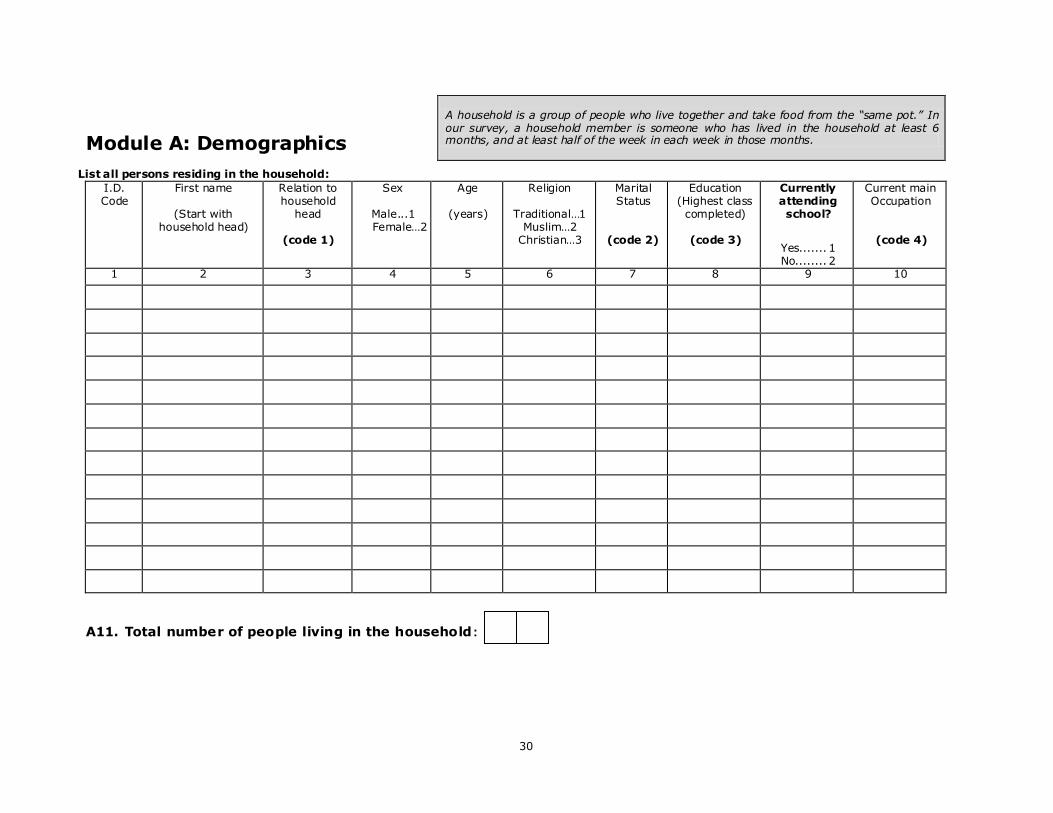
30
Module A: Demographics List all persons residing in the household:
I.D. Code
First name
(Start with household head)
Relation to household
head
(code 1)
Sex
Male...1 Female…2
Age
(years)
Religion
Traditional…1 Muslim…2
Christian…3
Marital Status
(code 2)
Education (Highest class
completed)
(code 3)
Currently attending school?
Yes....... 1 No........ 2
Current main Occupation
(code 4)
1 2 3 4 5 6 7 8 9 10
A11. Total number of people living in the household :
A household is a group of people who live together and take food from the “same pot.” In our survey, a household member is someone who has lived in the household at least 6 months, and at least half of the week in each week in those months.
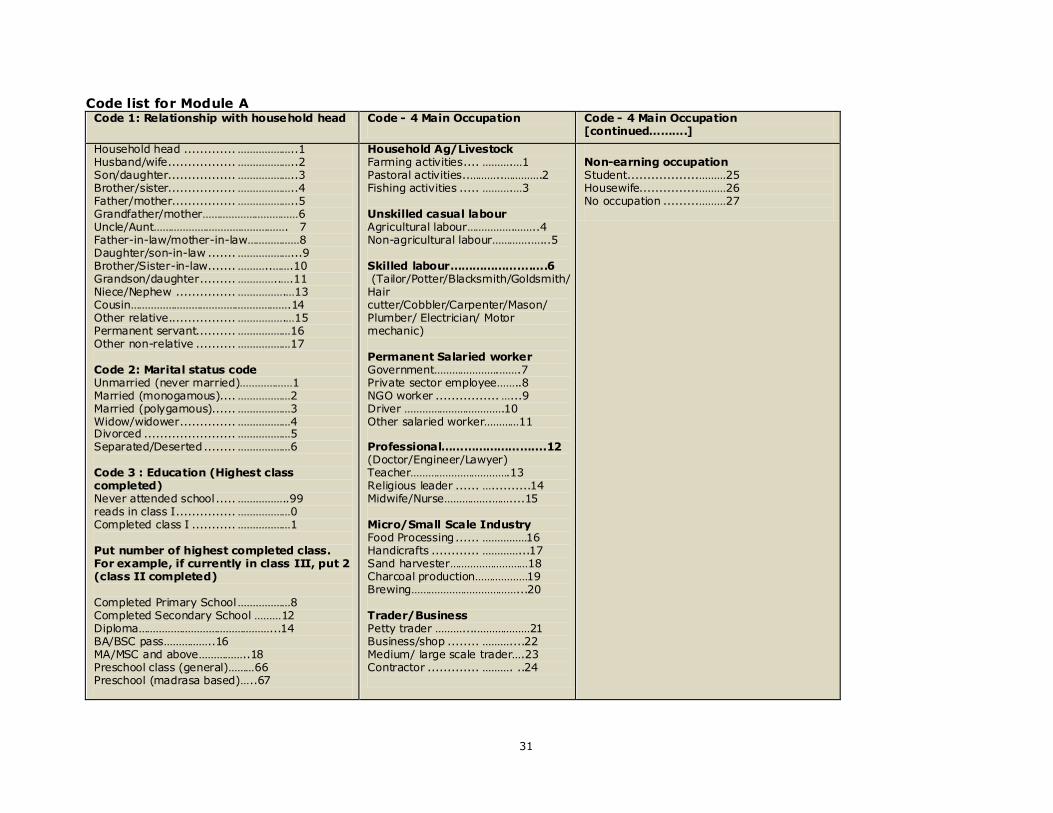
31
Code list for Module A Code 1: Relationship with household head Code - 4 Main Occupation
Code - 4 Main Occupation [continued……….]
Household head ............. ………………..1 Husband/wife ................. ………………..2 Son/daughter................. ………………..3 Brother/sister................. ………………..4 Father/mother................ ………………..5 Grandfather/mother……………………………6 Uncle/Aunt………………………………………. 7 Father-in-law/mother-in-law………………8 Daughter/son-in-law ....... ………………...9 Brother/Sister-in-law ....... ………..…….10 Grandson/daughter ......... …………..….11 Niece/Nephew ............... …………….…13 Cousin……………………………………………….14 Other relative................. …………….…15 Permanent servant.......... ………………16 Other non-relative .......... ………………17 Code 2: Marital status code Unmarried (never married)………………1 Married (monogamous).... ………………2 Married (polygamous)...... ………………3 Widow/widower .............. ………………4 Divorced ....................... ………………5 Separated/Deserted ........ ………………6 Code 3 : Education (Highest class completed) Never attended school ..... ……………..99 reads in class I ............... ………………0 Completed class I ........... ………………1 Put number of highest completed class. For example, if currently in class III, put 2 (class II completed) Completed Primary School ………………8 Completed Secondary School ………12 Diploma………………………………………...14 BA/BSC pass……………..16 MA/MSC and above……………..18 Preschool class (general)………66 Preschool (madrasa based)…..67
Household Ag/Livestock Farming activities .... ……….…1 Pastoral activities..………..………….2 Fishing activities ..... ……….…3 Unskilled casual labour Agricultural labour…………….……..4 Non-agricultural labour………….…...5 Skilled labour………………….….6 (Tailor/Potter/Blacksmith/Goldsmith/ Hair cutter/Cobbler/Carpenter/Mason/ Plumber/ Electrician/ Motor mechanic) Permanent Salaried worker Government………………….…….7 Private sector employee……..8 NGO worker ................ …...9 Driver …………………………….10 Other salaried worker…………11 Professional……………………....12 (Doctor/Engineer/Lawyer) Teacher…………………………….13 Religious leader ...... …..........14 Midwife/Nurse…………….……....15 Micro/Small Scale Industry Food Processing ...... ……………16 Handicrafts ............ …………...17 Sand harvester………………………18 Charcoal production………………19 Brewing………………………………...20 Trader/Business Petty trader ………....………………21 Business/shop ........ ………....22 Medium/ large scale trader….23 Contractor ............. ………. ..24
Non-earning occupation Student ..................………25 Housewife...............………26 No occupation .........………27
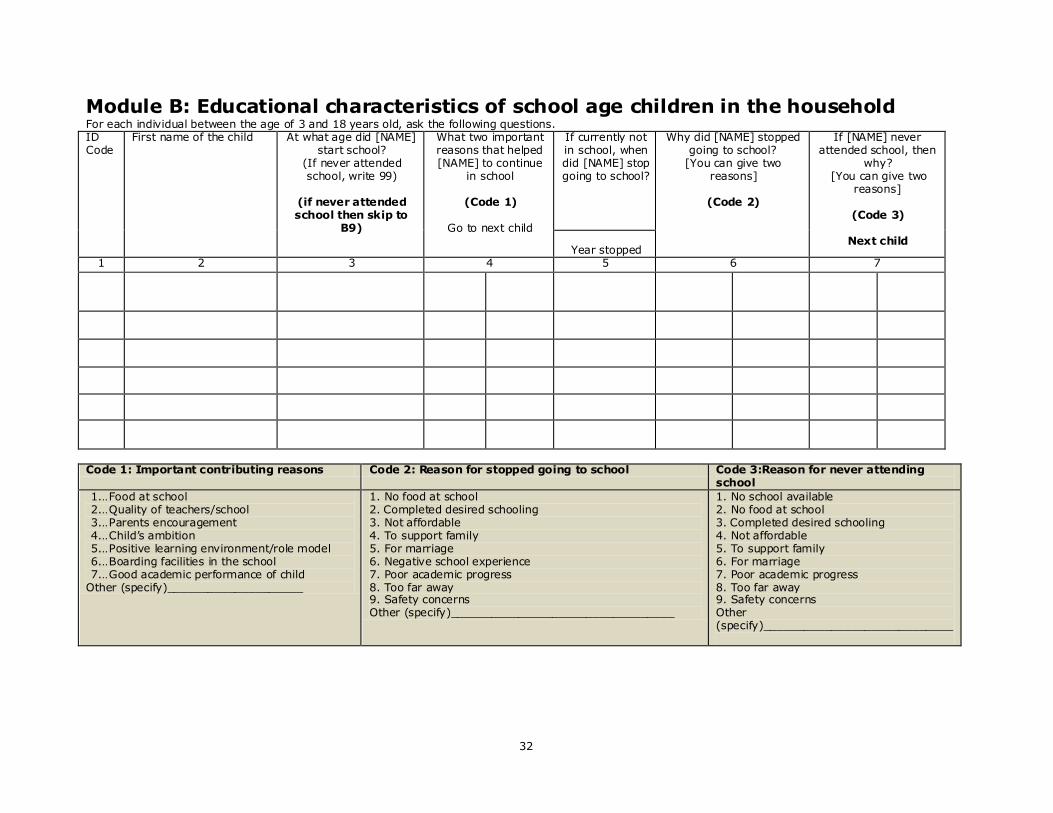
32
Module B: Educational characteristics of school age children in the household For each individual between the age of 3 and 18 years old, ask the following questions. ID Code
First name of the child At what age did [NAME] start school?
(If never attended school, write 99)
(if never attended school then skip to
B9)
What two important reasons that helped [NAME] to continue
in school
(Code 1)
Go to next child
If currently not in school, when did [NAME] stop going to school?
Why did [NAME] stopped going to school?
[You can give two reasons]
(Code 2)
If [NAME] never attended school, then
why? [You can give two
reasons]
(Code 3)
Next child Year stopped
1 2 3 4 5 6 7
Code 1: Important contributing reasons Code 2: Reason for stopped going to school Code 3:Reason for never attending school
1... Food at school 2... Quality of teachers/school 3... Parents encouragement 4... Child‘s ambition 5... Positive learning environment/role model 6... Boarding facilities in the school 7... Good academic performance of child
Other (specify)____________________
1. No food at school 2. Completed desired schooling 3. Not affordable 4. To support family 5. For marriage 6. Negative school experience 7. Poor academic progress 8. Too far away 9. Safety concerns Other (specify)_________________________________
1. No school available 2. No food at school 3. Completed desired schooling 4. Not affordable 5. To support family 6. For marriage 7. Poor academic progress 8. Too far away 9. Safety concerns Other (specify)____________________________
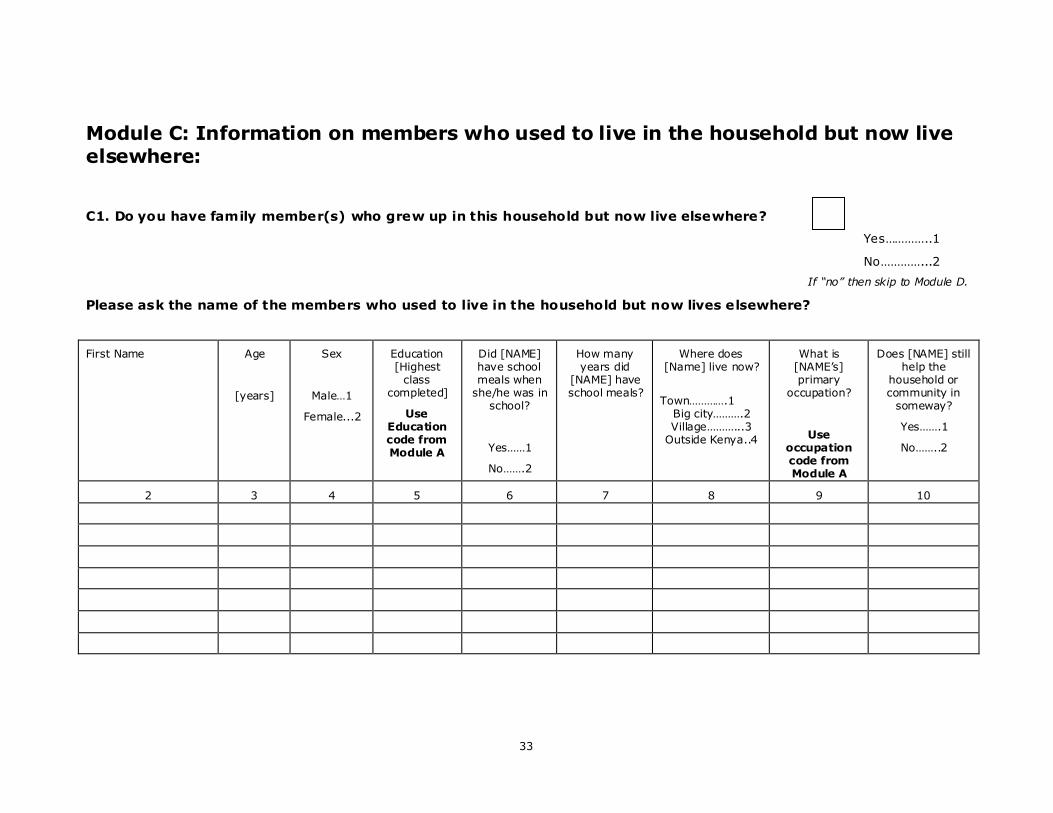
33
Module C: Information on members who used to live in the household but now live elsewhere:
If “no” then skip to Module D.
Please ask the name of the members who used to live in the household but now lives elsewhere?
First Name Age
[years]
Sex
Male…1
Female...2
Education [Highest
class completed]
Use Education code from Module A
Did [NAME] have school meals when
she/he was in school?
Yes……1
No…….2
How many years did
[NAME] have school meals?
Where does [Name] live now?
Town………….1
Big city……….2 Village………...3
Outside Kenya..4
What is [NAME‘s] primary
occupation?
Use occupation code from Module A
Does [NAME] still help the
household or community in
someway?
Yes…….1
No……..2
2 3 4 5 6 7 8 9 10
C1. Do you have family member(s) who grew up in this household but now live elsewhere?
Yes…………..1
No…………...2
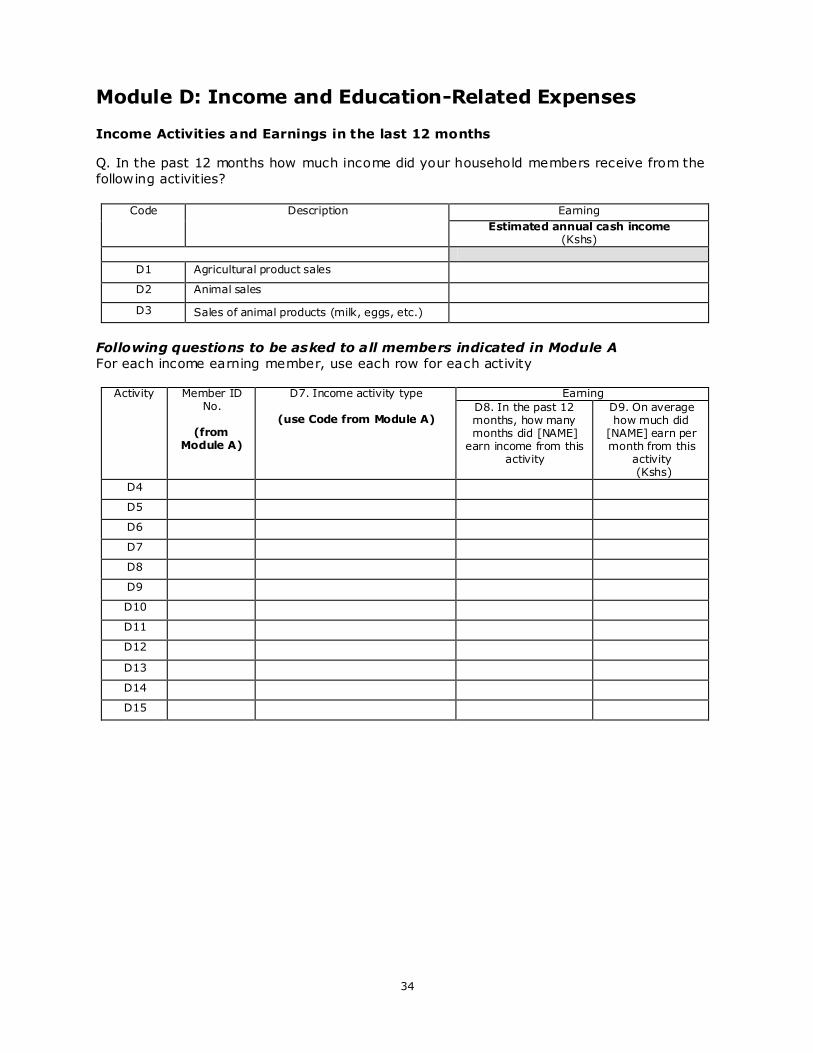
34
Module D: Income and Education-Related Expenses
Income Activities and Earnings in the last 12 months
Q. In the past 12 months how much income did your household members receive from the
following activities?
Code Description Earning
Estimated annual cash income (Kshs)
D1 Agricultural product sales
D2 Animal sales
D3 Sales of animal products (milk, eggs, etc.)
Following questions to be asked to all members indicated in Module A
For each income earning member, use each row for each activity
Activity Member ID No.
(from
Module A)
D7. Income activity type
(use Code from Module A)
Earning
D8. In the past 12 months, how many months did [NAME]
earn income from this activity
D9. On average how much did
[NAME] earn per month from this
activity (Kshs)
D4
D5
D6
D7
D8
D9
D10
D11
D12
D13
D14
D15
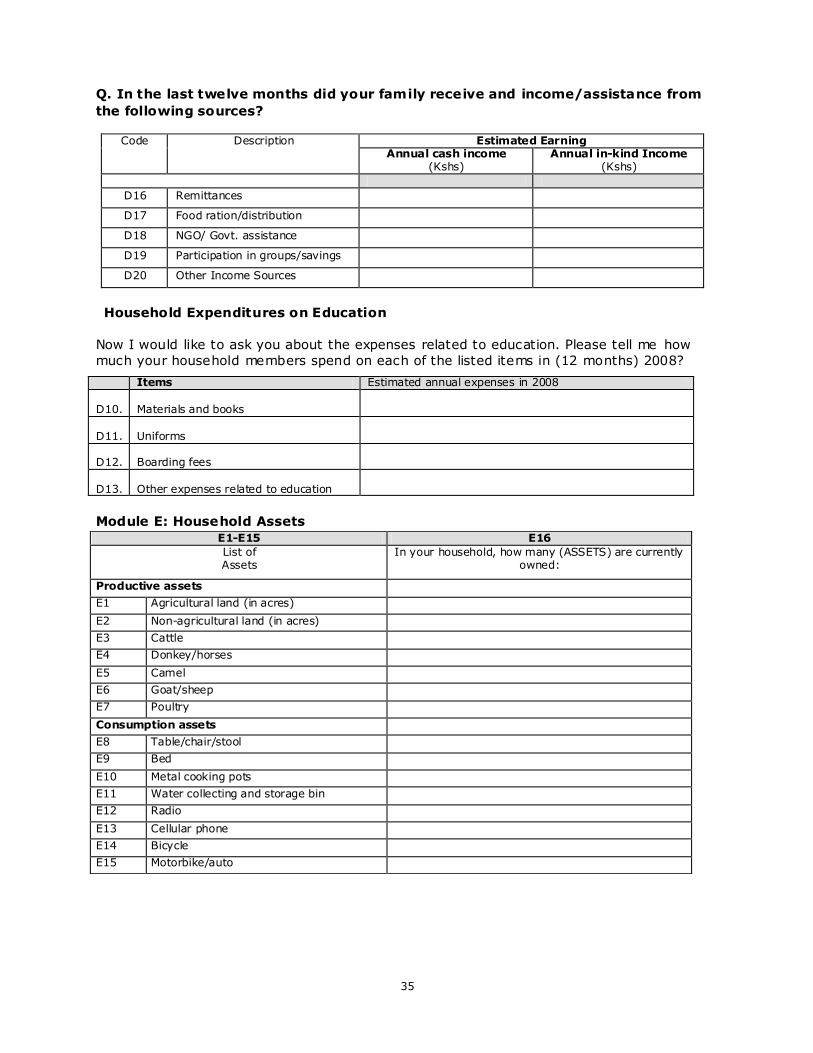
35
Q. In the last twelve months did your family receive and income/assistance from
the following sources?
Code Description Estimated Earning Annual cash income
(Kshs) Annual in-kind Income
(Kshs)
D16 Remittances
D17 Food ration/distribution
D18 NGO/ Govt. assistance
D19 Participation in groups/savings
D20 Other Income Sources
Household Expenditures on Education
Now I would like to ask you about the expenses related to education. Please tell me how
much your household members spend on each of the listed items in (12 months) 2008?
Module E: Household Assets
Items Estimated annual expenses in 2008
D10.
Materials and books
D11.
Uniforms
D12.
Boarding fees
D13.
Other expenses related to education
E1-E15 E16
List of Assets
In your household, how many (ASSETS) are currently owned:
Productive assets
E1 Agricultural land (in acres)
E2 Non-agricultural land (in acres)
E3 Cattle
E4 Donkey/horses
E5 Camel
E6 Goat/sheep
E7 Poultry
Consumption assets
E8 Table/chair/stool
E9 Bed
E10 Metal cooking pots
E11 Water collecting and storage bin
E12 Radio
E13 Cellular phone
E14 Bicycle
E15 Motorbike/auto
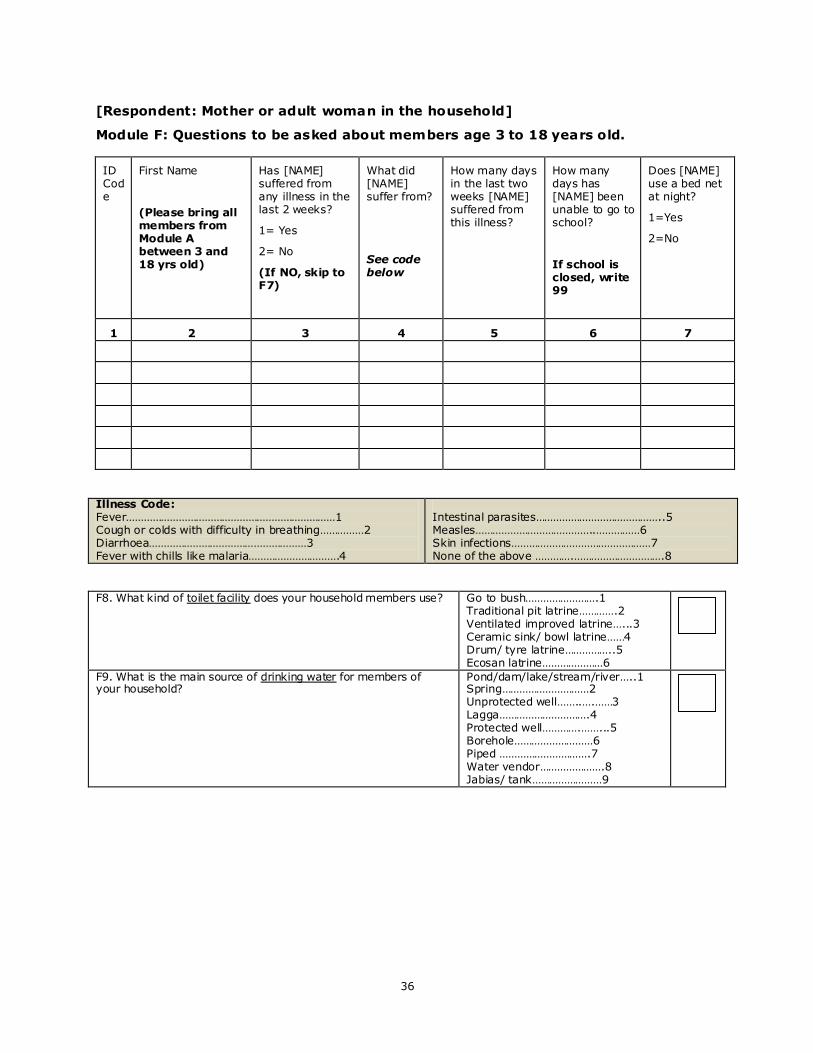
36
[Respondent: Mother or adult woman in the household]
Module F: Questions to be asked about members age 3 to 18 years old.
ID Code
First Name
(Please bring all members from Module A between 3 and 18 yrs old)
Has [NAME] suffered from any illness in the last 2 weeks?
1= Yes
2= No
(If NO, skip to F7)
What did [NAME] suffer from?
See code below
How many days in the last two weeks [NAME] suffered from this illness?
How many days has [NAME] been unable to go to school?
If school is closed, write 99
Does [NAME] use a bed net at night?
1=Yes
2=No
1 2 3 4 5 6 7
Illness Code: Fever………………………………………………………………1 Cough or colds with difficulty in breathing……………2 Diarrhoea………………………………………………3 Fever with chills like malaria………………………….4
Intestinal parasites……………………………………..5 Measles…………………………………..……………6 Skin infections…………………………………………7 None of the above ………….………………………….8
F8. What kind of toilet facility does your household members use? Go to bush…………………….1
Traditional pit latrine………….2 Ventilated improved latrine…...3 Ceramic sink/ bowl latrine……4 Drum/ tyre latrine……………..5 Ecosan latrine…………………6
F9. What is the main source of drinking water for members of your household?
Pond/dam/lake/stream/river…..1 Spring…………………………2 Unprotected well……..….……3 Lagga………………………….4 Protected well………….……...5 Borehole………………………6 Piped ………………………….7 Water vendor………………….8 Jabias/ tank……………………9
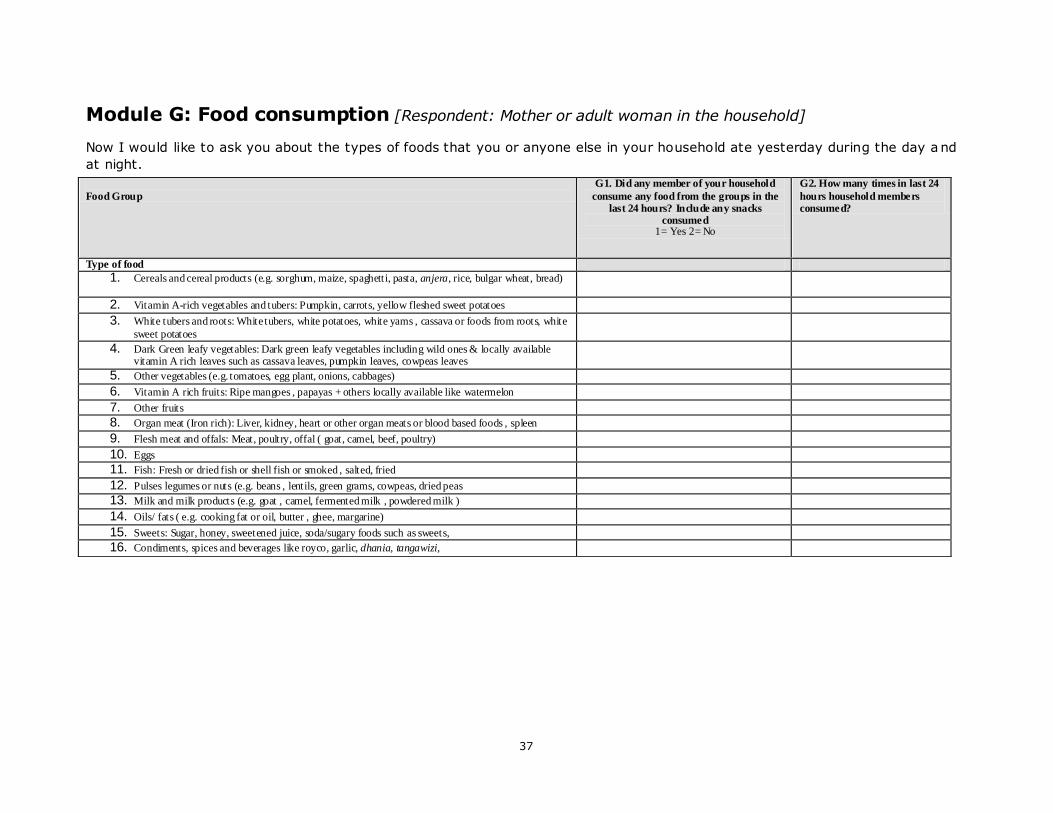
37
Module G: Food consumption [Respondent: Mother or adult woman in the household]
Now I would like to ask you about the types of foods that you or anyone else in your household ate yesterday during the day a nd
at night.
Food Group
G1. Did any member of your household
consume any food from the groups in the last 24 hours? Include any snacks
consumed 1= Yes 2= No
G2. How many times in last 24
hours household members consumed?
Type of food
1. Cereals and cereal products (e.g. sorghum, maize, spaghetti, pasta, anjera, rice, bulgar wheat, bread)
2. Vitamin A-rich vegetables and tubers: Pumpkin, carrots, yellow fleshed sweet potatoes
3. White tubers and roots: White tubers, white potatoes, white yams , cassava or foods from roots, white
sweet potatoes
4. Dark Green leafy vegetables: Dark green leafy vegetables including wild ones & locally available vitamin A rich leaves such as cassava leaves, pumpkin leaves, cowpeas leaves
5. Other vegetables (e.g. tomatoes, egg plant, onions, cabbages)
6. Vitamin A rich fruits: Ripe mangoes , papayas + others locally available like watermelon
7. Other fruits
8. Organ meat (Iron rich): Liver, kidney, heart or other organ meats or blood based foods , spleen
9. Flesh meat and offals: Meat, poultry, offal ( goat, camel, beef, poultry)
10. Eggs
11. Fish: Fresh or dried fish or shell fish or smoked , salted, fried
12. Pulses legumes or nuts (e.g. beans , lentils, green grams, cowpeas, dried peas
13. Milk and milk products (e.g. goat , camel, fermented milk , powdered milk )
14. Oils/ fats ( e.g. cooking fat or oil, butter , ghee, margarine)
15. Sweets: Sugar, honey, sweetened juice, soda/sugary foods such as sweets,
16. Condiments, spices and beverages like royco, garlic, dhania, tangawizi,
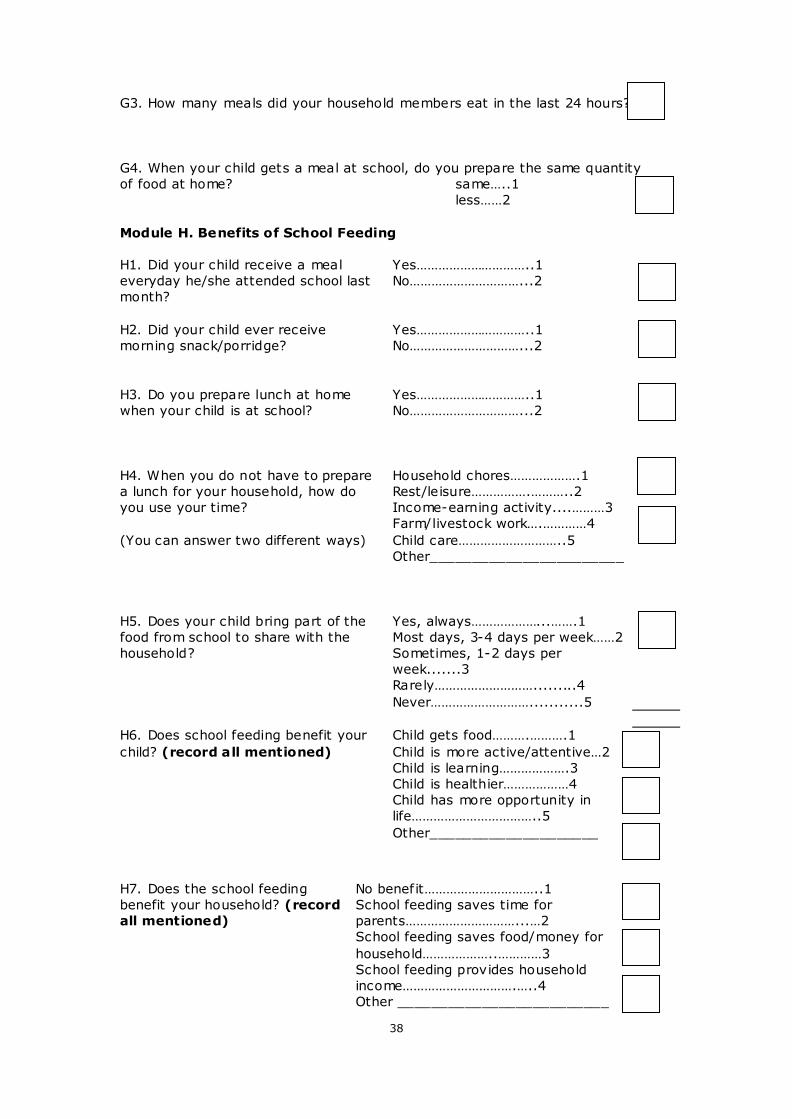
38
G3. How many meals did your household members eat in the last 24 hours?
G4. When your child gets a meal at school, do you prepare the same quantity
of food at home? same…..1
less……2
Module H. Benefits of School Feeding
H1. Did your child receive a meal
everyday he/she attended school last
month?
Yes…………………………..1
No…………………………...2
H2. Did your child ever receive
morning snack/porridge?
Yes…………………………..1
No…………………………...2
H3. Do you prepare lunch at home
when your child is at school?
Yes…………………………..1
No…………………………...2
H4. When you do not have to prepare
a lunch for your household, how do
you use your time?
(You can answer two different ways)
Household chores……………….1
Rest/leisure…………….………..2
Income-earning activity....………3
Farm/livestock work….…………4
Child care………………………..5
Other_______________________
H5. Does your child bring part of the
food from school to share with the
household?
Yes, always………………...…….1
Most days, 3-4 days per week……2
Sometimes, 1-2 days per
week.......3
Rarely……………………….........4
Never………………………...........5
H6. Does school feeding benefit your
child? (record all mentioned)
Child gets food……….……….1
Child is more active/attentive…2
Child is learning……………….3
Child is healthier………………4
Child has more opportunity in
life……………………………..5
Other____________________
H7. Does the school feeding
benefit your household? (record
all mentioned)
No benefit…………………………..1
School feeding saves time for
parents…………………………...…2
School feeding saves food/money for
household………………..…………3
School feeding provides household
income………………………….…..4
Other _________________________
39
Module I: Parents participation in the school
I1. Are you a member of the PTA or MC?
1 = yes
2 = No
I2. Do you participate in managing the school meal programme?
1 = yes
2 = No
I3. How many times did you visit the school last year? Number of
times
END OF SURVEY
THANK YOU SO MUCH!
H8. When your child eats at
school, do you spend less
money on food in household?
Same amount of money……………1
Less money………………………..2
Other____________________________
Do you sell anything to the
school for school meals?
(record all mentioned)
Firewood………………………….….1
Vegetables…………………………..2
Other food………………………....3
Labour…………………………………4
Water……………………………….…5
Other___________________
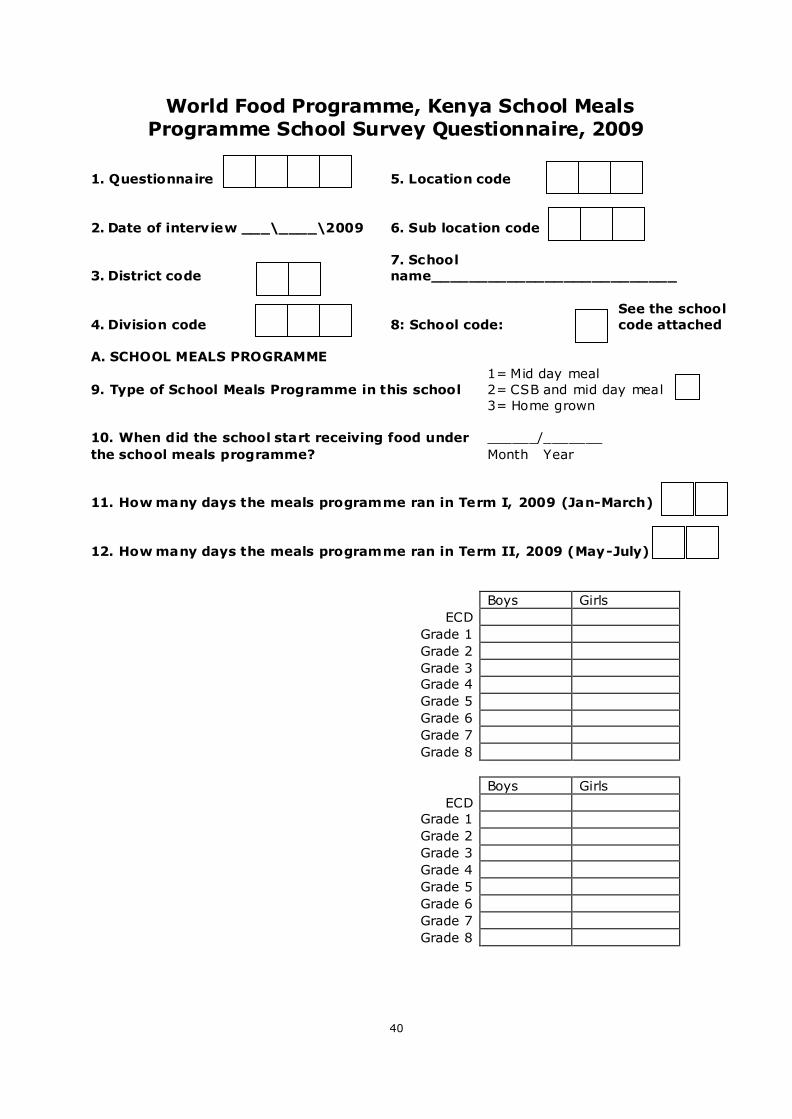
40
World Food Programme, Kenya School Meals Programme School Survey Questionnaire, 2009
1. Questionnaire
5. Location code
2. Date of interview ___\____\2009
6. Sub location code
3. District code
7. School
name__________________________
4. Division code
8: School code:
See the school
code attached
A. SCHOOL MEALS PROGRAMME
9. Type of School Meals Programme in this school
1= Mid day meal
2= CSB and mid day meal
3= Home grown
10. When did the school start receiving food under
the school meals programme?
______/_______
Month Year
11. How many days the meals programme ran in Term I, 2009 (Jan-March)
12. How many days the meals programme ran in Term II, 2009 (May-July)
Boys Girls
ECD
Grade 1
Grade 2
Grade 3
Grade 4
Grade 5
Grade 6
Grade 7
Grade 8
Boys Girls
ECD
Grade 1
Grade 2
Grade 3
Grade 4
Grade 5
Grade 6
Grade 7
Grade 8
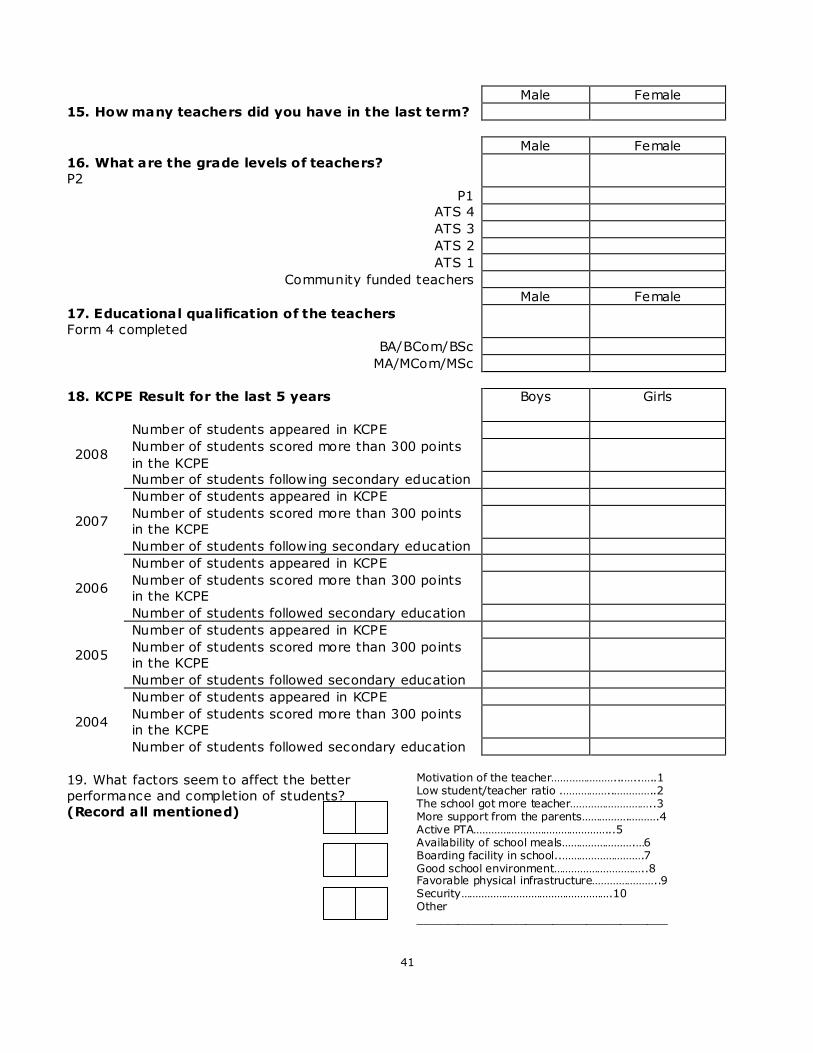
41
Male Female
15. How many teachers did you have in the last term?
Male Female
16. What are the grade levels of teachers?
P2
P1
ATS 4
ATS 3
ATS 2
ATS 1
Community funded teachers
Male Female
17. Educational qualification of the teachers
Form 4 completed
BA/BCom/BSc
MA/MCom/MSc
18. KCPE Result for the last 5 years
Boys Girls
2008
Number of students appeared in KCPE
Number of students scored more than 300 points
in the KCPE
Number of students following secondary education
2007
Number of students appeared in KCPE
Number of students scored more than 300 points
in the KCPE
Number of students following secondary education
2006
Number of students appeared in KCPE
Number of students scored more than 300 points
in the KCPE
Number of students followed secondary education
2005
Number of students appeared in KCPE
Number of students scored more than 300 points
in the KCPE
Number of students followed secondary education
2004
Number of students appeared in KCPE
Number of students scored more than 300 points
in the KCPE
Number of students followed secondary education
19. What factors seem to affect the better
performance and completion of students?
(Record all mentioned)
Motivation of the teacher…………………...…..…..1 Low student/teacher ratio .……………..…………..2 The school got more teacher………………………..3 More support from the parents…………….……….4 Active PTA………………………………………...5 Availability of school meals…………………….…6 Boarding facility in school..……………………….7 Good school environment…………………………..8 Favorable physical infrastructure…………………..9 Security…………………………………………….10 Other _____________________________________
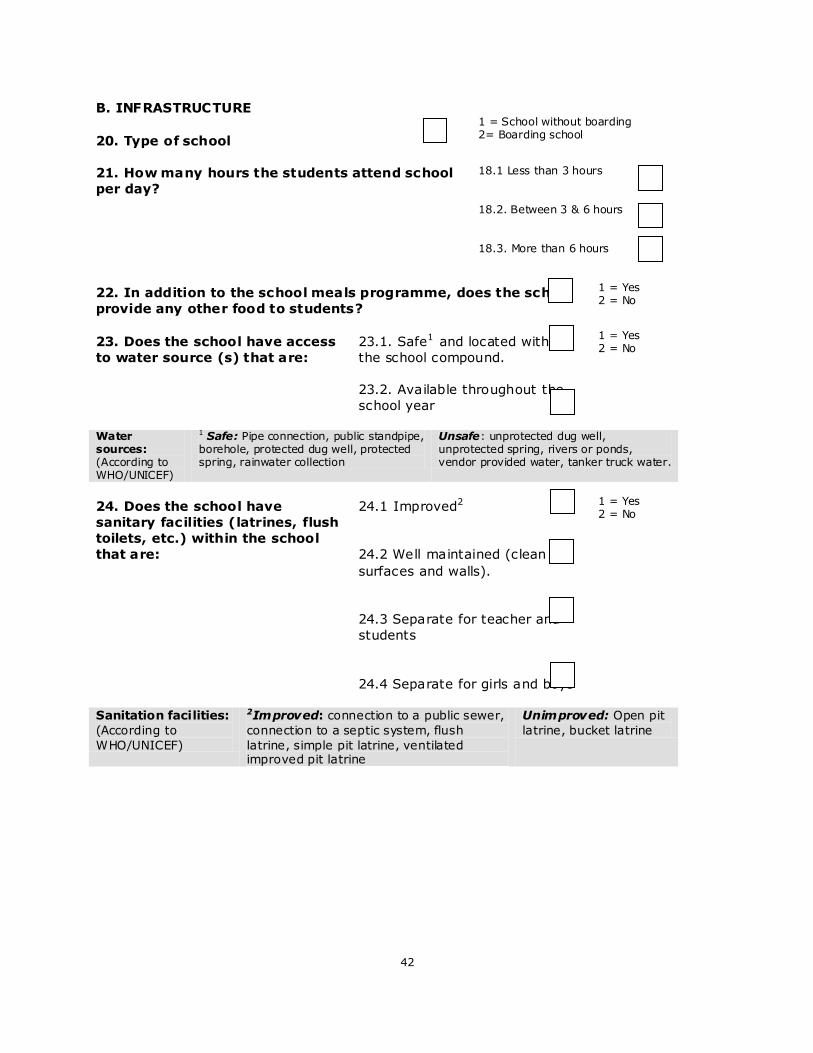
42
B. INFRASTRUCTURE
20. Type of school
1 = School without boarding 2= Boarding school
21. How many hours the students attend school
per day?
18.1 Less than 3 hours 18.2. Between 3 & 6 hours 18.3. More than 6 hours
22. In addition to the school meals programme, does the school
provide any other food to students?
1 = Yes 2 = No
23. Does the school have access
to water source (s) that are:
23.1. Safe1 and located within
the school compound.
23.2. Available throughout the
school year
1 = Yes 2 = No
Water sources: (According to WHO/UNICEF)
1 Safe: Pipe connection, public standpipe, borehole, protected dug well, protected spring, rainwater collection
Unsafe: unprotected dug well, unprotected spring, rivers or ponds, vendor provided water, tanker truck water.
24. Does the school have
sanitary facilities (latrines, flush
toilets, etc.) within the school
that are:
24.1 Improved2
24.2 Well maintained (clean
surfaces and walls).
24.3 Separate for teacher and
students
24.4 Separate for girls and boys
1 = Yes 2 = No
Sanitation facilities:
(According to
WHO/UNICEF)
2Improved: connection to a public sewer,
connection to a septic system, flush
latrine, simple pit latrine, ventilated improved pit latrine
Unimproved: Open pit
latrine, bucket latrine

43
25. Hand washing facilities at
the school:
25.1 Does the school have hand
washing facilities within the
school compound?
25.2 Do children usually wash
their hands after using
sanitation facilities?
25.3 Do children wash their
hands
before eating?
1 = Yes 2 = No
26. Does the school have a school garden?
1 = Yes 2 = No
27. How often the school uses vegetables from the
school garden in preparing school meals?
1 = 3 or more days a week 2 = 1 to 2 days a week 3 = 1 or 2 days a month 4= 1 to 2 times in a term 5 = Rarely
C. COMPLEMENTARY ACTIVITIES AT SCHOOL (Essential Package)
28. Which of the following student training and/ or services
took place during the past 12 months?
28.1 Health education
1 = Yes 2 = No
28.2 Nutrition education
1 = Yes
2 = No
28.3 Personal hygiene education
1 = Yes 2 = No
28.4 De-worming eradication treatment
1 = Yes
2 = No
28.5 School gardening
1 = Yes
2 = No
28.6 Vitamin A supplementation
1 = Yes 2 = No
28.7 HIV and AIDS awareness/education
1 = Yes
2 = No
28.8 Awareness/education on malaria prevention
1 = Yes 2 = No
D. SHORT-TERM HUNGER
29. Did you (teacher) observe changes in students’ classroom
behavior since the school feeding programme started
1 = Yes 2 = No
30. If yes, please list the changes that you observed.
Positive No
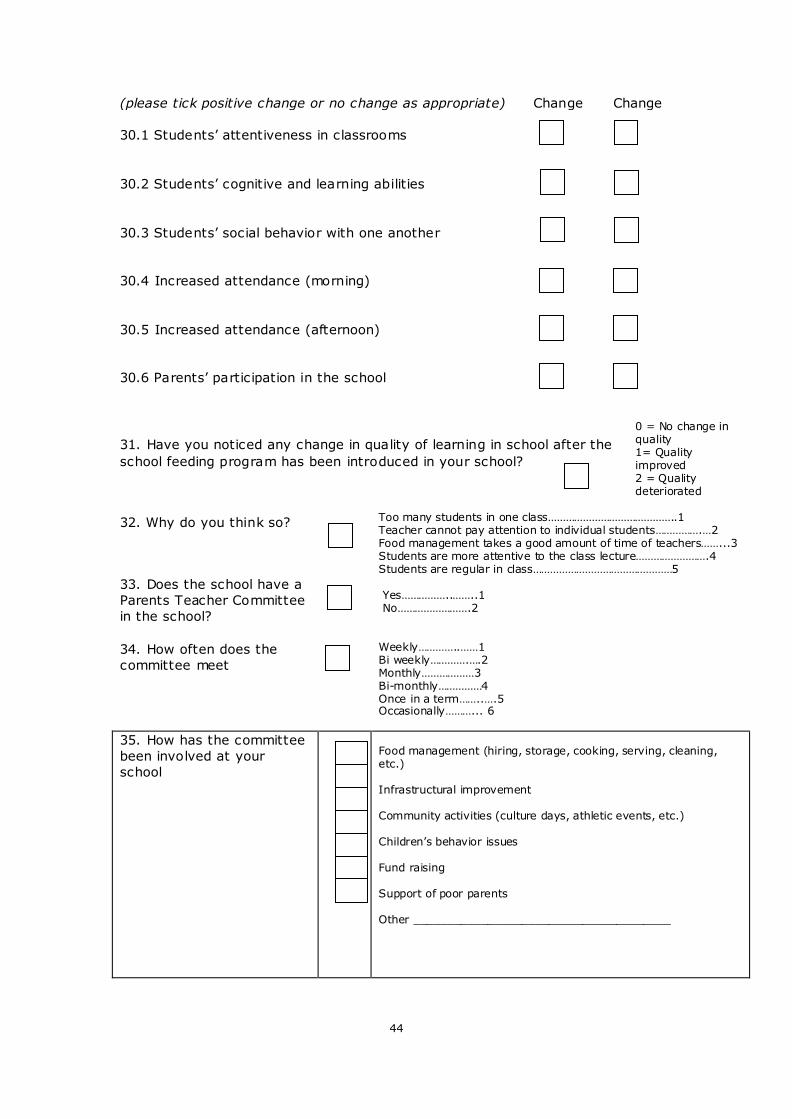
44
(please tick positive change or no change as appropriate) Change Change
30.1 Students‘ attentiveness in classrooms
30.2 Students‘ cognitive and learning abilities
30.3 Students‘ social behavior with one another
30.4 Increased attendance (morning)
30.5 Increased attendance (afternoon)
30.6 Parents‘ participation in the school
31. Have you noticed any change in quality of learning in school after the
school feeding program has been introduced in your school?
0 = No change in quality 1= Quality improved 2 = Quality deteriorated
32. Why do you think so?
Too many students in one class……………………………………..1 Teacher cannot pay attention to individual students…………….…2 Food management takes a good amount of time of teachers……...3 Students are more attentive to the class lecture…………………….4 Students are regular in class…………………………………………5
33. Does the school have a
Parents Teacher Committee
in the school?
Yes……………..……..1 No…………………….2
34. How often does the
committee meet
Weekly…………..……1 Bi weekly………….….2 Monthly………………3 Bi-monthly……………4 Once in a term……..….5 Occasionally………... 6
35. How has the committee
been involved at your
school
Food management (hiring, storage, cooking, serving, cleaning, etc.) Infrastructural improvement Community activities (culture days, athletic events, etc.) Children‘s behavior issues Fund raising Support of poor parents Other ______________________________________
45
Do you have any other comment about the school feeding programme?
END OF S URVEY
THANK YOU !
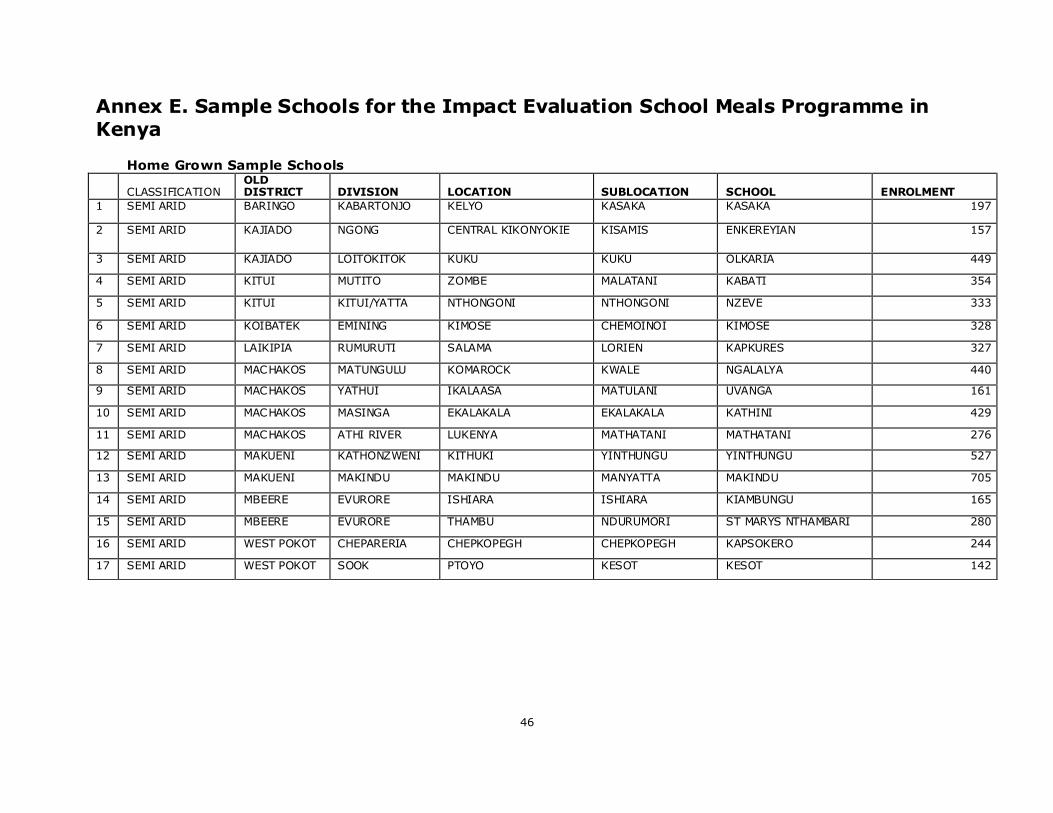
46
Annex E. Sample Schools for the Impact Evaluation School Meals Programme in Kenya
Home Grown Sample Schools
CLASSIFICATION OLD DISTRICT DIVISION LOCATION SUBLOCATION SCHOOL ENROLMENT
1 SEMI ARID BARINGO KABARTONJO KELYO KASAKA KASAKA 197
2 SEMI ARID KAJIADO NGONG CENTRAL KIKONYOKIE KISAMIS ENKEREYIAN 157
3 SEMI ARID KAJIADO LOITOKITOK KUKU KUKU OLKARIA 449
4 SEMI ARID KITUI MUTITO ZOMBE MALATANI KABATI 354
5 SEMI ARID KITUI KITUI/YATTA NTHONGONI NTHONGONI NZEVE 333
6 SEMI ARID KOIBATEK EMINING KIMOSE CHEMOINOI KIMOSE 328
7 SEMI ARID LAIKIPIA RUMURUTI SALAMA LORIEN KAPKURES 327
8 SEMI ARID MACHAKOS MATUNGULU KOMAROCK KWALE NGALALYA 440
9 SEMI ARID MACHAKOS YATHUI IKALAASA MATULANI UVANGA 161
10 SEMI ARID MACHAKOS MASINGA EKALAKALA EKALAKALA KATHINI 429
11 SEMI ARID MACHAKOS ATHI RIVER LUKENYA MATHATANI MATHATANI 276
12 SEMI ARID MAKUENI KATHONZWENI KITHUKI YINTHUNGU YINTHUNGU 527
13 SEMI ARID MAKUENI MAKINDU MAKINDU MANYATTA MAKINDU 705
14 SEMI ARID MBEERE EVURORE ISHIARA ISHIARA KIAMBUNGU 165
15 SEMI ARID MBEERE EVURORE THAMBU NDURUMORI ST MARYS NTHAMBARI 280
16 SEMI ARID WEST POKOT CHEPARERIA CHEPKOPEGH CHEPKOPEGH KAPSOKERO 244
17 SEMI ARID WEST POKOT SOOK PTOYO KESOT KESOT 142
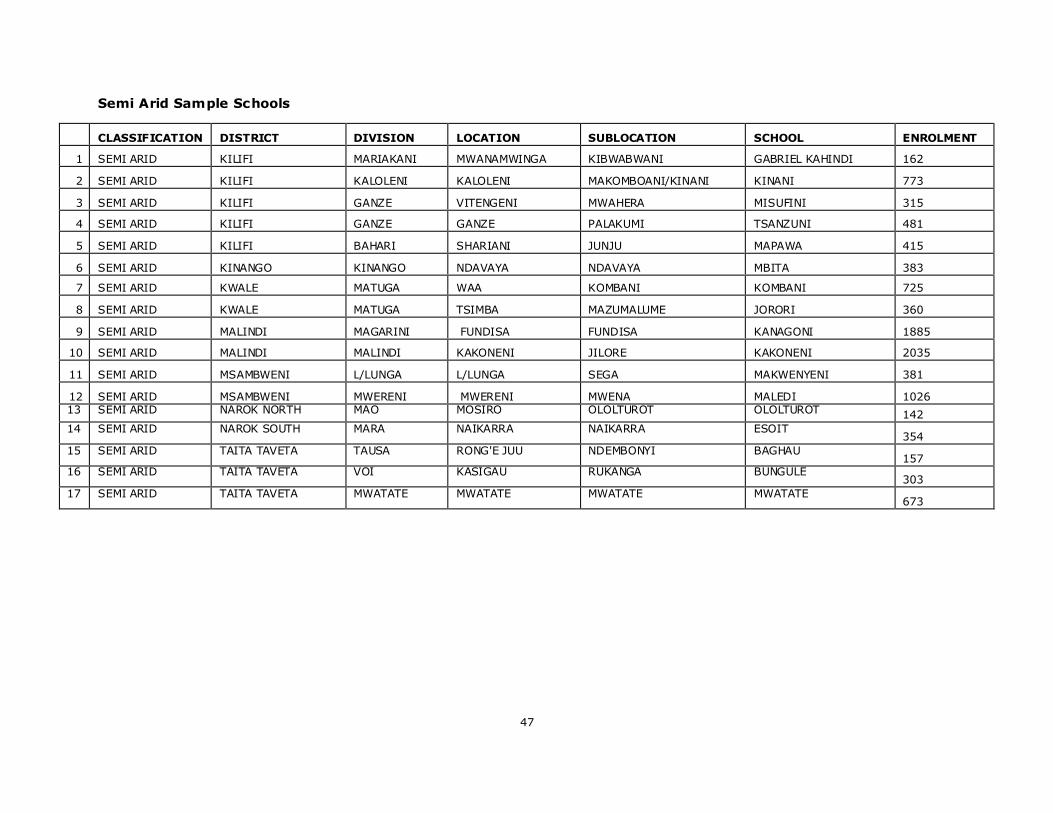
47
Semi Arid Sample Schools
CLASSIFICATION DISTRICT DIVISION LOCATION SUBLOCATION SCHOOL ENROLMENT
1 SEMI ARID KILIFI MARIAKANI MWANAMWINGA KIBWABWANI GABRIEL KAHINDI 162
2 SEMI ARID KILIFI KALOLENI KALOLENI MAKOMBOANI/KINANI KINANI 773
3 SEMI ARID KILIFI GANZE VITENGENI MWAHERA MISUFINI 315
4 SEMI ARID KILIFI GANZE GANZE PALAKUMI TSANZUNI 481
5 SEMI ARID KILIFI BAHARI SHARIANI JUNJU MAPAWA 415
6 SEMI ARID KINANGO KINANGO NDAVAYA NDAVAYA MBITA 383
7 SEMI ARID KWALE MATUGA WAA KOMBANI KOMBANI 725
8 SEMI ARID KWALE MATUGA TSIMBA MAZUMALUME JORORI 360
9 SEMI ARID MALINDI MAGARINI FUNDISA FUNDISA KANAGONI 1885
10 SEMI ARID MALINDI MALINDI KAKONENI JILORE KAKONENI 2035
11 SEMI ARID MSAMBWENI L/LUNGA L/LUNGA SEGA MAKWENYENI 381
12 SEMI ARID MSAMBWENI MWERENI MWERENI MWENA MALEDI 1026 13 SEMI ARID NAROK NORTH MAO MOSIRO OLOLTUROT OLOLTUROT 142
14 SEMI ARID NAROK SOUTH MARA NAIKARRA NAIKARRA ESOIT 354
15 SEMI ARID TAITA TAVETA TAUSA RONG'E JUU NDEMBONYI BAGHAU 157
16 SEMI ARID TAITA TAVETA VOI KASIGAU RUKANGA BUNGULE 303
17 SEMI ARID TAITA TAVETA MWATATE MWATATE MWATATE MWATATE 673
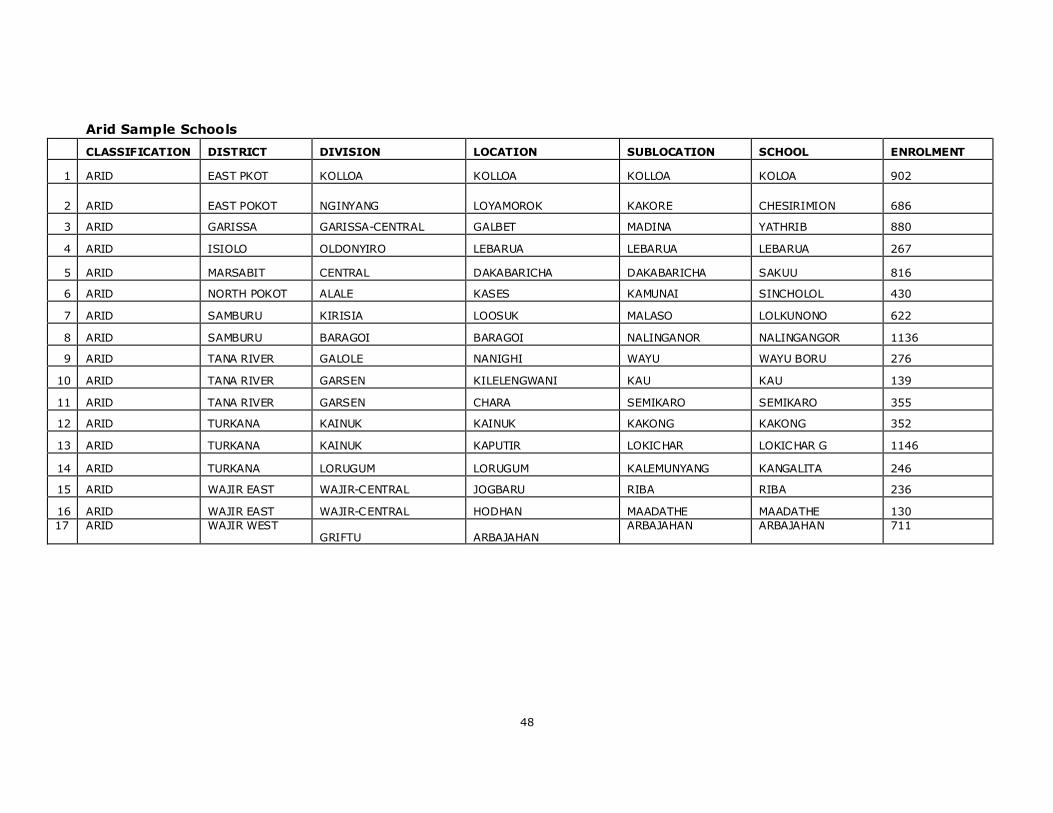
48
Arid Sample Schools
CLASSIFICATION DISTRICT DIVISION LOCATION SUBLOCATION SCHOOL ENROLMENT
1 ARID EAST PKOT KOLLOA KOLLOA KOLLOA KOLOA 902
2 ARID EAST POKOT NGINYANG LOYAMOROK KAKORE CHESIRIMION 686
3 ARID GARISSA GARISSA-CENTRAL GALBET MADINA YATHRIB 880
4 ARID ISIOLO OLDONYIRO LEBARUA LEBARUA LEBARUA 267
5 ARID MARSABIT CENTRAL DAKABARICHA DAKABARICHA SAKUU 816
6 ARID NORTH POKOT ALALE KASES KAMUNAI SINCHOLOL 430
7 ARID SAMBURU KIRISIA LOOSUK MALASO LOLKUNONO 622
8 ARID SAMBURU BARAGOI BARAGOI NALINGANOR NALINGANGOR 1136
9 ARID TANA RIVER GALOLE NANIGHI WAYU WAYU BORU 276
10 ARID TANA RIVER GARSEN KILELENGWANI KAU KAU 139
11 ARID TANA RIVER GARSEN CHARA SEMIKARO SEMIKARO 355
12 ARID TURKANA KAINUK KAINUK KAKONG KAKONG 352
13 ARID TURKANA KAINUK KAPUTIR LOKICHAR LOKICHAR G 1146
14 ARID TURKANA LORUGUM LORUGUM KALEMUNYANG KANGALITA 246
15 ARID WAJIR EAST WAJIR-CENTRAL JOGBARU RIBA RIBA 236
16 ARID WAJIR EAST WAJIR-CENTRAL HODHAN MAADATHE MAADATHE 130
17 ARID WAJIR WEST GRIFTU ARBAJAHAN
ARBAJAHAN ARBAJAHAN 711
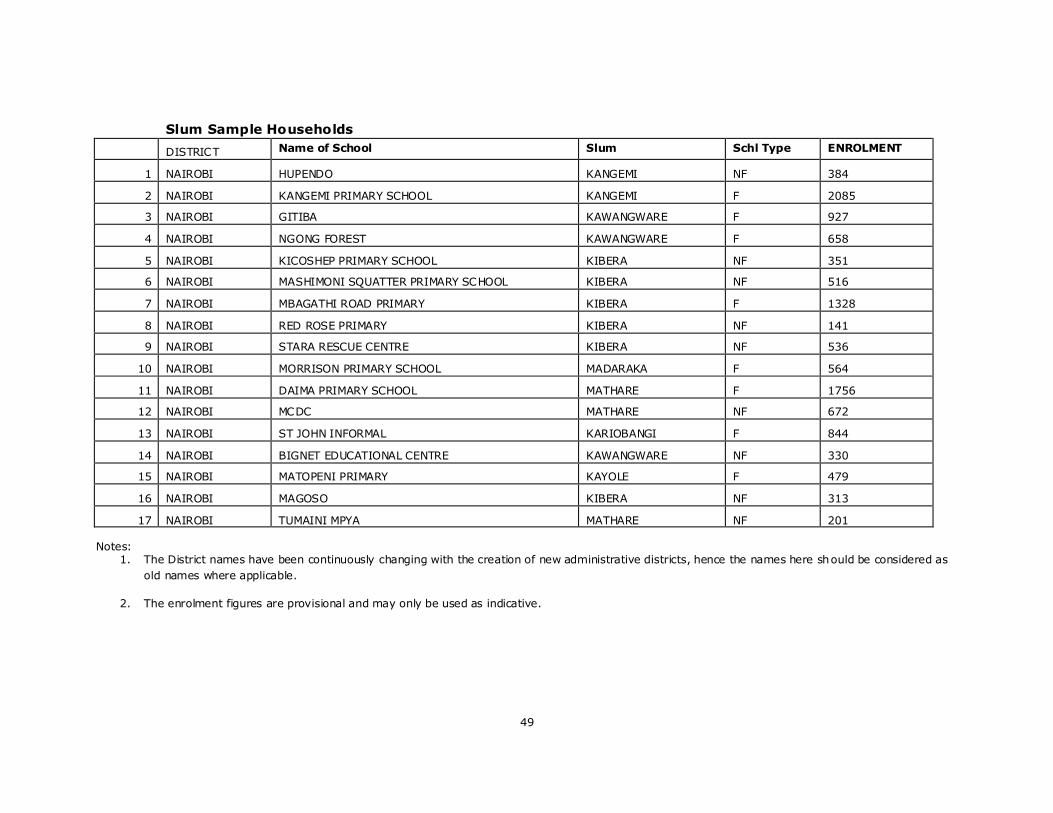
49
Slum Sample Households
DISTRICT Name of School Slum Schl Type ENROLMENT
1 NAIROBI HUPENDO KANGEMI NF 384
2 NAIROBI KANGEMI PRIMARY SCHOOL KANGEMI F 2085
3 NAIROBI GITIBA KAWANGWARE F 927
4 NAIROBI NGONG FOREST KAWANGWARE F 658
5 NAIROBI KICOSHEP PRIMARY SCHOOL KIBERA NF 351
6 NAIROBI MASHIMONI SQUATTER PRIMARY SCHOOL KIBERA NF 516
7 NAIROBI MBAGATHI ROAD PRIMARY KIBERA F 1328
8 NAIROBI RED ROSE PRIMARY KIBERA NF 141
9 NAIROBI STARA RESCUE CENTRE KIBERA NF 536
10 NAIROBI MORRISON PRIMARY SCHOOL MADARAKA F 564
11 NAIROBI DAIMA PRIMARY SCHOOL MATHARE F 1756
12 NAIROBI MCDC MATHARE NF 672
13 NAIROBI ST JOHN INFORMAL KARIOBANGI F 844
14 NAIROBI BIGNET EDUCATIONAL CENTRE KAWANGWARE NF 330
15 NAIROBI MATOPENI PRIMARY KAYOLE F 479
16 NAIROBI MAGOSO KIBERA NF 313
17 NAIROBI TUMAINI MPYA MATHARE NF 201 Notes:
1. The District names have been continuously changing with the creation of new administrative districts, hence the names here should be considered as
old names where applicable.
2. The enrolment figures are provisional and may only be used as indicative.
50
Annex F. Expanded Findings on Health and Nutritional Outcomes
Below are more detailed findings on health and nutrition, expanding on the contents of
Section 2.3 of the main evaluation report.
1. Household Dietary Intake
1. One the whole, about half the sample of households consumed three meals daily. The
highest proportion (53 per cent) of households consuming three meals a day came from the
urban areas and the lowest (32 per cent) was recorded in the arid districts (Table 1). The
mean number of meals consumed per day ranged from 2.2 in the arid areas to 2.45 in the
urban areas, and these differences are statistically signif icant. Overall, about one-third of
the households consumed less than three meals per day and hardly any households
consumed snacks in-between the meals. It is recommended that people eat three meals per
day in addition to snacks so as to have a continuous release of energy throughout the day
to enable one perform both physical and chemical activities.
2. The findings of the focus group discussions (FGDs) concur with the quantitative
household results. It was reported by respondents during the FGDs that the majority of the
households ate two meals per day at the time of the evaluation because of scarcity of food
brought about by chronic drought and high poverty levels in the semi-arid and arid areas
and the incidence of poverty in the urban areas. The lowest number of meals was eaten by
the households from the arid areas and the highest by those from the urban areas. Whereas
the findings for the urban areas could be explained by the fact that the majority of the
households may have some income from casual jobs, the households from arid areas would
be expected to consume a higher number of meals because of widespread access to GFD at
the time of the evaluation.
3. Dietary diversity, another proxy indicator of adequacy of the diet, is a qualitative
measure of food consumption that reflects household access to a wide variety of foods.
Dietary diversity has long been recognized by nutritionists as a key element for high quality
diets (WHO/FAO 1996). Lack of dietary diversity is a particularly severe problem among
poor populations in the developing world because their diets are predominantly based on
starchy staples. These plant-based diets are low in a number of mic ronutrients and those
that they contain are low in bioavailability.
4. Evidence from a multi-country analysis suggests that household level dietary diversity is
strongly associated with household food security.31 A consistent positive association
between dietary diversity and child nutrition has been found in a number of developing
countries. 32 In this evaluation, the HDDS was constructed by summing the number of food
groups consumed over a 24-hour period. The dietary diversity tool was also used to
determine if the households consume foods of special interest to this evaluation—vitamin A-
rich, iron-rich, iodine-rich, energy-rich, and protein-rich foods. The HDDS is meant to
provide a snapshot of the economic ability of a household to consume a variety of foods,33
and it is based on the premise that the more diverse the diet the more likely it is to provide
31 Hoddinot, J. and Yahnnes, Y. (2002): Dietary diversity as a household food security indictor, FANTA, Washington 32 Arimond, M and Ruel, M.T. (2004): Dietary diversity is associated with child nutritional status: evidence from 11 demographic and health surveys. Journal of Nutrition 134: 2579-2585. 33 Guidelines for measuring household and individual dietary diversity. Version 2, June 2007. Prepared by FAO Nutrition and Consumer Protection Division with the support from EC/FAO Food Security Information for Action Programme and the Food and Nutrition Technical Assistance (FANTA) Project. Rome, Italy
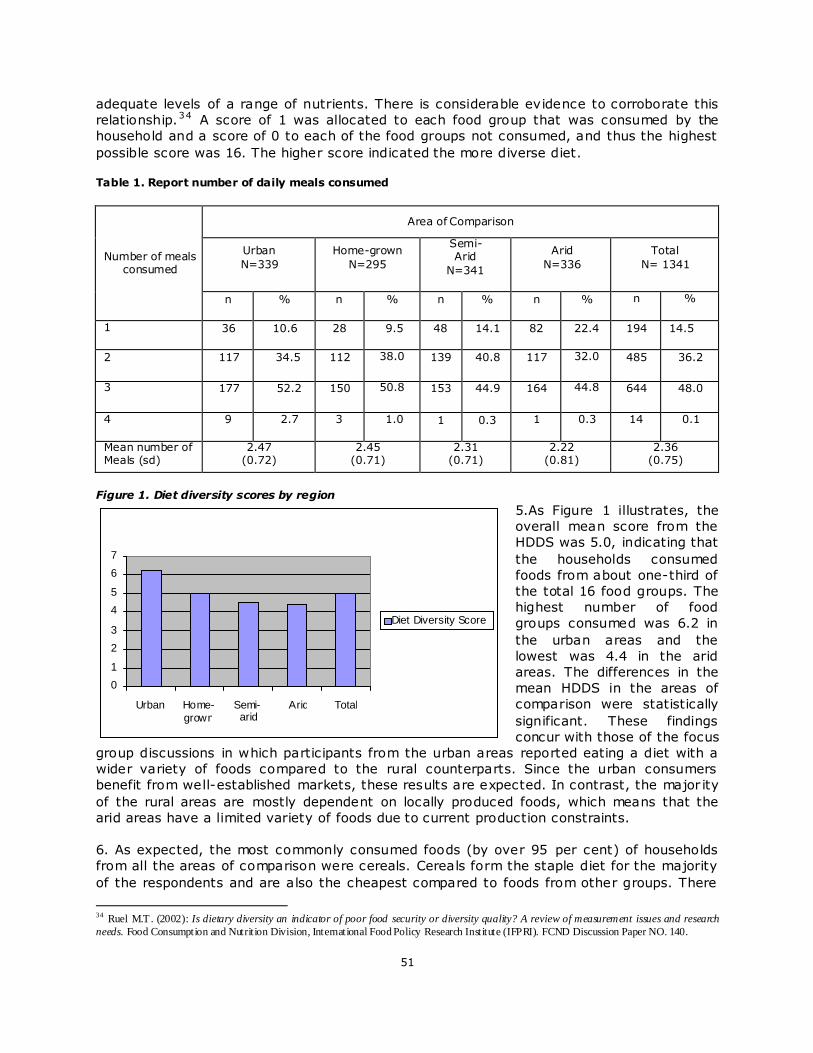
51
adequate levels of a range of nutrients. There is considerable evidence to corroborate this
relationship.34 A score of 1 was allocated to each food group that was consumed by the
household and a score of 0 to each of the food groups not consumed, and thus the highest
possible score was 16. The higher score indicated the more diverse diet.
Table 1. Report number of daily meals consumed
Number of meals
consumed
Area of Comparison
Urban
N=339
Home-grown
N=295
Semi- Arid
N=341
Arid
N=336
Total
N= 1341
n % n % n % n % n %
1 36 10.6 28 9.5 48 14.1 82 22.4 194 14.5
2 117 34.5 112 38.0 139 40.8 117 32.0 485 36.2
3 177 52.2 150 50.8 153 44.9 164 44.8 644 48.0
4 9 2.7 3 1.0 1 0.3 1 0.3 14 0.1
Mean number of Meals (sd)
2.47 (0.72)
2.45 (0.71)
2.31 (0.71)
2.22 (0.81)
2.36 (0.75)
Figure 1. Diet diversity scores by region
5.As Figure 1 illustrates, the
overall mean score from the
HDDS was 5.0, indicating that
the households consumed
foods from about one-third of
the total 16 food groups. The
highest number of food
groups consumed was 6.2 in
the urban areas and the
lowest was 4.4 in the arid
areas. The differences in the
mean HDDS in the areas of
comparison were statistically
significant. These findings
concur with those of the focus
group discussions in which participants from the urban areas reported eating a diet with a
wider variety of foods compared to the rural counterparts. Since the urban consumers
benefit from well-established markets, these results are expected. In contrast, the major ity
of the rural areas are mostly dependent on locally produced foods, which means that the
arid areas have a limited variety of foods due to current production constraints.
6. As expected, the most commonly consumed foods (by over 95 per cent) of households
from all the areas of comparison were cereals. Cereals form the staple diet for the majority
of the respondents and are also the cheapest compared to foods from other groups. There
34
Ruel M.T. (2002): Is dietary diversity an indicator of poor food security or diversity quality? A review of measurement issues and research
needs. Food Consumption and Nutrition Division, International Food Policy Research Institute (IFPRI). FCND Discussion Paper NO. 140.
0 1
2 3
4 5
6 7
Urban Home- grown
Semi- arid
Arid Total
Diet Diversity Score
52
were no significant differences in the consumption of cereals among the areas. The second
most commonly consumed food group was oils/fats, reported by 77 per cent of the
households from all the areas, with the highest consumption (94 per cent) found in the
households from the urban areas and the lowest (64 per cent) from the arid areas. The
oils/fats are used for cooking food. It is not clear why the arid areas recorded the lowest
consumption since oil is part of the GFD food basket. Pulses were consumed by 57 per cent
of all the households, with the highest consumption in home-grown districts (72 per cent)
and the lowest (49 per cent) in urban areas.
7. Over half the households from the urban consumed milk and milk products whereas the
lowest consumption (31 per cent) was by households from the semi-arid areas. Sweets in
the form of sugar in tea were consumed by 60 per cent of the households from all the
areas. The highest rate of consumption (84 per cent) was by households from the urban
and the lowest (52 per cent) from the arid areas. Dark green leafy vegetables were
consumed by a third (33 per cent) of all the households with the highest consumption (59
per cent) by households in the urban areas and the lowest (17 per cent) by those in the arid
areas. The relatively higher consumption of dark green leafy vegetables in the urban areas
may be due to the availability of a wider variety of vegetables. The low consumption of dark
green leafy vegetables is explained by the limited availability of vegetables in the arid and
semi-arid areas. These findings are consistent with those from the focus group discussions
in which respondents from arid areas reported limited consumption of vegetables whereas
those from urban areas reported consumption of a wider variety of foods. Vitamin A-rich
vegetables, fruits, organ meats, flesh meats, eggs, and fish were consumed by less than 15
per cent of the households.
8. The proportion of households that consumed iron-rich foods (organ meats and f lesh
meats) and the proportion of households that ate vitamin A-rich foods (vitamin A-rich
vegetables, dark green leafy vegetables, vitamin A-rich fruits, eggs and milk and milk
products) were used as indicators for dietary adequacy for iron and vitamin A respectively.
Table 2. Consumption of iron-rich and Vitamin A-rich foods
Agro-Ecological Zone
Urban
N=339
Home-grown
N=296
Semi-
arid
N=341
Arid
N=369
Total
N=1345
n % n % n % n % n %
Iron-
rich
foods
44 13.0 27 9.1 35 10.3 96 26.0 202 15.
0
Vitamin
A-rich
foods
294 86.7 164 55.4 189 55.4 199 3.95 846 62.9
The proportion of those households that consumed at least one of the iron-rich foods and at
least one of the vitamin A-rich foods were computed. In this evaluation, there was no
differentiation between the plant and animal sources of vitamin A-rich foods consumed. The
plant sources contain carotene or pro-vitamin A whereas the animal sources contain an
active form of the vitamin.
53
9. Overall, the consumption of iron was low. Only 15 per cent of the children from all the
comparison areas ate at least one iron-rich food. Of the children who ate iron-rich foods, the
highest proportion (26 per cent) were from the arid areas, followed by those from the urban
areas (13 per cent) and the least proportion of children (9 per cent) was from the home-
grown areas (Table 2). In contrast to the consumption of iron, about two-thirds (63 per cent
of the children ate at least one vitamin A-rich food, with over half of the children from all
the areas having consumed such foods. The highest proportion of the children (87 per cent)
that consumed vitamin A-rich foods was from the urban areas. This is explained by the
relatively high consumption of dark green leafy vegetables and milk in the urban areas.
2. Dietary Intake of School Pupils
10. It is important to ensure fair representation of all the days of the week in 24-hour
dietary recalls to avoid bias in the findings. There may be variation in dietary practices by
day of the week. For example, during the weekends people have more time to prepare
special meals whereas during weekdays people are limited in meal preparation time. There
was a fair representation of the days of the week for the dietary recall with the exception of
Fridays and Saturdays (because schools were not visited on Saturdays and Sundays). From
all the areas, one quarter (25 per cent) of the dietary recalls were for Sundays, and these
were for schools visited on Mondays. The dietary recalls for Sundays consisted of lunches
eaten at home and not in school.
11. The majority (79 per cent) of the children reported having had breakfast; the highest
proportion of those were from the urban areas (87 per cent) whereas the lowest proportion
(69 per cent) of the children were from the semi-arid areas (Table 3). Mid-morning snacks
were hardly eaten by the children from any of the areas. A signif icantly higher proportion (9
per cent) of the children from the urban areas and less than five percent from the other
areas ate a mid-morning snack. As expected, the majority (92 per cent) of children ate
lunch since the schools had on-going school feeding programs. There were no signif icant
differences in the proportion of children who ate lunch from the different rural and urban
zones. The afternoon snack was as infrequent as the morning snack and generally limited to
the urban children. The majority of the children (92 per cent) from all the areas ate dinner
with the highest proportion (96 per cent) being those from urban schools and the lowest (85
per cent) from the arid areas.
12. The findings on the proportion of children who took snacks, lunch, and dinner concur
with the findings from the FGDs. In contrast, during the FGDs, it was reported that the
majority of the children do not take breakfast, a finding that is inconsistent with the
quantitative data from the 24-hour recall. There is a possibility that the participants of the
FGDs did not view a cup of black tea or a cup of tea with little milk or, for a minority, a cup
of porridge only as a meal. These were reported to be the most commonly eaten foods for
breakfast as reported during the FGDs.
13. Breakfast is the most important meal of the day and ideally should provide at least 30
per cent of the total daily energy requirement and contain a variety of foods. Studies have
shown that programs providing breakfast to primary school children students significantly
increase attendance and arithmetic scores and signif icantly benefit children who have
suffered from malnutrition.35, 36 Despite the fact that a majority of the children in this
evaluation took breakfast, the food consumed was not likely to provide the required energy
to sustain intellectual tasks or to deal with the effects of short-term before lunch time. Even
35
Mathews R. Importance of breakfast to cognitive performance and health. Perspect Appl Nutr. 1996 (3):204-212. 36
Pollit E. Does breakfast make a difference in school? J Am Diet. Assoc. 1995; 95:1134-1139.
54
though the majority of the children ate dinner, the meals mostly consisted of cereals eaten
with either vegetables or beans. The consumption of animal foods was limited. These
patterns were identified during the FGDs and confirmed by the findings of the 24-hour
recall. As a whole, the meals eaten at home were reported to be inferior to the school lunch
in terms of dietary diversity and the amount served. This implies that even though the
children reportedly ate dinner, the nutritive value was limited because of the limited variety
of foods and the inadequate amounts of food consumed.
Table 3. Meals normally consumed daily by children Meals
Agro-Ecological Zone
Urban N=333
Home-grown N=290
Semi- arid
N=341
Arid N=366
Total N=1330
n % n % n % n % n %
Breakfast 290 87 225 78 236 69 296 81 1047 79
Mid-morning Snack 30 9 6 2 0 8 2 44 3 Lunch 305 92 266 92 303 89 345 94 1219 92
Afternoon Snack 55 17 11 4 1 0 3 1 70 5
Dinner 320 96 282 98 304 89 311 85 1217 92
14. The majority of children from all districts reported that the amount of food consumed
the previous day was the same as usually consumed. Overall, this indicates that for the
majority of the children the amount of food consumed was more or less the same as usual
and thus there was no increased food insecurity at the time of the evaluation.
3. Adequacy of the School Meal
15. One of the issues raised in the PIA sessions was whether the quantity and quality of the
school meal was adequate. Generally, the lunch consists of a cereal stew (usually maize or
bulgur wheat), a pulse (split pea) and oil and salt. Several student sessions mentioned the
lack of oil and salt and the consequent tastelessness of the lunch. Others stated that that
the quantity was not sufficient to stave off hunger later in the afternoon. With regards to
quality, some students did not customarily eat the food served at lunch (e.g. coastal rice
eaters being served maize) and suffered from digestion problems after eating. The survey of
student diets sought to address this issue of adequacy by focusing on the lunch of the
previous day. The majority (75 per cent) of the children ate lunch at school and 25 per cent
at home, depending on whether a lunch was served or if the interview occurred on a
Monday (thus recalling Sunday‘s lunch).
16. Student perceptions on the adequacy of the quantity of food served for lunch were
analyzed by comparing the lunch consumed at home with that served at school. With slight
differences across regions, between 80-90 percent of the students felt that both meals at
school and meals at home were adequate in terms of amount. These findings contrast with
the information from the FGDs, in which the majority of the pupils, students, and parents
reported that the amount of food served at school was more than what was served at home.
The PIA sessions with students further documented that the school lunch was not adequate
to last the day, and children felt hunger during the afternoon. The inability to draw a
consistent picture of school lunch adequacy (from the perspective of the ―clients‖) likely
identif ies significant variability at the level of the school and in terms of household food
security conditions. The analysis returns to this issue below.
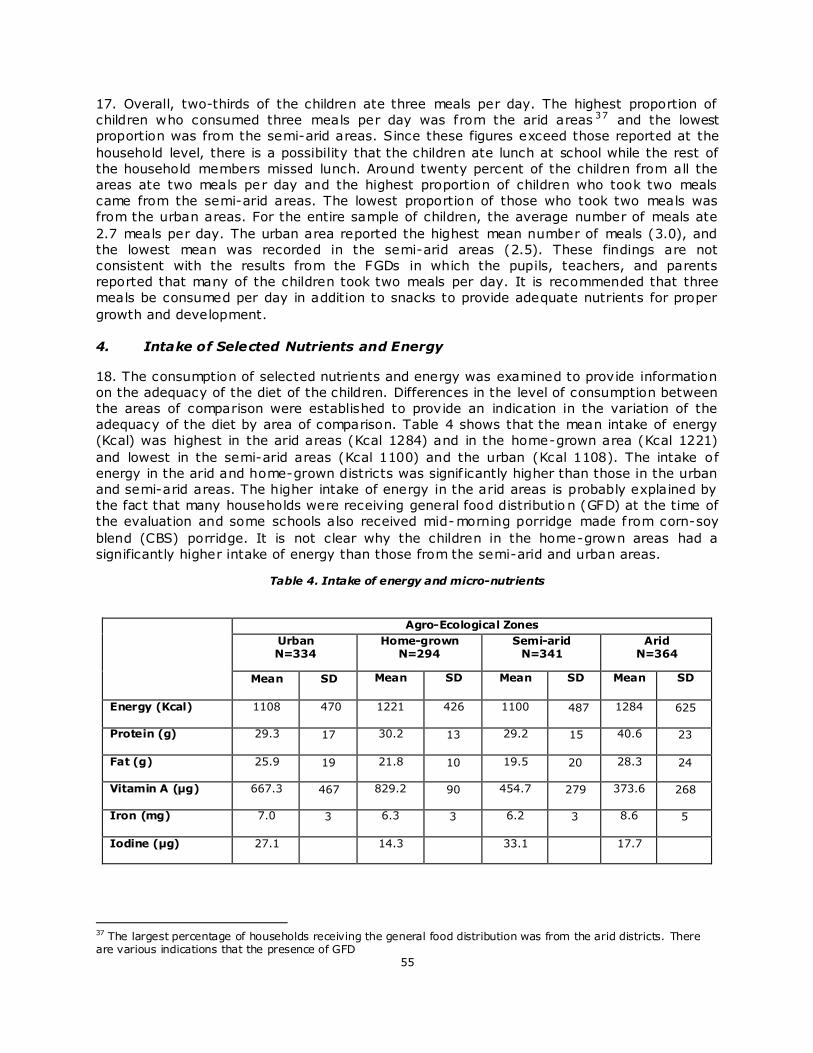
55
17. Overall, two-thirds of the children ate three meals per day. The highest proportion of
children who consumed three meals per day was from the arid areas 37 and the lowest
proportion was from the semi-arid areas. Since these figures exceed those reported at the
household level, there is a possibility that the children ate lunch at school while the rest of
the household members missed lunch. Around twenty percent of the children from all the
areas ate two meals per day and the highest proportion of children who took two meals
came from the semi-arid areas. The lowest proportion of those who took two meals was
from the urban areas. For the entire sample of children, the average number of meals ate
2.7 meals per day. The urban area reported the highest mean number of meals (3.0), and
the lowest mean was recorded in the semi-arid areas (2.5). These findings are not
consistent with the results from the FGDs in which the pupils, teachers, and parents
reported that many of the children took two meals per day. It is recommended that three
meals be consumed per day in addition to snacks to provide adequate nutrients for proper
growth and development.
4. Intake of Selected Nutrients and Energy
18. The consumption of selected nutrients and energy was examined to provide information
on the adequacy of the diet of the children. Differences in the level of consumption between
the areas of comparison were established to provide an indication in the variation of the
adequacy of the diet by area of comparison. Table 4 shows that the mean intake of energy
(Kcal) was highest in the arid areas (Kcal 1284) and in the home-grown area (Kcal 1221)
and lowest in the semi-arid areas (Kcal 1100) and the urban (Kcal 1108). The intake of
energy in the arid and home-grown districts was signif icantly higher than those in the urban
and semi-arid areas. The higher intake of energy in the arid areas is probably explained by
the fact that many households were receiving general food distributio n (GFD) at the time of
the evaluation and some schools also received mid-morning porridge made from corn-soy
blend (CBS) porridge. It is not clear why the children in the home-grown areas had a
significantly higher intake of energy than those from the semi-arid and urban areas.
Table 4. Intake of energy and micro-nutrients
Agro-Ecological Zones
Urban N=334
Home-grown N=294
Semi-arid N=341
Arid N=364
Mean SD Mean SD Mean SD Mean SD
Energy (Kcal) 1108 470 1221 426 1100 487 1284 625
Protein (g) 29.3 17 30.2 13 29.2 15 40.6 23
Fat (g) 25.9 19 21.8 10 19.5 20 28.3 24
Vitamin A (µg) 667.3 467 829.2 90 454.7 279 373.6 268
Iron (mg) 7.0 3 6.3 3 6.2 3 8.6 5
Iodine (µg) 27.1 14.3 33.1 17.7
37 The largest percentage of households receiving the general food distribution was from the arid districts. There are various indications that the presence of GFD
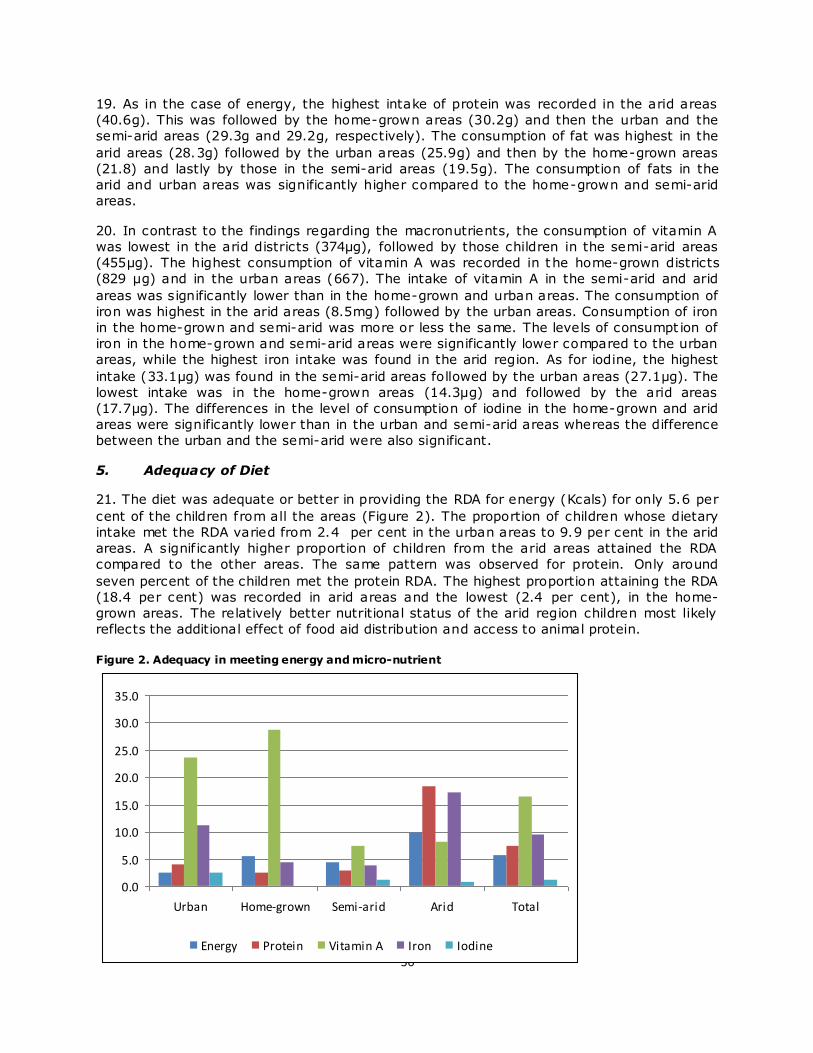
56
19. As in the case of energy, the highest intake of protein was recorded in the arid areas
(40.6g). This was followed by the home-grown areas (30.2g) and then the urban and the
semi-arid areas (29.3g and 29.2g, respectively). The consumption of fat was highest in the
arid areas (28.3g) followed by the urban areas (25.9g) and then by the home-grown areas
(21.8) and lastly by those in the semi-arid areas (19.5g). The consumption of fats in the
arid and urban areas was significantly higher compared to the home-grown and semi-arid
areas.
20. In contrast to the findings regarding the macronutrients, the consumption of vitamin A
was lowest in the arid districts (374µg), followed by those children in the semi-arid areas
(455µg). The highest consumption of vitamin A was recorded in the home-grown districts
(829 µg) and in the urban areas (667). The intake of vitamin A in the semi-arid and arid
areas was significantly lower than in the home-grown and urban areas. The consumption of
iron was highest in the arid areas (8.5mg) followed by the urban areas. Consumption of iron
in the home-grown and semi-arid was more or less the same. The levels of consumpt ion of
iron in the home-grown and semi-arid areas were significantly lower compared to the urban
areas, while the highest iron intake was found in the arid region. As for iodine, the highest
intake (33.1µg) was found in the semi-arid areas followed by the urban areas (27.1µg). The
lowest intake was in the home-grown areas (14.3µg) and followed by the arid areas
(17.7µg). The differences in the level of consumption of iodine in the home-grown and arid
areas were significantly lower than in the urban and semi-arid areas whereas the difference
between the urban and the semi-arid were also significant.
5. Adequacy of Diet
21. The diet was adequate or better in providing the RDA for energy (Kcals) for only 5.6 per
cent of the children from all the areas (Figure 2). The proportion of children whose dietary
intake met the RDA varied from 2.4 per cent in the urban areas to 9.9 per cent in the arid
areas. A signif icantly higher proportion of children from the arid areas attained the RDA
compared to the other areas. The same pattern was observed for protein. Only around
seven percent of the children met the protein RDA. The highest proportion attaining the RDA
(18.4 per cent) was recorded in arid areas and the lowest (2.4 per cent), in the home-
grown areas. The relatively better nutritional status of the arid region children most likely
reflects the additional effect of food aid distribution and access to animal protein.
Figure 2. Adequacy in meeting energy and micro-nutrient
0.0
5.0
10.0
15.0
20.0
25.0
30.0
35.0
Urban Home-grown Semi-arid Arid Total
Energy Protein Vitamin A Iron Iodine
57
22. The RDA for vitamin A was met by 16 percent of the sampled children. Almost one-third
of the pupils in the home-grown and urban areas (29 per cent and 27 per cent,
respectively) received vitamin A in amounts enough to meet the RDA. The semi-arid areas
recorded the lowest proportion with around seven percent. On the whole, lower proportions
of children attained the RDA for iron from the dietary intake compared to vitamin A. The
highest proportion of those whose diet provided sufficient amounts of iron to meet the RDA
was from the arid areas (17.3 per cent) and the lowest (3.8 per cent) were from the semi-
arid areas. Only one percent of the children received the RDA for iodine from the diet
despite the fact that iodized salt is provided as part of the food items for the school feeding
program.
23. The micronutrient deficiencies have far-reaching implications for health and nutrition
and consequently educational outcomes. A lack of iron not only causes an energy crisis but
also directly affects behavior, mood, attention span and learning ability. Iron deficiency
manifests itself in the lowering of motivation to persist in intellectually challenging tasks, a
shortening of the attention span, and a reduction of overall intellectual performance. 38
Vitamin A is involved in the immune functioning of the body and is necessary for the
prevention of infections such as diarrhea and acute respiratory infections. Deficiency of this
micronutrient can therefore impact negatively on education outcomes because if children fall
ill frequently this will lead to increased absenteeism from school. Iodine deficiency also
impacts negatively on educational outcomes, being the leading cause of intellectual
deficiency. 39
38 Calado C.B., Debruyne L. K. and Whitney E. N. (1995). Nutrition and Diet Therapy, Minneaplois/St. Paul, New York, Los Angeles, San Fransisco, West Publishing Company. 39 Holowell J, Staehling N, Hannan W, Flanders D, Gunter E, and Maberly G. Iodine nutrition in the United States. Trends of public health implications: Iodine excretion data from national health and nutrition examination Surveys I and III (1971-1974 and 1988-1994). J Clinical Endocrinology and Metabolism, 1998;83:3401-3408.
58
Annex G. List of People Consulted
WFP Kenya Office
Burkard Oberle, Country Director
Pippa Bradford Assistant Country Director
Marian Read, ex-ACD (now in HQ))
Nancy Walters, School Feeding Policy, HQ
Renee McGuffin, Program Officer, School Feeding Program
Danston Ondachi, School Feeding Program
Grace Igweta, M&E Officer
Dennis Tiren, M&E Assistant
Barbara Leseni, M&E Assistant
Beatrice Mwongela, M&E Assistant
Arben Caslli, Procurement and Administration
João Manja, VAM, Nairobi
Ashford Mbiuki, Satellite Office, Nairobi
Elizabeth Nabutola, Satellite Office, Nairobi
Joy Leshan, Logistics
Regional Director, Marsabit
School Feeding field staff, Lodwar
Government of Kenya Staff
Guleid Nur, School Feeding Unit, MOE, Nairobi
Paul Mungai, School Feeding Unit, MOE, Nairobi
Boniface Ouko, School Feeding Unit, MOE, Nairobi
Margaret Ndanyi, School Health Unit, MOE, Nairobi
Leah Rotich, Basic Education, MOE, Nairobi
Roger Bonner, Infrastructure, MOE, Nairobi
Philomena Chege, NMK Coordinator, MoA
Mr. Karani, Child and Adolescent Health, MOH
Joe Mwasi, DEO, Marsabit (Central)
Tom Mboya, DEO, Garissa
Dickson Keis, DEO, Kilif i
Jonathan Ronoh, DEO, Narok North
Mr. Ortieno, DEO, Wundanyi
Wilbert Nyangweso, DEO, Kwale
Chai, Abdallah, DEO, Malindi
DEO, Kitui
DEO, Machakos
SFPO, Narok South
John Lokoli, SFPO, Turkana North
Abdi Mohamed, SFPO, Wajir
Kibamba Maryselina, SFPO, Malindi
Grace Luganje, SFPO, Kalifi
Ole Sisika, SFPO, Kajiado
Juma Majaliwa, ECD, Kwale
Robert Nyabare, District Quality Assurance Officer
Victor Momanyi, DQAO, Narok North
Jacktome Abueri, DMO, Tana River
Dr. Langat, DMO, Narok North
Mr. Rotich, District Commissioner, Marsabit (Central)
Deputy Head Teacher, Gitiba Primary School, Narok
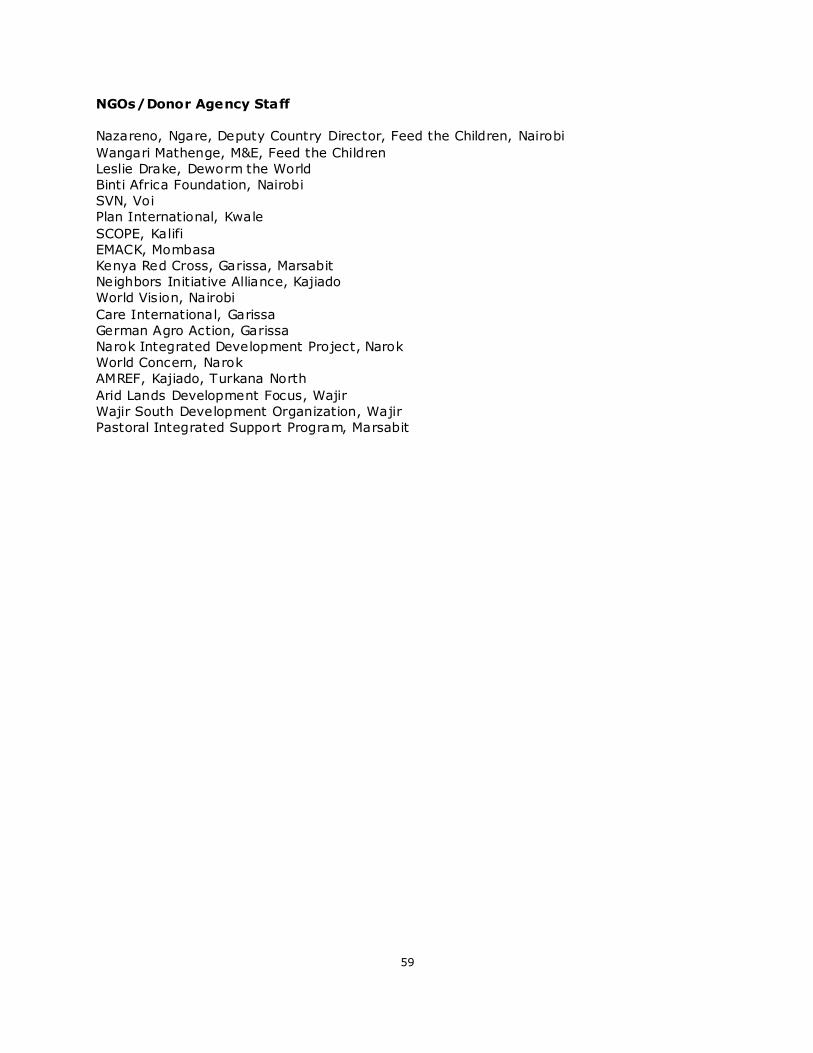
59
NGOs/Donor Agency Staff
Nazareno, Ngare, Deputy Country Director, Feed the Children, Nairobi
Wangari Mathenge, M&E, Feed the Children
Leslie Drake, Deworm the World
Binti Africa Foundation, Nairobi
SVN, Voi
Plan International, Kwale
SCOPE, Kalifi
EMACK, Mombasa
Kenya Red Cross, Garissa, Marsabit
Neighbors Initiative Alliance, Kajiado
World Vision, Nairobi
Care International, Garissa
German Agro Action, Garissa
Narok Integrated Development Project, Narok
World Concern, Narok
AMREF, Kajiado, Turkana North
Arid Lands Development Focus, Wajir
Wajir South Development Organization, Wajir
Pastoral Integrated Support Program, Marsabit
World Food Programme
Office of Evaluation
Via Cesare Giulio Viola, 68/70
00148 Rome, Italy
Tel +39 0665131
http://www.wfp.org/evaluation
Rom
e, M
arc
h 2
010, re
f: OE/2
010/0
05