Embed Size (px)
Citation preview

Macroeconomic and Financial Management Institute of Eastern and Southern Africa
IMPACT OF BASEL II IMPLEMENTATION: A CASE
STUDY ON ZAMBIA
Author: Lyness Phiri - Mambo
Supervisor: Dr. Blessing Mudavanhu
February, 2015
A Technical Paper Submitted in Partial Fulfillment of the Award of MEFMI
Fellowship

Abstract
The Basel capital framework is the globally accepted capital adequacy standard. This
paper investigates the impact of Basel II implementation on the financial sector in Zambia.
The paper analyses the capital adequacy position of banks in Zambia before and after
implementation of Basel II. Banks are put into three peer groups and an in-depth study of
the impact of implementation of Basel II on each peer group is carried out. Secondly, the
study reviewed developments, post the global financial crisis of 2007 in order to assess
implications for the local banking sector and the Macroeconomic and Financial
Management Institute of Eastern and Southern Africa (MEFMI) member countries and
develop a strategy for future adoption or implementation of the revisions made to the Basel
Capital Accord under Basel 2.5 and Basel III where necessary. In this regard the study
develops a living Dashboard highlighting the progress that MEFMI member countries have
made in adopting the Basel capital frameworks, which will help the Institute to focus and
tailor their capacity building initiatives accordingly.

Table of Contents
Abstract ........................................................................................................................................................ 0
List of Tables ............................................................................................................................................... 0
Acknowledgements .................................................................................................................................... 0
1. Introduction .......................................................................................................................................... 1
1.1. Structure of the Zambian Banking Sector .............................................................................. 1
1.2. Minimum Capital Requirements ............................................................................................... 3
1.3. Evolution of Basel Capital Framework .................................................................................... 5
1.4. Implementation of Basel II: Practical Considerations ........................................................... 7
1.5. Implementation of Basel II in Zambia ...................................................................................... 8
1.6. Problem Statement .................................................................................................................... 9
1.7. Objectives of the Paper ............................................................................................................. 9
1.8. Significance of Study ............................................................................................................... 10
1.9. Limitations of the Study ........................................................................................................... 11
1.10. Research Questions ............................................................................................................ 11
2. Literature Review ............................................................................................................................. 13
2.1. Background ............................................................................................................................... 13
2.2. Pre-Basel Capital Framework ................................................................................................ 14
2.3. BCBS Core Principle for Effective Supervision ................................................................... 16
2.4. Basel I Capital Framework - Overview .................................................................................. 17
2.5. Revised Capital Framework - Basel II ................................................................................... 18
2.5.1. Pillar I ..................................................................................................................................... 20
2.5.2. Pillar II .................................................................................................................................... 20
2.5.3. Pillar II - Shared Responsibility .......................................................................................... 21
2.5.4. Pillar II Governing Principles .............................................................................................. 21
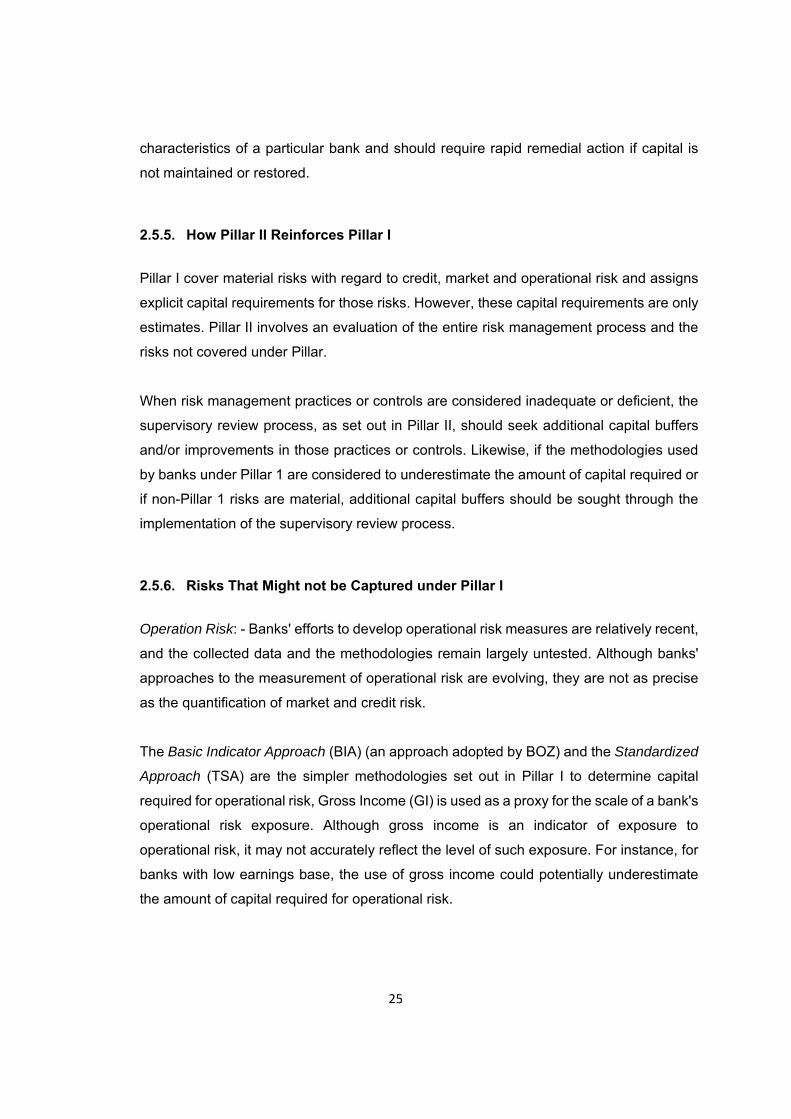
2.5.5. How Pillar II Reinforces Pillar I ........................................................................................... 25
2.5.6. Risks That Might not be Captured under Pillar I .............................................................. 25
2.5.7. Pillar III Market Discipline .................................................................................................... 26
2.6. Criteria for Determining Basel II Banks ................................................................................. 26
2.7. Rationale for Implementing Basel II ...................................................................................... 27
2.8. Basel II Implementation in Zambia ........................................................................................ 27
2.8.1. Advantages of Implementation of Basel II ........................................................................ 27
2.8.2. Expected Value Addition of Adaptation of Basel II for Banks ........................................ 28
2.8.3. Advantages for the Supervisor ........................................................................................... 29
2.8.4. Weakness and challenges of Basel II ............................................................................... 30
2.9. Preferred Basel II Pillar 1 Approaches for Zambia .............................................................. 30
2.9.1. Simplified Standardized Approach for Credit Risk .......................................................... 31
2.9.2. Credit Risk Mitigation ........................................................................................................... 32
2.10. Assessment of Risk Weights for Credit Risk under Basel II in Zambia ....................... 33
2.11. Basic Indicator Approach (BIA) for Operational Risk ...................................................... 34
2.11.1. Migration to Standardised Approach for Operation Risk ............................................ 34
2.12. Standardized Measurement - for Market Risk ................................................................. 34
2.13. Supervisory Review Process .............................................................................................. 35
2.14. Basel 2.5 and Basel III Framework .................................................................................... 35
2.15. Progress on Basel II Implementation in MEFMI Member States .................................. 38
3. Methodology ...................................................................................................................................... 40
3.1. Introduction ................................................................................................................................ 40
3.2. Data Description ....................................................................................................................... 41
3.2.1. Distribution of Assets in Banking Sector ........................................................................... 41
3.2.2. Tier 1 banks - banks with assets > ZMW5 bn .................................................................. 42
3.2.3. Tier 2 banks (banks with assets ≥ ZMW1 bn but less than ZMW5 bn) ........................ 43
3.2.4. Tier 3 banks (Banks with Assets < ZMW1 billion) ........................................................... 43
4. Results ............................................................................................................................................... 45
4.1. Distribution of Risk Weighted Assets for Tier 1 Banks ....................................................... 45
4.2. Impact of Basel I Pillar I on Tier 1 Banks .............................................................................. 45
4.3. Distribution of Risk Weighted Assets for Tier 2 Banks ....................................................... 46
4.4. Impact of Basel I Pillar I on Tier 2 banks .............................................................................. 46
4.5. Distribution of Risk Weighted Assets for Tier 3 Banks ....................................................... 47
4.6. Impact of Basel I Pillar I on Tier 3 banks .............................................................................. 48
5. Conclusion and Recommendations ............................................................................................... 50
Bibliography .............................................................................................................................................. 52

List of Figures
Figure 1: Total Assets and Liabilities of the Banking Sector (2011-2013) ..................................... 2
Figure 2: Regulatory Capital, RWA and Capital Adequacy Ratio (2011-2013) ............................. 2
Figure 3: Evolution of Basel Capital Framework ............................................................................ 5
Figure 4: Basel I Capital Accord Architecture .............................................................................. 18
Figure 5: Three Mutually Enforcing Pillars ................................................................................... 19
Figure 6: Basel 2.5 and Basel III Framework ............................................................................... 37
Figure 7: Assets Distribution ......................................................................................................... 42

List of Tables
Table 1: Basel I Asset Classification .............................................................................................. 5
Table 2: Minimum Capital Adequacy Ratios .................................................................................. 6
Table 3: Evolution of Basel Capital Framework ............................................................................. 7
Table 4: ECA Consensus Risk Scores ......................................................................................... 32
Table 5: ECA Consensus Risk Scores ......................................................................................... 32
Table 6: Tier 1 Asset Composition ............................................................................................... 42
Table 7: Tier 2 Assets Composition ............................................................................................. 43
Table 8: Tier 3 Asset Composition ............................................................................................... 44
Table 9: Tier 1 Banks RWA Distribution ....................................................................................... 45
Table 10: Tier 2 Banks RWA Distribution ..................................................................................... 46
Table 11: Tier 3 Banks RWA Distribution ..................................................................................... 48

Acknowledgements
I would like to thank my mentor, Dr. Blessing Mudavanhu for the guidance and support
given during the course of my research.
I would like to extend my sincere gratitude to the Bank of Zambia management their
support throughout my MEFMI fellowship program. I wish to also extend special thanks to
Ms Gladys Chongo Mposha, Mr. Ephraim Musilekwa, Mr. Raphael Kasonde and Mr.
Moses Chatulika for the comments and technical insights during my research. Further I
would like thank the Bank Supervision Department at large for the encouragement and
support provided to me throughout the program.
I am also very grateful to the MEFMI Secretariat, for funding my customized training
program and enhancing my supervisory skills. Furthermore, appreciation is extended to
Dr. Fundanga, Dr. Ngalande, Mr. Ncube, Mr. Mutimba, Mrs. Makamba and the entire
MEFMI secretariat for according me the opportunity to be part of the fellowship program
and their unwavering support.
And finally I wish to extend special thanks to my husband, for his patience and support.

1
List of Acronyms and Abbreviations
AIRB Advanced Internal Ratings–Based Approach
AMA Advanced Measurement Approach
BCBS Basel Committee on Banking Supervision
BCF Basel Capital Framework
BCP Basel Core Principles for Effective Banking Supervision
BIA Basic Indicator Approach
BOZ Bank of Zambia
CAR Capital Adequacy Ratio
CCF Credit Conversion Factors
CRM Credit Risk Mitigation
ECA Export Credit Agencies
FDIC Federal Deposit Insurance Corporation
FIRB Foundation Internal Ratings-Based Approach
FSAP Financial Sector Assessment Programme
GI Gross Income
GRZ Government Republic of Zambia
ICAAP Internal Capital Adequacy Assessment Process
IMF International Monetary Fund
LCR Liquidity Coverage Ratio
MEFMI Macroeconomic and Financial Management Institute
NSFR Net Stable Funding Ratio
OECD Organization of Economic Cooperation and Development
RCAP Regulatory Consistency Assessment Programme
RWA Risk - Weighted Assets
SA Standardized Approach
SADC Southern African Development Community
SREP Supervisory Review and Evaluation Process
SSA Simplified Standardized Approach
TSA The Standardized Approach

1
1. Introduction Banks are among the most highly leveraged institutions due to the roles that they play in
the economy. To draw from Sihna (2014) presentation that the financial system in general
and banks in particular are essential to the economy and their functioning has large
implications for economic growth. This stems from the banks’ role of financial
intermediation between savers and borrowers, promote saving which enhances free
enterprise. Banks take depositors funds, essentially borrowing funds and then at the same
time lending it out to their customers who are in need of financing, this creates a series of
debts. It has been argued by Simpson (2014) that when asset values decline, those assets
are less able to service debt, which in turn makes it difficult for banks to take in more
deposits thereby reducing the banks’ ability to lend. This results in a decrease in the flow
of credit from savers to borrowers and a decline in economic activity. In Zambia, the
banking sector accounts for over 80% of the financial sector’s total assets. The banking
sector is therefore a critical component of the Zambian financial system [Bank of Zambia
Financial Stability Report. 2014].
1.1. Structure of the Zambian Banking Sector
The Zambian banking sector comprised 19 commercial banks as at the end of December,
2013, and of which 13 banks were subsidiaries of foreign banks, 4 banks were locally
incorporated private banks while 2 were quasi-owned by the Government of the Republic
of Zambia. [The Bank Supervision of Zambia, 2013 Annual Report].
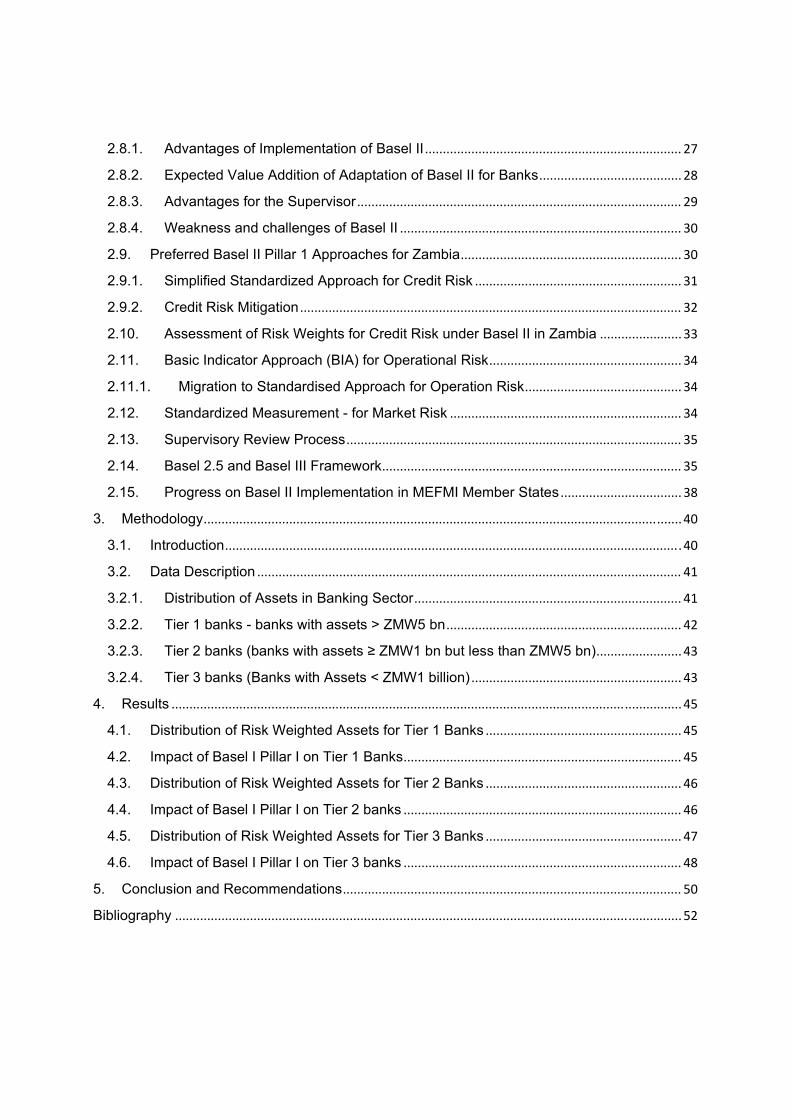
The total assets of the banking sector as at the end the December 2013 was ZMW41,953
million (US$7,628 million). The sector’s assets composition was mainly dominated by net
loans and advances which accounted for the largest share of the sector’s total assets at
43% followed by investment in government securities at 23%. Other significant classes of
assets included balances with the Bank of Zambia at 12%, then balances with foreign
financial institutions at 11% [Bank of Zambia, 2013 Annual Report]. The major funding for
the sector’s assets was customer deposits which accounted for 86% of total liabilities and
74% of total assets. [Bank Supervision, 2013 Annual Report]. Figure 1 depicts the growth
in total assets and deposits over the last three years.
2
Figure 1: Total Assets and Liabilities of the Banking Sector (2011-2013)
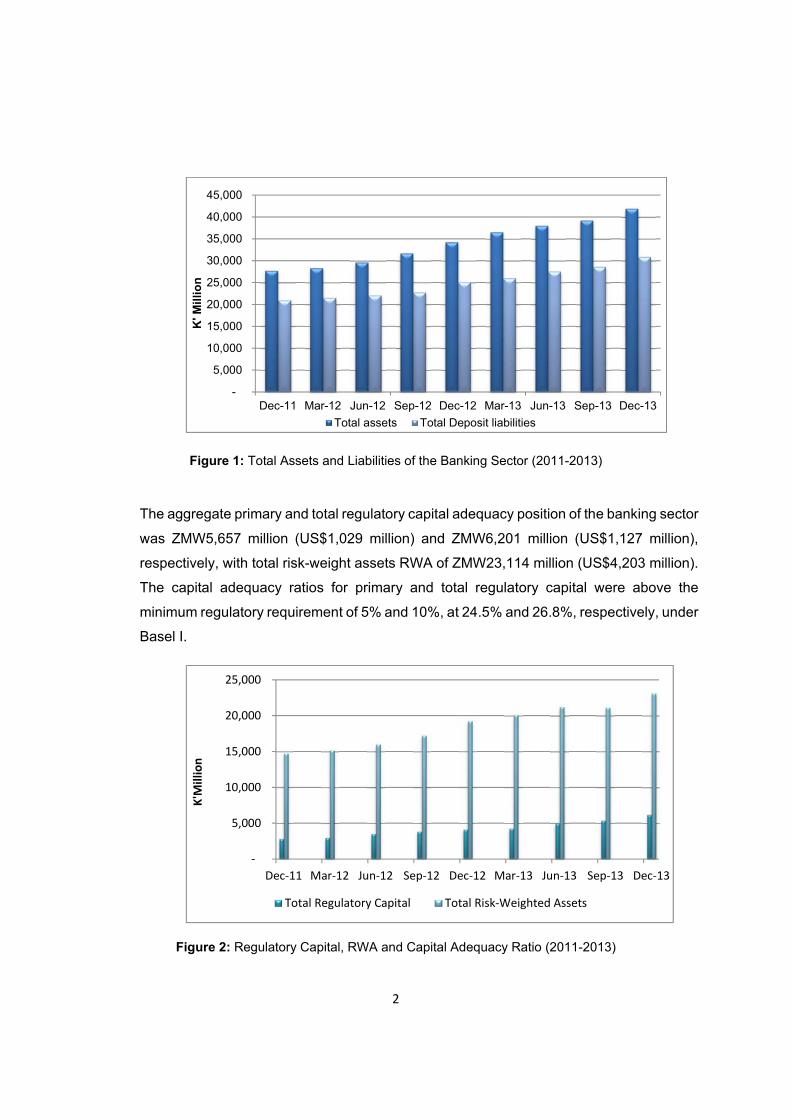
The aggregate primary and total regulatory capital adequacy position of the banking sector
was ZMW5,657 million (US$1,029 million) and ZMW6,201 million (US$1,127 million),
respectively, with total risk-weight assets RWA of ZMW23,114 million (US$4,203 million).
The capital adequacy ratios for primary and total regulatory capital were above the
minimum regulatory requirement of 5% and 10%, at 24.5% and 26.8%, respectively, under
Basel I.
Figure 2: Regulatory Capital, RWA and Capital Adequacy Ratio (2011-2013)
-
5,000
10,000
15,000
20,000
25,000
30,000
35,000
40,000
45,000
Dec-11 Mar-12 Jun-12 Sep-12 Dec-12 Mar-13 Jun-13 Sep-13 Dec-13
K' M
illio
n
Total assets Total Deposit liabilities
‐
5,000
10,000
15,000
20,000
25,000
Dec‐11 Mar‐12 Jun‐12 Sep‐12 Dec‐12 Mar‐13 Jun‐13 Sep‐13 Dec‐13
K'M
illion
Total Regulatory Capital Total Risk‐Weighted Assets

3
1.2. Minimum Capital Requirements
Nearly all jurisdictions with active banking systems require banks to maintain a minimum
level of capital adequacy to minimize disruptions to the financial system. Capital serves
as a cushion against unexpected losses and ensures future growth. Adequate levels of
capital help to promote public confidence in the banking system and enhance the financial
system’s resilience to shocks. The level and type of capital a bank requires has to be
commensurate with risks that a bank is exposed to in order to ensure adequate protection.
Prior to 1988, the requirements governing regulatory capital were country specific.
However, over time it became apparent that international convergence of regulatory
capital was desirable, especially given the increasing global activities of many banks. To
that end International Convergence of Capital Measurement and Capital Standards
(Commonly known as Basel I) was released in 1988, by the Basel Committee on Banking
Supervision (BCBS). Although the Accord was intended for internationally active banks
within the BCBS member countries1, over a 100 countries adopted Basel I, this lead to
increased consistency in defining regulatory capital [Reserve Bank of India Occasion
Papers Vol. 29, No. 2, Monsoon, 2008].
The main objectives of the Basel Committee when developing the regulatory convergence
(Basel I) was that the Basel Accord would strengthen the soundness and stability of the
international banking system; and that the framework would be fair and have a degree of
consistency in its application to banks in different countries with a view of reducing
competitive inequality among international banks [BCBS: International Convergence of
Capital Measurement and Capital Standards]. Basel I however, was considered to have a
narrow focus as it initially only covered credit risk and had a narrow range of risk-weights
which was not based on the riskiness of the underlying asset or instrument. Market risk
was only later included as part of amendments of 1996.
Following the economic turbulence in the world financial system 1997/1998, the risks that
internationally active banks from G-10 countries had to deal with had become more
complex and challenging. The review of the Basel I was designed to improve the way
1 The BCBS comprises bank supervisors from 27 member countries (Argentina, Australia, Belgium, Brazil, Canada, China, France, Germany, Hong Kong SAR, India, Indonesia, Italy, Japan, Korea, Luxembourg, Mexico, the Netherlands, Russia, Saudi Arabia, Singapore, South Africa, Spain, Sweden, Switzerland, Turkey, United Kingdom, and the United States).
4
regulatory capital requirements reflect underlying risks. It was also designed to better
address the financial innovation that had occurred, for example, asset securitisation
structures. Such innovations rendered Basel I less effective in ensuring that capital
requirements match a bank’s true risk profile. The review was also aimed at recognizing
the improvements in risk measurement and control that had occurred [Consultative
Document - Overview of the Basel New Capital Accord, 2001]. Subsequently, numerous
improvements were made to the Accord aimed at making capital more risk sensitive, which
resulted in momentous enhancements leading to the issuance of Basel II.
However, the Global Financial Crisis of 2007 highlighted weakness with Basel II and the
BCBS responded with Basel 2.5 and Basel III. Basel II made significant changes to the
methodology for computing risk-weighted assets (RWA). While Basel III proposes to make
significant changes to the definition of capital and asset quality.

5
1.3. Evolution of Basel Capital Framework
Figure 3: Evolution of Basel Capital Framework
Basel I primarily focused on credit risk and appropriate risk-weighting of assets with regard
to credit risk. Banks’ assets were classified and grouped in five classes according to
degree of credit risk as indicated in Table 1 below:
Asset Classification2 Risk
Weight Cash, bullion, Government Securities 0% Claims on domestic public-sector entities, excluding central government, and loans guaranteed by such entities
20%
Loans fully secured by mortgage on residential property that is or will be occupied by the borrower or that is rented
50%
Corporate debt 100% Some assets with no rating for on balance sheet items 100%
Table 1: Basel I Asset Classification
The Basel I also took account of the credit risk in off-balance-sheet exposures by applying
credit conversion factors to the different types of off-balance-sheet items. With the
exception of foreign exchange and interest rate related contingencies, the credit
2 Source: BCBS: International Convergence of Capital Measurement and Capital Standards

6
conversion factors ranged from 0% to 100%. They were derived from the estimated size
and likely occurrence of the credit exposure, as well as the relative degree of credit risk
as identified in the Committee's paper "The management of banks' off-balance sheet
exposures: a supervisory perspective" issued in March 1986. The credit conversion
factors would be multiplied by the weights applicable to the class of the counterparty for
an on-balance-sheet transaction International Convergence of Capital Measurement and
Capital Standards. Banks with international presence were required to hold capital equal
to 4% and 8% of their risk-weighted assets (RWA) for Tier 1 capital and total capital,
respectively.
Minimum Capital Adequacy Ratios
Tier 1 capital ratio = tier 1 capital / all RWA
Total capital ratio = (tier 1 + tier 2 + tier 3 capital) / all RWA
Table 2: Minimum Capital Adequacy Ratios
Basel II represented advancement over Basel I. Basel II is considered significantly more
risk-sensitive as it covers risks that were not covered by Basel I such as operational risk
and other risks such credit concentration risk, liquidity risks, interest rate risk in the banking
book. Further, credit risk has moved from simple credit risk–weighting to modeling credit
risk.
The financial crises of 2007 greatly affected the stability global banking system. It was
apparent that the Basel II Framework was insufficient with regard to its risk coverage
relating to complex securitization and re-securitization activities. Consequently, Basel 2.5
was issued as an interim measure and focused on only additional risks concerning banks’
securitization and re-securitization activities with regard to credit risk and market risk
[Saudi Arabian Monetary Agency’s Approach to Implement Basel 2.5: Saudi Arabian
Monetary Agency Banking Supervision Department, and October 2012]. Basel III provided
further enhancements to Basel I, Basel II and Basel 2.5 by strengthening of the definition
of regulatory capital. Following the 2007 global financial crisis, the Banking Basel
Committee on Banking Supervision embarked on global capital and liquidity reforms
aimed at strengthening the banking sector’s ability to absorb shocks arising from financial

7
and economic stress hence minimizing the risk of spillover from the financial sector to real
economy. Below is a summary of how Basel Capital Framework3 has evolved.
Basel I Basel II Basel 2.5 Basel III Definition of regulatory capital 1988 2010 Simple credit risk - weighting 1988 2004 Modeling credit risk 2004 Market risk 1996 2005 2009 Operational risk 2004 Counterparty risk 1988 2004 2010 Securitization 2004 2009 Pillar 2 2004 2009 Pillar 3 2004 2009 Regulatory capital adequacy ratio (CAR)
1988 2010
Capital conservation buffer 2010 Countercyclical buffer 2010 Leverage ratio 2010 Global systemically important banks
2011
Table 3: Evolution of Basel Capital Framework
1.4. Implementation of Basel II: Practical Considerations4 Following the release of the Basel II in June 2004, the Committee recognised that adoption
of the Revised Framework in the near future would not be a priority for all supervisors in
non-G10 countries in terms of what is needed to strengthen their supervision regime.
The BCBS indicated that Basel II was aimed at building a solid foundation of prudent
capital regulation, supervision, and market discipline and to enhance risk management
and financial stability. As such, the Committee encouraged each national supervisor to
consider cautiously the benefits of the new Framework in the context of their own local
banking system in developing their implementation plan and approach. Considering the
required resources and constraints, the plans were expected to extend beyond the
Committee’s implementation dates. Supervisors were therefore expected to consider
implementation of key elements of the supervisory review and market discipline
3 Data Source: FSIConnect (http://www.fsiconnect.org) 4 Basel Committee on Banking Supervision. 2004. Implementation of Basel II: Practical Considerations

8
components of the new Framework even if the Basel II minimum capital requirements
were not fully implemented by the implementation date. National supervisors were also
expected to ensure that banks that did not implement Basel II were subject to prudent
capital regulation and sound accounting and provisioning policies.
1.5. Implementation of Basel II in Zambia As was the case with Basel I Capital Framework of 1988 which established the first
internationally accepted definition and measure of bank regulatory capital, the Bank of
Zambia (BOZ), made a policy decision to implement the Basel II Capital Framework by
2009. However, this was not achieved as planned and the new implementation date was
moved to 2014.
A project team was established to spearhead the implementation process of Basel II. The
team carried out a number of activities between 2004 and 2007. However, due to staff
constraints and other pressing demands in general, work scaled down considerably from
2008. However, implementation of Basel II remained one of the Bank of Zambia’s strategic
objectives since 2008. In 2009, BOZ appointed a dedicated team to advance the
implementation process and set January, 2014 as the new implementation date. Further,
the adoption of Basel II is a requirement under the SADC Committee of Central Bank
Governors’ Sub-Committee on Banking Supervision, with an implementation target date
of 2014. Basel II comprise of three mutually reinforcing pillars as indicated below:
Pillar I - Minimum Capital Requirements;
Pillar II - Supervisory Review Process; and
Pillar III - Market discipline.
Pillar I, prescribes the minimum capital requirements and banks are supposed to allocate
capital for credit, market and operational risk. While under Pillar II banks are expected to
allocate additional capital for risks that are not covered under Pillar I. Pillar II focuses on
the banks’ internal capital adequacy assessment process (ICAAP) and supervisory review
and evaluation process (SREP). The third pillar deals with market discipline which
reinforce efforts to promote safety and soundness in banks.
Implementation of Basel II is not an end in itself for Zambia as a lot of improvements have
occurred since the global financial crisis of 2007 aimed at enhancing the stability of the

9
financial system. The study therefore, also reviewed the latest developments, post the
global financial crisis of 2007 and develop a strategy for future adoption/implementation
of the revisions that have been made to the Basel Capital Accord under Basel 2.5 and
Basel III.
1.6. Problem Statement
Following the global financial crisis of 2007 a lot of improvements have been done to the
Basel capital framework. Although the Basel capital framework is intended for
internationally active banks, non G-10 countries implement the accords in order to be
competitive. However, countries in the non-G10 countries, such as MEFMI member states
including Zambia are at various stages of implementing Basel Accord, this poses a
challenge when developing strategies to address problems being faced by MEFMI
member countries in the implementation of Basel II.
The integrity of data is considered to posse difficulties in the assessment and
quantification of the impact of adopting Basel II on the banks’ capital adequacy position in
Zambia.
There is no prescribed methodology for allocation of capital for Pillar II risks. Pillar II is
principle based. Under Pillar II, banks are expected to conduct an Internal Capital
Adequacy Assessment Process (ICAAP) and to set aside capital for all risks not covered
under Pillar I. The major challenge for supervisors lies in the limited skills and human
resources required to evaluate the ICAAP document and interrogate banks’ internal
models used in the allocation of capital for pillar II risks. It is therefore important that
regulators develop the right set of skills required to evaluate and validate the models being
used or develop a framework to ensure oversight.
1.7. Objectives of the Paper

10
The primary objective of this paper is to establish the impact of Basel II on the commercial
banks’ capital adequacy in Zambia. In this regard, the paper aims at:
i. Determining the current status of the Basel II project in Zambia and the MEFMI
member countries
ii. Determining the impact of Basel II on the banks’ capital adequacy position.
iii. Establishing the implementation status of Basel 2.5 and Basel III and implication for
Zambia and MEFMI member countries.
1.8. Significance of Study
Globalization and deregulation brought about sweeping changes in the banking sector
across countries. One may wonder about the relevance of the Basel II framework
especially for emerging countries, as it was designed for internationally active banks. The
position of most regulators and indeed that of the Bank of Zambia is that countries have
integrated with the rest of the world. It is for this reason that no country can afford to have
regulatory standards that deviate from global standards, as banking has evolved into a
global industry and physical boundaries no longer have any significant bearing in financial
markets.
To be part of the international financial system and to remain competitive, countries have
to adopt internationally accepted standards and Basel II is the globally accepted standard
by which the banking sector’s solvency is measured. Any deviation would harm a nation’s
financial system stability through perception and also in actual practice. If local standards
are perceived to be lower than the norm, local banks would be at a competitive
disadvantage globally. In practice, it has to be recognized that Basel II provides for
improved risk management systems in banks. It is important that banks have the cushion
afforded by improved risk management systems to withstand external shocks, especially
as they deepen their links with the global financial system.
The aim of this study is to provide an assessment of the impact of Basel II on capital
adequacy position of banks. This will be done using an in-depth study of the 19 banks
currently operating in the Zambia. As the banks are of varying size, banks will be put into

11
three peer groups based on asset size, and then a peer analysis will be conducted. The
study will also explore the status of Basel II implementation in the MEFMI region.
1.9. Limitations of the Study
The main limitation of the study is data integrity; most banks are in the process of
configuring their data and Information technology systems to ensure Basel II compliant.
Zambia like most MEFMI member countries also have less developed secondary markets
for market risk and credit risk mitigation securities such as government or sovereign debt
instruments which will make valuation of the securities difficult. The absence of credible
external rating agents will result in the one size fits all allocation of risk weights for
corporates.
Due to lack of data concerning operational risk under the standardised approach, based
on the banks’ activities which are divided into eight business lines: corporate finance,
trading and sales, retail banking, commercial banking, payment and settlement, agency
services, asset management, and retail brokerage. The study will limit its assessment to
the basic indicator approach as most banks are in the process of reconfiguring their
systems so that data is captured according to the prescribed business lines.
Further, like Zambia most countries in the sub-Saharan Africa region are at varying levels
of Basel II implementation, hence there will be very limited information or comparable data
with regard to allocation of capital to Pillar 2 risks. In addition limited model validation skills
might result in inconsistent capital allocation under pillar II.
An earlier study that was done on Basel II, focused on assessment of the impact of
implementing simpler approaches of Pillar 1 on the regulatory capital of banks in Zambia
(Moses H Chatulika, 2008).
1.10. Research Questions
i. What is the current status of the Basel II project in Zambia and the MEFMI member
countries?
ii. What is the impact of Basel II on the Zambian banks’ capital adequacy position?

12
iii. What is the implementation status of Basel 2.5 and Basel III and implication for
Zambia and MEFMI member countries?
The following chapters seek to address these research questions.

13
2. Literature Review
2.1. Background
The Basel Committee on Banking Supervision (BCBS) has its beginnings in the financial
market crises that followed the collapse of the Bretton Woods System of managed
exchange rates of 1973. After the collapse of Bretton Woods System many banks incurred
huge foreign exchange losses. On 26 June 1974, West Germany’s Federal Banking
Supervisory Office withdrew Bankhaus Herstatt’s banking licence after finding that the
bank’s foreign exchange exposures amounted to three times its capital. Banks outside
Germany took heavy losses on their unsettled trades with Herstatt, adding an international
dimension to the crisis. In October the same year, the Franklin National Bank of New York
also closed its doors after incurring large foreign exchange losses.
To address the above and other interruptions in the international financial markets, the
central bank governors of the G10 countries established a Committee on Banking
Regulations and Supervisory Practices at the end of 1974. The Committee was created
as a forum for regular cooperation between its member countries on banking supervisory
matters. Its aim was and is to enhance financial stability by improving supervisory
knowhow and the quality of banking supervision worldwide. [Basel Committee on Banking
Supervision: A brief history of the Basel Committee, October 2014]
The Committee comprises bank supervisors from 27 member countries5 [Basel
Committee on Banking Supervision: A brief history of the Basel Committee, October
2014]. One of its best known publications is commonly referred to as the Basel Capital
Accord (Basel I), which was published in 1988 and a revised Basel Capital Framework
(BCF), known as Basel II, was published in 2004, followed by Basel III in 2010.
The Basel Capital Accord of 1988, made major developments towards harmonization of
bank capital standards. The Basel Capital Accord has seen a number of amendments
since. Though capital regulation in banking had existed in some form or the other even
5 The Basel Committee on Banking Supervision consists of senior representatives of bank supervisory authorities and central banks from Argentina, Australia, Belgium, Brazil, Canada, China, France, Germany, Hong Kong SAR, India, Indonesia, Italy, Japan, Korea, Luxembourg, Mexico, the Netherlands, Russia, Saudi Arabia, Singapore, South Africa, Spain, Sweden, Switzerland, Turkey, the United Kingdom and the United States.

14
before the issuance of Basel Accord in 1988, the Accord marked a defining moment
towards harmonization of bank capital regulation across different jurisdictions and more
than 100 countries adopted the Basel I regulatory requirement of capital [Basel Committee
on Banking Supervision-Working Papers, Capital Requirements and Bank Behaviour: The
Impact of the Basle Accord, April 1999].
2.2. Pre-Basel Capital Framework
Prior to Basel Capital Framework, the use of capital ratios to establish minimum regulatory
requirements was being tried world over, but none were universally accepted at that time.
The escalation in bank failures and falling bank capital triggered a regulatory response in
1981 when, for instance, for the first time, the federal banking agencies in the US
introduced explicit numerical regulatory capital requirements. According to the data from
the USA Federal Deposit Insurance Corporation’s (FDIC) Division of Research and
Statistics, from 1980 to 1994, a total of 1,617 commercial and savings banks failed, the
failed banks accounted for US$206.179 billion in assets [FDIC: History of the Eighties -
Lessons for the Future, An Examination of the Banking Crises of the 1980s and Early
1990s Volume 1]. In another study based on FDIC data, 1,043 Thrifts failed or were
otherwise resolved from 1986-1995. In this case the institutions accounted for assets
amounting to $519 billion. The banking crisis of the 1980s was therefore a two-fold, on
one hand it related to the failure of savings and loans (the S&L crisis), which represented
the bulk of the assets and number of banks, and the other linked to the failure of large
commercial banks. When the above bank failures are compared to bank failure data
leading up to the 1980s, then magnitude of the crisis becomes evident. From 1965-1979,
for example, just 0.3% of all existing banks failed [FDIC: History of the Eighties - Lessons
for the Future, An Examination of the Banking Crises of the 1980s and Early 1990s Volume
1].
The increase in the number of bank failures in the 1980s had no single cause or list of
causes. Rather, it resulted from a concurrence of various forces working together to
produce a decade of banking crises. These included economic, financial, legislative, and
regulatory, established the preconditions for the increased number of bank failures at least
in the case of the USA. Further, a series of severe regional and sectoral recessions hit
banks in a number of banking markets and led to a majority of the failures. Furthermore,

15
some of the banks in these markets assumed excessive risks and were insufficiently
restrained by supervisory authorities, with the result that they failed in disproportionate
numbers [FDIC: History of the Eighties - Lessons for the Future, An Examination of the
Banking Crises of the 1980s and Early 1990s Volume 1]
The adopted standards employed a leverage ratio of primary capital (which consisted
mainly of equity and loan loss reserves) to average total assets. However, each regulator
had a different view as to what exactly constituted bank capital. With passage of time,
regulators worked to converge upon a uniform measure. The inadequate capitalization of
Japanese banks and differing banking structures (universal banks of Germany vis-à-vis
narrow banks of US) and varying risk profile of individual banks made agreement on
capital standards problematic.
The US Congress passed legislations in 1983, directing the federal banking agencies to
issue regulations addressing capital adequacy [Peterson Institute for international
Economics, Banking on Basel Preview Chapter 2: Role of Capital Regulations]. The
legislation provided the motivation for a common definition of regulatory capital and final
uniform capital requirements in 1985. By 1986, regulators in the US were concerned about
the failure of primary capital ratio to differentiate among risks and not providing an accurate
measure of the risk exposures associated with innovative and expanding banking
activities, most notably off-balance-sheet activities at larger institutions.
This prompted regulators in the US to start studying the risk-based capital frameworks
other countries like France, the UK and West Germany which had implemented risk-based
capital standards in 1979, 1980 and 1985, respectively. The agencies also revisited the
earlier studies of risk-based capital ratios. Leading the initiative in 1987, the US joined the
UK in announcing a bilateral agreement on capital adequacy, then Japan followed suit.
Subsequently in December 1987 ‘international convergence of capital measures and
capital standards’ was achieved and Basel Accord was released in July 1988.

16
2.3. BCBS Core Principle for Effective Supervision
To ensure effective supervision of banks, the BCBS Committee (the Committee) issued
the Basel Core Principles. The 29 Basel Core Principles are a framework of minimum
standards for sound prudential regulation and supervision of banks and banking systems.
The first 25 core principles were originally issued in 1997 and are used by countries as a
benchmark for assessing the quality of their supervisory systems and for identifying future
work to achieve a baseline level of sound supervisory practices [Basel Committee on
Banking Supervision: A brief history of the Basel Committee, October 2014]. The Core
Principles are also used by the International Monetary Fund (IMF) and the World Bank, in
the context of the Financial Sector Assessment Programme (FSAP), to assess the
effectiveness of countries’ banking supervisory systems and practices [International
Monetary Fund and World Bank, 2002: Implementation of the Basel Core Principles for
Effective Banking Supervision, Experiences, Influences, and Perspectives].
According to the BCBS Core Principle for effective supervision Principle 16 - Capital
Adequacy: The supervisor sets prudent and appropriate capital adequacy requirements
for banks that reflect the risks undertaken by, and presented by, a bank in the context of
the markets and macroeconomic conditions in which it operates. The supervisor defines
the components of capital, bearing in mind their ability to absorb losses. At least for
internationally active banks, capital requirements are not less than the applicable Basel
standards. Supervisors must be satisfied that banks and banking groups have in place a
comprehensive risk management process (including Board and senior management
oversight) to identify, evaluate, monitor and control or mitigate all material risks and to
assess their overall capital adequacy in relation to their risk profile. These processes
should be commensurate with the size and complexity of the institution. The two
fundamental objectives of the Committee’s work on regulatory convergence were:
for the framework to strengthen the soundness and stability of the
international banking system; and
for the framework to be fair and have a high degree of consistency in its
application to banks in different countries with a view to diminishing an existing
source of competitive inequality among international banks.
17
2.4. Basel I Capital Framework - Overview
The main features of Basel I was outlined in ‘International Convergence of Capital
Measurement and Capital Standards’ in three sections. The first two sections described
the framework in terms of the constituents of capital and the risk weighting system and the
third section dealt with the target ratio. The Accord provided a framework for fair and
reasonable degree of consistency in the application of capital standards in different
countries, and a shared definition of capital. The central focus of the Basel I framework
was credit risk and, as a further aspect of credit risk, country transfer risk.
The Committee later amended the Capital Accord to include risks other than credit risk,
which was the focus of the 1988 Accord. In January 1996, the Committee released the
Market Risk Amendment to the Capital Accord. This was designed to incorporate within
the Accord a capital requirement for the market risks arising from banks’ exposures to
foreign exchange, traded debt securities, equities, commodities and options.
The 1988 Capital Accord and its amendments played a significant role in creating a safe
and stable financial system by setting a common minimum capital requirement. However,
as the financial system evolved and become more sophisticated, the deficiencies in the
Accord become apparent and resulted in increased criticism of the Basel I. In its attempt
to close loopholes and re-establish a level playing field the Basel Committee started a
process of establishing a new accord, which would address the deficiencies to much the
changed realities in the financial system Mrak M, (2003).

18
Figure 4: Basel I Capital Accord Architecture
2.5. Revised Capital Framework - Basel II The faster rate of financial innovations, however, brought to the fall deficiencies of Basel I
framework and the need for a more risk-sensitive capital standard. Following years of
consultations and modifications, the revised capital framework, popularly known as Basel
II was issued by the BCBS in June 2004.
In July 2004, the BCBS published a document “Implementation of Basel II: Practical
Consideration”. The Committee encouraged each national supervisor to consider carefully
the benefits of the Basel II in the context of its own domestic banking system. The Basel
Committee was alive to the fact that given resource and other constraints, individual
country plans might extend beyond the Basel Committee's implementation dates.
The main objective of Basel II is to encourage improved risk management through the use
of three mutually reinforcing Pillars. While banks have primary responsibility for
appropriately measuring material risks and maintaining adequate capitalization, the Basel
II Framework recognizes that Pillar I minimum capital requirements cannot be the sole
answer to adequate capitalization and risk management in banks or safety and soundness

19
in a banking system. Strong risk-based supervisory review with early intervention and
market discipline under Pillars II and III, respectively, complement minimum capital
requirements.
It was therefore expected that supervisors in some jurisdictions could wish to retain their
current approach to minimum capital requirements and to focus their efforts on building a
strong supervisory review framework and to enhance market discipline, in line with the
principles underlying Pillars II and III. Assessment of countries’ compliance with the Basel
Committee's BCP provided good indications of areas of supervision that needed
strengthening in order to meet the standard supervisory requirements.
Basel II also prompted supervisors to consider the cross-border implications of the
implementation choice for instance, supervisors must evaluate whether the legal and
regulatory framework foster an effective system of cross-border supervisory exchange of
information, cooperation and co-ordination.
Figure 5: Three Mutually Enforcing Pillars

20
2.5.1. Pillar I
The requirements under Pillar I address and allocate capital for the principal risks faced
by banks, namely credit risk, market risk and operational risk. However, the business of
banking also involves other risks. Although Basel II retained the capital definition as
prescribed under Basel I and the minimum capital adequacy ratio, significant changes
were introduced in measurement of the risks. The key objective of Pillar I was to bring
greater risk-sensitivity in the computation of capital adequacy ratios and, therefore, more
flexibility in the computation of banks’ individual risk Rojas-Suarez L (2001). Under Basel
II, measurement of market risk remained unchanged, while the measurement of credit risk
was made more complex and refined. Operational risk was also included to the risks that
had to be individually quantified and supported by capital Mrak M (2003).
2.5.2. Pillar II
Pillar II acknowledges that banks also face risks not explicitly included under Pillar I. It
also recognizes that risks such as concentration risk are not fully captured under Pillar I
and that the measures used to capture risks under Pillar I, such as operational risk, are
estimates based on proxy measures. Pillar II therefore seeks to ensure that each bank
has sound internal processes in place, based on a thorough evaluation of its risks, to:
ensure that risk management and internal controls are aligned with the entity’s risk
characteristics; and
determine the level of capital that is commensurate with its overall risk profile
However, the Financial Crisis that began in 2007 revealed significant shortcomings in both
risk management and supervision – both of which form the backbone of Pillar II. In
response, the Committee developed enhanced guidance under Pillar II in order to address
a number of flaws highlighted by the crisis. The guidance did not replace, or change, the
Pillar II supervisory review process released as part of the implementation of Basel II, but
rather supplemented it. The supplemental guidance became effective in July 2009
[fsiconnect].

21
2.5.3. Pillar II - Shared Responsibility Bank management has the ultimate responsibility for managing the bank's risks and
determining the level of capital commensurate to the bank's risk profile.
Supervisors have the responsibility for evaluating how well banks assess their capital
adequacy needs relative to their risk profile, including whether banks are appropriately
addressing the relationship between different types of risk. In assessing the adequacy of
a bank's capital levels, supervisors must take into account the relationship between the
amount of capital held by the bank against its risks and the strength and effectiveness of
the bank's risk management and internal control processes.
The supervisory review process involves an active dialogue to promote a better
understanding between bank management and supervisors. This will facilitate prompt and
decisive action to reduce risk and/or increase capital levels when deficiencies are
identified.
2.5.4. Pillar II Governing Principles
Pillar II is principle based and comprises four principles. The first principle relate to the
responsibility of the banks.
The first Principle - states that banks should have a process for assessing their overall
capital adequacy in relation to their risk profile and a strategy for maintaining their capital
levels. Pillar II is also intended to ensure that banks not only hold adequate capital to
support all their risks, but also encourages banks to develop and use better risk
management techniques in monitoring and managing their risks.
The 2009, enhancements to the BCF emphasized the need for improved risk
management, including that senior management have an integrated, firm-wide
perspective of a bank's risk exposures, in order to support its ability to identify and react
to emerging and growing risks in a timely and effective manner.

22
In particular, the BCBS identified the importance of improved risk management to capital
markets activities (including securitization, off-balance sheet exposures, structured credit
and complex trading activities).
A sound risk management system should have the following key features:
active board and senior management oversight
appropriate policies, procedures and limits
comprehensive and timely identification, measurement, mitigation, controlling,
monitoring and reporting of risks
appropriate management information systems, both at the business and firm-wide
levels; and
comprehensive internal controls
A core component of Pillar II is the documentation of each bank's internal capital adequacy
assessment process (ICAAP). The ICAAP should reflect an integrated approach to risk
management and capital management, involving an assessment of the level of, and
appetite for, risk and then ensuring that the level and quality of capital is appropriate to
that risk profile. It is the bank's responsibility to ensure that it holds adequate capital to
support its risks. The BCF does not prescribe a template for the ICAAP, but rather
identifies five main features of a rigorous process. These features are as follows:
Board and senior management oversight
Sound capital assessment
Comprehensive assessment of risks
Monitoring and reporting
Independent internal control review
Further, based on significant weakness brought to light by the 2007 global financial crisis
in the risk management practices of a number of banks, it was apparent that many banks
did not practice prudent risk management against the backdrop of a prolonged period of
favourable economic conditions, rising asset prices, access to cheap funding sources and
intense competition among financial intermediaries. In response to these identified
weaknesses, the BCBS issued supplemental Pillar II guidance in July 2009 that it expects
all banks to incorporate into their ICAAP.

23
The ICAAP is expected to be forward looking. The forward-looking aspect of the ICAAP is
achieved through Stress Testing. A stress test of a bank is an evaluation of its financial
position under a severe but plausible scenario to assist in decision making within the bank.
Stress testing assists banks to understand their risk profile and their risk appetite against
their ability to absorb loss. It also alerts bank management to adverse unexpected
outcomes related to a broad variety of risks and provides an indication of how much capital
might be needed to absorb losses should large shocks occur.
A bank's capital planning process should incorporate rigorous, forward-looking stress tests
that identify possible events or changes in market conditions that could adversely impact
the bank and thus the bank's future capital resources and its capital requirements.
In its 2009 enhancements to the BCF, the BCBS emphasised the role of stress testing.
The BCBS noted that stress testing complements and helps validate other quantitative
and qualitative approaches so that bank management has a more complete understanding
of the bank's risks and the interaction of those risks under stressed conditions. In the
context of Pillar II, the bank's ICAAP must assess capital adequacy under stressed
conditions against a number of capital ratios, including regulatory capital measures.
The second Principle under Pillar II addresses the responsibilities of supervisors for
assessing a bank's ICAAP. Principle 2 - Supervisors should review and evaluate banks’
internal capital adequacy assessments and strategies, as well as their ability to monitor
and ensure their compliance with regulatory capital ratios. Supervisors should take
appropriate supervisory action if they are not satisfied with the result of this process.
The third Principle - Supervisors should expect banks to operate above the minimum
regulatory capital ratios and should have the ability to require banks to hold capital in
excess of the minimum. Pillar II recognises that banks face risks not included under Pillar
I and that many banks choose to operate at capital levels well above those implied by
Pillar I minima. Pillar II expresses the expectation that banks should operate above the
Pillar I minimum. Pillar II is not intended to introduce a system of automatic capital add-
ons driven by general regulatory requirements, nor is it intended to lead to additional
formal across-the-board requirements. Rather, the supervisory review process is intended
to address the circumstances of each bank.

24
The BCF is not prescriptive as to how supervisors should achieve the expectation under
Principle 3 that banks should operate above the minimum regulatory capital ratios.
However, it is clear that, all supervisory authorities should have sufficient powers to require
banks to hold capital in excess of regulatory requirements. Banks are expected to maintain
capital above the minimum Pillar I regulatory ratios as prescribed under the BCF, due to
following:
Pillar I does not impose capital requirements for a number of risks, including (but
not limited to) interest rate risk in the banking book, credit concentrations, strategic
and reputational risks, and business risk (variability in bank earnings).
For those risks that are explicitly covered under Pillar I – credit, market and
operational risks – regulatory capital requirements could be underestimated.
This could be due to, for instance, the proxy-based nature of the standardized
approaches to capital measurement, or because the capital requirement
determined under the advanced approaches is subject to modeling errors (such as
assumptions, data inputs, outputs and so on).
The breach of minimum requirements is a serious matter which may prompt
immediate supervisory actions and could erode market confidence in the bank.
Principle 3 integrates a bank's own assessment of its capital requirements and the
supervisor's response. This response can vary from an expectation about the size
of the buffers above the minimum Pillar I requirements to specification of a bank-
specific ratio.
A bank-specific capital requirement is typically established through the supervisory review
process. A bank-specific capital ratio is the level of capital that is commensurate with the
risk profile of a bank, taking into account both Pillar I and Pillar II risks, including the quality
of risk management. Any bank-specific ratio that is established should be reviewed
periodically, by both the bank and the supervisor, to verify that it continues to reflect the
bank's risk profile. Another supervisory response, adopted in some jurisdictions, is to set
Pillar I requirements above the minimum BCF requirements for all banks that operate in
that jurisdiction.
The fourth Principle states that supervisors should seek to intervene at an early stage to
prevent capital from falling below the minimum levels required to support the risk
25
characteristics of a particular bank and should require rapid remedial action if capital is
not maintained or restored.
2.5.5. How Pillar II Reinforces Pillar I
Pillar I cover material risks with regard to credit, market and operational risk and assigns
explicit capital requirements for those risks. However, these capital requirements are only
estimates. Pillar II involves an evaluation of the entire risk management process and the
risks not covered under Pillar.
When risk management practices or controls are considered inadequate or deficient, the
supervisory review process, as set out in Pillar II, should seek additional capital buffers
and/or improvements in those practices or controls. Likewise, if the methodologies used
by banks under Pillar 1 are considered to underestimate the amount of capital required or
if non-Pillar 1 risks are material, additional capital buffers should be sought through the
implementation of the supervisory review process.
2.5.6. Risks That Might not be Captured under Pillar I
Operation Risk: - Banks' efforts to develop operational risk measures are relatively recent,
and the collected data and the methodologies remain largely untested. Although banks'
approaches to the measurement of operational risk are evolving, they are not as precise
as the quantification of market and credit risk.
The Basic Indicator Approach (BIA) (an approach adopted by BOZ) and the Standardized
Approach (TSA) are the simpler methodologies set out in Pillar I to determine capital
required for operational risk, Gross Income (GI) is used as a proxy for the scale of a bank's
operational risk exposure. Although gross income is an indicator of exposure to
operational risk, it may not accurately reflect the level of such exposure. For instance, for
banks with low earnings base, the use of gross income could potentially underestimate
the amount of capital required for operational risk.

26
For this reason, Pillar II requires banks to incorporate into their ICAAPs a review of how
well Pillar I captures operational risk and whether the operational risk capital requirement
is adequate.
2.5.7. Pillar III Market Discipline
Under Pillar III the Committee introduced disclosure requirements as a way to foster
market discipline. The rationale behind pillar III is that knowledgeable market participants
will reward good risk management and thereby exert pressure on banks to improve their
systems and not take on excessive risk. Detailed disclosure requirements are believed to
create an environment in which effective market discipline can take place. Mrak (2003)
argues that if disclosure is to have a disciplinary function, both banks and other market
participants must recognize the importance of detailed disclosure information and play
their role by changing their behaviour according to the information received. Although the
situation in emerging countries, with regard to disclosure standards is steadily changing,
the likelihood of attaining the level expected under Basel II will not be attained
immediately. Further sensitization of both bank management and other market
participants would be needed, if disclosure requirements are to be used as a successful
tool of enhancing market discipline.
2.6. Criteria for Determining Basel II Banks
Below are some of the factors supervisors are expected to consider when determining the
population of banks to which Basel II would apply:
size of the bank, e.g. assets size ;
nature and complexity of its operations;
involvement in significant activities or business lines;
activities, or possession of a sizeable retail base;
international presence (e.g. proportion of assets held in/income from overseas
operations);
interaction with international markets;
bank's risk profile and risk management capabilities, and
other supervisory considerations, such as resources which will be available for
initial validation and ongoing monitoring, and the trade-off between the additional

27
complexity of implementing and validating these approaches vis-à-vis the
increased sensitivity of the resulting capital requirements.
2.7. Rationale for Implementing Basel II
The decision to implement Basel II was driven by a number of factors including:
Strengthening the soundness and stability of the international banking system
Basel I was found to have a number of flaws and did not, differentiate between
assets having less risk and assets having higher risk. Basel I therefore provided
a ‘one size fits all’ approach to the measurement of risk.
Basel I did not provide a capital charge for operational risk. Further, there was no
consideration for other risks such as concentration risk, liquidity risk, interest rate
risk in the banking book and strategic risk.
Basel II requires the adoption of strong risk management practices that provides a
driving force for bringing improvement in risk management capabilities in banks
Basel II provides an incentive for banks to have good risk management practices
and punishes those that are not managing their risks appropriately by requiring
them to hold higher capital allocations.
2.8. Basel II Implementation in Zambia
The implementation of Basel II shall lead to the overall soundness and stability of the
banking system. The supervised entities, the supervising authority and the country at large
are expected to benefit from the implementing Basel II in the following manner.
2.8.1. Advantages of Implementation of Basel II
The following benefits are expected to accrue when a country implements Basel II:
Financial Stability:- Increased financial system stability because the country will
have a better understanding of the risks that arise in the financial system and their
management;

28
Improved competitive standing: - Jurisdictions and institutions that do not adopt
Basel II (as was the case with Basel I) may find themselves competitively
disadvantaged when accessing international capital.
Moreover, international banks might be hesitant to enter into correspondent
relations with banks whose risk management and governance structures are not
transparent. Jurisdictions whose legal systems, accounting and auditing standards
and supervisory standards are not in line with international best practice may
therefore not be competitive and may thus be disadvantaged.
Enhanced International Perception: - Banking has evolved into a global industry
and physical boundaries no longer have any bearing in financial markets. To be
part of the international financial system and to remain competitive, countries have
to adopt international best practices and in the financial sector, Basel II, as was
the case with Basel I, is the globally accepted standard by which the banking
sector’s solvency is measured.
2.8.2. Expected Value Addition of Adaptation of Basel II for Banks
For banking institutions, the following benefits are expected to accrue when Basel II is
implemented:
Better understanding of Risks: - Basel II will improve the risk sensitivity of capital
as pillar I provide an expanded range of risks which require a capital charge.
Additionally, other risks, e.g. concentration risk, interest rate risk, strategic risk and
liquidity risks could, through the Pillar II process, also attract a capital charge.
Basel II will therefore ensure an improved framework for capital allocation through
the supervisory review process.
Improved Capital management: - Banks will be compelled to ensure that they
provide adequate capital to cushion all business risks that arise in the course of
business and not just credit risk as was the case with Basel I. This will add to the
resilience of the financial system.
Improved Risk Management practices: - Banks will have an incentive to improve
their risk management infrastructure because under Basel II, banks employing
advanced risk management practices have a reduced charge on their capital.

29
Improved pricing of banking products: - Because of improved risk recognition and
measurement, banks will be in a better position to price their products. Products
that carry a higher risk will be priced at a premium.
International best practice: - Basel II reflects international best practice and the
embodiment of improved capital management, risk management and other
corporate governance principles as encapsulated in Basel II enhances a bank’s
profile and its competitive position.
2.8.3. Advantages for the Supervisor
For supervisory authorities, the following benefits are expected to accrue when Basel II is implemented:
Better understanding of Risks: - Basel II will increase supervisors’ understanding
of the risks that banks take in their jurisdiction. A better understanding of banks’
risk profiles will improve the supervisors’ assessment of the financial condition of
banks in their jurisdiction and this will add to financial stability.
Focus on other risks: - Basel II will increase the supervisors’ focus on other risks
like operational risk, concentration risk, strategic risk and business cycle risk which
are ignored in the 1988 Accord. Under Basel II, operational risk will have a specific
capital charge whilst the other risks could also attract a capital charge. This is
expected to enhance the resilience of the financial system.
Process for aligning capital to risks: - Pillar II of Basel will provide the supervisor
with a tool which will enable them require banks to hold additional capital for risks
other than those explicitly covered by Pillar I. It also gives the supervisor a tool to
facilitate early intervention, therefore reducing the risk of bank failures. This is
expected to enhance financial system stability.
Formalization of home/host relationships: - The supervisor will have enhanced
oversight of banks that have cross-border operations through the establishment of
formal home-host supervision arrangements.
Increased disclosure: - The increased disclosure requirements of Pillar III will
assist the supervision of banks through increased market discipline. Increased
disclosure is also expected to lead to the management of financial institutions in a

30
safe and sound manner and thus contribute to stability in the banking sector and
the financial system as a whole.
2.8.4. Weakness and challenges of Basel II
A lot of researchers highlighted a number weakness with Basel II even prior to the global
financial crises of 2007 including the following:
Ward J (2002) argued that Basel II relies on the banks’ own risk estimates and that
the review was largely aimed at addressing the circumvention by large financial
institutions of the rules by regulatory arbitrage. Therefore the Committee tried to
align regulatory capital to economic capital, thereby making the regulatory capital
more ‘risk-sensitive’6.
Ward J (2002) further argued that regulators have not explained or tested the claim
that using sophisticated quantitative models represents “better risk management”
from the point of view of anyone but bank shareholders and yet the Committee
appears to have been so confident that models were better and that the Basel II
contains a capital incentive to move to the more sophisticated approaches.
Basel II strives to encourage the implementation of robust risk management
systems by the banking industry and to align regulatory capital with a bank’s risk
profile. Implementation of Basel II, however, poses a number of challenges for
supervisors, particularly with regard to acquiring and maintaining appropriate
human, financial and technical resources. On the other hand it presents a chance
for supervisors to improve their supervisory frameworks.
2.9. Preferred Basel II Pillar 1 Approaches for Zambia
Basel II allows banks a choice between two broad methodologies for calculating their
capital requirements. Banks can calculate capital requirements for credit, market and
operational risk using either the prescribed Standardized Approach or with supervisory
approved internal model-based approach. Zambia like many MEFMI member states has
6 Ward, J. “The New Basel Accord and Developing Countries: Problems and Alternatives” (2002), Cambridge Endowment of Research Finance, Working Paper No. 4, http://www.cerf.cam.ac.uk/publications/files/Ward04.pdf, p. 11

31
opted to implement the Simplified Standardized Approach (SSA) for credit risk,
Standardized Approach (SA) for market risk and Basic Indicator Approach (BIA) for
operational risk.
Pillar 1 provides a number of options for calculating banks’ minimum regulatory capital
charges for Credit Risk, Operational Risk and Market Risk. These options range from
relatively simple methodologies to more complex approaches that utilize banks’ own
quantitative risk assessments. In providing a wide range of approaches, Basel II
introduces regulatory capital requirements that capture risks more fully and are sensitive
to the differing complexity of banks.
The Bank of Zambia has adopted the Simplified Standardized Approach for credit risk,
Basic Indicator Approach (BIA) for operational risk with a possibility for migration to the
Standardized Approach upon meeting the Bank of Zambia set criteria. The Standardized
Measurement for market risk.
2.9.1. Simplified Standardized Approach for Credit Risk
The Committee permits banks a choice between two broad methodologies for calculating
their capital requirements for credit risk. One option, the Standardized Approach,
measures credit risk in a standardized manner, supported by external credit assessments.
The other alternative, the Internal Ratings-based Approach, which is subject to the explicit
approval of the bank’s supervisor, allows banks to use their internal rating systems for
credit risk.
In determining the risk weights under the standardized approach, banks may use
assessments by external credit assessment institutions recognised as eligible for capital
purposes by national supervisors in accordance with the defined criteria. However, under
the Simplified Standardized Approach, for the purpose of risk weighting claims on
sovereigns, the Bank of Zambia will recognize the country risk scores assigned by Export
Credit Agencies (ECAs), where the agencies publish their risk scores and subscribe to the
Organization of Economic Cooperation and Development (OECD) agreed methodology.
Banks will be required to use the consensus risk scores of ECAs participating in the
“Arrangement on Officially Supported Export Credit”. The OECD agreed methodology has

32
eight (8) risk scores which correspond to risk weight categories as indicated as shown in
Table 4 below:
ECA Risk7 Scores
0 - 1 2 3 4 to 6 7
Risk Weights 0% 20% 50% 100% 150%
Table 4: ECA Consensus Risk Scores8
Claims on foreign banks will be risk-weighted according to the weighting assigned to the
country in which they are incorporated as indicated in the Table 5 (regardless of the
original maturities).
ECA risk scores9 for Sovereigns
0 - 1 2 3 4 to 6 7
Risk Weights 20% 50% 100% 100% 150%
Table 5: ECA Consensus Risk Scores10
The rest of on balance exposures will be risk-weighted based on the assigned risk weights
indicated in Appendix I. While the Off-balance sheet items under the simplified
standardized approach will be converted into credit exposure equivalents through the use
of credit conversion factors (CCF) then will be assigned the risk weights indicated
Appendix II.
2.9.2. Credit Risk Mitigation
Basel II recognises that banks use a number of techniques to mitigate the credit risks to
which they are exposed. Exposure may be collateralized in whole or in part with cash or
securities, or a loan exposure may be guaranteed by a third party. Where the techniques
used to mitigate credit risk meet the prescribed requirements, then credit risk mitigation
(CRM) may be recognised.
7 Source: Draft Bank of Zambia Basel II Regulations 8 Countries’ ECA’s risk scores are reviewed periodically by the OECD and may change depending on the performance of a particular country. 9 Source: Draft Bank of Zambia Basel II regulations 10 Countries’ ECA’s risk scores are reviewed periodically by the OECD and may change depending on the performance of a particular country.

33
2.10. Assessment of Risk Weights for Credit Risk under Basel II in Zambia
Under Basel II risk-weights for some classes of assets have changed either based on
national discretion or as prescribed under the simplified standard approach. The following
are some of the major changes that were noted in the risk-weights (See Appendix II):
Under Claims on Sovereigns, the major change that was observed was in relation to the
risk-weight for claims on Government bonds which has changed to 0% from 20% obtaining
under Basel I. The rest of the assets under this category remained unchanged at the risk
weight of 0%. Claims on domestic banks relating to transactions with settlement within two
days will now be risk weighted at 0% from 50%. For Claims on foreign banks, banks which
were previously risk weighted at 20% under Basel I, will now be based on the ECA country
risk score as follows:
o Where the country ECA risk score is 0-1 the risk weight will be 20%.
o Where the country ECA risk score is 2 the risk weight will be 50%.
o Where the country ECA risk score is 3-6 the risk weight will be 100%.
o Where the country ECA risks scores is 7 the risk weight will be 150%.
Claims on Public Sector Entities: Denominated and funded in Kwacha (domestic currency)
and guaranteed by GRZ will now be risk weighted at 20% from 50%. Claims included in
the regulatory retail portfolio meeting the BOZ criteria will be risk-weighted at 75% from
50%. While those not meeting that BOZ criteria will be at 100%. Claims secured by
residential property will now have the following risk-weighted as follows:
o Those with loan to value ratio of up 80% will still be risk-weighted at 50%. The
currently the risk weight is also 50%, however, the loan to value ratio is not taken
into account.
o Those with loan to value ratio of greater than 80% will be risk weighted at 100%
from 50%.
o Unsecured portion of claims secured by residential mortgages that are past due
for 90 days or more shall be risk weighted 150%, net of specific provisions.
Past due loans will be risk weighted as follows: with provisions are less than 20% of
the outstanding loan will be at 150% from 100%; Where provisions are equal or exceed
20% but less than 50% of the outstanding loan the risk-weight will be 100%. Where
provisions are equal to or more than 50% of the outstanding loan risk weight will also
be at 100%.

34
Higher risk categories such as private equities will now be risk weighted at 150% from
100%. Other assets have remained at 100%. While for off-balance sheet items the
credit conversion factors have been scaled down based on the eligible collateral
available while maintain risk weights of 100% (See Appendix IV).
2.11. Basic Indicator Approach (BIA) for Operational Risk
The simplified standardised approach for operational risk is the Basic Indicator Approach
under which banks must hold capital equal to a fixed percentage (15%) of average annual
gross income, where positive, over the previous three years. Gross income (GI) is defined
as net interest income plus net non-interest income. The GI is intended to be gross of any
provisions (e.g. for unpaid interest), operating expenses, including fees paid to
outsourcing service providers and exclude realized profits/losses from the sale of
securities in the banking book and exclude extraordinary or irregular items as well as
income derived from insurance.
2.11.1. Migration to Standardised Approach for Operation Risk
All banks in Zambia will be required to use the Basic Indicator Approach for at least one
year. Subsequently, banks meeting the qualifying criteria set out BOZ may migrate to the
standardised approach with prior approval from BOZ.
2.12. Standardized Measurement - for Market Risk
Market risk is defined as the risk of losses in on and off-balance-sheet positions arising
from movements in market prices. The risks subject to this requirement are:
The risks regarding to interest rate related instruments and equities in the trading
book; and
Foreign exchange risk and commodities risk throughout the bank.
The standard framework for measuring the risk of holding or taking positions in debt
securities and other interest rate related instruments in the trading book include all fixed-
rate and floating-rate debt securities and instruments that behave like them, including non-

35
convertible preference shares. Convertible bonds, i.e. debt issues or preference shares
that are convertible, at a stated price, into common shares of the issuer, will be treated as
debt securities if they trade like debt securities and as equities if they trade like equities.
The minimum capital requirement is expressed in terms of two separately calculated
charges, one applying to the “specific risk” of each security, whether it is a short or a long
position, and the other to the interest rate risk in the portfolio (termed “general market risk”)
where long and short positions in different securities or instruments can be offset.
2.13. Supervisory Review Process
The supervisory review process of the Basel Framework is meant not only to ensure that
banks have adequate capital to support all the risks in their business, but also to
encourage banks to develop and use better risk management techniques in monitoring
and managing their risks.
Supervisors are expected to evaluate how well banks are assessing their capital needs
relative to their risks and to intervene, where appropriate. This interaction is aimed to
promote an active dialogue between banks and supervisors such that when deficiencies
are identified, prompt and decisive action can be taken to reduce risk or restore capital.
Accordingly, supervisors may wish to adopt an approach to focus more intensely on those
banks with risk profiles or operational experience that warrants such attention.
In view of the above, an assessment of BOZ supervisory procedures will be done to
determine their adequacy or lack of. Thereby determine tools that Zambia can adopt in
assessing capital requirements under Pillar II.
2.14. Basel 2.5 and Basel III Framework
Following global financial crisis of 2007, the Committee, embarked on revision to the Basel
II framework which culminated in the issuance of Basel II.5 and Basel III in order to
address the shortcomings brought to light by the crisis. The objective of the Basel III is to
improve the banking sector’s ability to absorb shocks arising from financial and economic
stress, whatever the source, thus lessening the risk of spillover from the financial sector
to the real economy. Under Basel III regulatory capital has been boosted by giving greater
importance to common equity. The eligibility criteria have been established for common

36
equity, for additional Tier 1 capital and Tier 2 capital. With a minimum common equity Tier
1 ratio (CET 1 ratio), set to reach 4.5% of RWAs, has been introduced. Efforts have been
made to harmonize supervisory deductions, which also serve to increase the level of
capital for ease of comparability. Further risk coverage has been improved with an
increase in capital requirements for re-securitization exposures. The market risk
framework has also been modified to better capture losses arising during stress periods.
The Counterparty Credit Risk (CCR) framework has been strengthened with requirements
that better capture specific aspects of CCR, such as wrong-way risks and credit valuation
adjustments.
Basel III puts additional emphasis on the importance of the leverage ratio. The leverage
ratio is intended to constrain bank leverage. The numerator of the ratio will be a high
quality capital measure. The denominator will be based on an accounting measure of
gross exposures. Exposures, either on - or off-balance sheet, will be captured. However,
gross exposures arising from securities financing and derivatives may be reduced through
regulatory netting. Basel III also introduced the capital conservation buffer (CCB) which
will constrain capital distributions when a bank’s CET 1 level falls between 4.5% and 7%
of its RWAs. While a countercyclical buffer of common equity representing up to of 2.5%
of RWAs will apply at national discretion during periods of excessive credit growth.
Further, under Basel III the Basel Committee introduced additional loss absorbency for
Global Systemically Important Banks (G-SIBs). The objective of the additional loss
absorbency for G-SIBs is to reduce the probability of failure by increasing their going-
concern loss absorbency. An indicator-based measurement approach is used to
determine G-SIBs and the additional loss absorbency will be achieved through an
extension of the capital conservative buffer. The BCBS also noted that capital for banks
is not sufficient but that a strong liquidity base is equally important, as noted during the
global financial crisis of 2007. To this end, the BCBS in 2008 issued Principles for sound
Liquidity risk Management and supervision.
According to the BCBS the standards have been developed to attain two separate but
complementary objectives. The first is to promote short-term resilience of a bank’s liquidity
risk profile by ensuring that it has sufficient high quality liquidity resources to survive
severe stress scenarios lasting for one month. BCBS developed the Liquidity Coverage
Ratio (LCR). The second objective is to promote resilience over a longer time horizon by
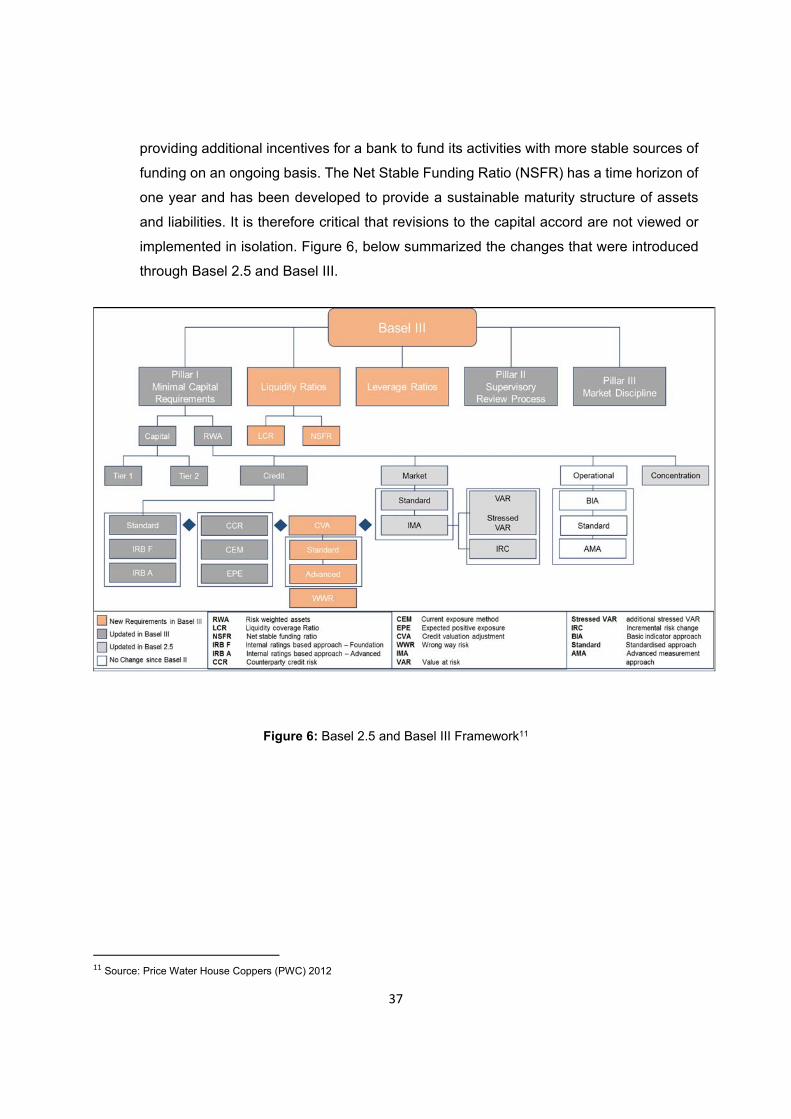
37
providing additional incentives for a bank to fund its activities with more stable sources of
funding on an ongoing basis. The Net Stable Funding Ratio (NSFR) has a time horizon of
one year and has been developed to provide a sustainable maturity structure of assets
and liabilities. It is therefore critical that revisions to the capital accord are not viewed or
implemented in isolation. Figure 6, below summarized the changes that were introduced
through Basel 2.5 and Basel III.
Figure 6: Basel 2.5 and Basel III Framework11
11 Source: Price Water House Coppers (PWC) 2012

38
2.15. Progress on Basel II Implementation in MEFMI Member States12
In 2013, the Financial Stability Institute (FSI) conducted a survey to ascertain the
status/plans regarding the implementation of on Basel II, 2.5 and III in jurisdictions that
are members of neither the BCBS nor the European Union (EU). The methodology
adopted by the FSI in this survey was similar to the one used by the BCBS, based on the
Basel Committee’s Regulatory Consistency Assessment Programme (RCAP) which
monitors the progress in introducing regulations, assess their consistency and analyse
regulatory outcomes.
The FSI through the survey therefore monitors the non-BCBS/ non-EU members’
regulatory adoption of Basel II, Basel 2.5 and Basel III. The scope of survey conducted in,
2013 was as follows:
Status of implementation of Basel II,
Status of Basel 2.5 implementation. Basel 2.5 enhanced the measurements of
risks related to securitisation and trading book exposures. Basel 2.5 was due to be
implemented no later than 31 December 2011 for BCBS member countries.
In December 2010, the Committee released Basel III, which set higher levels for
capital requirements and introduced a new global liquidity framework. BCBS
members agreed to implement Basel III from 1 January 2013, subject to
transitional and phase-in arrangements.
In November 2011, the BCBS published the rules text that sets out the framework
on the assessment methodology for global systemic importance and the
magnitude of additional loss absorbency that global systemically important banks
(G-SIBs) should have. The requirements will be introduced on 1 January 2016 and
become fully effective on 1 January 2019. To enable their timely implementation,
national jurisdictions agreed to implement by 1 January 2014 the official
regulations/legislations that establish the reporting and disclosure requirements.
In January 2013, the Basel Committee issued the full text of the revised Liquidity
Coverage Ratio (LCR). The LCR underpins the short-term resilience of a bank’s
liquidity risk profile. The LCR will be introduced as planned on 1 January 2015 and
will be subject to a transitional arrangement before reaching full implementation on
12 MEFMI Member states are: Angola, Burundi, Botswana, Kenya, Lesotho, Malawi, Mozambique, Namibia, Rwanda, Swaziland, Tanzania, Uganda, Zambia and Zimbabwe.

39
1 January 2019. The Net Stable Funding Ratio (NSFR) has been developed to
provide a sustainable maturity structure of assets and liabilities.
The Basel Committee is currently in the process of finalizing the details of the Basel
III leverage ratio standard. In June 2013, the Committee issued a consultative
paper on the revised leverage ratio framework, along with public disclosure
requirements starting on 1 January 2015.
In line with the BCBS’s approach, the FSI published the results of its 2013 survey by
disclosing all information provided by individual countries. Since MEFMI member countries
fall within the group of countries that are neither members of BCBS nor the EU, the study
used the FSI survey published results to establish the status of Basel II, 2.5 and III
implementation in MEFMI member countries. Appendices VI to VIII highlight the
implementation status of Basel II, Basel 2.5 and Basel III in MEFMI member countries.

40
3. Methodology
3.1. Introduction
Data used in this study to assess the impact of Basel II on the Zambian banks was
obtained from the BoZ database as submitted by the 19 commercial banks operating in
Zambia during the parallel run. BoZ commenced the Basel II, Pillar I parallel run in
October, 2013 following the issuance of the draft Basel II Regulations to the market. During
the parallel run, banks are required to submit their capital adequacy prudential returns for
both Basel I and Basel II on a monthly basis, the submitted data is unaudited and is
submitted for prudential off-site monitoring purposes. However, the Basel I data is
published on a quarterly basis as part of the quarterly financial statements in line with the
laws and regulations hence it is in public domain.
The published information includes the Balance Sheet, Income Statement, Statement of
Capital Position and Statement of the Liquidity position. The banks are yet to start
publishing the Basel II capital position. The study therefore analysed data based on the
abridged financial statements that appear in the published statements with regard to the
balance sheet and statement of capital position for all 19 banks.
Further, for the purpose this paper, banks shall be put into three peer groups based on
their asset size and each bank shall be referenced using the letters of the alphabet, A to
S for ease of analysis. The panel data used shall be as at 31 December, 2013. Each peer
group shall represent a tier and each tier shall be defined as follows:
Tier 1 comprise banks with assets > ZMW5 billion (US$910 million)
Tier 2 comprise banks with assets ≥ K1 billion but less than K5 billion or (≥US$182
million but less than US$910 million,)
Tier 3 shall comprise banks with assets < K1 billion (< US$182 million)
An analysis of each tier’s asset composition shall be done to determine the major drivers
for the risk weighted assets with regard to credit risk.
Further an analysis of the risk weights obtaining under Basel I and Basel II shall be done
to determine the changes that might have an impact on the capital adequacy ratios for
each bank and the peer group. An analysis of the RWA for each bank and peer group

41
shall be done to determine the source of increase or decrease in the total RWA. A
comparison of the capital adequacy ratios between Basel I and those obtained under
Basel II shall also be done.
Based on the adopted approaches for credit, operational and market risk, the study shall
assess the following under Pillar 1:
Asset composition for each peer group at end-December, 2013;
Analysis of the composition of the risk weighted assets for each peer group;
The risk-weighted assets computed under Basel II compared to that obtaining
under Basel I for each peer group as at end-December, 2013;
The risk-weighted assets for each risk area as a percent of total risk weighted
assets for each peer group under Basel II;
Analysis of primary capital to risk-based assets ratios under both Basel II and
Basel I as at end-December, 2013; and
Analysis of total regulatory capital ratios under both Basel II and Basel I as at end-
December, 2013.
3.2. Data Description
3.2.1. Distribution of Assets in Banking Sector
The asset composition for the banking industry in Zambia was mostly dominated by loans
and advances at 43%, followed by investment in Government securities at 23% then
balances with BOZ at 12% and then balances with banks abroad at 11%, other assets
accounted for 7%, Notes and Coins accounted for 3% and balances with local banks at
1%. The distribution of assets in for Tier 1 banks was in tandem with industry assets
distribution with loans and advances at 49%, followed by investment in Government
securities at 23% then balances with BoZ at 11% and then balances with banks abroad at
7%, other assets accounted for 6%, Notes and Coins accounted for 4% and balances with
local banks at less than 1% (see Figure 7).

42
Figure 7: Assets Distribution
3.2.2. Tier 1 banks - banks with assets > ZMW5 bn
Tier 1 comprised banks with assets greater than ZMW5 billion (US$ 910 million) each.
The group comprised four such of banks and in aggregate accounted for ZMW 24,398
million (US$4,436 million) in assets. Tier 1 banks accounted for 58% banking sector’s total
assets. Tier 1 banks as group accounted for 45% and 57% of the banking sector’s primary
capital and total regulatory capital, respectively. Asset composition for Tier 1 was
dominated by loans and advances at 49%, followed investments in government securities
at 23%. This pattern was evident in all the banks in the group (see Table 6).
Table 6: Tier 1 Asset Composition
Total Assets ZMW(000)
Notes & Coins
Balances with BOZ
Balances with Local
Banks
Balances with Banks
Abroad
Investments in
Securities
Loans & Advances
Other Assets
Total (%)
A 6,857,437 3% 10% 1% 3% 33% 42% 8% 100%
B 6,309,725 3% 15% 0% 14% 14% 51% 3% 100%
Tier 1 C 5,630,837 4% 9% 0% 4% 28% 49% 5% 100%
Banks D 5,600,061 6% 10% 0% 8% 15% 54% 8% 100%
Total 24,398,060 4% 11% 0% 7% 23% 49% 6% 100%
Name

43
3.2.3. Tier 2 banks (banks with assets ≥ ZMW1 bn but less than ZMW5 bn)
Tier 2 comprised seven banks which accounted for 34% of the banking sector’s total
assets. Tier 2 banks as group accounted 43% and 35% primary capital and total regulatory
capital, respectively. The Tier 2 banks also accounted for 28% and 34%, of the banking
sector’s RWA under Basel I and Basel II, respectively.
The asset structure of Tier 2 banks was as depicted in table 7 below with loans and
advances at 34%, followed investments in government securities at 23% and balances
with banks abroad at 18% (see Table 6). Tier 2 banks had two outlier banks whose asset
structures were quite different from the rest of the banks in the group. Bank E asset
composition was dominated by balances with banks abroad at 49% followed by balances
with BoZ at 23% with only 9% in loans and advances. While bank G had 51% in
government securities, followed by balances with BOZ at 19% with only 12% in loans and
advances (see Table 7).
Table 7: Tier 2 Assets Composition
3.2.4. Tier 3 banks (Banks with Assets < ZMW1 billion)
Tier 3 consists of eight banks with total assets of less than ZMW1 billion (US$182 million).
The banks in this tier accounted for 7% of the banking sector’s total assets. Tier 3 banks
as group accounted for 12% and 8% primary capital and total regulatory capital,
respectively. Further the Tier 3 banks only accounted for 9% and 8%, of the banking
sector’s RWA under Basel I and Basel II, respectively. The asset structure of Tier 3 banks
Total Assets ZMW(000)
Notes & Coins
Balances with BOZ
Balances with Local
Banks
Balances with Banks
Abroad
Investments in
Securities
Loans & Advances
Other Assets
Total (%)
E 3,002,132 0% 23% 0% 49% 18% 9% 2% 100%
F 2,363,426 4% 18% 0% 15% 16% 38% 8% 100%
G 2,320,972 1% 19% 1% 15% 51% 12% 2% 100%
Tier 2 H 2,099,881 4% 7% 0% 4% 21% 56% 8% 100%
Banks I 1,962,720 4% 17% 1% 2% 23% 44% 9% 100%
J 1,371,908 1% 4% 7% 18% 9% 56% 6% 100%
K 1,323,253 3% 5% 0% 7% 20% 54% 11% 100%
Total 14,444,291 2% 15% 1% 18% 23% 34% 6% 100%
Name

44
was as depicted in table 8 below with loans and advances at 34%, followed investments
in government securities at 18% and then other assets at 16%.
Table 8: Tier 3 Asset Composition
Total Assets ZMW(000)
Notes & Coins
Balances with BOZ
Balances with Local
Banks
Balances with Banks
Abroad
Investments in
Securities
Loans & Advances
Other Assets
Total (%)
L 818,642 7% 12% 13% 8% 20% 31% 10% 100%
M 558,076 4% 7% 11% 10% 13% 39% 16% 100%
N 407,239 1% 6% 22% 3% 33% 12% 23% 100%
Tier 3 O 383,842 8% 8% 6% 6% 13% 53% 6% 100%
Banks P 370,831 2% 14% 0% 8% 19% 26% 32% 100%
Q 303,278 3% 9% 2% 14% 7% 45% 20% 100%
R 217,211 2% 16% 8% 13% 18% 30% 13% 100%
S 51,548 4% 6% 0% 1% 5% 46% 37% 100%
Total 3,110,667 4% 10% 10% 8% 18% 34% 16% 100%
Name

45
4. Results
In this chapter results of the research based on the methodology described in the previous
chapter are summarized.
4.1. Distribution of Risk Weighted Assets for Tier 1 Banks
Tier 1 banks had the highest share of banking industry’s risk-weighted assets under both
Basel I and Basel II at 64% and 59%, respectively. Tier 1 banks total risk-weighted assets
under Basel I and Basel II was ZMW15,133 million (US$2,751 million) and ZMW15,840 million
(US$2,880 million), respectively (see Table 9). This represented a net increase of ZMW707
million (US$129 million) or 5%. All the banks in this Tier recorded a decrease in their RWA
with regard to credit risk. The net increase in RWA of ZMW707 million or 5% was therefore
mainly attributed to operational risk. However, the charge for credit risk was the highest at
79%, followed by operational risk at 20% and market risk was at 1%.
Table 9: Tier 1 Banks RWA Distribution
4.2. Impact of Basel I Pillar I on Tier 1 Banks
The increase in the RWA resulted in a decrease in capital adequacy ratios. However, all the
tier 1 banks’ capital ratios remained above the regulatory minimum of 5% and 10% for primary
and total regulatory capital adequacy ratios, respectively. Bank A primary and total regulatory
capital adequacy ratios decreased under Basel II to 16% and 17% from 19% and 20%,
respectively. While Bank B primary and total regulatory capital adequacy ratios decreased to
16% and 18% from 19% and 22% obtained under Basel I, respectively. Bank C primary and
total regulatory capital adequacy ratios also decreased to 20% and 20% from 21% and 22%,
respectively. Bank D primary and total regulatory capital adequacy ratios decreased to 13%
Basel I RWA
ZMW(000)
Basel II RWA
ZMW(000)
RWA (Increase/ Decrease) ZMW(000)
Credit Risk RWA (%)
Operational Risk RWA
(%)
Market Risk RWA (%)
Total (%)
A 3,372,291 3,969,258 596,967 75% 24% 1% 100%B 3,503,933 4,219,176 715,243 83% 17% 1% 100%
Tier 1 C 3,276,658 3,577,780 301,122 78% 22% 0% 100%Banks D 3,715,297 4,073,689 358,392 80% 18% 2% 100%
Total 15,132,460 15,839,903 707,443 79% 20% 1% 100%
Name

46
and 14% from 14% and 15%, respectively (see Appendix V). The decrease in the capital
adequacy ratios for the Tier 1 banks was largely on account of the capital charge for
operational risk.
4.3. Distribution of Risk Weighted Assets for Tier 2 Banks
The banks in this group also recorded an increase in their RWA under Basel II Pillar I
requirements. Total RWAs under Basel I and Basel II was ZMW6,131.5 million and
ZMW8,972.6 million, respectively (see Table 10). However, unlike Tier 1 banks, the net
increase in RWA of K2,841.1 million or 46.3%, was almost evenly distributed between credit
risk at 43.2% and operational risk at 41.1%. While market risk accounted for 15.7%. The
charge for credit risk also accounted for the highest at an aggregate of 82%, followed by the
charge for operation risk at 13% while market risk was at 5.0% total risk weight assets.
Table 10: Tier 2 Banks RWA Distribution
4.4. Impact of Basel I Pillar I on Tier 2 banks
The increase in the RWAs resulted in decreases in capital adequacy ratios for all the banks
in this tier (see Appendix V). However, they all remained above the regulatory capital
adequacy minimum ratios of 5% and 10% for primary and total regulatory capital adequacy
ratios, respectively. The average capital adequacy ratios for Tier 2 banks decreased to 27%
and 31% from 40% and 46%, for primary and total regulatory capital, respectively. Three of
the banks namely, Bank E, Bank G and Bank J in this group recorded significant decreases
in their capital adequacy ratios.
Basel I RWA
ZMW(000)
Basel II RWA
ZMW(000)
RWA (Increase/ Decrease) ZMW(000)
Credit Risk RWA (%)
Operational Risk RWA
(%)
Market Risk RWA (%)
Total (%)
E 546,635 930,790 384,155 93% 7% 0% 100%F 953,513 1,215,977 262,464 74% 26% 0% 100%G 595,388 1,333,804 738,416 78% 19% 3% 100%
Tier 2 H 1,369,968 1,853,758 483,790 95% 4% 1% 100%Banks I 1,054,825 1,109,411 54,586 80% 19% 1% 100%
J 928,069 1,605,343 677,274 69% 8% 23% 100%K 683,134 923,527 240,393 82% 18% 0% 100%
Total 6,131,532 8,972,610 2,841,078 82% 13% 5% 100%
Name

47
Bank E’s both primary and total regulatory capital adequacy ratios decreased to 62% from
105%, respectively. An analysis of the bank E’s assets revealed that the bank had 49% of its
assets with banks abroad. Balances abroad were previous all charged at 20%. However,
Balances with banks abroad which were previously risk weighted at 20% now range from 20%
to 150% under Basel II, depending on the sovereign risk score for country in which the foreign
bank is incorporated. In the case of Bank E over 50% of its balances with foreign banks moved
from the 20% bucket to the 50%. The rest of the assets were allocated as follows: balances
with BOZ were at 23%, investment in Government securities at 18% and (see Table 7). While
balances with BOZ and Government securities are at 0%. It was observed that credit risk
accounted for the highest portion of the bank E’s RWAs at 93%.
While Bank G’s both primary and total regulatory capital adequacy ratios decreased by 52%
to 42% from 94%, respectively. It was observed that credit risk accounted for the highest
portion of the bank G’s RWAs at 78%, followed by operational risk at 19%. Bank G’s on
Balance sheet assets were mostly concentrated in investment government securities at 51%,
followed balances with BOZ at 19% then balances with banks abroad at 15% and then loans
at 12%. Bank G’s credit risk was mostly attributed to off-balance sheet items.
Thirdly Bank J’s primary and total regulatory capital adequacy ratios decreased to 17% and
33% from 29% and 57%, respectively. Bank J’s distribution of RWA was slightly different from
the rest of its peers and industry at large. RWAs relating credit risk accounted for 69% but
then it was followed by market risk 23%. It is the only bank with market risk charge which is
higher than 5%. Most of the banks in the industry had insignificant trading books hence lower
RWA related to market risk arising from their trading portfolio. Operational risk for bank J
accounted for only 8% of the bank’s total RWA. While the remaining banks in this group only
had a 1000 basis points or less reduction in the capital adequacy ratios (see appendix V).
4.5. Distribution of Risk Weighted Assets for Tier 3 Banks
The Tier 3 banks total risk-weighted assets under Basel I and Basel II was ZMW1,850 million
(US$336 million) and ZMW2,003 million (US$634 million), respectively (see Table 11). Credit
risk accounted for the highest at 85%, followed by operational risk at 14% and market risk
was at 1%. There were three exceptional banks in this group which recorded decreases in

48
their RWAs under Basel II. The net increase in RWA of K152.6 million or 8.2% was attributed
to operational risk, as credit risk reduced by 7.9% when compared to Basel I.
Table 11: Tier 3 Banks RWA Distribution
4.6. Impact of Basel I Pillar I on Tier 3 banks
Five of the banks in this group are new banks which have been in operation for 5 years or
less. The asset allocation for these banks was quite varied from the industry. Although
loans and advances accounted for the highest share at 34%, the rest of the asset
allocation was almost evenly distributed with 18% in investment in securities, 16% in other
assets, 10% in balances with local banks and BOZ, respectively and *% with banks
abroad. While at individual bank level Bank N, Bank P, Bank Q and Bank S had 23%,
32%, 20 and 37%, respectively in ‘other assets’. Three of the banks in this group recorded
decreases in their RWAs. While five banks recorded increases in their RWA under Basel
II. However, like Tier 1 and Tier 2 banks, the charge for credit risk remained the highest
for the eight banks in Tier 3 at 85% in aggregate followed by the charge for operational
risk at 14% while market risk was at 1% of total risk-weight assets.
The change in the RWA for the eight banks resulted in either an increase or decrease in
capital adequacy ratios. However, Bank Q’s total regulatory capital decreased to 8% below
the minimum regulatory requirement of 10%. While Bank P’s both primary and total
regulatory capital adequacy ratios decreased to 11% from 15%, respectively. The rest of
the banks in this group remained adequately capitalized under Basel II (See appendix V).
Bank L both primary and total regulatory capital adequacy ratios increased to 39.1% and
40.4% from 34.4% and 35.6%, respectively. Bank M primary and total regulatory capital
adequacy ratios decreased to 28.2% and 28.7% from 37.1% and 37.7%, respectively.
Basel I RWA
ZMW(000)
Basel II RWA
ZMW(000)
RWA (Increase/ Decrease) ZMW(000)
Credit Risk RWA (%)
Operational Risk RWA
(%)
Market Risk RWA (%)
Total (%)
L 440,894 388,868 -52,026 91% 8% 1% 100%M 277,560 364,425 86,865 81% 16% 3% 100%N 222,704 178,019 -44,685 88% 12% 0% 100%
Tier 3 O 282,130 337,052 54,922 81% 17% 2% 100%Banks P 229,939 299,470 69,531 81% 19% 1% 100%
Q 217,214 275,318 58,104 86% 13% 0% 100%R 133,762 109,710 -24,052 85% 10% 5% 100%S 46,029 49,942 3,913 81% 19% 1% 100%
Total 1,850,232 2,002,804 152,572 85% 14% 1% 100%
Name

49
Bank N both primary and total regulatory capital adequacy ratios increased to 71.1% from
56.8%, respectively. Bank O’s primary and total regulatory capital adequacy ratios
decreased to 32.2% and 34.3% from 38.5% and 41.0%, respectively. Bank R’s both
primary and total regulatory capital adequacy ratios increased to 84.5% from 69.3%,
respectively. Bank S’s both primary and total regulatory capital adequacy ratios decreased
to 24.8% from 26.9%, respectively.

50
5. Conclusion and Recommendations
This section summarizes research findings, conclusions and provides recommendations.
The chapter also provides pointers that might require further studies in the implementation
of Basel II both in Zambia and in the MEFMI region. The study was aimed at assess the
impact of Basel II implementation in Zambia. This study also attempted to establish the
status of implementation of Basel II and the revision made to the capital framework
following the global financial crisis (Basel 2.5 and Basel III) in MEFMI member countries
aimed at providing MEFMI with a dashboard for future capacity building initiatives in this
area for its members.
The paper has established that implementation of Basel II will not have the same impact
on all banks as the impact will depend on the each bank’s risk profile and business model.
The study observed that 16 out of 19 or (84%) of banks operating in Zambia reported
increases in their risk-weighted assets and reduction in their capital adequacy ratios. The
16 banks comprised all the Tier 1 and Tier 2 banks with five banks from Tier 3. A further
analysis of the risk-weighted assets indicated that although the risk-weighted assets had
increased in aggregate, risk-weighted assets attributed to credit risk had in decreased.
This implies that the observed increase in the RWAs for the 16 banks was mainly attributed
to the charge for operational risk. While the decrease in the RWAs for credit risk was
mostly attributed to the reduced risk weights under Basel II related to assets such as
Government Bonds and balances with local banks which reduced from 50% to 0% and
20%, respectively, coupled with the introduction of eligible credit risk mitigations.
Further, the study observed that 3 banks in Tier 3, namely Bank L, Bank N & Bank R
recorded decreases in their risk-weighted assets, hence their capital adequacy ratios
increased. Analysis of the distribution of the on-balance sheet assets revealed that their
assets were mostly skewed to the asset classes with reduced risk weights or zero
weighted assets such as cash balances, balances with BOZ, balances with local banks
and investment in government securities accounted for 52%, 62% and 44% for Bank L,
Bank N and Bank R, respectively. The study also observed that all the 19 banks met the
minimum primary capital adequacy ratio of 5%. However, Bank Q’s total regulatory capital
adequacy ratio decreased to 8% thereby breaching the minimum total regulatory capital
adequacy of 10%.

51
An assessment of the FSI’s survey results to establish the status/plans of the
implementation on Basel II, 2.5 and III in neither counties non BCBS nor the European
Union (EU), revealed that MEFMI member countries are at various stages of Basel II, 2.5
and III implementation.
From the foregoing, it is recommended that BOZ conducts an in-depth study to establish
the root cause of the reduction in the capital charge for credit risk in order to establish
whether the reduction is a case of the banks’ business models or change in risk appetite
based on the revised risk weights. Further BOZ should develop a plan for banks whose
capital adequacy ratios have decreased below the minimum and establish how such
shortfall will be rectified by the banks affected, during the parallel run. It is also
recommended, that MEFMI develops deliberate programs that will assist member
countries in accelerating the implementation of Basel II, 2.5 and III or aspects of the
standards in order to ensure the stability of the financial system not only at individual
country level but also at a regional level.
As we reach maturity on Pillar I of Basel II implementation, an assessment of the impact
of Pillar II will be necessary. Impact of Basel II largely depends on the bank’s business
model and asset allocation. Major impact on capital adequacy position in Zambia like most
of the MEFMI member countries is credit risk and operational risk. In January, 2012, BOZ
revised the minimum capital requirements for banks from ZMW12 million to ZMW520
million and ZMW104 million for foreign owned banks and locally owned banks,
respectively. Therefore the impact of Basel II, Pillar I may have been minimized as banks
are adequately capitalized following this revision.

52
Bibliography
1. Bank of Zambia, Draft Basel II Regulations. 2013.
2. Basel Committee on Banking Supervision 2009: "Enhancement to the Basel II
Framework”.
3. Basel Committee on Banking Supervision Working Papers: Capital Requirements
and Bank Behaviour - The Impact of the Basel Accord, No. 1 April 1999
4. Basel Committee on Banking Supervision, 2014: A brief history of the Basel
Committee
5. Basel Committee on Banking Supervision, 2014: A Sound Capital Planning Process,
Fundamental Elements
6. Basel Committee on Banking Supervision. 2004. Implementation of Basel II: Practical
Considerations
7. Basel Committee on Banking Supervision. 2006. International Convergence of
Capital Measurement and Capital Standards, Revised Framework Comprehensive
Version.
8. Basel Committee on Banking Supervision. 2009: Principles for sound stress testing
practices and supervision.
9. Basel Committee on Banking Supervision. 2012. Core Principles for Effective
Banking Supervision
10. Basel Committee on Banking Supervision. 2013. Progress report on implementation
of the Basel regulatory framework
11. Basel Committee's Core Principles for Effective Banking Supervision (BCP,
September 1997)
12. Basel Committee's Core Principles for Effective Banking Supervision (BCP, October,
2006)
13. Evolution of the Basel Framework on Bank Capital Regulation, Reserve Bank of India
Occasional Papers Vol. 29, No 2, Monsoon 2008
14. Federal Deposit Insurance Corporation, 1997. History of the Eighties - Lessons for
the Future: An Examination of the Banking Crises of the 1980s and Early 1990s
Volume 1
15. Financial Stability Institute, 2014: FSI Survey Basel II, 2.5 and III Implementation
16. Financial Stability Institute. 2004: Occasion Paper No.4 Implementation of the new
capital adequacy framework in non-Basel Committee member countries.
53
17. Financial Stability Institute. 2006. Occasion Paper No.6 Implementation of the new
capital adequacy framework in non-Basel Committee member countries.
18. FSIConnect [online] available at: http://www.fsiconnect.org/
19. International Monetary Fund and World Bank, 2002: Implementation of the Basel
Core Principles for Effective Banking Supervision, Experiences, Influences, and
Perspectives
20. Mrak M, 2003. Implementation of the New Basel Capital Accord In Emerging Market
Economies –Problems and Alternatives
21. Peterson Institute of International Economics, Basel I
22. Rojas-Suarez L, 2001. Can International Capital Standards Strengthen Banks in
Emerging Markets
23. Simpson, D. S. 2014. The Banking System, Commercial Banking: Economic
Concepts in Banking Context [Online]. Available at:
http://www.investopedia.com/inversity/banking Accessed on November 2014
24. Ward, J 2002. The New Basel Accord and Developing Countries: Problems and
Alternatives, Cambridge Endowment of Research Finance Working Paper No. 4.
http://www.cerf.cam.ac.uk/publications/files/Ward04
25. Working Paper 68/2012: Basel I and Basel II Compliance Issues for Banks in India,
Sreejata Banerjee, Madras School of Economics, May 2012

AppendixI:On‐BalanceSheetExposureRiskWeights
54
ASSET CLASS ON-BALANCE SHEET EXPOSURESRISK
WEIGHTNotes and Coins (Domestic) 0.00%Notes and Coins (Foreign) 0.00%Bank of Zambia Claims - Denominated in Kwacha and Funded in Kwacha 0.00%Bank of Zambia Claims - Denominated in Foreign Currency 0.00%Bank of Zambia Claims - Open Market Operations (Both Kwacha and Foreign Currency) 0.00%Bank of Zambia Claims - Statutory Reserves (Both Kwacha and Foreign Currency) 0.00%Government of the Republic of Zambia Claims - Denominated in Kwacha and Funded in Kwacha 0.00%Government of the Republic of Zambia Claims - Denominated in Foreign Currency 100.00%Foreign Central Banks Claims - ECA risk score (0-1) 20.00%Foreign Central Banks Claims - ECA risk score (2) 50.00%Foreign Central Banks Claims - ECA risk score (3-6) 100.00%Foreign Central Banks Claims - ECA risk score (7) 150.00%Foreign Central Banks Claims - Unrated 150.00%Meeting BOZ/Basel II Criteria 0.00%Not Meeting BOZ/Basel II Criteria 100.00% - Transactions for settlement within two days 0.00% - with residual maturity of up to 3 months 20.00% - with residual maturity of between 3 and 6 months 50.00% - with residual maturity of between 6 and 12 months 75.00% - with residual maturity of more than 12 months 100.00% - secured by GRZ Debt Instruments 0.00% - With Country ECA Risk Score (0 - 1) 20.00% - With Country ECA Risk Score (2) 50.00% - With Country ECA Risk Score (3 - 6) 100.00% - With Country ECA Risk Score (7) 150.00% - With Country ECA Risk Score (Unrated) 150.00% a) Domestic - denominated and funded in Kwacha and guaranteed by GRZ 20.00% - denominated in a foreign currency and guaranteed by GRZ 50.00% - PSEs with commercial undertakings 100.00% - Other PSEs with no GRZ Guarantee 100.00% b) Foreign - With Country ECA Risk Score (0 - 1) 20.00% - With Country ECA Risk Score (2) 50.00% - With Country ECA Risk Score (3 - 6) 100.00% - With Country ECA Risk Score (7) 150.00% - With Country ECA Risk Score (Unrated) 150.00%Claims on Securities Firms 100.00%Claims on Corporates 100.00%Claims meeting BOZ Criteria 75.00%Others 100.00% - Loan to Value ratio of up 80% 50.0% - Loan to Value ratio greater than 80% 100.00% - Unsecured portion which is past due for 90 days or more 150.00%
CLAIMS SECURED BY All Claims 100.0% - Provisions are less than 20% of the outstanding loan 150.00% - Provisions are equal or exceed 20% but less than 50% of the outstanding loan 100.00% - Provisions are equal to or more than 50% of the outstanding loan 100.00%- Venture capital 150.00%- Private equities 150.00% a) Inter-branch assets in transit - Number of days outstanding (1 to 29) 0.00% - Number of days outstanding (30 to 59) 20.00% - Number of days outstanding (60 to 89) 50.00% - Number of days outstanding (90 days and above) 100.00% b) Inter-bank assets in transit - Number of days outstanding (2 days) 0.00% - Number of days outstanding (2 to 5 days) 20.00% - Number of days outstanding (6 to 10 days) 50.00% - Number of days outstanding (11 to 14 days) 100.00% - Number of days outstanding (over 14 days) 150.00% c) Bills of Exchange - Portion secured by cash or treasury bills 0.00% - Others 100.00% d) Acceptances 100.00% e) Bank premises 100.00% f) Any other assets not listed above 100.00%
CLAIMS ON SECURITISED All Claims 100.00%
CLAIMS INCLUDED IN THE REGULATORY RETAIL CLAIMS SECURED BY RESIDENTIAL PROPERTY
PAST DUE LOANS
HIGHER RISK CATEGORIES
OTHER ASSETS
CLAIMS ON SOVEREIGNS
CLAIMS ON OTHER OFFICIAL ENTITIES AND CLAIMS ON DOMESTIC BAN
CLAIMS ON FOREIGN BANKS
CLAIMS ON PUBLIC SECTOR ENTITIES (PSEs)
CLAIMS ON CORPORATES & SECURITIES FIRMS

AppendixII:ComparisonofRisk‐WeightsforOn‐BalanceSheetExposureunderBaselItoBaselII
55
RISK-WEIGHTED ASSETS (on-balance sheet)Basel I Risk
WeightsBasel II Risk
Weights
Claims on Sovereigns- Notes and Coins 0% 0%- Balances held with BoZ - Current Account 0% 0%- Balances held with BoZ - Statutory Reserve 0% 0%- Claims on GRZ - T-Bills 0% 0%- Claims on GRZ - G-Bonds 20% 0%Claims on Domestic Banks- Transactions for settlement within two days 50% 0%Claims on Foreign Banks (uses ECA country risk score)- With Country ECA Risk Score (0 - 1) 20% 20%- With Country ECA Risk Score 2 n/a 50%- With Country ECA Risk Score (3 - 6) n/a 100%- With Country ECA Risk Score (7) n/a 150%Claims on Public Sector Entities (PSEs)- Domestic - denominated and funded in Kwacha and guaranteed by GRZ 50% 20%Claims on Corporates and Securities Firms- Claims on Corporates 100% 100%Claims Included in the Regulatory Retail Portfolio- Claims meeting BOZ Criteria n/a 75%- Others 100% 100%Claims Secured by Residential Property- Loan to Value ratio of up 80% 50% 50% - Loan to Value ratio of up greater than 80% 100
- Unsecured portion of claims secured by residential mortgages that are past due for 90 days or more shall be risk weighted 150%, net of specific provisions 150%Past Due Loans- Provisions are less than 20% of the outstanding loan 100% 150%- Provisions are equal or exceed 20% but less than 50% of the outstanding loan 100% 100%- Provisions are equal to or more than 50% of the outstanding loan 100% 100%Higher Risk Categories - Private equities 100% 150%Total Past Due LoansProvisions are less than 20% of the outstanding loan 150%Provisions are equal or exceed 20% but less than 50% of the outstanding loan 100%Provisions are equal to or more than 50% of the outstanding loan 100%Other Assets- Bank Premises 100% 100%- Other Assets 100% 100%

AppendixIII:Off‐BalanceSheetExposureRiskWeights
56
OFF-BALANCE SHEET EXPOSURESGROSS EXPOSURE
SPECIFIC PROVISION
NET EXPOSURE BEFORE CCF
CREDIT CONVERSATION FACTOR
NET EXPOSURE AFTER CCF
RISK WEIGHT
RISK WEIGHTED ASSETS
A B C D E F G = E x FUnconditionally cancellable Commitments 0 0.00% 0 0.00% 0Commitments with an original maturity of one year or less 0 20.00% 0 100.00% 0Commitments with an original maturity of more than one year 0 50.00% 0 100.00% 0Direct Credit Substitutes 0 100.00% 0 100.00% 0Sales and Purchase Agreements 0 100.00% 0 100.00% 0Short term self-liquidating trade letters of credit 0 20.00% 0 100.00% 0Forward asset purchases, forward deposits 0 100.00% 0 100.00% 0Transaction related contingent items 0 50.00% 0 100.00% 0Note issuing facilities and revolving underwriting facilities 0 50.00% 0 100.00% 0Securities held by reporting bank as collateral 0 100.00% 0 100.00% 0Lending of bank securities as collateral 0 100.00% 0 100.00% 0TOTAL OFF-BALANCE SHEET CLAIMS

AppendixIV:ComparisonofRiskWeightsforOff‐BalanceSheetExposureunderBaselItoBaselII
57
Basel I Credit Conversion Factor
Basel II Credit Conversion Factor
Basel I Risk weights Basel II Risk weights
Letters of CreditBacked by Eligible CollateralCash backed 100% 20% 20% 100%Backed by Non-Eligible CollateralBacked by assignment of receivables - 20% 0% 100%Backed by letter of undertaking - 20% 0% 100%Backed by VAF Assets - 20% 0% 100%Backed by Debentures - 20% 0% 100%Backed by Mortgage 100% 20% 20% 100%GuaranteesBacked by Eligible CollateralCash 100% 20% 100% 100%T-Bills 100% 20% 50% 100%LC's - 20% - 100%Guarantees - 20% - 100%Backed by Non-Eligible CollateralBacked by Mortgage - 20% - 100%Backed by Debenture - 20% - 100%Backed by Counter Indemnity - 20% - 100%Loan CommitmentsLoan Commitments with original maturity >12 months 20% - 100%Total Off-Balance sheet 50% 100%
CREDIT CONVERSION FACTOR COMPARISON RISK WEIGHT COMPARISON

AppendixV:ImpactAssessmentofBaselIIonCapitalAdequacyRatiosinZambia
58
Total Assets ZMW('000)
Basel I RWA
Basel II RWA
RWA (Increase/ Decrease)
Tier I Capital
Total Capital
Tier I CAR Basel I
Tier I CAR Basel II
Tier I CAR (Increase/ Decrease)
Total CAR Basel I
Total CAR Basel II
CAR (Increase/ Decrease)
A 6,857,437 3,372,291 3,969,258 596,967 642,575 671,593 19% 16% -3% 20% 17% -3%B 6,309,725 3,503,933 4,219,176 715,243 675,587 762,434 19% 16% -3% 22% 18% -4%
Tier 1 C 5,630,837 3,276,658 3,577,780 301,122 701,052 723,098 21% 20% -2% 22% 20% -2%Banks D 5,600,061 3,715,297 4,073,689 358,392 538,934 568,934 15% 13% -1% 15% 14% -1%
Total 24,398,060 15,132,460 15,839,903 707,443 2,558,148 3,265,591 18% 16% -2% 20% 17% 3%E 3,002,132 546,635 930,790 384,155 574,450 574,450 105% 62% -43% 105% 62% -43%F 2,363,426 953,513 1,215,977 262,464 233,248 239,816 25% 19% -5% 25% 20% -5%G 2,320,972 595,388 1,333,804 738,416 562,158 561,488 94% 42% -52% 94% 42% -52%
Tier 2 H 2,099,881 1,369,968 1,853,758 483,790 448,841 534,324 33% 24% -9% 39% 29% -10%Banks I 1,962,720 1,054,825 1,109,411 54,586 273,871 278,207 26% 25% -1% 26% 25% -1%
J 1,371,908 928,069 1,605,343 677,274 266,543 527,062 29% 17% -12% 57% 33% -24%K 1,323,253 683,134 923,527 240,393 90,398 96,402 13% 10% -3% 14% 10% -4%
Total 14,444,291 6,131,532 8,972,610 2,841,078 2,449,509 2,811,749 40% 27% 13% 46% 31% -15%L 818,642 440,894 388,868 -52,026 151,881 156,929 34% 39% 5% 36% 40% 5%M 558,076 277,560 364,425 86,865 102,880 104,574 37% 28% -9% 38% 29% -9%N 407,239 222,704 178,019 -44,685 126,514 126,514 57% 71% 14% 57% 71% 14%
Tier 3 O 383,842 282,130 337,052 54,922 108,555 115,564 39% 32% -6% 41% 34% -7%Banks P 370,831 229,939 299,470 69,531 33,717 33,717 15% 11% -3% 15% 11% -3%
Q 303,278 217,214 275,318 58,104 21,780 21,780 10% 8% -2% 10% 8% -2%R 217,211 133,762 109,710 -24,052 92,656 92,656 69% 85% 15% 69% 85% 15%S 51,548 46,029 49,942 3,913 12,365 12,365 27% 25% -2% 27% 25% -2%
Total 3,110,667 1,850,232 2,002,804 152,572 650,347 664,098 35% 33% -3% 36% 33% -3%
Name

AppendixVI:MEFMIMemberCountriesImplementationStatusofBaselIICapitalFramework
59
Country Elements Status13 Year14 Comments15 Angola Standardised approach Angola has not implemented Basel II. It is now preparing regulations for
discussion with the market. Foundation internal ratings-based approach Advanced internal ratings-based approachBasic indicator approachThe Standardised approach Advanced measurement approachPillar 2 Pillar 3
Botswana Standardised approach 2 Dec-13 Bank of Botswana adopted a gradual approach to Basel II/III implementation
commencing with a parallel-run of Basel I and Basel II simple approaches in 2014, culminating in the adoption of the advanced approaches by qualifying banks in 2017. Full implementation of simple approaches will be in 2015.
Foundation internal ratings-based approach 5 N/A Advanced internal ratings-based approach 5 N/A Basic indicator approach 2 Dec-13 The Standardised approach 2 Dec-13 Advanced measurement approach 5 N/APillar 2 2 Dec-13Pillar 3 2 Dec-13
Kenya Standardised approach 5 N/A
Foundation internal ratings-based approach 5 N/A Advanced internal ratings-based approach 5 N/A Basic indicator approach 4 2013 The Standardised approach 5 N/A Advanced measurement approach 5 N/A Pillar 2 4 2013 Pillar 3 4 2013
Lesotho Standardised approach 1 2015 Lesotho is preparing to implement Basel II, the Central Bank of Lesotho has just
finalised the implementation plan. Foundation internal ratings-based approach 5 N/A Advanced internal ratings-based approach 5 N/A Basic indicator approach 1 2015The Standardised approach 5 N/AAdvanced measurement approach 5 N/A Pillar 2 1 2015Pillar 3 1 2015
Malawi Standardised approach 4 2013 Banks in Malawi completed the implementation of Basel II on 31 December 2013
and formally migrated to Basel II on 1 January 2014. However, there are two banks that have yet to meet revised minimum regulatory capital requirements in line with Basel II; these banks have been given a deadline of 30 June 2014 to be fully compliant.
Foundation internal ratings-based approach 5 N/A Advanced internal ratings-based approach 5 N/A Basic indicator approach 4 2013 The Standardised approach 4 N/A Advanced measurement approach 5 N/APillar 2 4 2013Pillar 3 4 2013
Mozambique Standardised approach 4 2014 Final rule was published in 2013 and entered into force in 2014.
Foundation internal ratings-based approach 5 N/A Advanced internal ratings-based approach 5 N/A Basic indicator approach 4 2014 The Standardised approach 4 2015
13 Status indicators are as follows: 1= Draft regulations not published, 2= Draft regulations published, 3=Final rule published, 4= Final rule in force, 5= Not applicable. 14 This denotes the year in which the draft or final rule was or is expected to be published or when the final rule was will be in force. N/A means that the jurisdiction is not planning to implement this component or is planning to implement the component but does not know the year in which it will be implemented. 15 Responses to the Financial Stability Institute survey on Basel II implementation

AppendixVI:MEFMIMemberCountriesImplementationStatusofBaselIICapitalFramework
60
Country Elements Status13 Year14 Comments15 Advanced measurement approach 5 N/APillar 2 4 2014 Pillar 3 4 2014
Namibia Standardised approach 4 2010
Foundation internal ratings-based approach Advanced internal ratings-based approach Basic indicator approach 2010 The Standardised approach 4 2010 Advanced measurement approach Pillar 2 4 2010Pillar 3 4 2010
Rwanda Standardised approach No data
Foundation internal ratings-based approach Advanced internal ratings-based approach Basic indicator approach The Standardised approach Advanced measurement approach Pillar 2 Pillar 3
Swaziland Standardised approach No Data
Foundation internal ratings-based approachAdvanced internal ratings-based approach Basic indicator approach The Standardised approach Advanced measurement approach Pillar 2 Pillar 3
Tanzania Standardised approach 1 No decision has been taken on implementation of Basel II/III. Tanzania has been
implementing some prerequisite aspects such as full implementation of Basel I, compliance with the Basel Core Principles for Effective Banking Supervision and implementing risk-based supervision while continuing to study Basel II/III. However, most aspects of Pillar II and Pillar III have been implemented through the RBS methodology and disclosure requirements regulations.
Foundation internal ratings-based approach 1Advanced internal ratings-based approach 1 Basic indicator approach 1The Standardised approach 1 Advanced measurement approach 1 Pillar 2 1 Pillar 3 1
Uganda Standardised approach 5 N/A Bank of Uganda (BoU) uses the Basel I Capital Adequacy Framework but Pillar II
and Pillar III aspects of Basel II have been embedded in the supervisory process. Pillar 3 issues are covered in the Financial Institutions Act 2004 and the Implementing Regulations/Guidelines.
Foundation internal ratings-based approach 5 NA Advanced internal ratings-based approach 5 N/ABasic indicator approach 5 N/AThe Standardised approach 5 N/A Advanced measurement approach 5 N/APillar 2 2 2010 Pillar 3 2 2004
Zambia Standardised approach 1 2013
Foundation internal ratings-based approach 1 Not yet decided Advanced internal ratings-based approach 1 Not yet decided Basic indicator approach 1 2013The Standardised approach 1 Not yet decided Advanced measurement approach 1 Not yet decidedPillar 2 1 2013Pillar 3 1 2013
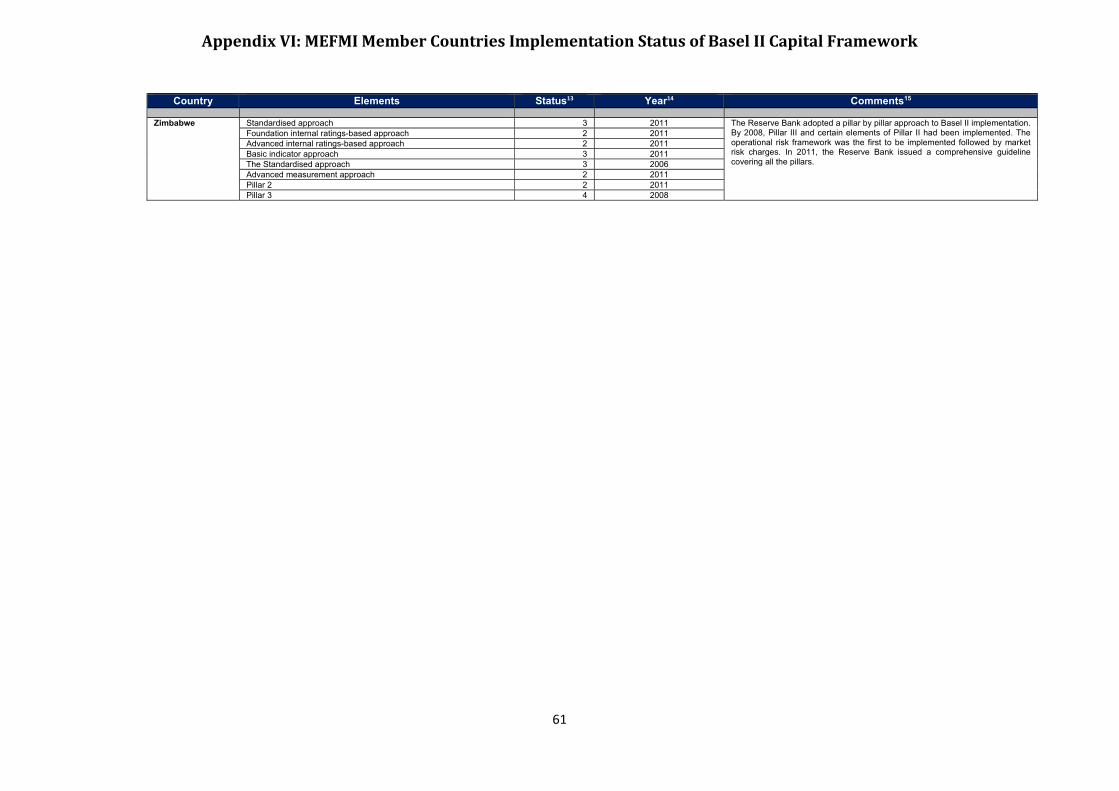
AppendixVI:MEFMIMemberCountriesImplementationStatusofBaselIICapitalFramework
61
Country Elements Status13 Year14 Comments15 Zimbabwe Standardised approach 3 2011 The Reserve Bank adopted a pillar by pillar approach to Basel II implementation.
By 2008, Pillar III and certain elements of Pillar II had been implemented. The operational risk framework was the first to be implemented followed by market risk charges. In 2011, the Reserve Bank issued a comprehensive guideline covering all the pillars.
Foundation internal ratings-based approach 2 2011Advanced internal ratings-based approach 2 2011 Basic indicator approach 3 2011 The Standardised approach 3 2006 Advanced measurement approach 2 2011 Pillar 2 2 2011 Pillar 3 4 2008

AppendixVII:MEFMIMemberCountriesImplementationStatusofBasel2.5CapitalFramework
62
Country Elements Status16 Year17 Comments18
Angola Revisions to Pillar 1 Angola has not implemented Basel II. It is now preparing regulations for discussion with the market.
Supplemental Pillar 2 guidance
Revisions to Pillar 3
Revisions to Basel II market risk framework
Botswana Revisions to Pillar 1 5 N/A
Supplemental Pillar 2 guidance 5 N/A
Revisions to Pillar 3 5 N/A
Revisions to Basel II market risk framework 5 N/A
Kenya
Revisions to Pillar 1 5 N/A
Supplemental Pillar 2 guidance 5 N/A
Revisions to Pillar 3 4 2013
Revisions to Basel II market risk framework 5 N/A
Lesotho Revisions to Pillar 1 5 N/A
Supplemental Pillar 2 guidance 5 NA
Revisions to Pillar 3 5 NA
Revisions to Basel II market risk framework 5 NA
Malawi Revisions to Pillar 1 5 N/A Stress testing guidelines were issued in 2013 and came in
force on 1 January 2014. Supplemental Pillar 2 guidance 5 N/A
Revisions to Pillar 3 5 N/A
Revisions to Basel II market risk framework 5 N/A
Mozambique
Revisions to Pillar 1 5 N/A
Supplemental Pillar 2 guidance 5 N/A
Revisions to Pillar 3 5 N/A
Revisions to Basel II market risk framework 5 N/A
16 Status indicators are as follows: 1= Draft regulations not published, 2= Draft regulations published, 3=Final rule published, 4= Final rule in force, 5= Not applicable. 17 This denotes the year in which the draft or final rule was or is expected to be published or when the final rule was will be in force. N/A means that the jurisdiction is not planning to implement this component or is planning to implement the component but does not know the year in which it will be implemented. 18 Financial Stability Institute: Survey responses on Basel 2.5 Implementation

AppendixVII:MEFMIMemberCountriesImplementationStatusofBasel2.5CapitalFramework
63
Country Elements Status16 Year17 Comments18
Namibia Revisions to Pillar 1 1
Supplemental Pillar 2 guidance 1 Revisions to Pillar 3 1 Revisions to Basel II market risk framework 1
Rwanda Revisions to Pillar 1 No Data
Supplemental Pillar 2 guidance
Revisions to Pillar 3
Revisions to Basel II market risk framework
Swaziland Revisions to Pillar 1 No Data
Supplemental Pillar 2 guidance
Revisions to Pillar 3
Revisions to Basel II market risk framework
Tanzania Revisions to Pillar 1 1 same as Basel II
Supplemental Pillar 2 guidance 1
Revisions to Pillar 3 1
Revisions to Basel II market risk framework 1
Uganda Revisions to Pillar 1 5 N/A
Supplemental Pillar 2 guidance 5 N/A Revisions to Pillar 3 5 N/A
Revisions to Basel II market risk framework 5 N/A Zambia Revisions to Pillar 1 1 2013 The draft regulations for Pillar I have already been finalised;
hence revisions to include Basel 2.5 for Pillar I will be done later. Revisions to Pillar II & III that are relevant for the jurisdiction will be incorporated.
Supplemental Pillar 2 guidance 1 2013
Revisions to Pillar 3 1 2013 Revisions to Basel II market risk framework 1 2013
Zimbabwe
Revisions to Pillar 1 1 2015 Currently there is a securitisation guideline in place which shall be revised to incorporate Basel 2.5 aspects. The disclosure framework will also be reviewed in line with international developments, informed partly by lessons from the global crisis.
Supplemental Pillar 2 guidance 1 2015
Revisions to Pillar 3 1 2015
Revisions to Basel II market risk framework 1 2015

AppendixVIII:MEFMIMemberCountriesImplementationStatusofBaselIIICapitalFramework
64
Country Elements Status19 Year20 Comments21
Angola Liquidity Standard Angola has not implemented Basel II. It is now preparing regulations for discussion with the market. Definition of Capital
Risk coverage Capital conservation buffer Countercyclical capital buffer Leverage ratio D-SIBs G-SIBs
Botswana Liquidity Standard 1 2014 the central bank has adopted the capital definition under Basel III; however,
capital buffers and leverage ratios have been deferred to a later stage. The central bank has also drafted liquidity guidelines based on the new liquidity standards and the draft has been sent to the market for comment and will be finalised by the end of 2014.
Definition of Capital 2 Dec-13 Risk coverage 5 N/A Capital conservation buffer 5 N/A Countercyclical capital buffer 5 N/A Leverage ratio 5 N/A D-SIBs 5 N/A G-SIBs 5 N/A
Kenya Liquidity Standard 4 2013 The LCR was included as part of Liquidity Risk Management, to guide banks
on good practices in liquidity management. Definition of Capital 4 2013 Risk coverage 5 N/A Capital conservation buffer 4 2013 Countercyclical capital buffer 5 N/A Leverage ratio 5 N/A D-SIBs 4 2013 G-SIBs 5 N/A
Lesotho Liquidity Standard 5 N/A Lesotho intends to adopt the new definition of capital adequacy only. As
such the capital adequacy regulations are to be amended accordingly by 2015.
Definition of Capital 1 2015 Risk coverage 5 N/A Capital conservation buffer 5 N/A Countercyclical capital buffer 5 N/A Leverage ratio 5 N/A D-SIBs 5 N/A G-SIBs 5 N/A
Malawi Liquidity Standard 1 2016 Banks are since 1 January 2013 required submitting monthly returns that
include templates for calculation of the LCR and the leverage ratio in preparation for the issuance of new bank leverage and liquidity standards.
Definition of Capital 1 2018 Risk coverage 5 N/A Capital conservation buffer 5 N/A Countercyclical capital buffer 5 N/A Leverage ratio 1 2016 D-SIBs 5 N/A G-SIBs 5 N/A
19Status indicators are as follows: 1= Draft regulations not published, 2= Draft regulations published, 3=Final rule published, 4= Final rule in force, 5= Not applicable. 20This denotes the year in which the draft or final rule was or is expected to be published or when the final rule was will be in force. N/A means that the jurisdiction is not planning to implement this component or is planning to implement the component but does not know the year in which it will be implemented. 21Financial Stability Institute: Survey responses on Basel III Implementation
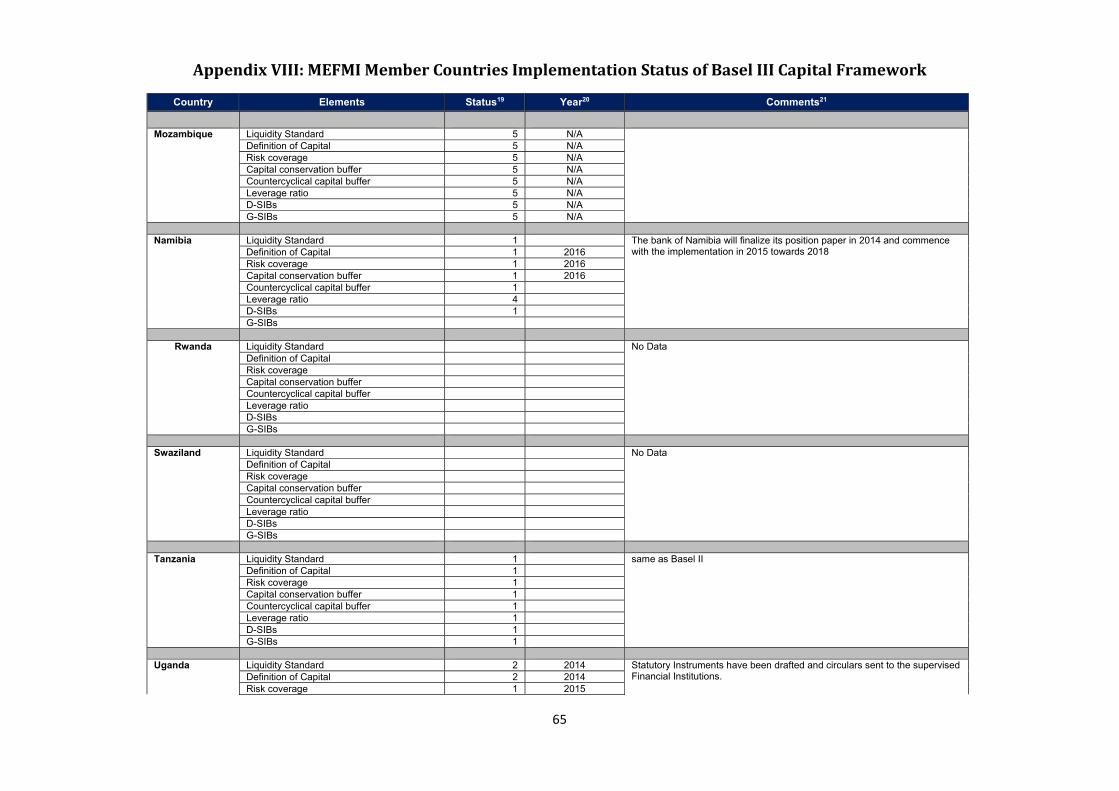
AppendixVIII:MEFMIMemberCountriesImplementationStatusofBaselIIICapitalFramework
65
Country Elements Status19 Year20 Comments21
Mozambique Liquidity Standard 5 N/A
Definition of Capital 5 N/A Risk coverage 5 N/A Capital conservation buffer 5 N/A Countercyclical capital buffer 5 N/A Leverage ratio 5 N/A D-SIBs 5 N/A G-SIBs 5 N/A
Namibia Liquidity Standard 1 The bank of Namibia will finalize its position paper in 2014 and commence
with the implementation in 2015 towards 2018 Definition of Capital 1 2016 Risk coverage 1 2016 Capital conservation buffer 1 2016 Countercyclical capital buffer 1 Leverage ratio 4 D-SIBs 1 G-SIBs
Rwanda Liquidity Standard No Data
Definition of Capital Risk coverage Capital conservation buffer Countercyclical capital buffer Leverage ratio D-SIBs G-SIBs
Swaziland Liquidity Standard No Data
Definition of Capital Risk coverage Capital conservation buffer Countercyclical capital buffer Leverage ratio D-SIBs G-SIBs
Tanzania Liquidity Standard 1 same as Basel II
Definition of Capital 1 Risk coverage 1 Capital conservation buffer 1 Countercyclical capital buffer 1 Leverage ratio 1 D-SIBs 1 G-SIBs 1
Uganda Liquidity Standard 2 2014 Statutory Instruments have been drafted and circulars sent to the supervised
Financial Institutions. Definition of Capital 2 2014 Risk coverage 1 2015

AppendixVIII:MEFMIMemberCountriesImplementationStatusofBaselIIICapitalFramework
66
Country Elements Status19 Year20 Comments21
Capital conservation buffer 2 2014 Countercyclical capital buffer 2 2014 Leverage ratio 2 2015 D-SIBs 2 2014 G-SIBs 1 N/A
Zambia Liquidity Standard 1 2014 Provisions for Basel III have been included in the draft Banking and Financial
Services Act. Detailed regulations, however, will only be worked on commencing 2014.
Definition of Capital 1 2014 Risk coverage 1 2014 Capital conservation buffer 1 2014 Countercyclical capital buffer 1 2014 Leverage ratio 1 2014 D-SIBs 1 Not yet Decided G-SIBs 1 Not yet Decided
Zimbabwe Liquidity Standard 1 2015 in order to cater for some of the capital buffers covered in Basel III, the
Reserve Bank increased capital ratios across the board as follows: Tier I capital from 6% to 8% and capital adequacy ratio from 10% to 12%
Definition of Capital 4 2012 Risk coverage 1 2015 Capital conservation buffer 4 2012 Countercyclical capital buffer 4 2012 Leverage ratio 4 2000 D-SIBs 1 2015 G-SIBs 1 2015