Embed Size (px)
Citation preview
Impact of climate change on health and wellbeing in remote Australian communities: a review of literature and scoping of adaptation options
Jane Addison
Working paper
CW014 2013
Cooperative Research Centre for Remote Economic Participation Working Paper CW014 ISBN: 978-1-74158-226-0 Citation Addison J. 2013. Impact of climate change on health and wellbeing in remote Australian communities: a
review of literature and scoping of adaptation options. CRC-REP Working Paper CW014. Ninti One Limited, Alice Springs.
Acknowledgements Thanks to those working in remote Australia who agreed to discuss this work. Yash Srivastava and Andrew Crouch are acknowledged for their review of the scenarios presented in this report. Yiheyis Maru is thanked for a number of discussions relating to this report, as well as assisting with the gap analysis table. Digby Race, Sheree Cairney and Kevin Williams provided guidance and input into the report. Meg Parsons, David Campbell, Ruth Elvin, Craig James and Ralph Matthews are thanked for their insightful review of the draft report, but all errors are the responsibility of the author. David Campbell is also thanked for providing key papers for review. The Cooperative Research Centre for Remote Economic Participation receives funding through the Australian Government Cooperative Research Centres Program. The views expressed herein do not necessarily represent the views of CRC-REP or its Participants. For additional information please contact Ninti One Limited Communications Manager PO Box 154, Kent Town SA 5071 Australia Telephone +61 8 8959 6000 Fax +61 8 8959 6048 www.nintione.com.au © Ninti One Limited 2013
Impact of climate change on health and wellbeing in remote Australian communities: a review of literature and scoping of adaptation options
Jane Addison
CRC-REP Working Paper CW014
ii Impact of climate change on health and wellbeing in remote Australian communities: Ninti One Limited a review of literature and scoping of adaptation options
Contents
Executive summary ........................................................................................................................... v 1. Introduction ................................................................................................................................... 1 2. Climate change and liveability ....................................................................................................... 2 3. Remote Australia ......................................................................................................................... 10
3.1 Introduction ........................................................................................................................... 10
3.2 Pathways to impact ................................................................................................................ 10
3.3 Cape York ............................................................................................................................. 14
3.4 Central Australia .................................................................................................................... 19
3.5 Kimberley .............................................................................................................................. 24
4. Synthesis ..................................................................................................................................... 29 4.1 Vulnerability .......................................................................................................................... 29
4.2 Resilience .............................................................................................................................. 29
5. Adaptation ................................................................................................................................... 36 5.1 Barriers to adaptation ............................................................................................................. 36
5.2 Overcoming barriers .............................................................................................................. 37
5.3 Adaptation under uncertainty ................................................................................................. 38
5.4 Options for focal areas ........................................................................................................... 39
6. Knowledge gaps and future research needs .................................................................................. 44 References....................................................................................................................................... 46 Appendix 1: Methodology ............................................................................................................... 57
A1.1 Methodology ....................................................................................................................... 57
A1.2 Assumptions, exclusions, risks and limitations .................................................................... 60
Appendix 2: Key climate metrics for the focal areas ........................................................................ 62 Appendix 3: Key demographic and vulnerability indicators for the focal areas ................................. 63 Appendix 4: Key research projects and adaptation plans relevant to focal areas................................ 69
A4.1 Cape York........................................................................................................................... 69
A4.2 Central Australia ................................................................................................................. 70
A4.3 Kimberley ........................................................................................................................... 71
CRC-REP Working Paper CW014
Ninti One Limited Impact of climate change on health and wellbeing in remote Australian communities: iii
a review of literature and scoping of adaptation options
Tables Table 1: Examples of likely effects of global climate change on liveability ........................................ 3 Table 2: Factors that increase, or may increase, an individual or population’s sensitivity to climate
variability/climate change ................................................................................................... 8 Table 3: Other impacts from climate change predicted for Cape York .............................................. 17 Table 4: Other impacts from climate change predicted for Central Australia, as cited in the soft and
hard literature ................................................................................................................... 23 Table 5: Other impacts from climate change predicted for the Kimberley, as cited in the soft and hard
literature ........................................................................................................................... 26 Table 6: Factors that increase, or may increase, vulnerability to climate variability/climate change .. 31 Table 7: Examples of risk-minimising adaptation measures of potential relevance to the focal areas 41 Table 8: Gap analysis on the literature related to climate change, liveability and adaptation in remote
Australia ........................................................................................................................... 44 Table 9: Web of Knowledge database search, including search terms and number of hits ................. 58 Table 10: Summary of the ‘soft database’ search ............................................................................. 59 Table 11: Climate metrics for three contrasting locations within each focal area............................... 62 Table 12: Key demographic and vulnerability indicators for the focal areas ..................................... 63 Table 13: Proportion of population that identify as being of Aboriginal and Torres Strait Islander
descent ............................................................................................................................. 65 Table 14: Proportion of population by income class ......................................................................... 65 Table 15: Proportion of people employed, by industry ..................................................................... 66 Table 16: Household mobility indicators .......................................................................................... 67 Table 17: Proportion of population by education level ..................................................................... 67 Table 18: Percentage of population aged 65 years or over ................................................................ 68 Table 19: Percentage of population 0–14 years old .......................................................................... 68
Figures Figure 1: Conceptual model taking an ‘outcome’ vulnerability (O’Brien et al. 2007) approach to
illustrating climate change impacts on health and liveability ............................................... 6 Figure 2: Range of predicted climate changes for Cape York ........................................................... 16 Figure 3: Todd River in flood .......................................................................................................... 20 Figure 4: Range of predicted climate changes for Central Australia .................................................. 22 Figure 5: Range of predicted climate changes for the Kimberley ...................................................... 25 Figure 6: Kimberley fire .................................................................................................................. 28 Boxes Box 1: Interconnected impacts of climatic events, infrastructure and health in a remote community . 11 Box 2: Scenario 1 – hotter temperatures, no change in rainfall ......................................................... 12 Box 3: Scenario 2 – hotter temperatures, increased rainfall .............................................................. 12 Box 4: Scenario 3 – hotter temperatures, decreased rainfall .............................................................. 13 Box 5: Important design principles for adaptation measures ............................................................. 38
CRC-REP Working Paper CW014
iv Impact of climate change on health and wellbeing in remote Australian communities: Ninti One Limited a review of literature and scoping of adaptation options
Shortened forms
ABC Australian Broadcasting Commission ABS Australian Bureau of Statistics BoM Bureau of Meteorology CAT Centre for Appropriate Technology CDEP Community Development Employment Projects. This Commonwealth program
will be replaced by the Remote Jobs and Communities Program as of July 1, 2013.
CRC-REP Cooperative Research Centre for Remote Economic Participation CSIRO Commonwealth Scientific and Industrial Research Organisation IEK Indigenous ecological knowledge NCCARP National Climate Change Adaptation Research Plan NCCARF National Climate Change Adaptation Research Facility TEK Traditional ecological knowledge TSRA Torres Strait Regional Authority WBGT Wet bulb globe temperature (indicator of the level of comfort experienced by
an individual, taking into account both humidity and temperature)
Glossary
Adaptation The planned or spontaneous adjustment in natural or human systems to climatic stimuli (Hennessy et al. 2007)
Adaptive capacity The resources and assets that represent the asset base from which adaptation actions and investments can be made, and is thus a component of vulnerability (Vincent 2007)
Climate change Statistically significant variation in either the mean state of the climate or in its variability, persisting for an extended period (typically decades or longer) (WHO 2003; IPCC 2007)
Exposure The character, magnitude and rate of climate variation affecting a system (WHO 2003)
Health A state of complete physical, mental and social wellbeing and not merely the absence of disease or infirmity (WHO 1948)
Liveability The state of wellbeing realised by the sum of interactions between the physical and social environment
Resilience The capacity of a system to absorb disturbance, and reorganise while undergoing change so as to retain essentially the same function, structure, identity and feedbacks (Walker et al. 2004)
Sensitivity The degree to which a system or (sub)-population is affected by climatic variability/change (IPCC 2007)
Vulnerability The degree to which a population is susceptible to, or unable to cope with, adverse effects of climate change, including climate variability and extremes (modified from WHO 2003; IPCC 2007). Vulnerability is a product of exposure and sensitivity.
CRC-REP Working Paper CW014
Ninti One Limited Impact of climate change on health and wellbeing in remote Australian communities: v
a review of literature and scoping of adaptation options
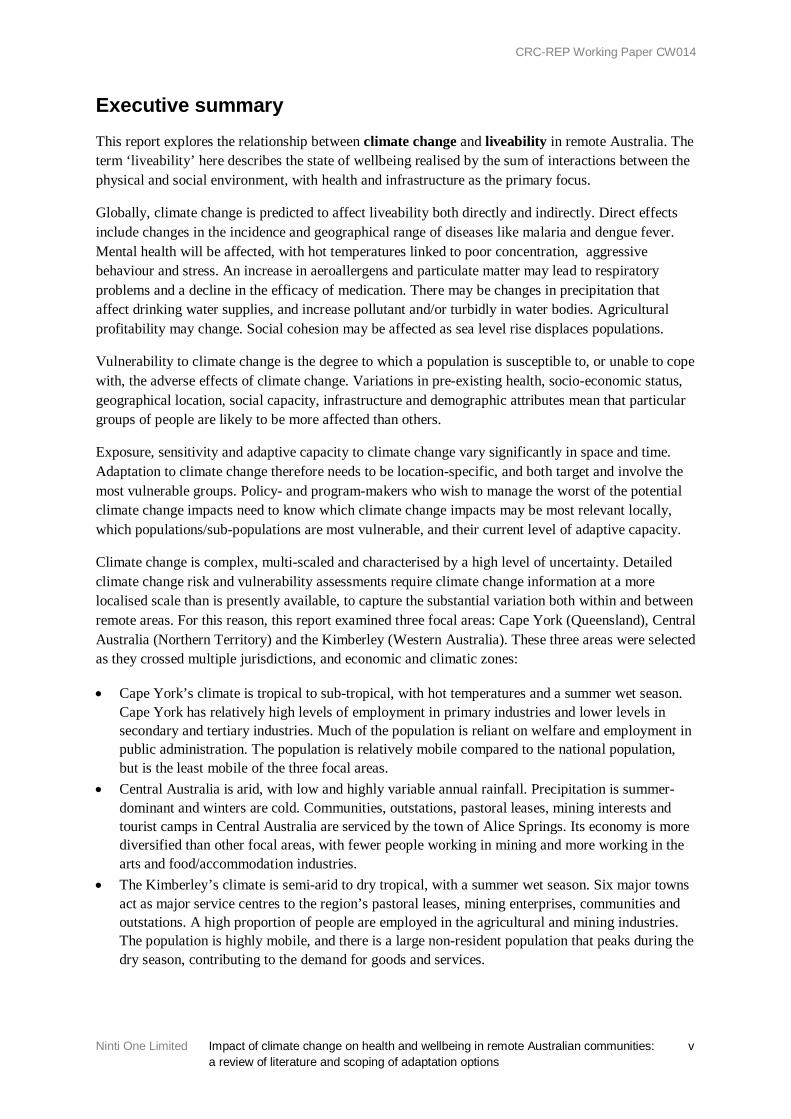
Executive summary This report explores the relationship between climate change and liveability in remote Australia. The term ‘liveability’ here describes the state of wellbeing realised by the sum of interactions between the physical and social environment, with health and infrastructure as the primary focus.
Globally, climate change is predicted to affect liveability both directly and indirectly. Direct effects include changes in the incidence and geographical range of diseases like malaria and dengue fever. Mental health will be affected, with hot temperatures linked to poor concentration, aggressive behaviour and stress. An increase in aeroallergens and particulate matter may lead to respiratory problems and a decline in the efficacy of medication. There may be changes in precipitation that affect drinking water supplies, and increase pollutant and/or turbidly in water bodies. Agricultural profitability may change. Social cohesion may be affected as sea level rise displaces populations.
Vulnerability to climate change is the degree to which a population is susceptible to, or unable to cope with, the adverse effects of climate change. Variations in pre-existing health, socio-economic status, geographical location, social capacity, infrastructure and demographic attributes mean that particular groups of people are likely to be more affected than others.
Exposure, sensitivity and adaptive capacity to climate change vary significantly in space and time. Adaptation to climate change therefore needs to be location-specific, and both target and involve the most vulnerable groups. Policy- and program-makers who wish to manage the worst of the potential climate change impacts need to know which climate change impacts may be most relevant locally, which populations/sub-populations are most vulnerable, and their current level of adaptive capacity.
Climate change is complex, multi-scaled and characterised by a high level of uncertainty. Detailed climate change risk and vulnerability assessments require climate change information at a more localised scale than is presently available, to capture the substantial variation both within and between remote areas. For this reason, this report examined three focal areas: Cape York (Queensland), Central Australia (Northern Territory) and the Kimberley (Western Australia). These three areas were selected as they crossed multiple jurisdictions, and economic and climatic zones:
• Cape York’s climate is tropical to sub-tropical, with hot temperatures and a summer wet season. Cape York has relatively high levels of employment in primary industries and lower levels in secondary and tertiary industries. Much of the population is reliant on welfare and employment in public administration. The population is relatively mobile compared to the national population, but is the least mobile of the three focal areas.
• Central Australia is arid, with low and highly variable annual rainfall. Precipitation is summer-dominant and winters are cold. Communities, outstations, pastoral leases, mining interests and tourist camps in Central Australia are serviced by the town of Alice Springs. Its economy is more diversified than other focal areas, with fewer people working in mining and more working in the arts and food/accommodation industries.
• The Kimberley’s climate is semi-arid to dry tropical, with a summer wet season. Six major towns act as major service centres to the region’s pastoral leases, mining enterprises, communities and outstations. A high proportion of people are employed in the agricultural and mining industries. The population is highly mobile, and there is a large non-resident population that peaks during the dry season, contributing to the demand for goods and services.

CRC-REP Working Paper CW014
vi Impact of climate change on health and wellbeing in remote Australian communities: Ninti One Limited a review of literature and scoping of adaptation options
All three focal areas include large populations of people with poor health, infrastructure and socio-economic status, and high numbers of children. All areas are predicted to warm under climate change; however, there is a high level of inconsistency around predicted changes in precipitation. In general, the population of urban centres such as Broome, Kununurra and Alice Springs show low sensitivity to climate change due to their relatively high socio-economic status. Outside of large urban areas, all focal areas include sub-populations that may be more sensitive to climate change impacts than other areas of Australia. Of the focal areas, the Shires of Derby-West Kimberley and Halls Creek, western areas of Cape York and northern and central areas of Central Australia appear to be among the most sensitive areas in Australia. The Shires of Wyndham-East Kimberley and Broome, outside of Kununurra and Broome townships, also show high levels of sensitivity. Given currently high levels of socio-economic disadvantage, a low tax base and poor service provision, most households and populations in the focal areas are likely to have poor adaptive capacity.
Resilience to climate change is the capacity of a system to absorb disturbance, and reorganise while undergoing change so as to retain essentially the same function, structure, identity and feedbacks. Vulnerable sub-populations in focal areas may manage climate change through behavioural adjustments such as mobility. However, it is likely that the current cultural attitudes and practises that have allowed remote Australians to manage for climate extremes in the past or present may not be sufficient under future climate change scenarios while socio-economic disadvantage remains.
Internationally, there is a lack of information on actual, current adaptation measures to climate change. Some barriers to effective adaptation measures are specific to remote areas, such as high reliance on fossil fuels, ensuring equitable and just access to healthcare, creating resilient infrastructure, consistent services and a sustainable workforce. While the involvement of local communities will be key in designing appropriate adaptation measures, low population densities, high dependency ratios and relatively few taxable individuals may make it difficult for local communities to raise adequate funds to adapt.
Given high levels of uncertainty in both the biophysical and socio-economic system, adaptation measures to climate change should follow key, risk-related principles:
• No regrets/win-win: Measures should accrue benefits, even without climate change • High insensitivity to future climate condition: Benefits should be accrued from adaptation
measures regardless of the eventual climate change scenario • Flexible and easily reversible: Measures should be able to be changed easily if they become
irrelevant, inappropriate or are found to create unwanted impacts • Safety margins: Measures should account for the full range of potential climate change scenarios,
rather than just the most likely scenario • Softness: Institutional, financial or behavioural measures are likely to be less expensive, and more
easily changed, than infrastructure measures • Reduce decision time horizons: Increase flexibility and reversibility.
These principles are largely related to selecting measures that have both short-term and long-term benefits, prevent maladaptation by neither affecting future adaptation options nor exacerbating climate change, and minimise risk. Addressing socio-economic disadvantage in focal areas is the best adaptation measure to climate change that meets all key, risk-related principles. However, more specific adaptation measures may also be locally appropriate provided other risk-related principles are met.
CRC-REP Working Paper CW014
Ninti One Limited Impact of climate change on health and wellbeing in remote Australian communities: 1 a review of literature and scoping of adaptation options
1. Introduction This report explores the relationship between climate change and liveability in remote Australia in general, and Cape York, Central Australia and Kimberley regions in particular. The ABS defines remoteness using the Accessibility/Remoteness Index of Australia (ARIA). ARIA is based on physical road distance to the nearest service centres (University of Adelaide 2013). In this report, ‘remote’ will be used to cover ARIA’s ‘remote’ and ‘very remote’ classifications.
Climate change is statistically significant variation in either the mean state of the climate or in its variability, persisting for an extended period (typically decades or longer) (WHO 2003; IPCC 2007). In contrast, weather events are of shorter duration.
The term liveability is inconsistently described and poorly defined in the international literature, but generally emphasises the physical and social environment in which people live (see van Kamp et al. 2003). For example, the Department of Sustainability, Environment, Water, Population and Communities (SEWPaC 2011) equates liveability to the quality of urban life that is determined predominately by the physical nature of the built environment, but also includes more general social and economic conditions. The term is sometimes synonymous with wellbeing and quality of life (van Kamp et al. 2003), with the three terms often being used to define each other. All three terms emphasise human perception; the ability, capability and freedom to access things that individuals enjoy; and the importance of the external environment in affecting the state of, and access to, these things. Because the term liveability includes all characteristics influencing where people live, such as participation, economic strength, social inclusion, built infrastructure, social infrastructure, environment, transport and amenity, it is too all-encompassing to explore in its entirety here. Instead, health and infrastructure are used here as surrogate indicators of liveability, hereby defined as the state of human wellbeing realised by the sum of interactions between the physical and social environments.1
Liveability, health and infrastructure are strongly linked. This report follows the World Health Organization’s definition of health as a state of complete physical, mental and social wellbeing and not merely the absence of disease or infirmity (WHO 1948). This holistic definition parallels the term liveability, and reflects the growing emphasis on systems thinking when seeking to understand climate change impacts (Moser 2011). The health domain of the Mercer (2012) liveability index includes infrastructure indicators such as water potability, sewage and waste removal. Good health hardware, such as functional plumbing, reduces the spread of infectious disease groups that are most likely to be affected by environmental conditions. These include respiratory infections, gastro-intestinal infections, skin infections and eye and ear infections (NSW Department of Health 2010). Continual exposure to these diseases can also contribute to chronic disease later in life (NSW Department of Health 2010). Housing and infrastructure are a documented determinant of health and other liveability attributes in remote Australia (Kimberley Aboriginal Health Plan Steering Committee 1999; Spickett et al. 2008). For example, inadequate housing and crowding were found to limit the efficacy of trachoma control in Central Australia (Ewald et al. 2003; Lansingh et al. 2010). Similarly, children in communities with more houses, fewer shared toilets and more electrical appliances were found to have lower hospital admission rates in the Northern Territory (Munoz et al. 1992). The rate of hospital separations for infectious diseases was 40% less for the rural NSW Aboriginal population with Housing for Health interventions that improved basic housing infrastructure when compared to the population with no such intervention (NSW Department
1 See Appendix 1 for a discussion of some of the strengths and limitations of defining the term in this way.
CRC-REP Working Paper CW014
2 Impact of climate change on health and wellbeing in remote Australian communities: Ninti One Limited a review of literature and scoping of adaptation options
of Health 2010). For these reasons, housing and related infrastructure are also considered closely with health throughout this report.
The approach suggested by Ebi et al. (2006) for assessing human health vulnerability and public health interventions to adapt to climate change is:
1. determine the scope of the assessment 2. describe current associations between health outcomes, climate variability and change 3. identify and describe current strategies, policies and measures to reduce the burden of climate-
sensitive health determinants and outcomes 4. review the health implications of the potential impacts of climate variability and change 5. estimate the future potential health impacts 6. synthesise the results 7. identify additional adaptation policies and measures, including procedures for evaluation after
implementation.
This report loosely follows this suggestion by reviewing the international literature on climate change and liveability, and then identifying potential vulnerability indicators that may be applicable to the focal areas. It next describes remote Australia and the focal areas. The biophysical and socio-economic profile of these areas is included, as are projected trends that may be relevant to climate change or climate change adaptation. Current climate change adaptation plans and research relevant to the focal areas are highlighted, where available. Finally, the report draws upon the international literature to review potential adaptation options that may improve liveability under climate change in the focal areas, or in areas that share a similar vulnerability profile.
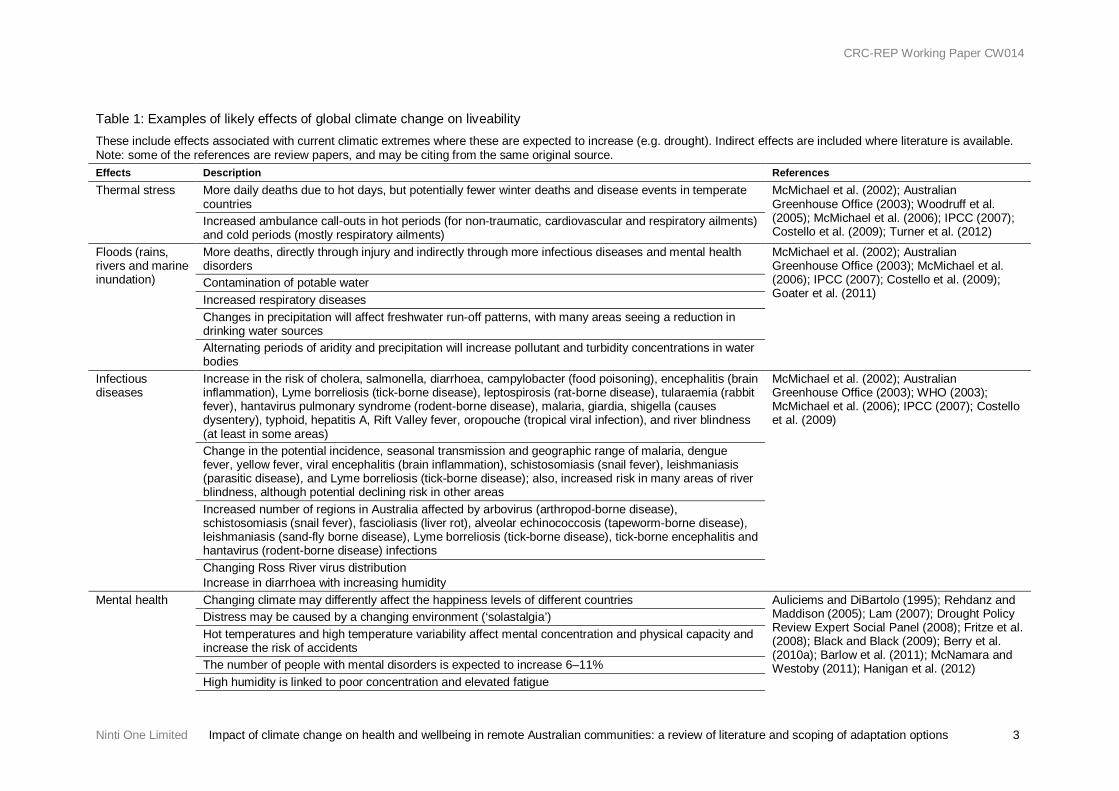
2. Climate change and liveability Climate change is expected to affect a range of biophysical and socio-economic entities in ways that change liveability (IPCC 2007). A growing body of international literature predicts the likely impact that climate change will have on health. While not exhaustive, Table 1 provides examples of some of these impacts.
CRC-REP Working Paper CW014
Ninti One Limited Impact of climate change on health and wellbeing in remote Australian communities: a review of literature and scoping of adaptation options 3
Table 1: Examples of likely effects of global climate change on liveability These include effects associated with current climatic extremes where these are expected to increase (e.g. drought). Indirect effects are included where literature is available. Note: some of the references are review papers, and may be citing from the same original source. Effects Description References Thermal stress More daily deaths due to hot days, but potentially fewer winter deaths and disease events in temperate
countries McMichael et al. (2002); Australian Greenhouse Office (2003); Woodruff et al. (2005); McMichael et al. (2006); IPCC (2007); Costello et al. (2009); Turner et al. (2012)
Increased ambulance call-outs in hot periods (for non-traumatic, cardiovascular and respiratory ailments) and cold periods (mostly respiratory ailments)
Floods (rains, rivers and marine inundation)
More deaths, directly through injury and indirectly through more infectious diseases and mental health disorders
McMichael et al. (2002); Australian Greenhouse Office (2003); McMichael et al. (2006); IPCC (2007); Costello et al. (2009); Goater et al. (2011)
Contamination of potable water Increased respiratory diseases Changes in precipitation will affect freshwater run-off patterns, with many areas seeing a reduction in drinking water sources Alternating periods of aridity and precipitation will increase pollutant and turbidity concentrations in water bodies
Infectious diseases
Increase in the risk of cholera, salmonella, diarrhoea, campylobacter (food poisoning), encephalitis (brain inflammation), Lyme borreliosis (tick-borne disease), leptospirosis (rat-borne disease), tularaemia (rabbit fever), hantavirus pulmonary syndrome (rodent-borne disease), malaria, giardia, shigella (causes dysentery), typhoid, hepatitis A, Rift Valley fever, oropouche (tropical viral infection), and river blindness (at least in some areas)
McMichael et al. (2002); Australian Greenhouse Office (2003); WHO (2003); McMichael et al. (2006); IPCC (2007); Costello et al. (2009)
Change in the potential incidence, seasonal transmission and geographic range of malaria, dengue fever, yellow fever, viral encephalitis (brain inflammation), schistosomiasis (snail fever), leishmaniasis (parasitic disease), and Lyme borreliosis (tick-borne disease); also, increased risk in many areas of river blindness, although potential declining risk in other areas Increased number of regions in Australia affected by arbovirus (arthropod-borne disease), schistosomiasis (snail fever), fascioliasis (liver rot), alveolar echinococcosis (tapeworm-borne disease), leishmaniasis (sand-fly borne disease), Lyme borreliosis (tick-borne disease), tick-borne encephalitis and hantavirus (rodent-borne disease) infections Changing Ross River virus distribution Increase in diarrhoea with increasing humidity
Mental health Changing climate may differently affect the happiness levels of different countries Auliciems and DiBartolo (1995); Rehdanz and Maddison (2005); Lam (2007); Drought Policy Review Expert Social Panel (2008); Fritze et al. (2008); Black and Black (2009); Berry et al. (2010a); Barlow et al. (2011); McNamara and Westoby (2011); Hanigan et al. (2012)
Distress may be caused by a changing environment (‘solastalgia’) Hot temperatures and high temperature variability affect mental concentration and physical capacity and increase the risk of accidents The number of people with mental disorders is expected to increase 6–11% High humidity is linked to poor concentration and elevated fatigue
CRC-REP Working Paper CW014
Ninti One Limited Impact of climate change on health and wellbeing in remote Australian communities: a review of literature and scoping of adaptation options 4
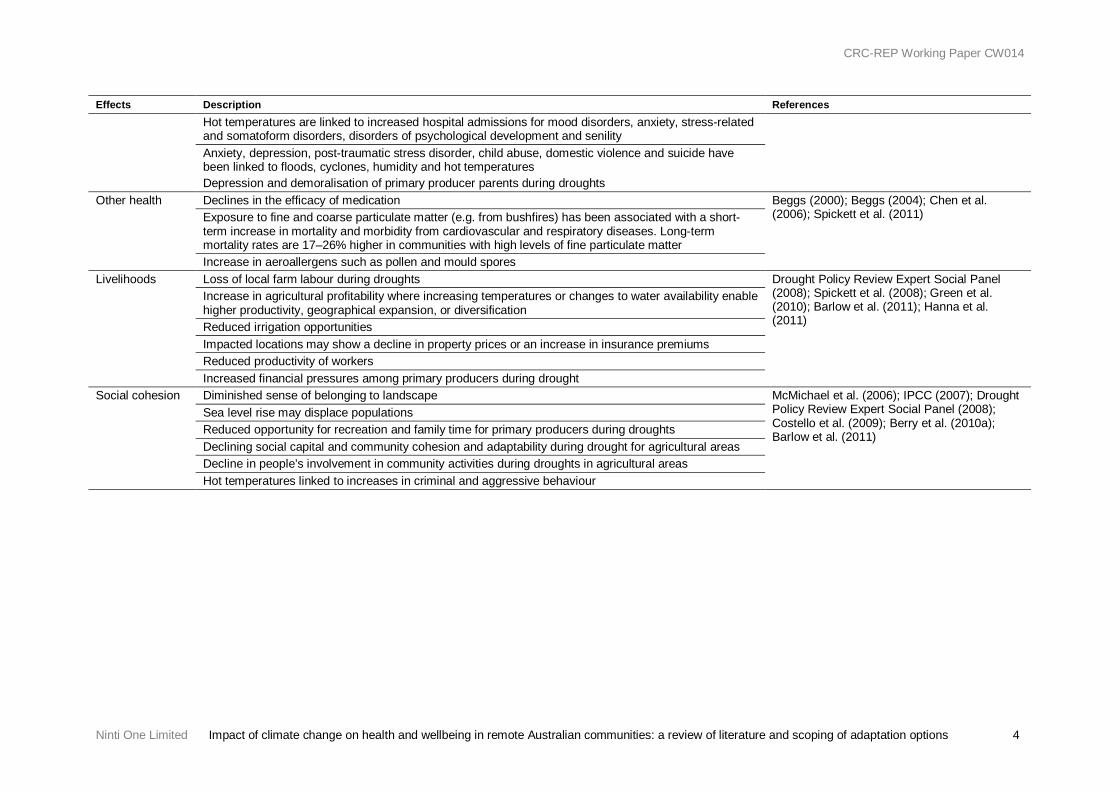
Effects Description References Hot temperatures are linked to increased hospital admissions for mood disorders, anxiety, stress-related and somatoform disorders, disorders of psychological development and senility Anxiety, depression, post-traumatic stress disorder, child abuse, domestic violence and suicide have been linked to floods, cyclones, humidity and hot temperatures Depression and demoralisation of primary producer parents during droughts
Other health Declines in the efficacy of medication Beggs (2000); Beggs (2004); Chen et al. (2006); Spickett et al. (2011) Exposure to fine and coarse particulate matter (e.g. from bushfires) has been associated with a short-
term increase in mortality and morbidity from cardiovascular and respiratory diseases. Long-term mortality rates are 17–26% higher in communities with high levels of fine particulate matter Increase in aeroallergens such as pollen and mould spores
Livelihoods Loss of local farm labour during droughts Drought Policy Review Expert Social Panel (2008); Spickett et al. (2008); Green et al. (2010); Barlow et al. (2011); Hanna et al. (2011)
Increase in agricultural profitability where increasing temperatures or changes to water availability enable higher productivity, geographical expansion, or diversification Reduced irrigation opportunities Impacted locations may show a decline in property prices or an increase in insurance premiums Reduced productivity of workers Increased financial pressures among primary producers during drought
Social cohesion Diminished sense of belonging to landscape McMichael et al. (2006); IPCC (2007); Drought Policy Review Expert Social Panel (2008); Costello et al. (2009); Berry et al. (2010a); Barlow et al. (2011)
Sea level rise may displace populations Reduced opportunity for recreation and family time for primary producers during droughts Declining social capital and community cohesion and adaptability during drought for agricultural areas Decline in people’s involvement in community activities during droughts in agricultural areas Hot temperatures linked to increases in criminal and aggressive behaviour
CRC-REP Working Paper CW014
Ninti One Limited Impact of climate change on health and wellbeing in remote Australian communities: 5 a review of literature and scoping of adaptation options
While Table 1 indicates what types of changes are possible under climate change, the relationship between social, economic and biophysical systems is complex, multi-scaled and characterised by a high level of uncertainty (IPCC 2007; Hallegate 2009; Green et al. 2010; Browne and Bishop 2011; Harley et al. 2011). Some uncertainty is irreducible (Hallegate 2009; Handmer et al. 2012). High levels of uncertainty in risk must be measured in more detail, and more clearly communicated (Barnett et al. 2011; Handmer et al. 2012). The variability and vulnerability of localised populations to climate change impacts must be explored (State of Victoria 2007) but detailed climate change risk and vulnerability assessments require climate change information at a more localised scale than what is presently available (Handmer et al. 2012; Maru et al. 2012). While there must be more research (Fritze et al. 2008; Green et al. 2010; Spickett et al. 2011), uncertainty will always exist about the scale and timing of both climate change effects, and the vulnerability and adaptive capacity of populations, and action will need to proceed regardless (Vincent 2007; Frumkin et al. 2008; Adger et al. 2009; Costello et al. 2009; Hallegate 2009; Browne and Bishop 2011; Green et al. 2012).
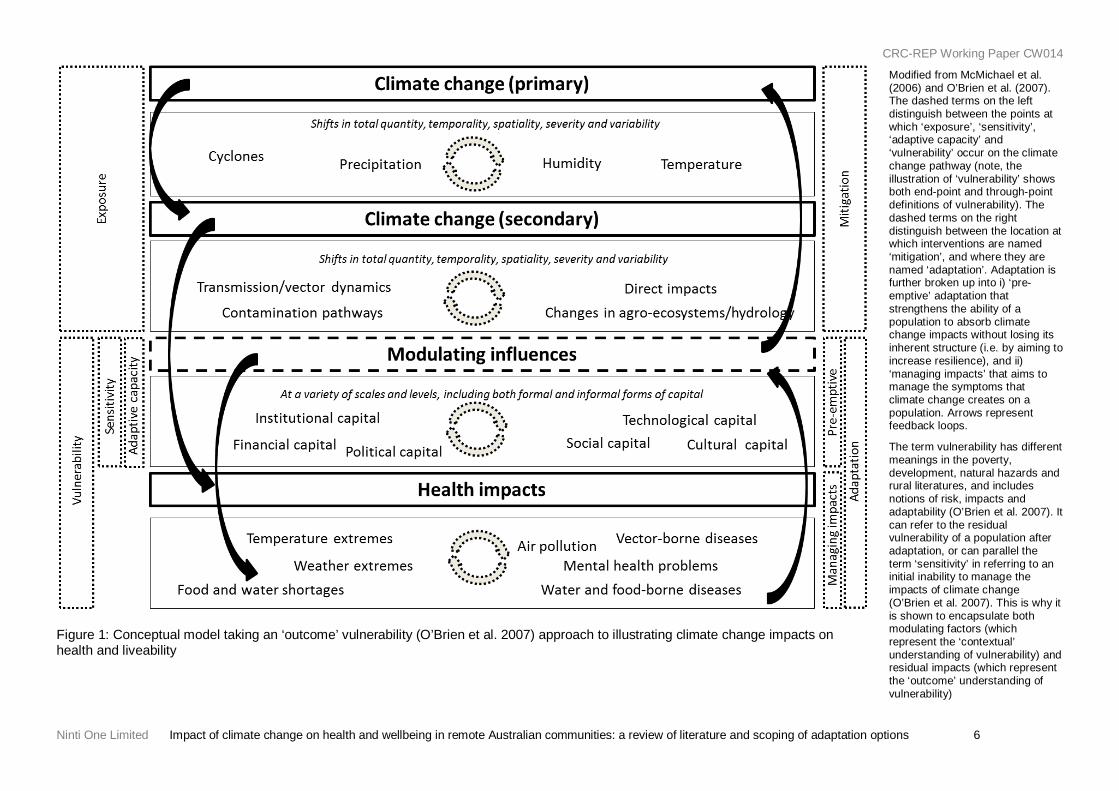
The likelihood of occurrence and severity of the impacts shown in Table 1 is a product of a population’s vulnerability and adaptive capacity. A conceptual model can be used to illustrate the broad pathways by which climate change may affect health and liveability (Figure 1).
Vulnerability to climate change is the degree to which a population is susceptible to, or unable to cope with, adverse effects of climate change, including climate variability and extremes (modified from WHO 2003; IPCC 2007). There are a number of risks associated with identifying a population’s vulnerability to climate change. Inappropriately framed, the term can imply weakness, passivity or instability, and has historically been used by external agents to justify interventions in communities (see Green et al. 2012). The term can also create the impression that specific groups of people are inherently vulnerable when, instead, their shared vulnerability is a product of a shared social, economic or political history (see Appendix 2 for the way in which this report frames vulnerability in remote Australia). Despite these issues, policymakers find value in identifying which sub-populations are vulnerable to external shocks and stresses, and under which conditions (Green et al. 2012). This report uses the literature in an initial attempt to identify these two aspects across the three focal areas.
Vulnerability is a product of exposure and sensitivity and, in some definitions, adaptive capacity (see O’Brien et al. 2007). In the context of this report, exposure is the character, magnitude and rate of climate variation affecting a system (WHO 2003). Broadscale climate change predictions will not always reflect exposure at more localised levels. The effects that exposure will have on a local population are also a product of that population’s inherent sensitivity. Sensitivity is the degree to which a system or (sub)-population is affected by climatic variability and/or change (IPCC 2007). Sensitivity to climate change varies both between and within populations, even where inherent exposure remains the same.
CRC-REP Working Paper CW014
Ninti One Limited Impact of climate change on health and wellbeing in remote Australian communities: a review of literature and scoping of adaptation options 6
Modified from McMichael et al. (2006) and O’Brien et al. (2007). The dashed terms on the left distinguish between the points at which ‘exposure’, ‘sensitivity’, ‘adaptive capacity’ and ‘vulnerability’ occur on the climate change pathway (note, the illustration of ‘vulnerability’ shows both end-point and through-point definitions of vulnerability). The dashed terms on the right distinguish between the location at which interventions are named ‘mitigation’, and where they are named ‘adaptation’. Adaptation is further broken up into i) ‘pre-emptive’ adaptation that strengthens the ability of a population to absorb climate change impacts without losing its inherent structure (i.e. by aiming to increase resilience), and ii) ‘managing impacts’ that aims to manage the symptoms that climate change creates on a population. Arrows represent feedback loops.
The term vulnerability has different meanings in the poverty, development, natural hazards and rural literatures, and includes notions of risk, impacts and adaptability (O’Brien et al. 2007). It can refer to the residual vulnerability of a population after adaptation, or can parallel the term ‘sensitivity’ in referring to an initial inability to manage the impacts of climate change (O’Brien et al. 2007). This is why it is shown to encapsulate both modulating factors (which represent the ‘contextual’ understanding of vulnerability) and residual impacts (which represent the ‘outcome’ understanding of vulnerability)
Figure 1: Conceptual model taking an ‘outcome’ vulnerability (O’Brien et al. 2007) approach to illustrating climate change impacts on health and liveability
CRC-REP Working Paper CW014
Ninti One Limited Impact of climate change on health and wellbeing in remote Australian communities: 7 a review of literature and scoping of adaptation options
The factors that make populations sensitive to climate change also tend to reduce their adaptive capacity (Berrang-Ford et al. 2011). Adaptation is the planned or spontaneous adjustment in natural or human systems to climatic stimuli (Hennessy et al. 2007). Adaptive capacity is the resources and assets that represent the asset base from which adaptation actions and investments can be made, and is thus a component of vulnerability (Vincent 2007). Understanding how climate change will affect liveability therefore requires an understanding of what makes some populations or sub-populations more sensitive, and less able to adapt, than others (Maru et al. 2012). Some characteristics that the international literature has identified as increasing sensitivity to climate change are summarised in Table 2.
Exposure, sensitivity and adaptive capacity vary significantly in space and time (Spickett et al. 2008; Langton et al. 2012). Adaptation to climate change therefore needs to be location-specific, and both target and involve the most vulnerable groups (Spickett et al. 2011; Langton et al. 2012). Policy- and program-makers who wish to manage the worst of the potential climate change impacts described in Table 1 need to know which of these are most relevant at the local scale, which populations/sub-populations are most vulnerable, and their current level of adaptive capacity (Spickett et al. 2011). This is also the case for people living in remote Australia, where identifying and exploring vulnerability and adaptation strategies to climate change is needed at the local level (Bi and Parton 2008; Fritze et al. 2008).
CRC-REP Working Paper CW014
Ninti One Limited Impact of climate change on health and wellbeing in remote Australian communities: a review of literature and scoping of adaptation options 8
Table 2: Factors that increase, or may increase, an individual or population’s sensitivity to climate variability/climate change Note: some of these references are review papers, and the original references have not been verified. The number of references should not be assumed to indicate the strength or certainty of the factor, and factors should not be assumed to be as equally significant as each other. No attempt is made to highlight or differentiate out indicators that are auto-correlated. General Specific References Economic Low financial capacity/income IPCC (2007); State of Victoria (2007); Fritze et al. (2008); Spickett et al. (2008);
Costello et al. (2009); TSRA (2010); DCCEE (2011); Maller and Strengers (2011); Langton et al. (2012)
Subsistence farmers/those whose economic prosperity depends directly on weather patterns
Spickett et al. (2008); Costello et al. (2009)
‘Traditional’/Indigenous societies State of Victoria (2007); Costello et al. (2009); Berry et al. (2010a); DCCEE (2011); Langton et al. (2012)
People in thermally stressful occupations (e.g. mining, shearing, farm work, fire fighting, outdoor maintenance work), young people undertaking heavy labour
McMichael et al. (2006); Berry et al. (2010a); Hanna et al. (2011)
Fly-in/fly-out workers in thermally stressful occupations who may return to work prior to acclimatisation
Hanna et al. (2011)
Health Those with pre-existing illnesses, particularly respiratory illnesses, and cardiovascular disease
WHO (2003); McMichael et al. (2006); State of Victoria (2007); Spickett et al. (2008); Costello et al. (2009); Green et al. (2009a)
Intense physical stress McMichael et al. (2006); Berry et al. (2010a) Low health levels Spickett et al. (2008); Costello et al. (2009); DCCEE (2011); Langton et al. (2012) Mental illness WHO (2003); Fritze et al. (2008); Cusack et al. (2011); Maller and Strengers
(2011) High body mass index (> 26 kgs per metre squared surface area) Department of the Army and Air Force (2003); Green et al. (2009b); Hanna et al.
(2011) Poor physical fitness Department of the Army and Air Force (2003); Hanna et al. (2011) Disability Spickett et al. (2008) Alcohol and/or drug dependency Green et al. (2009b); Cusack et al. (2011) Geographic Proximity to the coast McMichael et al. (2006); Spickett et al. (2008); Costello et al. (2009); Green et al.
(2010); Chen and Graham (2011) Remoteness Spickett et al. (2008); DCCEE (2011) Small islands IPCC (2007); Green et al. (2010); McNamara and Westoby (2011); Handmer et
al. (2012) People in cold locations will be more affected by hotter temperatures McMichael et al. (2006)
Urban people due to the ‘heat island’ effect Costello et al. (2009); Maller and Strengers (2011); Spickett et al. (2011) People sleeping on the top floor of buildings Maller and Strengers (2011)

CRC-REP Working Paper CW014
Ninti One Limited Impact of climate change on health and wellbeing in remote Australian communities: a review of literature and scoping of adaptation options 9
General Specific References Social Low human capacity Costello et al. (2009) Low levels of education Costello et al. (2009); Langton et al. (2012) Homeless people Spickett et al. (2008); Maller and Strengers (2011) Weak social support mechanisms Blashki et al. (2011) Those who live alone Maller and Strengers (2011) Demographic Elderly people due to their higher vulnerability to disease Australian Greenhouse Office (2003); McMichael et al. (2006); State of Victoria
(2007); Costello et al. (2009); Green et al. (2009b); Berry et al. (2010a); Horton et al. (2010); DCCEE (2011); Maller and Strengers (2011); Spickett et al. (2011); Ford et al. (2012)
Children due to their higher vulnerability to disease Ferguson-Hill (2002); Lam (2007); Costello et al. (2009); Green et al. (2009a); Ford et al. (2012); Maller and Strengers (2011); Spickett et al. (2011)
Males under the age of 25 and over 59 (increased risk of flood effects due to risk-seeking behaviour in the younger and immobility in the older group)
McMichael et al. (2002)
Young people (who are more vulnerable to post-traumatic stress disorder)
Berry et al. (2010a)
Women (who are more likely to migrate for employment or children’s education)
Berry et al. (2010a); Ford et al. (2012)
Institutional Aged care facilities due to the high density of elderly people Commonwealth of Australia (2007) Schools due to the high density of children Commonwealth of Australia (2007) Childcare centres due to the high density of children Commonwealth of Australia (2007) Infrastructure Those living in buildings without insulation Maller and Strengers (2011) Low levels of infrastructure, such as good housing and adequate fresh
water State of Victoria (2007); Costello et al. (2009); Langton et al. (2012)
Those unable to cool their living environment Blashki et al. (2011) Those who currently live in air-conditioning all year round Maller and Strengers (2011)
CRC-REP Working Paper CW014
10 Impact of climate change on health and wellbeing in remote Australian communities: Ninti One Limited a review of literature and scoping of adaptation options
3. Remote Australia
3.1 Introduction
Remote Australia differs from major cities, inner regional and outer regional areas in some important ways. Males outnumber females in almost all age groups (AIHW 2003). There are more children and working age males, and fewer elderly people (AIHW 2003). There is a significant young and highly mobile adult population from inner city areas (Jones et al. n.d.) that uses remote Australia as a ‘life stage escalator’ to advance their careers (Taylor et al. 2006). The proportion of people identifying as Aboriginal or Torres Strait Islander increases with remoteness (AIHW 2003).
Many socio-economic indicators suggest that remote Australians fare more poorly than those in less remote areas. Remote populations have higher levels of the risk factors known to lead to poor health, such as smoking, alcohol use, obesity and inactivity, and a lesser ability to access health services (Philips 2009). Subsequently, there are higher levels of coronary heart disease, diabetes, chronic obstructive pulmonary disease and cancers (Philips 2009). Death rates for the total population in very remote areas is higher than in Australia overall and life expectancy is lower (AIHW 2003). Injury hospital separation rates (use of hospital facilities due to injury), homicide rates and asthma death rates are also higher in remote Australia (Fraser et al. 2002).
When considered with Table 2, these differences in key socio-economic indicators suggest that remote Australia has a higher level of sensitivity to climate change, and a lower level of adaptive capacity, than non-remote Australia. However, there is substantial variation both within and between remote areas (Fraser et al. 2002; Maru and Chewings 2008; Green et al. 2009b; Langton et al. 2012). Indeed, the Jones et al. (n.d.) regionalisation of Australia, using Australian Bureau of Statistics (ABS) data, suggests that remote Australia is the most demographically variable of all regions. In some remote locations, death rates are lower than in major cities (Philips 2009). The ‘life stage escalator’ sub-population described earlier (Taylor et al. 2006) may be less vulnerable to climate change than other sub-populations due to good health and high levels of social capital (Jones et al. n.d.). Some remote areas are wealthier than urban areas: in 2009, the mean annual income in one statistical area of the Pilbara region of Western Australia was $74,577 compared to $52,325 in one area of Sydney (ABS 2011). While the literature recognises that localised assessments of climate change exposure and sensitivity are important (Bi and Parton 2008; Fritze et al. 2008; Spickett et al. 2011; Langton et al. 2012), extremely high levels of variability suggest that localised assessments are even more important in remote Australia.
3.2 Pathways to impact
Understanding the pathway from climate change to health impacts can assist with the design of effective adaptation strategies (Hanna and Spickett 2011). Figure 1 showed pathways to impact at a broad scale, and Tables 1 and 2 illustrated some of the ways that climate change can both directly and indirectly affect health in remote Australia. However, it is very difficult to map pathways to impact at the scale of the focal area given both the high levels of uncertainty and scaling issues. There are also significant gaps in the published literature on relationships between potential mechanical changes in infrastructure caused by climate change, social systems and health, and adaptation options. For example, Cechet (2005) noted that rainfall changes can alter moisture balances on roads, contributing to pavement deterioration. Higher temperatures can also contribute to cracking and subsequent loss of waterproofing, but research into the use and capability of regional road networks in emergency evacuation planning is lacking (Taylor and Philp 2010). Stewart et al. (2011) found that by 2100,
CRC-REP Working Paper CW014
Ninti One Limited Impact of climate change on health and wellbeing in remote Australian communities: 11 a review of literature and scoping of adaptation options
carbonation-induced damage to concrete corrosion may increase by 400% in tropical areas of Australia. Predicted effects were particularly bad in arid areas, where climate change may increase corrosion damage risks by 40–460% (Stewart et al. 2011). However, economic assessments of adaptation measures such as increased cover, concrete mix durability, galvanised or steel reinforcements and coatings are largely missing (Stewart et al. 2011). High levels of uncertainty around both climate change and its impacts on human systems also make it very difficult to determine which adaptation options may be effective or economically viable.
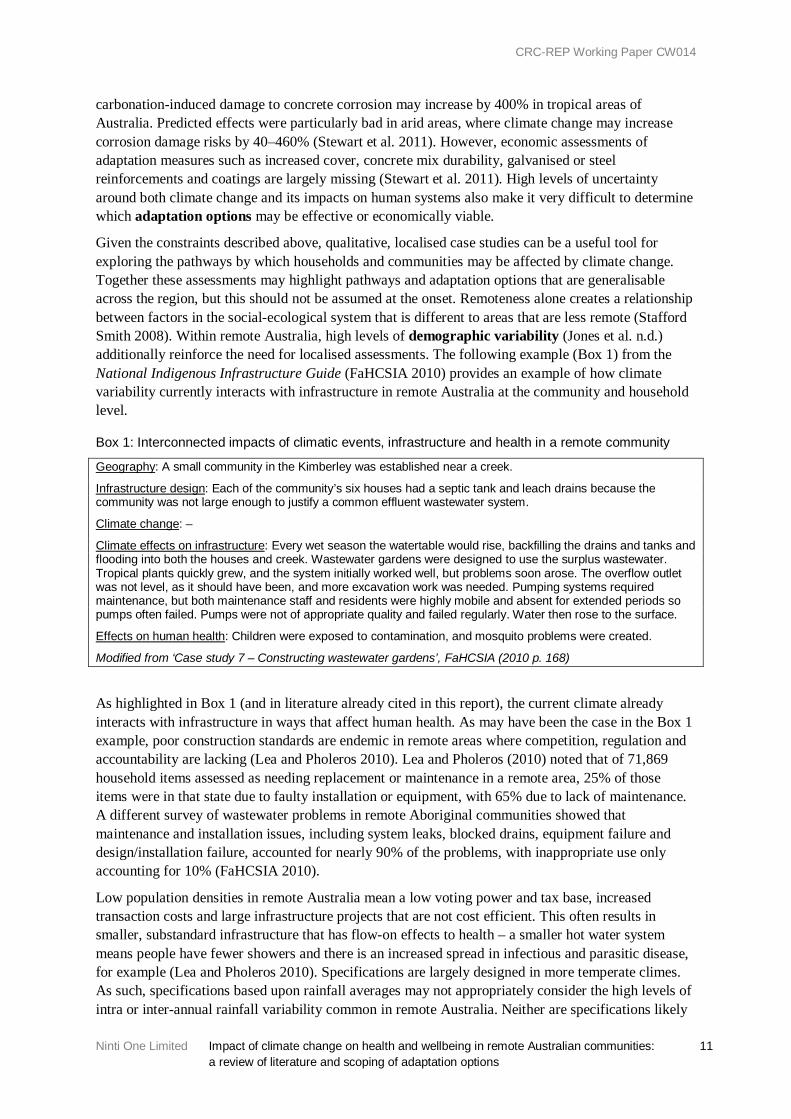
Given the constraints described above, qualitative, localised case studies can be a useful tool for exploring the pathways by which households and communities may be affected by climate change. Together these assessments may highlight pathways and adaptation options that are generalisable across the region, but this should not be assumed at the onset. Remoteness alone creates a relationship between factors in the social-ecological system that is different to areas that are less remote (Stafford Smith 2008). Within remote Australia, high levels of demographic variability (Jones et al. n.d.) additionally reinforce the need for localised assessments. The following example (Box 1) from the National Indigenous Infrastructure Guide (FaHCSIA 2010) provides an example of how climate variability currently interacts with infrastructure in remote Australia at the community and household level.
Box 1: Interconnected impacts of climatic events, infrastructure and health in a remote community
Geography: A small community in the Kimberley was established near a creek.
Infrastructure design: Each of the community’s six houses had a septic tank and leach drains because the community was not large enough to justify a common effluent wastewater system.
Climate change: –
Climate effects on infrastructure: Every wet season the watertable would rise, backfilling the drains and tanks and flooding into both the houses and creek. Wastewater gardens were designed to use the surplus wastewater. Tropical plants quickly grew, and the system initially worked well, but problems soon arose. The overflow outlet was not level, as it should have been, and more excavation work was needed. Pumping systems required maintenance, but both maintenance staff and residents were highly mobile and absent for extended periods so pumps often failed. Pumps were not of appropriate quality and failed regularly. Water then rose to the surface.
Effects on human health: Children were exposed to contamination, and mosquito problems were created.
Modified from ‘Case study 7 – Constructing wastewater gardens’, FaHCSIA (2010 p. 168)
As highlighted in Box 1 (and in literature already cited in this report), the current climate already interacts with infrastructure in ways that affect human health. As may have been the case in the Box 1 example, poor construction standards are endemic in remote areas where competition, regulation and accountability are lacking (Lea and Pholeros 2010). Lea and Pholeros (2010) noted that of 71,869 household items assessed as needing replacement or maintenance in a remote area, 25% of those items were in that state due to faulty installation or equipment, with 65% due to lack of maintenance. A different survey of wastewater problems in remote Aboriginal communities showed that maintenance and installation issues, including system leaks, blocked drains, equipment failure and design/installation failure, accounted for nearly 90% of the problems, with inappropriate use only accounting for 10% (FaHCSIA 2010).
Low population densities in remote Australia mean a low voting power and tax base, increased transaction costs and large infrastructure projects that are not cost efficient. This often results in smaller, substandard infrastructure that has flow-on effects to health – a smaller hot water system means people have fewer showers and there is an increased spread in infectious and parasitic disease, for example (Lea and Pholeros 2010). Specifications are largely designed in more temperate climes. As such, specifications based upon rainfall averages may not appropriately consider the high levels of intra or inter-annual rainfall variability common in remote Australia. Neither are specifications likely
CRC-REP Working Paper CW014
12 Impact of climate change on health and wellbeing in remote Australian communities: Ninti One Limited a review of literature and scoping of adaptation options
to consider high levels of dust, calcification and solar radiation (Lea and Pholeros 2010). Remoteness can increase both the cost and time of repairs, sometimes leading to additional problems with infrastructure. People in remote Australia are highly mobile, which can make it difficult to maintain infrastructure maintenance schedules. These characteristics combine to increase both the likelihood that housing and infrastructure will fail, and that it will stay ‘failed’ for longer than it would in non-remote Australia.
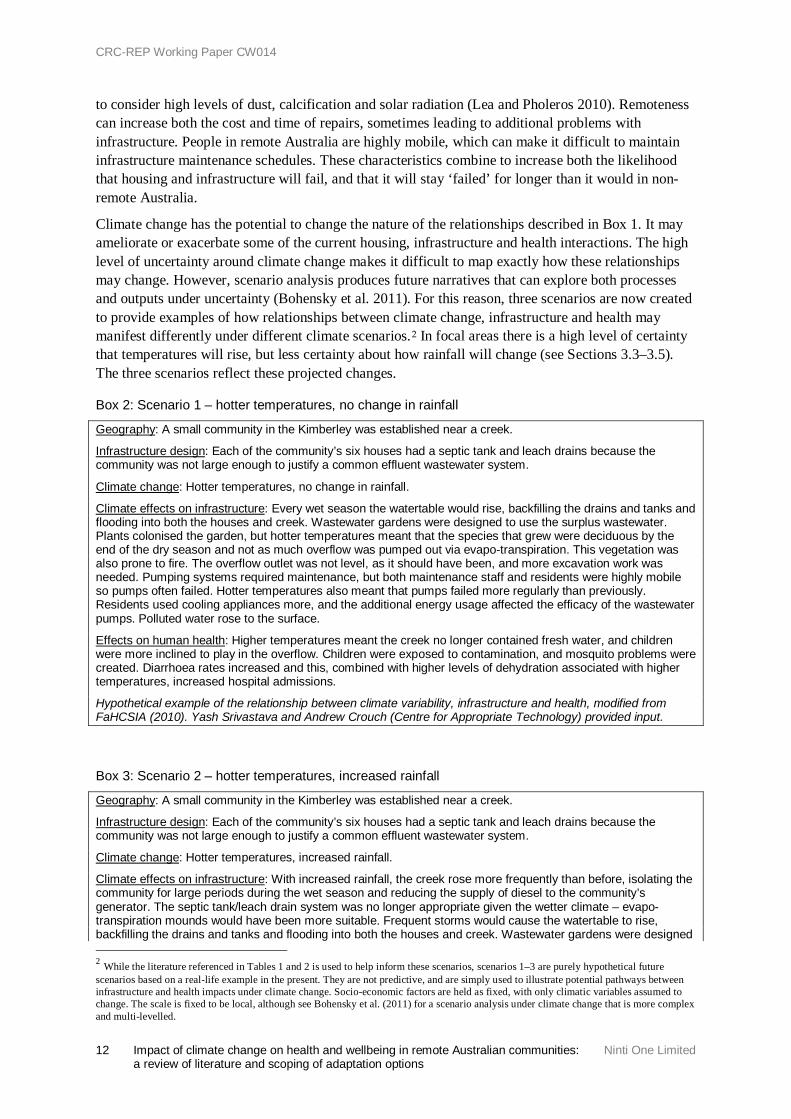
Climate change has the potential to change the nature of the relationships described in Box 1. It may ameliorate or exacerbate some of the current housing, infrastructure and health interactions. The high level of uncertainty around climate change makes it difficult to map exactly how these relationships may change. However, scenario analysis produces future narratives that can explore both processes and outputs under uncertainty (Bohensky et al. 2011). For this reason, three scenarios are now created to provide examples of how relationships between climate change, infrastructure and health may manifest differently under different climate scenarios.2 In focal areas there is a high level of certainty that temperatures will rise, but less certainty about how rainfall will change (see Sections 3.3–3.5). The three scenarios reflect these projected changes.
Box 2: Scenario 1 – hotter temperatures, no change in rainfall
Geography: A small community in the Kimberley was established near a creek.
Infrastructure design: Each of the community’s six houses had a septic tank and leach drains because the community was not large enough to justify a common effluent wastewater system.
Climate change: Hotter temperatures, no change in rainfall.
Climate effects on infrastructure: Every wet season the watertable would rise, backfilling the drains and tanks and flooding into both the houses and creek. Wastewater gardens were designed to use the surplus wastewater. Plants colonised the garden, but hotter temperatures meant that the species that grew were deciduous by the end of the dry season and not as much overflow was pumped out via evapo-transpiration. This vegetation was also prone to fire. The overflow outlet was not level, as it should have been, and more excavation work was needed. Pumping systems required maintenance, but both maintenance staff and residents were highly mobile so pumps often failed. Hotter temperatures also meant that pumps failed more regularly than previously. Residents used cooling appliances more, and the additional energy usage affected the efficacy of the wastewater pumps. Polluted water rose to the surface.
Effects on human health: Higher temperatures meant the creek no longer contained fresh water, and children were more inclined to play in the overflow. Children were exposed to contamination, and mosquito problems were created. Diarrhoea rates increased and this, combined with higher levels of dehydration associated with higher temperatures, increased hospital admissions.
Hypothetical example of the relationship between climate variability, infrastructure and health, modified from FaHCSIA (2010). Yash Srivastava and Andrew Crouch (Centre for Appropriate Technology) provided input.
Box 3: Scenario 2 – hotter temperatures, increased rainfall
Geography: A small community in the Kimberley was established near a creek.
Infrastructure design: Each of the community’s six houses had a septic tank and leach drains because the community was not large enough to justify a common effluent wastewater system.
Climate change: Hotter temperatures, increased rainfall.
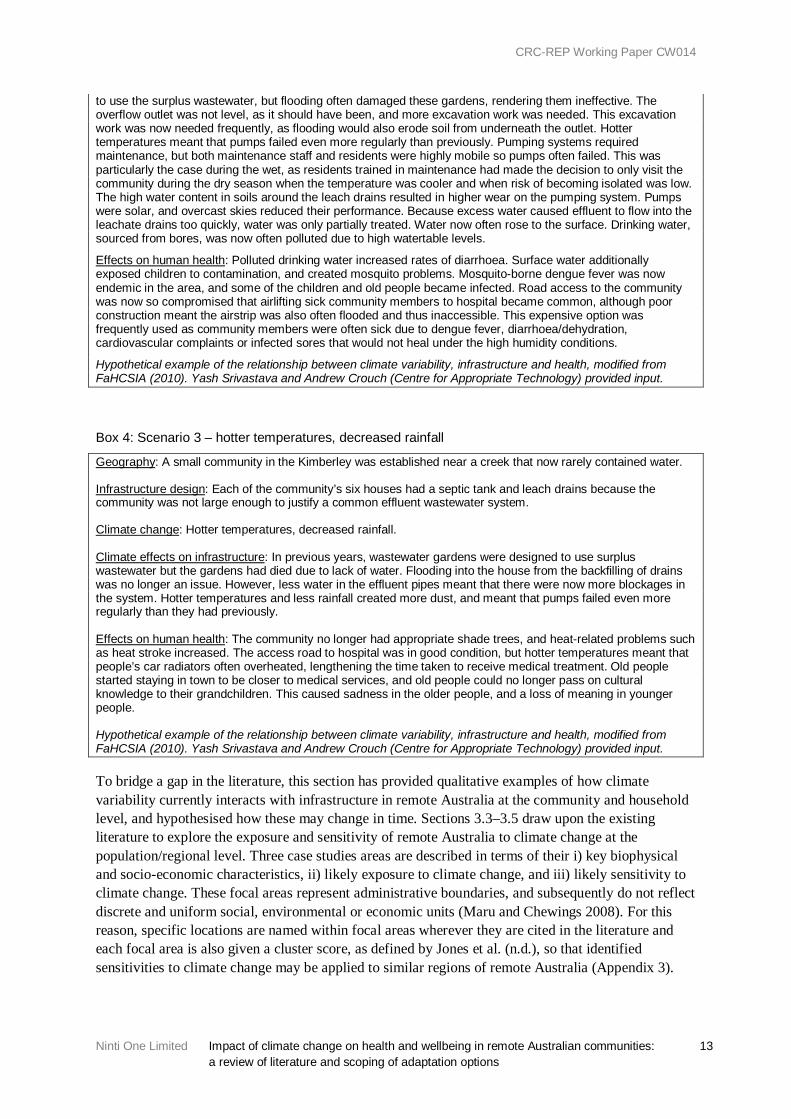
Climate effects on infrastructure: With increased rainfall, the creek rose more frequently than before, isolating the community for large periods during the wet season and reducing the supply of diesel to the community’s generator. The septic tank/leach drain system was no longer appropriate given the wetter climate – evapo-transpiration mounds would have been more suitable. Frequent storms would cause the watertable to rise, backfilling the drains and tanks and flooding into both the houses and creek. Wastewater gardens were designed 2 While the literature referenced in Tables 1 and 2 is used to help inform these scenarios, scenarios 1–3 are purely hypothetical future scenarios based on a real-life example in the present. They are not predictive, and are simply used to illustrate potential pathways between infrastructure and health impacts under climate change. Socio-economic factors are held as fixed, with only climatic variables assumed to change. The scale is fixed to be local, although see Bohensky et al. (2011) for a scenario analysis under climate change that is more complex and multi-levelled.
CRC-REP Working Paper CW014
Ninti One Limited Impact of climate change on health and wellbeing in remote Australian communities: 13 a review of literature and scoping of adaptation options
to use the surplus wastewater, but flooding often damaged these gardens, rendering them ineffective. The overflow outlet was not level, as it should have been, and more excavation work was needed. This excavation work was now needed frequently, as flooding would also erode soil from underneath the outlet. Hotter temperatures meant that pumps failed even more regularly than previously. Pumping systems required maintenance, but both maintenance staff and residents were highly mobile so pumps often failed. This was particularly the case during the wet, as residents trained in maintenance had made the decision to only visit the community during the dry season when the temperature was cooler and when risk of becoming isolated was low. The high water content in soils around the leach drains resulted in higher wear on the pumping system. Pumps were solar, and overcast skies reduced their performance. Because excess water caused effluent to flow into the leachate drains too quickly, water was only partially treated. Water now often rose to the surface. Drinking water, sourced from bores, was now often polluted due to high watertable levels.
Effects on human health: Polluted drinking water increased rates of diarrhoea. Surface water additionally exposed children to contamination, and created mosquito problems. Mosquito-borne dengue fever was now endemic in the area, and some of the children and old people became infected. Road access to the community was now so compromised that airlifting sick community members to hospital became common, although poor construction meant the airstrip was also often flooded and thus inaccessible. This expensive option was frequently used as community members were often sick due to dengue fever, diarrhoea/dehydration, cardiovascular complaints or infected sores that would not heal under the high humidity conditions.
Hypothetical example of the relationship between climate variability, infrastructure and health, modified from FaHCSIA (2010). Yash Srivastava and Andrew Crouch (Centre for Appropriate Technology) provided input.
Box 4: Scenario 3 – hotter temperatures, decreased rainfall
Geography: A small community in the Kimberley was established near a creek that now rarely contained water.
Infrastructure design: Each of the community’s six houses had a septic tank and leach drains because the community was not large enough to justify a common effluent wastewater system.
Climate change: Hotter temperatures, decreased rainfall.
Climate effects on infrastructure: In previous years, wastewater gardens were designed to use surplus wastewater but the gardens had died due to lack of water. Flooding into the house from the backfilling of drains was no longer an issue. However, less water in the effluent pipes meant that there were now more blockages in the system. Hotter temperatures and less rainfall created more dust, and meant that pumps failed even more regularly than they had previously.
Effects on human health: The community no longer had appropriate shade trees, and heat-related problems such as heat stroke increased. The access road to hospital was in good condition, but hotter temperatures meant that people’s car radiators often overheated, lengthening the time taken to receive medical treatment. Old people started staying in town to be closer to medical services, and old people could no longer pass on cultural knowledge to their grandchildren. This caused sadness in the older people, and a loss of meaning in younger people.
Hypothetical example of the relationship between climate variability, infrastructure and health, modified from FaHCSIA (2010). Yash Srivastava and Andrew Crouch (Centre for Appropriate Technology) provided input.
To bridge a gap in the literature, this section has provided qualitative examples of how climate variability currently interacts with infrastructure in remote Australia at the community and household level, and hypothesised how these may change in time. Sections 3.3–3.5 draw upon the existing literature to explore the exposure and sensitivity of remote Australia to climate change at the population/regional level. Three case studies areas are described in terms of their i) key biophysical and socio-economic characteristics, ii) likely exposure to climate change, and iii) likely sensitivity to climate change. These focal areas represent administrative boundaries, and subsequently do not reflect discrete and uniform social, environmental or economic units (Maru and Chewings 2008). For this reason, specific locations are named within focal areas wherever they are cited in the literature and each focal area is also given a cluster score, as defined by Jones et al. (n.d.), so that identified sensitivities to climate change may be applied to similar regions of remote Australia (Appendix 3).
CRC-REP Working Paper CW014
14 Impact of climate change on health and wellbeing in remote Australian communities: Ninti One Limited a review of literature and scoping of adaptation options
3.3 Cape York
3.3.1 Description
Cape York is a long peninsula located in Far North Queensland. The ABS (2013) classifies Cape York as very remote. In this report the term ‘Cape York’ also includes the more than 100 islands of the Torres Strait, a broad stretch of shallow water between the tip of Cape York and Papua New Guinea. The ABS’ Cape York Natural Resource Management area is used for sourcing statistics in this report, but it should be noted that this area excludes the Torres Strait Islands.
Cape York’s climate is tropical to sub-tropical, with hot temperatures and a summer wet season. The mean annual precipitation is between about 1300 and 1800 mm. Wet bulb globe temperate (WBGT) is commonly used to measure occupational heat stress (that is, temperature ‘comfort’) (Hyatt et al. 2010; Hanna et al. 2011). Cape York’s WGBT is high relative to other parts of Australia (Appendix 2).
The Cape York economy mirrors that of many other remote areas of northern Australia (see Appendix 3). It has relatively high levels of employment in primary industries and lower levels in secondary and tertiary industries. It extracts substantial wealth and creates some local employment via the mining industry. There is some employment in the primary industries of extensive pastoralism and fisheries. A large proportion of Cape York’s population is reliant upon the redistribution of the wealth created by the primary industries of other regions via welfare and employment in ‘public administration’ e.g. Community Development Employment Projects (CDEP – note this will be replaced in July 2013 by the Remote Jobs and Communities Program). However, as noted by Taylor (2003), the classification of CDEP under public administration masks a great diversity of work, including that of the customary economy. The future form of Cape York’s economy is unclear given the ongoing, entrenched contests over Cape York’s land, water and people (Taylor 2011).
The Cape York population is low and dispersed. Cape York has a higher Aboriginal and Torres Strait Islander population (48%) than other focal areas (see Appendix 3). However, Aboriginal and Torres Strait Islander communities on Cape York Peninsula tend to be relatively large and less dispersed than communities in other remote Australian areas such as the Kimberley (Green et al. 2012). The communities are largely situated along the west coast of the Peninsula, south from Weipa, at the tip of the Peninsula and in the Torres Strait, and in and around Cooktown.
The population is relatively mobile compared to the national population, but is less mobile than the other focal areas (see Appendix 3). The proportion of the population over the age of 65 is similar to the national average. However, the proportion of people under 15 years of age is similar to the other focal areas in being relatively high. The reliance on welfare is reflected by relatively low levels of income; of the three focal areas, Cape York has the highest proportion of the population earning between $150 and $249 per week.
3.3.2 Exposure
Direct changes in exposure
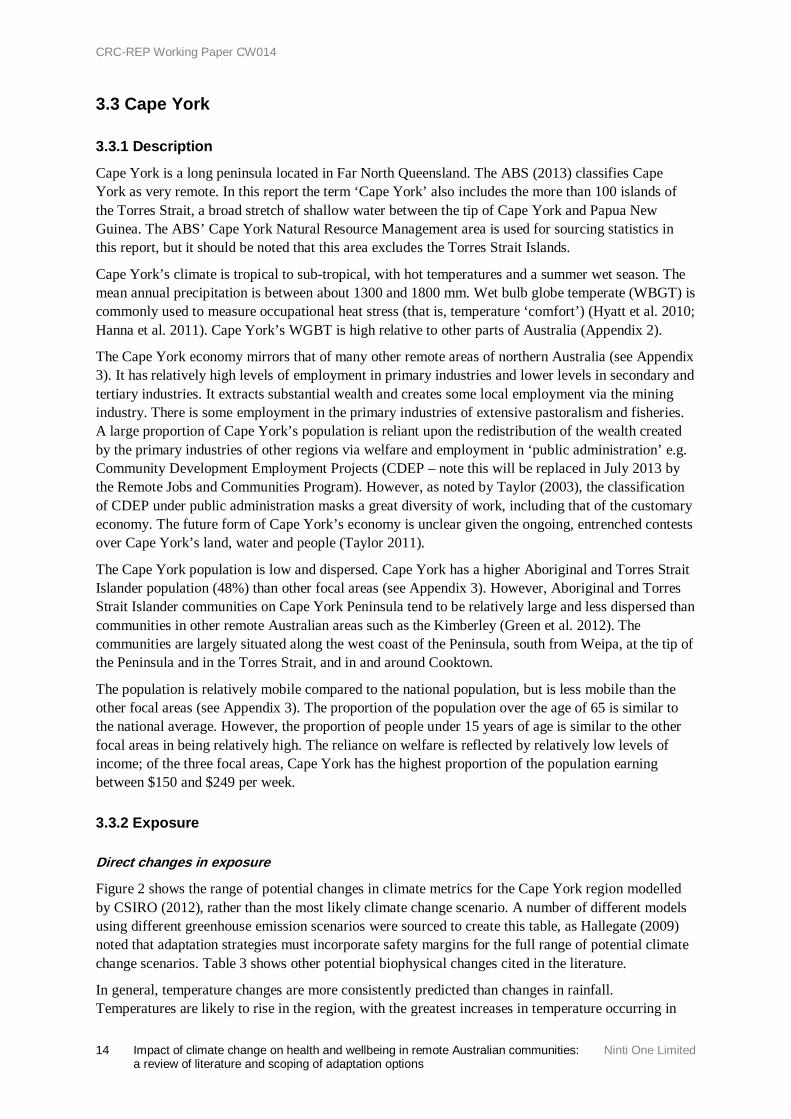
Figure 2 shows the range of potential changes in climate metrics for the Cape York region modelled by CSIRO (2012), rather than the most likely climate change scenario. A number of different models using different greenhouse emission scenarios were sourced to create this table, as Hallegate (2009) noted that adaptation strategies must incorporate safety margins for the full range of potential climate change scenarios. Table 3 shows other potential biophysical changes cited in the literature.
In general, temperature changes are more consistently predicted than changes in rainfall. Temperatures are likely to rise in the region, with the greatest increases in temperature occurring in

CRC-REP Working Paper CW014
Ninti One Limited Impact of climate change on health and wellbeing in remote Australian communities: 15 a review of literature and scoping of adaptation options
inland and southerly areas. Rainfall may significantly increase (by up to 8% of the long-term mean) or decrease (by 14–20% of the long-term mean). Humidity may increase or decrease, but not by large amounts.
Like climate change predictions globally, these predictions are highly uncertain. Green et al. (2010) noted that recorded meteorological variables for the Torres Strait region are either of short length or contain a large proportion of missing data, making it difficult to verify climate change models in the area, or understand the true nature of current extreme weather events. Despite the oceanic nature of the Torres Strait, potential impacts from changes to oceanographic currents are considered to be high but are not well resolved in global climate models (TSRA 2010). Tidal dynamics are very complicated; this can result in significant differences in tidal patterns over a few kilometres. These dynamics are also under-studied, and as such the impacts of sea level rise and inundation processes are largely unknown at the local level (TSRA 2010).
Likely impacts on liveability
McMichael et al. (2002) found that annual heat-related death rates in the over-65 age bracket were predicted to substantially increase in both Townsville and Cairns. Although total numbers were low, deaths were predicted to increase 100% and 400% in Cairns, and 33% and 500% in Townsville by 2020 and 2050, respectively.
Increased flooding is expected in both coastal and inland areas, and may affect both infrastructure and health. McMichael et al. (2002) estimated that flood risk in Cape York will increase by 3.17–3.85 times by 2020. Males under the age of 25 and over 59 have historically been the high risk group for flood-related deaths in Australia, due to risk-seeking behaviour and immobility issues respectively. Inundation is a particular threat to Torres Strait communities, with 7000 people living just two metres above sea level (Berry et al. 2010b). Some airstrips are currently threatened by beach erosion (Green 2006). Island infrastructure (roads, ports, power supplies and housing) are already threatened (TSRA 2010). Langton et al. (2012) anticipated higher levels of mobility, with the need for community relocation in the worst case scenario (TSRA 2010). Green (2006) expects that the psychological effect of relocation on people in the the Torres Strait may affect mental health as people worry over how they will maintain their cultural integrity. There may be additional inundation of sacred sites and cemeteries (TSRA 2010), which McNamara and Westoby (2011) already highlighted as affecting mental health. Green et al. (2010) noted other potential mental health impacts, including high levels of stress on medical practitioners who already manage health services with limited support, transportation issues and competing demands (such as the use of Torres Strait health services by Papua New Guinean nationals).
Health impacts are also expected via an increased transmission pathway. McMichael et al. (2002) noted that the ‘malaria receptive zone’ may expand southwards to include Rockhampton, Gladstone and Bundaberg. Green (2006) noted an expected increase in infected people entering the Torres Strait and Far North Queensland from Papua New Guinea, and that the infection of the local mosquito population is of concern. Currie (2001) noted that the introduction of Japanese encephalitis to the Torres Strait is of great concern and that there is a risk of it further spreading in Cape York, particularly in areas that have high concentrations of the feral pigs that act as a disease vector.
Transport networks to, and between, large regional centres and remote communities are likely to be affected by extreme weather (Green et al. 2012). The cost of national highway maintenance and rehabilitation costs as a result of climate variation, plus increases in population and transport demands, are projected to be over 50% for the whole of Queensland (Cechet 2005).
CRC-REP Working Paper CW014
Ninti One Limited Impact of climate change on health and wellbeing in remote Australian communities: a review of literature and scoping of adaptation options 16
Notes:
Ranges are shown in line with Hallegate’s (2009) argument that the range of what is possible under climate change is particularly relevant to designing adaptation measures. Figures show expected changes from 1990 levels. Maximums and minimums represent the full range of changes from any one combination of emission or model-type data used by CSIRO (2012).
Wet season = November–April, dry season = May–October
(a) Wet season precipitation is very spatially variable
(a) Dry season precipitation is highly spatially variable between models. Also, this conflicts with the figures cited by Green et al. (2010), who stated that the average dry season precipitation would decrease by 1–6% by 2030, and that the average wet season precipitation would increase by 0–4% by 2030
(b) Dry season temperature is particularly hot in inland and more southerly areas
(b) Dry season humidity will decline more in southern areas
(c) Relative humidity 3 pm
Figure 2: Range of predicted climate changes for Cape York
(a) (b)
(c)

CRC-REP Working Paper CW014
Ninti One Limited Impact of climate change on health and wellbeing in remote Australian communities: a review of literature and scoping of adaptation options 17
Table 3: Other impacts from climate change predicted for Cape York Sector Specific Predicted impact Reference Other primary climate changes
Wet bulb globe temperature
An increase in the WBGT Most of the peninsula will increase from a moderate to high risk of heat strain with a 3°C temperature increase
Hyatt et al. (2010)
Drought It is unlikely that north Queensland will have a one in ten year drought even by 2030, 2050 or 2070
Kirono et al. (2011)
Ocean temperature Increase in the Torres Strait TSRA (2010) Wind 50–70% chance of wind speed increasing in summer by 2070 CSIRO and BOM (2007) in Green et al. (2010) 60–90% chance of wind speed increasing in winter by 2070 CSIRO and BOM (2007) in Green et al. (2010) Mean days/year
above 35°C An increase from 3.8 to 5–9 by 2030, and 19–96 by 2070A. Hanna et al. (2011)
Secondary biophysical changes
Water supply Increased unreliability of supply on Torres Strait islands such as Erub Green et al. (2010); McNamara et al. (2012)
Sea level An increase in sea level between 0.18 m and 0.84 m by 2100 relative to 1990 levels in the Torres Strait
TSRA (2010)
An increase in sea level between 0 m and 1 m along the Great Barrier Reef. Bohensky et al. (2011) Cyclones More intense in the Torres StraitB
Increased frequency to the south of the area McMichael et al. (2002); TSRA (2010); Handmer et al. (2012)
Ocean acidification Increase in the Torres Strait TSRA (2010) Coastlines Increased frequency and extent of coastal erosion events in the Torres Strait
Loss of land, accretion or creation of land, and potentially increased shoreline fluctuation
TSRA (2010)
Flooding Increased frequency and extent of inundation of lower lying areasC McMichael et al. (2002); TSRA (2010) A This figure is for Cairns, which is close to, but just outside of, Cape York. B Green et al. (2010) noted that there is not enough empirical evidence to support claims of climate change and changing cyclone frequency/severity. C Green et al. (2010) noted that there is not enough empirical evidence to support claims of climate change and changing sea-related flooding frequency/severity for the Torres Strait.
Note, some references may be cross-references
CRC-REP Working Paper CW014
18 Impact of climate change on health and wellbeing in remote Australian communities: Ninti One Limited a review of literature and scoping of adaptation options
Livelihood impacts are anticipated, such as increases or decreases in income from the Torres Strait Rock Lobster, depending upon which global climate model is used (Plaganyi et al. 2011). Scenario analysis (Bohensky et al. 2011) suggests that unmitigated greenhouse gas emissions may lead to the collapse of international reef tourism and a decline in biodiversity values for both Aboriginal and Torres Strait Islander and non-Aboriginal or Torres Strait Islander communities.
3.3.3 Sensitivity
Table 2 summarises the factors identified in the international literature as increasing vulnerability to climate change. The relative proportion of the Cape York population with this vulnerability factor, as identified using data from the ABS, is highlighted in Table 8. The level of sensitivity to climate change of the Cape York population, as noted in the literature, is now discussed.3
The Jones et al. (n.d.) socio-economic regionalisation suggests that all areas of Cape York are sensitive to climate change when compared to the rest of the country. Western areas of Cape York where large Aboriginal and Torres Strait Islander settlements are located, including Aurukun, Pormpuraaw and Croydon, are likely to be particularly sensitive. Green et al. (2009b) estimated that under a business-as-usual scenario there would be between 4000 and 7000 vulnerable (defined as being aged less than 10 or more than 65) Aboriginal and Torres Strait Islander people in Cape York by 2030.
Green (2006) suggests that the pre-existing social and economic disadvantage of Torres Strait Islanders means that resilience to climate change in the Torres Strait is low. TSRA (2010) concurred, stating that ‘the potential impacts of climate change along with the geographic, social, cultural and spiritual factors of the region combine to make Torres Strait communities among the most vulnerable in Australia to climate change.’ This view is also endorsed by Green et al. (2010).
In general, the health status of the Cape York population is poor, but different subpopulations within Cape York appear to have different health sensitivity profiles. For example, the prevalence of psychotic disorders, incarceration, intellectual disability, medication rates and drug and alcohol use are higher for Cape York Aboriginal people than for Torres Strait Islanders (Hunter et al. 2012).
Although the Torres Strait appears to be particularly sensitive to extreme weather events and climate change, higher temperatures are likely to have less of an impact on health in tropical areas like Cape York because people probably have more adaptation strategies to hot temperatures throughout the year than in other parts of the country (Green et al. 2009b). However, it is unclear whether these strategies will be enough to offset other forms of sensitivity.
Coastal areas south of Weipa (in which many large Aboriginal communities are located) currently share the dual disadvantage of being more than 250 kilometres from the nearest hospital, and having cut-off road access for more than 90 days a year (Green et al. 2009b). Being cut-off from a diesel supply during climatic extremes may further compromise health if not managed adequately.
3 In the focal sections of this paper, the sensitivity and exposure of focal areas are only discussed where relevant literature is available. A sparse discussion reflects a lack of literature at the focal level.
CRC-REP Working Paper CW014
Ninti One Limited Impact of climate change on health and wellbeing in remote Australian communities: 19 a review of literature and scoping of adaptation options
3.4 Central Australia
3.4.1 Description
Central Australia is located in the southern Northern Territory. Areas in and immediately around Alice Springs are classified as remote by the ABS (2013), with areas further from Alice Springs being classed as very remote. The ABS’ postal areas of 0872 and 0870 were used for statistical purposes in this report.
Central Australia is arid, with a low and highly variable annual rainfall of less than 300 mm (Appendix 2). Precipitation tends to be summer-dominated. Summers are hot but, in contrast to the other more coastal and northerly focal areas, winters are cold. Central Australia’s WGBT is lower (more comfortable) than either the Kimberley or Cape York, primarily due to lower humidity levels (Appendix 2).
Unlike the Kimberley, with its multiple service towns, Central Australia is serviced only by the large town of Alice Springs. Alice Springs services surrounding communities, outstations, pastoral and mining leases, and significant tourist destinations such as Uluru. It also acts as a service hub for northern areas of South Australia, and eastern areas of Western Australia.
While a relatively large proportion of people are employed by ‘public administration’ (e.g. the soon-to-be replaced CDEP), the Central Australian economy is more diversified than the other focal areas (Appendix 3). In contrast to both the national average and that in other case study areas, Central Australia has a relatively low proportion of people working in the agricultural sector. Central Australia also has a smaller proportion of people working in the mining industry compared to the other two focal areas, but has slightly more working in the arts, food and accommodation industries. This reflects the importance of the tourism industry in centres like Alice Springs and Uluru.
The Central Australian population is more mobile than the Cape York population, perhaps reflecting the greater number of ‘life stage escalators’ (Taylor et al. 2006) employed by the relatively dominant health and education sectors (see Table 12), and the different cultural-geographic landscape. The relatively high proportion of people working in the professional sector probably reflects the role that Alice Springs plays in servicing much of arid Australia.
Central Australia has a large proportion of Aboriginal people when compared to the national average (Appendix 3) but this proportion is lower than that of Cape York. The population has few people aged over 65 and a large proportion of children. A relatively small proportion of the population have obtained a Year 12 level of education.
3.4.2 Exposure
Direct changes in exposure
Figure 4 shows the range of potential changes in climate metrics for the Central Australia region. As in Cape York, temperature changes are more predictable than changes in rainfall. Temperatures are likely to rise across the region. Of the three focal areas, Central Australia is predicted to be most significantly affected by changes in mean annual rainfall. Rainfall may significantly increase (e.g. by up to 36% of the long-term mean in Alice Springs) or decrease (by 88% of the long-term mean).

CRC-REP Working Paper CW014
20 Impact of climate change on health and wellbeing in remote Australian communities: Ninti One Limited a review of literature and scoping of adaptation options
Figure 3: Todd River in flood The Todd River in Central Australia already has an unpredictable flow, and further uncertainty is created by climate change as annual precipitation is predicted to either increase or decrease, depending upon the model and greenhouse gas scenario that is used. Photo credit: Jane Addison.
Likely impacts on liveability
McMichael et al. (2002) predicted that modelled temperature increases in Central Australia will translate to an increase of diarrhoeal admissions to hospital for Aboriginal children in the order of 3–5% by 2020, and 5–18% by 2050. This estimate was considered conservative due to the relatively high fertility levels of Aboriginal people, and outward migration by non-Aboriginal people in Central Australia. Currie (2001) suggests that the diagnosis of melioidosis in two people from Central Australia was outside the ‘normal’ endemic area of the Top End, and may be related to a changing climate.
Central Australia is currently ‘cooling dominated’ (Wang et al. 2010). That is, on the whole, people currently require cooling rather than heating infrastructure. With the increase in WGBT (Hyatt et al. 2010), it is expected that there will be a significant increase in the cooling energy requirement in Alice Springs, but a small reduction in the heating energy requirement. Effectively, the costs of keeping buildings at a comfortable temperature are likely to rise.
Most of Central Australia’s water is supplied by groundwater (Bailie et al. 2002), and extraction from the groundwater is currently considered to be unsustainable in arid Australia (Habermehl 2007). Changes in precipitation events should not additionally affect the abundance of accessible potable water in the short term, but may change in the longer term with changes in precipitation patterns and other factors affecting surface hydrology.
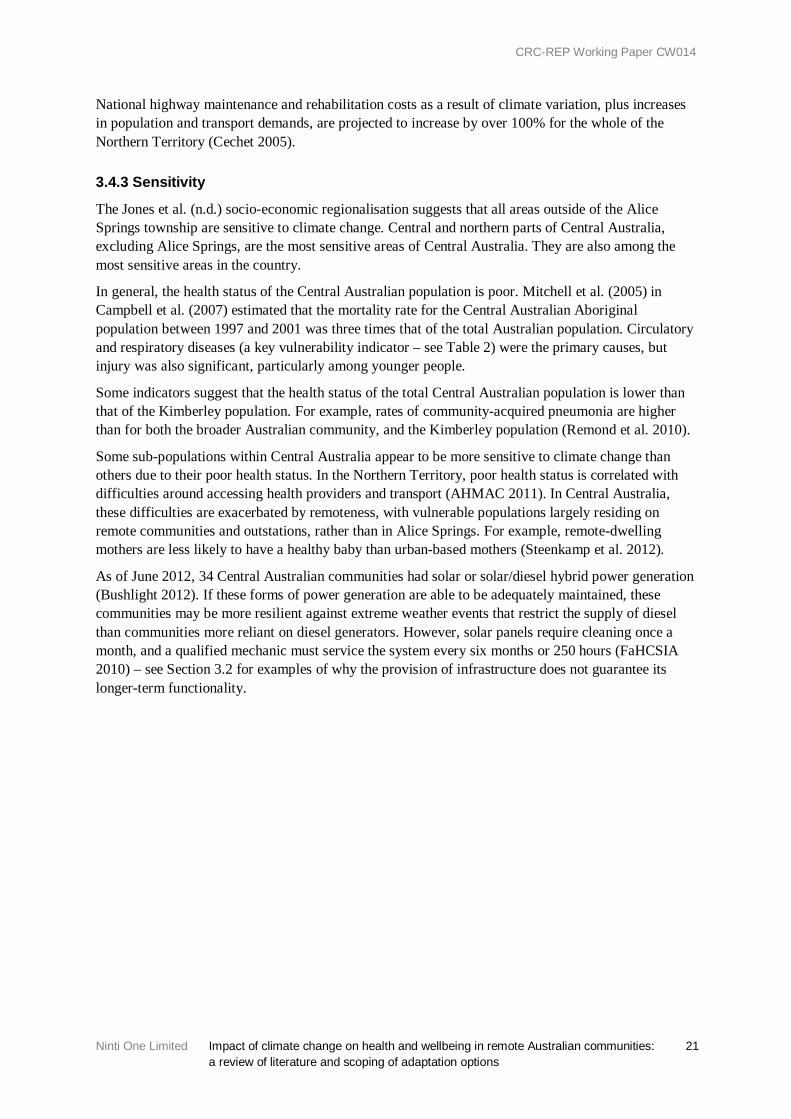
CRC-REP Working Paper CW014
Ninti One Limited Impact of climate change on health and wellbeing in remote Australian communities: 21 a review of literature and scoping of adaptation options
National highway maintenance and rehabilitation costs as a result of climate variation, plus increases in population and transport demands, are projected to increase by over 100% for the whole of the Northern Territory (Cechet 2005).
3.4.3 Sensitivity
The Jones et al. (n.d.) socio-economic regionalisation suggests that all areas outside of the Alice Springs township are sensitive to climate change. Central and northern parts of Central Australia, excluding Alice Springs, are the most sensitive areas of Central Australia. They are also among the most sensitive areas in the country.
In general, the health status of the Central Australian population is poor. Mitchell et al. (2005) in Campbell et al. (2007) estimated that the mortality rate for the Central Australian Aboriginal population between 1997 and 2001 was three times that of the total Australian population. Circulatory and respiratory diseases (a key vulnerability indicator – see Table 2) were the primary causes, but injury was also significant, particularly among younger people.
Some indicators suggest that the health status of the total Central Australian population is lower than that of the Kimberley population. For example, rates of community-acquired pneumonia are higher than for both the broader Australian community, and the Kimberley population (Remond et al. 2010).
Some sub-populations within Central Australia appear to be more sensitive to climate change than others due to their poor health status. In the Northern Territory, poor health status is correlated with difficulties around accessing health providers and transport (AHMAC 2011). In Central Australia, these difficulties are exacerbated by remoteness, with vulnerable populations largely residing on remote communities and outstations, rather than in Alice Springs. For example, remote-dwelling mothers are less likely to have a healthy baby than urban-based mothers (Steenkamp et al. 2012).
As of June 2012, 34 Central Australian communities had solar or solar/diesel hybrid power generation (Bushlight 2012). If these forms of power generation are able to be adequately maintained, these communities may be more resilient against extreme weather events that restrict the supply of diesel than communities more reliant on diesel generators. However, solar panels require cleaning once a month, and a qualified mechanic must service the system every six months or 250 hours (FaHCSIA 2010) – see Section 3.2 for examples of why the provision of infrastructure does not guarantee its longer-term functionality.
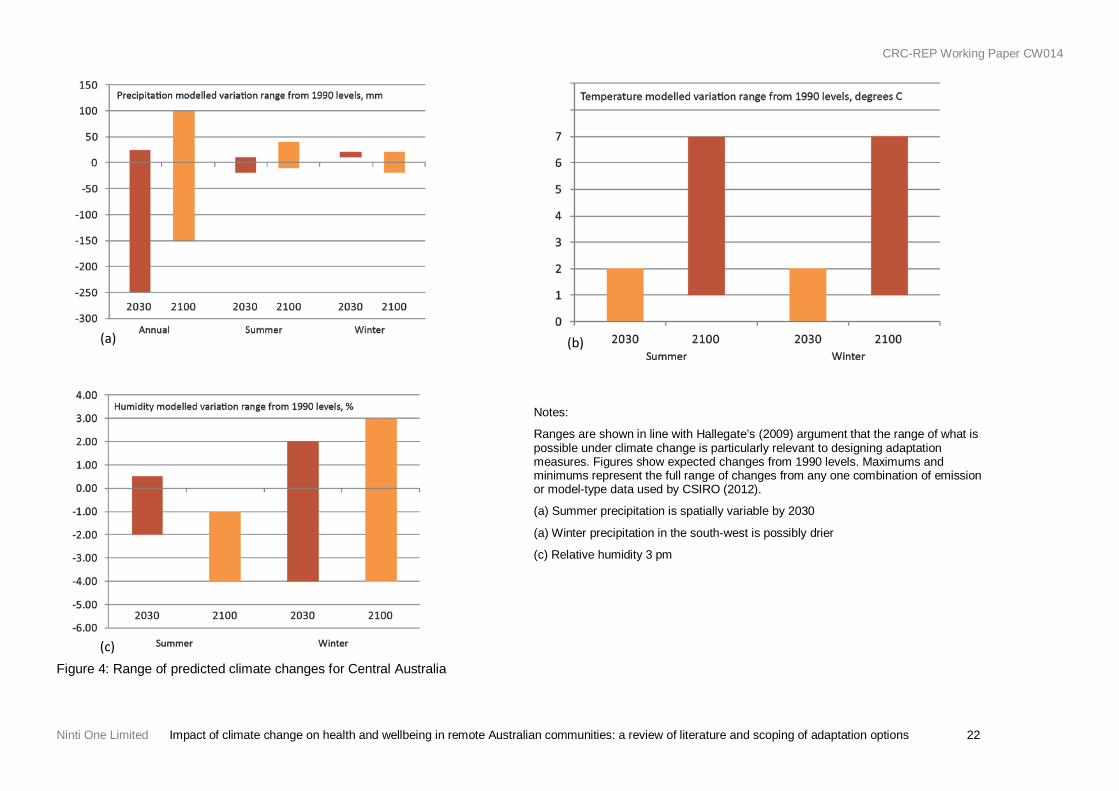
CRC-REP Working Paper CW014
Ninti One Limited Impact of climate change on health and wellbeing in remote Australian communities: a review of literature and scoping of adaptation options 22
Notes:
Ranges are shown in line with Hallegate’s (2009) argument that the range of what is possible under climate change is particularly relevant to designing adaptation measures. Figures show expected changes from 1990 levels. Maximums and minimums represent the full range of changes from any one combination of emission or model-type data used by CSIRO (2012).
(a) Summer precipitation is spatially variable by 2030
(a) Winter precipitation in the south-west is possibly drier
(c) Relative humidity 3 pm
Figure 4: Range of predicted climate changes for Central Australia
(a) (b)
(c)
CRC-REP Working Paper CW014
Ninti One Limited Impact of climate change on health and wellbeing in remote Australian communities: a review of literature and scoping of adaptation options 23
Table 4: Other impacts from climate change predicted for Central Australia, as cited in the soft and hard literature Sector Specific Predicted impact Reference Other primary climate changes
Wet bulb globe temperature Increase. The risk of heat strain will increase from a mixture of moderate to high, to being high in most areas, with a 3°C temperature increase
Hyatt et al. (2010)
Average number of days per year above 35°C
An increase from 90 to 102–118 by 2030, and 132–182 by 2070 Hanna et al. (2011)
Other secondary changes
Fire An increase in burning opportunities with an increase in rainfall variability/unpredictability, stronger rainfall events with a longer dry period between them
Hughes (2003)
Note, some of these may be cross-references.
CRC-REP Working Paper CW014
Ninti One Limited Impact of climate change on health and wellbeing in remote Australian communities: a review of literature and scoping of adaptation options
3.5 Kimberley
3.5.1 Description
The Kimberley is located in northern Western Australia, and is classified as very remote by the ABS (2013). The ABS’ Kimberley statistical division is used to define the Kimberley region in this report.
The Kimberley’s climate is semi-arid to dry tropical, with a summer wet season lasting between two and four months (Beard 1979). Average annual precipitation at the Derby airport is 686.9 mm, with the majority falling between December and March. The average maximum temperature ranges between 30.4°C in June to 38°C in November (BoM 2012g). Precipitation is higher to the north and in coastal areas, with south-easterly parts of the Kimberley having the lower annual precipitation and cooler dry season temperatures of arid areas. Coastal areas experience cyclonic activity in the late wet season. The Kimberley’s WGBT is high compared to other parts of Australia and is comparable to, although slightly lower than, Cape York’s (Appendix 2). More climate metrics for contrasting locations within the Kimberley can be found in Appendix 2.
The Kimberley includes the major towns of Derby, Fitzroy Crossing, Halls Creek, Kununurra, Wyndham and Broome. These towns have between 2000 and 10,000 permanent residents, and act as major service centres to the region’s pastoralists, mining enterprises and the more than 200 Aboriginal communities and outstations (Mak et al. 2004). These communities and outstations range in size from a few families to over 500 people (Mak et al. 2004), with the bulk of the population living in larger communities of more than 100 people (Taylor 2003). As Taylor (2003) notes, this spatial fragmentation creates barriers to engagement in the mainstream economy, but creates opportunities for engagement in the customary economic sector.
When compared to both the national average and other focal areas, the Kimberley employs a higher proportion of people in the agricultural and mining industries (Appendix 3). It has a high proportion employed in public administration (including in CDEP projects), but this proportion is relatively less than the other two focal areas. This is reflected by the relatively lower proportion of people earning only $150–$249 per week.
The population is highly mobile, with both the Kimberley and Central Australia being far more mobile than Cape York. In the Kimberley there is also a large non-resident population that peaks during the dry season (Taylor 2003). While the Kimberley population has the lowest proportion of residents aged over 65 of all three focal areas (Appendix 3), Roach et al. (2007) estimates that around 41,000 people over the age of 65 visit the area each year. This significantly contributes to the demand for goods and services, including health services. Of the three focal areas, the Kimberley has the largest proportion of people aged under 15, and relatively low education levels (Appendix 3).
3.5.2 Exposure
Direct changes in exposure
Table 7 shows the range of potential changes in climate metrics for the Kimberley region. In general, anticipated temperature changes are more consistent than changes in rainfall. Temperatures are likely to rise across the region, with the greatest increases occurring in inland regions. Rainfall may increase (e.g. by up to 4% of the long-term mean in Derby) or significantly decrease (by 36% of the long-term mean in Derby). However, rainfall patterns are difficult to plan for, given that rainfall is expected to show a greater departure from 1990 levels by 2030 than it does by 2100.

CRC-REP Working Paper CW014
Ninti One Limited Impact of climate change on health and wellbeing in remote Australian communities: a review of literature and scoping of adaptation options 25
Notes:
Ranges are shown in line with Hallegate’s (2009) argument that the range of what is possible under climate change is particularly relevant to designing adaptation measures. Figures show expected changes from 1990 levels. Maximums and minimums represent the full range of changes from any one combination of emission or model-type data used by CSIRO (2012).
Wet season = November–April, dry season = May–October
(a) Wet season precipitation is generally wetter to the north and east by 2030; by 2100 the West Kimberley is particularly wet
(a) Dry season precipitation in the far north is slightly drier than other areas by 2030 south-west is possibly drier
(b) Wet season temperature is hotter away from the coast than other areas by 2100
(c) Dry season humidity is generally drier inland
(c) Relative humidity 3 pm
Figure 5: Range of predicted climate changes for the Kimberley
(a) (b)
(c)
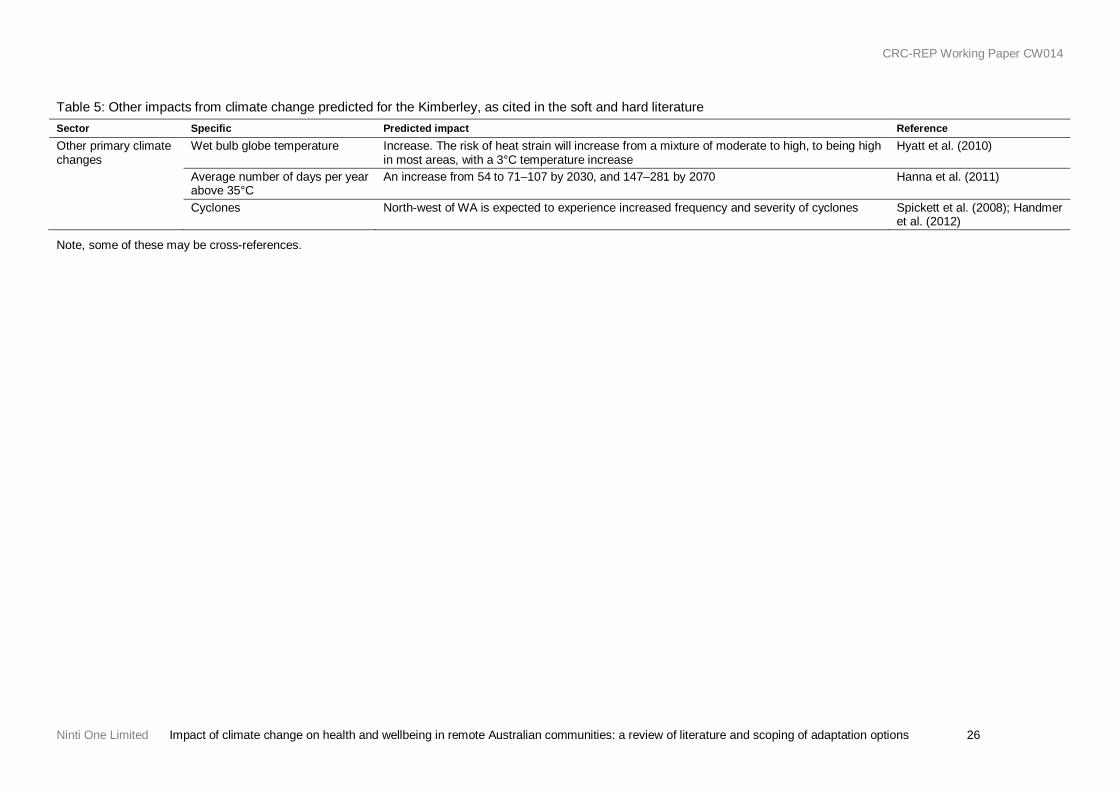
CRC-REP Working Paper CW014
Ninti One Limited Impact of climate change on health and wellbeing in remote Australian communities: a review of literature and scoping of adaptation options 26
Table 5: Other impacts from climate change predicted for the Kimberley, as cited in the soft and hard literature Sector Specific Predicted impact Reference Other primary climate changes
Wet bulb globe temperature Increase. The risk of heat strain will increase from a mixture of moderate to high, to being high in most areas, with a 3°C temperature increase
Hyatt et al. (2010)
Average number of days per year above 35°C
An increase from 54 to 71–107 by 2030, and 147–281 by 2070 Hanna et al. (2011)
Cyclones North-west of WA is expected to experience increased frequency and severity of cyclones Spickett et al. (2008); Handmer et al. (2012)
Note, some of these may be cross-references.
CRC-REP Working Paper CW014
Ninti One Limited Impact of climate change on health and wellbeing in remote Australian communities: 27 a review of literature and scoping of adaptation options
Likely impacts on liveability
There are very few data in the literature on the likely impacts of climate change on the social-ecological system in the Kimberley.
3.5.3 Sensitivity
The Jones et al. (n.d.) socio-economic regionalisation suggests that the Shires of Derby-West Kimberley and Halls Creek are among the most sensitive areas in the country. The Shires of Broome and Wyndham-East Kimberley are less sensitive, probably due to the statistical inclusion of the large and relatively wealthy townships of Broome and Kununurra.
Green et al. (2009b) estimated that under a business-as-usual model with climate change, by 2030 the west Kimberley would have 5000–7000 vulnerable (aged less than 10 or more than 64) Aboriginal people, the north Kimberley would have 100–500, and the east and central Kimberley would have 600–2000.
In general, the health status of the Kimberley population is poor. There is high infant mortality; poor maternal nutritional status; low birth weights; high levels of infectious disease in infants; diabetes, cardiovascular and respiratory disease; poor dental health; incontinence; dementia and chronic pain (e.g. Kimberley Aboriginal Health Plan Steering Committee 1999; Rousham and Gracey 2002; Taylor 2003; Kruger et al. 2008; Hunter 2010; LoGuidice et al. 2010). Incidence rates of notifiable sexually transmitted infections in the Kimberley are among the highest in Australia (Mak et al. 2004; Taylor 2003). Some infections that are uncommon in the greater Australian community, but are endemic in the Kimberley, include trachoma, leprosy and types of community-acquired pneumonia (Hunter 2010; Remond et al. 2010). Levels of mental stress are high (Hunter 2010). Community infrastructure such as poor housing, waste disposal, water and power, and a lack of recreation facilities are considered to be major constraints to the health of all people on remote communities in the Kimberley (Kimberley Aboriginal Health Plan Steering Committee 1999).
There appears to be some differentiation in the vulnerability to climate change in the Kimberley population as health status is a function of remoteness. The east Kimberley region has the worst health status in Western Australia (Taylor 2003). Oral health is poorer in rural and remote parts of Australia, including west Kimberley communities (Kruger et al. 2008). Low birth weight and length is associated with remoteness across the whole region (Rousham and Gracey 2002). Low incomes make it difficult for people to realise a healthy life anywhere, but there is a particularly high additional ‘remote’ cost of up to 80% for food and essential items in east Kimberley communities (Kimberley Aboriginal Health Plan Steering Committee 1999; Taylor 2003).
Access to transport is currently a major problem for remote communities. Maternity services are not available for a distance of nearly 1000 kilometres between Derby and Kununurra (Kimberley Aboriginal Health Plan Steering Committee 1999). This directly affects the uptake of primary health care; a third of west Kimberley respondents stated that they could not remember their last dental visit for reasons including ‘too far to travel’, ‘too expensive’ and ‘dentist not available’ (Kruger et al. 2008). It is already difficult to recruit health professionals to hot regions. Under hotter temperatures, this situation is expected to worsen, with commensurate impacts on health outcomes (Green et al. 2009b).
With climate change, the effects of remoteness from health care are likely to be exacerbated. For example, Green et al. (2009b) noted that although communities in the southern Kimberley will be exposed to the greatest number of days over 40°C across northern Australia, only a negligible number of these communities have good access to the hospitals and medical centres needed to manage climate-related health impacts such as heat exhaustion. Central and north Kimberley are also
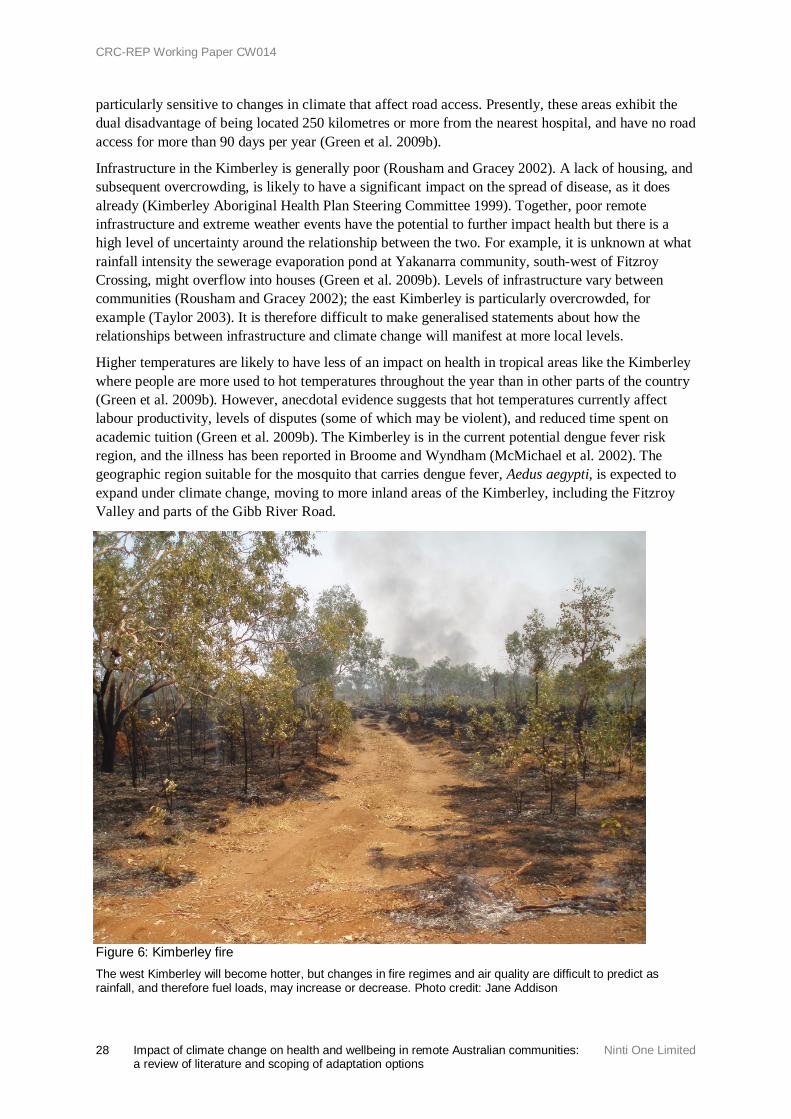
CRC-REP Working Paper CW014
28 Impact of climate change on health and wellbeing in remote Australian communities: Ninti One Limited a review of literature and scoping of adaptation options
particularly sensitive to changes in climate that affect road access. Presently, these areas exhibit the dual disadvantage of being located 250 kilometres or more from the nearest hospital, and have no road access for more than 90 days per year (Green et al. 2009b).
Infrastructure in the Kimberley is generally poor (Rousham and Gracey 2002). A lack of housing, and subsequent overcrowding, is likely to have a significant impact on the spread of disease, as it does already (Kimberley Aboriginal Health Plan Steering Committee 1999). Together, poor remote infrastructure and extreme weather events have the potential to further impact health but there is a high level of uncertainty around the relationship between the two. For example, it is unknown at what rainfall intensity the sewerage evaporation pond at Yakanarra community, south-west of Fitzroy Crossing, might overflow into houses (Green et al. 2009b). Levels of infrastructure vary between communities (Rousham and Gracey 2002); the east Kimberley is particularly overcrowded, for example (Taylor 2003). It is therefore difficult to make generalised statements about how the relationships between infrastructure and climate change will manifest at more local levels.
Higher temperatures are likely to have less of an impact on health in tropical areas like the Kimberley where people are more used to hot temperatures throughout the year than in other parts of the country (Green et al. 2009b). However, anecdotal evidence suggests that hot temperatures currently affect labour productivity, levels of disputes (some of which may be violent), and reduced time spent on academic tuition (Green et al. 2009b). The Kimberley is in the current potential dengue fever risk region, and the illness has been reported in Broome and Wyndham (McMichael et al. 2002). The geographic region suitable for the mosquito that carries dengue fever, Aedus aegypti, is expected to expand under climate change, moving to more inland areas of the Kimberley, including the Fitzroy Valley and parts of the Gibb River Road.
Figure 6: Kimberley fire The west Kimberley will become hotter, but changes in fire regimes and air quality are difficult to predict as rainfall, and therefore fuel loads, may increase or decrease. Photo credit: Jane Addison
CRC-REP Working Paper CW014
Ninti One Limited Impact of climate change on health and wellbeing in remote Australian communities: 29 a review of literature and scoping of adaptation options
4. Synthesis
4.1 Vulnerability
Groups perceived to be highly vulnerable to climate change, as is common in remote Australia, may be the focus of unwanted attention (Barnett et al. 2011). This is particularly the case where this framing perpetuates colonial stereotypes (Veland et al. 2013). For example, Cameron (2012) noted that vulnerability and adaptation assessments among Inuit in the Arctic risked perpetuating colonial perceptions of ‘local’ and ‘traditional’. Green et al. (2012) noted that some academics were concerned that a vulnerability assessment of Aboriginal and Torres Strait Islander people would reproduce a map of socio-economic disadvantage, despite the ability of some Aboriginal and Torres Strait Islander communities to, at times, better respond to climatic extremes than non-Aboriginal and Torres Strait Islander communities. Petheram et al. (2010) reported that East Arnhem people were concerned that climate change policy would trump efforts to improve rights by focusing on reductionist, externally conceived interventions. Vulnerability assessments must therefore avoid the top-down approach critiqued by Green et al. (2012) for being reductionist, and for ignoring both the complex dynamics of socio-economic systems and the knowledge and concerns of affected populations (Veland et al. 2013).
Evidence-based assessments of vulnerability using participatory methods4 that are inclusive of local communities are essential, but a full participatory assessment of the vulnerability of focal areas to climate change is beyond the scope of this report. Assessing vulnerability based on empirical indicators – such as poverty/standard of living, trade balance and number of telephones per 1000 population – has its limits but is increasingly common (Vincent 2007). Table 6 therefore uses empirical data sources to estimate the relative vulnerability profile of the three focal areas to climate change by cross-matching the known vulnerability indicators from the international literature (Table 2) with the profile of the focal areas. Note, Table 6 needs to be used carefully to guide a more localised discussion, rather than guiding less localised prescriptions.
4.2 Resilience
Table 6 indicates the populations or focal areas that are vulnerable to climate change. However, these populations and areas may have high levels of inherent, but difficult-to-measure, resilience to climate change. The term resilience is used across multiple academic disciplines, and as such has a variety of definitions (Walker et al. 2004). Here, it is defined as the capacity of a system to absorb disturbance, and reorganise while undergoing change so as to retain essentially the same function, structure, identity and feedbacks (Walker et al. 2004). Sub-populations with low sensitivity to climate change are also likely to have levels of resilience. For example, the ‘life stage escalators’ who use remote Australia to advance their careers (Taylor et al. 2006) are likely to either use their significant financial capital to avoid extreme climatic events (e.g. the use of air-conditioners), or their social capital to migrate. However, more sensitive populations may have lower resilience, as now discussed.
Both the Kimberley and Cape York have a disproportionate number of people employed in the primary industries. These industries may be more vulnerable to climate change due to their reliance on a resource that is highly responsive to climatic variability, and/or the high level of thermal stress that their work entails. Mine workers, particularly those who work fly-in/fly-out shifts, are vulnerable to temperature (see Table 2). However, there is evidence that mine workers show high resilience to extreme temperatures. This is largely due to voluntary behavioural adjustments, such as drinking water (Carter and Muller 2007), that are not constrained by external factors.
4 Note, participatory methods also risk causing distress to participants e.g. Veland et al. (2013).
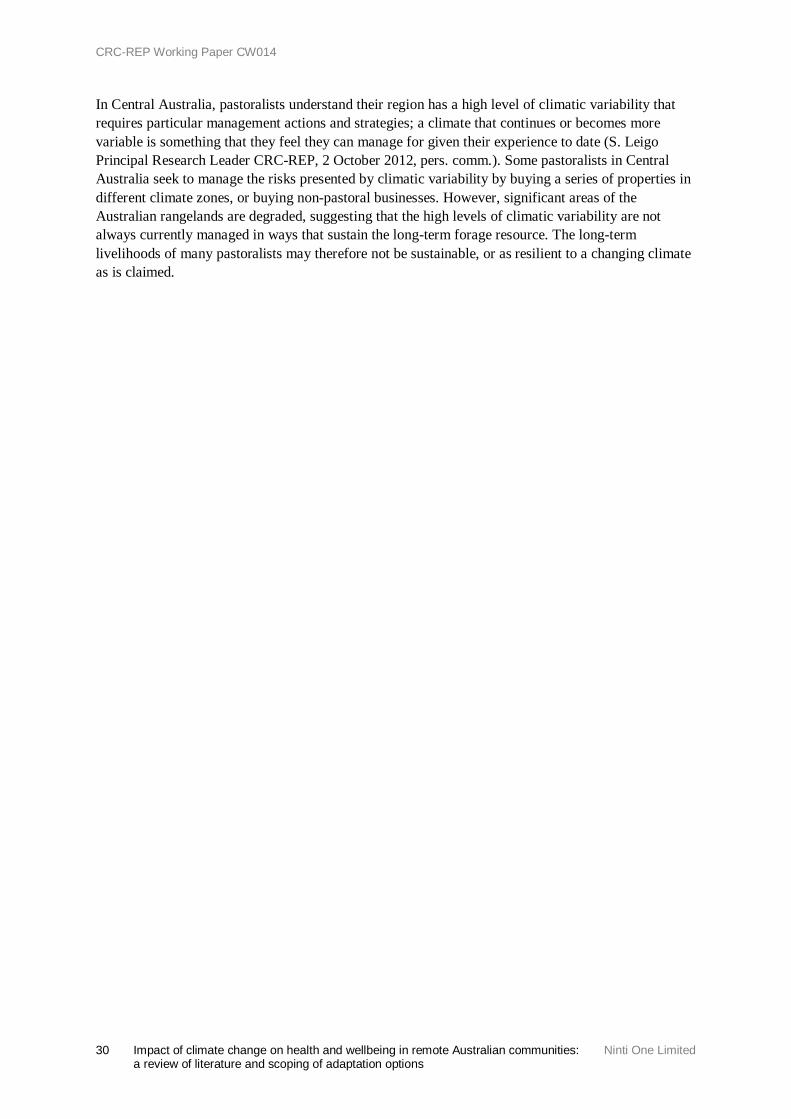
CRC-REP Working Paper CW014
30 Impact of climate change on health and wellbeing in remote Australian communities: Ninti One Limited a review of literature and scoping of adaptation options
In Central Australia, pastoralists understand their region has a high level of climatic variability that requires particular management actions and strategies; a climate that continues or becomes more variable is something that they feel they can manage for given their experience to date (S. Leigo Principal Research Leader CRC-REP, 2 October 2012, pers. comm.). Some pastoralists in Central Australia seek to manage the risks presented by climatic variability by buying a series of properties in different climate zones, or buying non-pastoral businesses. However, significant areas of the Australian rangelands are degraded, suggesting that the high levels of climatic variability are not always currently managed in ways that sustain the long-term forage resource. The long-term livelihoods of many pastoralists may therefore not be sustainable, or as resilient to a changing climate as is claimed.
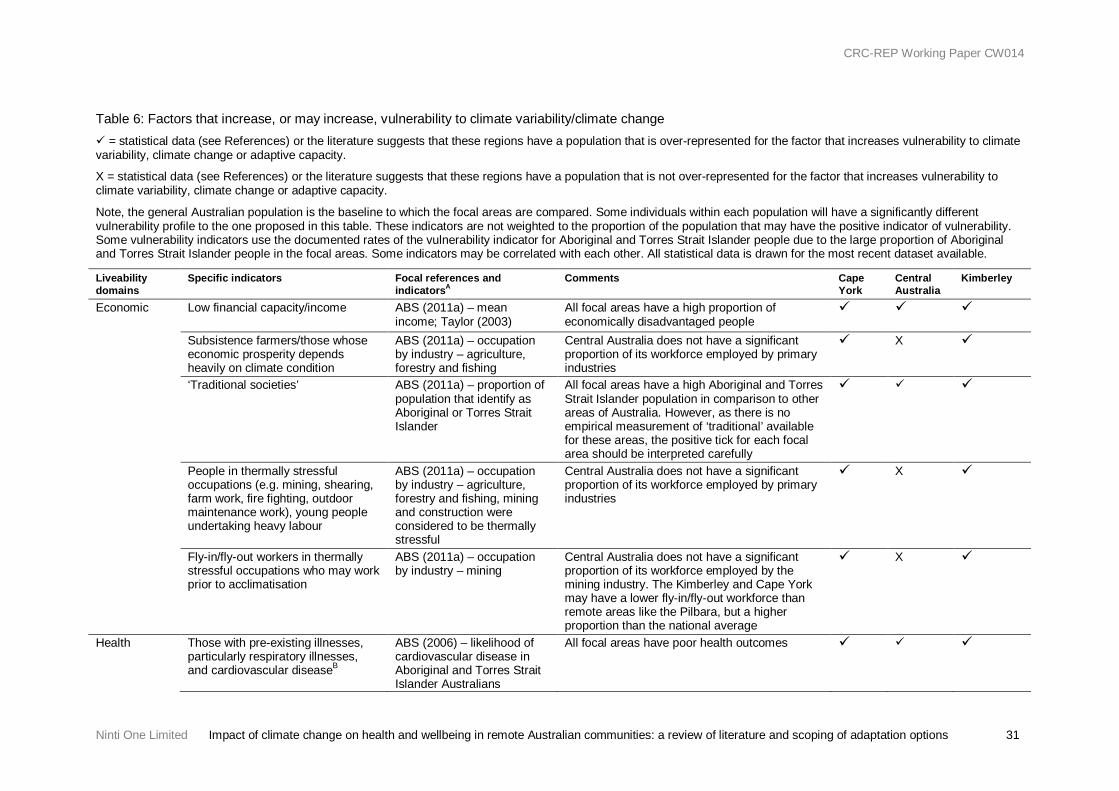
CRC-REP Working Paper CW014
Ninti One Limited Impact of climate change on health and wellbeing in remote Australian communities: a review of literature and scoping of adaptation options 31
Table 6: Factors that increase, or may increase, vulnerability to climate variability/climate change = statistical data (see References) or the literature suggests that these regions have a population that is over-represented for the factor that increases vulnerability to climate variability, climate change or adaptive capacity.
X = statistical data (see References) or the literature suggests that these regions have a population that is not over-represented for the factor that increases vulnerability to climate variability, climate change or adaptive capacity.
Note, the general Australian population is the baseline to which the focal areas are compared. Some individuals within each population will have a significantly different vulnerability profile to the one proposed in this table. These indicators are not weighted to the proportion of the population that may have the positive indicator of vulnerability. Some vulnerability indicators use the documented rates of the vulnerability indicator for Aboriginal and Torres Strait Islander people due to the large proportion of Aboriginal and Torres Strait Islander people in the focal areas. Some indicators may be correlated with each other. All statistical data is drawn for the most recent dataset available.
Liveability domains
Specific indicators Focal references and indicatorsA
Comments Cape York
Central Australia
Kimberley
Economic Low financial capacity/income ABS (2011a) – mean income; Taylor (2003)
All focal areas have a high proportion of economically disadvantaged people
Subsistence farmers/those whose economic prosperity depends heavily on climate condition
ABS (2011a) – occupation by industry – agriculture, forestry and fishing
Central Australia does not have a significant proportion of its workforce employed by primary industries
X
‘Traditional societies’ ABS (2011a) – proportion of population that identify as Aboriginal or Torres Strait Islander
All focal areas have a high Aboriginal and Torres Strait Islander population in comparison to other areas of Australia. However, as there is no empirical measurement of ‘traditional’ available for these areas, the positive tick for each focal area should be interpreted carefully
People in thermally stressful occupations (e.g. mining, shearing, farm work, fire fighting, outdoor maintenance work), young people undertaking heavy labour
ABS (2011a) – occupation by industry – agriculture, forestry and fishing, mining and construction were considered to be thermally stressful
Central Australia does not have a significant proportion of its workforce employed by primary industries
X
Fly-in/fly-out workers in thermally stressful occupations who may work prior to acclimatisation
ABS (2011a) – occupation by industry – mining
Central Australia does not have a significant proportion of its workforce employed by the mining industry. The Kimberley and Cape York may have a lower fly-in/fly-out workforce than remote areas like the Pilbara, but a higher proportion than the national average
X
Health Those with pre-existing illnesses, particularly respiratory illnesses, and cardiovascular diseaseB
ABS (2006) – likelihood of cardiovascular disease in Aboriginal and Torres Strait Islander Australians
All focal areas have poor health outcomes
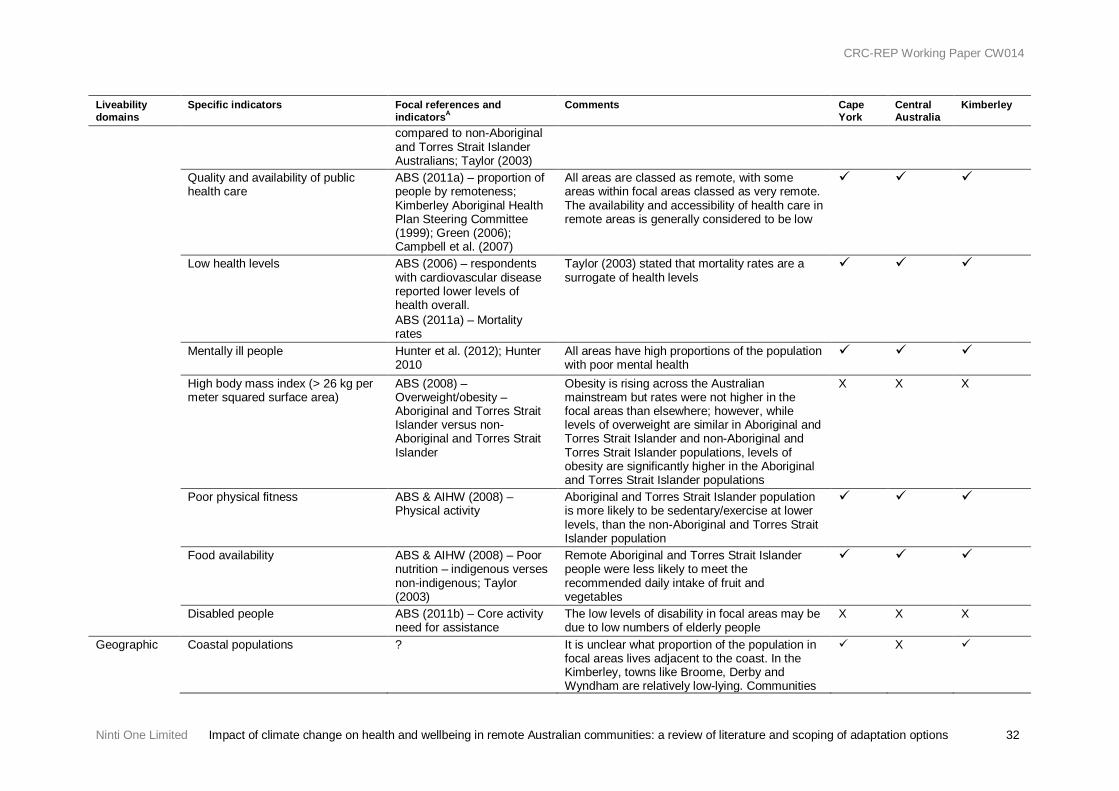
CRC-REP Working Paper CW014
Ninti One Limited Impact of climate change on health and wellbeing in remote Australian communities: a review of literature and scoping of adaptation options 32
Liveability domains
Specific indicators Focal references and indicatorsA
Comments Cape York
Central Australia
Kimberley
compared to non-Aboriginal and Torres Strait Islander Australians; Taylor (2003)
Quality and availability of public health care
ABS (2011a) – proportion of people by remoteness; Kimberley Aboriginal Health Plan Steering Committee (1999); Green (2006); Campbell et al. (2007)
All areas are classed as remote, with some areas within focal areas classed as very remote. The availability and accessibility of health care in remote areas is generally considered to be low
Low health levels ABS (2006) – respondents with cardiovascular disease reported lower levels of health overall. ABS (2011a) – Mortality rates
Taylor (2003) stated that mortality rates are a surrogate of health levels
Mentally ill people Hunter et al. (2012); Hunter 2010
All areas have high proportions of the population with poor mental health
High body mass index (> 26 kg per meter squared surface area)
ABS (2008) – Overweight/obesity – Aboriginal and Torres Strait Islander versus non-Aboriginal and Torres Strait Islander
Obesity is rising across the Australian mainstream but rates were not higher in the focal areas than elsewhere; however, while levels of overweight are similar in Aboriginal and Torres Strait Islander and non-Aboriginal and Torres Strait Islander populations, levels of obesity are significantly higher in the Aboriginal and Torres Strait Islander populations
X X X
Poor physical fitness ABS & AIHW (2008) – Physical activity
Aboriginal and Torres Strait Islander population is more likely to be sedentary/exercise at lower levels, than the non-Aboriginal and Torres Strait Islander population
Food availability ABS & AIHW (2008) – Poor nutrition – indigenous verses non-indigenous; Taylor (2003)
Remote Aboriginal and Torres Strait Islander people were less likely to meet the recommended daily intake of fruit and vegetables
Disabled people ABS (2011b) – Core activity need for assistance
The low levels of disability in focal areas may be due to low numbers of elderly people
X X X
Geographic Coastal populations ? It is unclear what proportion of the population in focal areas lives adjacent to the coast. In the Kimberley, towns like Broome, Derby and Wyndham are relatively low-lying. Communities
X
CRC-REP Working Paper CW014
Ninti One Limited Impact of climate change on health and wellbeing in remote Australian communities: a review of literature and scoping of adaptation options 33
Liveability domains
Specific indicators Focal references and indicatorsA
Comments Cape York
Central Australia
Kimberley
of the Torres Strait, and some communities on mainland Cape York, are also low-lying
Remoteness ABS (2011a) – Remoteness All areas are classed as remote, with some areas in focal areas classed as very remote
Small islands Cape York is the only focal area whose islands are sufficiently populate
X X
People in hot locations will be more affected by colder temperatures
see Appendix 2 Temperatures will increase in all focal areas X X X
People in cold locations will be more affected by hotter temperatures
see Appendix 2 In Central Australia, warmer winter temperatures may improve health outcomes through reduced cardio-respiratory problems in winter
X X X
Urban people ABS (2011a) – proportion of population by section of state
The ‘heat island’ effect is unlikely to be significant in any focal area
X X X
People sleeping on the top floor of buildings.
ABS (2010) – dwelling structure
No household in focal areas was in a dwelling with four or more storeys
X X X
Social Low human capacity NA Statistical data on human capacity is lacking. NA NA NA Low levels of education ABS (2011a) – highest year
of school completed Large proportions of the population in focal areas have poor education outcomes
Homelessness ABS (2010) – dwelling structure
All focal areas had high proportions of people who lived in ‘improvised home, tent, sleepers out’ or ‘dwelling structure not stated’
Weak social support NA Unable to be simply measured using statistical data
NA NA NA
Those who live alone ABS (2011a) – number of persons usually resident
Non-Aboriginal and Torres Strait Islander households are more likely to be in single occupancy households
X X X
Demographic Low levels of infrastructure, such as good housing and adequate fresh water
ABS (2011a) – proportion of people by remoteness; Taylor (2003); Kimberley Aboriginal Health Plan Steering Committee (1999)
While surrogates are used, infrastructure is generally considered to be poor in all focal areas
Those unable to cool their living environment
NA Statistics not available at the focal level NA NA NA
Elderly people, particularly women ABS (2011a) – population by age Taylor (2003); Roach et al. (2007)
While the resident population of the Kimberley is generally young, there is a large elderly cohort during the dry season
X X
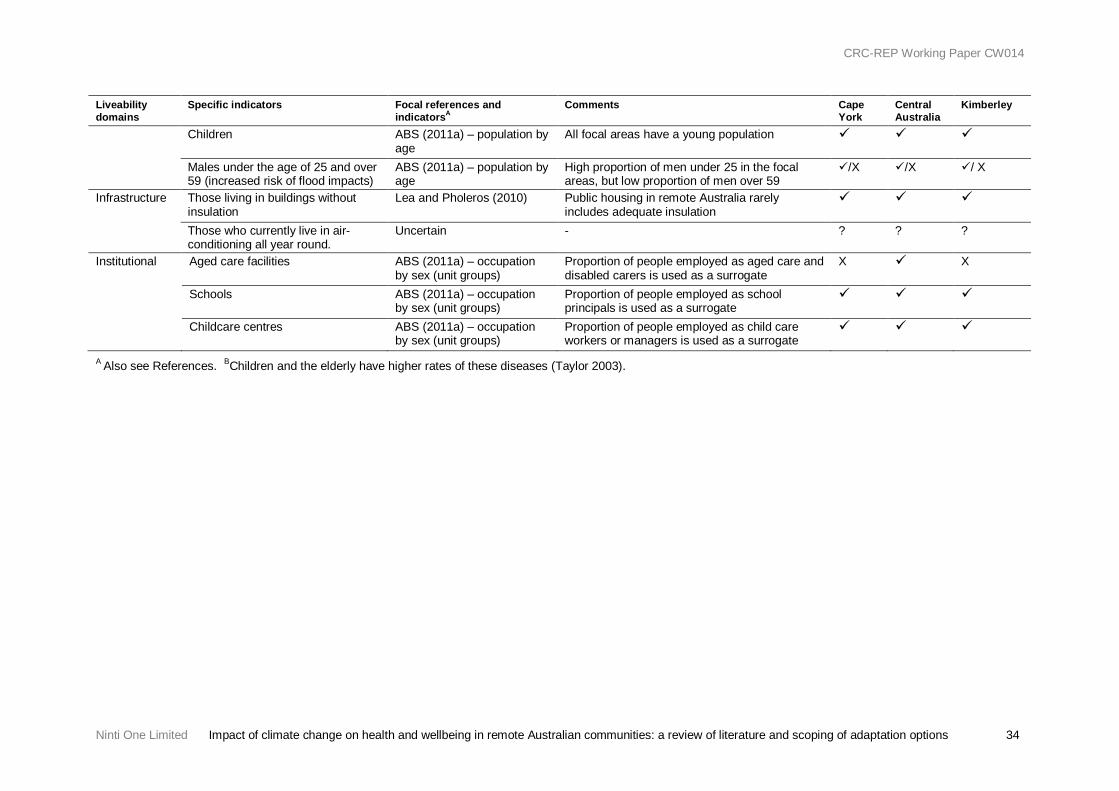
CRC-REP Working Paper CW014
Ninti One Limited Impact of climate change on health and wellbeing in remote Australian communities: a review of literature and scoping of adaptation options 34
Liveability domains
Specific indicators Focal references and indicatorsA
Comments Cape York
Central Australia
Kimberley
Children ABS (2011a) – population by age
All focal areas have a young population
Males under the age of 25 and over 59 (increased risk of flood impacts)
ABS (2011a) – population by age
High proportion of men under 25 in the focal areas, but low proportion of men over 59
/X /X / X
Infrastructure Those living in buildings without insulation
Lea and Pholeros (2010) Public housing in remote Australia rarely includes adequate insulation
Those who currently live in air-conditioning all year round.
Uncertain - ? ? ?
Institutional Aged care facilities ABS (2011a) – occupation by sex (unit groups)
Proportion of people employed as aged care and disabled carers is used as a surrogate
X X
Schools ABS (2011a) – occupation by sex (unit groups)
Proportion of people employed as school principals is used as a surrogate
Childcare centres ABS (2011a) – occupation by sex (unit groups)
Proportion of people employed as child care workers or managers is used as a surrogate
A Also see References. BChildren and the elderly have higher rates of these diseases (Taylor 2003).
CRC-REP Working Paper CW014
Ninti One Limited Impact of climate change on health and wellbeing in remote Australian communities: 35 a review of literature and scoping of adaptation options
The livelihoods of pastoralists are more directly tied to climatic variability than they are for the many remote Aboriginal and Torres Strait Islander Australians who do not solely rely on hunting and gathering to meet their nutritional needs. However, discussions with key stakeholders suggest that remote Australian pastoralists (engaging ‘local ecological knowledge’ – LEK) tend to have a similar perspective on climate change to that of remote Aboriginal and Torres Strait Islander people: climate change is only one of many challenges to which they are and will be exposed. This report has avoided linking climate change vulnerability with Indigenous status for the reasons described in Appendix 1, A1.2. However, traditional/indigenous ecological knowledge (TEK/IEK) has been linked with community resilience to environmental extremes (e.g. Berry et al. 2010b; Gomez-Baggethun et al. 2012). Howitt et al. (2012) argued that states often fail to acknowledge the relevance of indigenous knowledge to the recovery of the social-ecological system after stochastic events. TEK/IEK may therefore increase the resilience of remote Aboriginal and Torres Strait Islander people to climate change. For example, in spinifex country, like much of Central Australia and southern areas of the Kimberley, the use of fire for hunting may reduce the prevalence of the hotter fires that may increase under climate change (Bird et al. 2012). This may in turn reduce air pollution, and respiratory problems. In one study, Central Australian Aboriginal people on outstations were less likely to have diabetes and hypertension, to be hospitalised for infections, and have injuries, than those in centralised communities (Hetzel 2000). They also lived 10 years longer. While the causal factors for these better health outcomes were not identified (see below), the author hypothesises that they include hunting and gathering of traditional foods.
As with adaptation measures and capacity (Vincent 2007; McNamara et al. 2012), there are likely to be limitations to the use of TEK/IEK for resilience under climate change. Resilience can be unwanted where systems are resilient against interventions that may improve a range of social or medical indicators (Maru et al. 2012). While TEK/IEK provides capital that may increase resilience to climate change (Berry et al. 2010b), archaeological data suggest that historical changes in climate nevertheless caused significant shifts in the culture and economy of a pre-European contact Arnhemland society (Bourke et al. 2007); it is unclear whether that society would be classed as resilient to climate change. The study that found a positive relationship between remoteness and health in Aboriginal and Torres Strait Islander communities (Hetzel 2000) did not identify causal factors, including whether it was TEK/IEK that contributed to the better health outcomes of people living on outstations, and this study conflicts with other work that has linked remoteness with poor health.
While Howitt et al. (2012) argues that the social and cultural resilience of Indigenous cultures is often undermined by the practices, attitudes and polices of non-Indigenous state agencies, the pre-European contact Arnhemland society described earlier also showed significant decreases in fertility, and increases in mortality with historical climate change (Bourke et al. 2007). Bardsley and Wiseman (2012) critique the tendency of vulnerability assessments to assume that contemporary Aboriginal livelihoods and natural resources are presently sustainable, without the added perturbation of climate change. Mobility in arid areas may have been an effective strategy for managing climatic variability in the past (Gould 1991), but it challenges the provision of health and social service delivery in contemporary Australia (Kainz et al. 2012). Whether TEK/IEK alone could ever be enough to make Aboriginal and Torres Strait Islander people resilient enough to climate change is therefore debatable. However, the point made by Howitt et al. (2012) that the practices, attitudes and policies of state agencies undermine resilience to climate change in remote Australia is valid where these same practices, attitudes and policies lead to additional socio-economic disadvantage. There is significant empirical evidence to suggest that the current levels of socio-economic disadvantage increase vulnerability to climate change, and remote Aboriginal and Torres Strait Islander Australians are more disadvantaged than either urban Aboriginal and Torres Strait Islander Australians or the mainstream
CRC-REP Working Paper CW014
36 Impact of climate change on health and wellbeing in remote Australian communities: Ninti One Limited a review of literature and scoping of adaptation options
population (State of Victoria 2007; Costello et al. 2009; Berry et al. 2010a; Department of Climate Change and Energy Efficiency 2011; Langton et al. 2012). These factors suggest that TEK/IEK, at the population level and as it is currently practised, does not increase resilience to the same level as that of the non-remote Australian population.
Both remote Aboriginal and Torres Strait Islander people and climate change researchers working in remote Australia (in both tropical and arid areas) emphasise that environmental, social and economic factors are more important factors affecting liveability than climate change, and that these factors need to be strongly integrated with vulnerability assessments (O’Brien et al. 2007; Petheram et al. 2010; Bardsley and Wiseman 2012; Veland et al. 2013). Petheram et al. (2010) reported that East Arnhem people were concerned that climate change policy would trump efforts to improve rights by focusing on reductionist, externally conceived interventions. Veland et al. (2013) also noted that non-climate change-related issues (such as the social and cultural hazards of resettlement as a form of climate change adaptation) were greater perceived threats to West Arnhem livelihoods than biogeographical change. These findings suggest that vulnerability assessments and adaptation planning in remote Australia will be better understood using a contextual framework (O’Brien et al. 2007; Pearce et al. 2012; Veland et al. 2013). Such a framework should place human security in a greater social-ecological context, rather than emphasising a simple a linear climate change-impacts relationship.
5. Adaptation
A large number of variables affect the ability of a household or population to adapt to climate change. Social, political, economic, technological and institutional factors are all important (Vincent 2007). At the national level, adaptive capacity depends upon both financial resources and the ability of the organisational and institutional environment to deliver these resources to the areas and populations that are most vulnerable to climate change (Vincent 2007). At the level of the household, the ability to anticipate change, identify new or different livelihoods, and to access the resources required to achieve this, is necessary for climate change adaptation (Vincent 2007). This next section describes some of the factors that reduce adaptive capacity.
5.1 Barriers to adaptation
There is a lack of information on actual, current adaptation measures (Moser 2011). A lack of adaptation to date may be due to adaptation being ‘messy’, the process involving adjustments in human systems at multiple scales and by multiple actors, significant costs and trade-offs, denial, competition with mitigation funding and the reluctance of governments to invest (Vincent 2007; Fritze et al. 2008; Berrang-Ford et al. 2011; Moser 2011). Adaptation to climate change is limited by the values, perceptions, processes and power structures within society (Adger et al. 2009), with societal context mediating access to adaptation opportunities according to characteristics such as class, race and gender (Vincent 2007). This suggests that appropriate adaptation measures will need to vary through both space and time, and both within and between sub-populations.
Internationally, the public accepts that climate change has impacts on respiratory problems, heat-related problems, cancer and infectious diseases, and that these impacts are most likely to affect children, the elderly and the poor (Akerlof et al. 2010). However, cognitive barriers associated with the high level of exposure uncertainty, and long time frames, may have encouraged a lack of action to date (Adger et al. 2011; Barnett et al. 2011; DCCEE 2011; Moser 2011). Institutional paradoxes, such as the Australian Government simultaneously promoting renewable energy and conventional coal-fired energy (Browne and Bishop 2011), may also prevent effective climate change adaptation.
CRC-REP Working Paper CW014
Ninti One Limited Impact of climate change on health and wellbeing in remote Australian communities: 37 a review of literature and scoping of adaptation options
Fritze et al. (2008) and Hallegate (2009) noted that while local-level action to reduce socio-economic vulnerability to climate change is essential, actions at this level may be currently constrained by financial, legal and technological constraints at higher levels. Anisuzzaman and Jennings (2011) found that local government authorities in Australia had done little towards climate change adaptation planning due to lack of awareness, lack of sufficient resources, no mechanisms to facilitate cross-departmental planning and an inability to recognise climate change as a corporate risk. Cross-level tensions therefore also produce barriers to effective adaptation.
There are additional barriers to effective adaptation measures that are specific to remote areas. The Blashki et al. (2011) principles of health response to climate change include ensuring equitable and just access to healthcare, creating resilient infrastructure, consistent services and a sustainable workforce. These adaptation principles will be particularly difficult to apply to remote areas that already struggle with these very issues (Stafford Smith 2008 and as described in Sections 3.1 and 3.2). The high reliance on fossil fuels in remote areas may both increase sensitivity to climate change as fuel prices rise and prohibit some adaptation measures. Low population densities, high dependency ratios and relatively few taxable individuals (see Appendix 3) may make it difficult for local communities to raise adequate funds to adapt. Indeed, Parsons (2012) noted that high-level governments had been reluctant to invest in proposed flood adaptation measures in the Torres Strait, despite strong community support and scientific justification.5
5.2 Overcoming barriers
The literature on intentional climate change adaptation suggests that climate variability more strongly stimulates adaptation than a longer-term change in the climate average (Berrang-Ford et al. 2011). Changes in the predictability of precipitation, particularly in precipitation that causes floods or droughts, are particularly important for primary industry and water supply (Berrang-Ford et al. 2011). These changes may overcome psychological barriers, creating more will for the introduction of adaptation measures after these periods. Indeed, Vincent (2007) notes that it is generally easier to detect signs of adaptive capacity when the social system has had to face the actual risks and impacts of extreme weather events. However, waiting for these changes to occur moves the measure from the category of ‘adaptation’ to that of ‘reaction’, and accepts that there will be unmanaged impacts (such as loss of income, infrastructure damage or mortality) until longer-term psychological barriers are overcome.
Jones et al. (2008) anticipated that adaptation to climate change will mostly involve relatively modest behavioural changes facilitated by private markets. However, governments are far more anticipatory than households in the absence of financial stimuli (Berrang-Ford et al. 2011). Additionally, individual adaptation decisions take place within an institutional context that can constrain or facilitate adaptation, in turn mediating access to adaptation opportunities (Vincent 2007). Governments therefore have the greatest capacity to implement and/or encourage both market- and non-market–based adaptation measures, particularly those that overcome market failures, provide public goods and services and augment the private sector’s capacity to cope (Tamirisa 2008). Higher-level governments will especially need to assist local communities to adapt where adaptation costs are greater than the funding that can be generated locally. This will be particularly important in remote areas where low population densities lead to high transaction costs and a low tax base.
While higher-level governments may be the most appropriate funding body for climate change adaptation in remote Australia, the highly localised way in which climate change will affect social-
5 In 2012, after many years of lobbying, the Hon Simon Crean MP announced that the Torres Strait would benefit from funding for coastal protection infrastructure. Note, no mention of climate change was made in the media release (DRALGAS 2012).
CRC-REP Working Paper CW014
38 Impact of climate change on health and wellbeing in remote Australian communities: Ninti One Limited a review of literature and scoping of adaptation options
ecological systems suggests that they may not always be the most appropriate level of government for identifying and developing adaptation options. In remote areas, smaller communities are the most variable due to a range of socio-economic indicators (Maru and Chewings 2008; Jones et al. n.d.). This suggests that broad-based adaptation measures are likely to produce particularly patchy results in these communities. Local communities will therefore need to be involved in shaping their own climate change adaptation responses (Green et al. 2010).
5.3 Adaptation under uncertainty
In addition to the negative and positive side effects and externalities of adaptation measures, a number of key principles are relevant to choosing adaptation strategies under uncertainty in remote Australia (de Bruin et al. 2009; Hallegate 2009; Chen and Graham 2011). Adaptation measures will need to be proportionate, robust, timely, creative, cross-cutting, flexible, strategic and iterative (DCCEE 2011; Barlow et al. 2011; Blashki et al. 2011). It is also important that they do not undermine other goals, such as mitigating carbon emissions (Hallegate 2009; Moser 2011). Planned adaptation measures such as desalinisation plants, the increased use of air-conditioning, building large dams, large coastal protection structures and increases in nitrogen fertilisers may therefore be counterproductive and maladaptive (Moser 2011). Adapting to low levels of climate change should not increase the severity of consequences if, in reality, high levels of climate change occur (Travis 2010).
The following principles seek to minimise risk in the absence of a full risk assessment of individual adaptation options at specific locations, and will minimise the risk of maladaptation (Box 5). These principles are further explained in the text below.
Box 5: Important design principles for adaptation measures
1. No regrets/win-win 2. High insensitivity to future climate condition 3. Flexible and easily reversible 4. Include safety margins 5. Softness 6. Reduce decision time horizons
The first principle, and the one which this report considers to be the most important, is selecting ‘no regret’ strategies (Frumkin et al. 2008; Hallegate 2009). These strategies yield benefits even without climate change. Addressing the factors leading to socio-economic disadvantage is an obvious example, and is the example most likely to give greatest synergy (this is further explained in the next section). Another example is better maintaining water infrastructure to prevent leakages. This may help ‘drought proof’ if reduced precipitation occurs, but will also save money in the short-term (Hallegate 2009). Attempts to reduce social isolation may improve overall health, but may also reduce vulnerability to heat waves (Frumkin et al. 2008). Educating community members to cook with nutritious shop-bought food if the species that they usually hunt/collect and cook has changed in extent/abundance (Pearce et al. 2012) is another example of a no-regret strategy.
The remaining principles are centred on risk minimisation. Principles include choosing the most robust adaptation measure, one that is the most insensitive to future climate condition, rather than looking for the most favourable measure under all climate change projections (Hallegate 2009). This involves favouring measures that are easily reversible and flexible, have safety margins, are soft and reduce decision time horizons. Reversible and flexible strategies are those that keep the cost of being wrong about future climate change as low as possible. This may be particularly important in places like Cape York, where annual precipitation is projected to increase by 2100, but could either increase or decrease by 2030. Sea-wall defences that can be cheaply upgraded as sea levels rise are one example, assuming that people do not also choose to move to these areas because they perceive them
CRC-REP Working Paper CW014
Ninti One Limited Impact of climate change on health and wellbeing in remote Australian communities: 39 a review of literature and scoping of adaptation options
to be safe. Insurance is another example. Holding off on allowing housing developments in areas that may, or may not, be vulnerable to climate change is also easily reversible. An example of incorporating safety margins in adaptation measures includes changing required specifications of air-conditioners so that they must be able to work sufficiently under a climate of +5˚C the present maximum temperature. In pastoral settings, small-scale dams that are large enough to capture adequate water volumes under a drier climate, but are also robust enough to withstand heavy precipitation events, are another example. Soft strategies are institutional, financial or behavioural rather than technological (Chen and Graham 2011). Institutionalising long planning horizons, early warning systems or better incorporating potential climate-related health impacts into education tools are all examples. Reducing decision-making time horizons may be appropriate in some cases. For example, significant financial investments in foreshore renewal may not be appropriate if that foreshore is only likely to remain intact for the next ten years. Importantly, adaptation options that follow these principles should also not reduce the long-term resilience of any one social-ecological system (Adger et al. 2011).
5.4 Options for focal areas 5.4.1 Targeting vulnerability
Socio-economic disadvantage and remoteness are closely linked, despite some local variability. Vulnerability to climate change in remote Australia is closely linked to existing disadvantage. Existing policy is already extremely challenged by its target of ‘closing the gap’ in health, housing, education and employment (Green et al. 2012). Due to both high levels of uncertainty, and related psychological and institutional barriers, climate change is rarely the only reason for initiating adaptation action (McHenry 2009; Berrang-Ford et al. 2011). Climate change is expected to amplify existing disorders and health inequities, not create new ones (Blashki et al. 2011). For these reasons, adaptation measures may be more effective if they target the factors that currently maintain people in socio-economic disadvantage. That is, measures should concentrate on reducing vulnerability and increasing adaptive capacity by addressing the underlying causes of social disadvantage6 rather than initiating large-scale infrastructure projects (Kelly and Adger 2000; Bambrick et al. 2011; Krishnaswamy et al. 2012). O’Brien et al. (2007) classified this approach to vulnerability as belonging to the ‘contextual’ framework, such as that developed for the CRC-REP’s Interplay Project (Nguyen and Cairney 2013).
Factors contributing to disadvantage in remote areas are relatively uncontroversial, well documented, and have been consistently repeated through time. Addressing disadvantage may also be less risky than introducing other adaptation options because there is far more localised information available on the contributory factors to disadvantage in the focal areas than there is on either expected exposure to climate change, or the likely sensitivity of the population to these changes. Secondary contributory factors to vulnerability can generally be classed as either institutional or financial. As noted by O’Brien et al. (2007), reducing local vulnerability depends on addressing the mechanisms by which people are excluded from the support tools otherwise available to those engaging with the formal economy and political system. As well described by Lea and Pholeros (2010), poor governance at a variety of levels and scales has kept the infrastructure of remote communities at a low level. To give a more specific example, it is well known that inadequate expenditure on health care by governments has significant health impacts in both the Kimberley (Kimberley Aboriginal Health Plan Steering Committee 1999) and Central Australia (Campbell et al. 2007). While the populations of both focal areas receive the same per capita health expenditure as the broader Australian community, increased 6 ‘Decreasing socio-economic disadvantage in vulnerable populations’ should not be understood to mean the facilitation of indiscriminate economic growth. As Bohensky et al. (2011) demonstrate, there are significant negative trade-offs between economic wellbeing, and both social and environmental wellbeing, under different climate change scenarios.
CRC-REP Working Paper CW014
40 Impact of climate change on health and wellbeing in remote Australian communities: Ninti One Limited a review of literature and scoping of adaptation options
transaction costs associated with providing health care for a remote and dispersed population means that the effective expenditure is much less (Kimberley Aboriginal Health Plan Steering Committee 1999; Campbell et al. 2007). This is the case even though the need in remote communities is much higher the broader community on a per capita basis (Kimberley Aboriginal Health Plan Steering Committee 1999). Veland et al. (2013) noted that studies of climate change adaptation should not treat poverty, ill health and welfare dependence in remote Australia as primary contributors to climate change vulnerability. Rather, colonisation should be recognised as the primary, ongoing causal mechanism.
Apart from funding constraints, poor or inappropriate service provision is also both product of, and an explanation for, socio-economic disadvantage. One survey found that one-fifth of Aboriginal communities that are not connected to town water had not had their water quality tested within the previous year (FaHCSIA 2010). One-quarter of the communities had drinking water that had failed testing at least once within the previous year (ABS & AIHW 2005). Remote communities lack Aboriginal health workers (Kimberley Aboriginal Health Plan Steering Committee 1999). Many pastoralists, communities/outstations and remote tourism operators find it difficult to achieve the necessary after-sales service needed for basic technologies and services such as solar panels (McHenry 2009).
Addressing the general institutional issues creating this disadvantage in remote areas is likely to have a far greater impact on health and liveability, now and with climate change, than prescribing specific climate change adaptation measures (like those described in the next section). Local communities and ‘liveability experts’ – that is, those working on the local provision of services like health and infrastructure – are the best people to advise higher order governments on these issues. However, higher-level policymakers wishing to increase adaptive capacity at the population level should concentrate on funding well-managed programs that reduce the sensitivity of the largest vulnerable (sub)-populations. In the focal areas, these include those who live outside of urban areas such as Alice Springs or Broome, are children and are of poor health. In the focal areas, these populations are most likely to live in western Cape York Subcluster 5.1, Shires of Derby-West Kimberley and Halls Creek Subcluster 5.1 and Central Australia outside of Alice Springs Subcluster 5.1 (see Appendix 3 for an explanation of the clusters).
5.4.2 Other adaptation options
Other than adaptation measures that directly target vulnerability, there are a range of adaptation measures that O’Brien et al. (2007) classified as belonging to the ‘outcome’ vulnerability framework. Together with local communities, adaptation planners may carefully wish to employ these in strategic areas. These are as follows, as per Travis (2010):
• Technological control and intervention of the physical phenomena themselves • Physical protection and barriers to make places safe from the hazard (climate change) • Monitoring, forecast and warning systems to guide responses such as evacuation • Building codes and engineering design standards to reduce damages of given events • Relief and insurance mechanisms to spread the burden and support recovery and reconstruction • Land use changes to reduce underlying exposure and vulnerability. More specific examples of these types of adaptation measures that i) meet the risk-minimisation principles suggested by de Bruin et al. (2009) and Hallegate (2009), and described earlier, ii) have already been empirically tested in the context of extreme weather events, iii) are likely to be affordable, and iv) are of general relevance to the type of exposure to climate change predicted in focal areas, are shown in Table 10.
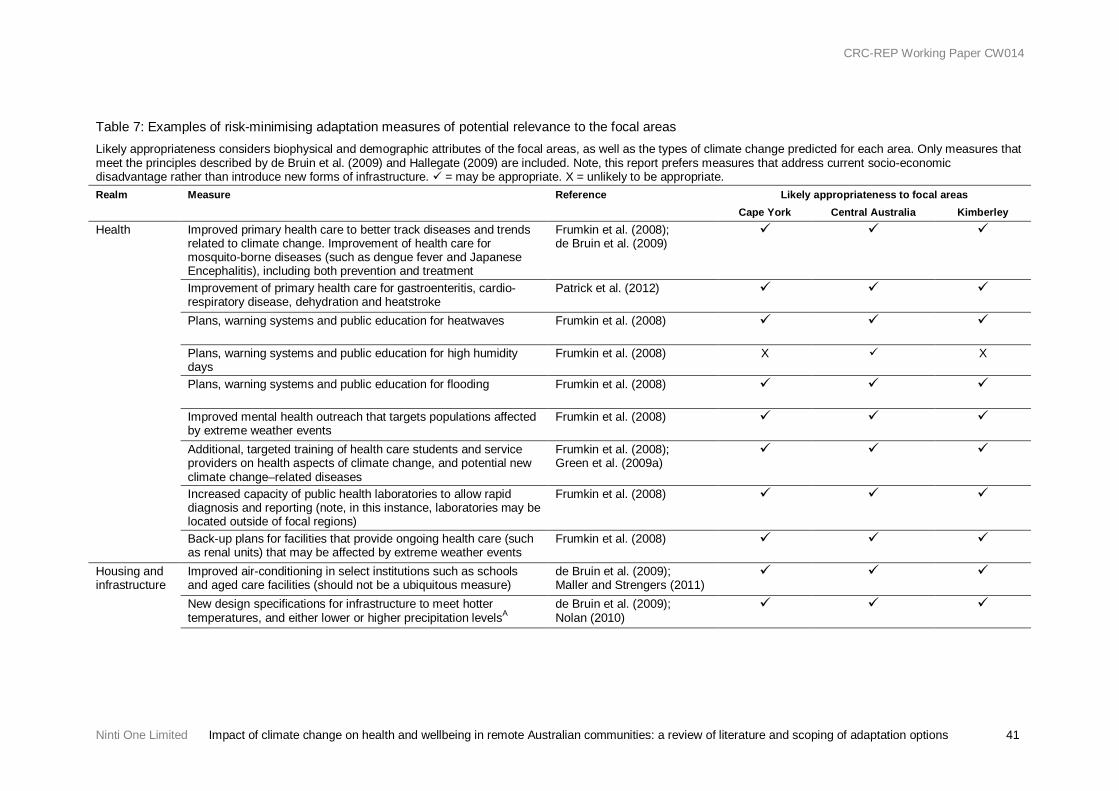
CRC-REP Working Paper CW014
Ninti One Limited Impact of climate change on health and wellbeing in remote Australian communities: a review of literature and scoping of adaptation options 41
Table 7: Examples of risk-minimising adaptation measures of potential relevance to the focal areas Likely appropriateness considers biophysical and demographic attributes of the focal areas, as well as the types of climate change predicted for each area. Only measures that meet the principles described by de Bruin et al. (2009) and Hallegate (2009) are included. Note, this report prefers measures that address current socio-economic disadvantage rather than introduce new forms of infrastructure. = may be appropriate. X = unlikely to be appropriate. Realm Measure Reference Likely appropriateness to focal areas
Cape York Central Australia Kimberley Health
Improved primary health care to better track diseases and trends related to climate change. Improvement of health care for mosquito-borne diseases (such as dengue fever and Japanese Encephalitis), including both prevention and treatment
Frumkin et al. (2008); de Bruin et al. (2009)
Improvement of primary health care for gastroenteritis, cardio-respiratory disease, dehydration and heatstroke
Patrick et al. (2012)
Plans, warning systems and public education for heatwaves Frumkin et al. (2008)
Plans, warning systems and public education for high humidity days
Frumkin et al. (2008) X X
Plans, warning systems and public education for flooding Frumkin et al. (2008)
Improved mental health outreach that targets populations affected by extreme weather events
Frumkin et al. (2008)
Additional, targeted training of health care students and service providers on health aspects of climate change, and potential new climate change–related diseases
Frumkin et al. (2008); Green et al. (2009a)
Increased capacity of public health laboratories to allow rapid diagnosis and reporting (note, in this instance, laboratories may be located outside of focal regions)
Frumkin et al. (2008)
Back-up plans for facilities that provide ongoing health care (such as renal units) that may be affected by extreme weather events
Frumkin et al. (2008)
Housing and infrastructure
Improved air-conditioning in select institutions such as schools and aged care facilities (should not be a ubiquitous measure)
de Bruin et al. (2009); Maller and Strengers (2011)
New design specifications for infrastructure to meet hotter temperatures, and either lower or higher precipitation levelsA
de Bruin et al. (2009); Nolan (2010)
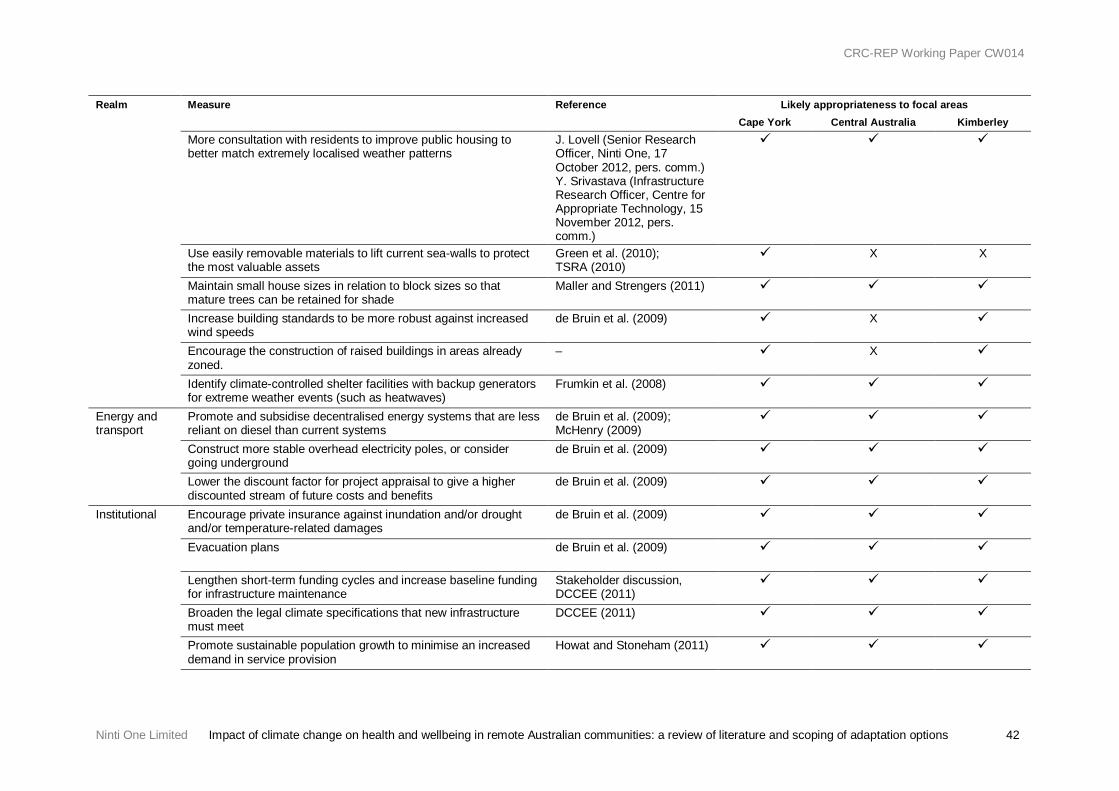
CRC-REP Working Paper CW014
Ninti One Limited Impact of climate change on health and wellbeing in remote Australian communities: a review of literature and scoping of adaptation options 42
Realm Measure Reference Likely appropriateness to focal areas Cape York Central Australia Kimberley
More consultation with residents to improve public housing to better match extremely localised weather patterns
J. Lovell (Senior Research Officer, Ninti One, 17 October 2012, pers. comm.) Y. Srivastava (Infrastructure Research Officer, Centre for Appropriate Technology, 15 November 2012, pers. comm.)
Use easily removable materials to lift current sea-walls to protect the most valuable assets
Green et al. (2010); TSRA (2010)
X X
Maintain small house sizes in relation to block sizes so that mature trees can be retained for shade
Maller and Strengers (2011)
Increase building standards to be more robust against increased wind speeds
de Bruin et al. (2009) X
Encourage the construction of raised buildings in areas already zoned.
– X
Identify climate-controlled shelter facilities with backup generators for extreme weather events (such as heatwaves)
Frumkin et al. (2008)
Energy and transport
Promote and subsidise decentralised energy systems that are less reliant on diesel than current systems
de Bruin et al. (2009); McHenry (2009)
Construct more stable overhead electricity poles, or consider going underground
de Bruin et al. (2009)
Lower the discount factor for project appraisal to give a higher discounted stream of future costs and benefits
de Bruin et al. (2009)
Institutional
Encourage private insurance against inundation and/or drought and/or temperature-related damages
de Bruin et al. (2009)
Evacuation plans de Bruin et al. (2009)
Lengthen short-term funding cycles and increase baseline funding for infrastructure maintenance
Stakeholder discussion, DCCEE (2011)
Broaden the legal climate specifications that new infrastructure must meet
DCCEE (2011)
Promote sustainable population growth to minimise an increased demand in service provision
Howat and Stoneham (2011)
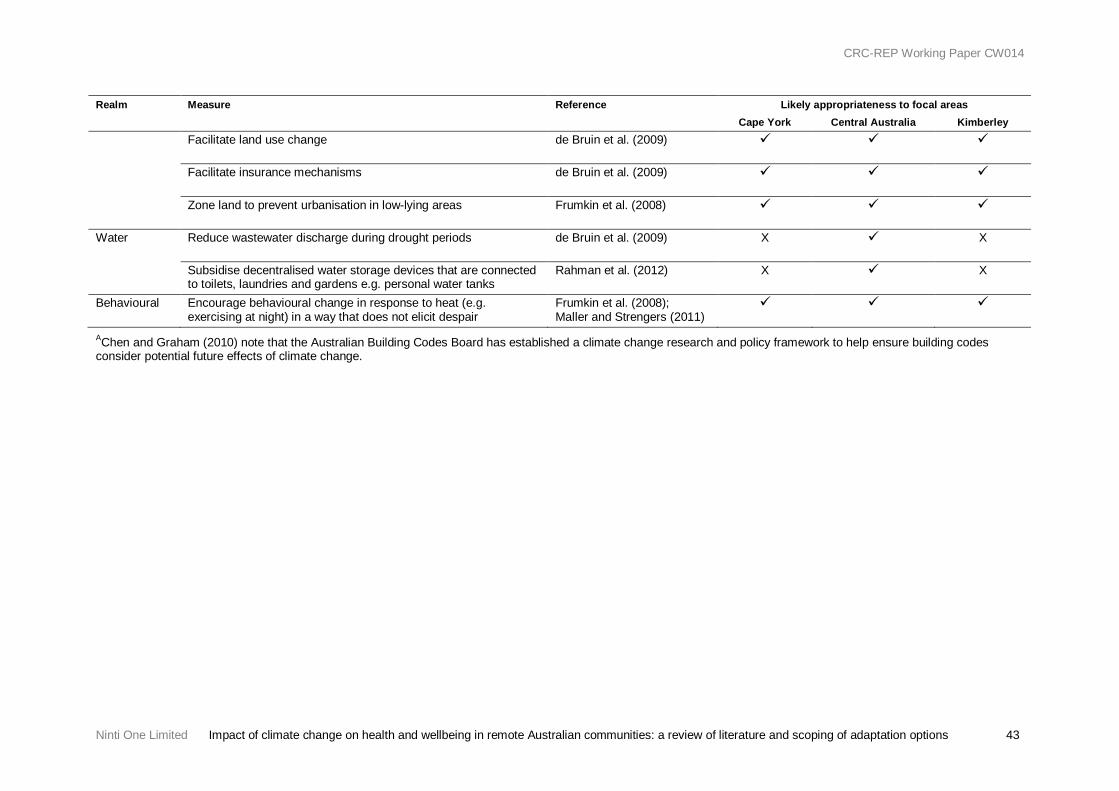
CRC-REP Working Paper CW014
Ninti One Limited Impact of climate change on health and wellbeing in remote Australian communities: a review of literature and scoping of adaptation options 43
Realm Measure Reference Likely appropriateness to focal areas Cape York Central Australia Kimberley
Facilitate land use change de Bruin et al. (2009)
Facilitate insurance mechanisms de Bruin et al. (2009)
Zone land to prevent urbanisation in low-lying areas Frumkin et al. (2008)
Water Reduce wastewater discharge during drought periods de Bruin et al. (2009) X X
Subsidise decentralised water storage devices that are connected to toilets, laundries and gardens e.g. personal water tanks
Rahman et al. (2012) X X
Behavioural Encourage behavioural change in response to heat (e.g. exercising at night) in a way that does not elicit despair
Frumkin et al. (2008); Maller and Strengers (2011)
AChen and Graham (2010) note that the Australian Building Codes Board has established a climate change research and policy framework to help ensure building codes consider potential future effects of climate change.
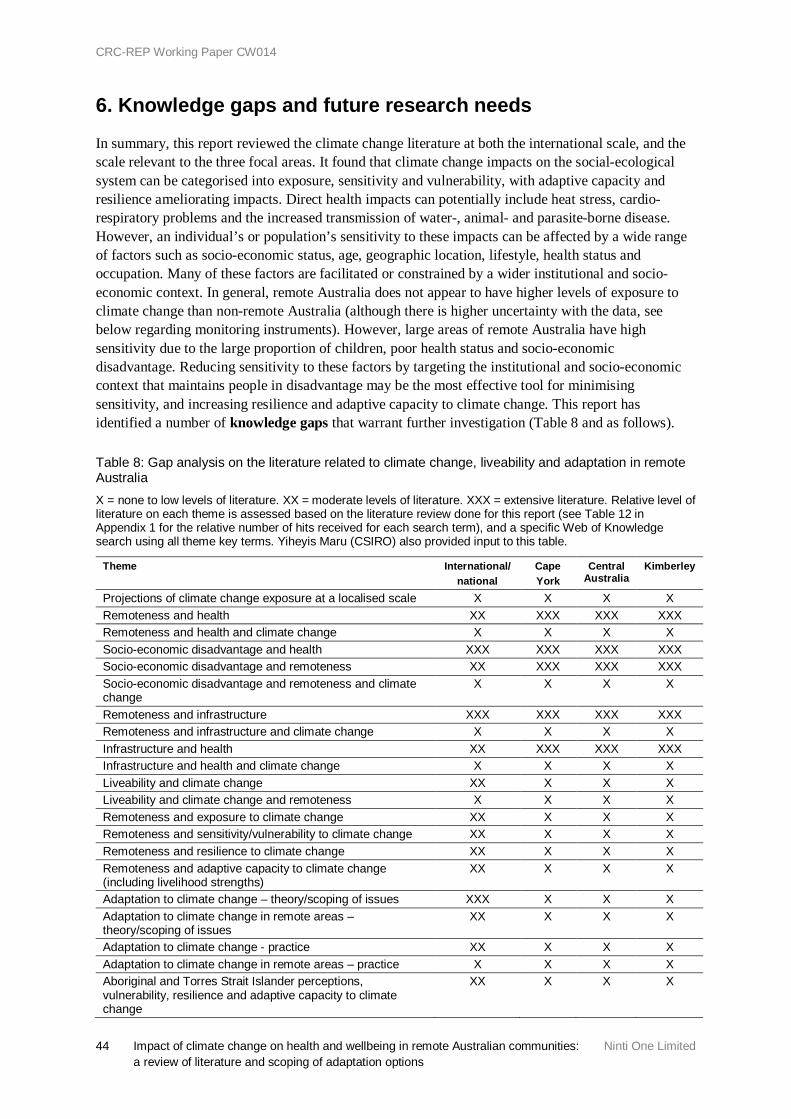
CRC-REP Working Paper CW014
44 Impact of climate change on health and wellbeing in remote Australian communities: Ninti One Limited a review of literature and scoping of adaptation options
6. Knowledge gaps and future research needs
In summary, this report reviewed the climate change literature at both the international scale, and the scale relevant to the three focal areas. It found that climate change impacts on the social-ecological system can be categorised into exposure, sensitivity and vulnerability, with adaptive capacity and resilience ameliorating impacts. Direct health impacts can potentially include heat stress, cardio-respiratory problems and the increased transmission of water-, animal- and parasite-borne disease. However, an individual’s or population’s sensitivity to these impacts can be affected by a wide range of factors such as socio-economic status, age, geographic location, lifestyle, health status and occupation. Many of these factors are facilitated or constrained by a wider institutional and socio-economic context. In general, remote Australia does not appear to have higher levels of exposure to climate change than non-remote Australia (although there is higher uncertainty with the data, see below regarding monitoring instruments). However, large areas of remote Australia have high sensitivity due to the large proportion of children, poor health status and socio-economic disadvantage. Reducing sensitivity to these factors by targeting the institutional and socio-economic context that maintains people in disadvantage may be the most effective tool for minimising sensitivity, and increasing resilience and adaptive capacity to climate change. This report has identified a number of knowledge gaps that warrant further investigation (Table 8 and as follows).
Table 8: Gap analysis on the literature related to climate change, liveability and adaptation in remote Australia X = none to low levels of literature. XX = moderate levels of literature. XXX = extensive literature. Relative level of literature on each theme is assessed based on the literature review done for this report (see Table 12 in Appendix 1 for the relative number of hits received for each search term), and a specific Web of Knowledge search using all theme key terms. Yiheyis Maru (CSIRO) also provided input to this table.
Theme International/ national
Cape York
Central Australia
Kimberley
Projections of climate change exposure at a localised scale X X X X Remoteness and health XX XXX XXX XXX Remoteness and health and climate change X X X X Socio-economic disadvantage and health XXX XXX XXX XXX Socio-economic disadvantage and remoteness XX XXX XXX XXX Socio-economic disadvantage and remoteness and climate change
X X X X
Remoteness and infrastructure XXX XXX XXX XXX Remoteness and infrastructure and climate change X X X X Infrastructure and health XX XXX XXX XXX Infrastructure and health and climate change X X X X Liveability and climate change XX X X X Liveability and climate change and remoteness X X X X Remoteness and exposure to climate change XX X X X Remoteness and sensitivity/vulnerability to climate change XX X X X Remoteness and resilience to climate change XX X X X Remoteness and adaptive capacity to climate change (including livelihood strengths)
XX X X X
Adaptation to climate change – theory/scoping of issues XXX X X X Adaptation to climate change in remote areas – theory/scoping of issues
XX X X X
Adaptation to climate change - practice XX X X X Adaptation to climate change in remote areas – practice X X X X Aboriginal and Torres Strait Islander perceptions, vulnerability, resilience and adaptive capacity to climate change
XX X X X
CRC-REP Working Paper CW014
Ninti One Limited Impact of climate change on health and wellbeing in remote Australian communities: 45 a review of literature and scoping of adaptation options
Of the focal areas, Central Australia and the Kimberley appear to have the strongest literature linking health and infrastructure. Cape York appears to have the strongest literature on the projected climate change impacts of the socio-economic system, but this literature tends to focus on the Torres Strait. There is a relatively small body of literature on climate change impacts on the social-ecological system for Central Australia and the Kimberley. Most of the papers referenced in this report are largely speculative about the impacts that climate change may have; this masks the true paucity of empirically based knowledge.
When focusing on remote Australia, the literature has tended to focus on impacts to Aboriginal and Torres Strait Islander Australians. This is warranted by the high levels of sensitivity that many Aboriginal and Torres Strait Islander Australians are likely to have to climate change, due to their disproportionately high level of socio-economic disadvantage. However, there has been little specific research on the potential impacts of climate change on pastoral, defence, tourist or mining interests in remote Australia. Pastoralists, due to their high economic reliance on rainfall, remoteness from health services and high levels of financial strain, may be particularly sensitive.
The exposure of remote Australia to climate change is even more uncertain than the already high levels of uncertainty in less remote areas. This is due to the sparse network of meteorological and water monitoring stations in remote Australia making it difficult to calibrate models. For example, Green et al. (2010) noted that recorded meteorological variables for the Torres Strait region are either of short length or contain a large proportion of missing data, making it difficult to verify climate change models in the area or to understand the true nature of current extreme weather events. Potential impacts from changes to oceanographic currents are considered to be high but are not well resolved in global climate models (TSRA 2010). Tidal dynamics are very complicated; this can result in significant differences in tidal patterns over a few kilometres. These dynamics are also understudied, and as such the impacts of sea level rise and inundation processes are largely unknown at the local level (TSRA 2010).
Other important aspects of climate change that require further research because they are lacking in the literature relevant to remote Australia or were beyond the scope of this report include the relationships between remoteness, resilience and adaptive capacity; the relationship between adaptive capacity and vulnerability; the larger institutional context that facilitates adaptive capacity in remote Australia; the impacts of climate change on health and infrastructure that occur indirectly via other impacts on the social-ecological system; the institutional and cultural capacity of local communities to respond to new (crisis) situations; the economic transformation of focal areas and the likely impact of such transformations on adaptive capacity; and the relationship between mobility and adaptive capacity.
CRC-REP Working Paper CW014
46 Impact of climate change on health and wellbeing in remote Australian communities: Ninti One Limited a review of literature and scoping of adaptation options
References
ABC. 2012. Climate change unit axed in cost-cutting push. Posted 23/10/2012. Accessed 06/12/2012. Available: http://www.abc.net.au/news/2012-10-23/cost-cutting-sees-climate-change-unit-axed/4329928.
ABS (Australian Bureau of Statistics) 2006. Cardiovascular Disease in Australia: A Snapshot, 2004–05. Cat. no. 4821.0.55.001. Australian Bureau of Statistics. Canberra. http://www.abs.gov.au/ausstats/[email protected]/mf/4821.0.55.001/.
ABS (Australian Bureau of Statistics). 2008. Overweight and Obesity in Adults, Australia, 2004–05. Cat. no. 4719.0. Australian Bureau of Statistics. Canberra. http://www.abs.gov.au/AUSSTATS/[email protected]/Latestproducts/4719.0Main%20Features32004-05?opendocument&tabname=Summary&prodno=4719.0&issue=2004-05&num=&view=.
ABS (Australian Bureau of Statistics). 2010. Population Characteristics, Aboriginal and Torres Strait Islander Australians, 2006 – Dwelling Structure. Cat. no. 4713.0. Australian Bureau of Statistics. Canberra. http://www.abs.gov.au/ausstats/[email protected]/Lookup/93F26866F08FB795CA2578DB00283CD2.
ABS (Australian Bureau of Statistics). 2011a. National Regional Profile, 2006 to 2010. Cat. no. 1379.0.55.001. Australian Bureau of Statistics. Canberra. http://www.abs.gov.au/AUSSTATS/[email protected]/DetailsPage/1379.0.55.0012006%20to%202010?OpenDocument.
ABS (Australian Bureau of Statistics). 2011b. The Health and Welfare of Australia's Aboriginal and Torres Strait Islander Peoples, Oct 2010 – Disability: prevalence of disability. Australian Bureau of Statistics. Canberra. http://www.abs.gov.au/AUSSTATS/[email protected]/lookup/4704.0Chapter510Oct+2010.
ABS (Australian Bureau of Statistics). 2013. Remoteness Structure. Australian Bureau of Statistics. Canberra. http://www.abs.gov.au/websitedbs/D3310114.nsf/home/remoteness+structure.
ABS & AIHW (Australian Bureau of Statistics and Australian Institute of Health and Welfare). 2005. The health and welfare of Australia's Aboriginal and Torres Strait Islander peoples. ABS Catalogue No. 4704.0, AIHW Catalogue No. IHW14. Australian Bureau of Statistics and Australian Institute of Health and Welfare. Canberra. Available: http://www.aihw.gov.au/WorkArea/DownloadAsset.aspx?id=6442458576.
ABS & AIHW (Australian Bureau of Statistics and Australian Institute of Health and Welfare). 2008. The health and welfare of Australia's Aboriginal and Torres Strait Islander peoples. ABS Catalogue No. 4704.0, AIHW Catalogue No. IHW 21. Australian Bureau of Statistics and Australian Institute of Health and Welfare. Canberra. Available: http://www.ausstats.abs.gov.au/Ausstats/subscriber.nsf/0/51B575E133A75C6DCA2574390014EDFE/$File/47040_2008.pdf.
Adger W, Brown K, Nelson D, Berkes D, Berkes F, Eakin H, Folke C, Galvin K, Gunderson L, Goulden M, O’Brien K, Ruitenbeek J, and Tompkins E. 2011. Resilience implications of policy responses to climate change. Climate Change 2(5), 757–766.
Adger W, Dessai S, Goulden M, Hulme M, Lorenzoni I, Nelson D, Naess L, Wolf J and Wreford A. 2009. Are there limits to adaptation to climate change? Climatic Change 93, 335–354. http://research.fit.edu/sealevelriselibrary/documents/doc_mgr/338/Global_Social_Limits_to_CC_Adaptation_-_Adger_et_al._2008.pdf.
AHMAC (Australian Health Ministers’ Advisory Council). 2011. Aboriginal and Torres Strait Islander Health Performance Framework Report 2010. AHMAC. Canberra.
CRC-REP Working Paper CW014
Ninti One Limited Impact of climate change on health and wellbeing in remote Australian communities: 47 a review of literature and scoping of adaptation options
http://www.health.gov.au/internet/publications/publishing.nsf/Content/health-oatsih-pubs-framereport-toc/$FILE/HPF%20Report%202010august2011.pdf.
AIHW (Australian Institute of Health and Welfare). 2003. Rural, regional and remote health: a study on mortality. Rural Health Series no. 2. AIHW cat. no. PHE 45. Australian Institute of Health and Welfare. Canberra.
Akerlof K, DeBono R, Berry P, Leiserowitz A, Roser-Renouf C, Clarke K, Rogaeva A, Nisbet M, Weathers M and Maibach E. 2010. Public perceptions of climate change as a human health risk: surveys of the United States, Canada and Malta. International Journal of Environmental Research and Public Health 7(6), 2559–2606.
Anisuzzaman M and Jennings P. 2011. A framework for mainstreaming climate change adaptation within local government operations. International Journal of Climate Change: Impacts and Responses 3(3) 31–46.
Auliciems A and DiBartolo L. 1995. Domestic violence in a subtropical environment: police calls and weather in Brisbane. International Journal of Biometeorology 39(1), 34–39.
Australian Greenhouse Office. 2003. Climate change: an Australian guide to the science and potential impacts. (Ed) Pittock B. Australian Greenhouse Office. Canberra.
Bailie R, Siciliano F, Dane G, Bevan L, Paradies Y and Carson B. 2002. Atlas of health related infrastructure. Aboriginal and Torres Strait Islander Commission. Melbourne.
Bambrick H, Capon A, Barniett G, Beaty R and Burton A. 2011. Climate change and health in the urban environment: adaptation opportunities in Australia cities. Asia-Pacific Journal of Public Health 23(2), 67S–79S.
Bardsley D and Wiseman N. 2012. Climate change vulnerability and social development for remote indigenous communities of South Australia. Global Environmental Change 22(3), 713–723.
Barlow S, Grace P, Stone R, Gibbs M, Howden M, Howieson J, Ugalde D, Miller C, Eckard R and Rowland S. 2011. National climate change adaptation research plan for primary industries. National Climate Change Adaptation Research Facility. Gold Coast.
Barnett J, Dovers S, Hatfield-Dodds S, McDonald H, Nelson K and Waller S. 2011. National climate change adaptation research plan: social, economic and institutional dimensions. National Climate Change Adaptation Research Facility. Gold Coast.
Beard J. 1979. Vegetation survey of Australia: Kimberley. 1:1000000 vegetation series. Map and explanatory notes. University of Western Australia Press. Perth, Western Australia.
Beggs P. 2000. Impacts of climate and climate change on medications and human health. Australian and New Zealand Journal of Public Health 24(6), 630–32.
Beggs P. 2004. Impacts of climate change on aeroallergens: past and future. Clinical and Experimental Allergy 34(10), 1507–1513.
Berrang-Ford L, Ford J and Paterson J. 2011. Are we adapting to climate change? Global Environmental Change 21(1), 25–33.
Berry H, Bowen K and Kjellstrom T. 2010a. Climate change and mental health: a causal pathways framework. International Journal of Public Health 55(2), 123–132.
Berry H, Butler J, Burgess P, Kig U, Tsey K, Cadet-Ames Y, Rigby W and Raphael B. 2010b. Mind, body, spirit: co-benefits for mental health from climate change adaptation and caring for country in remote Aboriginal Australian communities. NSW Public Health Bulletin, 21, 5–6.
Bi P and Parton K. 2008. Effect of climate change on Australian rural and remote regions: what do we know and what do we need to know? Australian Journal of Rural Health 16(1), 2–4.
CRC-REP Working Paper CW014
48 Impact of climate change on health and wellbeing in remote Australian communities: Ninti One Limited a review of literature and scoping of adaptation options
Bird R, Codding B, Kauhanen P and Bird D. 2012. Aboriginal hunting buffers climate-driven fire-size variability in Australia’s Spinifex grasslands. Proceedings of the National Academy of Sciences of the United States of America 109(26), 10287–10292.
Black D and Black J. 2009. A review of the urban development and transport impacts on public health with particular reference to Australia: trans-disciplinary research teams and some research gaps. International Journal of Environmental Research and Public Health 6(5), 1557–1596.
Blashki G, Armstrong G, Louise Berry B, Weaver H, Hanna E, Bi P, Harley D and Spickett J. 2011. Preparing health services for climate change in Australia. Asia Pacific Journal of Public Health 23(2Suppl), 133S–43.
Bohensky E, Butler J, Costanza R, Bohnet I, Delisle A, Fabricius K, Gooch M, Kubiszewski I, Lukacs G, Pert P and Wolanski E. 2011. Future makers or future takers? A scenario analysis of climate change and the Great Barrier Reef. Global Environmental Change 21(3), 876–893.
BoM (Bureau of Meteorology). 2012a. Climate Data Online – Cooktown. Bureau of Meteorology. Canberra. Available: http://www.bom.gov.au/climate/averages/tables/cw_031016.shtml.
BoM (Bureau of Meteorology). 2012b. Climate Data Online – Coconut Island. Bureau of Meteorology. Canberra. Available: http://www.bom.gov.au/climate/averages/tables/cw_027022.shtml.
BoM (Bureau of Meteorology). 2012c. Climate Data Online – Weipa. Bureau of Meteorology. Canberra. Available: http://www.bom.gov.au/climate/averages/tables/cw_027042.shtml.
BoM (Bureau of Meteorology). 2012d. Climate Data Online – Alice Springs. Bureau of Meteorology. Canberra. Available: http://www.bom.gov.au/climate/averages/tables/cw_015590.shtml.
BoM (Bureau of Meteorology). 2012e. Climate Data Online – Jervois. Bureau of Meteorology. Canberra. Available: http://www.bom.gov.au/climate/averages/tables/cw_015602.shtml.
BoM (Bureau of Meteorology). 2012f. Climate Data Online – Yulara Aero. Bureau of Meteorology. Canberra. Available: http://www.bom.gov.au/climate/averages/tables/cw_015635.shtml.
BoM (Bureau of Meteorology). 2012g. Climate Data Online – Derby Aero. Bureau of Meteorology. Canberra. Available: http://www.bom.gov.au/climate/averages/tables/cw_003032.shtml.
BoM (Bureau of Meteorology). 2012h. Climate Data Online – Halls Creek. Bureau of Meteorology. Canberra. Available: http://www.bom.gov.au/climate/averages/tables/cw_002012.shtml.
BoM (Bureau of Meteorology). 2012i. Climate Data Online – Doongan. Bureau of Meteorology. Canberra. Available: http://www.bom.gov.au/climate/averages/tables/cw_001025.shtml.
Boon HJ, Millar J, Lake D, Cottrell A and King D. 2012. Recovery from Disaster: Resilience, Adaptability and Perceptions of Climate Change. National Climate Change Adaptation Research Facility. Gold Coast. http://www.nccarf.edu.au/sites/default/files/attached_files_publications/FinalReport_Boon-Recoveryfromdisaster_forweb.pdf.
Bourke P, Brockwell S, Faulkner P and Meehan B. 2007. Climate variability in the mid to late Holocene Arnhem Land Region, Northern Australia: archaeological archives of environmental and cultural change. Archaeology in Oceania 42(3), 91–101.
Browne A and Bishop B. 2011. Chasing our tails: psychological, institutional and societal paradoxes in natural resource management, sustainability and climate change in Australia. American Journal of Community Psychology 47(3–4), 354–361.
Bushlight. 2012. Supported communities June 2012. Accessed 14 November 2012, from http://www.bushlight.org.au.

CRC-REP Working Paper CW014
Ninti One Limited Impact of climate change on health and wellbeing in remote Australian communities: 49 a review of literature and scoping of adaptation options
Cameron E. 2012. Securing indigenous politics: a critique of the vulnerability and adaptation approach to the human dimensions of climate change in the Canadian Arctic. Global Environmental Change 22(1), 103–114.
Campbell D, Davies J and Wakerman J. 2007. Realising economies in the joint supply of health and environmental services in Aboriginal central Australia. Working Paper 11. Desert Knowledge CRC. Alice Springs.
Carter A and Muller R. 2007. Hydration knowledge, behaviours and status of staff at the residential camp of a fly-in/fly-out minerals extraction and processing operation in tropical north-eastern Australia. Industrial Health 45(4), 579–589.
Cechet B. 2005. Climate change impact on the pavement maintenance and rehabilitation costs associated with the Australian national highway network. In Zerger A and Argent RM. (Eds.) MODSIM 2005 International Congress on Modelling and Simulation. Modelling and Simulation Society of Australia and New Zealand, pp. 489–96. December 2005. Melbourne, Australia.
Chazal J. 2010. A systems approach to liveability and sustainability: defining terms and mapping relationships to link desires with ecological opportunities and constraints. Systems Research and Behavioural Science 27(5), 585–597.
Chen N, Verrall K and Tong S. 2006. Air particulate pollution due to bushfires and respiratory hospital admissions in Brisbane, Australia. International Journal of Environmental Health Research 16(3), 181–191.
Chen N and Graham P. 2011. Climate change as a survival strategy: soft infrastructure for urban resilience and adaptive capacity in Australia’s coastal zones. In: Resilient Cities and Adaptation to Climate Change – Proceedings of the Global Forum 2010. Ed. K Otto-Zimmermann. pp. 379–388. Springer Science+Business Media BV. The Netherlands.
Commonwealth of Australia. 2007. National Environmental Health Strategy 2007–2012. Publications number: P3-2333. Australian Government. Canberra.
Costello A, Abbas M, Allen A, Ball S, Bell S, Bellamy R, Friel S, Groce N, Johnson A, Kett M, Lee M, Levy C, Maslin M, McCoy D, McGuire B, Montgomery H, Napier D, Pagel C, Patel J, Antonio Puppim de Oliveira J, Redclift N, Rees H, Rogger D, Scott J, Stephenson J, Twigg J, Wolff J and Patterson C. 2009. Managing the health effects of climate change. The Lancet 373(9676), 1693–1733.
CSIRO. 2012. OzClim. Exploring climate change scenarios for Australia. http://www.csiro.au/ozclim. Retrieved October and November 2012.
CSIRO and Bureau of Meteorology. 2007. Climate change in Australia. CSIRO and Bureau of Meteorology. Canberra.
Cusask L, de Crespigny C and Athanasos P. 2011. Heatwaves and their impact on people with alcohol, drug and mental health conditions: a discussion paper on clinical practice considerations. Journal of Advanced Nursing 67(4), 915–922.
Currie B. 2001. Environmental change, global warming and infectious diseases in northern Australia. Environmental Health 1(4), 35–44.
DCCEE (Department of Climate Change and Energy Efficiency). 2011. Barriers to effective climate change adaptation: a submission to the productivity commission. Australian Government. Canberra. http://www.pc.gov.au/__data/assets/pdf_file/0003/114744/sub057.pdf.
de Bruin K, Dellink RB., Ruijs A, Bolwidt L, van Buuren A, Graveland J, de Groot R, Kuikman P, Reinhard S, Roetter R, Tassone V, Verhagen A and Ierland E. 2009 Adapting to climate change in The Netherlands: an inventory of climate adaptation options and ranking of alternatives. Climate Change 95, 23–45.
CRC-REP Working Paper CW014
50 Impact of climate change on health and wellbeing in remote Australian communities: Ninti One Limited a review of literature and scoping of adaptation options
http://www.cakex.org/sites/default/files/adapting%20to%20climate%20change%20in%20the%20netherlands.pdf.
Department of the Army and Air Force. 2003. Heat stress control and heat casualty management. Technical Bulletin TB MED 507/AFPAM 48-152(I). US Army Research Institute of Environmental Medicine. Matick, MA.
Dobes L, Scheufele G and Bennett J. 2012. Benefits and costs of provision of post-cyclone emergency services. National Climate Change Adaptation Research Facility. Gold Coast.
DoHAC (Department of Health and Aged Care). 2001. Measuring Remoteness: Accessibility/Remoteness Index of Australia (ARIA). Revised Edition. Department of Health and Aged Care and the National Key Centre for Social Applications of Geographical Information Systems (GISCA) at the University of Adelaide. Adelaide.
DRALGAS (Department of Regional Australia, Local Government, Arts and Sport). 2012. Torres Strait soon to benefit from coastal protection. Media release 7 July 2012, accessed 12 March 2013. http://ministers.regional.gov.au/hon-simon-crean-mp/media-releases/2012/torres-strait-soon-benefit-coastal-protection.
Drought Policy Review Expert Social Panel. 2008. Assessment of the social impacts of drought and related government and non-government social support services. Issues Paper. Department of Agriculture, Fisheries and Forestry. Canberra.
Ebi K, Sari Kovats R and Menne B. 2006. An approach for assessing human health vulnerability and public health interventions to adapt to climate change. Environmental Health Perspectives 114(12), 1930–1934.
Ewald D, Hall G and Franks C. 2003. An evaluation of a SAFE-style trachoma control program in Central Australia. Medical Journal of Australia 178(2), 65–68.
FaHCSIA (Department of Families, Housing, Community Services and Indigenous Affairs) 2010. National Indigenous Infrastructure Guide. Department of Families, Housing, Community Services and Indigenous Affairs. Canberra.
Ferguson-Hill S. 2002. Management of heat related illness enhanced by climate change and global warming in the north west Kimberley region of Western Australia. Journal of Rural and Remote Environmental Health 1(1), 13–18.
Fien J, Charlesworth E, Lee G, Baker D, Grice T and Morries D. 2011. Life on the edge: housing experiences in three remote Australian indigenous settlements. Habitat International 35(2), 343–349.
Ford J, Bolton K, Shirley J, Pearce T, Tremblay M and Westlake M. 2012. Mapping human dimensions of climate change research in the Canadian Arctic. Ambio 41(8), 808–822.
Fraser C, Judd F, Jackson H, Murray G, Humphreys J and Hodgins G. 2002. Does one size really fit all? Why the mental health of rural Australians requires further research. Australian Journal of Rural Health 10(6), 288–295.
Fritze J, Blashki G, Burke S and Wiseman J. 2008. Hope, despair and transformation: climate change and the promotion of mental health and wellbeing. International Journal of Mental Health Systems 2(13). http://www.ijmhs.com/content/pdf/1752-4458-2-13.pdf.
Frumkin H, Hess J, Luber G, Malilay J and McGeehin M. 2008. Climate change: the public health response. American Journal of Public Health 98(3), 435–455.
Goater S, Cook A, Hogan A, Mengersen K, Hieatt A and Weinstein P. 2011. Strategies to strengthen public health inputs to water policy in response to climate change: an Australian perspective. Asia-Pacific Journal of Public Health 23(2), 80S–90S.
CRC-REP Working Paper CW014
Ninti One Limited Impact of climate change on health and wellbeing in remote Australian communities: 51 a review of literature and scoping of adaptation options
Gomez-Baggethun E, Reyes-Garcia V, Olsson P and Montes C. 2012. Traditional ecological knowledge and community resilience to environmental extremes: a focal in Donana, SW Spain. Global Environmental Change 22(3), 640–650.
Gould R. 1991.Arid-land foraging as seen from Australia: adaptive models and behavioral realities. Oceania 62(1), 12–33.
Green D. 2006. Climate change and health: impacts on remote indigenous communities in northern Australia. CSIRO Marine and Atmospheric Research Paper 012, CSIRO. Aspendale, Victoria.
Green E, Blashki G, Berry H, Harley D, Horton G and Hall G. 2009a. Preparing Australian medical students for climate change. Australian Family Physician 38(9), 726–729.
Green D, Jackson S and Morrison J. 2009b. Risks from climate change to indigenous communities in the tropical north of Australia. Department of Climate Change and Energy Efficiency. Canberra.
Green D, Alexander L, McInner K, Church J, Nicholls N and White N. 2010. As assessment of climate change impacts and adaptation for the Torres Strait Islands, Australia. Climate Change 102, 405–433.
Green D, Niall S and Morrison J. 2012. Bridging the gap between theory and practice in climate change vulnerability assessments for remote Indigenous communities in northern Australia. Local environment: the international journal of justice and sustainability. iFirst Article: 1–21.
Habermehl M. 2007. Managing non-renewable groundwater resources. Science for decision makers. Bureau of Rural Sciences. Canberra.
Hallegate S. 2009. Strategies to adapt to an uncertain climate change. Global Environmental Change 19(2), 240–247.
Handmer J, McKellar R, McLennan B, Whittaker J, Towers B, Duggie J and Woolf M. 2012. National climate change adaptation research plan: emergency management – revised 2012 edition. National Climate Change Adaptation Research Facility. Gold Coast.
Hanigan I, Butler C, Kokic P and Hutchinson M. 2012. Suicide and drought in New South Wales, Australia, 1970–2007. Proceedings of the National Academy of Sciences of the United States of America 109(35), 13950–13955.
Hanna E, Kjellstrom T, Bennett C and Dear K. 2011. Climate change and rising heat: population health implications for working people in Australia. Asia-Pacific Journal of Public Health 23(2), 14S–26S.
Hanna E and Spickett J. 2011. Climate change and human health: building Australia’s adaptation capacity. Asia-Pacific Journal of Public Health 23(2), 7S–13S.
Harley D, Bi P, Hall G, Swaminathan A, Tong S and Williams C. 2011. Climate change and infectious diseases in Australia: future prospects, adaptation options and research priorities. Asia-Pacific Journal of Public Health 23(2), 54S–66S.
Haynes K, Bird DK, Carson D, Larkin S and Mason M. 2011. Institutional response and Indigenous experiences of Cyclone Tracy. National Climate Change Adaptation Research Facility. Gold Coast.
Hennessy K, Fitzharris B, Bates B, Harvey N, Howden S, Hughes L, Salinger J and Warrick R. 2007. Australia and New Zealand. Contribution of Working Group 2 to the Fourth Assessment Report of the Intergovernmental Panel on Climate Change. Climate change 2007: impacts, adaptation and vulnerability. (Eds) M Parry, O Canziani, J Palutikof, J van der Linden, C Hanson. pp. 507–540. Cambridge University Press, Cambridge.
Hetzel B. 2000 Historical perspectives on indigenous health in Australia. Asia Pacific Journal of Clinical Nutrition 9(3), 157–163.
Horne R. forthcoming. ‘Living change – adaptive housing response to climate change in the town camps of Alice Springs’. National Climate Change Adaptation Research Facility. Gold Coast.
CRC-REP Working Paper CW014
52 Impact of climate change on health and wellbeing in remote Australian communities: Ninti One Limited a review of literature and scoping of adaptation options
Horton G, Hanna L and Kelly B. 2010. Drought, drying and climate change: emerging health issues for ageing Australians in rural areas. Australasian Journal on Ageing 29(1), 2–7.
Howat P and Stoneham M. 2011. Why sustainable population growth is a key to climate change and public health equity. Health Promotion Journal of Australia 22(S1), S34–S38.
Howitt R, Havnen O and Veland S. 2012 Natural and unnatural disasters: responding with respect for indigenous rights and knowledges. Geographical Research 50(1), 47–59.
Hughes L. 2003. Climate change and Australia: trends, projections and impacts. Austral Ecology 28(4), 423–443.
Hunter E. 2010. Hearts and minds: Evolving understandings of chronic cardiovascular disease in Aboriginal and Torres Strait Islander populations. Australian Aboriginal Studies 2010(1), 74–91.
Hunter E, Gynther B, Anderson C, Onnie L, Nelson J, Hall W, Baune B and Groves A. 2012. Psychosis in indigenous populations of Cape York and the Torres Strait. Medical Journal of Australia 196(2), 133–135.
Hyatt O, Lemke B and Kjellstrom T. 2010. Regional maps of occupational heat exposure: past, present and potential future. Global Health Action 3, 5715.
IPCC (Intergovernmental Panel on Climate Change). 2007. Climate Change 2007: Synthesis Report. An Assessment of the Intergovernmental Panel on Climate Change. Intergovernmental Panel on Climate Change. (Eds.) A Allali, R Bojariu, S Diaz, I Elgizouli, D Griggs, D Hawkins, O Hohmeyer, B Jallow, L Kajfez-Bogataj, N Leary, H Lee and D Wratt. Fourth Assessment Report. Intergovernmental Panel on Climate Change. Geneva.
Jerry D. forthcoming. ‘Vulnerability of an iconic Australian finfish (Barramundi, Lates calcarifer) and related industries to altered climate across tropical Australia’. National Climate Change Adaptation Research Facility. Gold Coast.
Jones B, Keen M and Strand J. 2008. Paying for climate change. Finance and development 45(1),28–31.
Jones W, Cuteri C and Smith L. n.d.. Australian Socio-economic Geography – AUSEG. pp. 1–186.
Kainz T, Carson DA and Carson DB. 2012. Temporary indigenous mobility in remote South Australia: understanding the challenges for urban based health and social service delivery. Journal of Rural and Community Development 7(1), 16–35.
Kamp van I, Leidelmeijer K, Marsman G and de Hollander A. 2003. Urban environmental quality and human well-being: towards a conceptual framework and demarcation of concepts; a literature study. Landscape and Urban Planning 65(1–2), 5–18.
Kelly P and Adger W. 2000. Theory and practice in assessing vulnerability to climate change and facilitating adaptation. Climatic Change 47(4), 325–352.
Kimberley Aboriginal Health Plan Steering Committee. 1999. Kimberley Regional Aboriginal Health Plan. (Eds.) D Atkinson, C Bridge and D Gray. Office of Aboriginal Health, Department of Health. Perth.
King D, Ginger J, Williams S, Cottrell A, Gurtner Y, Leitch C, Henderson D, Jayasinghe N, Kim P, Booth K, Ewin C, Innes K, Jacobs K, Jago-Bassingthwaighte M, Jackson L. 2012. Planning, building and insuring: Adaptation of built environment to climate change induced increased intensity of natural hazards. National Climate Change Adaptation Research Facility. Gold Coast.
Kirono D, Kent D, Hennessy K and Mpelasoka F. 2011. Characteristics of Australian droughts under enhanced greenhouse conditions: results from 14 global climate models. Journal of Arid Environments 75(6), 566–575.

CRC-REP Working Paper CW014
Ninti One Limited Impact of climate change on health and wellbeing in remote Australian communities: 53 a review of literature and scoping of adaptation options
Krishnaswamy A, Simmons E and Joseph LN. 2012. Increasing the resilience of British Columbia’s rural communities to natural disturbances and climate change. BC Journal of Ecosystems and Management 13(1), 92–106.
Kruger E, Smith K, Atkinson D and Tennant M. 2008. The oral health status and treatment needs of indigenous adults in the Kimberley region of Western Australia. Australian Journal of Rural Health 16(5), 283–289.
Lam L. 2007. The association between climatic factors and childhood illness presented to hospital emergency among young children. International Journal of Environmental Health Research 17(1), 1–8.
Langton M, Parsons M, Leonard S, Auty K, Bell D, Burgess P and Edwards S. 2012. National climate change adaptation research plan for indigenous communities. National Climate Change Adaptation Research Facility. Gold Coast.
Lansingh V, Mukesh D, Keeffe J and Taylor H. 2010. Trachoma control in two Central Australian Aboriginal communities: a case study. International Ophthalmology 30(4), 367–375.
Larkin S and Bird D. forthcoming. ‘Future change in ancient worlds: Indigenous adaptation in northern Australia’. National Climate Change Adaptation Research Facility. Gold Coast.
Lea T and Pholeros T. 2010. This is not a pipe: the treacheries of indigenous housing. Public Culture 22(1), 187–209.
LoGuidice D, Smith K, Atkinson D, Dwyer A, Lautenschlager N, Almeida O and Flicker L. 2010. Preliminary evaluation of the prevalence of falls, pain and urinary incontinence in remote living indigenous Australians over the age of 45 years. Internal Medicine Journal 42(6), e102–e107.
Mak D, Johnson G and Plant A. 2004. A syphilis outbreak in remote Australia: epidemiology and strategies for control. Epidemiological Infections 132(5), 805–812.
Maller C and Strengers Y. 2011. Housing, heat stress and health in a changing climate: promoting the adaptive capacity of vulnerable householder, a suggested way forward. Health Promotion International 26(4), 492–498.
Mallon K, Hamilton E, Black M, Beem B, Abs J. 2013. Adapting the Community Sector for Climate Extremes. National Climate Change Adaptation Research Facility. Gold Coast.
Maru Y and Chewings V. 2008. How can we identify socio-regions in the rangelands of Australia? The Rangeland Journal 30(1), 45–53.
Maru Y, Chewings V and Sparrow A. 2012. Climate change adaptation, energy futures and carbon economies in remote Australia: a review of the current literature, research and policy. CRC-REP Working Paper CW005. Ninti One Limited. Alice Springs.
Mason M and Haynes K. 2010. Adaptation Lessons from Cyclone Tracy. National Climate Change Adaptation Research Facility. Gold Coast.
McHenry M. 2009. Why are remote Western Australians installing renewable energy technologies in stand-alone power supply systems? Renewable Energy 34(5), 1252–1256.
McMichael A. 2006. Population health as the ‘bottom line’ of sustainability: a contemporary challenge for public health researchers. European Journal of Public Health 16(6), 579–582.
McMichael A, Woodruff R, Whetton P, Hennessy K, Nicholls N, Hales S, Woodward A and Kjellstrom T. 2002. Human health and climate change in Oceania: a risk assessment. Australian Government. Canberra.
McMichael A, Woodruff R and Hales S. 2006. Climate change and human health: present and future risks. The Lancet 367(9513), 859–869.
CRC-REP Working Paper CW014
54 Impact of climate change on health and wellbeing in remote Australian communities: Ninti One Limited a review of literature and scoping of adaptation options
McNamara K and Westoby R. 2011. Solastalgia and the gendered nature of climate change: an example from Erub Island, Torres Strait. EcoHealth 8(2), 233–236.
McNamara K, Smithers S, Westoby R and Parnell K. 2012. Limits to climate change adaptation for two low-lying communities in the Torres Strait. National Climate Change Adaptation Research Facility. Gold Coast.
Memmott P. forthcoming. ‘Aboriginal responses to climate change in arid zone Australia – Regional understandings and capacity building for adaptation’. National Climate Change Adaptation Research Facility. Gold Coast.
Mercer. 2012. Mercer 2011 Quality of Living Survey Highlights – Defining ‘Quality of Living’. Available: http://www.mercer.com.au/articles/quality-of-living-survey-report-2011. Accessed October 15, 2012.
Mitchell J, Pearce R, Stevens M, Taylor J and Warchivker I. 2005. Indigenous Populations and Resource Flows in Central Australia: A Social and Economic Baseline Profile. DKCRC Research Report 05. Desert Knowledge CRC. Alice Springs.
Moser S. 2011. Adaptation, mitigation and their disharmonious discontents. Climatic Change. 111(2), 165–175.
Munoz E, Powers P, Nienhuys T and Mathews J. 1992. Social and environmental factors in 10 Aboriginal communities in the Northern Territory – relationship to hospital admissions of children. Medical Journal of Australia 156(8), 529–533.
NSW Department of Health. 2010. Closing the gap: 10 years of Housing for Health in NSW. An evaluation of a healthy housing intervention. Produced by the Aboriginal Environmental Health Unit. Sydney.
Nolan M. 2010 Adapting infrastructure for climate change impacts. Managing climate change: papers from the Greenhouse 2009 conference. pp. 197–203. (Eds.) I Jubb, P Holper and W Cai. CSIRO Publishing. Melbourne.
Nguyen O and Cairney S. 2013. Literature review of the interplay between education, employment, health and wellbeing for Aboriginal and Torres Strait Islander people in remote areas: working towards an Aboriginal and Torres Strait Islander wellbeing framework. CRC-REP Working Paper CW013. Ninti One Limited. Alice Springs.
O’Brien K, Eriksen S, Nygaard L and Schjolden A. 2007. Why different interpretations of vulnerability matter in climate change discourses. Climate Policy 7(1), 73–88.
Parsons M. 2012. ‘Climate change adaptation for Indigenous communities: an overview’. Presentation in Alice Springs, November 7. http://www.nccarf.edu.au/sites/default/files/attached_files_publications/CCA%20Indigenous%20Communities%20Overview.pdf.
Parsons M. forthcoming. ‘Learning from the past, adapting in the future – Identifying pathways to successful adaptation in Indigenous communities’. National Climate Change Adaptation Research Facility. Gold Coast.
Patrick R, Capetola T, Townsend M and Nuttman S. 2012. Health promotion and climate change: exploring the core competencies required for action. Health Promotion International 27(4), 475–485.
Pearce T, Ford J, Caron A and Kudlak B. 2012. Climate change adaptation planning in remote, resource-dependent communities: an Arctic example. Regional Environmental Change 12(4), 825–837.
Petheram L, Zander L, Campbell B, High C and Stacey N. 2010. ‘Strange changes’: Indigenous perspectives of climate change and adaptation in NE Arnhem Land (Australia). Global Environmental Change 20(4), 681–692.
CRC-REP Working Paper CW014
Ninti One Limited Impact of climate change on health and wellbeing in remote Australian communities: 55 a review of literature and scoping of adaptation options
Philips A. 2009. Health status differentials across rural and remote Australia. Australian Journal of Rural Health 17(1), 2–9.
Plaganyi E, Weeks S, Skewes T, Gibbs M, Poloczanska E, Norman-Lopez A, Blamey L, Soares M and Robinson W. 2011. Assessing the adequacy of current fisheries management under changing climate: a southern synopsis. ICES Journal of Marine Science 68(6), 1305–1317.
Rahman A, Keane J and Imteaz M. 2012. Rainwater harvesting in Greater Sydney: water savings, reliability and economic benefits. Resources Conservation and Recycling 61, 16–21.
Rehdanz K and Maddison D. 2005. Climate and happiness. Ecological Economics 52(1), 111–125.
Remond M, Ralph A, Brady S, Martin J, Tikoft E and Maguire G. 2010. Community-acquired pneumonia in the central desert and north-western tropics of Australia. Internal Medicine Journal 40(1), 37–44.
Roach S, Atkinson D, Waters A and Jefferies F. 2007. Primary health care in the Kimberley: Is the doctor shortage much bigger than we think? Australian Journal of Rural Health 15(6), 373–379.
Rousham E and Gracey M. 2002. Factors affecting birth weight of rural Australian Aborigines. Annals of Human Biology 29(4), 363–372.
SEWPaC (Department of Sustainability, Environment, Water, Population and Communities). 2011. State of the Environment 2011. Independent report to the Australian Government Minister for Sustainability, Environment, Water, Population and Communities. Canberra. Available: http://www.environment.gov.au/soe/2011/report/built-environment/2-1-livability.html.
Spickett J, Brown H and Katscherian D. 2008. Health impacts of climate change: adaptation strategies for Western Australia. WA Department of Health. Perth.
Spickett J, Brown H and Rumchev K. 2011. Climate change and air quality: the potential impact on health. Asia-Pacific Journal of Public Health 23(2), 37S–45S.
State of Victoria 2007. Climate change and health: an exploration of challenges for public health in Victoria. Victorian Government Department of Human Services. Melbourne.
Stafford Smith M. 2008. The ‘desert syndrome’ – causally linked factors that characterise outback Australia. The Rangeland Journal 30(1), 3–14.
Steenkamp M, Rumbold A, Kilder S, Bar-Zeev S, Kruske S, Dunbar T and Barclay L. 2012. Measuring what matters in delivering services to remote-dwelling Indigenous moths and infants in the Northern Territory, Australia. Australian Journal of Rural Health 20(4), 228–237.
Stewart M, Wang X and Nguyen M. 2011. Climate change impact and risks of concrete infrastructure deterioration. Engineering Structures 33(4), 1326–1337.
Tamirisa N. 2008. Climate change and the economy. Finance and development 45(1). http://www.imf.org/external/pubs/ft/fandd/2008/03/tamirisa.htm.
Taylor J. 2003. Aboriginal population profiles for development planning in the Northern East Kimberley. Research monograph no. 23. Centre for Aboriginal Economic Policy Research. Canberra.
Taylor J, Brown D and Bell M. 2006. Population Dynamics and Demographic Accounting in Arid and Savanna Australia: Methods, Issues and Outcomes. DKCRC Research Report 16. Desert Knowledge CRC. Alice Springs.
Taylor M and Philp M. 2010. Adapting to climate change – implications for transport infrastructure, transport systems and travel behaviour. Road and Transport Research 19(4), 66–79.
Taylor J. 2011. Contesting the future of Cape York Peninsula. Australian Geographer 42(1), 53–68.
The Economist. 2012. Liveability Ranking Report August 2011. Economist Intelligence Unit. Retrieved October 15, 2012. https://www.eiu.com/public/topical_report.aspx?campaignid=liveabilityAug2011.

CRC-REP Working Paper CW014
56 Impact of climate change on health and wellbeing in remote Australian communities: Ninti One Limited a review of literature and scoping of adaptation options
Tong S. forthcoming. ‘Projection of the impact of climate change on the transmission of Ross River virus disease’. National Climate Change Adaptation Research Facility. Gold Coast.
Travis W. 2010. Going to extremes: propositions on the social response to severe climate change. Climatic Change 98(2010), 1–19. http://sciencepolicy.colorado.edu/admin/publication_files/resource-2668-2010.03.pdf.
TSRA (Torres Strait Regional Authority). 2010. Torres Strait Climate Change Strategy 2010–2013. Report prepared by the Environmental Management Program, Torres Strait Regional Authority. Thursday Island.
Turner L, Connell D and Tong S. 2012. Exposure to hot and cold temperatures and ambulance attendances in Brisbane, Australia: a time-series study. BMJ Open 2(4), 1–8.
University of Adelaide. 2013. ARIA and accessibility. Australian Population and Migration Research Centre. University of Adelaide. Adelaide. http://www.adelaide.edu.au/apmrc/research/projects/category/aria.html
Veland S, Howitt R, Dominey-Howes D, Thomalla F and Houston D. 2013. Procedural vulnerability: understanding environmental change in a remote indigenous community. Global Environmental Change 23(1), 314–326.
Vincent K. 2007. Uncertainty in adaptive capacity and the importance of scale. Global Environmental Change, 17(2007), 12–24.
Walker B, Holling C, Carpenter S and Kinzig A. 2004. Resilience, adaptability and transformability in social-ecological systems. Ecology and Society 9(2), 5.
Wang X, Chen D and Ren Z. 2010. Assessment of climate change impact on residential building heating and cooling energy requirement in Australia. Building and Environment 45(7), 1663–1682.
Weir J. forthcoming. ‘Changes to country and culture, changes to climate – Strengthening institutions for Indigenous resilience and adaptation’. National Climate Change Adaptation Research Facility. Gold Coast.
Welch D. forthcoming. ‘Management implications of climate change impacts on fisheries resources of northern Australia’. National Climate Change Adaptation Research Facility. Gold Coast.
Woodruff R, Hales S, Butler S and McMichael A. 2005. Climate change health impacts in Australia: effects of dramatic CO2 emission reductions. National Centre for Epidemiology and Population Health. Canberra.
World Health Organization. 1948. Preamble to the Constitution of the World Health Organization as adopted by the International Health Conference. New York, 19–22 June, 1946; signed on 22 July 1946 by the representatives of 61 States (Official Records of the World Health Organization, no. 2, p. 100) and entered into force on 7 April 1948.
World Health Organization. 2003. Climate change and human health: risks and responses. Summary. NLM Classification: WA 30.
CRC-REP Working Paper CW014
Ninti One Limited Impact of climate change on health and wellbeing in remote Australian communities: 57 a review of literature and scoping of adaptation options
Appendix 1: Methodology
A1.1 Methodology
Peer reviewed literature was obtained via the database, Web of Knowledge. This database was searched at various times between 02/10/2012 and 02/12/2012. A total of 5441 ‘hits’ returned using the search terms shown in Table 9. The title, and then abstract, of each of these was read and assessed for relevance. Ninety-six were judged to be relevant, and were subsequently read.
Several peer reviewed journals were also targeted. For example, the Asia-Pacific Journal of Public Health was searched using the search term ‘climate change’. There were 76 hits, 7 of which were considered relevant.
The soft literature was also searched in a targeted manner. The titles of all reports published on the NCCARF website between 2009 and 2012 were viewed. Relevant reports were then reviewed in more detail. These included any reports relating to emergency management, health, Aboriginal and Torres Strait Islander affairs, settlement/infrastructure, primary industry and water.
Soft databases from collated collections hosted on organisational websites were also searched in a targeted manner. These databases included Australian Indigenous HealthInfoNet, Kimberley Aboriginal Medical Services Council and Climate Change Adaptation Research Network for Human Health: Network Library.
The Maru et al. (2012) report that preceded this literature review was reviewed in detail. The report’s bibliography was then used to identify other relevant publications. Relevant publications were largely those that included the words ‘adapt’ or ‘health’ in the title. Any paper that included a reference to the focal area was also considered to be relevant. Thirteen papers from the Maru et al. (2012) bibliography were not identified by the Web of Knowledge review but were considered to be relevant. These were located and reviewed, as were papers suggested by reviewers of the draft report.
Three relevant workshops that informed this literature were also attended. They were:
• Dr Leanne Webb (University of New South Wales), entitled Health impacts of climate change on indigenous Australians: an epidemiological approach, 8 October 2012
• Professor Tony Wong (CRC for Water Sensitive Cities), entitled Alice Springs Community Water Rules – Towards a Water Sensitive City?, 11 October 2012
• Dr Meg Parsons (NCCARF), entitled Climate change adaptation, Indigenous communities and concepts of social justice, 7 November 2012.
The peer reviewed and soft literature informed the predicted climate change impacts of Table 1, and the sensitivity indicators of Table 2. The relevance of the vulnerability indicators to the focal areas, shown in Table 6, was determined by cross-checking the indicator with the statistical data shown in Appendix 2. Where statistical data showed that a focal area had a population that was disproportionate in a relevant vulnerability indicator, that focal area was ‘ticked.’
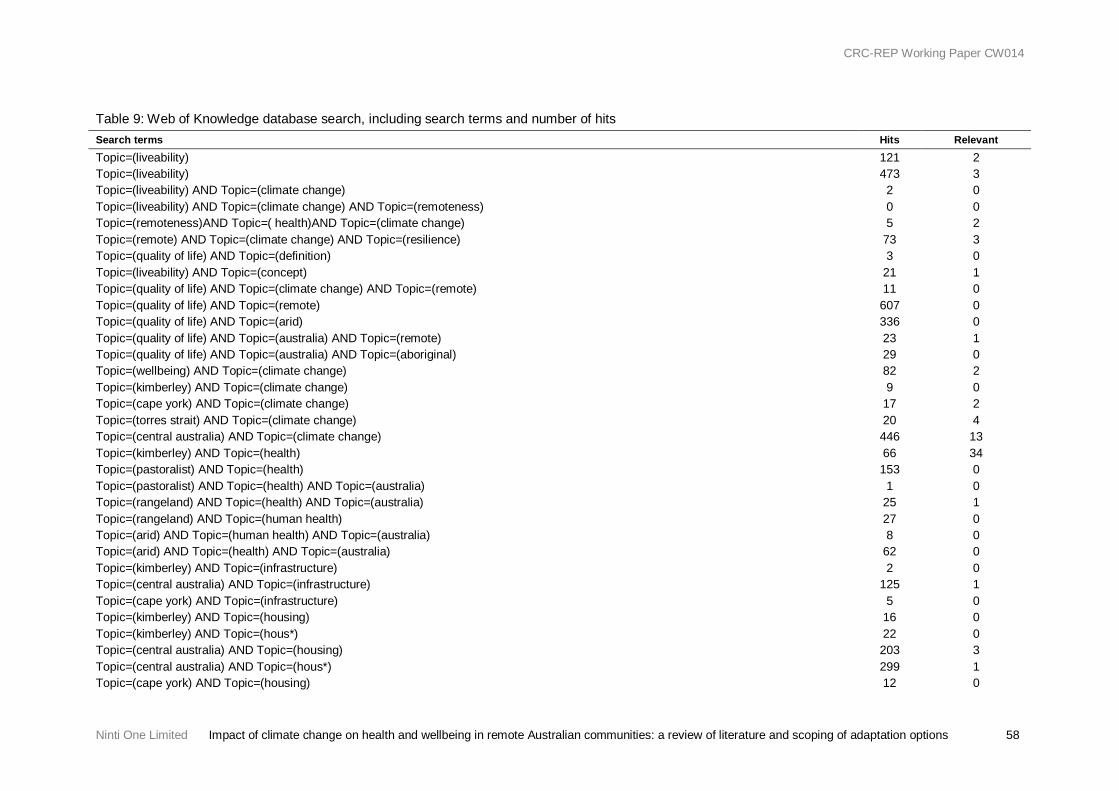
CRC-REP Working Paper CW014
Ninti One Limited Impact of climate change on health and wellbeing in remote Australian communities: a review of literature and scoping of adaptation options 58
Table 9: Web of Knowledge database search, including search terms and number of hits Search terms Hits Relevant Topic=(liveability) 121 2 Topic=(liveability) 473 3 Topic=(liveability) AND Topic=(climate change) 2 0 Topic=(liveability) AND Topic=(climate change) AND Topic=(remoteness) 0 0 Topic=(remoteness)AND Topic=( health)AND Topic=(climate change) 5 2 Topic=(remote) AND Topic=(climate change) AND Topic=(resilience) 73 3 Topic=(quality of life) AND Topic=(definition) 3 0 Topic=(liveability) AND Topic=(concept) 21 1 Topic=(quality of life) AND Topic=(climate change) AND Topic=(remote) 11 0 Topic=(quality of life) AND Topic=(remote) 607 0 Topic=(quality of life) AND Topic=(arid) 336 0 Topic=(quality of life) AND Topic=(australia) AND Topic=(remote) 23 1 Topic=(quality of life) AND Topic=(australia) AND Topic=(aboriginal) 29 0 Topic=(wellbeing) AND Topic=(climate change) 82 2 Topic=(kimberley) AND Topic=(climate change) 9 0 Topic=(cape york) AND Topic=(climate change) 17 2 Topic=(torres strait) AND Topic=(climate change) 20 4 Topic=(central australia) AND Topic=(climate change) 446 13 Topic=(kimberley) AND Topic=(health) 66 34 Topic=(pastoralist) AND Topic=(health) 153 0 Topic=(pastoralist) AND Topic=(health) AND Topic=(australia) 1 0 Topic=(rangeland) AND Topic=(health) AND Topic=(australia) 25 1 Topic=(rangeland) AND Topic=(human health) 27 0 Topic=(arid) AND Topic=(human health) AND Topic=(australia) 8 0 Topic=(arid) AND Topic=(health) AND Topic=(australia) 62 0 Topic=(kimberley) AND Topic=(infrastructure) 2 0 Topic=(central australia) AND Topic=(infrastructure) 125 1 Topic=(cape york) AND Topic=(infrastructure) 5 0 Topic=(kimberley) AND Topic=(housing) 16 0 Topic=(kimberley) AND Topic=(hous*) 22 0 Topic=(central australia) AND Topic=(housing) 203 3 Topic=(central australia) AND Topic=(hous*) 299 1 Topic=(cape york) AND Topic=(housing) 12 0

CRC-REP Working Paper CW014
Ninti One Limited Impact of climate change on health and wellbeing in remote Australian communities: a review of literature and scoping of adaptation options 59
Search terms Hits Relevant Topic=(cape york) AND Topic=(hous*) 16 0 Topic=(kimberley) AND Topic=(build*) 17 0 Topic=(cape york) AND Topic=(build*) 20 0 Topic=(central australia) AND Topic=(build*) 396 0 Topic=(remote) AND Topic=(infrastructure) AND Topic=(australia) 138 2 Topic=(remote)AND Topic=( infrastructure) AND Topic=(health) 95 2 Topic=(climate change) AND Topic=(infrastructure) AND Topic=(arid) 57 0 Topic=(climate change) AND Topic=(infrastructure) AND Topic=(australia) 142 8 Topic=(climate change) AND Topic=(adaptation) AND Topic=(remote) 141 2 Topic=(climate change) AND Topic=(ecological knowledge) AND Topic=(australia) 102 1 Topic=(remote) AND Topic=(socioeconomic) AND Topic=(climate change) 93 2 Topic=(climate) AND Topic=(aoriginal) AND Topic=(australia) 165 3 Topic=(remote) AND Topic=(infrastructure) AND Topic=(climate) 173 2 Topic=(arid) AND Topic=(infrastructure) AND Topic=(australia) 340 0 Topic=(climate) AND Topic=(housing) AND Topic=(australia) 242 1
Table 10: Summary of the ‘soft database’ search Organisation URL Other parameters Hits Relevant
hits Australian Indigenous HealthInfoNet http://www.healthinfonet.ecu.edu.a
u/key-resources/ Topic: ‘Rural and remote’ – all 202
8 3
Kimberley Aboriginal Medical Services Council (KAMSC) http://www.kamsc.org.au/ ‘Resources’ 1 1 Climate Change Adaptation Research Network for Human Health: Network Library http://climatehealthresearch.org/n
ode/435 - 180 11
All databases searched 02–04/10/2012
CRC-REP Working Paper CW014
60 Impact of climate change on health and wellbeing in remote Australian communities: Ninti One Limited a review of literature and scoping of adaptation options
A1.2 Assumptions, exclusions, risks and limitations
Liveability is a scaled concept (Chazal 2010). In this report, the term is mostly used at the scale of the household and immediate community, but at times increases in scale to include the vectors linking individual households and communities to the goods and services they provide, or are provided with, from other such households and communities. The temporal scale varies from a few days to the lifespan of an individual.
The report assumes ‘all being equal’. That is, that other socio-economic or biophysical changes unrelated to climate change, such as fuel prices, will not occur. This is a naïve but necessary assumption for the purposes of this paper and is, in part, why the paper argues for non-infrastructure–based adaptation options in the absence of viability modelling.
This report acknowledges that some ethnic groups may experience more indicators of vulnerability to climate change than others, but assumes this is more a product of a greater socio-economic context that may have little direct relationship to the cultural values and practices of the more vulnerable group. For example, while some Aboriginal and Torres Strait Islander people may prefer to live close to extended family for cultural reasons (Fien et al. 2011), few people choose to live with ten other people in a two bedroom house – they do so because of a lack of adequate and affordable housing (Kimberley Aboriginal Health Plan Steering Committee 1999; Taylor 2003). Similarly, there are culturally distinctive uses of domestic space, but this does not preclude the desire for functional health hardware such as flushable toilets (Lea and Pholeros 2010).
Cameron (2012) noted that vulnerability and adaptation assessments among Inuit in the Arctic risks perpetuating colonial perceptions of ‘local’ and ‘traditional’. Green et al. (2012) noted that some academics were concerned that a vulnerability assessment of Aboriginal and Torres Strait Islander people would reproduce a map of socio-economic disadvantage, despite the ability of some Aboriginal and Torres Strait Islander communities to, at times, better respond to climatic extremes than non-Aboriginal and Torres Strait Islander communities. Petheram et al. (2010) reported that East Arnhem people were concerned that climate change policy would trump efforts to improve rights by focusing on reductionist, externally conceived interventions. Labelling any one community as ‘vulnerable’ can also create a sense of powerlessness. Because of these reasons (and the ones stated above), this report prefers to stratify according to evidence-based indicators of vulnerability, rather than ethnicity. However, due to the population stratification techniques in much of the Australian health literature, data that stratify by ethnicity are still sometimes used and referenced accordingly. In some sense, this addresses critique by Green et al. (2012) of the ‘mainstreaming’ of Aboriginal and Torres Strait Islander vulnerability by showing that Australia’s generally high level of adaptive capacity is not true of all Australian populations.
Vulnerability assessments based on the use of indices and indicators have several limitations. Firstly, there are significant scaling issues associated with trying to capture a complex reality (Vincent 2007). The oversimplified or inaccurate representation of a condition or process is a risk (Vincent 2007). The averaging of populations masks variability. Sub-populations within each focal area will vary in their relative level of vulnerability. The coarse nature of climate modelling will mean that geographical areas within the case studies will experience different levels of exposure to climate change. Secondly, indicators like ‘low financial capacity’ are relative. For example, even if the focal areas have a lower financial capacity than mainstream Australia, it is unknown whether the relationship between financial capacity and vulnerability is linear, or whether thresholds exist. Thirdly, statistical data are not always available for key vulnerability indicators. In this report, surrogates have been used in some cases. It is also unknown under what contexts individual vulnerability indicators manifest, are masked, or interact. Lastly, this approach parallels the ‘top-down’ approach critiqued by Green et al.
CRC-REP Working Paper CW014
Ninti One Limited Impact of climate change on health and wellbeing in remote Australian communities: 61 a review of literature and scoping of adaptation options
(2012) for being reductionist, and for ignoring both the complex dynamics of socio-economic systems and the knowledge and concerns of affected populations.
Options for reducing the production of greenhouse gas emissions or the potential for carbon economies are not discussed in this report, and neither are potential changes in flora or fauna distribution or abundance, or changes in other ecological attributes, such as vegetation cover, that may have indirect effects on liveability.
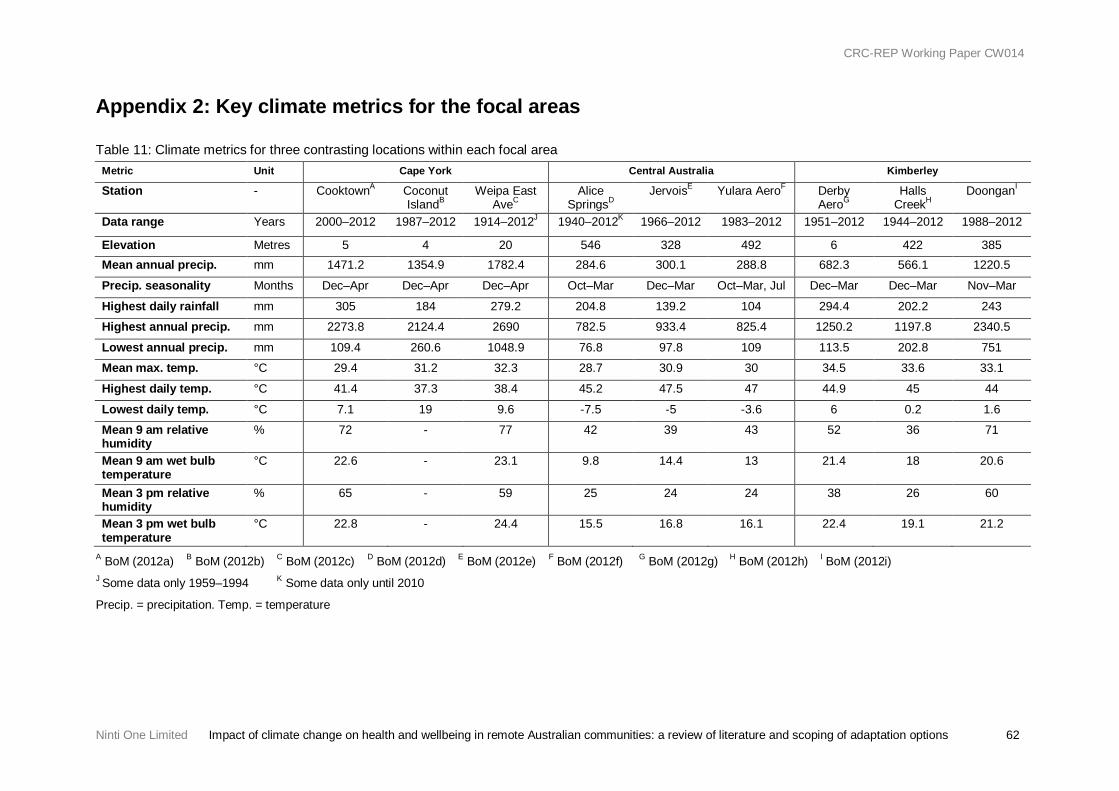
CRC-REP Working Paper CW014
Ninti One Limited Impact of climate change on health and wellbeing in remote Australian communities: a review of literature and scoping of adaptation options 62
Appendix 2: Key climate metrics for the focal areas
Table 11: Climate metrics for three contrasting locations within each focal area Metric Unit Cape York Central Australia Kimberley
Station - CooktownA Coconut IslandB
Weipa East AveC
Alice SpringsD
JervoisE Yulara AeroF Derby AeroG
Halls CreekH
DoonganI
Data range Years 2000–2012 1987–2012 1914–2012J 1940–2012K 1966–2012 1983–2012 1951–2012 1944–2012 1988–2012
Elevation Metres 5 4 20 546 328 492 6 422 385 Mean annual precip. mm 1471.2 1354.9 1782.4 284.6 300.1 288.8 682.3 566.1 1220.5
Precip. seasonality Months Dec–Apr Dec–Apr Dec–Apr Oct–Mar Dec–Mar Oct–Mar, Jul Dec–Mar Dec–Mar Nov–Mar
Highest daily rainfall mm 305 184 279.2 204.8 139.2 104 294.4 202.2 243
Highest annual precip. mm 2273.8 2124.4 2690 782.5 933.4 825.4 1250.2 1197.8 2340.5
Lowest annual precip. mm 109.4 260.6 1048.9 76.8 97.8 109 113.5 202.8 751
Mean max. temp. °C 29.4 31.2 32.3 28.7 30.9 30 34.5 33.6 33.1
Highest daily temp. °C 41.4 37.3 38.4 45.2 47.5 47 44.9 45 44
Lowest daily temp. °C 7.1 19 9.6 -7.5 -5 -3.6 6 0.2 1.6
Mean 9 am relative humidity
% 72 - 77 42 39 43 52 36 71
Mean 9 am wet bulb temperature
°C 22.6 -
23.1 9.8 14.4 13 21.4 18 20.6
Mean 3 pm relative humidity
% 65 - 59 25 24 24 38 26 60
Mean 3 pm wet bulb temperature
°C 22.8 - 24.4 15.5 16.8 16.1 22.4 19.1 21.2
A BoM (2012a) B BoM (2012b) C BoM (2012c) D BoM (2012d) E BoM (2012e) F BoM (2012f) G BoM (2012g) H BoM (2012h) I BoM (2012i)
J Some data only 1959–1994 K Some data only until 2010 Precip. = precipitation. Temp. = temperature
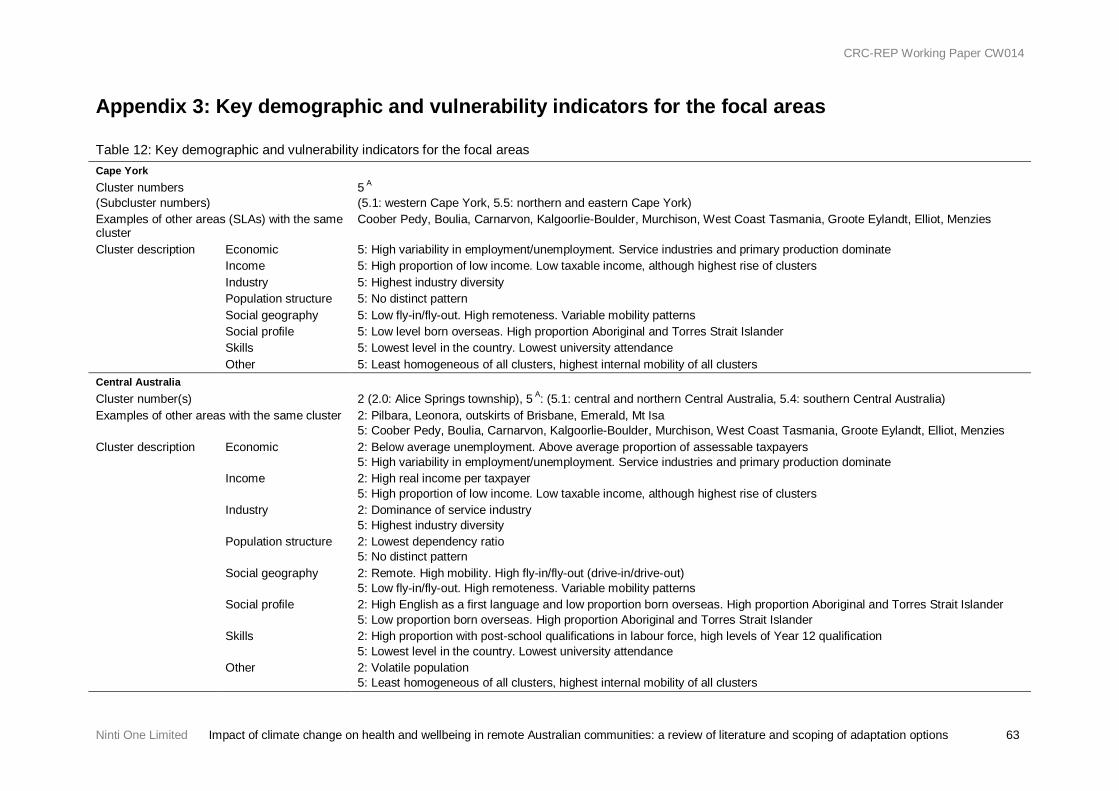
CRC-REP Working Paper CW014
Ninti One Limited Impact of climate change on health and wellbeing in remote Australian communities: a review of literature and scoping of adaptation options 63
Appendix 3: Key demographic and vulnerability indicators for the focal areas
Table 12: Key demographic and vulnerability indicators for the focal areas Cape York Cluster numbers (Subcluster numbers)
5 A (5.1: western Cape York, 5.5: northern and eastern Cape York)
Examples of other areas (SLAs) with the same cluster
Coober Pedy, Boulia, Carnarvon, Kalgoorlie-Boulder, Murchison, West Coast Tasmania, Groote Eylandt, Elliot, Menzies
Cluster description Economic 5: High variability in employment/unemployment. Service industries and primary production dominate Income 5: High proportion of low income. Low taxable income, although highest rise of clusters Industry 5: Highest industry diversity Population structure 5: No distinct pattern Social geography 5: Low fly-in/fly-out. High remoteness. Variable mobility patterns Social profile 5: Low level born overseas. High proportion Aboriginal and Torres Strait Islander Skills 5: Lowest level in the country. Lowest university attendance Other 5: Least homogeneous of all clusters, highest internal mobility of all clusters
Central Australia Cluster number(s) 2 (2.0: Alice Springs township), 5 A: (5.1: central and northern Central Australia, 5.4: southern Central Australia) Examples of other areas with the same cluster 2: Pilbara, Leonora, outskirts of Brisbane, Emerald, Mt Isa
5: Coober Pedy, Boulia, Carnarvon, Kalgoorlie-Boulder, Murchison, West Coast Tasmania, Groote Eylandt, Elliot, Menzies Cluster description Economic 2: Below average unemployment. Above average proportion of assessable taxpayers
5: High variability in employment/unemployment. Service industries and primary production dominate Income 2: High real income per taxpayer
5: High proportion of low income. Low taxable income, although highest rise of clusters Industry 2: Dominance of service industry
5: Highest industry diversity Population structure 2: Lowest dependency ratio
5: No distinct pattern Social geography 2: Remote. High mobility. High fly-in/fly-out (drive-in/drive-out)
5: Low fly-in/fly-out. High remoteness. Variable mobility patterns Social profile 2: High English as a first language and low proportion born overseas. High proportion Aboriginal and Torres Strait Islander
5: Low proportion born overseas. High proportion Aboriginal and Torres Strait Islander Skills 2: High proportion with post-school qualifications in labour force, high levels of Year 12 qualification
5: Lowest level in the country. Lowest university attendance Other 2: Volatile population
5: Least homogeneous of all clusters, highest internal mobility of all clusters
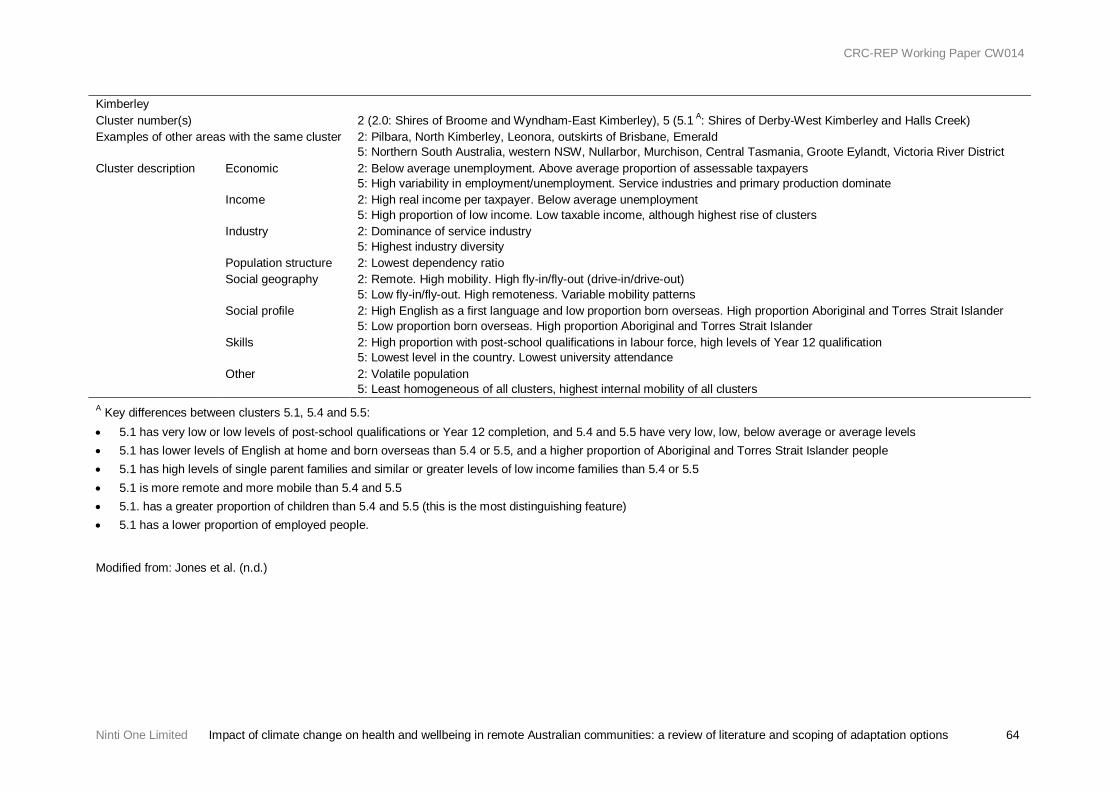
CRC-REP Working Paper CW014
Ninti One Limited Impact of climate change on health and wellbeing in remote Australian communities: a review of literature and scoping of adaptation options 64
Kimberley Cluster number(s) 2 (2.0: Shires of Broome and Wyndham-East Kimberley), 5 (5.1 A: Shires of Derby-West Kimberley and Halls Creek) Examples of other areas with the same cluster 2: Pilbara, North Kimberley, Leonora, outskirts of Brisbane, Emerald
5: Northern South Australia, western NSW, Nullarbor, Murchison, Central Tasmania, Groote Eylandt, Victoria River District Cluster description Economic 2: Below average unemployment. Above average proportion of assessable taxpayers
5: High variability in employment/unemployment. Service industries and primary production dominate Income 2: High real income per taxpayer. Below average unemployment
5: High proportion of low income. Low taxable income, although highest rise of clusters Industry 2: Dominance of service industry
5: Highest industry diversity Population structure 2: Lowest dependency ratio Social geography 2: Remote. High mobility. High fly-in/fly-out (drive-in/drive-out)
5: Low fly-in/fly-out. High remoteness. Variable mobility patterns Social profile 2: High English as a first language and low proportion born overseas. High proportion Aboriginal and Torres Strait Islander
5: Low proportion born overseas. High proportion Aboriginal and Torres Strait Islander Skills 2: High proportion with post-school qualifications in labour force, high levels of Year 12 qualification
5: Lowest level in the country. Lowest university attendance Other 2: Volatile population
5: Least homogeneous of all clusters, highest internal mobility of all clusters A Key differences between clusters 5.1, 5.4 and 5.5: • 5.1 has very low or low levels of post-school qualifications or Year 12 completion, and 5.4 and 5.5 have very low, low, below average or average levels • 5.1 has lower levels of English at home and born overseas than 5.4 or 5.5, and a higher proportion of Aboriginal and Torres Strait Islander people • 5.1 has high levels of single parent families and similar or greater levels of low income families than 5.4 or 5.5 • 5.1 is more remote and more mobile than 5.4 and 5.5 • 5.1. has a greater proportion of children than 5.4 and 5.5 (this is the most distinguishing feature) • 5.1 has a lower proportion of employed people.
Modified from: Jones et al. (n.d.)
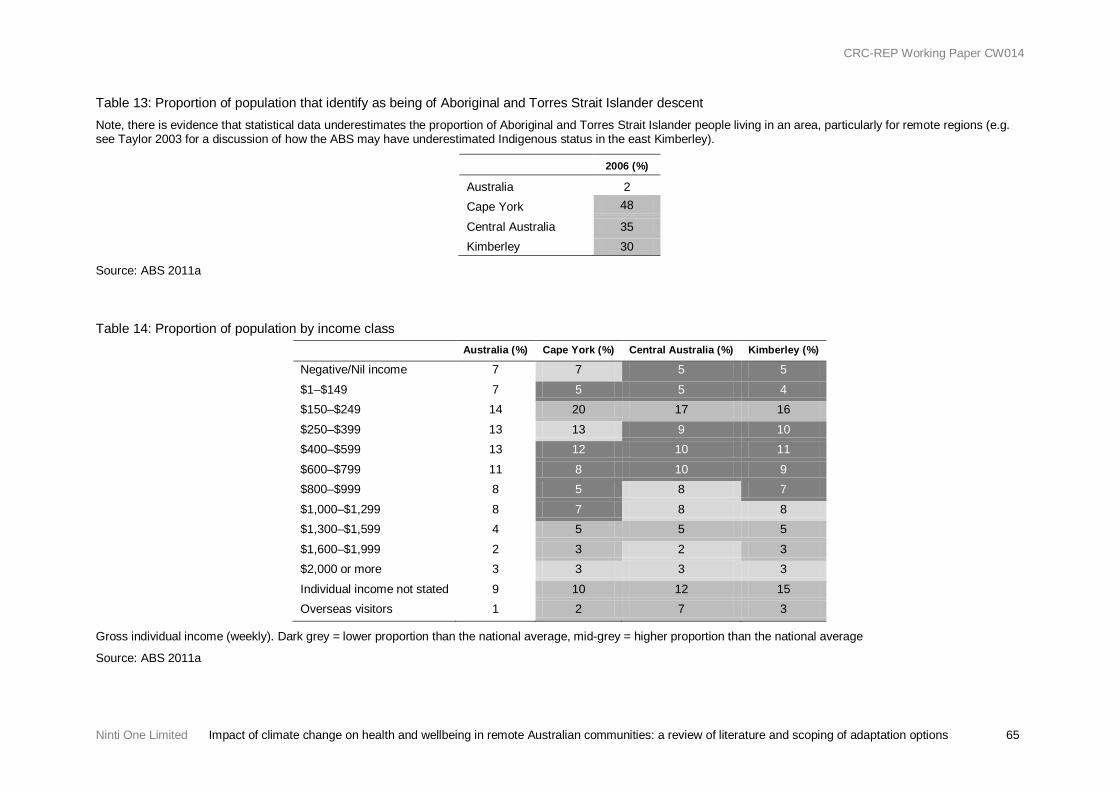
CRC-REP Working Paper CW014
Ninti One Limited Impact of climate change on health and wellbeing in remote Australian communities: a review of literature and scoping of adaptation options 65
Table 13: Proportion of population that identify as being of Aboriginal and Torres Strait Islander descent Note, there is evidence that statistical data underestimates the proportion of Aboriginal and Torres Strait Islander people living in an area, particularly for remote regions (e.g. see Taylor 2003 for a discussion of how the ABS may have underestimated Indigenous status in the east Kimberley).
2006 (%)
Australia 2 Cape York 48
Central Australia 35 Kimberley 30
Source: ABS 2011a
Table 14: Proportion of population by income class
Australia (%) Cape York (%) Central Australia (%) Kimberley (%)
Negative/Nil income 7 7 5 5 $1–$149 7 5 5 4 $150–$249 14 20 17 16 $250–$399 13 13 9 10 $400–$599 13 12 10 11 $600–$799 11 8 10 9 $800–$999 8 5 8 7 $1,000–$1,299 8 7 8 8 $1,300–$1,599 4 5 5 5 $1,600–$1,999 2 3 2 3 $2,000 or more 3 3 3 3 Individual income not stated 9 10 12 15 Overseas visitors 1 2 7 3
Gross individual income (weekly). Dark grey = lower proportion than the national average, mid-grey = higher proportion than the national average
Source: ABS 2011a
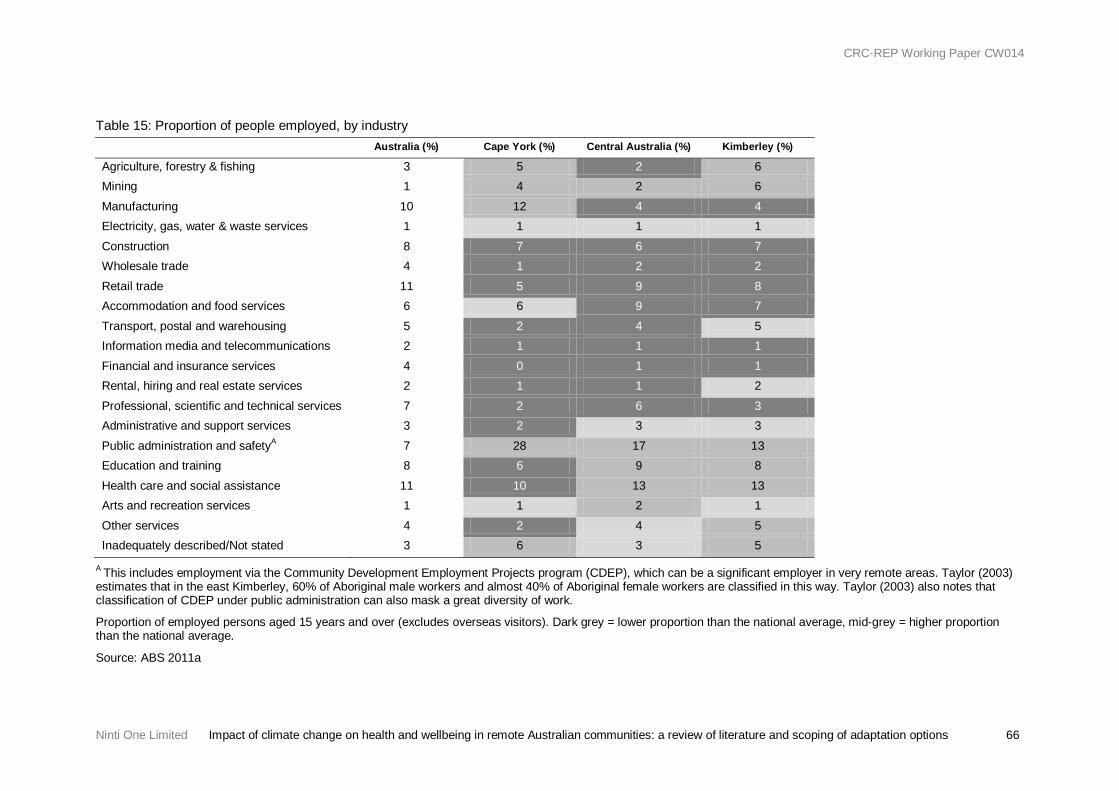
CRC-REP Working Paper CW014
Ninti One Limited Impact of climate change on health and wellbeing in remote Australian communities: a review of literature and scoping of adaptation options 66
Table 15: Proportion of people employed, by industry Australia (%) Cape York (%) Central Australia (%) Kimberley (%)
Agriculture, forestry & fishing 3 5 2 6 Mining 1 4 2 6 Manufacturing 10 12 4 4 Electricity, gas, water & waste services 1 1 1 1 Construction 8 7 6 7 Wholesale trade 4 1 2 2 Retail trade 11 5 9 8 Accommodation and food services 6 6 9 7 Transport, postal and warehousing 5 2 4 5 Information media and telecommunications 2 1 1 1 Financial and insurance services 4 0 1 1 Rental, hiring and real estate services 2 1 1 2 Professional, scientific and technical services 7 2 6 3 Administrative and support services 3 2 3 3 Public administration and safetyA 7 28 17 13 Education and training 8 6 9 8 Health care and social assistance 11 10 13 13 Arts and recreation services 1 1 2 1 Other services 4 2 4 5 Inadequately described/Not stated 3 6 3 5
A This includes employment via the Community Development Employment Projects program (CDEP), which can be a significant employer in very remote areas. Taylor (2003) estimates that in the east Kimberley, 60% of Aboriginal male workers and almost 40% of Aboriginal female workers are classified in this way. Taylor (2003) also notes that classification of CDEP under public administration can also mask a great diversity of work.
Proportion of employed persons aged 15 years and over (excludes overseas visitors). Dark grey = lower proportion than the national average, mid-grey = higher proportion than the national average.
Source: ABS 2011a
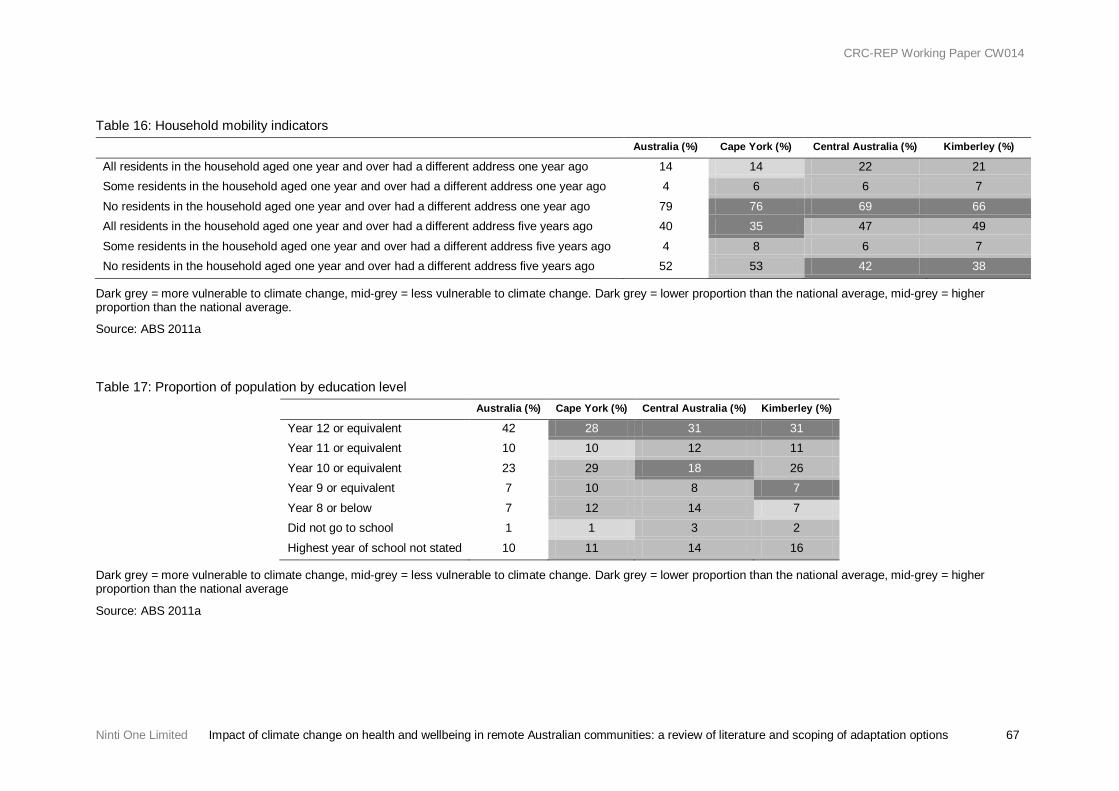
CRC-REP Working Paper CW014
Ninti One Limited Impact of climate change on health and wellbeing in remote Australian communities: a review of literature and scoping of adaptation options 67
Table 16: Household mobility indicators Australia (%) Cape York (%) Central Australia (%) Kimberley (%)
All residents in the household aged one year and over had a different address one year ago 14 14 22 21 Some residents in the household aged one year and over had a different address one year ago 4 6 6 7 No residents in the household aged one year and over had a different address one year ago 79 76 69 66 All residents in the household aged one year and over had a different address five years ago 40 35 47 49 Some residents in the household aged one year and over had a different address five years ago 4 8 6 7 No residents in the household aged one year and over had a different address five years ago 52 53 42 38
Dark grey = more vulnerable to climate change, mid-grey = less vulnerable to climate change. Dark grey = lower proportion than the national average, mid-grey = higher proportion than the national average.
Source: ABS 2011a
Table 17: Proportion of population by education level Australia (%) Cape York (%) Central Australia (%) Kimberley (%)
Year 12 or equivalent 42 28 31 31 Year 11 or equivalent 10 10 12 11 Year 10 or equivalent 23 29 18 26 Year 9 or equivalent 7 10 8 7 Year 8 or below 7 12 14 7 Did not go to school 1 1 3 2 Highest year of school not stated 10 11 14 16
Dark grey = more vulnerable to climate change, mid-grey = less vulnerable to climate change. Dark grey = lower proportion than the national average, mid-grey = higher proportion than the national average
Source: ABS 2011a

CRC-REP Working Paper CW014
68 Impact of climate change on health and wellbeing in remote Australian communities: Ninti One Limited a review of literature and scoping of adaptation options
Table 18: Percentage of population aged 65 years or over 2006 (%) 2007 (%) 2008 (%) 2009 (%) 2010 (%)
Australia 13 13.1 13.2 13.3 13.5 Cape York 11.8 12.3 12.5 12.9 13.4 Central Australia 4.5 4.8 5 5.3 5.5 Kimberley 4.7 4.6 4.7 4.8 4.9
Dark grey = lower proportion than the national average.
Source: ABS 2011a
Table 19: Percentage of population 0–14 years old 2006 (%) 2007 (%) 2008 (%) 2009 (%) 2010 (%)
Australia 19.6 19.4 19.2 19.1 18.9 Cape York 23.1 22.6 22.3 22 22 Central Australia 24 23.5 22.9 22.8 22.6 Kimberley 26 25.3 24.9 24.7 24.3
Mid-grey = higher proportion than the national average.
Source: ABS 2011a
CRC-REP Working Paper CW014
Ninti One Limited Impact of climate change on health and wellbeing in remote Australian communities: 69 a review of literature and scoping of adaptation options
Appendix 4: Key research projects and adaptation plans relevant to focal areas
A4.1 Cape York
Cape York in its entirety does not have a climate change adaptation plan. However, the Torres Strait Climate Strategy 2010–2012 (TSRA 2010) covers the Torres Strait Islands. The National Climate Change Adaptation Research Facility’s (hereafter NCCARF) research plans applicable to Cape York include the National Climate Change Adaptation Research Plan (hereafter NCCARP) for Primary Industries (Barlow et al. 2011), the NCCARP for Social, Economic and Institutional Dimensions (Barnett et al. 2011), the NCCARP for Emergency Management – Revised 2012 Edition (Handmer et al. 2012), and the NCCARP for Indigenous Communities (Langton et al. 2012). The NCCARF McNamara et al. (2012) publication Limits to adaptation for two low-lying communities in the Torres Strait is also of relevance.
There are 60 projects with financial input from NCCARF funded in Queensland (see www.nccarf.edu.au). Not all of these are directly relevant to Cape York. A search of project abstracts using the terms ‘cape york’ and ‘torres strait’, plus other ongoing or recently completed research projects sponsored by NCCARF that are directly related to vulnerable populations in Cape York or expected changes in exposure, are titled as follows7:
• Recovery from disaster experience: its effect on perceptions of climate change risk and on adaptive behaviours to prevent, prepare and response to future climate contingencies (Boon et al. 2013)
• ‘Projection of the impact of climate change on the transmission of Ross River virus disease’ (Tong, forthcoming)
• ‘Vulnerability of an iconic Australian finfish (Barramundi, Lates calcarifer) and related industries to altered climate across tropical Australia’ (Jerry, forthcoming)
• ‘Management implications of climate change impacts on fisheries resources of northern Australia’ (Welch, forthcoming)
• ‘Changes to country and culture, changes to climate – Strengthening institutions for Indigenous resilience and adaptation’ (Weir, forthcoming)
• Adaptation of the built environment to climate change-induced increased intensity of natural hazards (King et al. 2012)
• Adaptation lessons from Cyclone Tracy (Mason and Haynes 2010) • The institutional response and Indigenous experience of Cyclone Tracy (Haynes et al. 2011) • ‘Learning from the past, adapting in the future – Identifying pathways to successful adaptation in
Indigenous communities’ (Parsons, forthcoming) • Adapting the community sector for climate extremes (Mallon et al. 2013) • Benefits and costs of provision of post-cyclone emergency services (Dobes et al. 2012).
7 NCCARF search engine was used to view all project synopses located in Queensland (for Cape York), Western Australia (for the Kimberley) and the Northern Territory (for Central Australia). Other NCCARF research projects may also be of relevance to Cape York, but this relevance is not as direct (e.g. research on national governance issues for climate change are not included here).
CRC-REP Working Paper CW014
70 Impact of climate change on health and wellbeing in remote Australian communities: Ninti One Limited a review of literature and scoping of adaptation options
A4.2 Central Australia
Central Australia is not specifically covered by a climate change adaptation plan. Neither is the Northern Territory government likely to produce a Territory-wide plan given its current policy platform and recent disbanding of the Energy Policy and Climate Change Unit within the environment department (ABC 2012). NCCARF research plans most applicable to Central Australia include the NCCARP for Primary Industries (Barlow et al. 2011), the NCCARP for Social, Economic and Institutional Dimensions (Barnett et al. 2011), the NCCARP for Emergency Management – Revised 2012 Edition (Handmer et al. 2012), and the NCCARP for Indigenous Communities (Langton et al. 2012).
There are a number of NCCARF projects funded in the Northern Territory, or relating to the Northern Territory (see www.nccarf.edu.au). Not all of these are directly relevant to Central Australia. A search of all project abstracts for the Northern Territory, plus other ongoing or recently completed research projects sponsored by NCCARF that are directly related to vulnerable populations or key exposure types in Central Australia, are titled as follows8:
• ‘Aboriginal responses to climate change in arid zone Australia – Regional understandings and capacity building for adaptation’ (Memmott forthcoming)
• ‘Changes to country and culture, changes to climate – Strengthening institutions for Indigenous resilience and adaptation’ (Weir, forthcoming)
• Adaptation of the built environment to climate change-induced increased intensity of natural hazards (King et al. 2012)
• Adapting the community sector for climate extremes (Mallon et al. 2013) • Benefits and costs of provision of post-cyclone emergency services (Dobes et al. 2012) • ‘Future change in ancient worlds: Indigenous adaptation in northern Australia’ (Larkin and Bird,
forthcoming) • The institutional response and Indigenous experience of Cyclone Tracy (Haynes et al. 2011) • ‘Living change – adaptive housing response to climate change in the town camps of Alice
Springs’ (Horne, forthcoming) • ‘Learning from the past, adapting in the future – Identifying pathways to successful adaptation in
Indigenous communities’ (Parsons, forthcoming).
8 NCCARF search engine was used to view all project synopses located in Queensland (for Cape York), Western Australia (for the Kimberley) and the Northern Territory (for Central Australia). Other NCCARF research projects may also be of relevance to Cape York, but this relevance is not as direct (e.g. research on national governance issues for climate change are not included here).

CRC-REP Working Paper CW014
Ninti One Limited Impact of climate change on health and wellbeing in remote Australian communities: 71 a review of literature and scoping of adaptation options
A4.3 Kimberley
The Kimberley does not have a specific climate change adaptation plan, but the Western Australian government’s Health impacts of climate change: adaptation strategies for Western Australia (Spickett et al. 2008) is directly relevant to the Kimberley. Other NCCARF research plans applicable to the Kimberley include the NCCARP for Primary Industries (Barlow et al. 2011), the NCCARP for Social, Economic and Institutional Dimensions (Barnett et al. 2011), the NCCARP for Emergency Management – Revised 2012 Edition (Handmer et al. 2012), and the NCCARP for Indigenous Communities (Langton et al. 2012).
There are a number of NCCARF projects funded in Western Australia, or relating to Western Australia (see www.nccarf.edu.au). Most are not directly relevant to the Kimberley. A search of all project abstracts for Western Australia, plus other ongoing or recently completed research projects sponsored by NCCARF that are directly related to vulnerable populations or key exposure types in the Kimberley, are titled as follows9:
• ‘Management implications of climate change impacts on fisheries resources of northern Australia’ (Welch, forthcoming)
• ‘Changes to country and culture, changes to climate – Strengthening institutions for Indigenous resilience and adaptation’ (Weir, forthcoming)
• Adaptation of the built environment to climate change-induced increased intensity of natural hazards (King et al. 2012)
• Adapting the community sector for climate extremes (Mallon et al. 2013) • Benefits and costs of provision of post-cyclone emergency services (Dobes et al. 2012) • Adaptation lessons from Cyclone Tracy (Mason and Haynes 2010) • The institutional response and Indigenous experience of Cyclone Tracy (Haynes et al. 2011) • ‘Living change – adaptive housing response to climate change in the town camps of Alice
Springs’ (Horne, forthcoming) • ‘Learning from the past, adapting in the future – Identifying pathways to successful adaptation in
Indigenous communities’ (Parsons, forthcoming).
9 The NCCARF search engine was used to view all project synopses located in Queensland (for Cape York), Western Australia (for the Kimberley) and the Northern Territory (for Central Australia). Other NCCARF research projects may also be of relevance to the Kimberley, but this relevance is not as direct (e.g. research on national governance issues for climate change are not included here).