Embed Size (px)
Citation preview
I N S T I T U T E F O R D E F E N S E A N A L Y S E S
Impact of Conditions which Affect Exploratory Factor Analysis
Heather Wojton, Project Leader
Kevin Krost
Daniel J. Porter Stephanie T. Lane Heather M. Wojton
April 2019 Approved for public release. Distribution
is unlimited.
IDA Document NS D-10622
Log: H 2019-000204
INSTITUTE FOR DEFENSE ANALYSES 4850 Mark Center Drive
Alexandria, Virginia 22311-1882
About This Publication This work was conducted by the Institute for Defense Analyses (IDA) under contract HQ0034-14-D-0001, Task Nos. BD-9-229990, “Test Science Applications,” C9087, “T&E Knowledge Exchange,” and C9082, “Statistics and Science Data Working Group,” for the Office of the Director, Operational Test and Evaluation. The views, opinions, and findings should not be construed as representing the official position of either the Department of Defense or the sponsoring organization.
For more information: Heather Wojton, Project Leader [email protected] • (703) 845-6811
Robert R. Soule, Director, Operational Evaluation Division [email protected] • (703) 845-2482
Copyright Notice © 2019 Institute for Defense Analyses
4850 Mark Center Drive, Alexandria, Virginia 22311-1882 • (703) 845-2000.
This material may be reproduced by or for the U.S. Government pursuant to the copyright license under the clause at DFARS 252.227-7013 (a)(16) [Jun 2013].
I N S T I T U T E F O R D E F E N S E A N A L Y S E S
IDA Document NS D-10622
Impact of Conditions which Affect Exploratory Factor Analysis
Heather Wojton, Project Leader
Kevin Krost Daniel J. Porter
Stephanie T. Lane Heather M. Wojton

i
Executive Summary
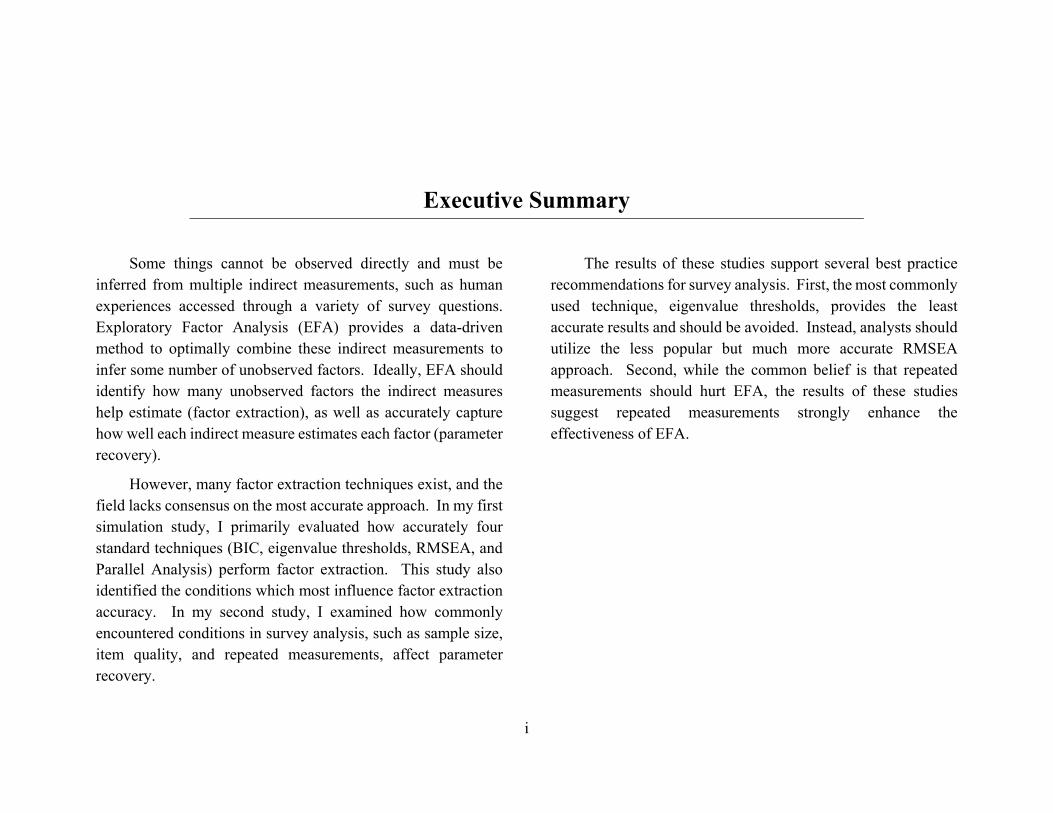
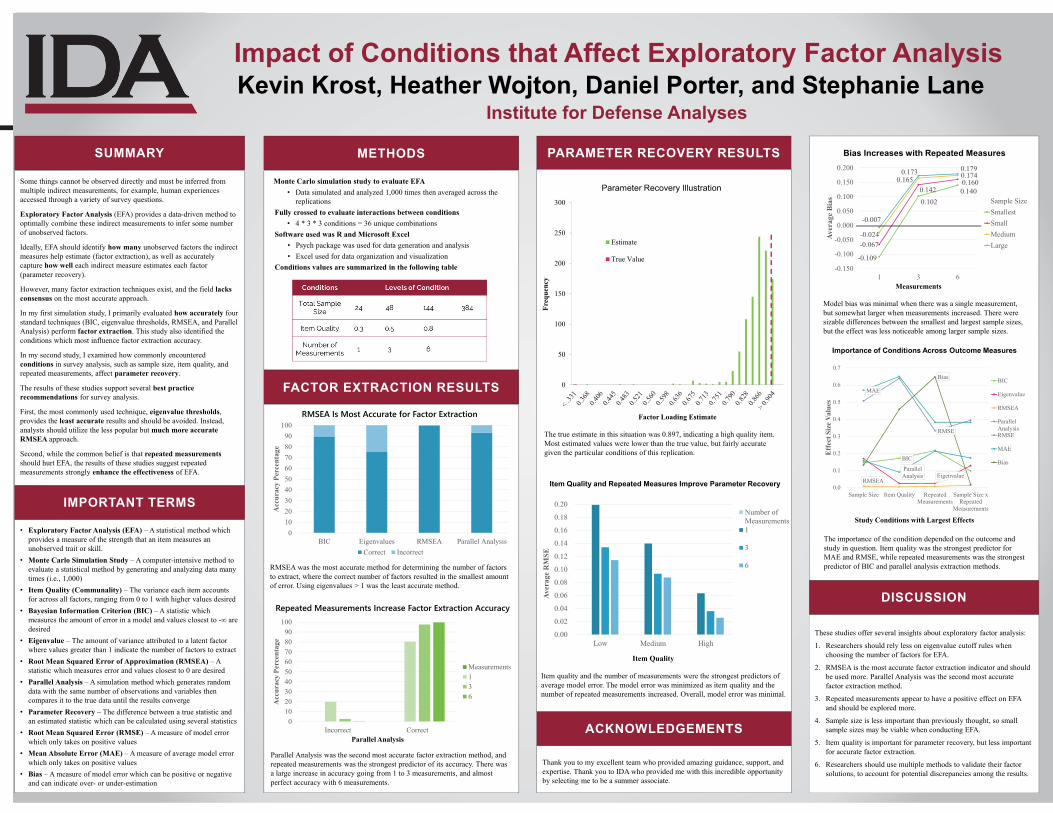
Some things cannot be observed directly and must be inferred from multiple indirect measurements, such as human experiences accessed through a variety of survey questions. Exploratory Factor Analysis (EFA) provides a data-driven method to optimally combine these indirect measurements to infer some number of unobserved factors. Ideally, EFA should identify how many unobserved factors the indirect measures help estimate (factor extraction), as well as accurately capture how well each indirect measure estimates each factor (parameter recovery).
However, many factor extraction techniques exist, and the field lacks consensus on the most accurate approach. In my first simulation study, I primarily evaluated how accurately four standard techniques (BIC, eigenvalue thresholds, RMSEA, and Parallel Analysis) perform factor extraction. This study also identified the conditions which most influence factor extraction accuracy. In my second study, I examined how commonly encountered conditions in survey analysis, such as sample size, item quality, and repeated measurements, affect parameter recovery.
The results of these studies support several best practice recommendations for survey analysis. First, the most commonly used technique, eigenvalue thresholds, provides the least accurate results and should be avoided. Instead, analysts should utilize the less popular but much more accurate RMSEA approach. Second, while the common belief is that repeated measurements should hurt EFA, the results of these studies suggest repeated measurements strongly enhance the effectiveness of EFA.

RESEARCH POSTER PRESENTATION DESIGN © 2012
www.PosterPresentations.com
Monte Carlo simulation study to evaluate EFA• Data simulated and analyzed 1,000 times then averaged across the
replicationsFully crossed to evaluate interactions between conditions
• 4 * 3 * 3 conditions = 36 unique combinationsSoftware used was R and Microsoft Excel
• Psych package was used for data generation and analysis• Excel used for data organization and visualization
Conditions values are summarized in the following table
Some things cannot be observed directly and must be inferred from multiple indirect measurements, for example, human experiences accessed through a variety of survey questions.
Exploratory Factor Analysis (EFA) provides a data-driven method to optimally combine these indirect measurements to infer some number of unobserved factors.
Ideally, EFA should identify how many unobserved factors the indirect measures help estimate (factor extraction), as well as accurately capture how well each indirect measure estimates each factor (parameter recovery).
However, many factor extraction techniques exist, and the field lacks consensus on the most accurate approach.
In my first simulation study, I primarily evaluated how accurately four standard techniques (BIC, eigenvalue thresholds, RMSEA, and Parallel Analysis) perform factor extraction. This study also identified the conditions which most influence factor extraction accuracy.
In my second study, I examined how commonly encountered conditions in survey analysis, such as sample size, item quality, and repeated measurements, affect parameter recovery.
The results of these studies support several best practice recommendations for survey analysis.
First, the most commonly used technique, eigenvalue thresholds, provides the least accurate results and should be avoided. Instead, analysts should utilize the less popular but much more accurate RMSEA approach.
Second, while the common belief is that repeated measurementsshould hurt EFA, the results of these studies suggest repeated measurements strongly enhance the effectiveness of EFA.
These studies offer several insights about exploratory factor analysis:
1. Researchers should rely less on eigenvalue cutoff rules when choosing the number of factors for EFA.
2. RMSEA is the most accurate factor extraction indicator and should be used more. Parallel Analysis was the second most accurate factor extraction method.
3. Repeated measurements appear to have a positive effect on EFA and should be explored more.
4. Sample size is less important than previously thought, so small sample sizes may be viable when conducting EFA.
5. Item quality is important for parameter recovery, but less important for accurate factor extraction.
6. Researchers should use multiple methods to validate their factor solutions, to account for potential discrepancies among the results.
Thank you to my excellent team who provided amazing guidance, support, and expertise. Thank you to IDA who provided me with this incredible opportunity by selecting me to be a summer associate.
• Exploratory Factor Analysis (EFA) – A statistical method which provides a measure of the strength that an item measures an unobserved trait or skill.
• Monte Carlo Simulation Study – A computer-intensive method to evaluate a statistical method by generating and analyzing data many times (i.e., 1,000)
• Item Quality (Communality) – The variance each item accounts for across all factors, ranging from 0 to 1 with higher values desired
• Bayesian Information Criterion (BIC) – A statistic which measures the amount of error in a model and values closest to -∞ are desired
• Eigenvalue – The amount of variance attributed to a latent factor where values greater than 1 indicate the number of factors to extract
• Root Mean Squared Error of Approximation (RMSEA) – A statistic which measures error and values closest to 0 are desired
• Parallel Analysis – A simulation method which generates random data with the same number of observations and variables then compares it to the true data until the results converge
• Parameter Recovery – The difference between a true statistic and an estimated statistic which can be calculated using several statistics
• Root Mean Squared Error (RMSE) – A measure of model error which only takes on positive values
• Mean Absolute Error (MAE) – A measure of average model error which only takes on positive values
• Bias – A measure of model error which can be positive or negative and can indicate over- or under-estimation
Kevin Krost, Heather Wojton, Daniel Porter, and Stephanie LaneImpact of Conditions that Affect Exploratory Factor Analysis
Institute for Defense Analyses
BIC
EigenvalueRMSEA
ParallelAnalysis
RMSE
MAE
Bias
0.0
0.1
0.2
0.3
0.4
0.5
0.6
0.7
Sample Size Item Quality RepeatedMeasurements
Sample Size xRepeated
Measurements
Effe
ct S
ize V
alue
s
Study Conditions with Largest Effects
BIC
Eigenvalue
RMSEA
ParallelAnalysisRMSE
MAE
Bias
Importance of Conditions Across Outcome Measures
0102030405060708090
100
BIC Eigenvalues RMSEA Parallel Analysis
Acc
urac
y Pe
rcen
tage
RMSEA Is Most Accurate for Factor Extraction
Correct Incorrect
RMSEA was the most accurate method for determining the number of factors to extract, where the correct number of factors resulted in the smallest amount of error. Using eigenvalues > 1 was the least accurate method.
0102030405060708090
100
Incorrect Correct
Acc
urac
y Pe
rcen
tage
Parallel Analysis
Measurements136
Repeated Measurements Increase Factor Extraction Accuracy
Parallel Analysis was the second most accurate factor extraction method, and repeated measurements was the strongest predictor of its accuracy. There was a large increase in accuracy going from 1 to 3 measurements, and almost perfect accuracy with 6 measurements.
0
50
100
150
200
250
300
Freq
uenc
y
Factor Loading Estimate
Parameter Recovery Illustration
Estimate
True Value
The true estimate in this situation was 0.897, indicating a high quality item. Most estimated values were lower than the true value, but fairly accurate given the particular conditions of this replication.
0.00
0.02
0.04
0.06
0.08
0.10
0.12
0.14
0.16
0.18
0.20
Low Medium High
Aver
age
RM
SE
Item Quality
Number ofMeasurements1
3
6
Item Quality and Repeated Measures Improve Parameter Recovery
Item quality and the number of measurements were the strongest predictors of average model error. The model error was minimized as item quality and the number of repeated measurements increased. Overall, model error was minimal.
-0.109
0.1020.140
-0.067
0.1420.160
-0.024
0.165 0.174
-0.007
0.173 0.179
-0.150
-0.100
-0.050
0.000
0.050
0.100
0.150
0.200
1 3 6
Aver
age
Bias
Measurements
Sample SizeSmallestSmallMediumLarge
Bias Increases with Repeated Measures
Model bias was minimal when there was a single measurement, but somewhat larger when measurements increased. There were sizable differences between the smallest and largest sample sizes, but the effect was less noticeable among larger sample sizes.
The importance of the condition depended on the outcome and study in question. Item quality was the strongest predictor for MAE and RMSE, while repeated measurements was the strongest predictor of BIC and parallel analysis extraction methods.
SUMMARY METHODS
IMPORTANT TERMS
FACTOR EXTRACTION RESULTS
PARAMETER RECOVERY RESULTS
DISCUSSION
ACKNOWLEDGEMENTS

REPORT DOCUMENTATION PAGE
Standard Form 298 (Rev. 8/98) Prescribed by ANSI Std. Z39.18
Form Approved OMB No. 0704-0188
The public reporting burden for this collection of information is estimated to average 1 hour per response, including the time for reviewing instructions, searching existing data sources, gathering and maintaining the data needed, and completing and reviewing the collection of information. Send comments regarding this burden estimate or any other aspect of this collection of information, including suggestions for reducing the burden, to Department of Defense, Washington Headquarters Services, Directorate for Information Operations and Reports (0704-0188), 1215 Jefferson Davis Highway, Suite 1204, Arlington, VA 22202-4302. Respondents should be aware that notwithstanding any other provision of law, no person shall be subject to any penalty for failing to comply with a collection of information if it does not display a currently valid OMB control number. PLEASE DO NOT RETURN YOUR FORM TO THE ABOVE ADDRESS.
1. REPORT DATE (DD-MM-YYYY) 2. REPORT TYPE 3. DATES COVERED (From - To)
4. TITLE AND SUBTITLE 5a. CONTRACT NUMBER
5b. GRANT NUMBER
5c. PROGRAM ELEMENT NUMBER
5d. PROJECT NUMBER
5e. TASK NUMBER
5f. WORK UNIT NUMBER
6. AUTHOR(S)
7. PERFORMING ORGANIZATION NAME(S) AND ADDRESS(ES) 8. PERFORMING ORGANIZATION REPORT NUMBER
10. SPONSOR/MONITOR'S ACRONYM(S)
11. SPONSOR/MONITOR'S REPORT NUMBER(S)
9. SPONSORING/MONITORING AGENCY NAME(S) AND ADDRESS(ES)
12. DISTRIBUTION/AVAILABILITY STATEMENT
13. SUPPLEMENTARY NOTES
14. ABSTRACT
15. SUBJECT TERMS
16. SECURITY CLASSIFICATION OF:a. REPORT b. ABSTRACT c. THIS PAGE
17. LIMITATION OF ABSTRACT
18. NUMBER OF PAGES
19a. NAME OF RESPONSIBLE PERSON
19b. TELEPHONE NUMBER (Include area code)