Embed Size (px)
Citation preview

Impact of Cover Crops Impact of Cover Crops on Soil Physical on Soil Physical
PropertiesProperties
Impact of Cover Crops Impact of Cover Crops on Soil Physical on Soil Physical
PropertiesProperties
Newell R. KitchenNewell R. KitchenMatt VolkmannMatt Volkmann
Newell R. KitchenNewell R. KitchenMatt VolkmannMatt Volkmann
October 21, 2009October 21, 2009October 21, 2009October 21, 2009

Why do we do cover Why do we do cover crops?crops?

Cover: blanket, canopy, cloak, hood, layer, shield, overlay, veil, cap

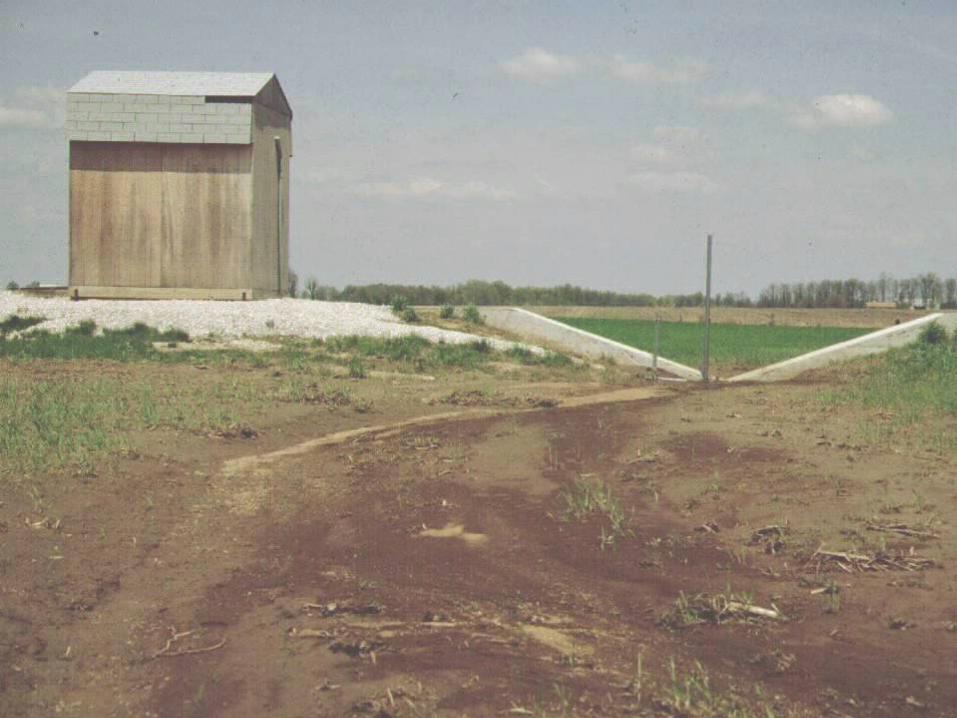
On May 1, 1917 in Columbia, MO the first
erosion plot research in the US was initiated.
WHY Columbia?
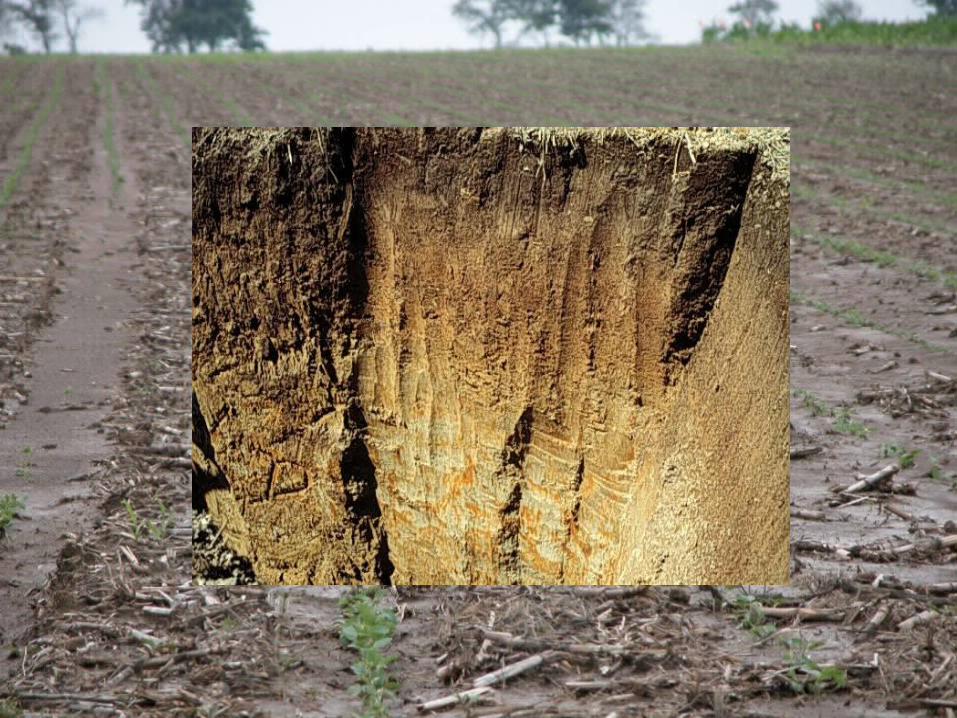

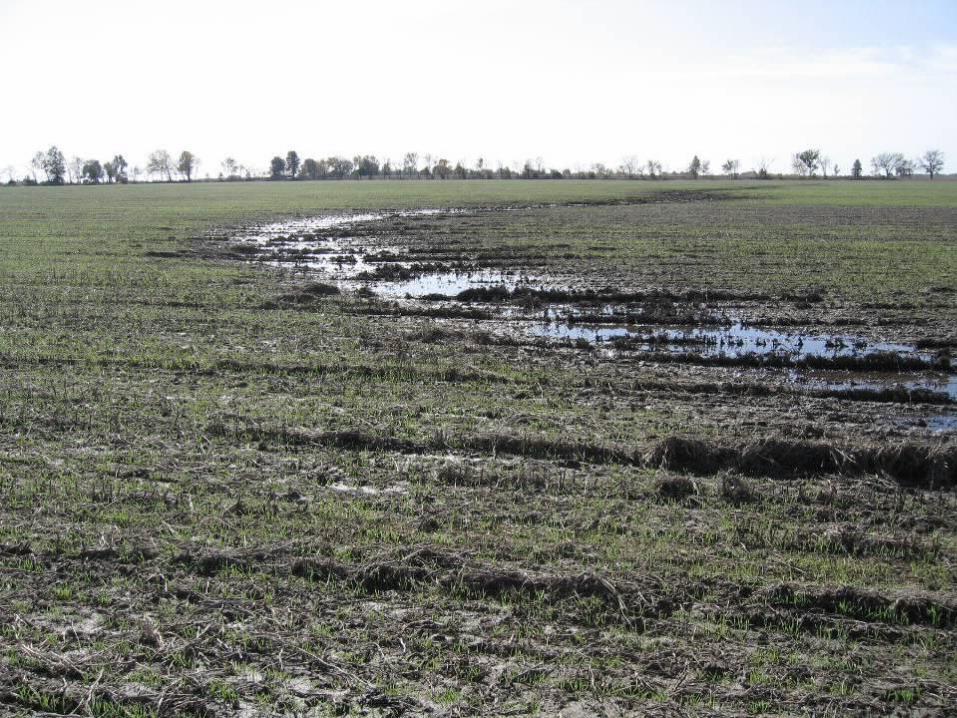
Historical Loss of Soil from Historical Loss of Soil from ErosionErosion
• Average 5 inches of soil loss over the whole field • Extreme Loss > 16 inches of soil loss in localized areas• Over 150 years…. between 5 and 6 tons/year
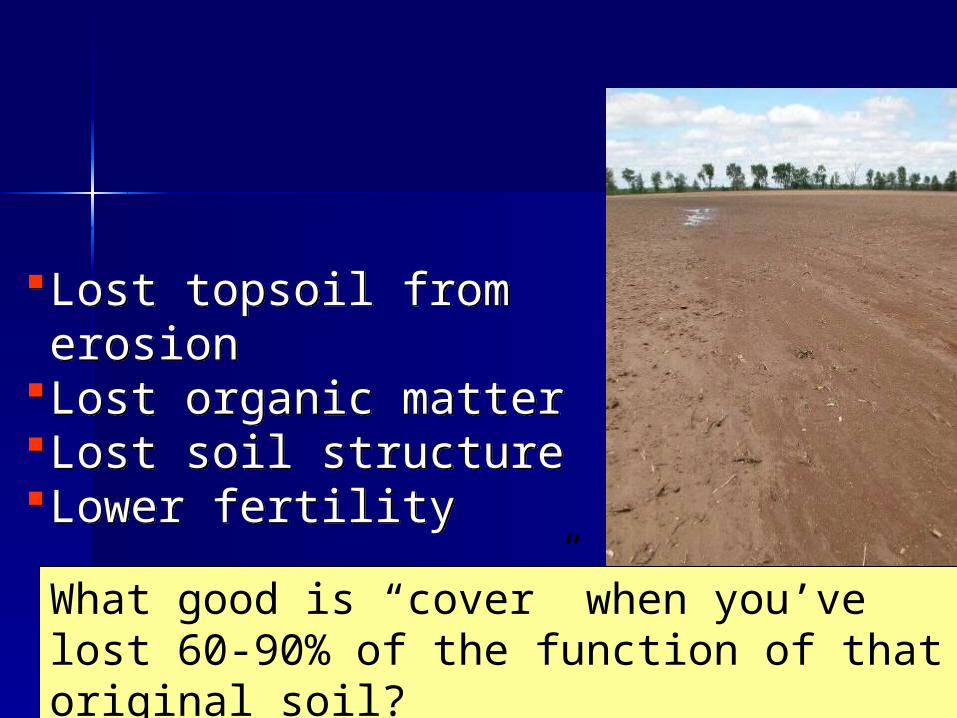
Lost topsoil from erosionLost organic matterLost soil structureLower fertility
Lost topsoil from erosionLost organic matterLost soil structureLower fertility
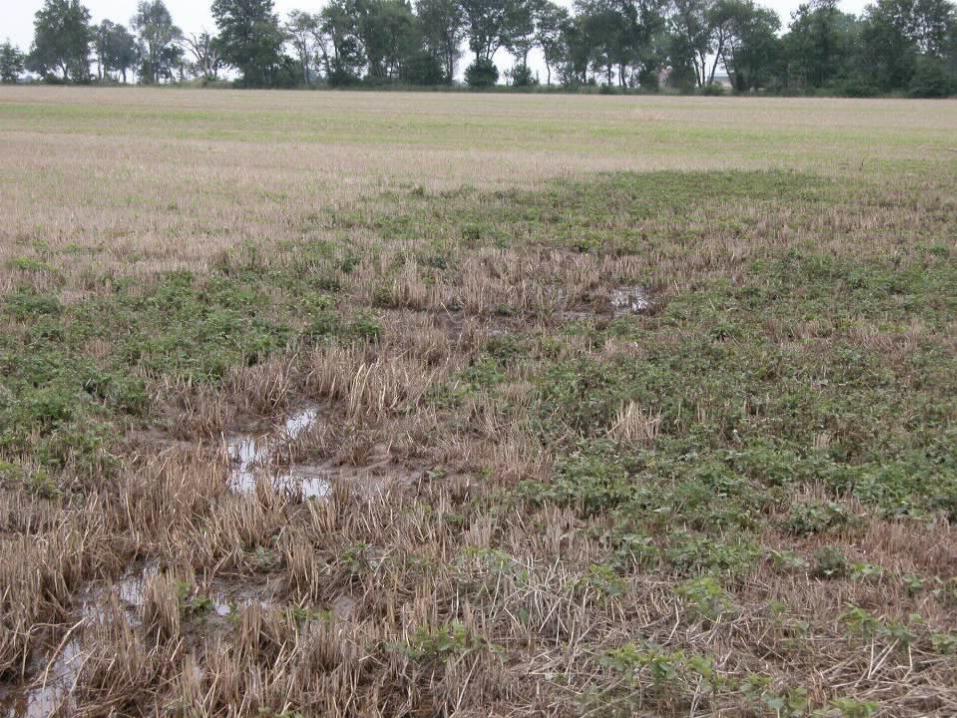
What good is “cover” when you’ve lost 60-90% of the function of that original soil?
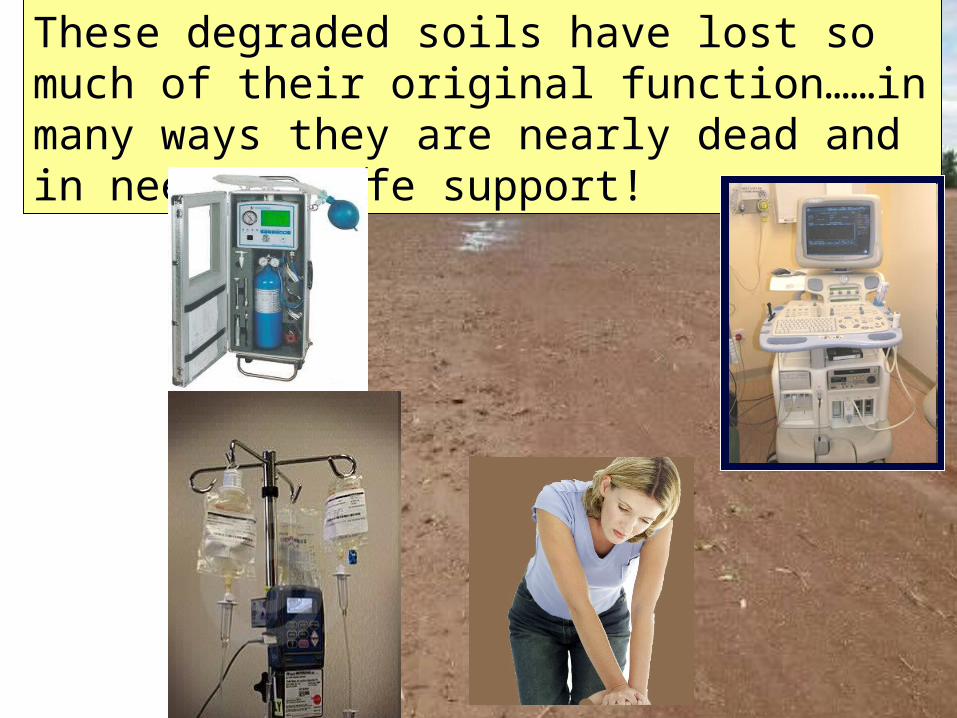
These degraded soils have lost so much of their original function……in many ways they are nearly dead and in need of life support!
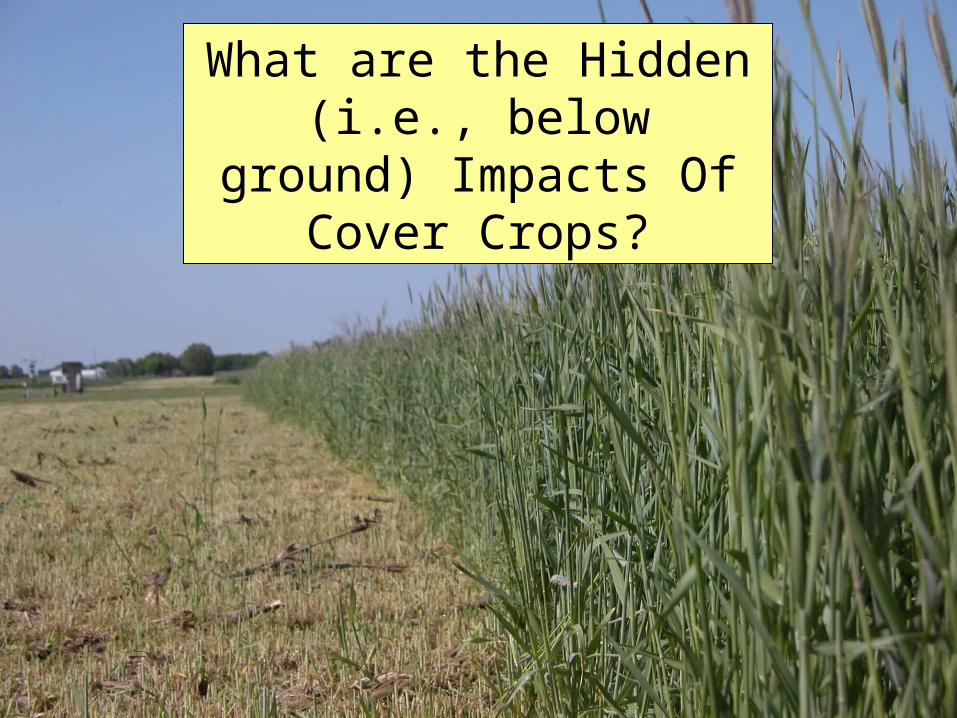
What are the Hidden (i.e., below ground) Impacts Of Cover
Crops?
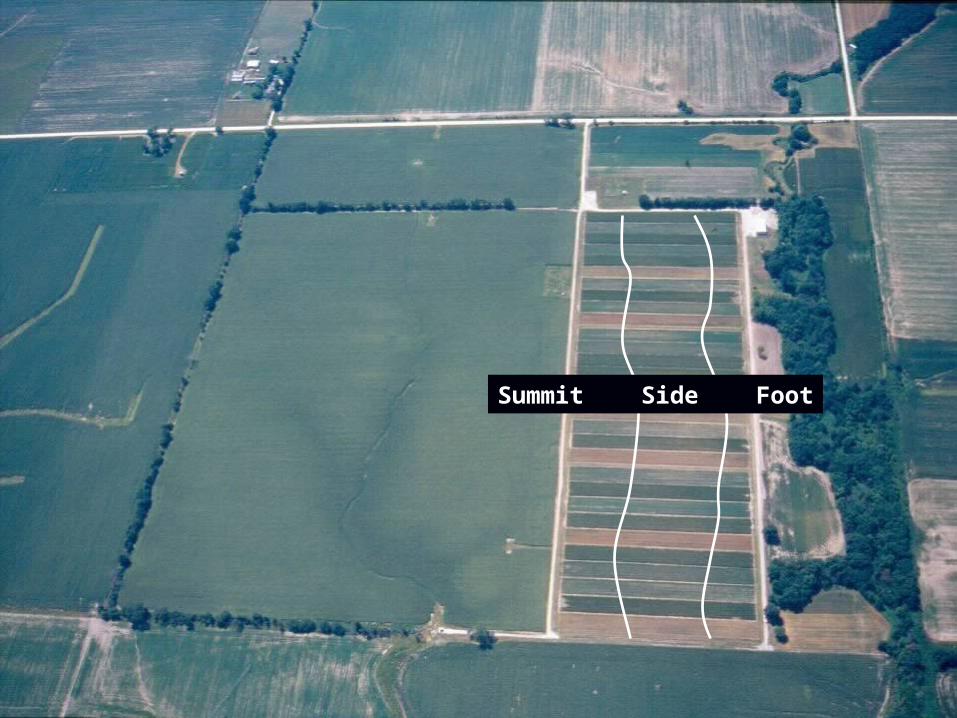
Summit Side Foot

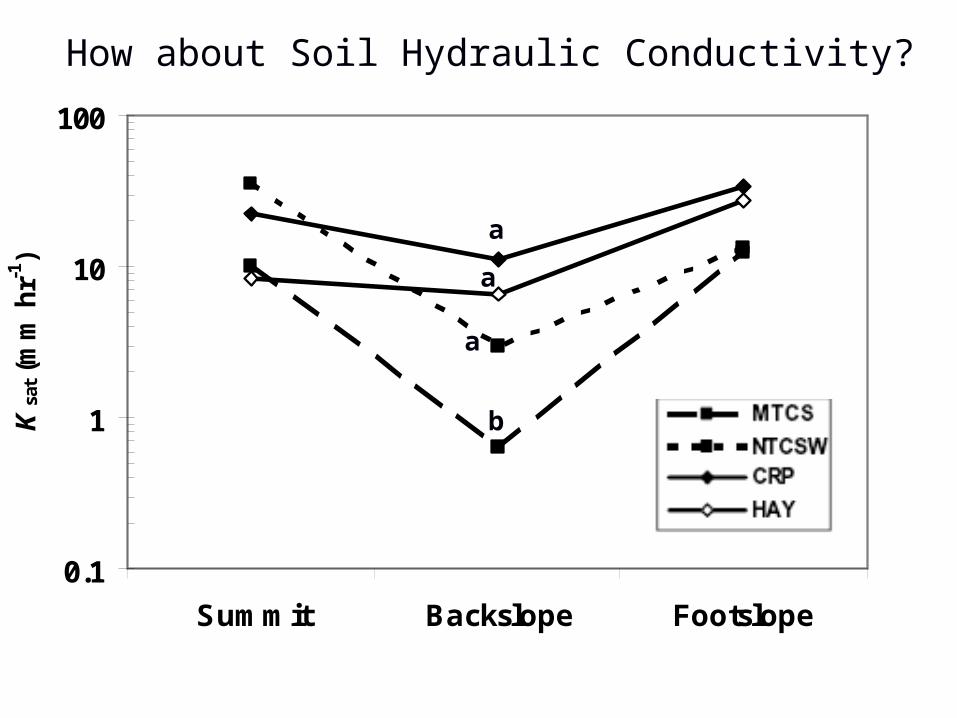
Mulch tillage, Corn-soybean rotation (MTCS)
No-till, Corn-soybean-wheat rotation (NTCSW cover)
0.1
1
10
100
Summit Backslope Footslope
Ksa
t (m
m h
r-1)
b
a
a
a
How about Soil Hydraulic Conductivity?
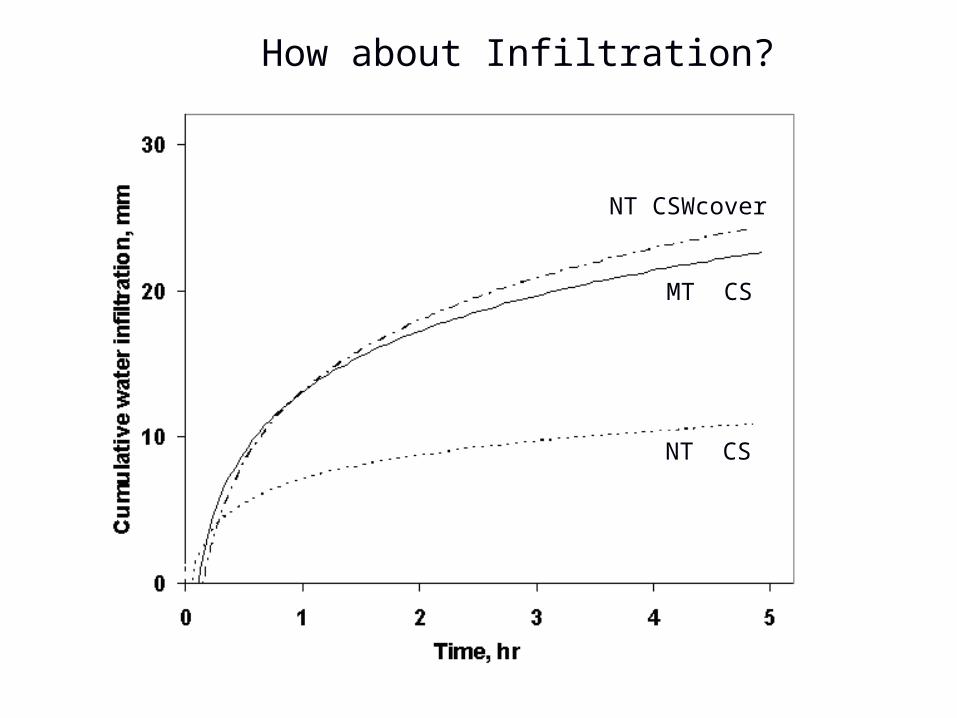
NT CS
MT CS
NT CSWcover
How about Infiltration?

Do All Cover Crops Provide Equal Benefit?

Permanent grass managementPermanent grass management
2 Conservation Reserve 2 Conservation Reserve Program (CRP) systems: No Program (CRP) systems: No inputsinputs
Species: Tall fescue, orchard Species: Tall fescue, orchard grass, red clover or warm grass, red clover or warm season grassesseason grasses
Hay: Hay crop, N 90 kg/ha, Hay: Hay crop, N 90 kg/ha, Lime, P, and K by soil testLime, P, and K by soil test
Species: White clover, Species: White clover, orchard grass, Canadian orchard grass, Canadian wildrye, big bluestem.wildrye, big bluestem.
HAYCRP
CRP
HAY
CRP

CRP (cool)
CRP (warm)
hay (cool & warm)
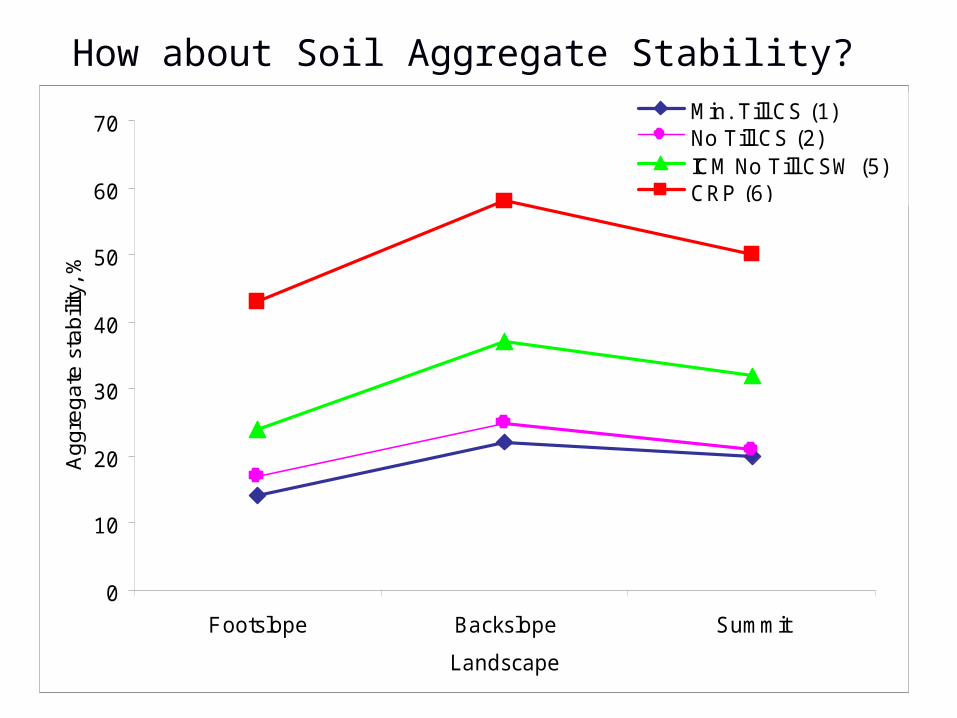
0
10
20
30
40
50
60
70
Footslope Backslope Summit
Landscape
Ag
gre
ga
te s
tab
ility
, %
Min. Till CS (1)No Till CS (2)ICM No Till CSW (5)CRP (6)
How about Soil Aggregate Stability?

How about Soil Strength?
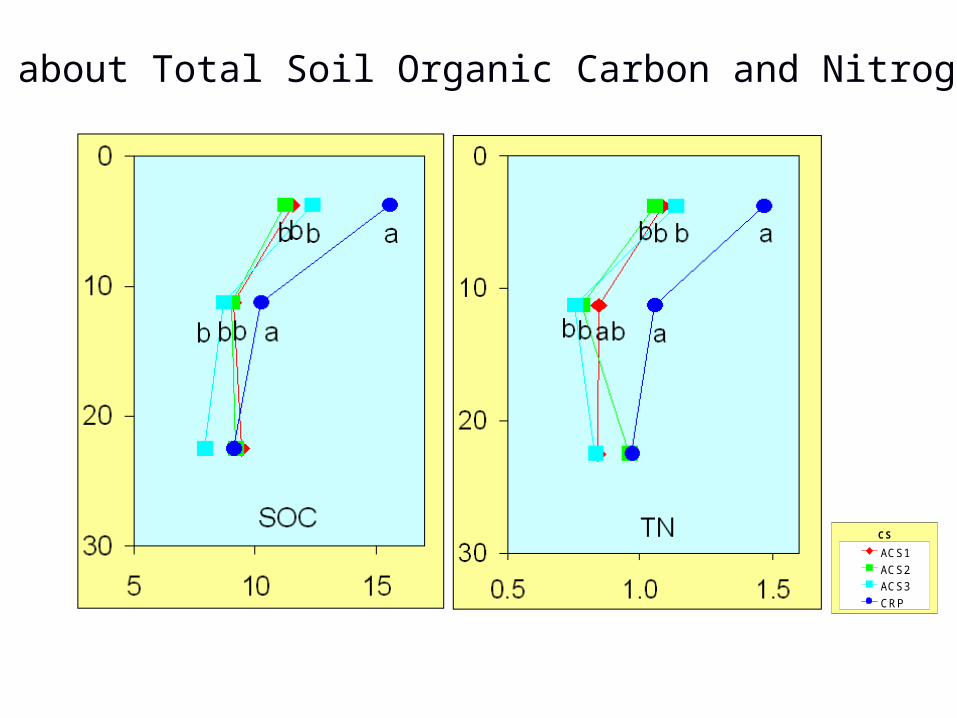
CS
b bb bb
ba
a
5
01
02
03
0
ACS1
ACS2
ACS3
CRP
Soi
l dep
th,
mHow about Total Soil Organic Carbon and Nitrogen?


2005 , 2007, 2009 Wheat Cover
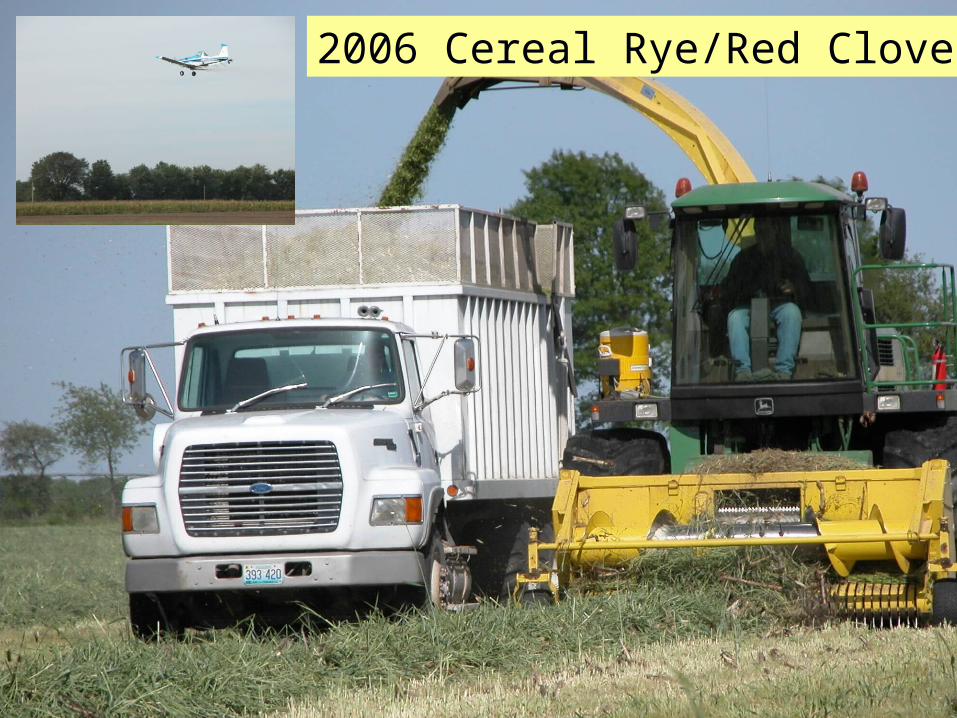
2006 Cereal Rye/Red Clover

2007 Sudex (following wheat)
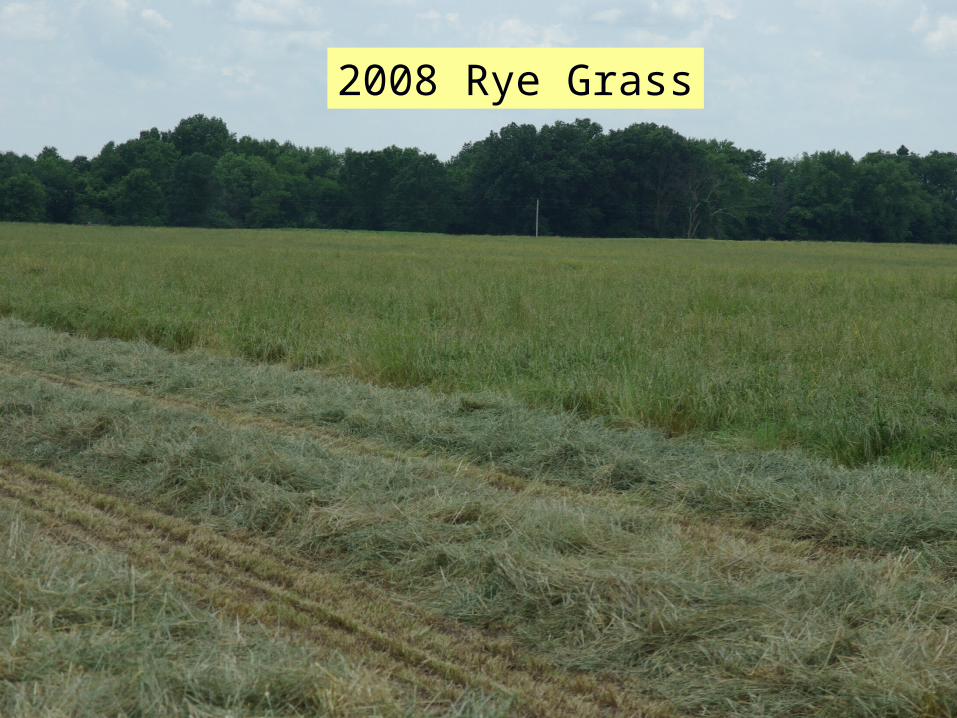
2008 Rye Grass

2009 Brassica Mix (following wheat)
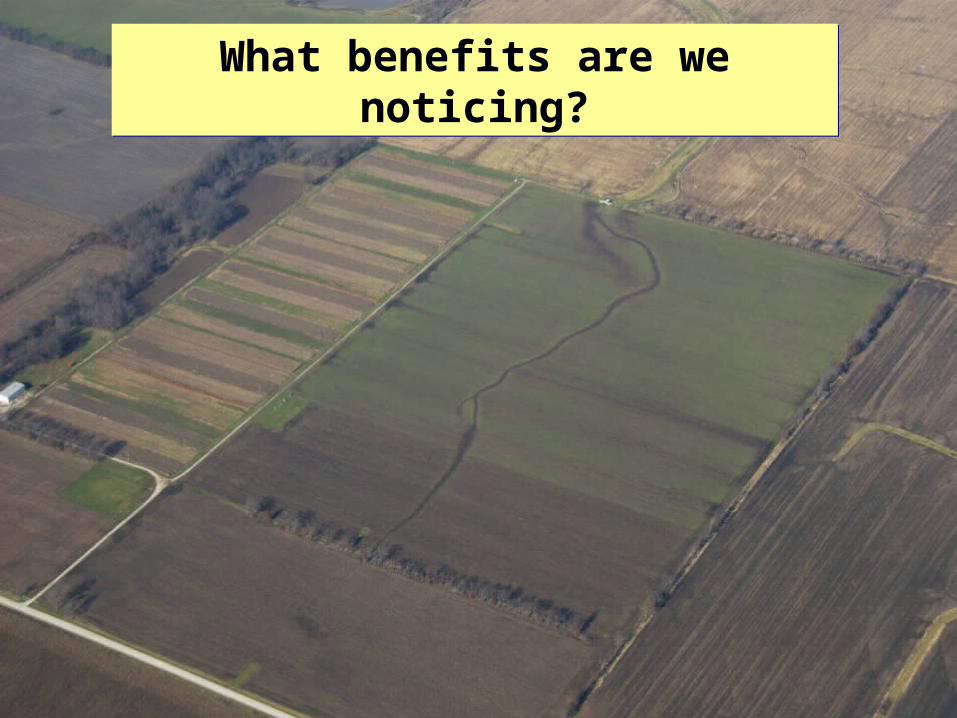
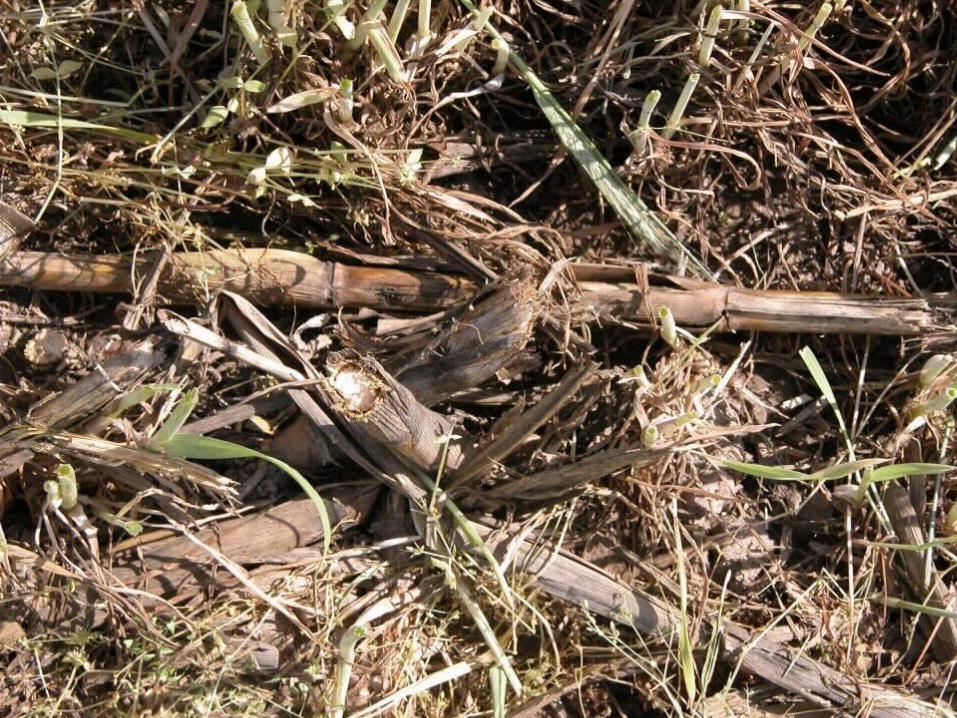
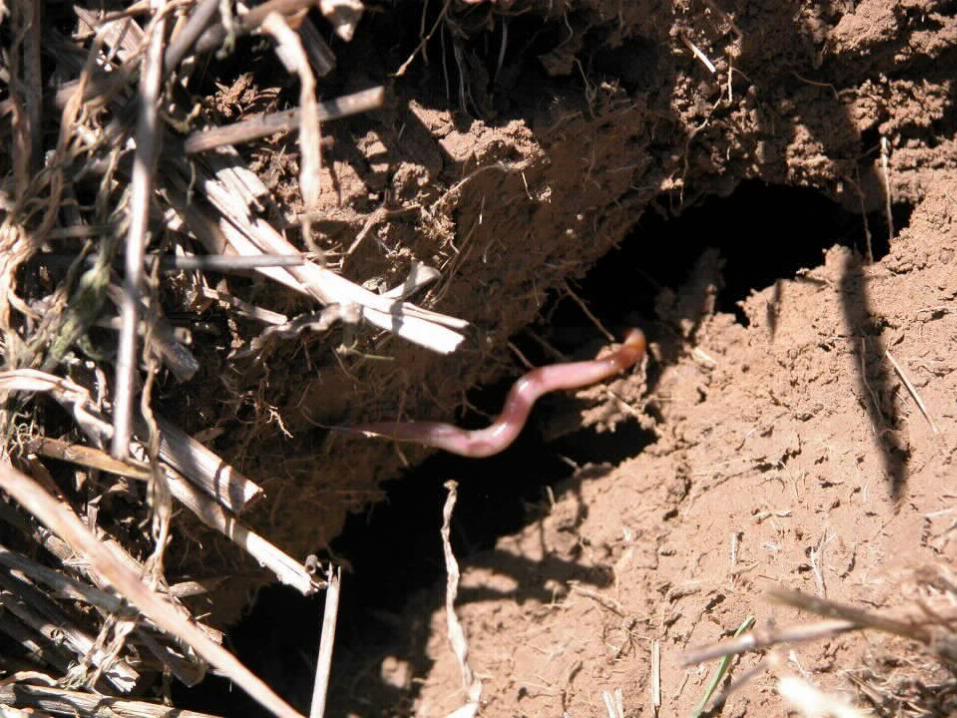
What benefits are we noticing?What benefits are we noticing?

Results – Results – Temporal Differences in Temporal Differences in SQIsSQIs
Property and units 2003 2007
pH 6.18 6.34
P, mg/kg 7.6 15.1
K, mg/kg 60.9 133.6
SOC, g/kg 11.5 12.4
POM-C, g/kg 1.49 2.51
MnOxC, g/kg 0.344 0.342
Total N, g/kg 1.07 1.18
POM-N, g/kg 0.117 0.166
Highlighted items are significantly different between samplings

Results – Results – Temporal Differences in Temporal Differences in SQIsSQIs
-2 .0
-1 .0
0 .0
1 .0
2 .0
3 .0
4 .0
5 .0Tota l O rganic C arbon (g/kg)
0 .0 0 .5 1 .0 1 .5 2 .0 2 .5 3 .0 3 .5 4 .0 4 .5Particu la te O rganic M atter C arbon (g/kg)
-0 .010
-0 .008
-0 .006
-0 .004
-0 .002
0 .000
0 .002
0 .004Perm anganate-oxid izable C arbon (g/kg)
-0 .25
-0 .15
-0 .05
0 .05
0 .15
0 .25
0 .35
0 .45Tota l N itrogen (g/kg)
0 .02
0 .04
0 .06
0 .08
0 .10
0 .12
Particu la te O rganic M atter N itrogen (g/kg)


Avg. N O 3-N (kg ha -1 90cm -1) C over: 16.7 N o-C over: 118.8
0 20 40 60
NO 3-N (kg ha -1)
80
60
40
20
0
Pro
file
Dep
th (
cm)
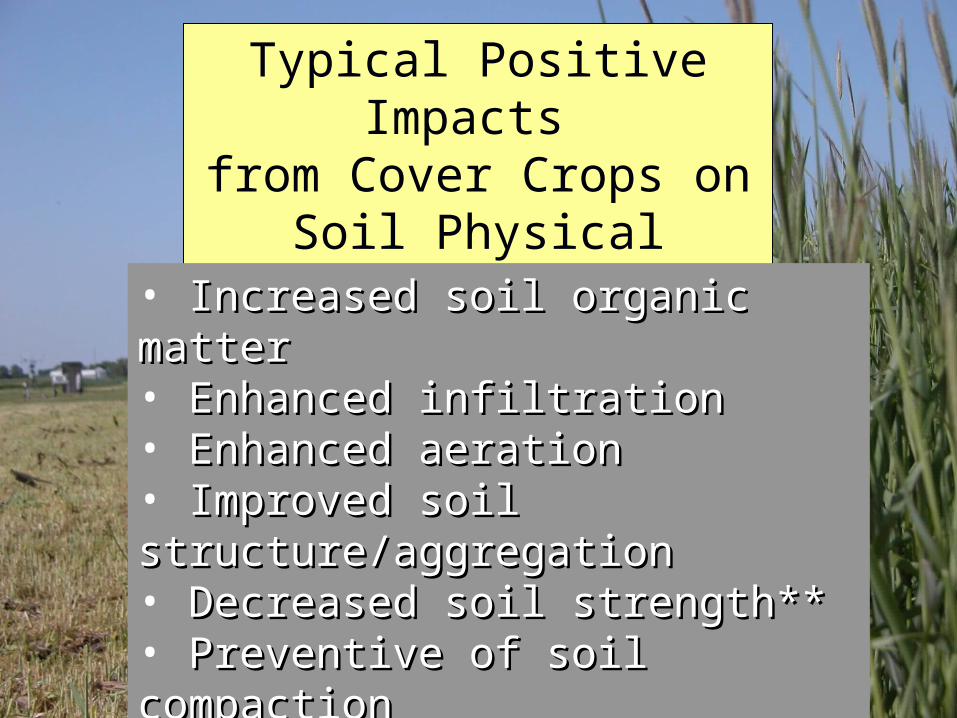
Typical Positive Impacts
from Cover Crops on Soil Physical Properties
• Increased soil organic matterIncreased soil organic matter• Enhanced infiltrationEnhanced infiltration• Enhanced aerationEnhanced aeration• Improved soil Improved soil structure/aggregationstructure/aggregation• Decreased soil strength**Decreased soil strength**• Preventive of soil compactionPreventive of soil compaction• Reduced evaporation potentialReduced evaporation potential