Embed Size (px)
Citation preview
SimBuild2010
Fourth National Conference of IBPSA-USANew York City, New York
August 11 – 13, 2010
1
IMPACT OF DIFFERENT DAYLIGHTING SIMULATION RESULTS ON THE PREDICTION OF TOTAL ENERGY CONSUMPTION
RogérioVersage1, Ana Paula Melo2, and Roberto Lamberts3 1Federal University of Santa Catarina, Florianópolis, Brazil 2Federal University of Santa Catarina, Florianópolis, Brazil 3Federal University of Santa Catarina, Florianópolis, Brazil
Labeee – Energy Efficiency in Buildings Laboratory Campus Universitário – Trindade – 88040-900
ABSTRACT
This paper examines the influence of modeling daylighting in two energy simulation programs: EnergyPlus and Daysim. Different controls of the daylighting system will be tested and the results will be based on the total building energy consumption. The daylighting results from the EnergyPlus program show limitations for zones that have great depth as it overestimates the illuminance values in areas far from the window. Thus, the modelling of daylighting using Daysim was combined with the EnergyPlus program to estimate the whole building energy performance. These results demonstrated higher accuracy and the influence of the use of the Daysim daylighting result can be noted in the building energy consumption.
INTRODUCTION The presence of daylighting in buildings guarantees appropriate lighting levels for human activities and reduces the building electric energy consumption. However, the potential for energy economy through daylighting does not only depend on its availability and rational use (Lamberts et al., 1997). The control of the artificial lighting system and the influence of gains from building openings and lighting equipment also affect the total building energy consumption. As a result, the potential for building energy economy will depend on an integrated analysis of the lighting, cooling and heating systems.
There are different ways to analyze the daylighting thermal performance in buildings. Daylighting simulations are computerized processes that calculate the amount daylighting in a thermal zone. The simulations seek to quantify the luminance and illuminance at certain points of the building and these results can be presented through numerical values, scene visualizations or false color maps, and these analyses can be static or dynamic. According to Reinhart et al. (2006) a static simulation expresses results in the form of images or illuminance values, in
relation to a reference sky, known as the Daylight Factor (DF). The dynamic simulations provide an annual series of illuminance and they are used as dynamic indicators of daylighting thermal performance. The most commonly used dynamic indicators are Daylight Autonomy (DA) and Useful Daylight Illuminance (UDI).
Daylight Autonomy is defined as a percentage of occupied hours per year, in which a minimum level of illuminance can be maintained by daylighting alone (Reinhart and Morrison, 2003). Useful Daylight Illuminance was proposed initially by Nabil and Mardaljevic (2005) and, together with DA, it is a method of dynamic evaluation that seeks to determine when the levels of daylighting are considered useful: not very dark (not < 100 lux), nor very light (not > 2000 lux). In contrast to DA, UDI establishes a maximum value of illuminance so that the extra daylighting does not lead to visual or thermal discomfort (Nabil and Mardajevic, 2006).
The methods most commonly used in simulations of illuminance distribution in a three-dimensional space are split-flux, radiosity and ray-tracing. The split-flux is a method that calculates the DF at a point through the sum of the direct and reflected daylighting components. The radiosity method calculates the radiation transfer among surfaces based on the form factor and it simulates the light performance in its radiant form. The ray-tracing simulates the performance of the light rays in the space and it calculates the lighting distribution at one point (Reinhart, 2006; WinkeImann and Selkwitz, 1985).
The split-flux and radiosity methods require a shorter calculation time, however, they have limitations when dealing with complex geometries. On the other hand, the ray-tracing method offers advantages for simulating the physical performance of light rays and the material spectral properties, for any building complexity.
In thermal simulations it is also recommended to consider the hourly variation of the climatic variables
SimBuild2010
Fourth National Conference of IBPSA-USANew York City, New York
August 11 – 13, 2010
2
during the year, allowing a more detailed evaluation of the building thermal performance. The computational program EnergyPlus is a simulation tool through which analysis can be carried out based on hourly results for daylighting, cooling and heating systems. The EnergyPlus daylighting simulation allows the impact of the daylighting use on the energy consumption to be determined according to the environmental conditions and the types of lighting control based on daylighting availability and glare occurrence.
However, Winkelmann and Selkowitz (1985), who integrated the lighting system into the DOE program, which was later inserted into the EnergyPlus program, indicated some limitations to these algorithms. It has been observed that the adopted method works better for thermal zones which have a cubic format, diffuse surfaces and no internal separation. For these reasons, this algorithm is not recommended for environments distant from the window, indicating that the depth of the environment should not exceed three times the height (floor-to-ceiling distance). Furthermore, it was also observed that this algorithm can overestimate the reflected internal illuminance for the points closest to the far end of the thermal zone away from the window. This limitation of the daylighting simulation in the EnergyPlus program interferes in the characterization of lighting control performance, reflecting in the lighting system energy consumption and consequently, due to the thermal loads related to the lighting system, affecting the estimated total energy consumption.
In compensation, there are other daylighting simulation tools that produce more precise lighting results, allowing model simulations for more complex geometries. One example is the Daysim program, a simulation tool that calculates the annual internal lighting using the climatic files from the EnergyPlus program. According to Reinhart (2006), the Daysim program uses the method of the Radiance program, which is a mechanism based on the ray-tracing method. It simulates the illuminance and internal luminance distribution in complex models for defined sky conditions. Based on these considerations, main objective of this research is to compare the daylighting simulation results obtained using the EnergyPlus and Daysim program through dynamic methods of evaluation. Also, the integration of the lighting control results from Daysim into the EnergyPlus thermal simulation will be analyzed.
METHODOLOGY
The EnergyPlus program
EnergyPlus is a computational program based on the BLAST and DOE-2 programs and distributed by the Department of Energy of the United States, developed for the thermal and energy simulation of buildings and their systems (ENERGYPLUS, 2007). The program has two classes of daylighting simulation: Daylighting:Controls, which calculate the daylighting incidence through the split-flux method; and the DE-Light, which determines the daylighting based on the radiosity method. The lighting control system can be of the type continuous dimming control, continuous dimming control with switch off or disperse control. The daylighting simulation in the EnergyPlus program can be described by three stages:
1 – The pre-process of calculating the Daylight Factor: where the illuminance at the points of interest is calculated hour by hour;
2 – The calculation of hourly values of illuminance by interpolation of Daylight Factors based on the climatic characteristics of each hour;
3 – Based on daylighting illuminance, the determination of values for the artificial lighting power to reach the desire level of illuminance, computing the radiant fraction of the lighting system for the thermal and energy calculation.
The DaySim program
Daysim is a program of daylighting analysis, developed by the National Research Council Canada (NRCC) that uses the Radiance program algorithm to calculate efficiently the internal illuminance and luminance of a thermal zone in the period of one year (Reinhart, 2006). The program works with annual data through climatic files, the same ones used in the EnergyPlus program, which contain an hourly series of solar data, which are converted in sub-hourly series.
The program Daysim calculates the annual daylighting by integrating the method of the Radiance program into the Daylight Coefficient method. Radiance is a simulation program based on the physical performance of the light functioning with the ray-tracing method. This program predicts the illuminance and luminance distribution in buildings under defined sky conditions. The results of the simulation can be associated with photorealistic images, false color or numeric values (Ward, 1993).
The Daylight Coefficient concept was originally proposed by Tregenza (1983) as a method to calculate the internal illuminance levels in relation to the

SimBuild2010
Fourth National Conference of IBPSA-USANew York City, New York
August 11 – 13, 2010
3
daylighting under the defined sky conditions. This method divides the celestial hemisphere into segments and calculates the contribution of each segment to obtain the total illuminance. As a result, once the values for the points of interest have been calculated, the illumination levels can be easily calculated for any sky condition. The use of this method in Daysim enables the simulation time for all hours of the year, avoiding the necessity to simulate all sky conditions to obtain the annual daylighting conditions.
Also, the Daysim program includes an algorithm called Lightswitch which predicts the performance of the lighting system control or the users of the lighting systems control in relation to the lighting level. This algorithm allows sub-hourly simulation of the lighting use from the lighting dynamic performance and provides a report on the lighting system and curtain use for all hours of the year (Bourgeois et al., 2006).
Daylighting simulation
Typology characteristics
To analyze the natural illumination through the programs EnergyPlus and Daysim a model was defined that represents an office of 24m² (4m x 6m) with a floor-to-ceiling height of 3m. The model has a window to the exterior in the north façade of 6m², as shown in Figure 01.
Figure 01 Typology characteristics.
The typology adopted has diffuse surfaces with a reflectance of 58% for the internal walls, 84% for the ceiling and 30% for the floor. A simple glass pane of 6 mm of thickness was considered for the window. The climatic file adopted for the simulations is a TMY (Test Meteorological Year) of 1991 for the city Campo Grande, Brazil. The occupation period was considered as being from 08h00 to 17h00 for all days of the year.
Six points were defined to evaluate the daylighting simulations, and these points were distributed along the longitudinal axis of the thermal zone, according to Figure 02.
Figure 02 – Distribution of points in the environment.
The analysis of the daylighting performance was carried out through the dynamic methods of Daylight Autonomy and Useful Daylight Illuminance.
Daylighting simulation in the EnergyPlus program
For the daylighting analysis, the simulation in the EnergyPlus program was accomplished with Daylighting:Controls, as this allows a map of the illuminance distribution in the thermal zone to be obtained. The reference points were defined for the administration of the artificial lighting system and the illuminance value was 500 lux in accordance with NBR 5413 (ANBT, 1991).
For the daylighting evaluation, an hourly report with daylighting illuminance values was required based on the six points defined. The reports produced, which contain the illuminance values were processed in the Microsoft Excel program, where it is possible to obtain the frequency values for each point. Thus, the dynamic indexes of daylighting of DA and UDI were defined.
Daylighting simulation in the Daysim program
For the simulation in the Daysim program, the typology was drawn in the Google Sketchup 6.0 program and then exported in 3ds file format, according to the Daysim tutorial recommendations. According to the typology description the surface reflectance and the six points for the evaluation were defined.
From the simulation results a report was produced with Daylight Autonomy and Useful Daylight Illuminance values for each point defined.
SimBuild2010
Fourth National Conference of IBPSA-USANew York City, New York
August 11 – 13, 2010
4
Integrated simulations
The performance of the artificial lighting system controls were simulated by the EnergyPlus and Daysim programs to analyze the impact of the daylighting use on the energy economy. The lighting system was simulated using control by a photoelectric sensor which adjusts the lighting intensity according to the daylighting availability and maintaining a defined lighting level.
The thermal simulations were carried out in the EnergyPlus program through lighting controls simulated for the EnergyPlus and Daysim programs. Three integrated simulations were carried out adopting the following control types of lighting system: reference, where the lights stay on during the whole occupation period; with a continuous system of lighting control simulated by EnergyPlus program; and with the system simulation based on the Daysim program lighting control. All the thermal simulations were processed by the EnergyPlus program.
Typology characteristics
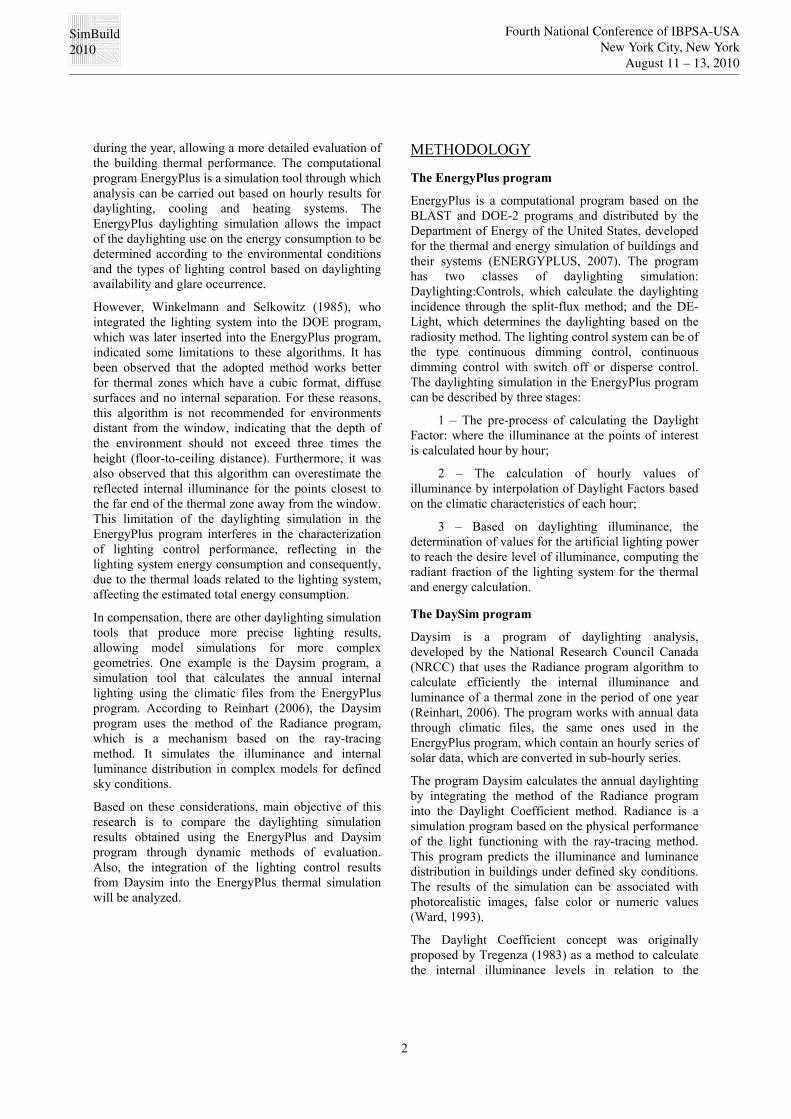
The typology used for the energy simulations is different from the typology used in the daylighting simulation. The typology has three thermal zones: two offices and a hall that divides them. The offices have an area of 24m², with floor-to-ceiling height of 3m. Each office has a window to the exterior, one on the south façade and the other on the north façade, as shown in Figure 03.
Figure 03 Typology adopted for the integrated
simulations.
The office was considered as occupied during the weekdays from 08h00 to 17h00, with a one-hour break for lunch. Each office has two people with an activity of 117W. Any occupant behavior was used during the simulations, just sensors to search out at 500 lux.
The lighting system was defined as suspended fluorescent lamps with a power density of 10 W / m² and a total of 140W related to the equipment.
The air conditioning system adopted is a window type with a COP (Coefficient of Performance) of 3.0 and a setpoint of 24ºC for cooling. The infiltration rate was defined as 0.5 ACH for each area. A point of reference was adopted for the sensor of the lighting control system 1.5m from the far end of the room and at 0.85m height for each analyzed zone, according to Figure 04.
Figure 04 Typology used in the integrated simulations.
Lighting control simulation for EnergyPlus
In the EnergyPlus program the lighting control of the type that adjusts the lighting intensity in the Daylighting:Controls and DE-Light was simulated, with a specific reference point and the illuminance level was established as 500 lux. In the DE-Light simulation a high resolution was defined for the surface division for the radiosity calculation, and also the values indicated for the EnergyPlus program were adopted for a more precise analysis.
The control type adopted for the lighting system in both simulations methods was the continuous/off which identifies the daylighting intensity through the sensors installed at the reference point, with a gradual decrease in, or the blocking of, the artificial light through dimmers which are controlled automatically. Lighting control simulation for Daysim
The lighting control simulation for the Daysim program was carried out through the integration of the lighting control hourly report (internalgains.csv), which is integrated into the EnergyPlus program through a control schedule for the lighting system for each hour of the year.
SimBuild2010
Fourth National Conference of IBPSA-USANew York City, New York
August 11 – 13, 2010
5
As the EnergyPlus and Daysim programs work with different units of lighting power, Watts and Installed Lighting Power Density, respectively, the report values from the Daysim program were converted. In other words, the load density used in the Daysim program was divided by the office area to obtain the percentage use value for the lighting power. Thus, it was possible to employ the hourly values of the factor power used as the lighting control schedule in the EnergyPlus program.
RESULTS The results for the daylighting simulations and integrated simulations were analyzed separately.
Daylighting simulations
The Daylight Autonomy and Useful Daylight Illuminance dynamic indexes were calculated for the six points of reference through the EnergyPlus and Daysim program. The DE-Light was not used in this analysis as it does not have a map report of hourly illuminance.
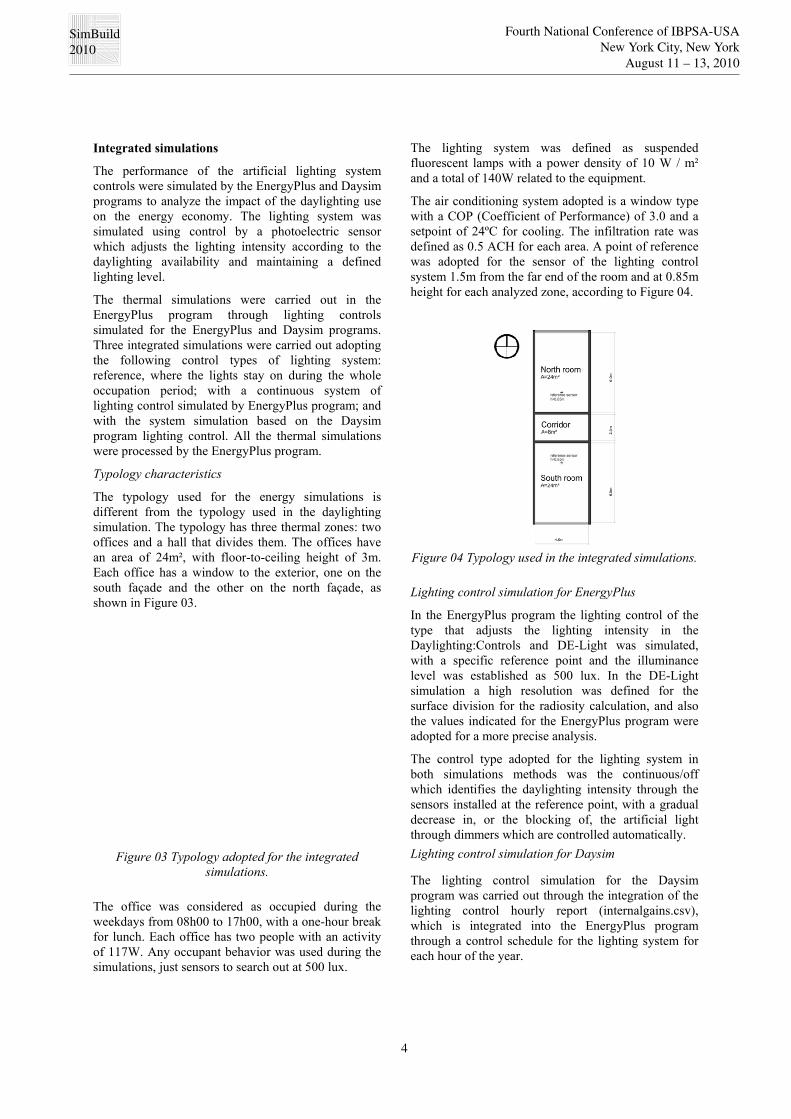
The daylighting performance obtained through the DA dynamic index (Figure 06) indicates when the illuminance level of 500 lux is maintained with daylighting. It can be observed that the values of DA calculated by EnergyPlus and Daysim have similar values within the first three meters from the window, however, at the other points the values diverge totally. This can be attributed to the previously mentioned limitations of the split-flux method used by EnergyPlus program.
Daylight Autonomy
>500 lux
EnergyPlus
99%
94%
86%
81%
79%
77%
Daysim
100%
95%
82%
54%
27%
17%
Figure 06 Daylighting results for DA.
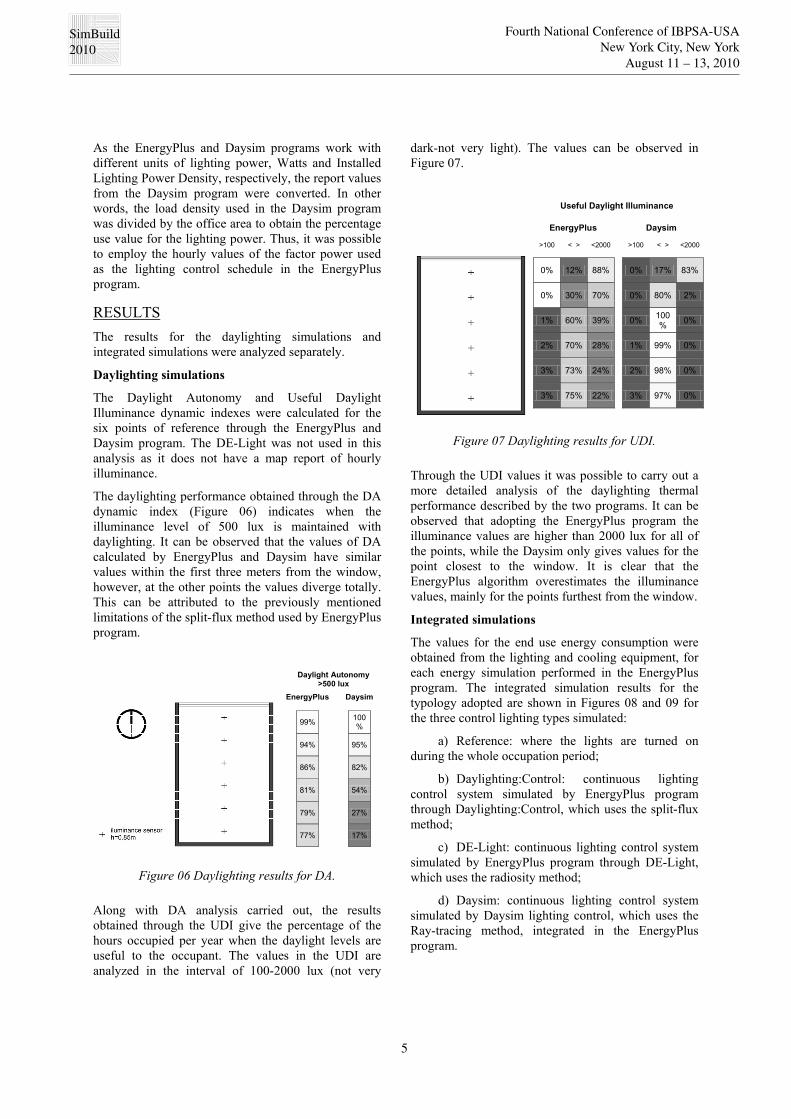
Along with DA analysis carried out, the results obtained through the UDI give the percentage of the hours occupied per year when the daylight levels are useful to the occupant. The values in the UDI are analyzed in the interval of 100-2000 lux (not very
dark-not very light). The values can be observed in Figure 07.
Useful Daylight Illuminance
EnergyPlus
>100 < > <2000
0% 12% 88%
0% 30% 70%
1% 60% 39%
2% 70% 28%
3% 73% 24%
3% 75% 22%
Daysim
>100 < > <2000
0% 17% 83%
0% 80% 2%
0% 100% 0%
1% 99% 0%
2% 98% 0%
3% 97% 0%
Figure 07 Daylighting results for UDI.
Through the UDI values it was possible to carry out a more detailed analysis of the daylighting thermal performance described by the two programs. It can be observed that adopting the EnergyPlus program the illuminance values are higher than 2000 lux for all of the points, while the Daysim only gives values for the point closest to the window. It is clear that the EnergyPlus algorithm overestimates the illuminance values, mainly for the points furthest from the window.
Integrated simulations
The values for the end use energy consumption were obtained from the lighting and cooling equipment, for each energy simulation performed in the EnergyPlus program. The integrated simulation results for the typology adopted are shown in Figures 08 and 09 for the three control lighting types simulated:
a) Reference: where the lights are turned on during the whole occupation period;
b) Daylighting:Control: continuous lighting control system simulated by EnergyPlus program through Daylighting:Control, which uses the split-flux method;
c) DE-Light: continuous lighting control system simulated by EnergyPlus program through DE-Light, which uses the radiosity method;
d) Daysim: continuous lighting control system simulated by Daysim lighting control, which uses the Ray-tracing method, integrated in the EnergyPlus program.
SimBuild2010
Fourth National Conference of IBPSA-USANew York City, New York
August 11 – 13, 2010
6
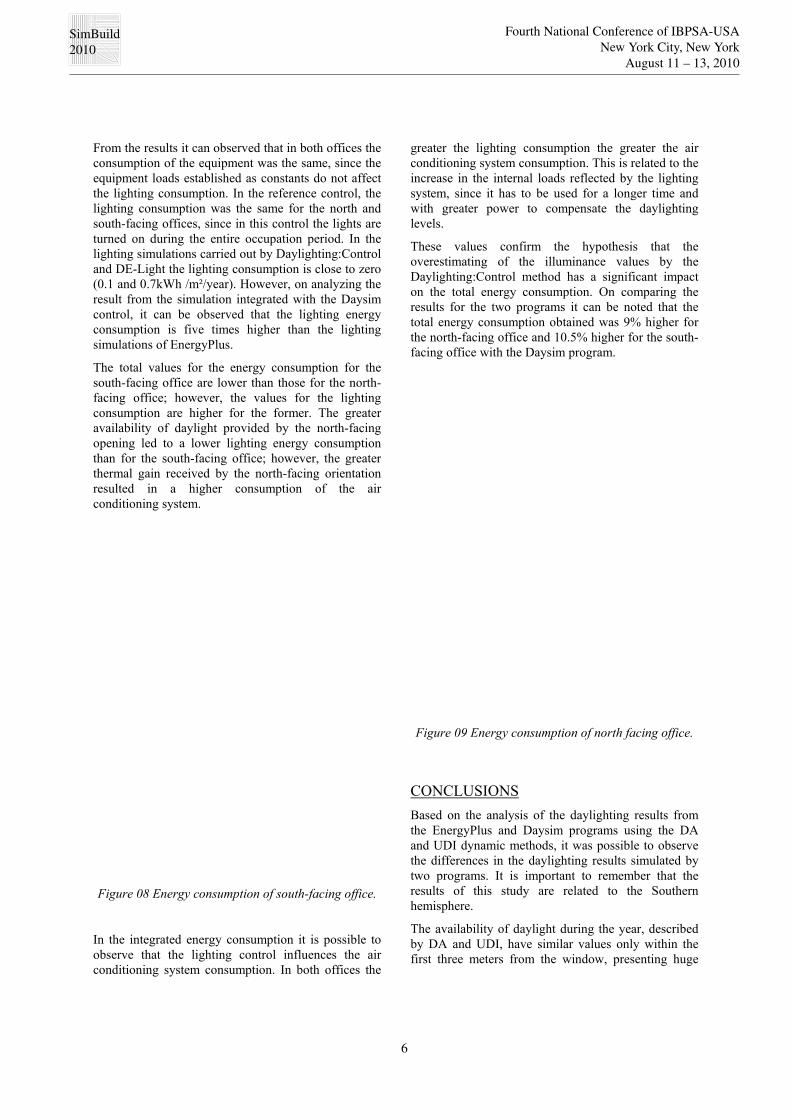
From the results it can observed that in both offices the consumption of the equipment was the same, since the equipment loads established as constants do not affect the lighting consumption. In the reference control, the lighting consumption was the same for the north and south-facing offices, since in this control the lights are turned on during the entire occupation period. In the lighting simulations carried out by Daylighting:Control and DE-Light the lighting consumption is close to zero (0.1 and 0.7kWh /m²/year). However, on analyzing the result from the simulation integrated with the Daysim control, it can be observed that the lighting energy consumption is five times higher than the lighting simulations of EnergyPlus.
The total values for the energy consumption for the south-facing office are lower than those for the north-facing office; however, the values for the lighting consumption are higher for the former. The greater availability of daylight provided by the north-facing opening led to a lower lighting energy consumption than for the south-facing office; however, the greater thermal gain received by the north-facing orientation resulted in a higher consumption of the air conditioning system.
Figure 08 Energy consumption of south-facing office.
In the integrated energy consumption it is possible to observe that the lighting control influences the air conditioning system consumption. In both offices the
greater the lighting consumption the greater the air conditioning system consumption. This is related to the increase in the internal loads reflected by the lighting system, since it has to be used for a longer time and with greater power to compensate the daylighting levels.
These values confirm the hypothesis that the overestimating of the illuminance values by the Daylighting:Control method has a significant impact on the total energy consumption. On comparing the results for the two programs it can be noted that the total energy consumption obtained was 9% higher for the north-facing office and 10.5% higher for the south-facing office with the Daysim program.
Figure 09 Energy consumption of north facing office.
CONCLUSIONS Based on the analysis of the daylighting results from the EnergyPlus and Daysim programs using the DA and UDI dynamic methods, it was possible to observe the differences in the daylighting results simulated by two programs. It is important to remember that the results of this study are related to the Southern hemisphere.
The availability of daylight during the year, described by DA and UDI, have similar values only within the first three meters from the window, presenting huge
SimBuild2010
Fourth National Conference of IBPSA-USANew York City, New York
August 11 – 13, 2010
7
divergences at the points further from the window. This divergence is important due to the effect of the daylighting simulation results on the energy consumption prediction and this leads to the necessity for an analysis of the impact of daylighting on the total energy consumption.
From the analysis of daylighting availability during the year, described by DA and UDI, it is possible to verify the impact of the difference in the prediction results for the economy in lighting through the availability of daylight in the thermal zone.
The limitations of the split-flux method, adopted by EnergyPlus, were confirmed. However, the recommendation that the depth of the thermal zone cannot exceed three times the height of floor-to-ceiling height, in order to not overestimate the internal reflected illuminance was not sufficient for the themal zone analyzed, since on comparing these results with those generated by Daysim, the illuminance values were very high. Also, it should be mention that the errors in the split-flux method based simulations can increase as non-diffuse surfaces partitions and furniture are considered in the ambient analyzed.
The overestimated results for the daylighting simulated by EnergyPlus influenced the prediction of the total energy consumption. The high lighting levels simulated by EnergyPlus reduced the lighting energy consumption, reflecting in the air conditioning consumption. This effect reduced the total energy consumption for the typology adopted.
However, it was possible to better describe the situation by integrating the Daysim lighting results with the integral simulation adopting the EnergyPlus program; and with the integration of the daylighting results from Daysim with the integral simulation achieved adopting the EnergyPlus program it possible to obtain more appropriate results.
REFERENCES BOURGEOIS, D.; REINHART, C.; MACDONALD,
I. Adding advanced behavioral model in whole building energy simulation: A study on the total energy impact of manual and automated lighting control. Energy and Buildings, v. 35, p. 814-823, 2006.
ENERGYPLUS. Getting Started with EnergyPlus. Lawrence Berkeley National Laboratory. 2007a.
____. Engineering Reference. Lawrence Berkeley National Laboratory. 2007b.
LAMBERTS, R.; DUTRA, L.; PEREIRA, F. O. R. (1997) Eficiência energética na arquitetura. São Paulo, SP, 188p.
NABIL, A.; MARDALJEVIC, J. Useful daylight illuminances: A replacement for daylight factors. Energy and Buildings, v. 38, p. 905-913, 2006.
NBR 5413 – Iluminância de Interiores. ABNT, 1992.
PEREZ, R.; PIERRE, I.; SEALS, R.; MICHALSKY, J.; STEWART, R.. Modeling daylight availability and irradiance components from direct and global irradiance. Solar Energy, v. 44, p. 271-289, 1990.
RAMOS, G. Análise da iluminação natural calculada por meio do programa Energyplus. Dissertação de Mestrado – Programa de Pós-graduação em Engenharia Civil, Universidade Federal de Santa Catarina. Florianópolis, 2008.
REINHART, C. F. Tutorial on the Use of Daysim Simulations for Sustainable Design. Institute for research in Construction National Research Council Canada. Canada, 2006.
REINHART, C. F.; MARDALJEVIC, J.; ROGERS, Z. Dynamic daylight performance metrics for sustainable building design. NRCC-48669. 2006.
REINHART, C. F.; MORRISON, M. The lightswitch wizard – reliable daylight simulations forinitial design investigation. In: Buildings Simulation, 2003. Proceedings… Eindhoven, 2003. p.1093-1100.
TREGENZA, P. R.; WATERS, I. M. Daylight Coefficients. Lighting Research & Technology. 15(2), p. 65-71, 1983.
WARD, G. Radiance Tutorial. Building Technologies Department. Lawrence Berkeley Laboratory. 1993. Disponível em: http://radsite.lbl.gov/radiance/. Acesso em: Novembro de 2007.
WINKELMANN, F.; SELKWITZ, S. Daylighting simulation in the DOE-2 building energy analysis program. Energy and Buildings, v. l8, p.271-286, 1985.