Embed Size (px)
Citation preview
IMPACT OF DROUGHT ON HOUSEHOLD WATER QUALITY IN RURAL SOUTHERN NEW MEXICO: CONTINUATION PROJECT
FINAL REPORT
. . . to test for contaminants known to be present in thfe state’s border aquifers . . .
June 2016

The research team at the New Mexico Water Resources Research Institute wishes to thank the
New Mexico Department of Health and the state Cooperative Extension Service for supporting this
project. A special note of thanks goes to Freida Adams with the NMDOH Office of Border Health;
Jeff Anderson, Mary Ellen Dziak and Karoline Getkin with Don a Ana County Extension; Kristen N.
Fisher, Judy O’Loughlin, Marlee Runyan and Jessica Swapp-Lucas with Grant County Extension;
and Shelly Batts, Jack Blandford and Beatrice Dominguez with Luna County Extension.
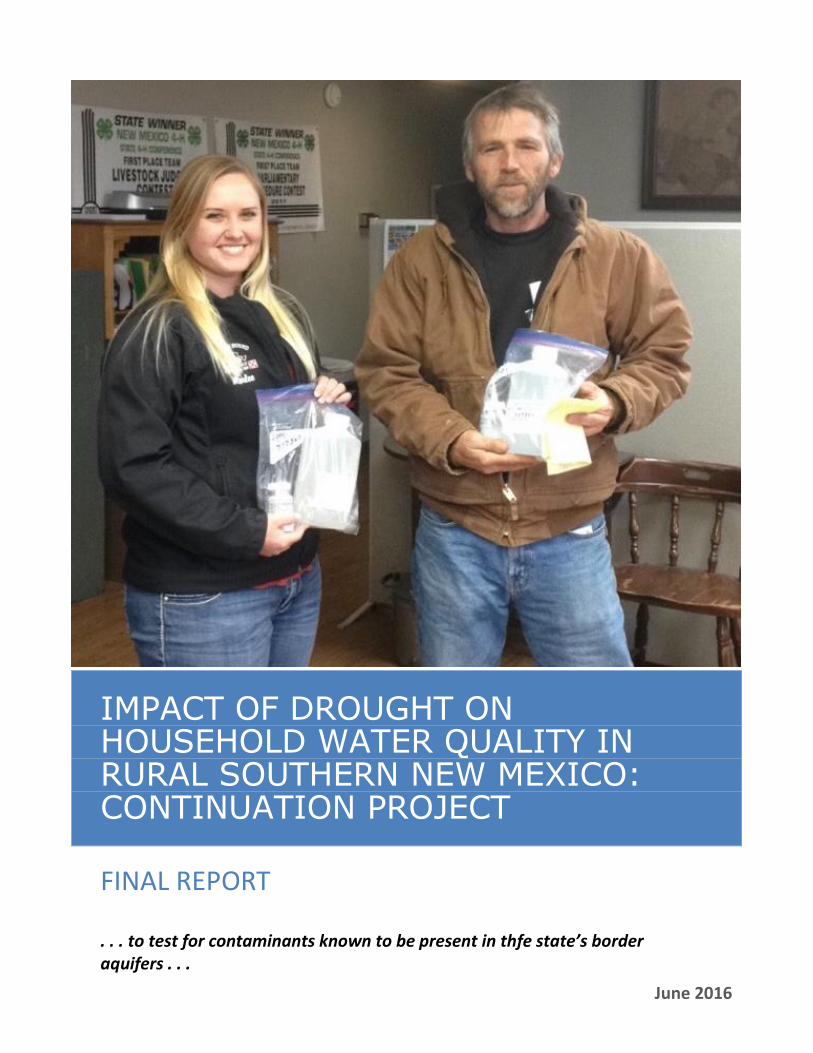
Cover Photo
Grant County residents receive a free well water testing kit from their Cooperative Extension Office,
2610 N. Silver St. in Silver City. The free tests were funded by the New Mexico Department of Health
in partnership with the state’s Water Resources Research Institute and Cooperative Extension
Service.

Page i
Project Summary
The border region of southern New Mexico and northern Chihuahua is well into its sixth
consecutive year of drought. The U.S. National Weather Service reports precipitation remaining
below the 12-month annual average and lists the New Mexico border region as suffering from
“abnormally dry” conditions. Previous research finds that concentrations of contaminants in
groundwater may rise during periods of drought. The objective of this two-year effort is to test the
levels of known contaminants in private, domestic wells in the state’s border region. As a
deliverable, the project provides healthcare professionals with “hot spot” maps showing the risk of
finding harmful levels of contaminants in border region aquifers.
APPROACH
The two-year effort (1) measured changes in aquifer elevation in the state’s border region, (2)
analyzed laboratory results from more than 435 private, domestic wells, and (3) mapped the
potential for elevated contaminant levels within each of three border aquifers. Follow up
measures were conducted with well owners whose household water supplies exceeded federal
and state standards for healthy drinking water.
FINDINGS
A series of depth-to-water measurements in wells located within the Mimbres groundwater basin
identified a three-year drop in aquifer elevation of more than 60 feet. The drop exceeded historical
changes in the aquifer and pointed to drawdown of the aquifer during a period of drought.
Lab analysis of water samples from 435 private domestic wells recorded concentrations of arsenic,
uranium, fluoride and nitrates and the presence of total coliform and E. coli in three border region
aquifers. In total, 61 samples or 14.0% of the total samples exceeded the standard for one or more
contaminant. Seven (7) samples exceeded the health standards by two or more contaminants.
Laboratory data was used to develop color-coded maps that highlight the potential for elevated
contaminant levels areas within each of three aquifers. The maps can be found in the Maps section
of this report or online at http://border.nmsu.edu/ under the “Well Water Sampling Project” tab.
The maps identify areas within each aquifer where groundwater likely exceeds the maximum
concentration for healthy drinking water. Of note, elevated concentrations of arsenic and/or
fluoride were identified within each of the three regional aquifers.
Page ii
CONCLUSION
As drought advances in the border region of southern New Mexico, it may be concluded that
groundwater sampling becomes a more relevant exercise for monitoring private domestic water
supplies. Maps showing the potential for elevated concentrations of harmful contaminants in
groundwater may aid healthcare workers in identifying individuals at risk of exposure to
unhealthy drinking water.
Page iii
Table of Contents
Project Summary ___________________________________________________________________________________________ i
Approach ____________________________________________________________________________________________________________ i
Findings _____________________________________________________________________________________________________________ i
Conclusion __________________________________________________________________________________________________________ ii
Table of Contents _________________________________________________________________________________________ iii
Introduction _______________________________________________________________________________________________ 1
Background ________________________________________________________________________________________________ 2
Scope of Work______________________________________________________________________________________________ 3
Task 1 – Aquifer sampling _________________________________________________________________________________________ 4
Sampling Approach ________________________________________________________________________________________________ 4
Task 2 – Follow Up Activities ______________________________________________________________________________________ 5
Task 3 - Workshops ________________________________________________________________________________________________ 5
Task 4 – Data Analysis & Water Quality Maps ___________________________________________________________________ 6
Findings ____________________________________________________________________________________________________ 7
Exceedances ________________________________________________________________________________________________________ 7
Maps _______________________________________________________________________________________________________ 19
Discussion _________________________________________________________________________________________________ 21
Property Owner-Supplied Data __________________________________________________________________________________ 33
workship evaluations _____________________________________________________________________________________________ 33
Sampling Errors___________________________________________________________________________________________________ 33
PROJECT Promotion ______________________________________________________________________________________________ 33
Conclusion ________________________________________________________________________________________________ 34
References and Works Cited _____________________________________________________________________________ 35
Page 1
Introduction
In 2014 - ‘16 the New Mexico Department of Health (NMDOH) partnered with the Water
Resources Research Institute (WRRI) to test the quality of groundwater in the state’s border
aquifers. The aquifers are significant in serving as the primary source of domestic water supplies
for residents of New Mexico’s southern border counties of Don a Ana, Grant, Hidalgo and Luna
counties. These transboundary aquifers also supply several Mexican communities, including
Palomas, Chihuahua. Results from the first of two projects identified elevated concentrations of
harmful contaminants in 11.2% of wells sampled in Luna County. More than 9% were measured at
levels that exceed the federal and state health standards. Some samples tested as high as four
times the maximum concentration for healthy drinking water. Much of this information was
previously unknown.
This report constitutes the final report for the second-year of groundwater sampling. The report
combines data from the first year’s project with data from the second year. Completed in June
2016, the second-year effort was designed to extend the reach of well water sampling into Don a
Ana and Grant counties and develop a more detailed description of domestic water quality in the
state’s border aquifers.
The objective of this two-year effort is to test the levels of known contaminants in
private, domestic wells in the state’s border region. As a deliverable, the project
provides healthcare professionals with “hot spot” maps showing the risk of finding
harmful levels of contaminants in border region aquifers.

Page 2
Background
The border region of southern New Mexico and northern Chihuahua is well into its sixth
consecutive year of drought. For the current year, the U.S. National Weather Service reports
precipitation remaining below the 12-month average and lists the New Mexico border region as
suffering from “abnormally dry” conditions.1 Many authors cite rising concentrations of
contaminants in groundwater during periods of drought (i.e., Delpla et al., 2008; van Vliet et al.,
2009). Under such circumstances, groundwater quality can degrade.
The 272,383 residents of New Mexico’s Don a Ana, Grant, Hidalgo and Luna counties rely almost
solely on groundwater for their domestic and agricultural supplies. Of those, an estimated 15%2
obtain their household water from private wells. Private wells are unregulated in most U.S. states,
including New Mexico. As such, no requirements are in place for routine testing or assessment of
water quality.3
Due to a combination of extended drought and the high percentage of individuals in New Mexico’s
border counties served by unregulated, private wells, WRRI and NMDOH agreed to conduct a well
testing project to determine if resident well owners were at risk from elevated concentrations of
harmful contaminants in their drinking water.
1 U.S. Drought Monitor, National Weather Service. Accessed Aug. 5, 2016 at http://droughtmonitor.unl.edu/ 2 Domestic water use: self-supplied population 2005, U.S. Geological Survey. Published by the U.S. Census Bureau. Accessed July 18, 2016 at http://censtats.census.gov/ 3 EPA regulates public water systems; it does not have the authority to regulate private drinking water wells. Approximately 15 percent of Americans rely on their own private drinking water supplies, and these supplies are not subject to EPA standards, although some state and local governments do set rules to protect users of these wells. Unlike public drinking water systems serving many people, they do not have experts regularly checking the water’s source and its quality before it is sent to the tap. These households must take special precautions to ensure the protection and maintenance of their drinking water supplies. Accessed July 2, 2016 at www.epa.gov/
Page 3
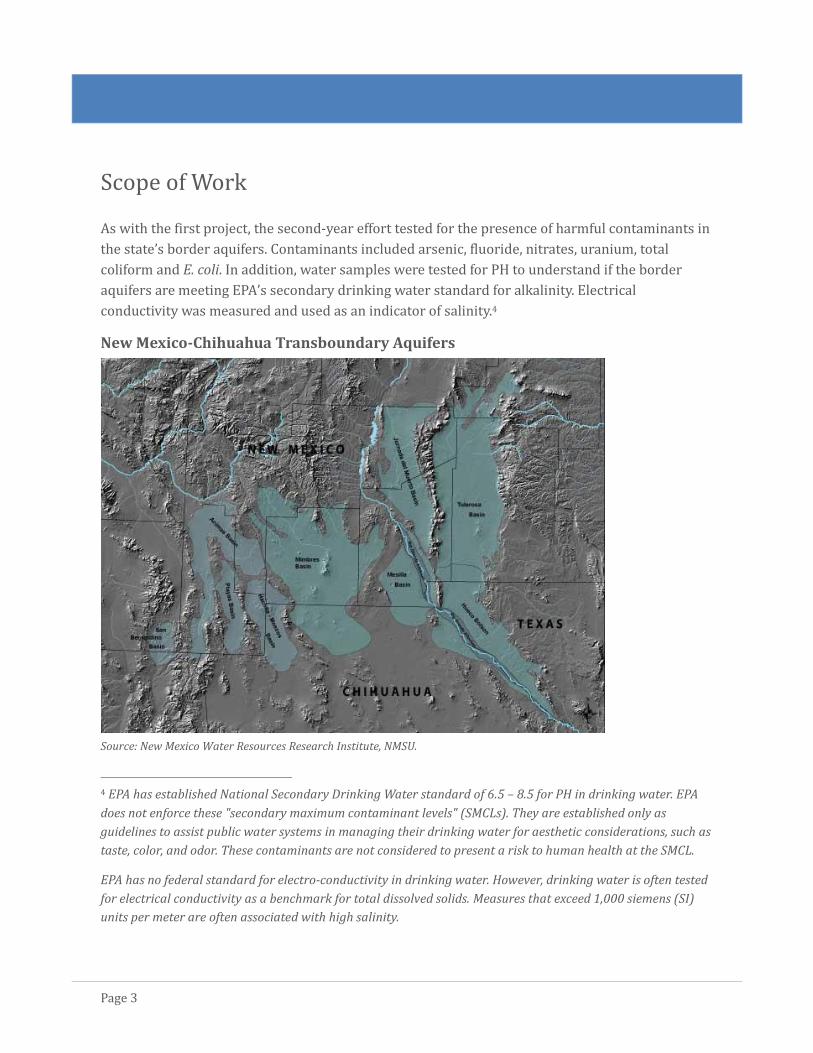
Scope of Work
As with the first project, the second-year effort tested for the presence of harmful contaminants in
the state’s border aquifers. Contaminants included arsenic, fluoride, nitrates, uranium, total
coliform and E. coli. In addition, water samples were tested for PH to understand if the border
aquifers are meeting EPA’s secondary drinking water standard for alkalinity. Electrical
conductivity was measured and used as an indicator of salinity.4
New Mexico-Chihuahua Transboundary Aquifers
Source: New Mexico Water Resources Research Institute, NMSU.
4 EPA has established National Secondary Drinking Water standard of 6.5 – 8.5 for PH in drinking water. EPA
does not enforce these "secondary maximum contaminant levels" (SMCLs). They are established only as
guidelines to assist public water systems in managing their drinking water for aesthetic considerations, such as
taste, color, and odor. These contaminants are not considered to present a risk to human health at the SMCL.
EPA has no federal standard for electro-conductivity in drinking water. However, drinking water is often tested
for electrical conductivity as a benchmark for total dissolved solids. Measures that exceed 1,000 siemens (SI)
units per meter are often associated with high salinity.
Page 4
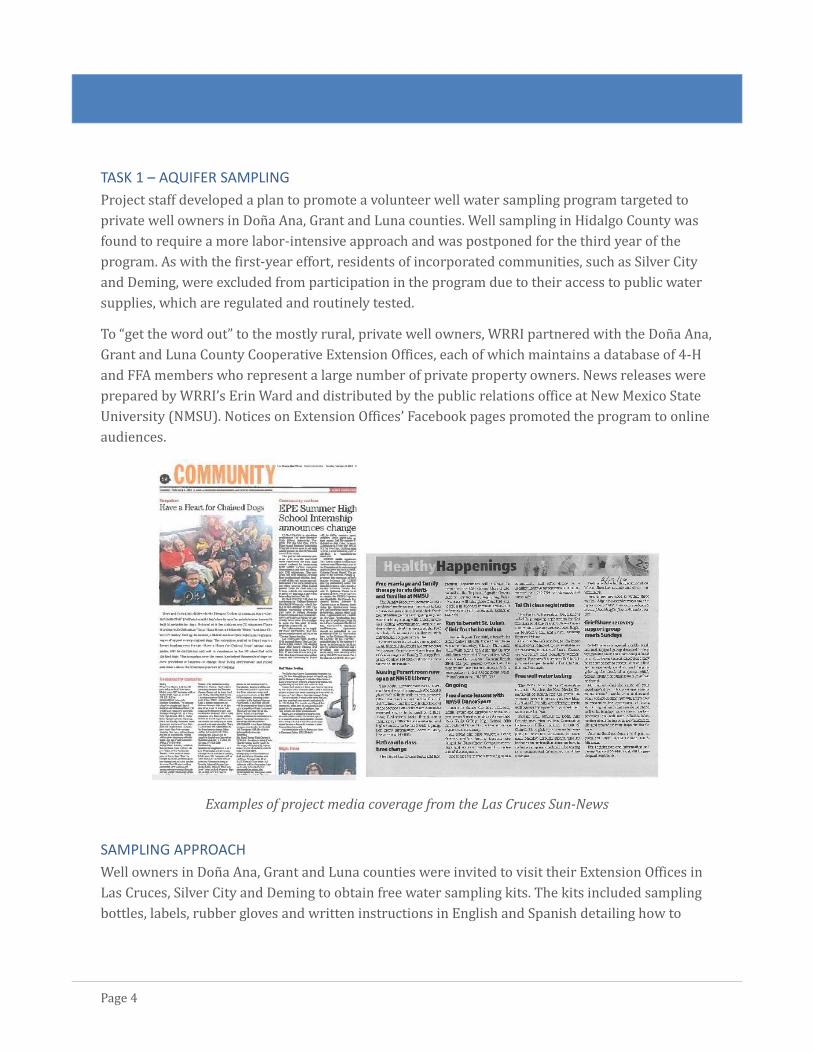
TASK 1 – AQUIFER SAMPLING
Project staff developed a plan to promote a volunteer well water sampling program targeted to
private well owners in Don a Ana, Grant and Luna counties. Well sampling in Hidalgo County was
found to require a more labor-intensive approach and was postponed for the third year of the
program. As with the first-year effort, residents of incorporated communities, such as Silver City
and Deming, were excluded from participation in the program due to their access to public water
supplies, which are regulated and routinely tested.
To “get the word out” to the mostly rural, private well owners, WRRI partnered with the Don a Ana,
Grant and Luna County Cooperative Extension Offices, each of which maintains a database of 4-H
and FFA members who represent a large number of private property owners. News releases were
prepared by WRRI’s Erin Ward and distributed by the public relations office at New Mexico State
University (NMSU). Notices on Extension Offices’ Facebook pages promoted the program to online
audiences.
Examples of project media coverage from the Las Cruces Sun-News
SAMPLING APPROACH
Well owners in Don a Ana, Grant and Luna counties were invited to visit their Extension Offices in
Las Cruces, Silver City and Deming to obtain free water sampling kits. The kits included sampling
bottles, labels, rubber gloves and written instructions in English and Spanish detailing how to

Page 5
collect well water for laboratory analysis. Property owners were instructed to collect their
samples on Tuesday mornings (Don a Ana) or Thursday mornings (Grant and Luna) and deliver
them to their respective Extension Office by 2 p.m. on the same day. The deadline allowed time for
Extension staff to pack the samples in ice and ship them overnight to the state’s authorized
drinking water laboratory in Albuquerque. The quick turnaround from sample collection to
delivery at the lab ensured that each water sample would arrive within a 24-hour window,
improving the reliability of the lab analysis.
Property owners were guaranteed anonymity for participation in the program. As such, Extension
staff asked well owners to identify themselves by street address or to label their collection bottles
with the latitude and longitude of their wellheads by using a mobile phone app or computer
program. Well locations were later verified by WRRI student employees to assure accuracy in
mapping contaminant concentrations within each aquifer.
TASK 2 – FOLLOW UP ACTIVITIES
Laboratory results were returned to property owners usually within three to four weeks. The
results were provided to well owners either in hardcopy at the Extension Office or communicated
via email or telephone, depending on well owner preference. To help property owners understand
their lab reports, a flyer was developed in English and Spanish that explained how to read the
report. In some cases, WRRI or Extension staff met in person with a property owner to discuss a
lab result or assist the well owner in understanding the probable source of contamination. Staff
also instructed owners of contaminated wells in methods to reduce or eliminate the contaminant.
WRRI and NMDOH worked together to develop brochures in English and Spanish explaining the
health impacts of certain contaminants.
TASK 3 - WORKSHOPS
Workshops were conducted May 25 in Grant County and June 15 Luna County for well owners
who participated in the program. The workshops were scheduled to evaluate the second-year
effort and determine the extent of follow up by property owners in installing or updating water
treatment devices.
Written evaluations were completed by participants attending the Silver City workshop. Overall,
some 86% of participants said they were “very satisfied” with the project. A perfect 100% of
evaluators said the well sampling instructions were clear and easy to follow. More than 92%
reported the “Hot to Read Your Lab Results” instruction sheet as helpful in interpreting the
laboratory data.
Page 6
Six participants reported lab results that exceeded the health standards. Of the six, two reported
installing or treating their household water with an installed device or treatment system. The
remaining four reported exceedances of total coliform only, and were directed to retest their well
water for coliform contamination at a later time.5
At close of the Silver City workshop, several residents requested information on how to construct
a homemade water filter. WRRI staff provided a brochure and performed a demonstration,
showing how to assemble a filter to fit their needs. Variations of the device are currently in use in
Palomas, Chih., where the homemade filters were found to reduce high concentrations of fluoride
and arsenic from local well water supplies.
The Luna County workshop was conducted with the staff of the County Extension Office in
Deming. For this meeting, WRRI provided Powerpoint slides, which were edited so that the
Extension staff could use the slides for meetings with agriculture producers held after the fall
harvest season.
TASK 4 – DATA ANALYSIS & WATER QUALITY MAPS
This report contains the chief deliverables for the project. The report includes a database of
laboratory results from 435 individual well samples and “hot spot” maps showing the risk in each
of three groundwater basins of finding elevated contaminant concentrations. Risk is calculated
using the magnitude of values from laboratory analyses of well water and the distances between
each wellhead to assign a range of values by contaminant (See Maps B through M).
5 Hall Environmental Analysis Laboratory reports a high sensitivity to false positives for exceedances of total coliforms.
Page 7
Findings
The second-year effort was initiated the second week of December 2015. Samples were collected
each week for 15 weeks through mid-March. Some 329 well samples were collected and tested for
arsenic, fluoride, nitrates, uranium, total coliform, E. coli, PH and electro-conductivity. Data from
the second-year effort were combined with data from 106 wells sampled the first year. In total,
435 individual wells were sampled, tested for contaminants and their locations mapped within
three aquifers. Total samples represented an estimated 5.2% of all private domestic wells in the
three-county border region and exceeded by more than 140 the number of wells targeted by the
project team.
Of the total samples, some 380 qualified for testing of the full range of six contaminants, PH and
electro-conductivity. Some 56 samples were analyzed for the five contaminants of arsenic,
fluoride, uranium and the presence of total coliform and E. coli. This was due to an error by the
testing lab, which shipped collection bottles with an incorrect preservative that curtailed testing
for nitrates. Another 22 samples could not be tested for total coliform or E. coli because of delays
in reaching the laboratory within 24 hours or when water samples exceeded the maximum
temperature for testing. A smaller group of samples were analyzed only for total coliform and E.
coli at the request of the well owners. One sample in the five-contaminant group also exceeded the
24-hour limit for coliform and E. coli testing.
EXCEEDANCES
Of the 435 samples tested, 61 or 14.0% exceeded the drinking water standard for one or more of
the contaminants of arsenic, fluoride, nitrates, uranium or E. coli. Seven (7) of the 61 were found to
exceed the standards for two or more contaminants. Eleven (11) or 2.5% of samples failed to meet
EPA’s secondary standard for PH, demonstrating high alkalinity. Electro-conductivity, which
carries no state or federal health standard, was measured at 1000 or greater in 87 or 20.0% of
total samples, indicating a potential for high salinity.
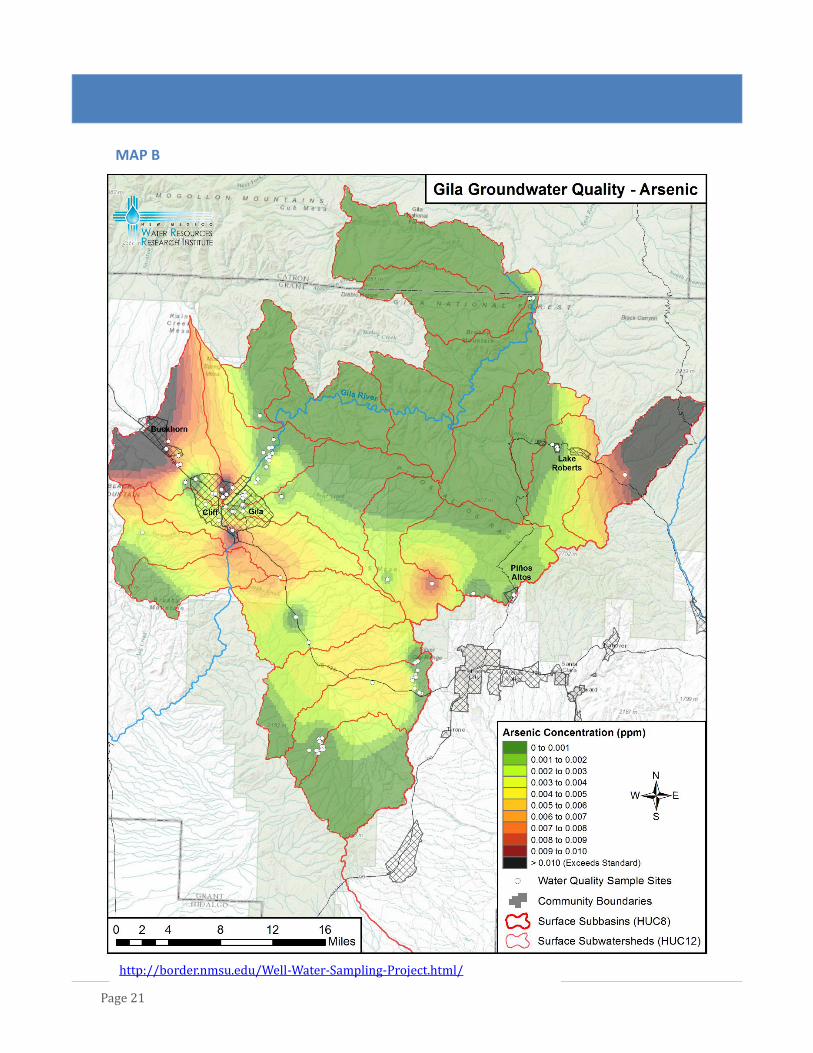
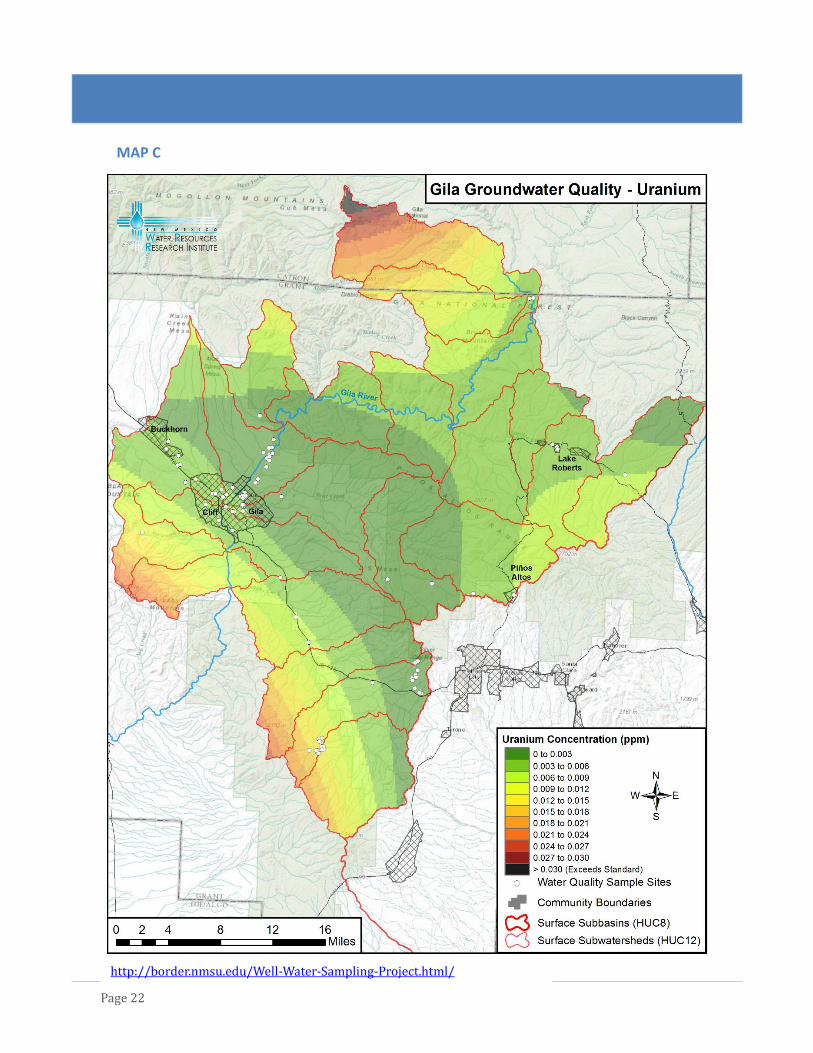
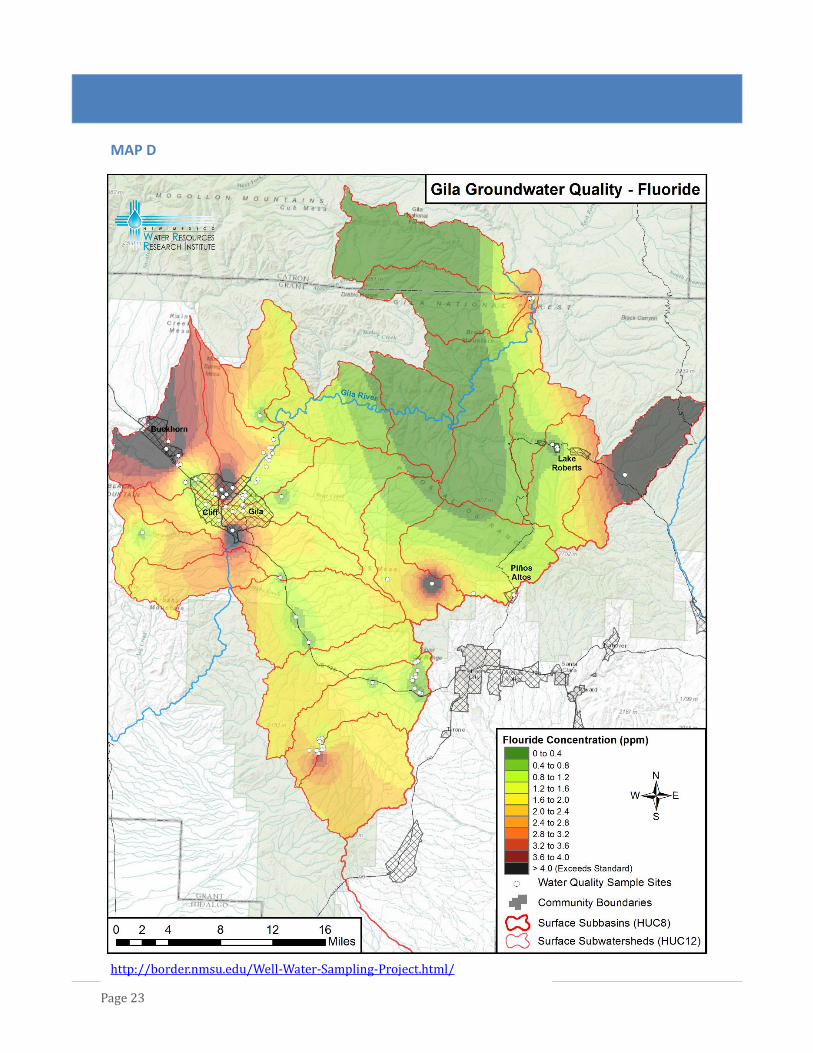
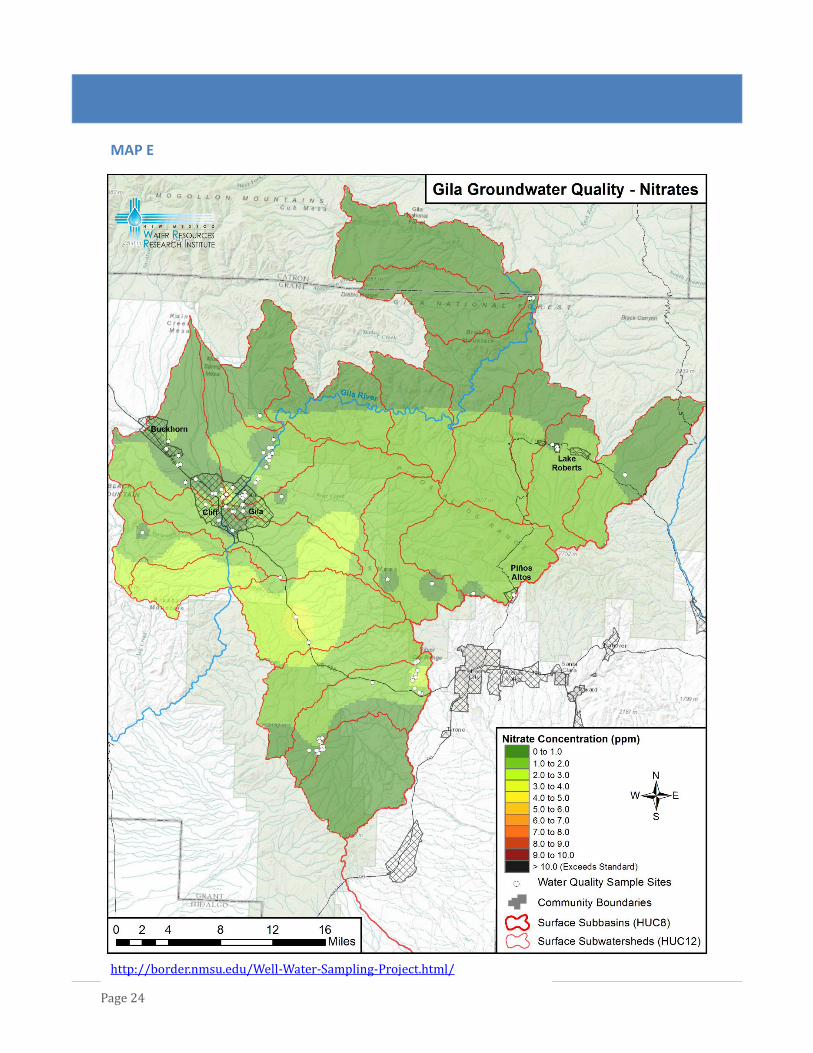
GILA RIVER BASIN
The Gila River Basin, the smallest of the three regional aquifers, demonstrated high potential for
exceedances of arsenic and fluoride, with isolated potential for exceedances of the uranium
standard. The single nitrate exceedance was associated with poor septic maintenance.
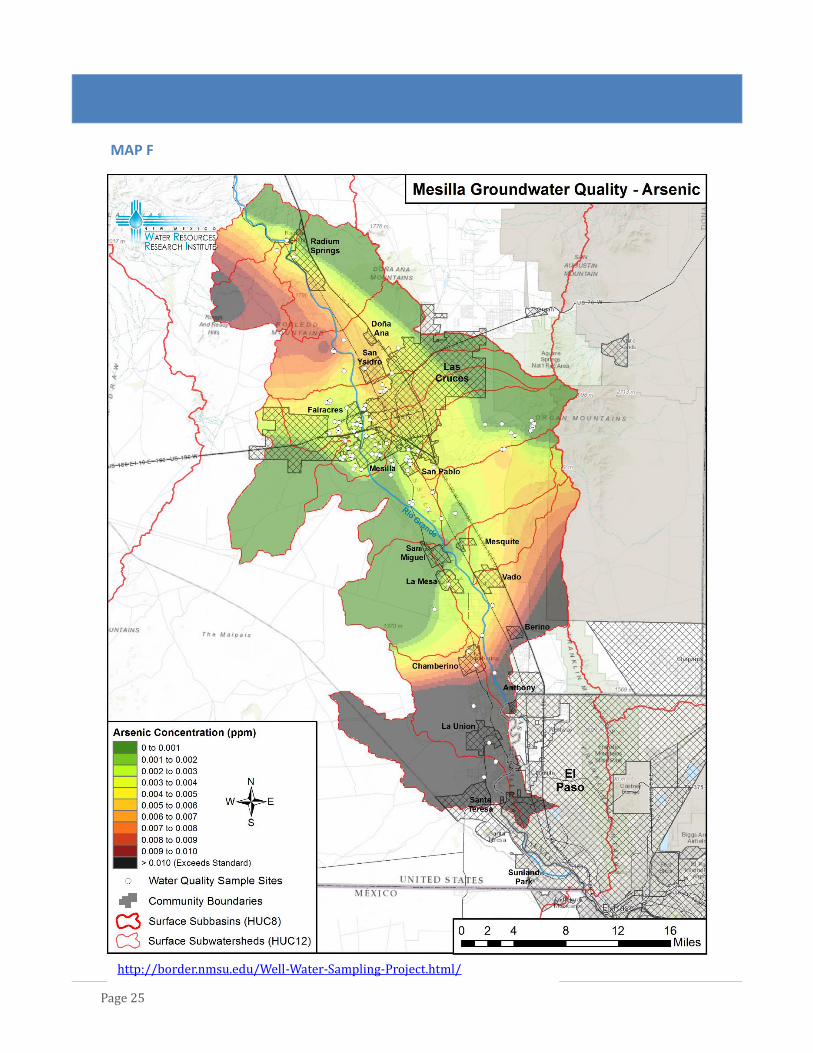
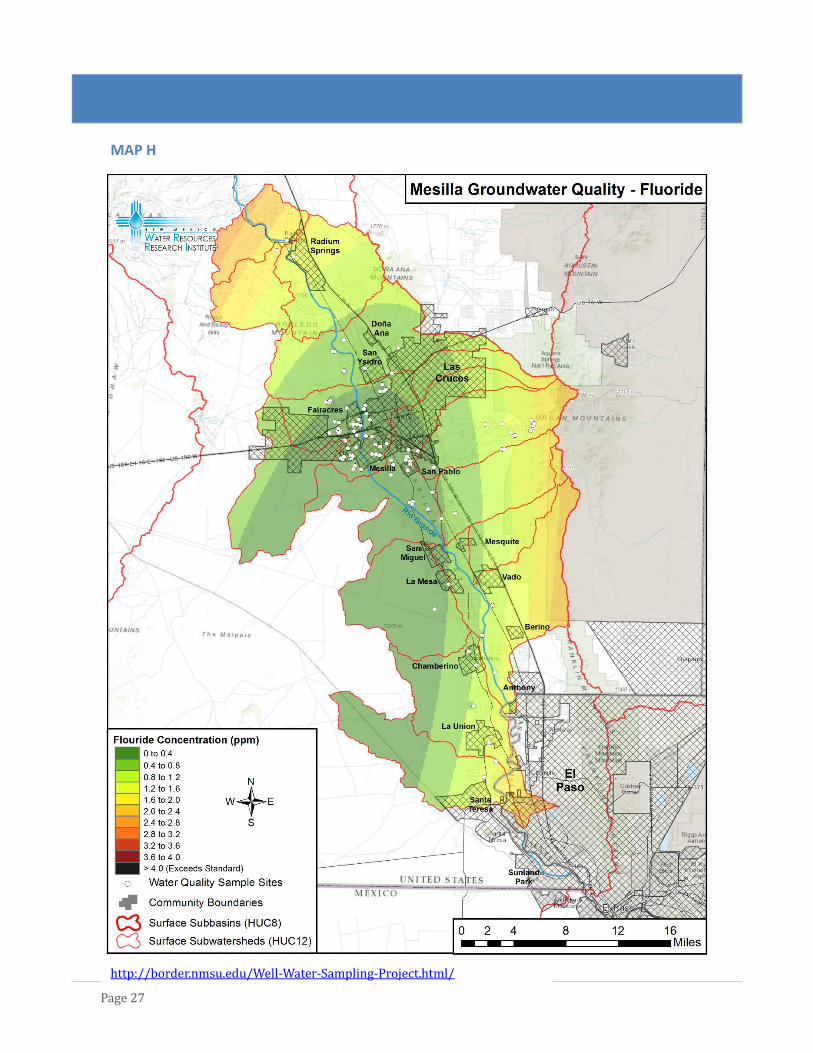
MESILLA BASIN
The Mesilla Basin supplies domestic water to the city of Las Cruces, the largest population center
in the state’s border region. Groundwater south of Las Cruces showed particularly high
Page 8
concentrations of arsenic. Well samples also identified isolated exceedances of uranium and
fluoride.
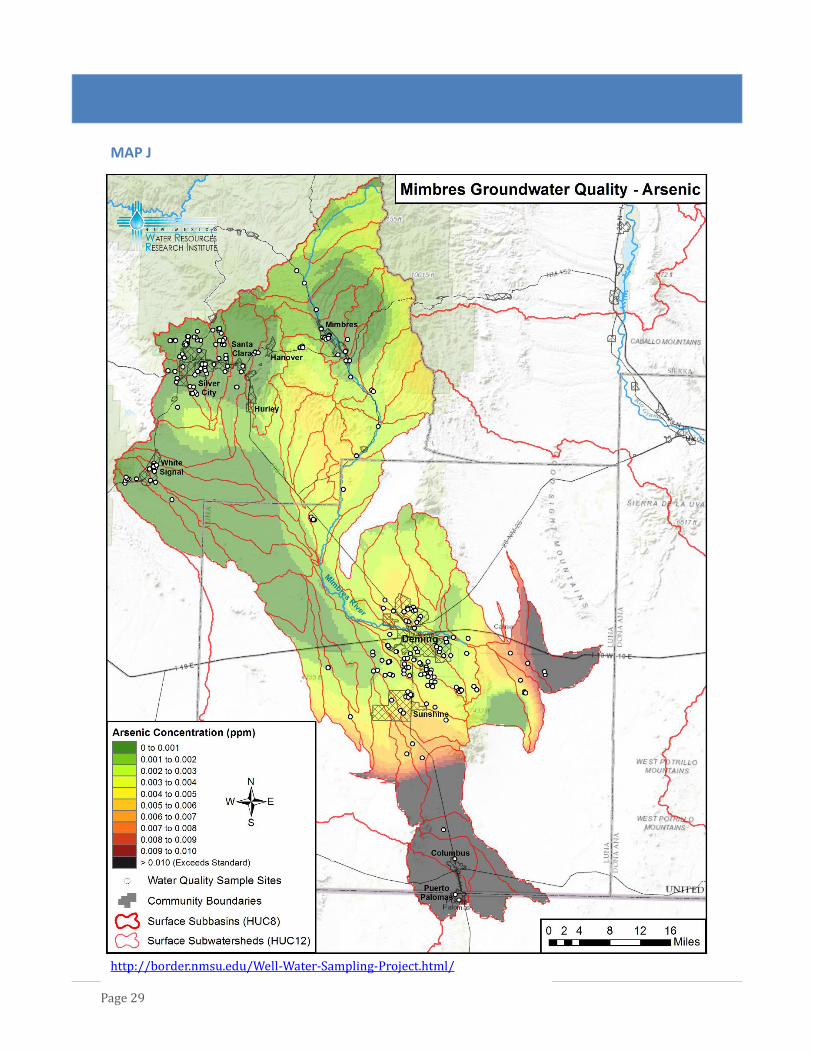
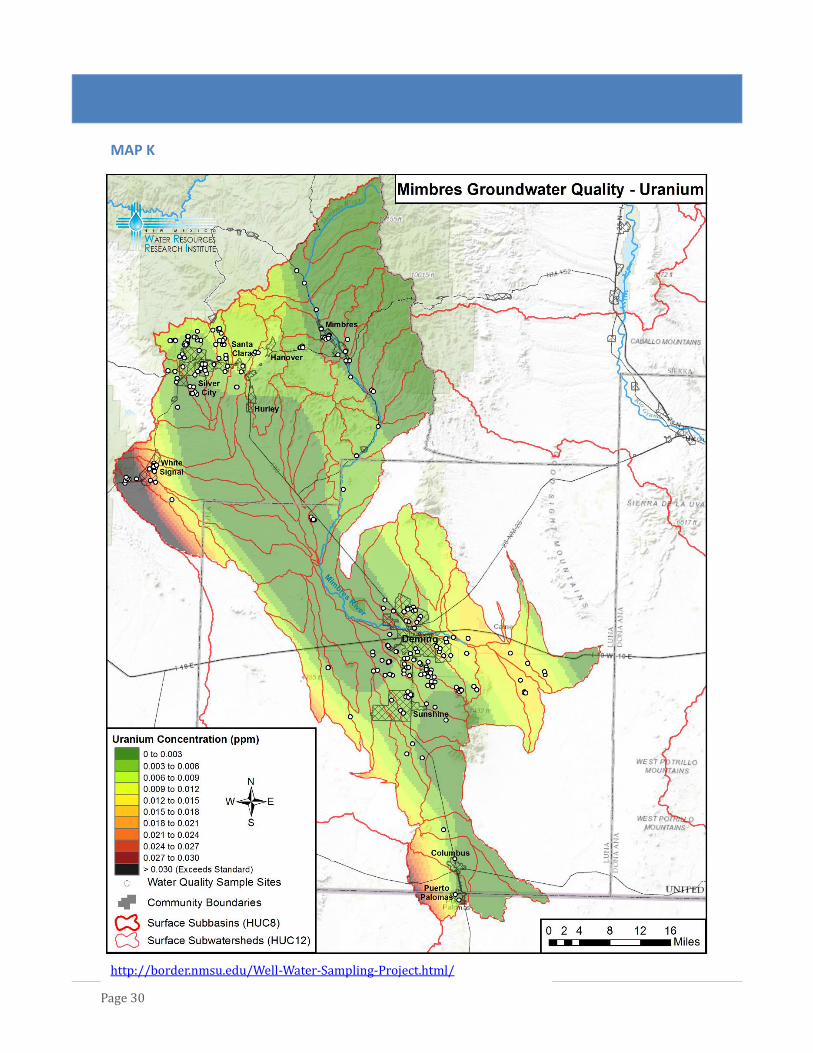
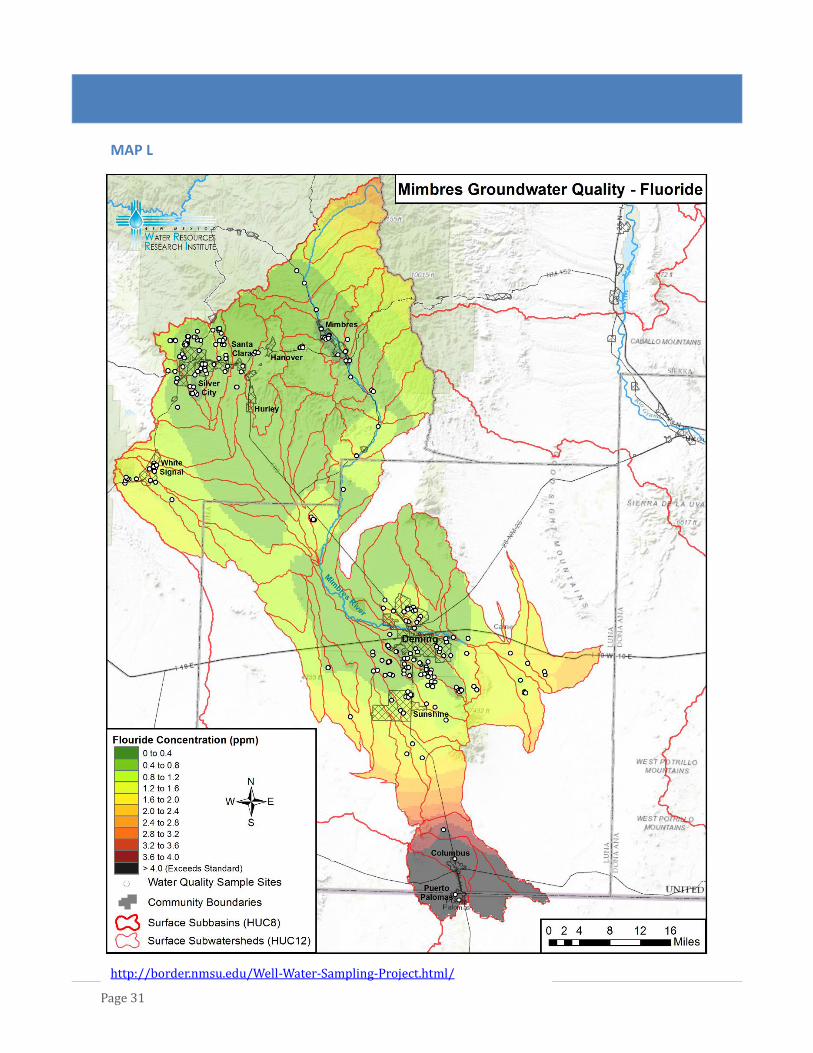
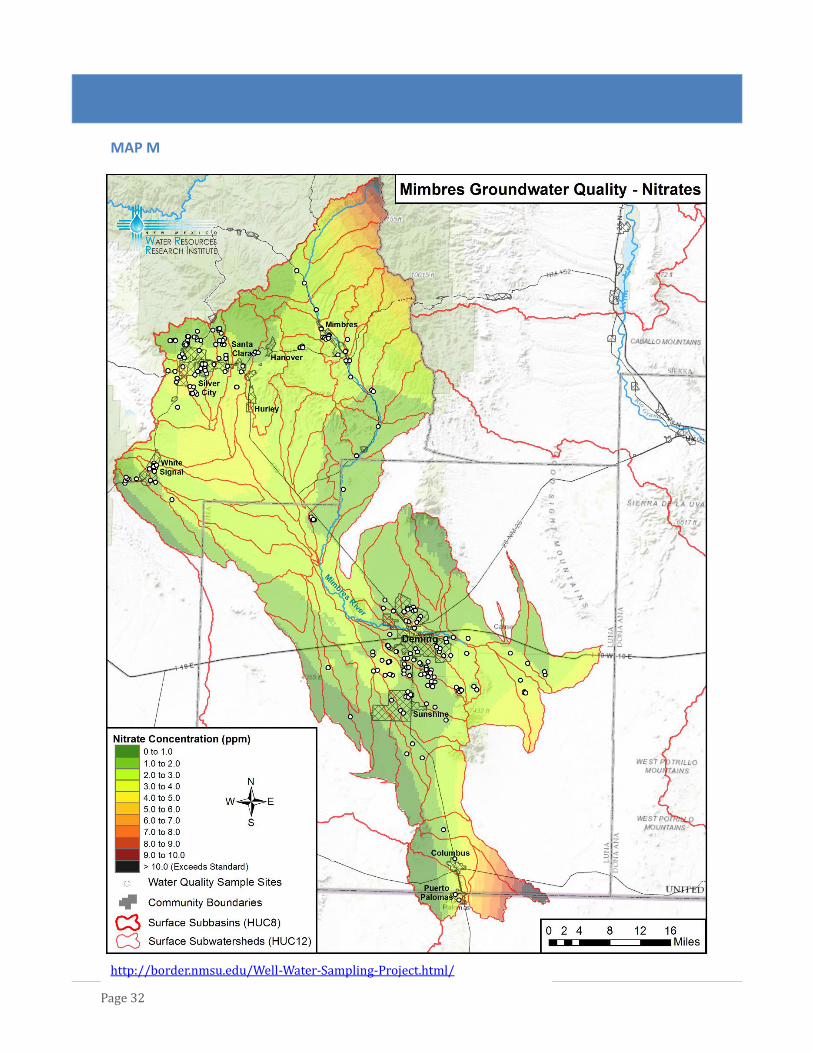
MIMBRES BASIN
Groundwater supplies in the Mimbres Basin showed regional diversity in water quality with
healthy supplies found in the middle of aquifer near Deming. Portions of the aquifer demonstrated
a high potential for elevated levels of arsenic, uranium and fluoride. Nitrates were measured in
isolated areas and are likely due to septic system failures or livestock operations.
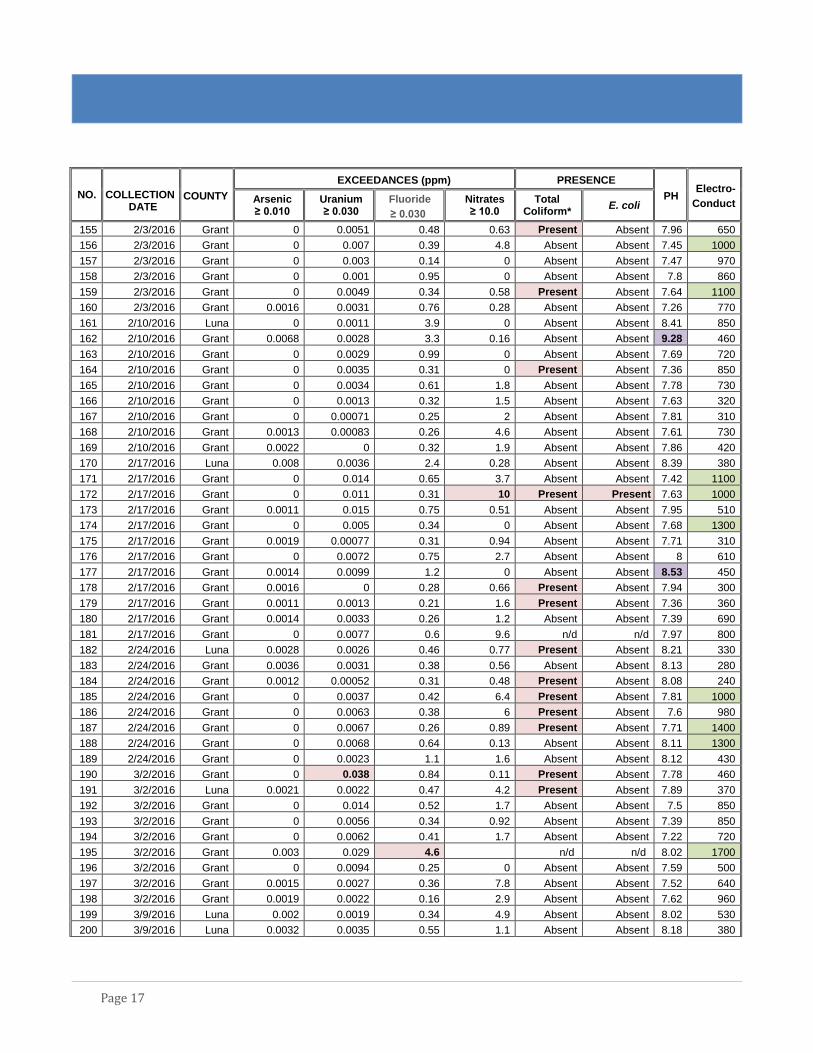
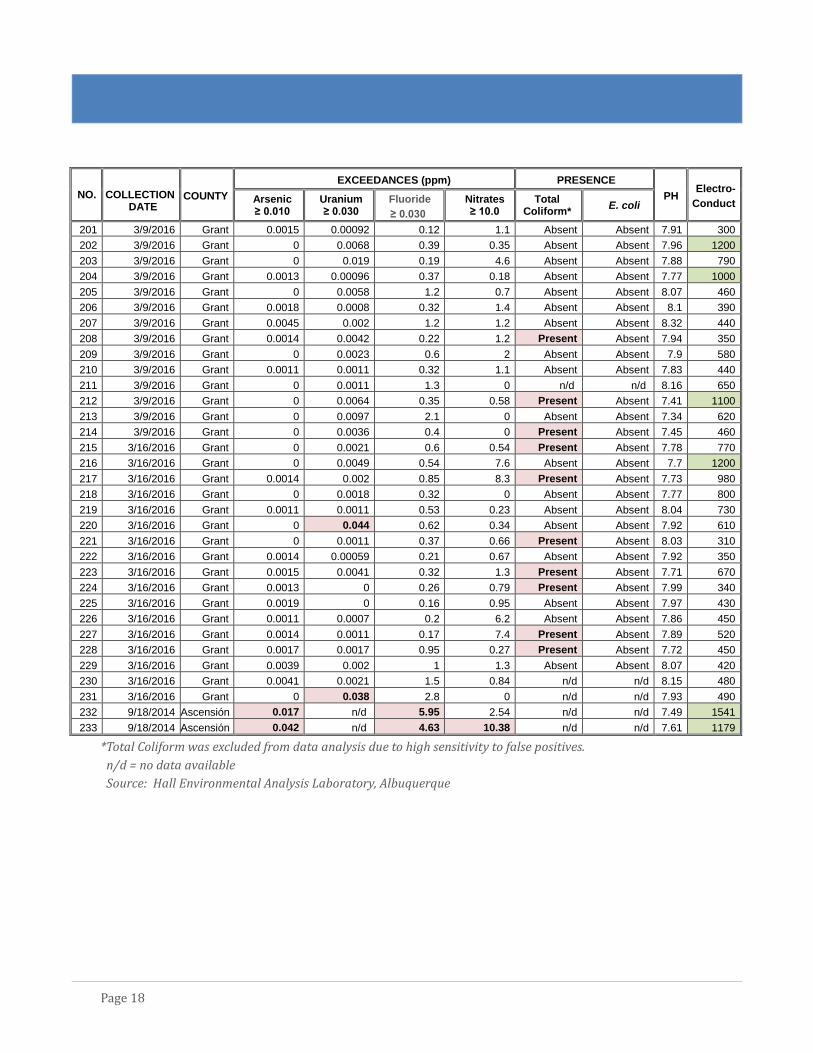
TABLE A
EXCEEDANCES OF DRINKING WATER STANDARD BY AQUIFER
AQUIFER SAMPLES
PRIMARY STANDARD SECONDARY
STANDARD NO STANDARD
Arsenic Uranium Fluoride Nitrates Total Coliform*
E. coli %
Samples PH
% Samples
Electro-Conduct
% Samples
Gila 86 5 3 8 1 29 1 20.9 8 9.3 4 4.7
Mesilla 116 6 1 1 0 15 0 6.9 0 0 58 50.0
Mimbres 233 6 9 7 9 56 4 15.02 3 1.3 25 10.7
TOTALS 435 17 13 16 10 100 5 14.0 11 2.5 87 20.0
* Total Coliform was excluded from data analysis due to high sensitivity to false positives.
Source: Hall Environmental Analysis Laboratory, Albuquerque
TABLE B
GILA AQUIFER - CONTAMINANT CONCENTRATION BY SAMPLE
NO.
COLLECTION DATE COUNTY
EXCEEDANCES (ppm) PRESENCE
PH Electro-Conduct Arsenic
≥ 0.010 Uranium ≥ 0.030
Fluoride ≥ 4.0
Nitrates ≥ 10.0
Total Coliform*
E. coli
1 12/9/2015 Grant 0.01 0.0026 7.8 0.28 Present Absent 8.14 600
2 12/16/2015 Grant 0 0.021 1.1 0 Absent Absent 7.94 1100
3 12/16/2015 Grant 0 0.0048 0.39 4.8 Absent Absent 7.71 600
4 12/16/2015 Grant 0.0046 0.0051 0.51 0.82 Absent Absent 7.82 410
5 12/16/2015 Grant 0 0.033 1.6 0.31 Present Absent 7.71 720
6 12/23/2015 Grant 0.0017 0.0062 2.7 0 n/d n/d 8.13 880
7 12/23/2015 Grant 0.001 0 1.5 0.75 n/d n/d 7.86 360
8 12/23/2015 Grant 0.001 0 1.9 0 n/d n/d 7.79 250
9 12/30/2015 Grant 0 0 1.8 0 n/d n/d 7.37 250
10 1/13/2016 Grant 0.0037 0.019 1.3 0.34 Present Absent 7.69 580
11 1/13/2016 Grant 0 0.0071 0.6 0.56 Absent Absent 7.46 850
12 1/13/2016 Grant 0 0.0072 0.92 0.72 Absent Absent 7.66 740
13 1/13/2016 Grant 0 0.0014 0.22 1.2 Present Absent 8.09 380
14 1/13/2016 Grant 0 0.00068 0.29 1.1 Present Absent 7.96 380

Page 9
NO.
COLLECTION DATE COUNTY
EXCEEDANCES (ppm) PRESENCE
PH Electro-Conduct Arsenic
≥ 0.010 Uranium ≥ 0.030
Fluoride ≥ 4.0
Nitrates ≥ 10.0
Total Coliform*
E. coli
15 1/13/2016 Grant 0.0022 0.0016 0.6 0.64 Present Absent 8.1 410
16 1/13/2016 Grant 0.002 0.0045 1.5 0.51 Present Absent 7.96 370
17 1/13/2016 Grant 0.0012 0.0018 0.34 0.25 Present Absent 7.66 480
18 1/13/2016 Grant 0 0.0017 2.3 1.5 Absent Absent 7.29 500
19 1/13/2016 Grant 0 0 0.3 0.85 Present Absent 6.99 280
20 1/13/2016 Grant 0 0 2.1 0 Absent Absent 7.07 350
21 1/20/2016 Grant 0.0025 0.0035 0.35 0.12 Present Absent 7.82 370
22 1/20/2016 Grant 0.009 0.0042 4 0 Absent Absent 8 540
23 1/20/2016 Grant 0 0.006 2.8 0 Absent Absent 7.91 610
24 1/20/2016 Grant 0 0 2.1 0.18 Absent Absent 7.26 320
25 1/20/2016 Grant 0.0024 0.00055 1.4 1.6 Absent Absent 8.03 350
26 1/20/2016 Grant 0.0015 0.0016 0.32 2.1 Present Present 8.06 440
27 1/20/2016 Grant 0.011 0.0012 3.5 0 Absent Absent 9.92 800
28 1/20/2016 Grant 0 0.011 0.74 0 Absent Absent 7.65 1400
29 1/20/2016 Grant 0.0017 0.003 0.79 1.8 Present Absent 7.88 460
30 1/20/2016 Grant 0.0025 0.0012 0.48 0.83 Absent Absent 8.12 360
31 1/27/2016 Grant 0.0015 0.00099 0.31 3.2 Absent Absent 7.9 440
32 1/27/2016 Grant 0.002 0.0038 0.78 0.98 Present Absent 8.1 360
33 1/27/2016 Grant 0 0.012 0.66 0.21 Present Absent 7.66 880
34 1/27/2016 Grant 0 0.0017 0.36 3.7 Absent Absent 7.97 480
35 1/27/2016 Grant 0 0.04 0.94 0.13 Present Absent 7.69 970
36 1/27/2016 Grant 0.0075 0.0005 1.4 0 Absent Absent 9.96 770
37 1/27/2016 Grant 0 0.012 0.49 0.54 Present Absent 8.8 230
38 1/27/2016 Grant 0.0015 0.0014 0.85 0 Absent Absent 8.06 940
39 1/27/2016 Grant 0.0018 0.0026 1.2 5.3 Absent Absent 7.75 480
40 1/27/2016 Grant 0.025 0.0013 20 0 Absent Absent 8.77 2400
41 2/3/2016 Grant 0 0.0073 1.8 3.4 Present Absent 7.5 980
42 2/3/2016 Grant 0.013 0.02 8.3 78 Present Absent 8.01 1700
43 2/3/2016 Grant 0 0.0082 2.8 0 Absent Absent 7.85 620
44 2/3/2016 Grant 0 0.0017 1.1 0.49 Absent Absent 7.91 340
45 2/10/2016 Grant 0.0012 0.0039 0.82 0.87 Absent Absent 8.04 390
46 2/10/2016 Grant 0.0058 0.0034 4.5 0 Absent Absent 7.9 650
47 2/10/2016 Grant 0.0078 0 6.7 0 Absent Absent 8.78 350
48 2/10/2016 Grant 0.0083 0.003 3.9 0.42 Present Absent 8.88 840
49 2/10/2016 Grant 0.0021 0.0016 0.85 0.38 Absent Absent 8.04 320
50 2/10/2016 Grant 0.024 0.0059 16 5.2 Present Absent 8.83 750
51 2/10/2016 Grant 0.0025 0.0027 2 0.23 Absent Absent 7.58 350
52 2/17/2016 Grant 0 0.0041 0.55 0.77 Absent Absent 7.5 650
53 2/17/2016 Grant 0.0076 0.0024 2.4 0.42 Absent Absent 7.87 340
54 2/17/2016 Grant 0.0024 0.01 0.45 3 Absent Absent 7.93 420
55 2/17/2016 Grant 0.002 0.00075 1.2 1.9 Absent Absent 7.96 340
56 2/24/2016 Grant 0.0029 0.0027 0.57 0.26 Absent Absent 8.14 330
57 2/24/2016 Grant 0.0014 0.0018 0.56 0.7 Present Absent 8.04 420
58 2/24/2016 Grant 0 0.0013 1.3 0.65 Absent Absent 7.94 440
59 2/24/2016 Grant 0.0018 0 0.34 1 Absent Absent 8.08 360
60 2/24/2016 Grant 0.0024 0.0013 0.66 0.65 Present Absent 7.97 290
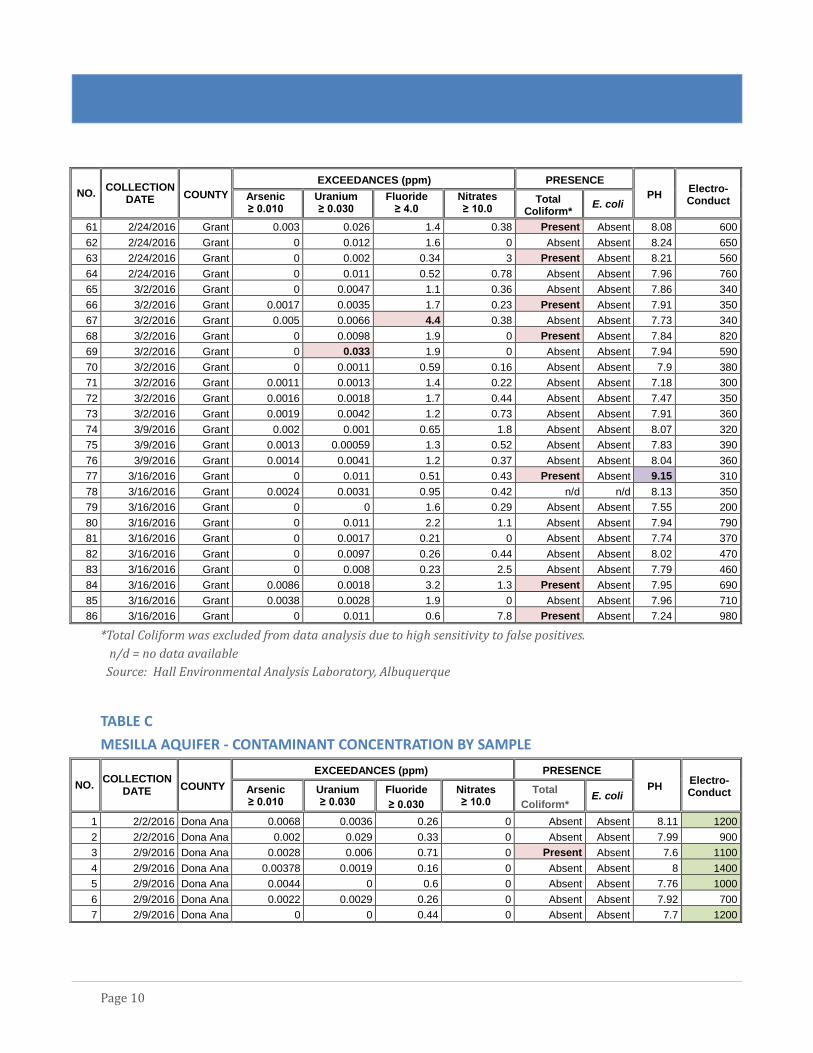
Page 10
NO.
COLLECTION DATE COUNTY
EXCEEDANCES (ppm) PRESENCE
PH Electro-Conduct Arsenic
≥ 0.010 Uranium ≥ 0.030
Fluoride ≥ 4.0
Nitrates ≥ 10.0
Total Coliform*
E. coli
61 2/24/2016 Grant 0.003 0.026 1.4 0.38 Present Absent 8.08 600
62 2/24/2016 Grant 0 0.012 1.6 0 Absent Absent 8.24 650
63 2/24/2016 Grant 0 0.002 0.34 3 Present Absent 8.21 560
64 2/24/2016 Grant 0 0.011 0.52 0.78 Absent Absent 7.96 760
65 3/2/2016 Grant 0 0.0047 1.1 0.36 Absent Absent 7.86 340
66 3/2/2016 Grant 0.0017 0.0035 1.7 0.23 Present Absent 7.91 350
67 3/2/2016 Grant 0.005 0.0066 4.4 0.38 Absent Absent 7.73 340
68 3/2/2016 Grant 0 0.0098 1.9 0 Present Absent 7.84 820
69 3/2/2016 Grant 0 0.033 1.9 0 Absent Absent 7.94 590
70 3/2/2016 Grant 0 0.0011 0.59 0.16 Absent Absent 7.9 380
71 3/2/2016 Grant 0.0011 0.0013 1.4 0.22 Absent Absent 7.18 300
72 3/2/2016 Grant 0.0016 0.0018 1.7 0.44 Absent Absent 7.47 350
73 3/2/2016 Grant 0.0019 0.0042 1.2 0.73 Absent Absent 7.91 360
74 3/9/2016 Grant 0.002 0.001 0.65 1.8 Absent Absent 8.07 320
75 3/9/2016 Grant 0.0013 0.00059 1.3 0.52 Absent Absent 7.83 390
76 3/9/2016 Grant 0.0014 0.0041 1.2 0.37 Absent Absent 8.04 360
77 3/16/2016 Grant 0 0.011 0.51 0.43 Present Absent 9.15 310
78 3/16/2016 Grant 0.0024 0.0031 0.95 0.42 n/d n/d 8.13 350
79 3/16/2016 Grant 0 0 1.6 0.29 Absent Absent 7.55 200
80 3/16/2016 Grant 0 0.011 2.2 1.1 Absent Absent 7.94 790
81 3/16/2016 Grant 0 0.0017 0.21 0 Absent Absent 7.74 370
82 3/16/2016 Grant 0 0.0097 0.26 0.44 Absent Absent 8.02 470
83 3/16/2016 Grant 0 0.008 0.23 2.5 Absent Absent 7.79 460
84 3/16/2016 Grant 0.0086 0.0018 3.2 1.3 Present Absent 7.95 690
85 3/16/2016 Grant 0.0038 0.0028 1.9 0 Absent Absent 7.96 710
86 3/16/2016 Grant 0 0.011 0.6 7.8 Present Absent 7.24 980
*Total Coliform was excluded from data analysis due to high sensitivity to false positives.
n/d = no data available
Source: Hall Environmental Analysis Laboratory, Albuquerque
TABLE C
MESILLA AQUIFER - CONTAMINANT CONCENTRATION BY SAMPLE
NO.
COLLECTION DATE COUNTY
EXCEEDANCES (ppm) PRESENCE
PH Electro-Conduct Arsenic
≥ 0.010 Uranium ≥ 0.030
Fluoride
≥ 0.030
Nitrates ≥ 10.0
Total
Coliform* E. coli
1 2/2/2016 Dona Ana 0.0068 0.0036 0.26 0 Absent Absent 8.11 1200
2 2/2/2016 Dona Ana 0.002 0.029 0.33 0 Absent Absent 7.99 900
3 2/9/2016 Dona Ana 0.0028 0.006 0.71 0 Present Absent 7.6 1100
4 2/9/2016 Dona Ana 0.00378 0.0019 0.16 0 Absent Absent 8 1400
5 2/9/2016 Dona Ana 0.0044 0 0.6 0 Absent Absent 7.76 1000
6 2/9/2016 Dona Ana 0.0022 0.0029 0.26 0 Absent Absent 7.92 700
7 2/9/2016 Dona Ana 0 0 0.44 0 Absent Absent 7.7 1200
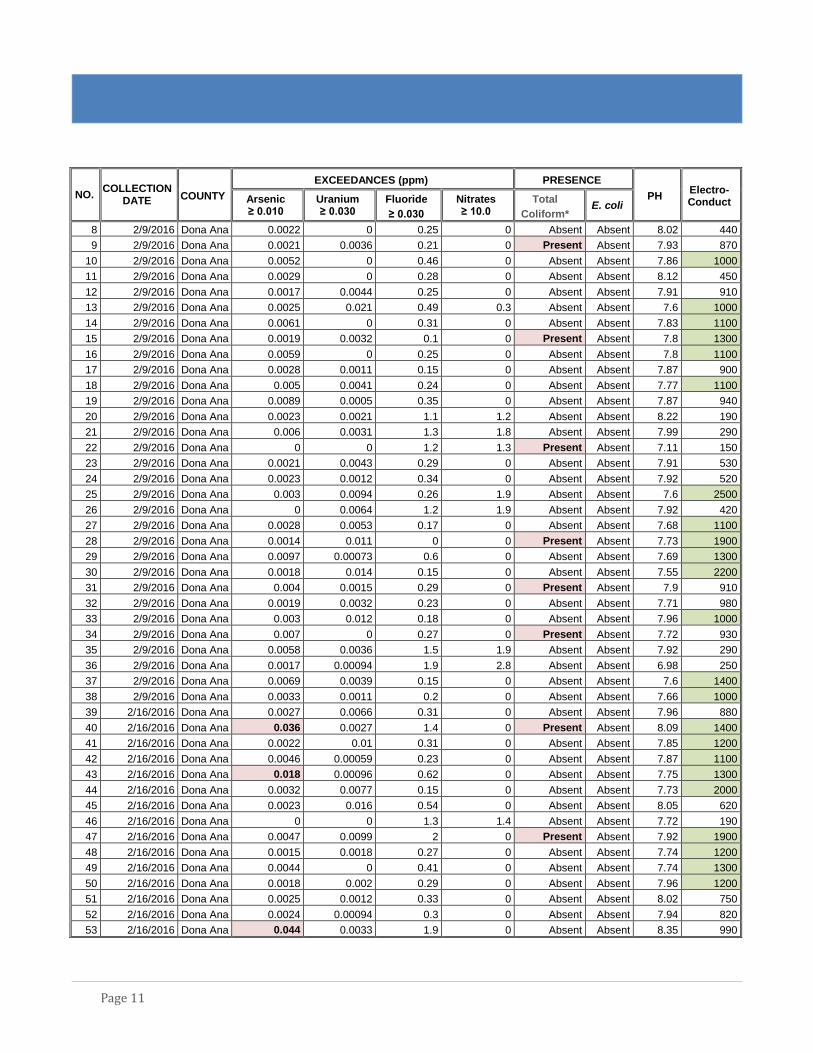
Page 11
NO.
COLLECTION DATE COUNTY
EXCEEDANCES (ppm) PRESENCE
PH Electro-Conduct Arsenic
≥ 0.010 Uranium ≥ 0.030
Fluoride
≥ 0.030
Nitrates ≥ 10.0
Total
Coliform* E. coli
8 2/9/2016 Dona Ana 0.0022 0 0.25 0 Absent Absent 8.02 440
9 2/9/2016 Dona Ana 0.0021 0.0036 0.21 0 Present Absent 7.93 870
10 2/9/2016 Dona Ana 0.0052 0 0.46 0 Absent Absent 7.86 1000
11 2/9/2016 Dona Ana 0.0029 0 0.28 0 Absent Absent 8.12 450
12 2/9/2016 Dona Ana 0.0017 0.0044 0.25 0 Absent Absent 7.91 910
13 2/9/2016 Dona Ana 0.0025 0.021 0.49 0.3 Absent Absent 7.6 1000
14 2/9/2016 Dona Ana 0.0061 0 0.31 0 Absent Absent 7.83 1100
15 2/9/2016 Dona Ana 0.0019 0.0032 0.1 0 Present Absent 7.8 1300
16 2/9/2016 Dona Ana 0.0059 0 0.25 0 Absent Absent 7.8 1100
17 2/9/2016 Dona Ana 0.0028 0.0011 0.15 0 Absent Absent 7.87 900
18 2/9/2016 Dona Ana 0.005 0.0041 0.24 0 Absent Absent 7.77 1100
19 2/9/2016 Dona Ana 0.0089 0.0005 0.35 0 Absent Absent 7.87 940
20 2/9/2016 Dona Ana 0.0023 0.0021 1.1 1.2 Absent Absent 8.22 190
21 2/9/2016 Dona Ana 0.006 0.0031 1.3 1.8 Absent Absent 7.99 290
22 2/9/2016 Dona Ana 0 0 1.2 1.3 Present Absent 7.11 150
23 2/9/2016 Dona Ana 0.0021 0.0043 0.29 0 Absent Absent 7.91 530
24 2/9/2016 Dona Ana 0.0023 0.0012 0.34 0 Absent Absent 7.92 520
25 2/9/2016 Dona Ana 0.003 0.0094 0.26 1.9 Absent Absent 7.6 2500
26 2/9/2016 Dona Ana 0 0.0064 1.2 1.9 Absent Absent 7.92 420
27 2/9/2016 Dona Ana 0.0028 0.0053 0.17 0 Absent Absent 7.68 1100
28 2/9/2016 Dona Ana 0.0014 0.011 0 0 Present Absent 7.73 1900
29 2/9/2016 Dona Ana 0.0097 0.00073 0.6 0 Absent Absent 7.69 1300
30 2/9/2016 Dona Ana 0.0018 0.014 0.15 0 Absent Absent 7.55 2200
31 2/9/2016 Dona Ana 0.004 0.0015 0.29 0 Present Absent 7.9 910
32 2/9/2016 Dona Ana 0.0019 0.0032 0.23 0 Absent Absent 7.71 980
33 2/9/2016 Dona Ana 0.003 0.012 0.18 0 Absent Absent 7.96 1000
34 2/9/2016 Dona Ana 0.007 0 0.27 0 Present Absent 7.72 930
35 2/9/2016 Dona Ana 0.0058 0.0036 1.5 1.9 Absent Absent 7.92 290
36 2/9/2016 Dona Ana 0.0017 0.00094 1.9 2.8 Absent Absent 6.98 250
37 2/9/2016 Dona Ana 0.0069 0.0039 0.15 0 Absent Absent 7.6 1400
38 2/9/2016 Dona Ana 0.0033 0.0011 0.2 0 Absent Absent 7.66 1000
39 2/16/2016 Dona Ana 0.0027 0.0066 0.31 0 Absent Absent 7.96 880
40 2/16/2016 Dona Ana 0.036 0.0027 1.4 0 Present Absent 8.09 1400
41 2/16/2016 Dona Ana 0.0022 0.01 0.31 0 Absent Absent 7.85 1200
42 2/16/2016 Dona Ana 0.0046 0.00059 0.23 0 Absent Absent 7.87 1100
43 2/16/2016 Dona Ana 0.018 0.00096 0.62 0 Absent Absent 7.75 1300
44 2/16/2016 Dona Ana 0.0032 0.0077 0.15 0 Absent Absent 7.73 2000
45 2/16/2016 Dona Ana 0.0023 0.016 0.54 0 Absent Absent 8.05 620
46 2/16/2016 Dona Ana 0 0 1.3 1.4 Absent Absent 7.72 190
47 2/16/2016 Dona Ana 0.0047 0.0099 2 0 Present Absent 7.92 1900
48 2/16/2016 Dona Ana 0.0015 0.0018 0.27 0 Absent Absent 7.74 1200
49 2/16/2016 Dona Ana 0.0044 0 0.41 0 Absent Absent 7.74 1300
50 2/16/2016 Dona Ana 0.0018 0.002 0.29 0 Absent Absent 7.96 1200
51 2/16/2016 Dona Ana 0.0025 0.0012 0.33 0 Absent Absent 8.02 750
52 2/16/2016 Dona Ana 0.0024 0.00094 0.3 0 Absent Absent 7.94 820
53 2/16/2016 Dona Ana 0.044 0.0033 1.9 0 Absent Absent 8.35 990
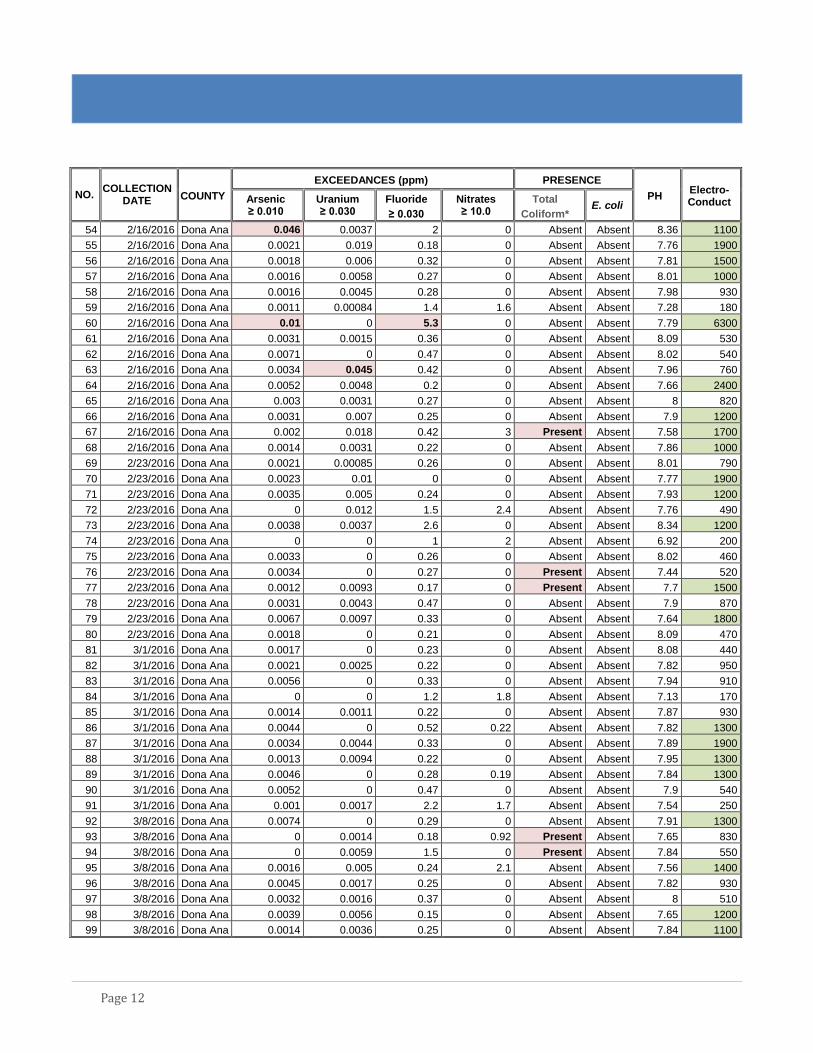
Page 12
NO.
COLLECTION DATE COUNTY
EXCEEDANCES (ppm) PRESENCE
PH Electro-Conduct Arsenic
≥ 0.010 Uranium ≥ 0.030
Fluoride
≥ 0.030
Nitrates ≥ 10.0
Total
Coliform* E. coli
54 2/16/2016 Dona Ana 0.046 0.0037 2 0 Absent Absent 8.36 1100
55 2/16/2016 Dona Ana 0.0021 0.019 0.18 0 Absent Absent 7.76 1900
56 2/16/2016 Dona Ana 0.0018 0.006 0.32 0 Absent Absent 7.81 1500
57 2/16/2016 Dona Ana 0.0016 0.0058 0.27 0 Absent Absent 8.01 1000
58 2/16/2016 Dona Ana 0.0016 0.0045 0.28 0 Absent Absent 7.98 930
59 2/16/2016 Dona Ana 0.0011 0.00084 1.4 1.6 Absent Absent 7.28 180
60 2/16/2016 Dona Ana 0.01 0 5.3 0 Absent Absent 7.79 6300
61 2/16/2016 Dona Ana 0.0031 0.0015 0.36 0 Absent Absent 8.09 530
62 2/16/2016 Dona Ana 0.0071 0 0.47 0 Absent Absent 8.02 540
63 2/16/2016 Dona Ana 0.0034 0.045 0.42 0 Absent Absent 7.96 760
64 2/16/2016 Dona Ana 0.0052 0.0048 0.2 0 Absent Absent 7.66 2400
65 2/16/2016 Dona Ana 0.003 0.0031 0.27 0 Absent Absent 8 820
66 2/16/2016 Dona Ana 0.0031 0.007 0.25 0 Absent Absent 7.9 1200
67 2/16/2016 Dona Ana 0.002 0.018 0.42 3 Present Absent 7.58 1700
68 2/16/2016 Dona Ana 0.0014 0.0031 0.22 0 Absent Absent 7.86 1000
69 2/23/2016 Dona Ana 0.0021 0.00085 0.26 0 Absent Absent 8.01 790
70 2/23/2016 Dona Ana 0.0023 0.01 0 0 Absent Absent 7.77 1900
71 2/23/2016 Dona Ana 0.0035 0.005 0.24 0 Absent Absent 7.93 1200
72 2/23/2016 Dona Ana 0 0.012 1.5 2.4 Absent Absent 7.76 490
73 2/23/2016 Dona Ana 0.0038 0.0037 2.6 0 Absent Absent 8.34 1200
74 2/23/2016 Dona Ana 0 0 1 2 Absent Absent 6.92 200
75 2/23/2016 Dona Ana 0.0033 0 0.26 0 Absent Absent 8.02 460
76 2/23/2016 Dona Ana 0.0034 0 0.27 0 Present Absent 7.44 520
77 2/23/2016 Dona Ana 0.0012 0.0093 0.17 0 Present Absent 7.7 1500
78 2/23/2016 Dona Ana 0.0031 0.0043 0.47 0 Absent Absent 7.9 870
79 2/23/2016 Dona Ana 0.0067 0.0097 0.33 0 Absent Absent 7.64 1800
80 2/23/2016 Dona Ana 0.0018 0 0.21 0 Absent Absent 8.09 470
81 3/1/2016 Dona Ana 0.0017 0 0.23 0 Absent Absent 8.08 440
82 3/1/2016 Dona Ana 0.0021 0.0025 0.22 0 Absent Absent 7.82 950
83 3/1/2016 Dona Ana 0.0056 0 0.33 0 Absent Absent 7.94 910
84 3/1/2016 Dona Ana 0 0 1.2 1.8 Absent Absent 7.13 170
85 3/1/2016 Dona Ana 0.0014 0.0011 0.22 0 Absent Absent 7.87 930
86 3/1/2016 Dona Ana 0.0044 0 0.52 0.22 Absent Absent 7.82 1300
87 3/1/2016 Dona Ana 0.0034 0.0044 0.33 0 Absent Absent 7.89 1900
88 3/1/2016 Dona Ana 0.0013 0.0094 0.22 0 Absent Absent 7.95 1300
89 3/1/2016 Dona Ana 0.0046 0 0.28 0.19 Absent Absent 7.84 1300
90 3/1/2016 Dona Ana 0.0052 0 0.47 0 Absent Absent 7.9 540
91 3/1/2016 Dona Ana 0.001 0.0017 2.2 1.7 Absent Absent 7.54 250
92 3/8/2016 Dona Ana 0.0074 0 0.29 0 Absent Absent 7.91 1300
93 3/8/2016 Dona Ana 0 0.0014 0.18 0.92 Present Absent 7.65 830
94 3/8/2016 Dona Ana 0 0.0059 1.5 0 Present Absent 7.84 550
95 3/8/2016 Dona Ana 0.0016 0.005 0.24 2.1 Absent Absent 7.56 1400
96 3/8/2016 Dona Ana 0.0045 0.0017 0.25 0 Absent Absent 7.82 930
97 3/8/2016 Dona Ana 0.0032 0.0016 0.37 0 Absent Absent 8 510
98 3/8/2016 Dona Ana 0.0039 0.0056 0.15 0 Absent Absent 7.65 1200
99 3/8/2016 Dona Ana 0.0014 0.0036 0.25 0 Absent Absent 7.84 1100

Page 13
NO.
COLLECTION DATE COUNTY
EXCEEDANCES (ppm) PRESENCE
PH Electro-Conduct Arsenic
≥ 0.010 Uranium ≥ 0.030
Fluoride
≥ 0.030
Nitrates ≥ 10.0
Total
Coliform* E. coli
100 3/8/2016 Dona Ana 0.0021 0.0013 1.1 1.3 Absent Absent 7.87 200
101 3/8/2016 Dona Ana 0.0017 0.0046 0.33 0 Absent Absent 7.83 870
102 3/8/2016 Dona Ana 0.0013 0.0086 0.16 0 Absent Absent 7.85 1200
103 3/8/2016 Dona Ana 0 0.0072 0.22 1 Absent Absent 7.89 1300
104 3/15/2016 Dona Ana 0.0019 0.011 0.12 0 Absent Absent 7.64 1300
105 3/15/2016 Dona Ana 0.0046 0.013 0.35 0 Absent Absent 7.58 2000
106 3/15/2016 Dona Ana 0.0021 0.012 0.13 0 n/d 7.83 1700
107 3/15/2016 Dona Ana 0.0016 0.0039 0.31 0 Absent Absent 7.83 910
108 3/15/2016 Dona Ana 0.0052 0.00088 0.26 0 Absent Absent 7.95 450
109 3/15/2016 Dona Ana 0.0035 0.0016 0.32 0 Absent Absent 8.05 460
110 3/22/2016 Dona Ana 0.0025 0.0047 0.22 0 Absent Absent 8.12 990
111 3/22/2016 Dona Ana 0.032 0.0014 1.2 0 Absent Absent 8.35 1000
112 3/22/2016 Dona Ana 0.0015 0.0011 1.9 1.8 Present Absent 7.49 190
113 3/22/2016 Dona Ana 0.007 0 0.34 0 Absent Absent 7.94 1400
114 3/22/2016 Dona Ana 0.0031 0 0.27 0 Absent Absent 8.17 870
115 3/22/2016 Dona Ana 0.0031 0 0.21 0 Absent Absent 8.09 940
116 3/22/2016 Dona Ana 0.0024 0.0022 0.21 0 Absent Absent 8.26 1300
*Total Coliform was excluded from data analysis due to high sensitivity to false positives.
n/d = no data available
Source: Hall Environmental Analysis Laboratory, Albuquerque
TABLE D
MIMBRES AQUIFER - CONTAMINANT CONCENTRATION BY SAMPLE
NO.
COLLECTION
DATE COUNTY
EXCEEDANCES (ppm) PRESENCE
PH Electro-
Conduct Arsenic ≥ 0.010
Uranium ≥ 0.030
Fluoride
≥ 0.030
Nitrates ≥ 10.0
Total Coliform*
E. coli
1 3/11/2015 Luna 0.0031 0.0028 0.86 3 Present Absent n/d n/d
2 3/11/2015 Luna 0.0036 0.003 0.44 0.31 Absent Absent n/d n/d
3 3/11/2015 Luna 0.0031 0.003 0.95 0.26 Absent Absent n/d n/d
4 3/11/2015 Luna 0.003 0.0034 0.93 0.27 Present Absent n/d n/d
5 3/11/2015 Luna 0 0 0.41 5.5 Absent Absent n/d n/d
6 3/11/2015 Luna 0.0027 0.0025 0.63 0.88 Absent Absent n/d n/d
7 3/11/2015 Luna 0.0031 0.0036 0.75 0.57 Absent Absent n/d n/d
8 3/11/2015 Luna 0.003 0.003 0.84 0.27 Absent Absent n/d n/d
9 3/11/2015 Luna 0.0022 0.0024 0.42 3 Absent Absent n/d n/d
10 3/18/2015 Luna 0.0016 0.0016 1.1 0.43 Absent Absent n/d n/d
11 3/18/2015 Luna 0.0029 0.0031 0.82 0.52 Absent Absent n/d n/d
12 3/18/2015 Luna 0 0.014 1.2 3.4 Absent Absent n/d n/d
13 3/18/2015 Luna 0 0.014 1.3 3.4 Absent Absent n/d n/d
14 3/18/2015 Luna 0 0.015 1.1 5.7 Absent Absent n/d n/d
15 3/18/2015 Luna 0.0033 0.0031 0.85 0.31 Absent Absent n/d n/d
16 3/25/2015 Luna 0 0.0026 0.46 26 Absent Absent n/d n/d
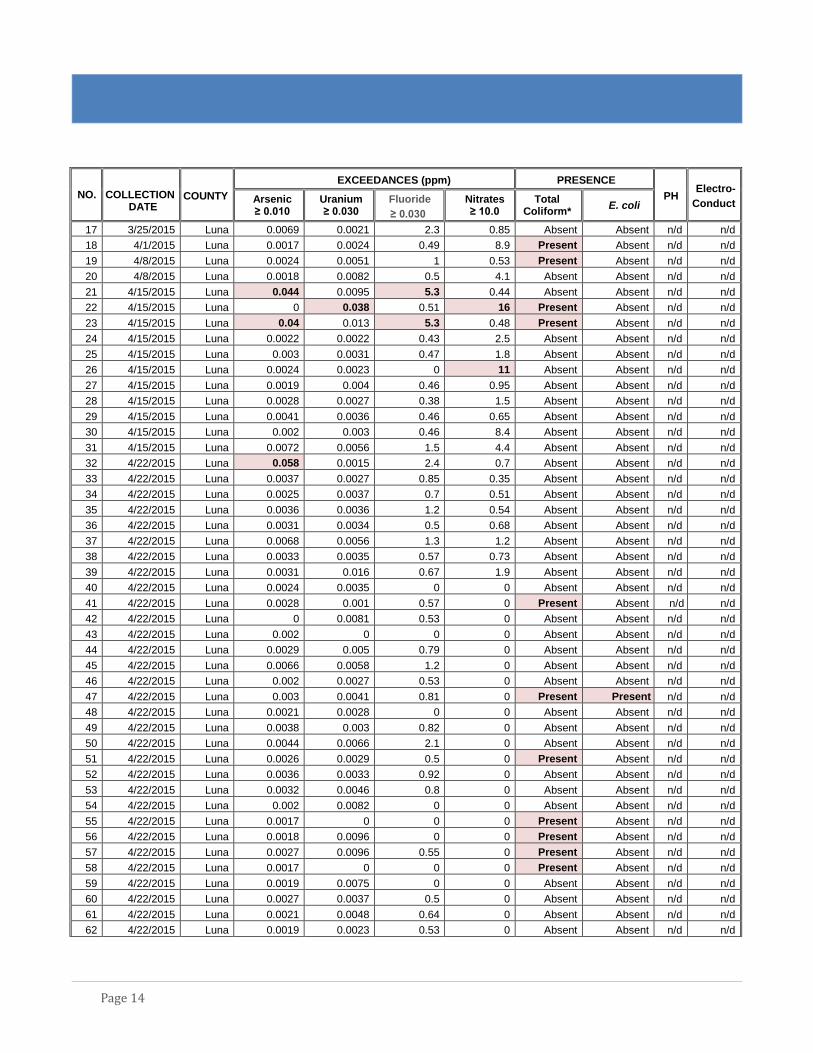
Page 14
NO.
COLLECTION
DATE COUNTY
EXCEEDANCES (ppm) PRESENCE
PH Electro-
Conduct Arsenic ≥ 0.010
Uranium ≥ 0.030
Fluoride
≥ 0.030
Nitrates ≥ 10.0
Total Coliform*
E. coli
17 3/25/2015 Luna 0.0069 0.0021 2.3 0.85 Absent Absent n/d n/d
18 4/1/2015 Luna 0.0017 0.0024 0.49 8.9 Present Absent n/d n/d
19 4/8/2015 Luna 0.0024 0.0051 1 0.53 Present Absent n/d n/d
20 4/8/2015 Luna 0.0018 0.0082 0.5 4.1 Absent Absent n/d n/d
21 4/15/2015 Luna 0.044 0.0095 5.3 0.44 Absent Absent n/d n/d
22 4/15/2015 Luna 0 0.038 0.51 16 Present Absent n/d n/d
23 4/15/2015 Luna 0.04 0.013 5.3 0.48 Present Absent n/d n/d
24 4/15/2015 Luna 0.0022 0.0022 0.43 2.5 Absent Absent n/d n/d
25 4/15/2015 Luna 0.003 0.0031 0.47 1.8 Absent Absent n/d n/d
26 4/15/2015 Luna 0.0024 0.0023 0 11 Absent Absent n/d n/d
27 4/15/2015 Luna 0.0019 0.004 0.46 0.95 Absent Absent n/d n/d
28 4/15/2015 Luna 0.0028 0.0027 0.38 1.5 Absent Absent n/d n/d
29 4/15/2015 Luna 0.0041 0.0036 0.46 0.65 Absent Absent n/d n/d
30 4/15/2015 Luna 0.002 0.003 0.46 8.4 Absent Absent n/d n/d
31 4/15/2015 Luna 0.0072 0.0056 1.5 4.4 Absent Absent n/d n/d
32 4/22/2015 Luna 0.058 0.0015 2.4 0.7 Absent Absent n/d n/d
33 4/22/2015 Luna 0.0037 0.0027 0.85 0.35 Absent Absent n/d n/d
34 4/22/2015 Luna 0.0025 0.0037 0.7 0.51 Absent Absent n/d n/d
35 4/22/2015 Luna 0.0036 0.0036 1.2 0.54 Absent Absent n/d n/d
36 4/22/2015 Luna 0.0031 0.0034 0.5 0.68 Absent Absent n/d n/d
37 4/22/2015 Luna 0.0068 0.0056 1.3 1.2 Absent Absent n/d n/d
38 4/22/2015 Luna 0.0033 0.0035 0.57 0.73 Absent Absent n/d n/d
39 4/22/2015 Luna 0.0031 0.016 0.67 1.9 Absent Absent n/d n/d
40 4/22/2015 Luna 0.0024 0.0035 0 0 Absent Absent n/d n/d
41 4/22/2015 Luna 0.0028 0.001 0.57 0 Present Absent n/d n/d
42 4/22/2015 Luna 0 0.0081 0.53 0 Absent Absent n/d n/d
43 4/22/2015 Luna 0.002 0 0 0 Absent Absent n/d n/d
44 4/22/2015 Luna 0.0029 0.005 0.79 0 Absent Absent n/d n/d
45 4/22/2015 Luna 0.0066 0.0058 1.2 0 Absent Absent n/d n/d
46 4/22/2015 Luna 0.002 0.0027 0.53 0 Absent Absent n/d n/d
47 4/22/2015 Luna 0.003 0.0041 0.81 0 Present Present n/d n/d
48 4/22/2015 Luna 0.0021 0.0028 0 0 Absent Absent n/d n/d
49 4/22/2015 Luna 0.0038 0.003 0.82 0 Absent Absent n/d n/d
50 4/22/2015 Luna 0.0044 0.0066 2.1 0 Absent Absent n/d n/d
51 4/22/2015 Luna 0.0026 0.0029 0.5 0 Present Absent n/d n/d
52 4/22/2015 Luna 0.0036 0.0033 0.92 0 Absent Absent n/d n/d
53 4/22/2015 Luna 0.0032 0.0046 0.8 0 Absent Absent n/d n/d
54 4/22/2015 Luna 0.002 0.0082 0 0 Absent Absent n/d n/d
55 4/22/2015 Luna 0.0017 0 0 0 Present Absent n/d n/d
56 4/22/2015 Luna 0.0018 0.0096 0 0 Present Absent n/d n/d
57 4/22/2015 Luna 0.0027 0.0096 0.55 0 Present Absent n/d n/d
58 4/22/2015 Luna 0.0017 0 0 0 Present Absent n/d n/d
59 4/22/2015 Luna 0.0019 0.0075 0 0 Absent Absent n/d n/d
60 4/22/2015 Luna 0.0027 0.0037 0.5 0 Absent Absent n/d n/d
61 4/22/2015 Luna 0.0021 0.0048 0.64 0 Absent Absent n/d n/d
62 4/22/2015 Luna 0.0019 0.0023 0.53 0 Absent Absent n/d n/d

Page 15
NO.
COLLECTION
DATE COUNTY
EXCEEDANCES (ppm) PRESENCE
PH Electro-
Conduct Arsenic ≥ 0.010
Uranium ≥ 0.030
Fluoride
≥ 0.030
Nitrates ≥ 10.0
Total Coliform*
E. coli
63 4/22/2015 Luna 0.002 0.0023 0.52 0 Absent Absent n/d n/d
64 4/22/2015 Luna 0.0027 0.0026 1 1.1 Absent Absent n/d n/d
65 4/22/2015 Luna 0.0019 0.0069 0.49 6.6 Absent Absent n/d n/d
66 4/29/2015 Luna 0.0051 0.0037 1.2 0 Absent Absent n/d n/d
67 4/29/2015 Luna 0.0017 0.0081 0.57 4.2 Absent Absent n/d n/d
68 4/29/2015 Luna 0.0027 0.0027 0.42 1.2 Absent Absent n/d n/d
69 5/6/2015 Luna 0.0017 0.0026 0.91 0.54 Absent Absent n/d n/d
70 5/6/2015 Luna 0.0018 0.00063 0.46 3.9 Absent Absent n/d n/d
71 5/6/2015 Luna 0.009 0.025 5 3.3 Absent Absent n/d n/d
72 5/13/2015 Luna 0.0025 0.0045 0 0 Present Absent n/d n/d
73 5/20/2015 Luna 0.0029 0.0061 1.1 0.6 Absent Absent n/d n/d
74 5/20/2015 Luna 0.003 0.005 1.1 0.67 Absent Absent n/d n/d
75 5/20/2015 Luna 0.0018 0.0021 0.48 2.6 Present Absent n/d n/d
76 5/20/2015 Luna 0.0028 0.0034 0.47 0.73 Absent Absent n/d n/d
77 5/20/2015 Luna 0.0027 0.0051 0.86 0.59 Absent Absent n/d n/d
78 5/20/2015 Luna 0.0086 0.0091 2.8 1.5 Present Absent n/d n/d
79 5/20/2015 Luna 0.004 0.0029 0.78 0.39 Absent Absent n/d n/d
80 5/20/2015 Luna 0.0018 0.004 0.55 0.77 Absent Absent n/d n/d
81 5/20/2015 Luna 0.003 0.0031 0.51 2.2 Absent Absent n/d n/d
82 5/20/2015 Luna 0.0025 0.0043 0.56 2.4 Absent Absent n/d n/d
83 5/20/2015 Luna 0.0015 0.021 0.43 14 Absent Absent n/d n/d
84 5/20/2015 Luna 0 0.0029 0.55 8.4 Absent Absent n/d n/d
85 5/20/2015 Luna 0.0021 0.0032 0.5 8.9 Absent Absent n/d n/d
86 5/20/2015 Luna 0.0017 0.0022 0.52 3.9 Absent Absent n/d n/d
87 5/20/2015 Luna 0.003 0.0029 0.72 1 Absent Absent n/d n/d
88 5/20/2015 Luna 0.041 0.025 1.6 0.87 Absent Absent n/d n/d
89 5/20/2015 Luna 0.0029 0.004 0 0 Present Present n/d n/d
90 5/20/2015 Luna 0.0027 0.0037 0.51 1.2 Absent Absent n/d n/d
91 5/20/2015 Luna 0.0033 0.0039 0.86 0.52 Absent Absent n/d n/d
92 5/27/2015 Luna 0.0031 0.0031 0.56 1.4 Absent Absent n/d n/d
93 5/27/2015 Luna 0.0023 0.0038 1.7 0.39 Absent Absent n/d n/d
94 5/27/2015 Luna 0.0034 0.002 4.1 0.55 Absent Absent n/d n/d
95 5/27/2015 Luna 0.0025 0.0034 0.46 2.6 Absent Absent n/d n/d
96 5/27/2015 Luna 0.0026 0 2.5 0.44 Absent Absent n/d n/d
97 5/27/2015 Luna 0.0048 0.0086 1.7 0.57 Absent Absent n/d n/d
98 5/27/2015 Luna 0.0019 0.0039 0.63 0.74 Absent Absent n/d n/d
99 5/27/2015 Luna 0.0036 0.0035 0.57 1.1 Present Absent n/d n/d
100 5/27/2015 Luna 0.0019 0.0024 0.5 2.6 Absent Absent n/d n/d
101 5/27/2015 Luna 0.0017 0.0023 0.5 1.5 Absent Absent n/d n/d
102 5/27/2015 Luna 0.0027 0.0029 2.7 0.44 Absent Absent n/d n/d
103 5/27/2015 Luna 0.0043 0.003 1.1 0.67 Absent Absent n/d n/d
104 5/27/2015 Luna 0.0018 0.0026 0.41 12 Absent Absent n/d n/d
105 5/27/2015 Luna 0.0029 0.0038 0.86 0.53 Present Absent n/d n/d
106 5/27/2015 Luna 0.0029 0.0045 0.76 0.52 Absent Absent n/d n/d
107 12/9/2015 Grant 0 0.005 0.89 2 Present Absent 7.77 450
108 12/9/2015 Grant 0.0011 0.0024 0.22 3 Absent Absent 7.84 510
Page 16
NO.
COLLECTION
DATE COUNTY
EXCEEDANCES (ppm) PRESENCE
PH Electro-
Conduct Arsenic ≥ 0.010
Uranium ≥ 0.030
Fluoride
≥ 0.030
Nitrates ≥ 10.0
Total Coliform*
E. coli
109 12/9/2015 Grant 0 0.037 1.4 0.11 Absent Absent 7.8 540
110 12/9/2015 Grant 0 0.011 0.87 0.29 Absent Absent 7.72 1400
111 12/9/2015 Grant 0.0032 0.0041 0.38 0.43 Absent Absent 8.17 250
112 12/9/2015 Grant 0 0.0068 0.36 0.11 Present Absent 7.67 1100
113 No record Grant 0.0015 0.0011 0.25 0.52 n/d n/d 7.98 290
114 No record Grant 0 0.0085 1.3 2.9 n/d n/d 7.89 470
115 No record Grant 0.002 0.0026 2.5 0 Absent Absent 8.96 250
116 No record Grant 0 0.025 2.3 2.3 Absent Absent 8.11 470
117 No record Grant 0 0.012 1.9 2.4 Absent Absent 7.91 400
118 No record Grant 0 0 0.25 1.9 n/d n/d 7.77 450
119 1/6/2016 Grant 0 0.01 0.41 1.2 Present Absent 7.96 930
120 1/6/2016 Grant 0 0.0095 0.32 0.12 Present Absent 8.03 1000
121 1/13/2016 Grant 0.0023 0.0018 0.19 4.7 Absent Absent 7.74 1100
122 1/13/2016 Grant 0 0.0051 0.24 0.17 Absent Absent 7.84 1100
123 1/13/2016 Grant 0.0017 0.0011 1.1 0 Present Absent 7.95 760
124 1/13/2016 Grant 0 0.034 1.1 0 Absent Absent 7.36 950
125 1/13/2016 Grant 0 0.0077 1.7 1.7 Absent Absent 7.81 400
126 1/13/2016 Grant 0 0.0072 0.91 0.13 Absent Absent 7.22 470
127 1/13/2016 Grant 0 0.042 2.7 4 Present Absent 7.65 550
128 1/13/2016 Grant 0.0011 0.0075 0.39 0 Absent Absent 8.06 390
129 1/13/2016 Grant 0 0.00055 0.21 1.8 Absent Absent 7.6 990
130 1/13/2016 Grant 0 0.012 1.3 2 Present Absent 7.61 480
131 1/13/2016 Grant 0 0.0026 0.37 0 Present Present 7.46 1200
132 1/20/2016 Grant 0.0013 0.0025 0.28 3.7 Absent Absent 8.09 570
133 1/20/2016 Grant 0 0.00082 1.5 0.34 Absent Absent 8.23 460
134 1/20/2016 Grant 0 0.00089 0.15 5.2 Present Absent 7.82 510
135 1/20/2016 Grant 0 0.00077 0.14 8.3 Present Absent 7.96 460
136 1/20/2016 Grant 0 0.00063 3.1 0 Absent Absent 7.72 850
137 1/20/2016 Grant 0.0018 0 0.4 12 Present Absent 7.8 580
138 1/15/2016 Grant 0.0022 0.0032 0.45 0.7 Absent Absent 7.98 360
139 1/20/2016 Grant 0 0.0091 1.3 0 Absent Absent 7.69 1400
140 1/27/2016 Grant 0 0.014 0.39 7.4 Absent Absent 7.88 970
141 1/27/2016 Grant 0 0.0043 0.4 0.75 Present Absent 8.06 370
142 1/27/2016 Grant 0 0.012 0.47 0.21 Absent Absent 7.95 760
143 1/27/2016 Grant 0 0.0024 0.37 0 Absent Absent 7.82 580
144 1/27/2016 Grant 0 0.0085 0.633 5 Present Absent 7.5 1000
145 1/27/2016 Grant 0.0027 0.00076 0.32 11 Absent Absent 8.19 550
146 1/27/2016 Grant 0 0.011 0.48 1.2 Present Absent 7.68 610
147 1/27/2016 Grant 0 0.0029 0.45 0 Absent Absent 7.79 570
148 1/27/2016 Grant 0 0.0047 0.17 0.84 Absent Absent 7.74 1200
149 1/27/2016 Grant 0.0013 0 0.17 0.63 Absent Absent 7.86 290
150 1/27/2016 Grant 0 0.0074 0.37 0.24 Absent Absent 7.5 700
151 1/27/2016 Grant 0 0.0014 0.61 0.12 Absent Absent 7.62 810
152 2/3/2016 Grant 0 0.046 1 0 Absent Absent 7.64 630
153 2/3/2016 Grant 0 0.12 2 1.2 Absent Absent 7.84 490
154 2/3/2016 Grant 0 0.023 0.35 2.8 Absent Absent 7.55 1100
Page 17
NO.
COLLECTION
DATE COUNTY
EXCEEDANCES (ppm) PRESENCE
PH Electro-
Conduct Arsenic ≥ 0.010
Uranium ≥ 0.030
Fluoride
≥ 0.030
Nitrates ≥ 10.0
Total Coliform*
E. coli
155 2/3/2016 Grant 0 0.0051 0.48 0.63 Present Absent 7.96 650
156 2/3/2016 Grant 0 0.007 0.39 4.8 Absent Absent 7.45 1000
157 2/3/2016 Grant 0 0.003 0.14 0 Absent Absent 7.47 970
158 2/3/2016 Grant 0 0.001 0.95 0 Absent Absent 7.8 860
159 2/3/2016 Grant 0 0.0049 0.34 0.58 Present Absent 7.64 1100
160 2/3/2016 Grant 0.0016 0.0031 0.76 0.28 Absent Absent 7.26 770
161 2/10/2016 Luna 0 0.0011 3.9 0 Absent Absent 8.41 850
162 2/10/2016 Grant 0.0068 0.0028 3.3 0.16 Absent Absent 9.28 460
163 2/10/2016 Grant 0 0.0029 0.99 0 Absent Absent 7.69 720
164 2/10/2016 Grant 0 0.0035 0.31 0 Present Absent 7.36 850
165 2/10/2016 Grant 0 0.0034 0.61 1.8 Absent Absent 7.78 730
166 2/10/2016 Grant 0 0.0013 0.32 1.5 Absent Absent 7.63 320
167 2/10/2016 Grant 0 0.00071 0.25 2 Absent Absent 7.81 310
168 2/10/2016 Grant 0.0013 0.00083 0.26 4.6 Absent Absent 7.61 730
169 2/10/2016 Grant 0.0022 0 0.32 1.9 Absent Absent 7.86 420
170 2/17/2016 Luna 0.008 0.0036 2.4 0.28 Absent Absent 8.39 380
171 2/17/2016 Grant 0 0.014 0.65 3.7 Absent Absent 7.42 1100
172 2/17/2016 Grant 0 0.011 0.31 10 Present Present 7.63 1000
173 2/17/2016 Grant 0.0011 0.015 0.75 0.51 Absent Absent 7.95 510
174 2/17/2016 Grant 0 0.005 0.34 0 Absent Absent 7.68 1300
175 2/17/2016 Grant 0.0019 0.00077 0.31 0.94 Absent Absent 7.71 310
176 2/17/2016 Grant 0 0.0072 0.75 2.7 Absent Absent 8 610
177 2/17/2016 Grant 0.0014 0.0099 1.2 0 Absent Absent 8.53 450
178 2/17/2016 Grant 0.0016 0 0.28 0.66 Present Absent 7.94 300
179 2/17/2016 Grant 0.0011 0.0013 0.21 1.6 Present Absent 7.36 360
180 2/17/2016 Grant 0.0014 0.0033 0.26 1.2 Absent Absent 7.39 690
181 2/17/2016 Grant 0 0.0077 0.6 9.6 n/d n/d 7.97 800
182 2/24/2016 Luna 0.0028 0.0026 0.46 0.77 Present Absent 8.21 330
183 2/24/2016 Grant 0.0036 0.0031 0.38 0.56 Absent Absent 8.13 280
184 2/24/2016 Grant 0.0012 0.00052 0.31 0.48 Present Absent 8.08 240
185 2/24/2016 Grant 0 0.0037 0.42 6.4 Present Absent 7.81 1000
186 2/24/2016 Grant 0 0.0063 0.38 6 Present Absent 7.6 980
187 2/24/2016 Grant 0 0.0067 0.26 0.89 Present Absent 7.71 1400
188 2/24/2016 Grant 0 0.0068 0.64 0.13 Absent Absent 8.11 1300
189 2/24/2016 Grant 0 0.0023 1.1 1.6 Absent Absent 8.12 430
190 3/2/2016 Grant 0 0.038 0.84 0.11 Present Absent 7.78 460
191 3/2/2016 Luna 0.0021 0.0022 0.47 4.2 Present Absent 7.89 370
192 3/2/2016 Grant 0 0.014 0.52 1.7 Absent Absent 7.5 850
193 3/2/2016 Grant 0 0.0056 0.34 0.92 Absent Absent 7.39 850
194 3/2/2016 Grant 0 0.0062 0.41 1.7 Absent Absent 7.22 720
195 3/2/2016 Grant 0.003 0.029 4.6 n/d n/d 8.02 1700
196 3/2/2016 Grant 0 0.0094 0.25 0 Absent Absent 7.59 500
197 3/2/2016 Grant 0.0015 0.0027 0.36 7.8 Absent Absent 7.52 640
198 3/2/2016 Grant 0.0019 0.0022 0.16 2.9 Absent Absent 7.62 960
199 3/9/2016 Luna 0.002 0.0019 0.34 4.9 Absent Absent 8.02 530
200 3/9/2016 Luna 0.0032 0.0035 0.55 1.1 Absent Absent 8.18 380
Page 18
NO.
COLLECTION
DATE COUNTY
EXCEEDANCES (ppm) PRESENCE
PH Electro-
Conduct Arsenic ≥ 0.010
Uranium ≥ 0.030
Fluoride
≥ 0.030
Nitrates ≥ 10.0
Total Coliform*
E. coli
201 3/9/2016 Grant 0.0015 0.00092 0.12 1.1 Absent Absent 7.91 300
202 3/9/2016 Grant 0 0.0068 0.39 0.35 Absent Absent 7.96 1200
203 3/9/2016 Grant 0 0.019 0.19 4.6 Absent Absent 7.88 790
204 3/9/2016 Grant 0.0013 0.00096 0.37 0.18 Absent Absent 7.77 1000
205 3/9/2016 Grant 0 0.0058 1.2 0.7 Absent Absent 8.07 460
206 3/9/2016 Grant 0.0018 0.0008 0.32 1.4 Absent Absent 8.1 390
207 3/9/2016 Grant 0.0045 0.002 1.2 1.2 Absent Absent 8.32 440
208 3/9/2016 Grant 0.0014 0.0042 0.22 1.2 Present Absent 7.94 350
209 3/9/2016 Grant 0 0.0023 0.6 2 Absent Absent 7.9 580
210 3/9/2016 Grant 0.0011 0.0011 0.32 1.1 Absent Absent 7.83 440
211 3/9/2016 Grant 0 0.0011 1.3 0 n/d n/d 8.16 650
212 3/9/2016 Grant 0 0.0064 0.35 0.58 Present Absent 7.41 1100
213 3/9/2016 Grant 0 0.0097 2.1 0 Absent Absent 7.34 620
214 3/9/2016 Grant 0 0.0036 0.4 0 Present Absent 7.45 460
215 3/16/2016 Grant 0 0.0021 0.6 0.54 Present Absent 7.78 770
216 3/16/2016 Grant 0 0.0049 0.54 7.6 Absent Absent 7.7 1200
217 3/16/2016 Grant 0.0014 0.002 0.85 8.3 Present Absent 7.73 980
218 3/16/2016 Grant 0 0.0018 0.32 0 Absent Absent 7.77 800
219 3/16/2016 Grant 0.0011 0.0011 0.53 0.23 Absent Absent 8.04 730
220 3/16/2016 Grant 0 0.044 0.62 0.34 Absent Absent 7.92 610
221 3/16/2016 Grant 0 0.0011 0.37 0.66 Present Absent 8.03 310
222 3/16/2016 Grant 0.0014 0.00059 0.21 0.67 Absent Absent 7.92 350
223 3/16/2016 Grant 0.0015 0.0041 0.32 1.3 Present Absent 7.71 670
224 3/16/2016 Grant 0.0013 0 0.26 0.79 Present Absent 7.99 340
225 3/16/2016 Grant 0.0019 0 0.16 0.95 Absent Absent 7.97 430
226 3/16/2016 Grant 0.0011 0.0007 0.2 6.2 Absent Absent 7.86 450
227 3/16/2016 Grant 0.0014 0.0011 0.17 7.4 Present Absent 7.89 520
228 3/16/2016 Grant 0.0017 0.0017 0.95 0.27 Present Absent 7.72 450
229 3/16/2016 Grant 0.0039 0.002 1 1.3 Absent Absent 8.07 420
230 3/16/2016 Grant 0.0041 0.0021 1.5 0.84 n/d n/d 8.15 480
231 3/16/2016 Grant 0 0.038 2.8 0 n/d n/d 7.93 490
232 9/18/2014 Ascensión 0.017 n/d 5.95 2.54 n/d n/d 7.49 1541
233 9/18/2014 Ascensión 0.042 n/d 4.63 10.38 n/d n/d 7.61 1179
*Total Coliform was excluded from data analysis due to high sensitivity to false positives.
n/d = no data available
Source: Hall Environmental Analysis Laboratory, Albuquerque
Page 19
Maps
This section contains maps that show data collected from laboratory analyses of 435 well water
samples collected by rural property owners in the Gila, Mesilla and Mimbres groundwater basins.
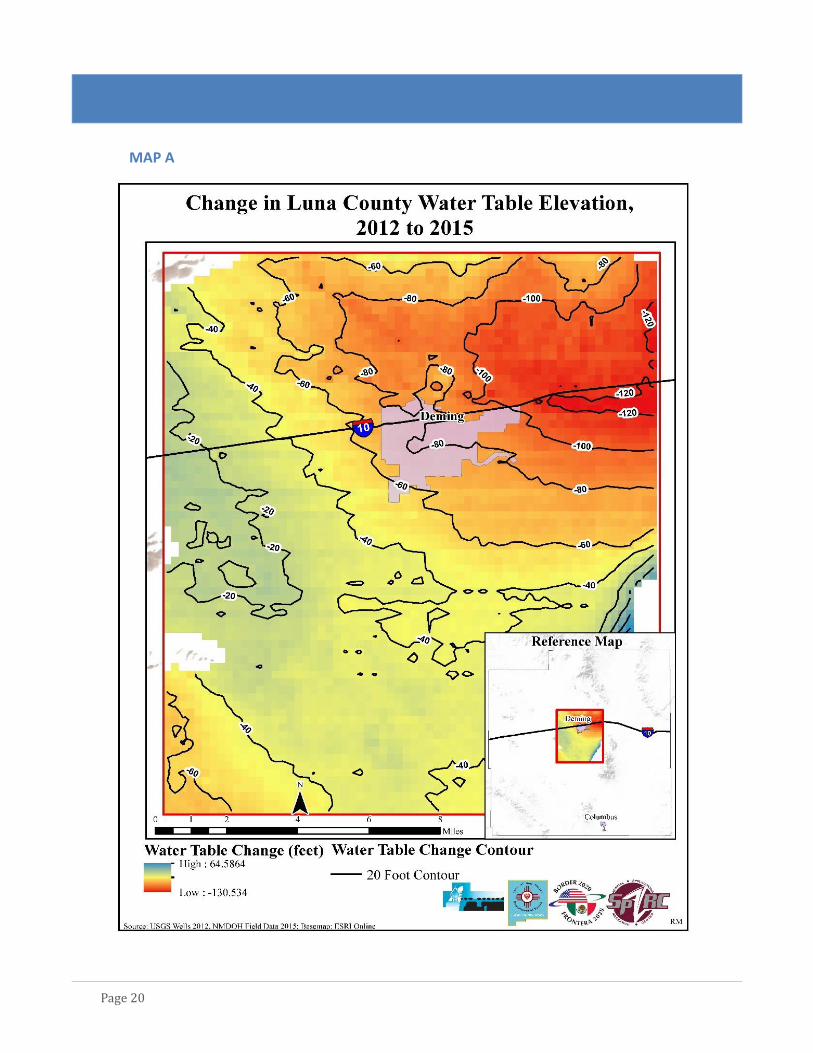
Map A shows changes in depth-to-water measurements from drought years 2012-2015. Of
significance, the map identifies a three-year decline of more than 60 feet in groundwater elevation
at the southern and eastern portions of the basin. The map also identifies a large increase in
aquifer elevation at the northeastern end of the basin. However, this change in elevation is based
on a one-time depth reading and is a likely anomaly of the data. Much of this data was collected
during the first year of the project.
The remaining maps (Maps B through M) highlight the potential for concentrations of arsenic,
uranium, fluoride and nitrates in each of the three regional aquifers. On each map, locations with
the highest potential for contaminant concentrations that exceed the health standards are marked
in dark red. The maps are scalable and easily printed. Online versions can be found at
http://border.nmsu.edu/ under the “Well Water Sampling Project” tab.
Page 20
MAP A
Page 21
http://border.nmsu.edu/Well-Water-Sampling-Project.html/
MAP B
Page 22
http://border.nmsu.edu/Well-Water-Sampling-Project.html/
http://border.nmsu.edu/Well-Water-Sampling-Project.html/
MAP C
Page 23
http://border.nmsu.edu/Well-Water-Sampling-Project.html/
MAP D
Page 24
http://border.nmsu.edu/Well-Water-Sampling-Project.html/
MAP E
Page 25
http://border.nmsu.edu/Well-Water-Sampling-Project.html/
http://border.nmsu.edu/Well-Water-Sampling-Project.html/
MAP F
Page 26
http://border.nmsu.edu/Well-Water-Sampling-Project.html/
http://border.nmsu.edu/Well-Water-Sampling-Project.html/
MAP G
Page 27
http://border.nmsu.edu/Well-Water-Sampling-Project.html/
MAP H

Page 28
http://border.nmsu.edu/Well-Water-Sampling-Project.html/
MAP I
Page 29
http://border.nmsu.edu/Well-Water-Sampling-Project.html/
MAP J
Page 30
http://border.nmsu.edu/Well-Water-Sampling-Project.html/
MAP K
Page 31
http://border.nmsu.edu/Well-Water-Sampling-Project.html/
MAP L
Page 32
http://border.nmsu.edu/Well-Water-Sampling-Project.html/
MAP M
Page 33
Discussion
PROPERTY OWNER-SUPPLIED DATA
Most participants (74%) identified the location of their wellheads using measurements for
latitude and longitude obtained from a mobile phone app. To verify the accuracy of this
information, WRRI staff confirmed the location of each well. In some cases, staff members phoned
the property owner to verify the information. If a well’s location could not be confirmed, the data
from that well was eliminated from the mapping profile. This process assured the overall accuracy
of data provided by property owners and improved the level of confidence in developing the “hot
spot” maps.
WORKSHIP EVALUATIONS
It is unusual for participants in water research projects to express thanks to researchers for their
efforts. This project has proved different. During each year of well sampling, it was not unusual for
property owners contacted by the project staff to express gratitude for access to water laboratory
testing. Currently, the southern half of the state is without an authorized drinking water lab, and
property owners must drive their samples the 300 plus miles to Albuquerque. In addition, a
typical lab analysis is costly.
SAMPLING ERRORS
The project relied on well owners to fill their sample bottles to the brim, label the bottles with the
exact time and date, identify the latitude and longitude of the wellhead, and return the sample
bottlers to their county extension offices prior to 2 p.m. on the same day of collection. While most
were collected correctly and shipped to the laboratory within the recommended time period,
some well owners were unable to collect samples properly or return their samples in time to allow
for the full set of contaminant analyses. As such, the project recorded a 4% collection error rate.
PROJECT PROMOTION
During the first-year effort, water sampling increased notably after the project was highlighted in
newspaper articles or broadcast over radio. During the second year, the project team found that
word of mouth among rural property owners increased participation. At the beginning of the
second-year effort, some property owners expressed suspicion about state government and its
intentions in obtaining private well water data. Where possible, project staff addressed these
concerns by guaranteeing privacy of the water quality data and confirming the project’s objective
of understanding potential changes occurring in regional aquifers.
Page 34
Conclusion
Due to the combination of extended drought and the high percentage of individuals in the state
border region served by unregulated, private wells, WRRI and NMDOH conducted a well water
testing project to determine if well owners were unknowingly at risk from elevated concentrations
of harmful contaminants in their drinking water. Some 435 individual well samples were collected
over a two-year period and shipped for testing to the state-authorized drinking water laboratory
in Albuquerque. Samples were tested for known contaminants of arsenic, uranium, fluoride,
nitrates, total coliform and E. coli. Of the samples tested, 61 or 14.0% were measured at
concentrations that exceeded one or more of the standards for healthy drinking water. Seven (7)
samples exceeded the standards for two or more contaminants, some as high as four times the
maximum concentration level.
The project sampled well water from three regional aquifers: the Gila, Mesilla and Mimbres. The
data were used to map the likelihood of finding elevated contaminate levels within each aquifer.
The Gila River Basin, the smallest of the three groundwater basins, demonstrated high potential
for exceedances of arsenic and fluoride. The Mesilla Basin measured particularly high
concentrations of arsenic in portions of the aquifer south of Las Cruces. The Mimbres Basin, which
stretches across Luna and Grant counties, showed wide diversity in water quality data with
healthy drinking water more likely found at the center of the aquifer and the potential for elevated
concentrations of arsenic, uranium and fluoride found along the aquifer’s edges. Of note, the
potential for poor water quality rose significantly at the southern end of the Mimbres, a trend
confirmed with data from well samples taken from the Mexican community of Palomas.
The border region of southern New Mexico and northern Chihuahua is well into its sixth
consecutive year of drought. A series of depth-to-water measurements in wells in the Mimbres
Basin conducted by project staff identified a three-year drop in aquifer elevation of more than 60
feet. The drop exceeded historical changes in the aquifer and pointed to drawdown of the aquifer
during a period of drought.
As drought advances in the border region of southern New Mexico, it may be concluded that
groundwater sampling becomes a more relevant exercise for monitoring private domestic water
supplies. Maps showing the potential for elevated concentrations of harmful contaminants in
groundwater may aid healthcare workers in identifying individuals at risk of exposure to
unhealthy drinking water.
Page 35
References and Works Cited
Delpla I, A-V Jung, E Baures, M Clement, O Thomas. Impacts of climate change on surface water quality in
relation to drinking water production. Environmental International 2009; 35(8):1225-33.
van Vliet MTH, JJG Zwolsman. Impact of summer droughts on the water quality of the Meuse river 2008;
353(1-2):1-17.
Drought Summary, National Weather Service Weather. Released Aug. 4, 2016. Accessed Aug. 5, 2016 at
http://www.srh.noaa.gov/abq/?n=drought#Wateryear
Census 2010, U.S. Census Bureau. Department of Commerce. Accessed July 23, 2016 at
http://www.census.gov