Embed Size (px)
Citation preview
DPRIETI Discussion Paper Series 15-E-029
Impact of Exchange Rate Shocks on Japanese Exports: Quantitative assessment using a structural VAR model
IWAISAKO TokuoHitotsubashi University
NAKATA HayatoMeisei University
The Research Institute of Economy, Trade and Industryhttp://www.rieti.go.jp/en/

1
RIETI Discussion Paper Series 15-E-029 March 2015
Impact of Exchange Rate Shocks on Japanese Exports: Quantitative assessment using a structural VAR model1
IWAISAKO Tokuo2 and NAKATA Hayato3
Abstract
In the policy debate over the Japanese macroeconomic performance, the impact of exchange rate fluctuations on Japan’s exports has received considerable attention. However, if we take the period from the end of 2008 following the collapse of Lehman Brothers as an example, the “price shock” of the yen’s rapid appreciation and the “quantity shock” because of the rapid decline in global aggregate demand were equally responsible for the significant reduction in exports. We analyze this problem using a structural vector autoregression (VAR) model, assuming that there are two exogenous shocks, namely, a foreign demand shock and an exchange rate-specific shock. We evaluate the relative importance of each shock to Japanese aggregate exports. We further expand our VAR system to incorporate and analyze the impact of fluctuations in oil prices as additional exogenous shocks. In the second half of the paper, the relative importance of foreign demand shocks and exchange rate shocks during historic episodes of large exchange rate fluctuations are compared, including the mid-1980s with the high-yen recession after the Plaza Accord, the sharp yen appreciation in the mid-1990s, and the period of the “trade collapse” after the Lehman Brothers bankruptcy in the late 2000s. Keywords: Japanese economy, Exchange rate, Exports, Structural VAR JEL classification: F31, F41, Q43
RIETI Discussion Papers Series aims at widely disseminating research results in the form of professional papers, thereby stimulating lively discussion. The views expressed in the papers are solely those of the author(s), and neither represent those of the organization to which the author(s) belong(s) nor the Research Institute of Economy, Trade and Industry.
1 This study is conducted as a part of the research project “Exports and the Japanese Economy: Experiences in the 2000s and the lessons for the future” at the Research Institute of Economy, Trade, and Industry (RIETI). We appreciate comments from Masahisa Fujita, Takatoshi Ito, Masayuki Morikawa, and seminar participants at RIETI. Iwaisako also acknowledges the financial support from Grant-in-Aid for Scientific Research (A) 25245037. 2 Corresponding author; Institute of Economic Research, Hitotsubashi University and RIETI; [email protected] 3 Department of Economics, Meisei University; [email protected]

1 Introduction
Historically, the most important macroeconomic policy objective for policymakers in the United States has been unemployment, whereas it has beenbudget de�cits in continental Europe. Similarly, exchange rates have alwaysreceived attention in macroeconomic policy debates in Japan. The fear ofappreciation of the yen against other currencies started in 1971 with theSmithsonian Agreement. Since then, policy makers have tried to avoid astrong yen to aid Japanese exporters. In particular, the rapid appreciationof the yen after the Plaza Accord in 1985 and the subsequent �strong yen re-cession�was a traumatic experience for Japanese policy makers and businessleaders. Because of this, monetary expansion that leads to a depreciation ofyen to increase exports has been considered as a panacea for Japan�s macro-economic weakness until recently. In fact, in the early stages of Abenomics,the announcement of the new Prime Minister�s commitment to �ght de�a-tion and his intention to appoint a much more dovish central bank governorafter the incumbent�s term expired in March 2013 prompted a 20end of 2012to the �rst half of 2013. A weaker yen resulted in a substantial improvementin Japan�s domestic business conditions and macroeconomic performance in2013 and the �rst half of 2014.
Despite such conventional wisdom in Japan, a strong yen is not the rootof all economic evils and a weak yen is not a magic stick for economic re-covery. The slowdown in Japanese exports could have occurred because ofreasons other than the strong yen. To see this, in Figure 1, Japan�s reale¤ective exchange rate (panel A) is shown along with the movements ofnominal and real exports before and after two major appreciations of theyen, namely the Plaza Accord of September 1985 and the US �nancial crisistriggered by the collapse of Lehman Brothers in September 2008 (panel B).From the graph of the real exchange rate, we see that the appreciation ofthe yen after the Plaza Accord was only slightly larger than the appreciationafter the collapse of Lehman Brothers. To the contrary, from the graph ofexports, we observe that real export had not declined as much as nominalexports when the yen appreciated in the mid-1980s. On the other hand,nominal and real exports moved in tandem during the global recession sub-sequent to the Lehman shock in September 2008. Such a di¤erence in exportresponses in the mid-1980s and toward the end of the 2000s suggests thatthe �quantity shock�associated with the rapid decline in global aggregatedemand was as equally responsible as the �price shock�of the yen�s rapidappreciation, for the signi�cant slowdown in exports during the global re-
2

cession in late 2008 and 2009. In other words, the appreciation of the yenduring the global recession after the collapse of Lehman Brothers was partlythe result of the severe recession overseas and the decline in foreign demandfor Japan�s exports.
[Figure 1 here]
Apparently, we were not the �rst to point out that an appreciation and adepreciation of the yen of the same magnitude can have signi�cantly di¤erentimpacts on Japan�s exports and GDP. One of main purposes of this paper isto provide quantitative evaluation of the e¤ect of purely exogenous exchangerate movements on Japanese exports using a simple empirical framework.Our second purpose is to assess how much of the export decline duringhistorical yen appreciations can be explained by the part of the appreciationnot related to fundamentals.
In regard to the �rst point, we �nd that the quantitative impact of reale¤ective exchange rate movements on aggregate Japanese exports is similarwhether modelled using the exchange rate alone or with the other variablesconsidered in this paper such as a global aggregate demand shock and oilprices. For our second purpose, we selected three historical episodes ofyen appreciation, namely, before/after the Plaza Accord in the mid-1980s,the rapid appreciation in 1994�1995, and the global recession in 2008�2009.Among these three events, the relative importance of pure exchange rateshocks compared with other exogenous shocks is largest for the yen appre-ciation in the mid-1990s. In the period subsequent to the Lehman shock,a negative global aggregate demand shock is the dominant force, while theimpact of the exchange rate is much smaller.
The remainder of the paper is organized as follows. In Section 2, we in-troduce a simple structural VAR as the framework for empirical analysis. Wealso discuss the measure of global real economic activity proposed by LutzKilian and his treatment of oil price shocks. Section 3 describes the data.The next two sections present the empirical results of the structural VAR.Section 4 presents the impulse response functions and Section 5 presents theresults of variance decompositions for the growth rate of Japan�s exports.In Section 6, we compare the three periods of yen appreciation and assessthe role of pure exchange rate shocks on Japan�s exports using historical
3

decompositions based on our structural VAR system. Section 7 concludesand discusses our future research agenda.
2 Framework of Empirical Analyses
The main goal of this paper is to provide a quantitative evaluation of thee¤ect of exogenous exchange rate �uctuations on Japanese exports usinga simple empirical framework. For this purpose, we use a structural VARmodel and estimate it under three di¤erent speci�cations, starting from atwo-variable system, and then adding other economic variables.
We start our analysis with a bivariate VAR system as a benchmark, con-sisting of the real e¤ective exchange rate and export growth rate. Althoughthe in�uence of the exchange rate is signi�cant, as we will see immediatelybelow, a major part of the variation in export growth cannot be explainedby exchange rate movements alone. In our second VAR system, we add aproxy for global real economic activity, which was �rst introduced in a seriesof studies by Lutz Kilian (2009). Kilian calculates an index using data ofocean freight transport fares and uses it as a variable representing aggregatedemand shocks for crude oil. Here, we use it as a proxy for global aggregatedemand shocks which will increase the demand for Japanese exports. It isassumed that foreign demand shocks for Japanese exports will a¤ect theexchange rate, but the exchange rate will not a¤ect foreign demand withinthe same one-month period. While we believe this is a sensible assumption,impulse response functions and the results of variance decompositions werenot signi�cantly a¤ected even if the ordering of variables is reversed.
In the third VAR system, we add the price of crude oil and oil productionto the second system. In our companion paper (Iwaisako and Nakata 2014),we used a four-variable system that excludes the export growth rate fromour �ve variable system to calculate a series of structural shocks. Then,industry sales data are regressed on the structural shocks to estimate theresponses of Japanese industries�output to global demand shocks, oil supplyshocks, temporary oil price shocks, and temporary exchange rate shocks. Inthis paper, we are interested in the response of Japan�s aggregate exportsto the structural shocks, so that we simply include the export growth ratein the VAR system.
4

For the identi�cation of structural shocks in our �ve-variable system, weplace the following restrictions on the innovations and structural shocks:
ut =
2666664uprodt
urealt
upoilt
ufxtuexpt
3777775 = A0�t =266664a11 0 0 0 0a21 a22 0 0 0a31 a32 a33 0 0a41 a42 a43 a44 0a51 a52 a53 a54 a55
377775266664
�SYt�DEt�OILt
�FEXt
�TRADEt
377775 : (1)
Variables:
� prodt : growth rate of world crude oil production
� realt : proxy for global real economic activity (Kilian)
� poilt : crude oil price
� fxt : real e¤ective exchange rate
� expt : growth rate of Japanese real exports
Structural shocks;
� �SYt : oil supply shock
� �DEt : global demand shock
� �OILt : temporary oil price shock
� �FEXt : temporary exchange rate shock
� �TRADEt : �uctuations in exports that cannot be explained by the fourstructural shocks above
For a more detailed discussion, let us focus on the exogenous tempo-rary exchange rate shock �FEXt . The VAR system described above extractsthe series �FEXt as the variation in the real exchange rate that is not as-sociated with either (i) oil supply shocks �SYt , (ii) global demand shocks�DEt , or (iii) temporary oil price shocks �OILt . Admittedly, it is not obvious
5
whether temporary exchange rate shocks �FEXt or temporary oil price shocks�OILt are more exogenous. However, changing the variable order in Choleskyfactorization does not change the shape of the impulse response functionsdrastically. Hence, we present empirical results based on the above restric-tion between innovations in variables and structural shocks in the followingempirical analyses.
Our two-variable system and three-variable system can be interpretedas special cases of a �ve-variable system, on which we put the followingrestrictions.
ut =
�ufxtuexpt
�= A0�t =
�a44 0a54 a55
� ��FEXt
�TRADEt
�(2)
ut =
24 urealt
ufxtuexpt
35 = A0�t =24 a22 0 0a42 a44 0a52 a54 a55
3524 �DEt�FEXt
�TRADEt
35 (3)
3 Data
In the empirical analyses below, we use monthly data from 1977 to 2011 forthe following variables. As a proxy for global real economic activity, henceexogenous demand shocks to Japanese exports, we use the same variableused in Kilian (2009) and Kilian and Park (2009). Data were downloadedfrom Lutz Kilian�s Web site. Crude oil price data are US crude oil importedacquisition costs by re�ners (dollars per barrel) taken from the US Depart-ment of Commerce�s Web site. For the sample period considered in thispaper, the correlation between the US Department of Commerce�s data andthe IMF�s oil price data in their Primary Commodity Prices dataset is morethan 95%.1 US data, therefore, are nearly identical to the average of the
1 IMF�s oil price data are the average of Brent Crude, Dubai Fateh, and WTI.
6

international crude oil price. The lag in the VAR estimation is set to 12months unless otherwise stated.
Japan�s real e¤ective exchange rate and monthly real export data areobtained from Bank of Japan�s Web site. For real export data, we use boththe seasonally adjusted monthly growth rate and the growth rate from thesame month in the previous year. As the empirical results are qualitativelyvery similar, in the following discussions, we report the empirical resultsusing the growth rate from the same month in the previous year.
4 Impulse Response Functions
In Figure 2, the impulse responses of the two-, three-, and �ve-variable VARsystems are plotted. Rows in the tables represent the variable respondingto shocks and columns represent the shock variable.
[Figure 2 here]
Let us start with a discussion of the two-variable system. First, boththe real e¤ective exchange rate and exports are positively a¤ected by theirown past shocks. Second, while an increase in the real exchange rate, i.e.,appreciation of the yen, today reduces exports tomorrow (second row, �rstcolumn), an autonomous increase in exports does not result in a signi�cantimpact on future exchange rates (�rst row, second column).
Next, in the three-variable system, the global aggregate demand shock,a proxy for global real economic activity, is added to the two-variable sys-tem and it is in�uenced only by its own lagged variables (�rst row, �rstcolumn). The global aggregate demand shock leads a signi�cant positive re-sponse of export growth (third row, �rst column). Although not statisticallysigni�cant, the aggregate demand shock also seems to induce a depreciationof the yen�s value against other currencies (second row, �rst column). Onthe other hand, the relationship between the variables in the two-variablesystem, export growth and real exchange rate, does not appear to be sig-ni�cantly a¤ected by the introduction of the aggregate demand shock tothe system. Still, in explaining the variation in export growth, the relative
7
importance of the exchange rate shock can vary over time substantially de-pending on the relative sizes of contemporaneous exogenous exchange rateshocks and aggregate demand shocks.
Our �ve-variable system also includes the oil price and oil production.Oil production does not appear to have a strong in�uence on the other fourvariables. However, because our sample starts from the late 1970s, it doesnot include the early 1970s when the world economy experienced a largeexogenous shock to oil production. Hence, it is not obvious whether the em-pirical results here can be generalized beyond the sample period consideredin this paper. Fluctuations in oil production are a¤ected by own lagged val-ues and nothing else. Even though aggregate demand shocks seem to have apositive impact (�rst row, second column), this e¤ect is not statistically sig-ni�cant. On the other hand, temporary oil price �uctuations are explainedby past aggregate demand shocks (third row, the second column) as well asits own lagged values (third row, third column). Export shocks also seemto have a positive impact on the oil price, but the e¤ect is not statisticallysigni�cant (third row, �fth column).
In addition, the temporary rise in the crude oil price has a small pos-itive impact on the world economy (second row, third column) and clearpositive impact on Japanese exports (�fth row, third column). The latterresult is puzzling, but is consistent with the �nding by Fukunaga, Hirakata,and Sudo (2011) about the oil price�s e¤ect on output. Fukunaga et al. ar-gue that Japanese companies�comparative advantage in energy-saving tech-nology stimulates Japan�s exports when the oil price increases. However,whether such an explanation is persuasive enough requires more detailedmicroeconomic evidence, which is an issue for future research.
5 Variance Decomposition
In Table 1, the results of variance decompositions performed with three dif-ferent VAR systems are shown. In addition to the full sample results, vari-ance decompositions are calculated for the previous and subsequent 2000subsamples. As a robustness check, we report the results of variance de-compositions using seasonally adjusted month-to-month growth rates as anexport variable, in addition to the 12-month growth rate.
8

[Table 1 here]
First, in the variance decompositions for the two-variable VAR system,the fraction of exports variation explained by exchange rate shocks is 15%when the seasonally adjusted growth rate is used as an export variable andis 22% when the growth rate from the same month in the previous year isused. While the exchange rate has slightly higher explanatory power in thelatter, both results suggest about 80% of the variation in export growth canbe explained by factors other than exogenous exchange rate shocks.
Turning to the results of the three-variable system, 11% of seasonallyadjusted monthly growth and 33% of the 12-month growth of exports areexplained by global aggregate demand shocks. The share of lagged exportvalues drops by about 10 percentage points in the three-variable system,from 85% to 75%, compared with the two-variable system, when monthlygrowth is used as an export variable. If the 12-month growth rate is used,the share of lagged values drops by about 30 percentage points, from 78%to 47%. Therefore, foreign demand shocks are more important in explainingexport variation at longer horizons. On the other hand, the share of ex-change rate shocks accounts for 14% of the variation in seasonally adjustedexport growth and about 20% of the variation in 12-month growth. So ineither case, the share of exchange rate shocks remains almost the same in thethree-variable system as in the two-variable system. Finally, in a compari-son of earlier and latter subsamples, the share of global aggregate demandshocks is higher in the subsample after 2000. This result is consistent withthe informal discussion in Section 1 about the behaviors of nominal and realexports in the mid-1980s and in the late 2000s.
Finally, in the �ve-variable VAR decompositions, the importance ofglobal demand is also higher in the second half of the subsample. Thus,the share of export shocks is lower and this is consistent with the results forthe three-variable system. The in�uence of oil supply shocks is extremelylimited. In contrast, temporary �uctuations in the crude oil price in thelatter subsample is extremely signi�cant. While it has very limited impacton Japanese exports in earlier subsamples, it explains as much as 22% ofmonthly Japanese export growth and 47% of the 12-month growth rate inthe subsample after year 2000. Hence, temporary movements of the crudeoil price have a considerable impact on export �uctuations in Japan in recentyears. However, its share of the 12-month export growth rate is unrealisti-cally high, which will require a more careful analysis in future research.
9

6 Comparison of Historical Episodes
In this section, we select three historical episodes of yen appreciation andprovide a quantitative evaluation of the relative importance of exogenousexchange rate shocks in explaining export variation in these episodes. Forthis purpose, we perform historical decompositions of the 12-month realexport growth rate using the full sample. Figures 3 and 4 show the resultfor three particular periods, namely the mid-1980s (around the Plaza Accordin September 1985), mid-1990s (around 1995/96 when the yen recorded itshistorical high against the US dollar), and late 2000s (around the collapseof Lehman Brothers and the subsequent global economic downturn).
Figure 3 shows the results of the historical decomposition for the three-variable system. The graph in panel C suggests that the decline in exportsimmediately after the onset of the global recession in late 2008 and 2009and the subsequent sharp recovery in 2010 are both explained by shocks toexports. Compared with the episode in the late 2000s, the real exchangerate and aggregate demand played much more important roles in the 1980sand 1990s. The relative importance of the autonomous decline and recoveryof Japanese exports might be explained by excessive inventory adjustmentby Japanese �rms as suggested by Shioji and Uchino (2011). On the otherhand, in the comparison of the relative importance of exchange rate shocksand aggregate demand shocks, the latter is more important in explainingthe �uctuations in Japanese exports in the late 2000s, while the former ismore important in the episodes in the 1980s and 1990s. These results areconsistent with the variance decomposition discussion in the previous sectionand Table 1.
[Figure 3 here]
In Figure 4, the historical decompositions of the �ve-variable VAR areshown. First, we con�rm that oil supply shocks do not have a signi�cantimpact on export variation in either the impulse response or variance de-composition results. Furthermore, the absolute magnitude of the impactsof exchange rate shocks and global demand shocks on Japanese exportsin the �ve-variable system are not signi�cantly di¤erent from those in thethree-variable system. On the other hand, �uctuations in the oil price areindependent of oil supply and had limited importance in 1980s data. It isfar more important in the 1990s and 2000s data, especially the latter. In
10
Panel B, for the periods from mid- 1992 to the �rst half of 1993 and frommid-1996 to early1997, oil price shocks stimulate exports. In the data for the2000s shown in panel C, oil shock prices contributed positively to exportsin the period from the second half of 2007 to the summer of 2008. Afterthe collapse of Lehman Brothers in the fall of 2008, the oil price �rst has alarge negative impact on Japanese exports, and then from mid-2010 has alarge positive impact. As mentioned in the discussion on the variance de-composition results, the explanatory power of oil price shocks for Japaneseexports during this period seems to be too large and requires further studiesin future.
[Figure 4 here]
7 Conclusions
In this paper, using a simple structural VAR in which foreign demand shocksand temporary exchange rate shocks coexist, we provided a quantitativeevaluation of their relative importance in explaining variation in Japaneseexports. We also expanded our VAR system to consider the impact of oilprice �uctuations and found that temporary oil price �uctuations seem toplay an important role in explaining Japanese exports in the sample after2000. In the second half of the paper, we compared the roles of exchangerate shocks and global demand shocks in three historical episodes of yenappreciation. We found that the relative importance of exchange rate shocksin explaining export �uctuations was most pronounced in the �uctuations ofthe yen in the mid-1990s. While they were less pronounced than in the 1990s,exchange rate shocks were also important in the yen appreciation after thePlaza Accord in the mid-1980s. Conversely, in the �trade collapse�periodduring the global recession in the late 2000s, subsequent to the collapse ofLehman Brothers in 2008, global aggregate demand shocks were much moreimportant than exchange rate movements in explaining the sharp decline andrecovery of Japanese exports. However, it should be noted that the absolutesize of exchange rate shocks are virtually the same in all three historicalepisodes. Instead, the magnitude of other factors, especially the size offoreign demand shocks, di¤er signi�cantly in the di¤erent time periods.
Historically, Japanese policy makers have tried to lower the yen�s valueto stimulate the economy by stimulating exports. The empirical results
11

of this paper suggest that the importance of the exchange rate has beenexaggerated in policy debate. Other economic factors such as the level ofglobal economic activity and the oil price have also had large impacts onJapanese export �uctuations. Therefore, it is dangerous to generalize theconventional wisdom about the yen impact on Japanese exports and theeconomy. In particular, the e¤ect of expansionary monetary policy in tryingto depreciate the yen could be muted when aggregate global demand isextremely weak.
The analysis in this paper has left some important issues for future re-search and they should be studied carefully to draw concrete policy implica-tions. First, the analysis with the �ve-variable VAR found that temporaryoil price increases had positive e¤ects on Japan�s exports and that this e¤ectwas particularly large in the 2000s. This is consistent with what Fukunagaet al. (2011) found about the e¤ect of oil price increases on Japan�s output.However, looking at the results of the historical decomposition for the 2000sin Figure 4, the impact of temporary oil price shocks was far more importantthan exchange rate shocks and global demand shocks. Perhaps it is too largeto be taken seriously. It also should be noted that, even though this paperhas argued that the e¤ect of the exchange rate on exports has been exagger-ated, the exchange rate can also a¤ect corporate pro�t levels without havinga large impact on exports. Therefore, the impact of the exchange rate onthe corporate pro�ts of Japanese companies should be examined separatelyfrom the impact on exports.
Finally, this paper ignored the possibility of structural change in therelationship between the yen exchange rate and Japanese exports. It is con-ceivable that the quantitative impact of the exchange rate on exports hasweakened as Japanese corporations move their production bases overseas.Although there is substantial empirical evidence of shifts in production fa-cilities overseas at an industrial level (see, for example, the Ministry ofEconomy, Trade and Industry 2014), their impact at the macroeconomiclevel requires further investigation in future research.
12

References
[1] Iwaisako, Tokuo and Hayato Nakata (2014) �Impact of Exchange RateShocks on Japanese Exports: Quantitative Assessment Using the Struc-tural VAR Model (in Japanese; Genyu-kakaku, Kawase-reito to Nihon-keizai)�. RIETI discussion paper 14-J-051, November 2014
[2] Ministry of Economy, Trade and Industry, (2014) �Relationship betweenUS Automobile Sales and Japanese Auto Exports Getting Weaker (inJapanese; Beikokuni-okeru Jidousha Hanbai-to Nihonsha Yusyutsu-noKankei-kihakuka), http://www.slideshare.net/ssuserf0¤62/ss-40612388(Dated: Oct. 22, 2014).
[3] Shioji, Etsuro and Taisuke Uchino (2011) �Foreign Socks andJapanese Business Cycle: Great Trade Collapse and Japan�s Au-tomobile Industry (in Japanese; Gai-teki shock to Nihon-no Keiki-hendo: Jidosha-sangyo niokeru �Great Trade Collapse� no Jisyo-bunseki)�, Bank of Japan working paper series 11-J-1. URL:https://www.boj.or.jp/research/wps_rev/wps_2011/wp11j01.htm
[4] Fukunaga, Ichiro, Naohisa Hirakata, and Nao Sudo (2011) �The E¤ectsof Oil Price Changes on the Industry-Level Production and Prices in theUnited States and Japan,� in Commodity Prices and Markets, NBEREast Asia Seminar on Economics, Volume 20, pp.195�231, UniversityChicago Press.
[5] Kilian, Lutz (2009) �Not All Oil Price Shocks Are Alike: DisentanglingDemand and Supply Shocks in the Crude Oil Market�, American Eco-nomic Review, 99(3), June 2009, 1053�1069.
[6] Kilian, Lutz and Cheolbeom Park (2009) �The Impact of Oil PriceShocks on the U.S. Stock Market�, International Economic Review,50(4), November 2009, 1267�1287.
13

Table 1 Variance Decomposition for Export Growth
We estimate two-, three-, and �ve-variable VARs including Japan�s exportgrowth and real e¤ective exchange rate for the period from 1975 to 2011,as well as subsamples divided at the end of 1999. In the tables below,variance decompositions for the variation in export growth are reported.For the de�nitions of structural shocks, see the explanations of equation (1)in the main text. In panels (1a), (1b), and (1c), the monthly growth rate ofseasonally adjusted data are used as the export growth variable. In panels(2a), (2b), and (2c), the 12-month growth rate from the same month inprevious year was used.
(1a) Monthly/two-variable (1b) Monthly/three-variable�FEXt �TRADEt
1975�2011 15.0 85.01975�1999 14.9 85.12000�2011 31.2 68.8
�DEt �FEXt �TRADEt
1975�2011 11.1 14.3 74.61975�1999 2.4 15.1 82.52000�2011 34.0 17.3 48.7
(1c) Monthly/�ve-variable�SYt �DEt �OILt �FEXt �TRADEt
1975�2011 2.3 5.9 10.3 12.0 69.61975�1999 4.6 1.7 2.9 14.7 76.02000�2011 3.6 19.1 22.3 9.6 45.3
(2a) 12 months/two-variable (2b) 12 months/three-variable�FEXt �TRADEt
1975�2011 21.8 78.21975�1999 42.4 57.62000�2011 32.8 67.2
�DEt �FEXt �TRADEt
1975�2011 33.2 19.9 46.91975�1999 15.5 23.3 61.22000�2011 69.5 9.4 21.0
(2c) 12 months/�ve-variable�SYt �DEt �OILt �FEXt �TRADEt
1975�2011 0.3 15.1 39.3 11.0 34.31975�1999 4.4 14.9 3.2 18.1 59.42000�2011 2.1 29.7 46.8 3.4 18.1
14
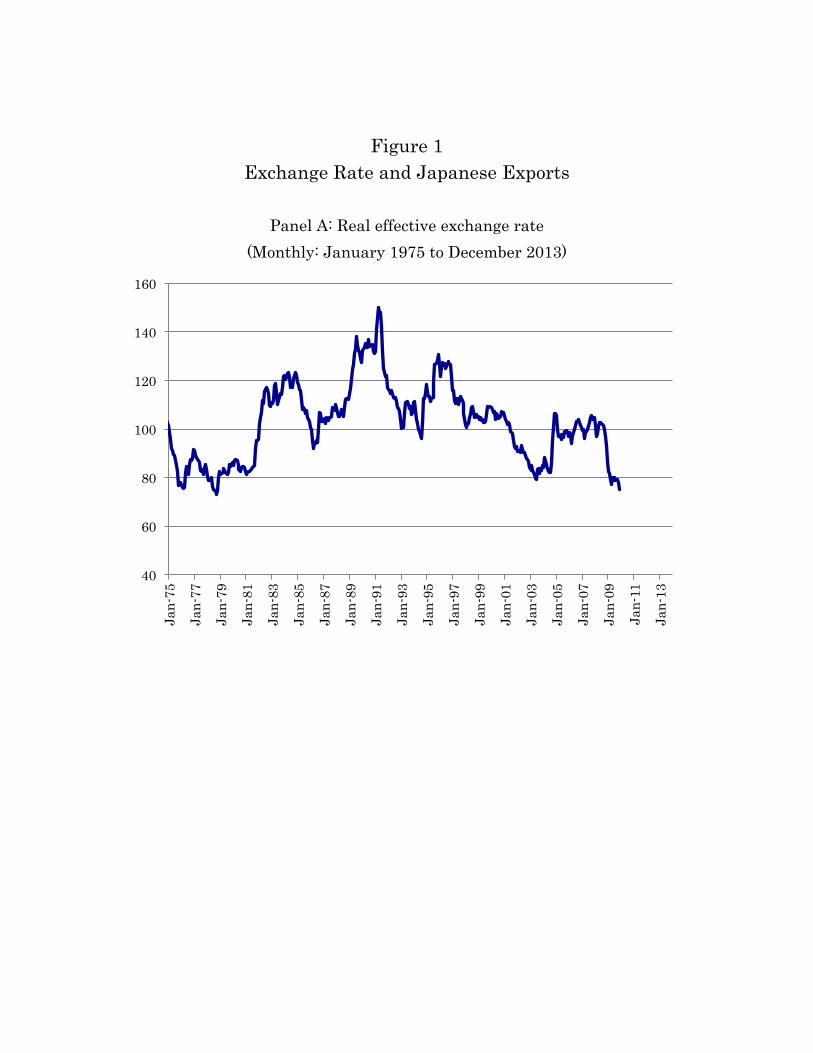
Figure 1 Exchange Rate and Japanese Exports
Panel A: Real effective exchange rate
(Monthly: January 1975 to December 2013)
40
60
80
100
120
140
160
Jan-
75
Jan-
77
Jan-
79
Jan-
81
Jan-
83
Jan-
85
Jan-
87
Jan-
89
Jan-
91
Jan-
93
Jan-
95
Jan-
97
Jan-
99
Jan-
01
Jan-
03
Jan-
05
Jan-
07
Jan-
09
Jan-
11
Jan-
13

Figure1 (continued) Panel B: Real and nominal export responses to large exchange rate shocks
Before and after Plaza Accord in September 1985 (1982:Q1−1987:Q4)
Before and after the collapse of Lehman Brothers’ in September 2008 (2005:Q1−2010:Q4)
Seasonally adjusted quarterly data from Japan’s SNA statistics. Actual data were normalized so
that the beginning of each subsample (first quarter of 1982 and 2005) is set to be 100.
70
80
90
100
110
120
130
140
150
1982 1983 1984 1985 1986 1987
Real Nominal
70
80
90
100
110
120
130
140
150
2005 2006 2007 2008 2009 2010
Real Nominal
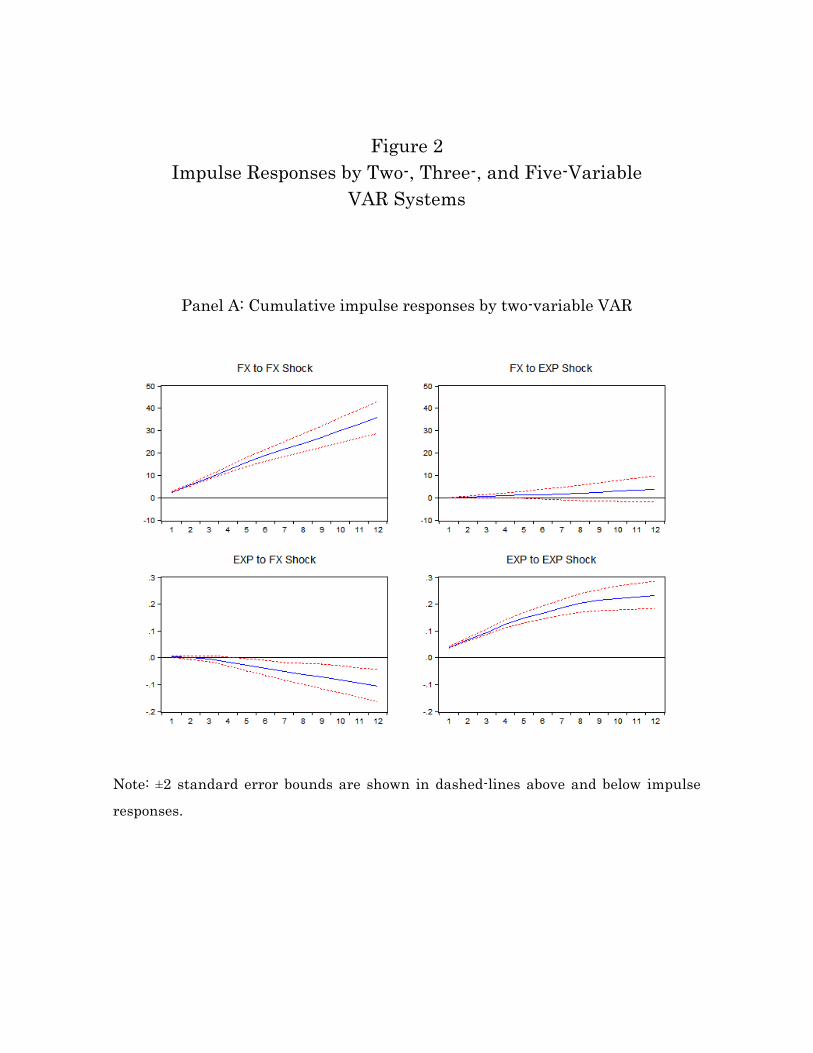
Figure 2 Impulse Responses by Two-, Three-, and Five-Variable
VAR Systems
Panel A: Cumulative impulse responses by two-variable VAR
Note: ±2 standard error bounds are shown in dashed-lines above and below impulse responses.

Figure 2 (continued)
Panel B: Cumulative impulse responses by three-variable VAR

Figure 2 (continued) Panel C: Cumulative impulse responses by five-variable VAR

Figure 3 Historical Decomposition by the Three-variable VAR System
tshock (blue solid line): Unexpected change in export growth. real economic activity (green bar): Contribution of contemporaneous global
aggregate demand shock to tshock.
real effective exchange rate (red bar): Contribution of contemporaneous exchange rate shock to tshock.
Panel A: January 1983 to December 1988
-0.2
-0.15
-0.1
-0.05
0
0.05
0.1
0.15
0.2
Jan-
83
Apr-
83
Jul-8
3 O
ct-8
3 Ja
n-84
Ap
r-84
Ju
l-84
Oct
-84
Jan-
85
Apr-
85
Jul-8
5 O
ct-8
5 Ja
n-86
Ap
r-86
Ju
l-86
Oct
-86
Jan-
87
Apr-
87
Jul-8
7 O
ct-8
7 Ja
n-88
Ap
r-88
Ju
l-88
Oct
-88
real economic activity
rear effective exchange rate
tshock
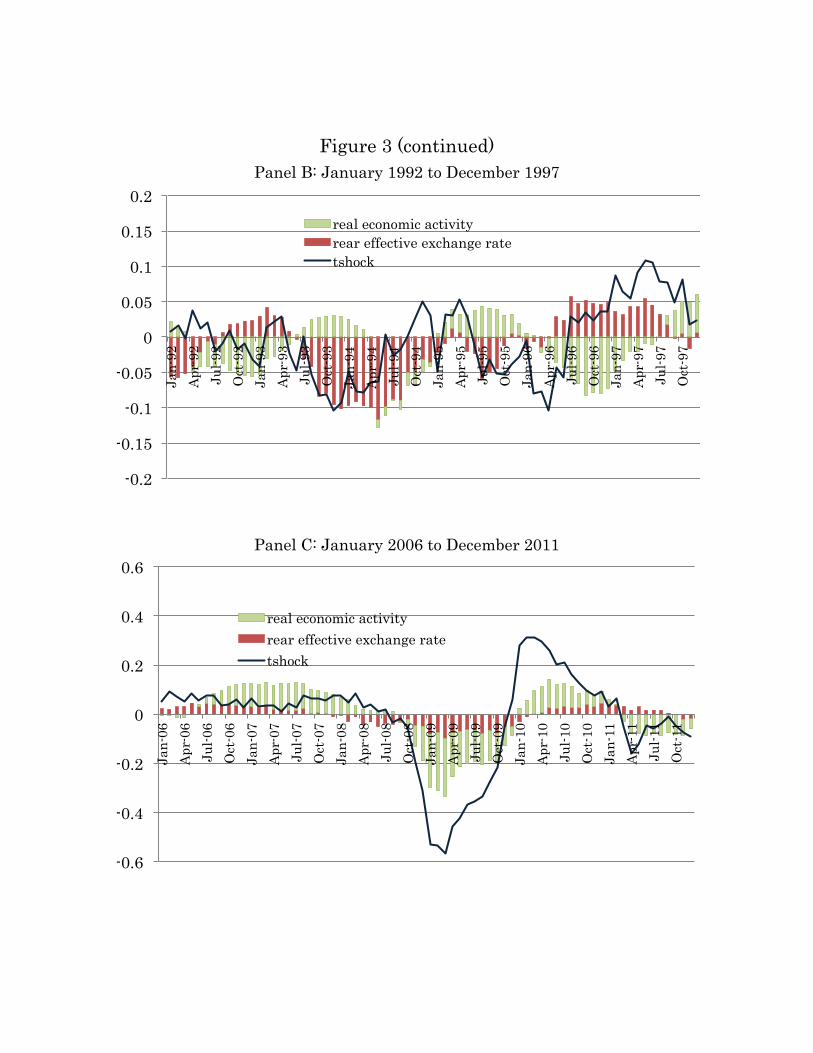
Figure 3 (continued) Panel B: January 1992 to December 1997
Panel C: January 2006 to December 2011
-0.2
-0.15
-0.1
-0.05
0
0.05
0.1
0.15
0.2 Ja
n-92
Ap
r-92
Ju
l-92
Oct
-92
Jan-
93
Apr-
93
Jul-9
3 O
ct-9
3 Ja
n-94
Ap
r-94
Ju
l-94
Oct
-94
Jan-
95
Apr-
95
Jul-9
5 O
ct-9
5 Ja
n-96
Ap
r-96
Ju
l-96
Oct
-96
Jan-
97
Apr-
97
Jul-9
7 O
ct-9
7
real economic activity rear effective exchange rate tshock
-0.6
-0.4
-0.2
0
0.2
0.4
0.6
Jan-
06
Apr-
06
Jul-0
6 O
ct-0
6 Ja
n-07
Ap
r-07
Ju
l-07
Oct
-07
Jan-
08
Apr-
08
Jul-0
8 O
ct-0
8 Ja
n-09
Ap
r-09
Ju
l-09
Oct
-09
Jan-
10
Apr-
10
Jul-1
0 O
ct-1
0 Ja
n-11
Ap
r-11
Ju
l-11
Oct
-11
real economic activity rear effective exchange rate tshock

Figure 4 Historical Decomposition by the Five-Variable VAR System
tshock (blue solid line): Unexpected change in export growth. oil production (orange bar): Contribution of contemporaneous oil production shock
to tshock.
oil price (blue bar): Contribution of contemporaneous temporary oil price change to tshock.
real economic activity (green bar): Contribution of contemporaneous global
aggregate demand shock to tshock. real effective exchange rate (red bar): Contribution of contemporaneous exchange
rate shock to tshock.
Panel A: January 1983 to December 1988
-0.2
-0.15
-0.1
-0.05
0
0.05
0.1
0.15
0.2
Jan-
83
Apr-
83
Jul-8
3 O
ct-8
3 Ja
n-84
Ap
r-84
Ju
l-84
Oct
-84
Jan-
85
Apr-
85
Jul-8
5 O
ct-8
5 Ja
n-86
Ap
r-86
Ju
l-86
Oct
-86
Jan-
87
Apr-
87
Jul-8
7 O
ct-8
7 Ja
n-88
Ap
r-88
Ju
l-88
Oct
-88
oil production oil price real economic activity rear effective exchange rate tshock

Figure 4 (continued) Panel B: January 1992 to December 1997
Panel C: January 2006 to December 2011
-0.2
-0.15
-0.1
-0.05
0
0.05
0.1
0.15
0.2
Jan-
92
Apr-
92
Jul-9
2 O
ct-9
2 Ja
n-93
Ap
r-93
Ju
l-93
Oct
-93
Jan-
94
Apr-
94
Jul-9
4 O
ct-9
4 Ja
n-95
Ap
r-95
Ju
l-95
Oct
-95
Jan-
96
Apr-
96
Jul-9
6 O
ct-9
6 Ja
n-97
Ap
r-97
Ju
l-97
Oct
-97
oil production oil price real economic activity rear effective exchange rate tshock
-0.6
-0.4
-0.2
0
0.2
0.4
0.6
Jan-
06
Apr-
06
Jul-0
6 O
ct-0
6 Ja
n-07
Ap
r-07
Ju
l-07
Oct
-07
Jan-
08
Apr-
08
Jul-0
8 O
ct-0
8 Ja
n-09
Ap
r-09
Ju
l-09
Oct
-09
Jan-
10
Apr-
10
Jul-1
0 O
ct-1
0 Ja
n-11
Ap
r-11
Ju
l-11
Oct
-11
oil production oil price real economic activity rear effective exchange rate tshock