Embed Size (px)
Citation preview
PROJECT TITLE: Impact of Flooding on Human Settlement in Rural Households of
Gambella Region in Ethiopia
PROJECT NUMBER: xxxxx
YEAR: 2012
STARTING DATE: August, 2012
ENDING DATE: March, 2014
REPORTING PERIOD COVERED: 01/09/2012 to 29/03/2014
TOTAL BUDGET: 50,000 USD
FINANCIAL IMPLEMENTATION RATE: 100%
SUPPORT OF THE ACPC-CLIMDEV WORK PROGRAM:
ii
IMPACT OF FLOODING ON HUMAN SETTLEMENT IN RURAL
HOUSEHOLDS OF GAMBELLA REGION IN ETHIOPIA
United Nations Economic Commission for Africa: African Climate Policy Center
&
Arba Minch Univerisity, Arba Minch Institute of Technology
By
Dr. Alemseged Tamiru, IWMI
Dr. Negash Wagesho, AMU
Mr. Ermias Alemu, AMU
March 2014
iii
EXECUTIVE SUMMARY
Natural and man induced alterations to the natural environment have significantly contributed to
the global climate change and local weather variability. This has been marked by frequent
occurrence of extreme weather events such as flood and drought in many parts of the world. The
societal implications of such weather variability are diverse and particularly jeopardized the
livelihoods of the rural community in developing countries. The agrarian community in the
developing nations is categorically equipped with least adaptive measures to cope with such
adverse effects. In many cases, the magnitude of resulting damage and coping strategies
exercised by the local community are not well documented in informative manner. The
indigenous coping mechanisms that have significant impact to recover from flood and drought
shock, in many cases, are overlooked.
The present study focused on the least developed part of Western Ethiopia, Gambella Regional
State. It covers Itang Special Woreda, with a total population size of about 42,000, situated in the
lower plain of Baro-Akobo basin that accounts 21 kebeles. More than 95 % of the inhabited area
is situated in the left and right banks of the Baro river and are susceptible to flood damage during
extreme flood events. The region is inhabited by agro-pastoralists and pastoralists where crop
production and animal herding are the mainstays for their livelihood. This particular study is
conducted with the main objective of providing empirical evidence on the loss and damage
caused by floods as a result of household level inability to fully cope or adapt to impacts. The
existing local knowledge associated to flood events and its ensuing damage and loss are
investigated from the community perspectives. The adaptive mechanisms that the local
community has been using are assessed and their relative merit is discussed.
Relevant information pertinent to the present study is organized through field observation,
household survey, focus group discussion and key informant interview. A total of 431 household
head are interviewed to respond to structured and non-structured questionnaires organized to
extract relevant information regarding flood loss and damage in the region. It has been learned
from the study that flood affected population of the study area use indigenous coping strategies
such as raising the foundation level of the houses, shifting properties and livestock to relatively
drier areas during flood season, temporarily moving to the nearby schools and other government

iv
offices for protection, using local boats to move from one place to the other, reserving food crops
for flood season, etc.
v
Table of Contents
1. INTRODUCTION ................................................................................................................................ 1
2. DESCRIPTION OF THE STUDY AREA ............................................................................................ 2
3. METHODS ........................................................................................................................................... 3
4. RESULTS ............................................................................................................................................. 7
4.1 Respondents‟ and households‟ profile .......................................................................................... 7
4.1.1 Respondents’ profile ............................................................................................................. 7
4.1.2 Households’ profile ............................................................................................................... 9
4.2 Climate change over the past 20 years and adaptation ............................................................... 15
4.3 The 2007 flood and coping strategies adopted by households .................................................... 19
4.3.1 Characteristics of the 2007 flood event .............................................................................. 19
4.3.3 Flood Impact ....................................................................................................................... 27
4.4 Participatory GIS Mapping ......................................................................................................... 35
4.4.1 Flood inundation pattern – Major flood routes ....................................................................... 35
4.4.2 Seasonal diagram .................................................................................................................... 39
5. CONCLUSIONS ................................................................................................................................. 42
vi
List of Tables
Table 1: Number of respondents in each village of Itang as well as the total population and number of
households in the year 2012. The shaded rows refer to villages where livestock keeping is the most
common while the remaining rows refer to villages were crop cultivation is common ............................... 5
Figure 1: Marital status of the respondents.................................................................................................. 8
Figure 2: Educational level of the respondents ............................................................................................. 9
Table 2: Household’s profile - Family size and household composition. Unless and otherwise specified the
percentage values are calculated as percentage of the total number of respondents ................................ 9
Table 3: Involvement in income generation activities: Agricultural ............................................................ 10
Table 4: Involvement in farming ................................................................................................................. 11
Table 5: Household’s Involvement in Livestock keeping ............................................................................. 12
Table 6: Access to electricity, safe drinking water and latrine .................................................................... 13
Table 7: Level of household food security ................................................................................................... 14
Table 8: Floor height of the houses of respondents .................................................................................... 15
Table 9: Did things you did to deal with changes in flood characteristics have any negative effects on the
living standard and well-being of your household? .................................................................................... 19
Table 10: The depth of 2007 flooding in Itang Special Woreda .................................................................. 21
Table 11: Respondent’s perception about duration of the 2007 flooding in Itang Special Woreda ........... 22
Table 12: Prevention actions taken by households to reduce the impact of the 2007 flooding ................. 26
Table 13: Frequency of households who received support to cope against impacts of the 2007 flood.
Note: the percentage in the second column is in terms of the total number of respondents while the
percentage in the remaining columns are in terms of the total number of respondents who received
support from each of the sources of support. ............................................................................................. 34
Table 14: The amount of time required to recover from impacts of the 2007 flood .................................. 35
Table 15: Seasonal diagram describing fish availability in the river. ......................................................... 39
vii
List of Figures
Figure 1: Marital status of the respondents.................................................................................................. 8
Figure 2: Educational level of the respondents ............................................................................................. 9
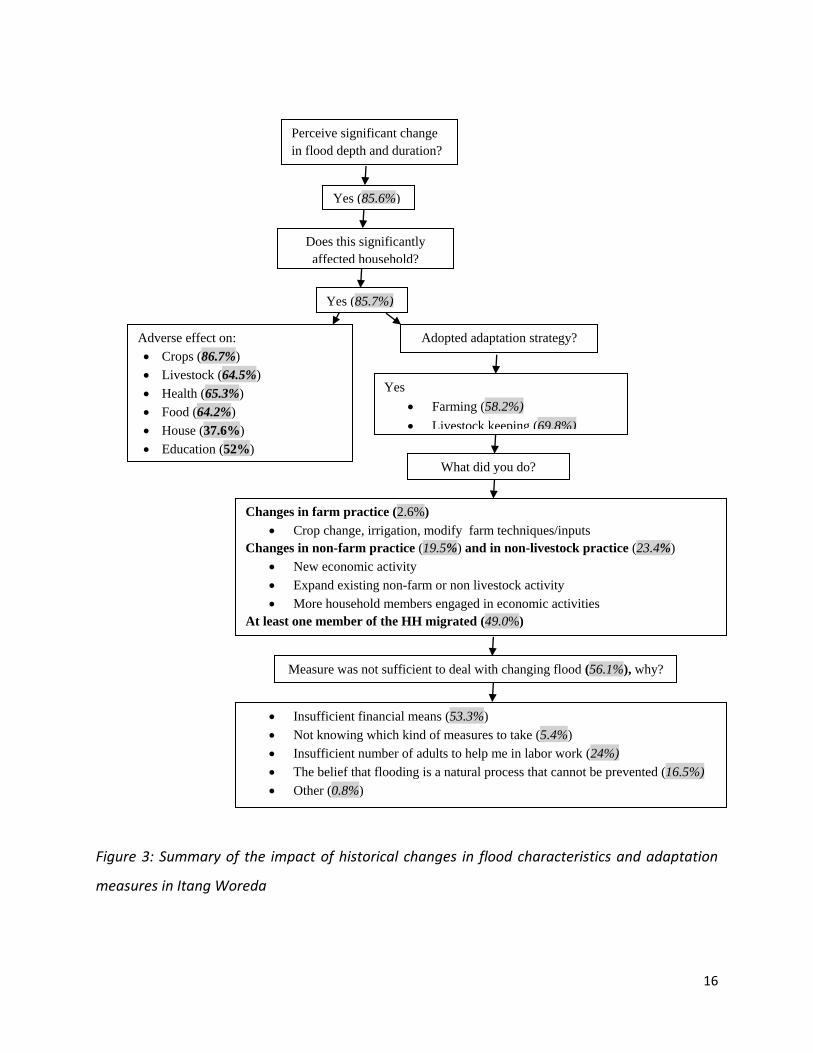
Figure 3: Summary of the impact of historical changes in flood characteristics and adaptation measures
in Itang Woreda .......................................................................................................................................... 16
Figure 4: Preventive actions applied by households and their effectiveness .............................................. 30
Figure 5: Part of Itang town inundated by the 2012 flood……………………………………………………….36
Figure 6: Location of major river bank breaches and the flood routs in Itang town, Note: Broken
lines show major flood flow direction, circled numbers show location of river breaches, Black
lines indicate gravel roads ………………………………………………………………………………………………….. 37
Figure 7 : Inundation extent of historical floods and flood extent for three frequencies which are
annual, every five year and every 10-year……………………………………………………………………………... 38
1
1. INTRODUCTION
The frequent occurrence of extreme hydrologic events such as flood and drought over the last
couple of decades signals key climate variability and change in many parts of the world. The
impacts of these extreme events vary from region to region. The Sub-Saharan part of Africa has
been affected by persistent flood and drought that jeopardized millions of urban and rural lives.
Projected impacts of climate change indicate that the Eastern African part of the region will be
affected by more frequent flooding, increased poverty of small-scale farmers and changing rainy
season will make agriculture more difficult, e.g. changed sowing dates due to later or earlier start
of wet season etc. (Goossens, 2007). These are the most affected regions due to their limited
coping capacity to the effects of climate change. The weather and climate variability and change
in terms of prolonged drought in Ethiopia dated back to 250 BC (Degefu, 1987). Prolonged
drought devoured crops and livestock as a consequence of which catastrophic famine and
ecological disorder had become inevitable facets of the late ninetieth century.
Among most severe natural disasters during the last century in Ethiopia, flood and drought
accounts for major proportion (48 flood and 12 drought events) in terms of loss of life and
associated damages to people and property (EM-DAT, 2010). Apart direct impacts on lives of
human and animals, flood and drought contribute to modification of fragile ecosystem in terms
of land degradation. Population growth is putting high pressure on resources and the rate of
conversion of forest to arable land due to intense cultivation is increasing
Hydrological response of these modified land use systems is different which in turn aggravate
the impacts of flood events. Most often flood plains in Awash and Baro River basins in Ethiopia
are settled by humans and livestock. Water is easily accessed and deposited moist soil is fertile to
support farming in these areas. Flooding of these areas during the recent years has resulted in
destructions of thousands of lives and property. In recognition of its importance, flood protection
is one of the five objectives of water resources management policy of the Ethiopian Water Sector
Policy (MoWR, 2001). The damages associated to flood are more pronounced in urban and rural
areas situated in flood plain. Gathering an exhaustive and region specific knowledge about flood
damage and loss on society and environment is an urgent course of action to cope with and
2
search for mitigation measures. The application of scientific methodologies to sort out how flood
and drought have been behaving since the pre-industrial era provides abroad picture of its
vulnerability and associated damages. The magnitude of flood loss and damage in terms of
societal implications (loss of human life, livestock, crop damage, resource degradation and
others) gathered from the target area enhances the foregoing argument. The mechanisms
practiced by the indigenous people to cope with frequently occurring flood events to sustain life
could yield valuable lesson for flood plain management.
In Ethiopia, majority of natural streams and flush flood originate from the highland area and
marches through defiles until they trace the low land plain zones. The highly steep slope and
associated topographical arrangements impart sufficient energy against flow resistance so that
the concentration time for flood water is reduced. It inundates vast area within short period of
time so that associated life and property loss become substantial. Moreover, the outburst of
epidemic waterborne diseases put the health condition of urban and rural community at risk. It
also causes physical injuries to people, mental health problems, and malnutrition as result of
reduced crop production. Therefore, the main objective of this study was to provide empirical
evidence on the loss and damage caused by floods as a result of household level inability to fully
cope or adapt to impacts.
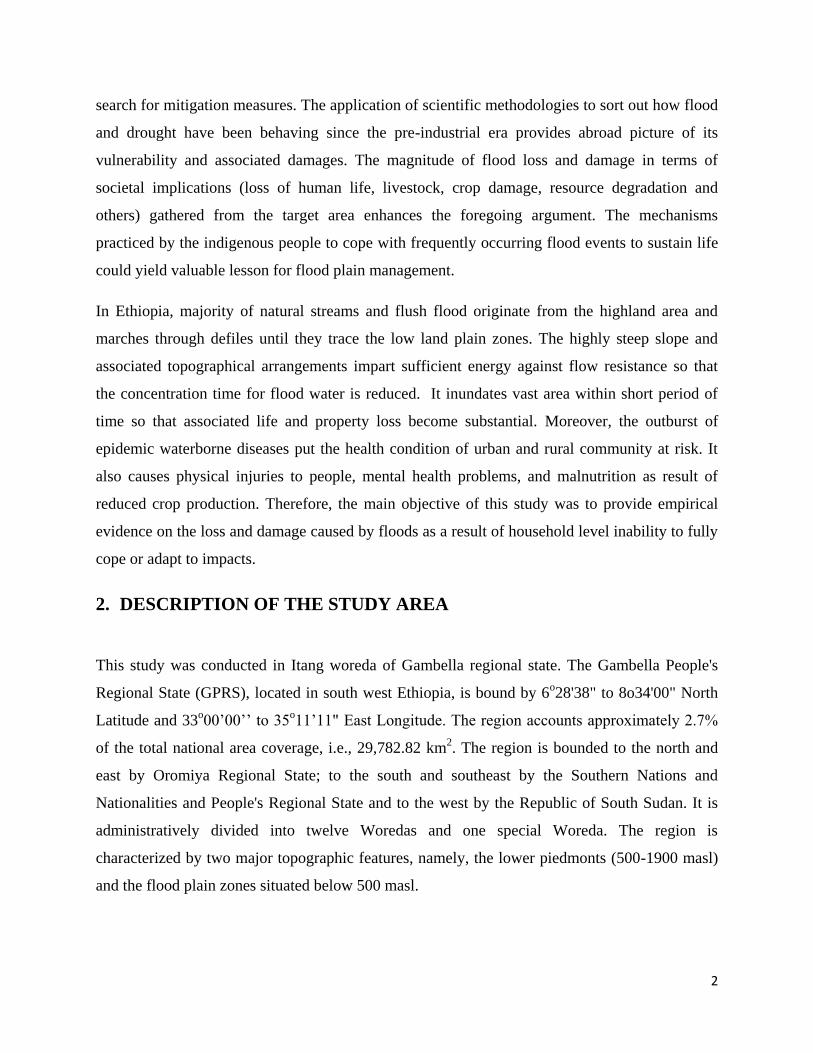
2. DESCRIPTION OF THE STUDY AREA
This study was conducted in Itang woreda of Gambella regional state. The Gambella People's
Regional State (GPRS), located in south west Ethiopia, is bound by 6o28'38" to 8o34'00" North
Latitude and 33o00‟00‟‟ to 35
o11‟11" East Longitude. The region accounts approximately 2.7%
of the total national area coverage, i.e., 29,782.82 km2. The region is bounded to the north and
east by Oromiya Regional State; to the south and southeast by the Southern Nations and
Nationalities and People's Regional State and to the west by the Republic of South Sudan. It is
administratively divided into twelve Woredas and one special Woreda. The region is
characterized by two major topographic features, namely, the lower piedmonts (500-1900 masl)
and the flood plain zones situated below 500 masl.
3
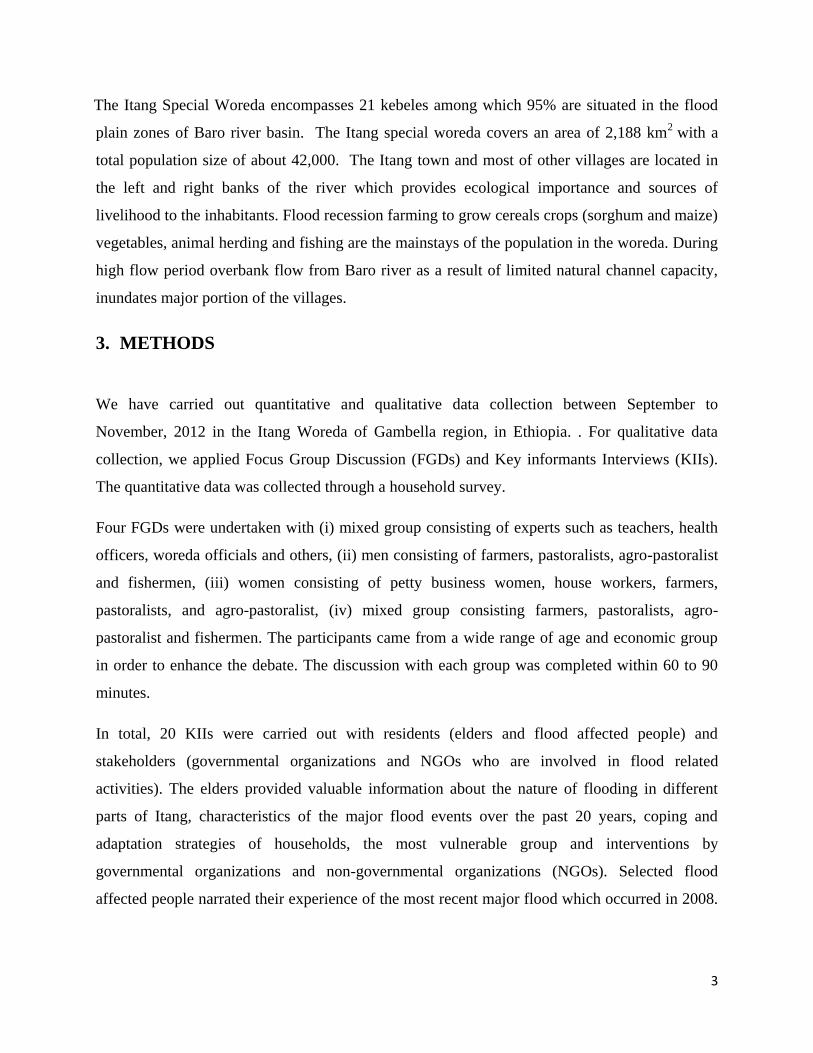
The Itang Special Woreda encompasses 21 kebeles among which 95% are situated in the flood
plain zones of Baro river basin. The Itang special woreda covers an area of 2,188 km2
with a
total population size of about 42,000. The Itang town and most of other villages are located in
the left and right banks of the river which provides ecological importance and sources of
livelihood to the inhabitants. Flood recession farming to grow cereals crops (sorghum and maize)
vegetables, animal herding and fishing are the mainstays of the population in the woreda. During
high flow period overbank flow from Baro river as a result of limited natural channel capacity,
inundates major portion of the villages.
3. METHODS
We have carried out quantitative and qualitative data collection between September to
November, 2012 in the Itang Woreda of Gambella region, in Ethiopia. . For qualitative data
collection, we applied Focus Group Discussion (FGDs) and Key informants Interviews (KIIs).
The quantitative data was collected through a household survey.
Four FGDs were undertaken with (i) mixed group consisting of experts such as teachers, health
officers, woreda officials and others, (ii) men consisting of farmers, pastoralists, agro-pastoralist
and fishermen, (iii) women consisting of petty business women, house workers, farmers,
pastoralists, and agro-pastoralist, (iv) mixed group consisting farmers, pastoralists, agro-
pastoralist and fishermen. The participants came from a wide range of age and economic group
in order to enhance the debate. The discussion with each group was completed within 60 to 90
minutes.
In total, 20 KIIs were carried out with residents (elders and flood affected people) and
stakeholders (governmental organizations and NGOs who are involved in flood related
activities). The elders provided valuable information about the nature of flooding in different
parts of Itang, characteristics of the major flood events over the past 20 years, coping and
adaptation strategies of households, the most vulnerable group and interventions by
governmental organizations and non-governmental organizations (NGOs). Selected flood
affected people narrated their experience of the most recent major flood which occurred in 2008.
4
The research team also interviewed governmental organizations and NGOs to assess their role in
flood disaster management in Itang.
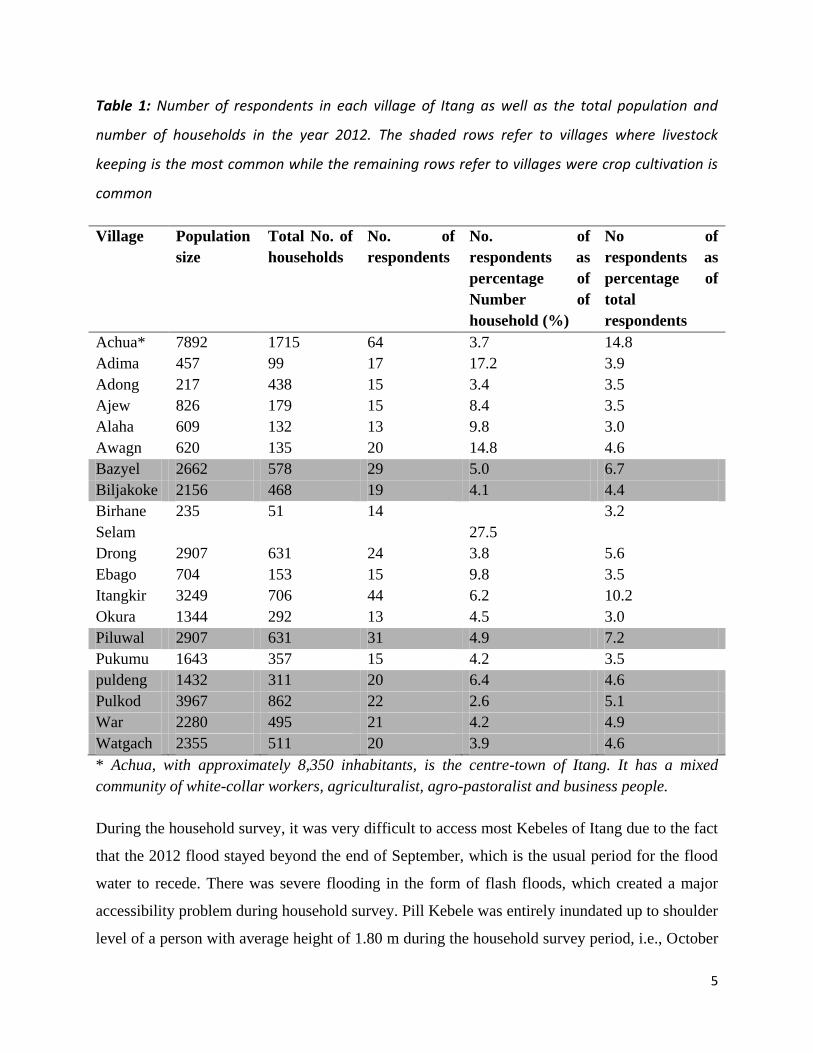
The total number of households surveyed in this study was 431. The households‟ distribution in
each Kebele is shown in Table 1. A minimum of 13 households (in Okura and Alaha Kebeles)
and a maximum of 64 households (in Achua Kebele) were surveyed. The total number of
respondents in this study was between 2.6% in Pulkod to 17.2% in Adima of the number of
households in the respective Kebele. This can be considered satisfactory coverage. Many
households were surveyed from Achua Kebele for several reasons, which help to get a very good
insight about impacts of flooding, copping and adaptation strategies. Achua is the center or town
of Itang which is characterized by the largest population size in the Woreda and by mixed
community (white collar, Agriculturalist, agro-pastoralist, business person). The severity of
flooding in Achua shows significant spatial variation and is caused by a combination of factors
such as excess rainfall and river overtopping.
5
Table 1: Number of respondents in each village of Itang as well as the total population and
number of households in the year 2012. The shaded rows refer to villages where livestock
keeping is the most common while the remaining rows refer to villages were crop cultivation is
common
Village Population
size
Total No. of
households
No. of
respondents
No. of
respondents as
percentage of
Number of
household (%)
No of
respondents as
percentage of
total
respondents
Achua* 7892 1715 64 3.7 14.8
Adima 457 99 17 17.2 3.9
Adong 217 438 15 3.4 3.5
Ajew 826 179 15 8.4 3.5
Alaha 609 132 13 9.8 3.0
Awagn 620 135 20 14.8 4.6
Bazyel 2662 578 29 5.0 6.7
Biljakoke 2156 468 19 4.1 4.4
Birhane
Selam
235 51 14
27.5
3.2
Drong 2907 631 24 3.8 5.6
Ebago 704 153 15 9.8 3.5
Itangkir 3249 706 44 6.2 10.2
Okura 1344 292 13 4.5 3.0
Piluwal 2907 631 31 4.9 7.2
Pukumu 1643 357 15 4.2 3.5
puldeng 1432 311 20 6.4 4.6
Pulkod 3967 862 22 2.6 5.1
War 2280 495 21 4.2 4.9
Watgach 2355 511 20 3.9 4.6
* Achua, with approximately 8,350 inhabitants, is the centre-town of Itang. It has a mixed
community of white-collar workers, agriculturalist, agro-pastoralist and business people.
During the household survey, it was very difficult to access most Kebeles of Itang due to the fact
that the 2012 flood stayed beyond the end of September, which is the usual period for the flood
water to recede. There was severe flooding in the form of flash floods, which created a major
accessibility problem during household survey. Pill Kebele was entirely inundated up to shoulder
level of a person with average height of 1.80 m during the household survey period, i.e., October
6
and November. For this reason, Pill was not included in this study but it is assumed that the
response obtained from other Kebeles will provide some insight about the coping and adaptation
strategies of households in Pill. Descriptive statistics are applied in this study to report results of
the quantitative survey.
Participatory mapping (PGIS)
In this part of the study, We applied participatory mapping also called PGIS for capturing spatial
variations of flood impact and characteristics. Mapping participants consisted of a group of six
community members from five Kebele‟s (Villages) of Itang Woreda. We selected participants in
such a way that they represent various socio-economic, demography (aged from 25-75 years) and
gender groups. Trained local language interpreters were assigned for two local languages
(Agnwak and Nuwer) for easy communication with different language users of the community.
All participants were provided with necessary stationary materials to aid the mapping process on
paper. The objective of mapping was explained to the participants. The research team located
key features like major and minor roads and Baro River on the mapping paper with the help of
participants. In participatory methods, it is mandatory that participants define the legend that
they can easily associated with events or phenomenon. Participants had a long discussion before
arriving at a unique symbol to represent each of the physical features that they want to show on
the map. They also clearly stated their reasons for choosing each of the symbols. Commonly, this
reason relates to what colors or symbols the community associates with negative or positive
impacts. For instance, participants used red color to show severe flood condition as in the
community red is associated with risk and loss; yellow or blue was used to show Moderately
affected areas as these colors stand for warning sign; and green color was used to represent least
affected areas as green is a symbol of abundance in Itang. Next participants identified the
location of their own houses on the map and then their houses served as reference points for
further mapping activities. This was followed by locating other prominent centers on the
mapping paper. These prominent centers include schools, churches, shopping center, police
station, telephone center, local administrative head office, and others for easy references on the
non-scaled paper. Community participants had long discussion and arrived at consensus before
putting down features on a map.
7
Seasonal diagram and daily activity
In this study, we applied seasonal diagram to assess seasonal changes in access to resources
(firewood, water, fish) in order to identify flood impacts. Participants for preparing seasonal
diagram were composed of men and women (8-10 representatives) who represented a wide range
of age and livelihood groups. The objective of the exercise was first clearly communicated to the
participants. They were also allowed to choose the symbols to represent various degrees of
resource availability. Four asterisks (****) was chosen to indicate adequate availability, three
asterisks (***) to indicate slightly adequate availability, two asterisks (**) to indicate scaricity
and one asterisk (*) to indicate high level of resources scarcity.
Daily activity helps to sequentially illustrate timing and importance of activities over a day.
Daily activity of selected individuals was assessed separately for men and women to identify
who is responsible for dealing with floods at household level and what time of the day is the
busiest in terms of dealing with floods. The overall objective was to assess whether flooding
introduces additional burden to households and whether the effect is disproportionate in terms of
gender.
4. RESULTS
Results of the household survey are presented under this section. First, the profile of the
respondents and the surveyed households is presented. Second, perception of respondents about
changes in flood characteristics over the past twenty years is analyzed and the adaptation
measures applied by households are also discussed. Third, the nature and causes of the 2007
extreme flood, coping and preventive measures and residual loss and damage are presented.
4.1 Respondents’ and households’ profile
4.1.1 Respondents’ profile
The proportions of male and female interviewees were nearly equal. Approximately 32 percent
of the households covered in this study are female headed while the remaining households are
male-headed. The average age of respondents is 43 years (median is also 43). Most respondents
(87.7%) were within the age group between 30 to 65 years and only less than one percent of
8
them are more than 65 years old. Respondents lived in the study area for at least 27 years. About
Sixty percent of the respondents lived within the study area for more than 20 years. This shows
that the respondents have lived long enough in the study area to provide a historical perspective
of flooding as well as coping and adaptation strategies in Itang.
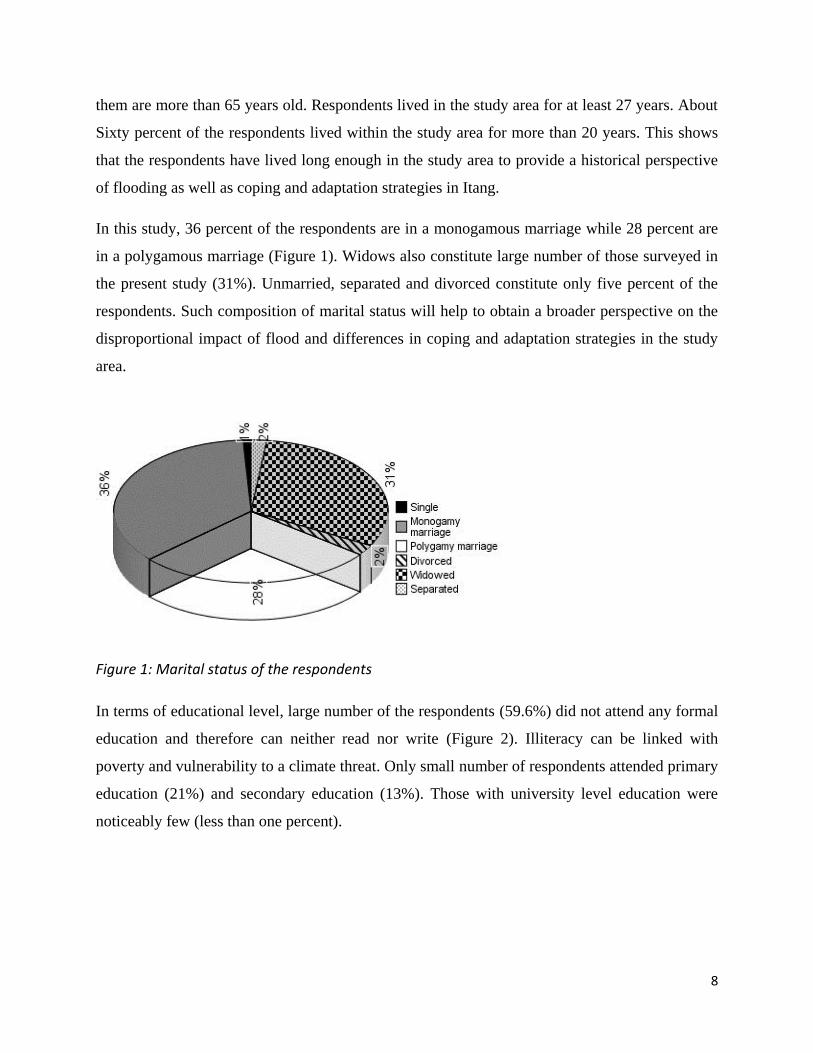
In this study, 36 percent of the respondents are in a monogamous marriage while 28 percent are
in a polygamous marriage (Figure 1). Widows also constitute large number of those surveyed in
the present study (31%). Unmarried, separated and divorced constitute only five percent of the
respondents. Such composition of marital status will help to obtain a broader perspective on the
disproportional impact of flood and differences in coping and adaptation strategies in the study
area.
Figure 1: Marital status of the respondents
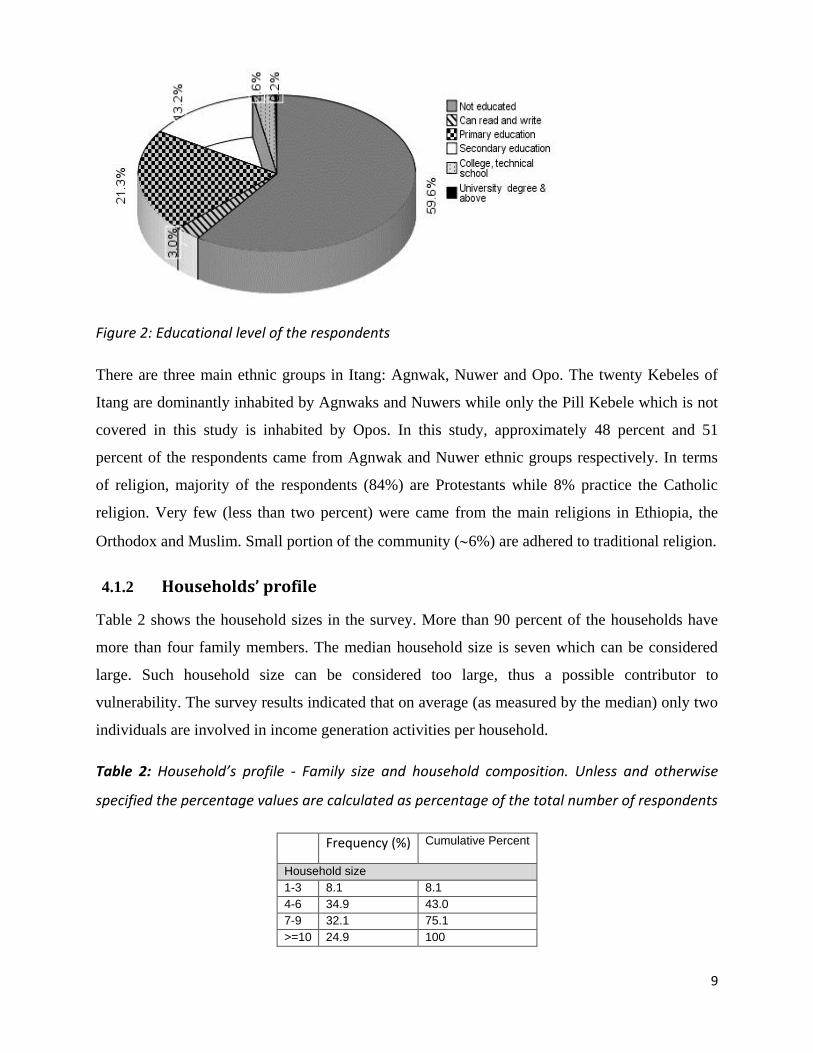
In terms of educational level, large number of the respondents (59.6%) did not attend any formal
education and therefore can neither read nor write (Figure 2). Illiteracy can be linked with
poverty and vulnerability to a climate threat. Only small number of respondents attended primary
education (21%) and secondary education (13%). Those with university level education were
noticeably few (less than one percent).
9
Figure 2: Educational level of the respondents
There are three main ethnic groups in Itang: Agnwak, Nuwer and Opo. The twenty Kebeles of
Itang are dominantly inhabited by Agnwaks and Nuwers while only the Pill Kebele which is not
covered in this study is inhabited by Opos. In this study, approximately 48 percent and 51
percent of the respondents came from Agnwak and Nuwer ethnic groups respectively. In terms
of religion, majority of the respondents (84%) are Protestants while 8% practice the Catholic
religion. Very few (less than two percent) were came from the main religions in Ethiopia, the
Orthodox and Muslim. Small portion of the community (6%) are adhered to traditional religion.
4.1.2 Households’ profile
Table 2 shows the household sizes in the survey. More than 90 percent of the households have
more than four family members. The median household size is seven which can be considered
large. Such household size can be considered too large, thus a possible contributor to
vulnerability. The survey results indicated that on average (as measured by the median) only two
individuals are involved in income generation activities per household.
Table 2: Household’s profile - Family size and household composition. Unless and otherwise
specified the percentage values are calculated as percentage of the total number of respondents
Frequency (%) Cumulative Percent
Household size
1-3 8.1 8.1
4-6 34.9 43.0
7-9 32.1 75.1
>=10 24.9 100
10
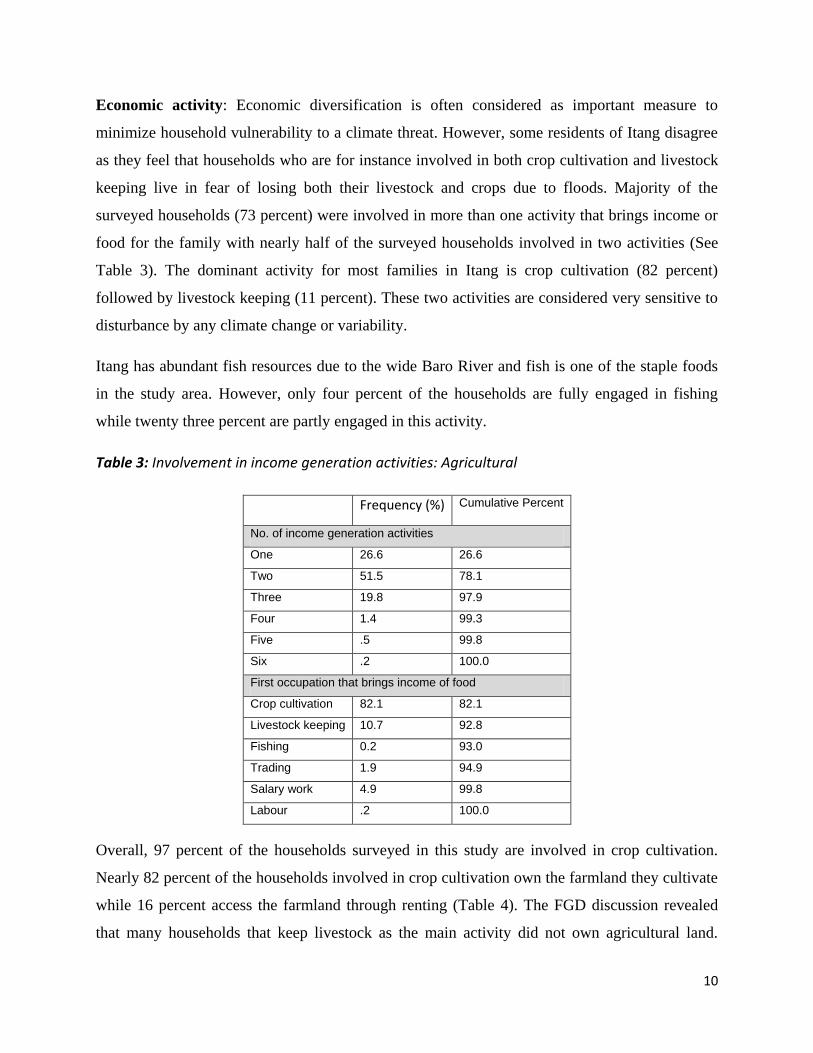
Economic activity: Economic diversification is often considered as important measure to
minimize household vulnerability to a climate threat. However, some residents of Itang disagree
as they feel that households who are for instance involved in both crop cultivation and livestock
keeping live in fear of losing both their livestock and crops due to floods. Majority of the
surveyed households (73 percent) were involved in more than one activity that brings income or
food for the family with nearly half of the surveyed households involved in two activities (See
Table 3). The dominant activity for most families in Itang is crop cultivation (82 percent)
followed by livestock keeping (11 percent). These two activities are considered very sensitive to
disturbance by any climate change or variability.
Itang has abundant fish resources due to the wide Baro River and fish is one of the staple foods
in the study area. However, only four percent of the households are fully engaged in fishing
while twenty three percent are partly engaged in this activity.
Table 3: Involvement in income generation activities: Agricultural
Frequency (%) Cumulative Percent
No. of income generation activities
One 26.6 26.6
Two 51.5 78.1
Three 19.8 97.9
Four 1.4 99.3
Five .5 99.8
Six .2 100.0
First occupation that brings income of food
Crop cultivation 82.1 82.1
Livestock keeping 10.7 92.8
Fishing 0.2 93.0
Trading 1.9 94.9
Salary work 4.9 99.8
Labour .2 100.0
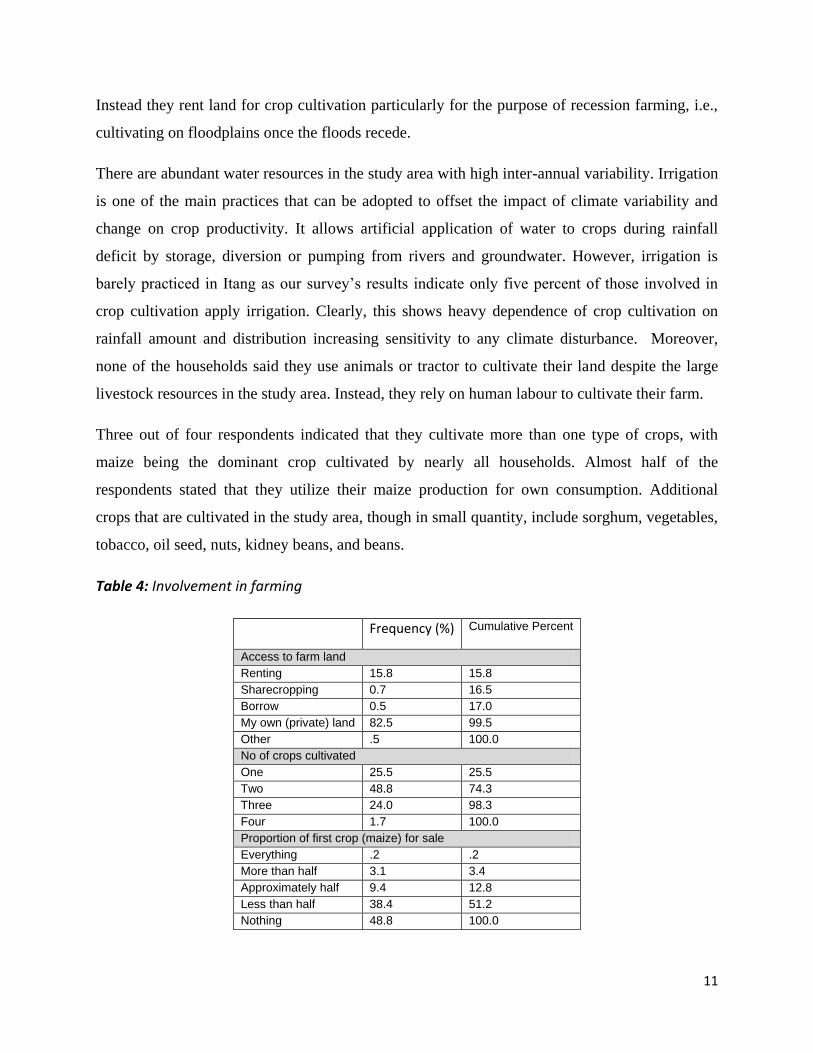
Overall, 97 percent of the households surveyed in this study are involved in crop cultivation.
Nearly 82 percent of the households involved in crop cultivation own the farmland they cultivate
while 16 percent access the farmland through renting (Table 4). The FGD discussion revealed
that many households that keep livestock as the main activity did not own agricultural land.
11
Instead they rent land for crop cultivation particularly for the purpose of recession farming, i.e.,
cultivating on floodplains once the floods recede.
There are abundant water resources in the study area with high inter-annual variability. Irrigation
is one of the main practices that can be adopted to offset the impact of climate variability and
change on crop productivity. It allows artificial application of water to crops during rainfall
deficit by storage, diversion or pumping from rivers and groundwater. However, irrigation is
barely practiced in Itang as our survey‟s results indicate only five percent of those involved in
crop cultivation apply irrigation. Clearly, this shows heavy dependence of crop cultivation on
rainfall amount and distribution increasing sensitivity to any climate disturbance. Moreover,
none of the households said they use animals or tractor to cultivate their land despite the large
livestock resources in the study area. Instead, they rely on human labour to cultivate their farm.
Three out of four respondents indicated that they cultivate more than one type of crops, with
maize being the dominant crop cultivated by nearly all households. Almost half of the
respondents stated that they utilize their maize production for own consumption. Additional
crops that are cultivated in the study area, though in small quantity, include sorghum, vegetables,
tobacco, oil seed, nuts, kidney beans, and beans.
Table 4: Involvement in farming
Frequency (%) Cumulative Percent
Access to farm land
Renting 15.8 15.8
Sharecropping 0.7 16.5
Borrow 0.5 17.0
My own (private) land 82.5 99.5
Other .5 100.0
No of crops cultivated
One 25.5 25.5
Two 48.8 74.3
Three 24.0 98.3
Four 1.7 100.0
Proportion of first crop (maize) for sale
Everything .2 .2
More than half 3.1 3.4
Approximately half 9.4 12.8
Less than half 38.4 51.2
Nothing 48.8 100.0
12
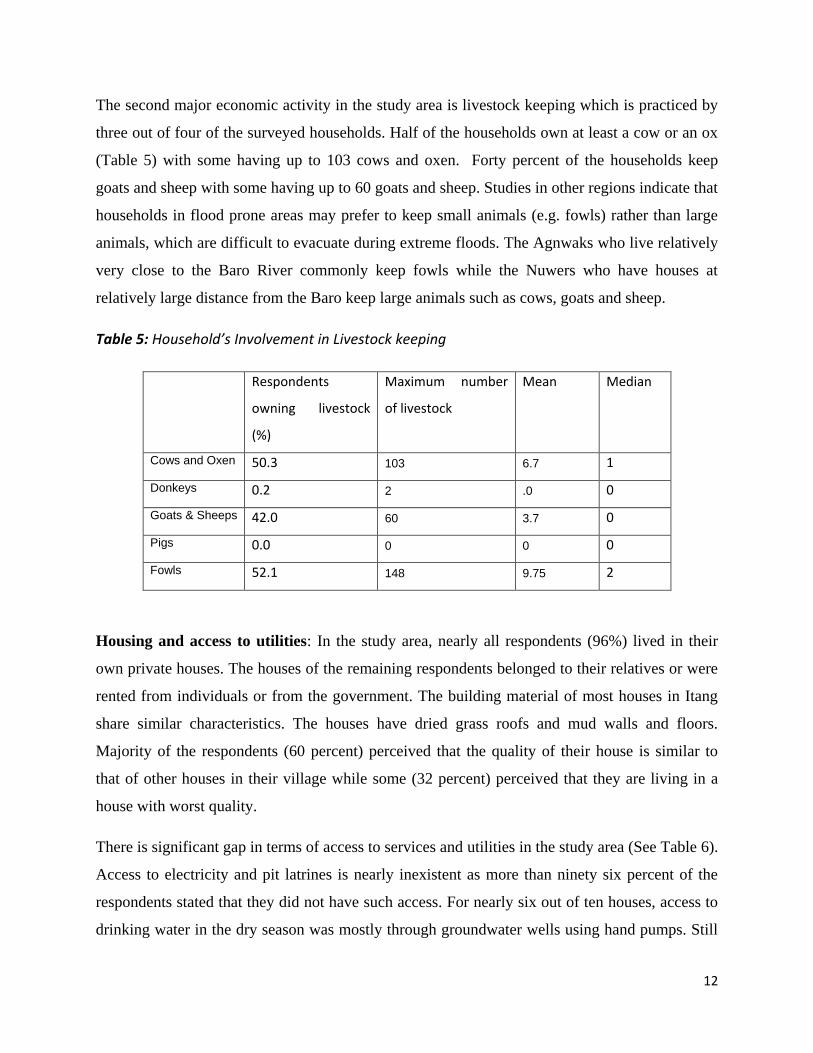
The second major economic activity in the study area is livestock keeping which is practiced by
three out of four of the surveyed households. Half of the households own at least a cow or an ox
(Table 5) with some having up to 103 cows and oxen. Forty percent of the households keep
goats and sheep with some having up to 60 goats and sheep. Studies in other regions indicate that
households in flood prone areas may prefer to keep small animals (e.g. fowls) rather than large
animals, which are difficult to evacuate during extreme floods. The Agnwaks who live relatively
very close to the Baro River commonly keep fowls while the Nuwers who have houses at
relatively large distance from the Baro keep large animals such as cows, goats and sheep.
Table 5: Household’s Involvement in Livestock keeping
Respondents
owning livestock
(%)
Maximum number
of livestock
Mean Median
Cows and Oxen 50.3 103 6.7 1
Donkeys 0.2 2 .0 0
Goats & Sheeps 42.0 60 3.7 0
Pigs 0.0 0 0 0
Fowls 52.1 148 9.75 2
Housing and access to utilities: In the study area, nearly all respondents (96%) lived in their
own private houses. The houses of the remaining respondents belonged to their relatives or were
rented from individuals or from the government. The building material of most houses in Itang
share similar characteristics. The houses have dried grass roofs and mud walls and floors.
Majority of the respondents (60 percent) perceived that the quality of their house is similar to
that of other houses in their village while some (32 percent) perceived that they are living in a
house with worst quality.
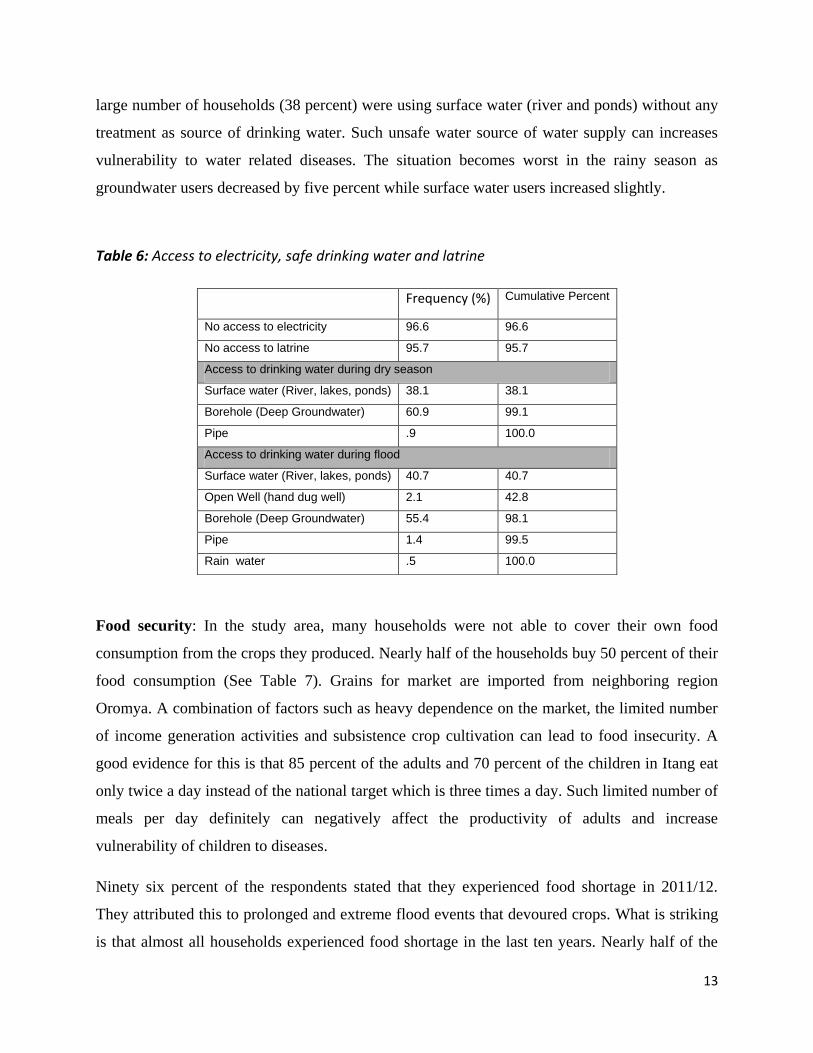
There is significant gap in terms of access to services and utilities in the study area (See Table 6).
Access to electricity and pit latrines is nearly inexistent as more than ninety six percent of the
respondents stated that they did not have such access. For nearly six out of ten houses, access to
drinking water in the dry season was mostly through groundwater wells using hand pumps. Still
13
large number of households (38 percent) were using surface water (river and ponds) without any
treatment as source of drinking water. Such unsafe water source of water supply can increases
vulnerability to water related diseases. The situation becomes worst in the rainy season as
groundwater users decreased by five percent while surface water users increased slightly.
Table 6: Access to electricity, safe drinking water and latrine
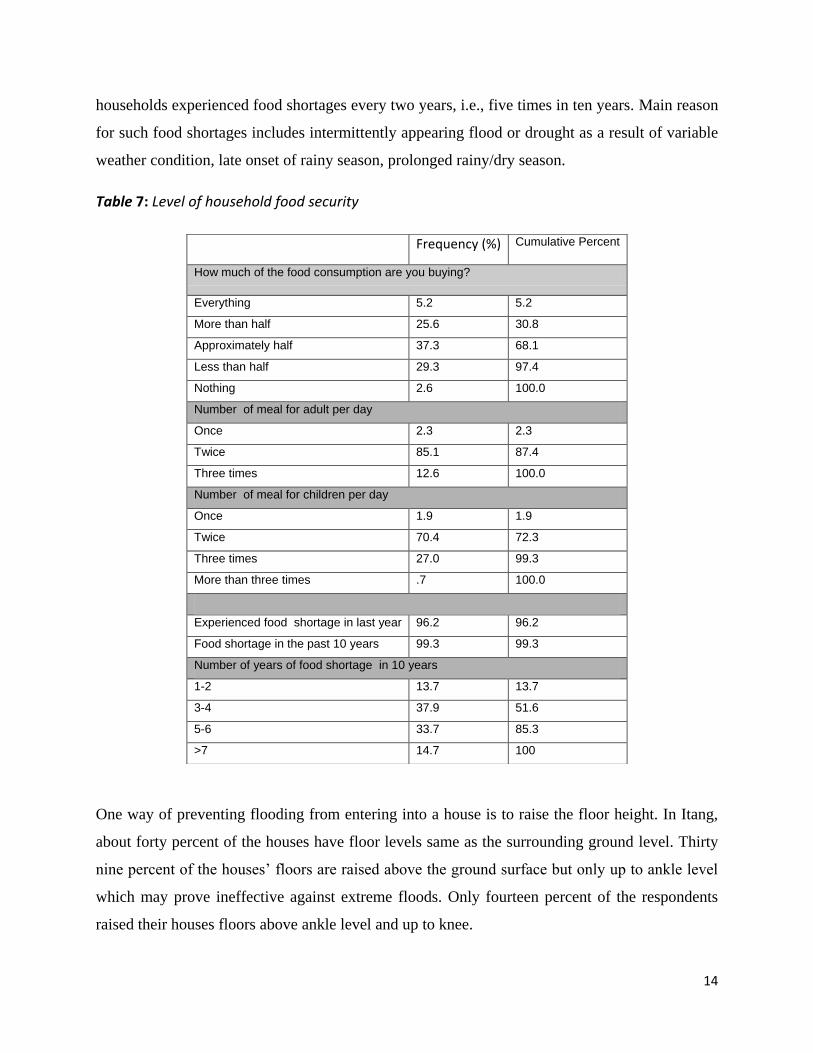
Food security: In the study area, many households were not able to cover their own food
consumption from the crops they produced. Nearly half of the households buy 50 percent of their
food consumption (See Table 7). Grains for market are imported from neighboring region
Oromya. A combination of factors such as heavy dependence on the market, the limited number
of income generation activities and subsistence crop cultivation can lead to food insecurity. A
good evidence for this is that 85 percent of the adults and 70 percent of the children in Itang eat
only twice a day instead of the national target which is three times a day. Such limited number of
meals per day definitely can negatively affect the productivity of adults and increase
vulnerability of children to diseases.
Ninety six percent of the respondents stated that they experienced food shortage in 2011/12.
They attributed this to prolonged and extreme flood events that devoured crops. What is striking
is that almost all households experienced food shortage in the last ten years. Nearly half of the
Frequency (%) Cumulative Percent
No access to electricity 96.6 96.6
No access to latrine 95.7 95.7
Access to drinking water during dry season
Surface water (River, lakes, ponds) 38.1 38.1
Borehole (Deep Groundwater) 60.9 99.1
Pipe .9 100.0
Access to drinking water during flood
Surface water (River, lakes, ponds) 40.7 40.7
Open Well (hand dug well) 2.1 42.8
Borehole (Deep Groundwater) 55.4 98.1
Pipe 1.4 99.5
Rain water .5 100.0
14
households experienced food shortages every two years, i.e., five times in ten years. Main reason
for such food shortages includes intermittently appearing flood or drought as a result of variable
weather condition, late onset of rainy season, prolonged rainy/dry season.
Table 7: Level of household food security
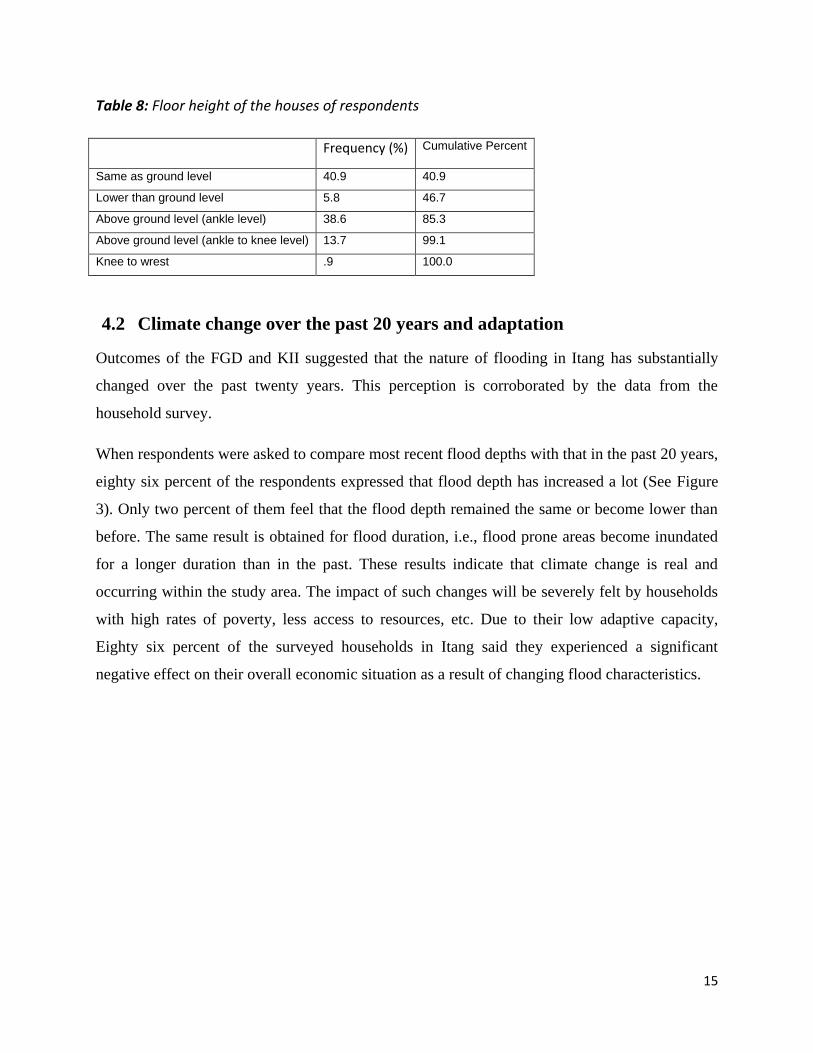
One way of preventing flooding from entering into a house is to raise the floor height. In Itang,
about forty percent of the houses have floor levels same as the surrounding ground level. Thirty
nine percent of the houses‟ floors are raised above the ground surface but only up to ankle level
which may prove ineffective against extreme floods. Only fourteen percent of the respondents
raised their houses floors above ankle level and up to knee.
Frequency (%) Cumulative Percent
How much of the food consumption are you buying?
Everything 5.2 5.2
More than half 25.6 30.8
Approximately half 37.3 68.1
Less than half 29.3 97.4
Nothing 2.6 100.0
Number of meal for adult per day
Once 2.3 2.3
Twice 85.1 87.4
Three times 12.6 100.0
Number of meal for children per day
Once 1.9 1.9
Twice 70.4 72.3
Three times 27.0 99.3
More than three times .7 100.0
Experienced food shortage in last year 96.2 96.2
Food shortage in the past 10 years 99.3 99.3
Number of years of food shortage in 10 years
1-2 13.7 13.7
3-4 37.9 51.6
5-6 33.7 85.3
>7 14.7 100
15
Table 8: Floor height of the houses of respondents
Frequency (%) Cumulative Percent
Same as ground level 40.9 40.9
Lower than ground level 5.8 46.7
Above ground level (ankle level) 38.6 85.3
Above ground level (ankle to knee level) 13.7 99.1
Knee to wrest .9 100.0
4.2 Climate change over the past 20 years and adaptation
Outcomes of the FGD and KII suggested that the nature of flooding in Itang has substantially
changed over the past twenty years. This perception is corroborated by the data from the
household survey.
When respondents were asked to compare most recent flood depths with that in the past 20 years,
eighty six percent of the respondents expressed that flood depth has increased a lot (See Figure
3). Only two percent of them feel that the flood depth remained the same or become lower than
before. The same result is obtained for flood duration, i.e., flood prone areas become inundated
for a longer duration than in the past. These results indicate that climate change is real and
occurring within the study area. The impact of such changes will be severely felt by households
with high rates of poverty, less access to resources, etc. Due to their low adaptive capacity,
Eighty six percent of the surveyed households in Itang said they experienced a significant
negative effect on their overall economic situation as a result of changing flood characteristics.
16
Figure 3: Summary of the impact of historical changes in flood characteristics and adaptation
measures in Itang Woreda
Adverse effect on:
Crops (86.7%)
Livestock (64.5%)
Health (65.3%)
Food (64.2%)
House (37.6%)
Education (52%)
Yes (85.6%)
Does this significantly
affected household?
Yes (85.7%)
Perceive significant change
in flood depth and duration?
Adopted adaptation strategy?
Yes
Farming (58.2%)
Livestock keeping (69.8%)
What did you do?
Changes in farm practice (2.6%)
Crop change, irrigation, modify farm techniques/inputs
Changes in non-farm practice (19.5%) and in non-livestock practice (23.4%)
New economic activity
Expand existing non-farm or non livestock activity
More household members engaged in economic activities
At least one member of the HH migrated (49.0%)
Measure was not sufficient to deal with changing flood (56.1%), why?
Insufficient financial means (53.3%)
Not knowing which kind of measures to take (5.4%)
Insufficient number of adults to help me in labor work (24%)
The belief that flooding is a natural process that cannot be prevented (16.5%)
Other (0.8%)
17
Respondents in Itang reported that flooding disrupts their daily activities by hindering income
generation activities (agriculture, livestock keeping, trade), food, shelter, business and the
education process. For instance, majority of the respondents (86 percent) experienced a severe
negative effect on crop production as a result of changed characteristics of floods. Such severe
effect was manifest by the flood-induced damage or destruction to standing crops, damage to
stored grains, and loss of productivity. The cropping season in Itang correspond to the beginning
of the rainy season and the end of the rainy season.
Gambella is considered one of the livestock rich regions in Ethiopia. However, livestock keeping
is very sensitive to impacts of climate change. In the study area, 65 percent of the respondents
that keep livestock stated that increased flood depth and duration caused severe negative effects
on their livestock. The FGD participants identified the impact of flooding on livestock to include
lack of grazing land, animal diseases, death of livestock and loss of productivity.
Increased depth and duration of flooding lead to deterioration of human health due to flood
related diseases. Discussion with health officers indicated that the health impact of flooding is
severe in Itang. This was also reflected in the results of the household survey as 65 percent of the
households stated that their household is severely affected by deterioration of health situation
due to changing floods.
There was evidence that households were attempting to adapt to the changing floods. Results of
the household survey indicated that 58 percent and 70 percent of the households involved in crop
cultivation and livestock keeping respectively applied at least one adaptation measure. For
instance, the households increased their involvement in new economic activity, expanded
existing non-farm or non-livestock activity, increased the number of household members
engaged in economic activities, or household members migrated to other areas to adapt to
climate change. Despite the adverse impact of flooding on crops, only less than three percent of
the respondents stated that they changed their farming practice by changing crop type, applying
irrigation, or modifying farm techniques/inputs. Migration is found to be a common way to adapt
to change in flood characteristics. Half of the surveyed households migrated repeatedly in order
to adapt to changing floods.
18
A significant number of respondents (56 percent) expressed that the adaptation measure their
household adopted was not sufficient to deal with impacts of changing flood. A number of
reasons were given for the inability of the households to fully adapt to increased flood severity.
The most common reason is lack of financial means to implement adaptation measures -
according to more than half the respondents. Insufficient work force in the households is
mentioned as a reason by 24 percent of the respondents. Sixteen percent of the respondents stated
that they believe that flooding is a natural process that cannot be prevented. This can be
attributed to the low level of literacy in the study area. Only few mentioned that they did not
know which kind of measures to take.
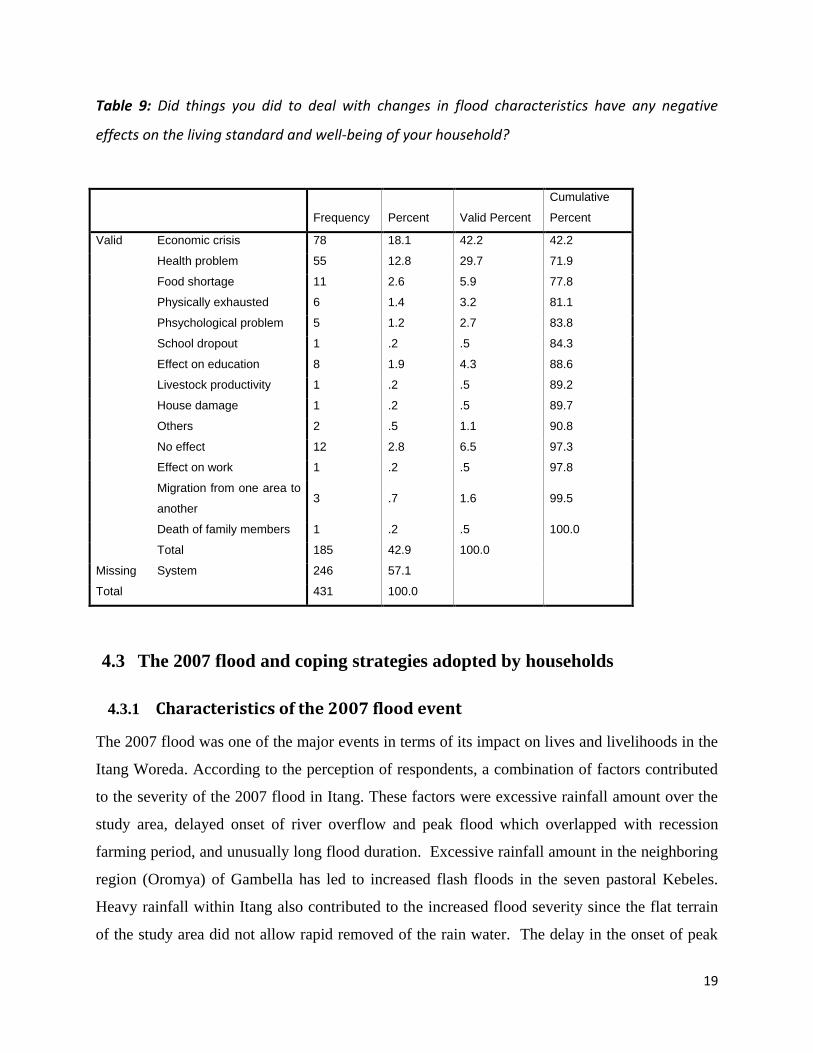
Effect of inability to adapt: The inability to adapt to changing flood behavior had consequences
in each household. For 42 percent of the surveyed households this is mainly manifested through
economic crisis. Some have lost their entire livestock over the past twenty years others could not
fully cultivate crops. Households were also forced to use their limited resources in order to deal
with the changing floods instead of improving their livelihood. Health problems also led to
economic crisis as they decreased the amount of effective work force in a household and families
were often forced to use their limited income for covering their health expense. Thirty percent of
the respondents stated that the health situation of their family member deteriorated due changing
floods. There is a perception that disease incidence had substantially increased over the years as
flood severity increased.
19
Table 9: Did things you did to deal with changes in flood characteristics have any negative
effects on the living standard and well-being of your household?
Frequency Percent Valid Percent
Cumulative
Percent
Valid Economic crisis 78 18.1 42.2 42.2
Health problem 55 12.8 29.7 71.9
Food shortage 11 2.6 5.9 77.8
Physically exhausted 6 1.4 3.2 81.1
Phsychological problem 5 1.2 2.7 83.8
School dropout 1 .2 .5 84.3
Effect on education 8 1.9 4.3 88.6
Livestock productivity 1 .2 .5 89.2
House damage 1 .2 .5 89.7
Others 2 .5 1.1 90.8
No effect 12 2.8 6.5 97.3
Effect on work 1 .2 .5 97.8
Migration from one area to
another 3 .7 1.6 99.5
Death of family members 1 .2 .5 100.0
Total 185 42.9 100.0
Missing System 246 57.1
Total 431 100.0
4.3 The 2007 flood and coping strategies adopted by households
4.3.1 Characteristics of the 2007 flood event
The 2007 flood was one of the major events in terms of its impact on lives and livelihoods in the
Itang Woreda. According to the perception of respondents, a combination of factors contributed
to the severity of the 2007 flood in Itang. These factors were excessive rainfall amount over the
study area, delayed onset of river overflow and peak flood which overlapped with recession
farming period, and unusually long flood duration. Excessive rainfall amount in the neighboring
region (Oromya) of Gambella has led to increased flash floods in the seven pastoral Kebeles.
Heavy rainfall within Itang also contributed to the increased flood severity since the flat terrain
of the study area did not allow rapid removed of the rain water. The delay in the onset of peak
20
flood level and increased flood duration had a significant negative impact on the livelihood of
households in Itang. For instance, there was lack of supplemental rainfall for recession crop
cultivation as the growing season was extended to the driest months (e.g. January). Increased
flood duration severely affected livestock as well since grazing land was entirely covered by
water for an extended period of time.
When severity of flood exceeds a certain threshold, it disrupts the normal life of households.
About half of the respondents characterized the 2007 flood as highly severe and many (38%) felt
it was disastrous. Three out of four respondents were partly or completely unable to go to their
work place and engage in food or income generation activities due to the severity of the flood.
This has contributed to food shortage and low income undermining households‟ capacity to deal
with the flood impact.
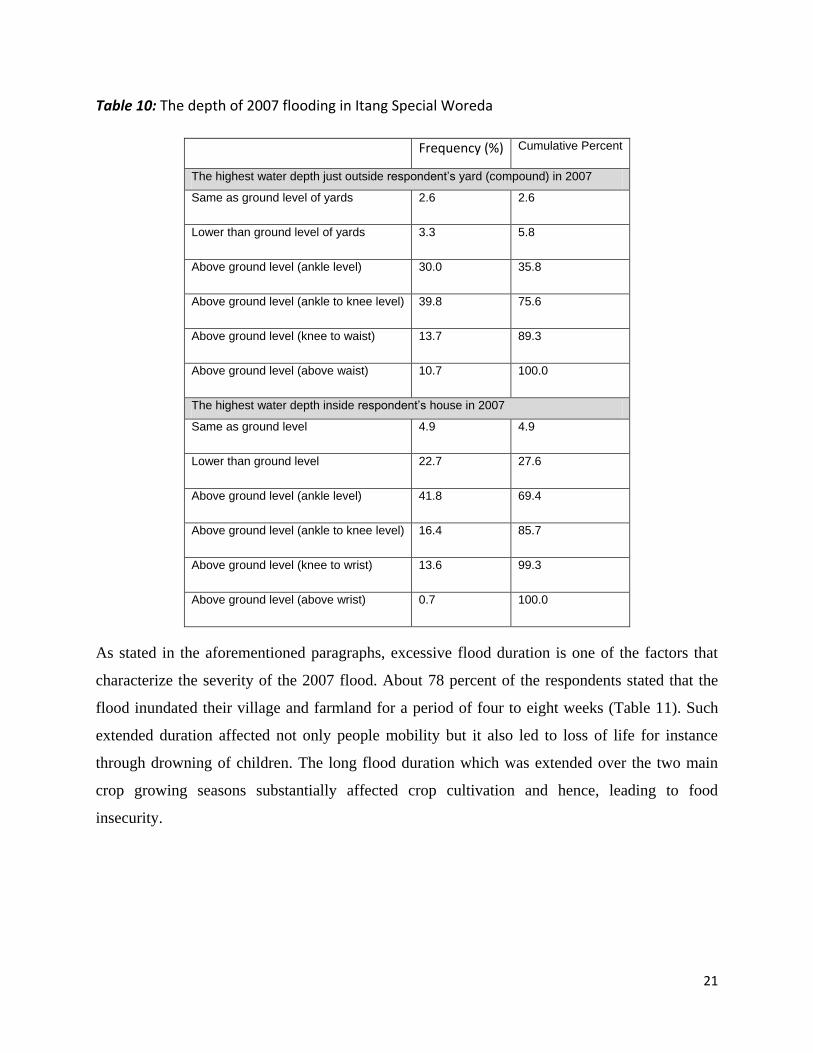
One of the main characteristics of the flood in Itang is its excessively high depth which has
limited people‟s mobility. In many villages, swimming was the only way to cross the flood water
and access service areas such as hospital and market places. In 2007, about 94 percent of the
respondents‟ yard was inundated with the flood level exceeding ankle level in 60 percent of the
yards (Table 10). The flood water found its way into 72 percent of the surveyed houses with its
level exceeding ankle level in 31 percent of the houses. This suggests that properties of many
houses were exposed to impact of flooding unless some preventive measures were undertaken
particularly considering the relatively small floor height of the houses in the study area. Wet
floors also contributed to deterioration of health condition.
21
Table 10: The depth of 2007 flooding in Itang Special Woreda
Frequency (%) Cumulative Percent
The highest water depth just outside respondent’s yard (compound) in 2007
Same as ground level of yards 2.6 2.6
Lower than ground level of yards 3.3 5.8
Above ground level (ankle level) 30.0 35.8
Above ground level (ankle to knee level) 39.8 75.6
Above ground level (knee to waist) 13.7 89.3
Above ground level (above waist) 10.7 100.0
The highest water depth inside respondent’s house in 2007
Same as ground level 4.9 4.9
Lower than ground level 22.7 27.6
Above ground level (ankle level) 41.8 69.4
Above ground level (ankle to knee level) 16.4 85.7
Above ground level (knee to wrist) 13.6 99.3
Above ground level (above wrist) 0.7 100.0
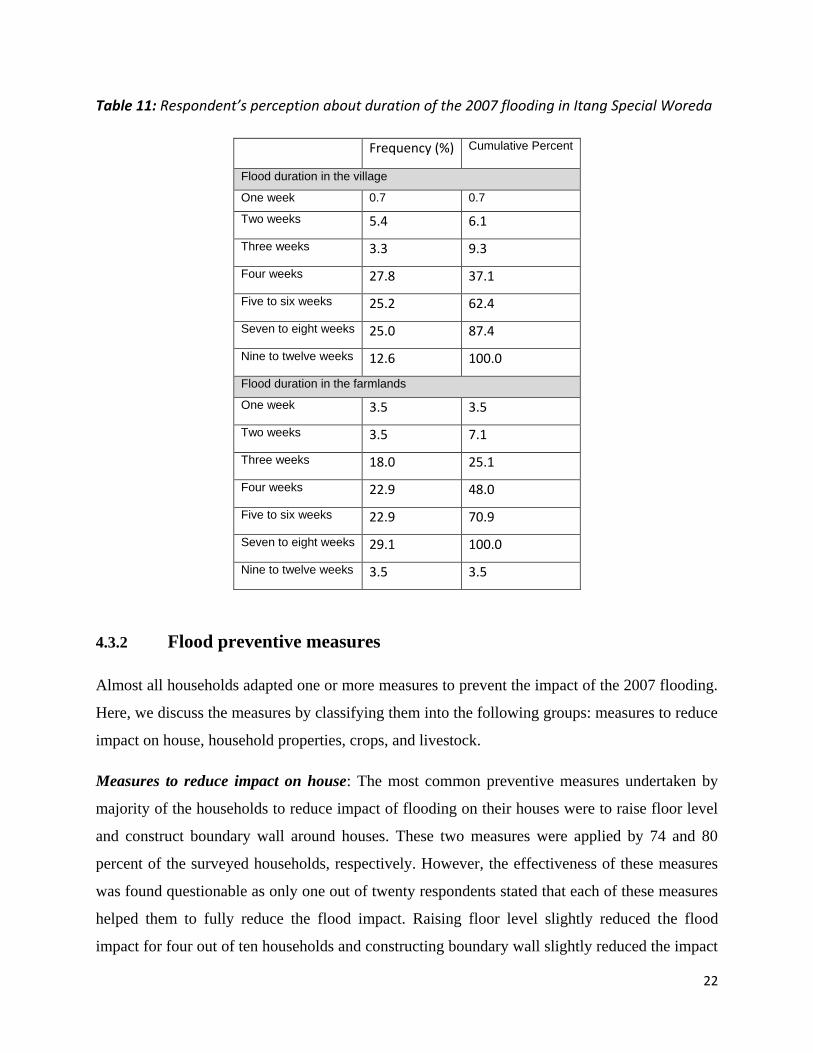
As stated in the aforementioned paragraphs, excessive flood duration is one of the factors that
characterize the severity of the 2007 flood. About 78 percent of the respondents stated that the
flood inundated their village and farmland for a period of four to eight weeks (Table 11). Such
extended duration affected not only people mobility but it also led to loss of life for instance
through drowning of children. The long flood duration which was extended over the two main
crop growing seasons substantially affected crop cultivation and hence, leading to food
insecurity.
22
Table 11: Respondent’s perception about duration of the 2007 flooding in Itang Special Woreda
Frequency (%) Cumulative Percent
Flood duration in the village
One week 0.7 0.7
Two weeks 5.4 6.1
Three weeks 3.3 9.3
Four weeks 27.8 37.1
Five to six weeks 25.2 62.4
Seven to eight weeks 25.0 87.4
Nine to twelve weeks 12.6 100.0
Flood duration in the farmlands
One week 3.5 3.5
Two weeks 3.5 7.1
Three weeks 18.0 25.1
Four weeks 22.9 48.0
Five to six weeks 22.9 70.9
Seven to eight weeks 29.1 100.0
Nine to twelve weeks 3.5 3.5
4.3.2 Flood preventive measures
Almost all households adapted one or more measures to prevent the impact of the 2007 flooding.
Here, we discuss the measures by classifying them into the following groups: measures to reduce
impact on house, household properties, crops, and livestock.
Measures to reduce impact on house: The most common preventive measures undertaken by
majority of the households to reduce impact of flooding on their houses were to raise floor level
and construct boundary wall around houses. These two measures were applied by 74 and 80
percent of the surveyed households, respectively. However, the effectiveness of these measures
was found questionable as only one out of twenty respondents stated that each of these measures
helped them to fully reduce the flood impact. Raising floor level slightly reduced the flood
impact for four out of ten households and constructing boundary wall slightly reduced the impact
23
for five out of ten households. Overall, raising the floor height by few centimeters (only up to
ankle level) offered temporary solution during normal floods but did not help much during the
2007 extreme flood. The research team observed that the boundary walls were constructed from
mud and were not noticeably high (lower than ankle level) not alone to prevent flood inundation.
Nearly four out of ten respondents kept existing ditches around their house clean or dug new
ditches. Only less than five percent of the respondents who applied these two measures felt that
the measures were very helpful while only 25 percent and 36 percent of them stated that keeping
existing ditches clean and digging new ones slightly reduced the flood impact on their houses,
respectively. Such low success rate in reducing the flood impact by diverting excess water away
from the residential areas can be explained by (i) the topography of the study area is too flat to
rapidly remove the flood water, and (ii) the ditches were constructed by the local people without
proper guidance from engineers and as such the ditches were too small with low gradient and
poor layout.
Measures to reduce impact on household properties: Protecting household properties from
flood impact is one of the major activities that consume the time and energy of many people in
Itang. In 2007, households took some preventive measures as listed. Two-thirds of the
households have kept their properties on ceiling or elevated places in their houses in order to
prevent damage caused by floods. For instance, it is a common practice in Itang to keep
properties on beds, tables and chairs which were deteriorated due to repeated use leading to
additional expense for maintenance or replacement. During the field work for the present study,
the research team observed that some people in Achua Kebele were staying outside their houses
during the day time since their houses were wet and their beds, tables and chair were occupied by
household properties. In the evening they were returning back to their houses to pass the night.
The measure was moderately successful as it fully avoided flood impact on properties of one out
of five households and slightly reduced the impact for six out of ten households who adapted it.
As the flood level increased and the threat became serious, 34 percent of the respondents shifted
their properties to the houses of their relatives who were living in areas not severely affected by
the flood. Adaption of this measure was found helpful in fully or partly avoiding property
damage by four and 62 percent of the households, respectively. However, it should be noted that
flood affected people were able to save only few of their properties (commonly cooking
24
utensils). The extent of evacuated or saved property depends upon the carrying capacity of the
member of the household, level of information about the arrival of the flood and travel distance
to the temporary shelters.
Measures to reduce crop damage: Despite the huge impact on crops by annual floods, only few
of the respondents adapted preventive measures to reduce or fully avoid damage of standing
crops by the 2007 flood. Less than one third of the respondents harvested premature crops in
order to avoid flood damage. This measure was reported to be successful by half of the
respondents in terms of slightly reducing crop damage but none of the respondents were able to
fully avoid crop damage by adapting this measure. Nearly one out of ten respondents changed
crop pattern or delayed sowing and same proportion invested less on crop cultivation anticipating
extreme flooding in 2007. Such low rate of adaption of the three important measures is possibly
due to lack of timely information about floods or lack of awareness. What is striking here is that
none of the respondents mentioned that these measures helped them to fully avoid the flood
impact on standing crops though slightly reduced for 10 to 25 percent of the households. During
FGD, some stated that measures such as less investment on farming to reduce flood impact
increased their vulnerability to flooding as their household faced food shortage since they run out
of grains as a result of limited or no crop production.
One way of preventing flood water from inundating farm land is by constructing new ditches or
cleaning existing ones. These were also adapted in the study area where 32 percent of the
households cleaned existing ditches while 40 percent of them dug new ditches. Despite this
effort, only less than two and six out of ten of the respondents who adapted the two measures
respectively stated they were able to fully avoid the impact of flooding on crops. The result
suggests that the 2007 flood found its way in to large number of farms. However, cleaning the
ditches helped to slightly reduce impact on crops of eight out of ten respondents who applied the
measure and nearly two-third of those who dug new ditches were able to slightly reduce the
flood impact. Cleaning existing ditches or digging new ones were reported to be not helpful to
fully avoid impacts probably due to inadequate capacity of the ditches to remove extreme flood
water. The flat terrain of Itang requires expert inputs when designing and constructing the layout
and capacity of ditches which is not the case in the study area as residents constructed ditches by
themselves without any technical support.
25
Measures to reduce livestock damage: Nearly half of the respondents that keep big animals
(cows, sheep and goats) applied at least one preventive measure that included making a raised
stage and keeping the cattle in it, or keeping the animals in schools, stores or other places which
were not affected by the flood in Itang. These measures were adapted most often but in sequence
by households. For instance, for low to moderate flood levels animals were kept on raised stages
but were moved to dry places in other villages or Kebeles as the flood severity increased. Only
few of the respondents (zero to three percent) stated that these measures were very helpful in
fully avoiding the impact of floods on animals. Keeping cattle on relatively dry and high
elevation places may somewhat help to reduce direct impact of flood but indirect impacts will
still exist for instance impact of the rainfall cannot be fully avoided as the cattle are often kept in
open space. Another indirect impact of flooding is lack of grazing land.
Selling cattle was adapted to avoid or reduce impact of flooding. This was adapted by forty five
percent of the surveyed households and was found to slightly reduce the impact. Most
households did not sell all their cattle and as a result this measure was not helpful in fully
avoiding impact but it slightly helped seven households out of the ten that sold their cattle.
Seventeen percent of the households that keep cattle were forced to evacuate their cattle outside
the Itang Woreda.
The majority of the respondents (60%) who keep fowls made a raised stage and kept their fowls
in it during the flooding period. This practice fully avoided the impact on fowls for 17 percent of
the residents and slightly reduced the impact for 63 percent of respondents. Only two out of five
households that keep fowls moved their fowls to schools, stores or other dry places in Itang as
the severity of the flood in their village increased. Instead of losing their fowls by the flood, two
out of five households sold their fowls. This is expected to erode their asset base increasing their
vulnerability for future flood.
26
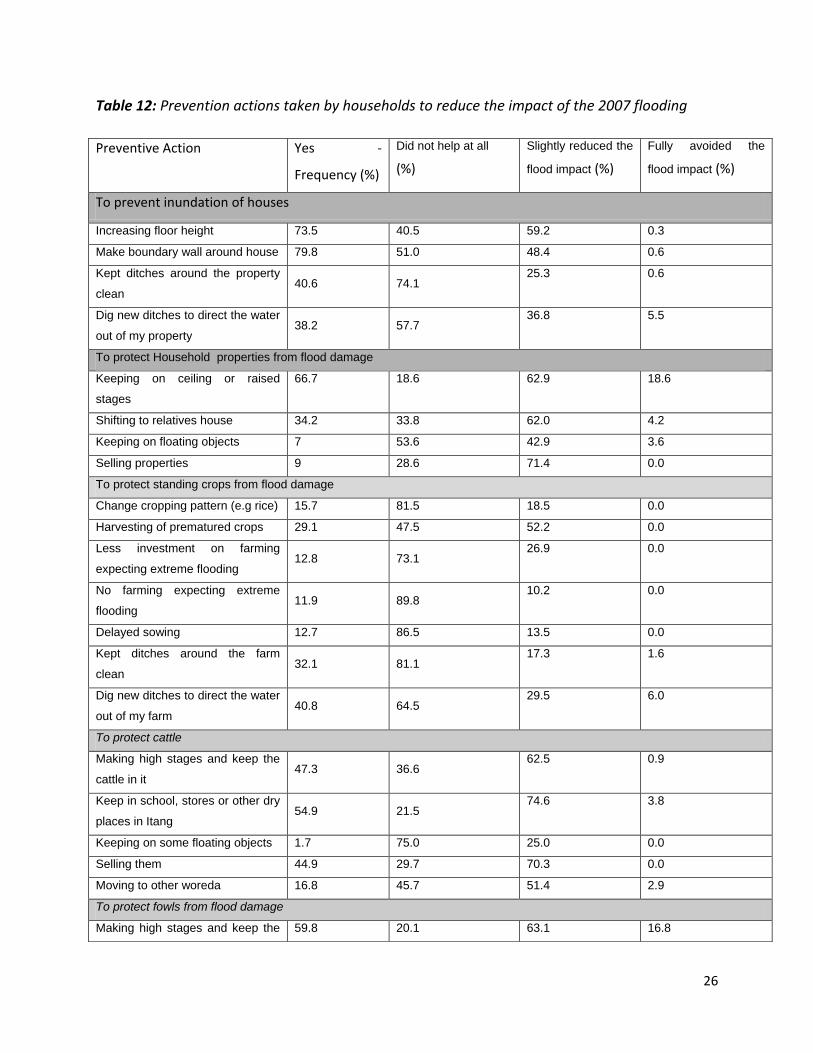
Table 12: Prevention actions taken by households to reduce the impact of the 2007 flooding
Preventive Action Yes -
Frequency (%)
Did not help at all
(%)
Slightly reduced the
flood impact (%)
Fully avoided the
flood impact (%)
To prevent inundation of houses
Increasing floor height 73.5 40.5 59.2 0.3
Make boundary wall around house 79.8 51.0 48.4 0.6
Kept ditches around the property
clean 40.6 74.1
25.3 0.6
Dig new ditches to direct the water
out of my property 38.2 57.7
36.8 5.5
To protect Household properties from flood damage
Keeping on ceiling or raised
stages
66.7 18.6 62.9 18.6
Shifting to relatives house 34.2 33.8 62.0 4.2
Keeping on floating objects 7 53.6 42.9 3.6
Selling properties 9 28.6 71.4 0.0
To protect standing crops from flood damage
Change cropping pattern (e.g rice) 15.7 81.5 18.5 0.0
Harvesting of prematured crops 29.1 47.5 52.2 0.0
Less investment on farming
expecting extreme flooding 12.8 73.1
26.9 0.0
No farming expecting extreme
flooding 11.9 89.8
10.2 0.0
Delayed sowing 12.7 86.5 13.5 0.0
Kept ditches around the farm
clean 32.1 81.1
17.3 1.6
Dig new ditches to direct the water
out of my farm 40.8 64.5
29.5 6.0
To protect cattle
Making high stages and keep the
cattle in it 47.3 36.6
62.5 0.9
Keep in school, stores or other dry
places in Itang 54.9 21.5
74.6 3.8
Keeping on some floating objects 1.7 75.0 25.0 0.0
Selling them 44.9 29.7 70.3 0.0
Moving to other woreda 16.8 45.7 51.4 2.9
To protect fowls from flood damage
Making high stages and keep the 59.8 20.1 63.1 16.8
27
4.3.3 Flood Impact
To evaluate the severity of the 2007 flood impact, two sets of questions were asked: one set is
focusing on the physical effect (damage) and the other is addressing the effect on production
(loss). In terms of physical damage, the most severe effect in the study area was damage to
standing crops as reported by 77 percent of the surveyed households. The standing crops of the
first growing season (June to August) were damaged and in some cases entirely destroyed by
early season flood which inundated most of the farmlands. Harvested and pilled crop of 38
percent of the households were severely damaged by the floodwater. During the second growing
season (September to December), most of the farmlands were inundated and crops (starting from
seedling stage) were severely damaged by late season flood. Food reserves (grains) of nearly
half of the surveyed households were destroyed by flooding increasing the difficult to deal with
food shortages caused by the flood.
Livestock is the second most affected sector in terms of flood damage in 2007 as three out four
of those that keep cattle and nearly half of the households involved in poultry reported severe
damage. The flood water exceeded the height of goats and therefore many goats were drowned
when crossing the Baro River and flash floods to access grazing land. In addition, the flood
killed many livestock through indirect effects as well such as lack of grazing land and flood
related diseases. Many cattle swallowed snail while they were drinking flood water which
usually carried large number of snails. Those snails were severely affecting the internal organ of
the cattle which in many cases resulted in death. In the flood season, the cattle were affected by
at least six flood related diseases which include pain on the legs of the cattle, tiredness and death
as a result of lack of grazing land due to floods and anthrax. For instance, Anthrax can kill all
cattle of individuals. Many fowls also died due to lack of dry place.
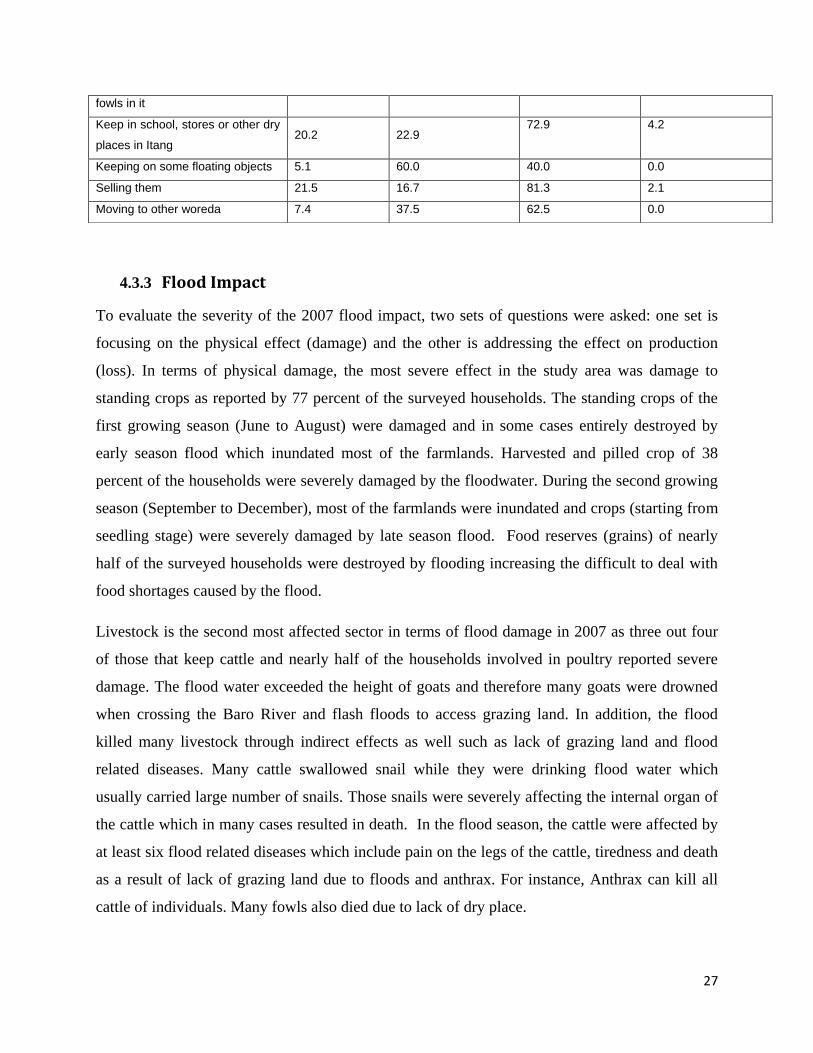
fowls in it
Keep in school, stores or other dry
places in Itang 20.2 22.9
72.9 4.2
Keeping on some floating objects 5.1 60.0 40.0 0.0
Selling them 21.5 16.7 81.3 2.1
Moving to other woreda 7.4 37.5 62.5 0.0
28
The construction materials of the houses in Itang are not water proof and strong enough to
withstand the flood wave. As a result 38 percent of the surveyed houses were severely damaged
by the 2007 flood. The foundation of several houses settles down by few centimeters every year
since the foundation has been undermined by flood water which eventually led to collapsing of
the houses during the extreme flood.
Household properties were severely damaged in one quarter of the surveyed houses. This
probably has affected the coping and recovery process due to additional expense to replace
damaged properties. Three out of the four surveyed business centers were severely damaged by
the 2007 flood. Those business centers are situated relatively close to the Baro River and
therefore are highly exposed to flood inundation.
Deterioration of health situation due to flood related diseases is common in Itang. FGD
participants mentioned that many elderly people die during flood season as a result of flood
related disease though this should be substantiated with proper scientific method in the future.
There are many cases of Malaria, Diarrhea, fever and other flood related diseases. The health
extension workers teach the community to raise their awareness about the use of mosquito nets.
Though people started using mosquito nets, many people are bitten by mosquito before bed time;
i.e. before they get the chance to get into their mosquito net. In 2007, several children were
affected by “Diarrhea” which even caused large number of deaths according to FGD participants.
The flood left no playing ground for children who were forced to play in a forest which resulted
in death of four children due to drowning in flood water.
The FGD participants feel that they were forced to work only eight months a year while they
could not get involved in income generation such as fishing, firewood collection, and charcoal
production during flood periods which cover one-third of a year. Most households experienced a
severe decrease in crop, dairy and poultry productivity due to the 2007 flood. Eighty five percent
of the respondents stated that they faced severe loss of crop productivity. Such loss of
productivity is due to increased pest, water logging and lack of supplementary rainfall during
recession farming as a result of delayed sowing.
In Itang, the farming activities are undertaken twice a year with the first one based on rain-fed
crop cultivation and the second one based on recession crop cultivation. The sowing season for
29
the rain-fed cultivation is in May which is the start of the rainy season. The effect of floods in
this season is manifested by physical damage on standing crops prior to the actual harvest time.
Normal flooding results in increased productivity of recession crop cultivation as the idea behind
such farming practice is to best utilize the soil moisture for the purpose of crop production.
However, FGD participants stated that extreme flooding can have a negative effect on
productivity of recession cultivation by (i) increasing pests that affect production, (ii) water
logging due to excess water and (iii) damaging crops at seedling or maturity stage. Though
productivity of recession crop cultivation relies much on availability of soil moisture, it still
requires some rainfall to supplement declining soil moisture content over the course of the crop
growing season. The study area receives some amount of rainfall in October and November
which are not part of the main rainy season. However, the amount and the timing of rainfall in
these months are not always adequate to sustain recession farming. Normally, sowing takes place
in between mid-September and beginning of October but it will be delayed when the flood water
stays beyond October due to excessive river over topping or unexpected flash floods. This will
extend the growing season further into the driest months which later results in lack of
supplementary rainfall during crop maturing period leading to decline in productivity.
In 2007, most grazing lands were inundated by flood water and as such livestock became weak
as a result of lack of fodder which led to increased incidence of flood related livestock disease.
As a result, there was severe loss of dairy and poultry productivity according to sixty and forty
percent of the respondents, respectively. According the FGD participants, the amount of milk
production in non-flood season is three to four litres per day per cow (one and half to two litres
in the morning and evening respectively). However, this amount substantially reduced to one to
two litres per day per cow during the flood season. The number of newly borne calves was also
significantly reduced during the flood period. Many calves were born early since cows were
seriously affected by diseases. The main problem with poultry production in the 2007 flood
season was that the chickens lay eggs in wet areas. As a result, eggs were damaged as well as
eggs were not accessible for collectors. As a result, the income from eggs was much smaller in
the wet season than in the dry season.
Business persons reported severe decline in income as flooding affected people mobility and
some business centers were inaccessible. About 85 percent of the respondents reported a
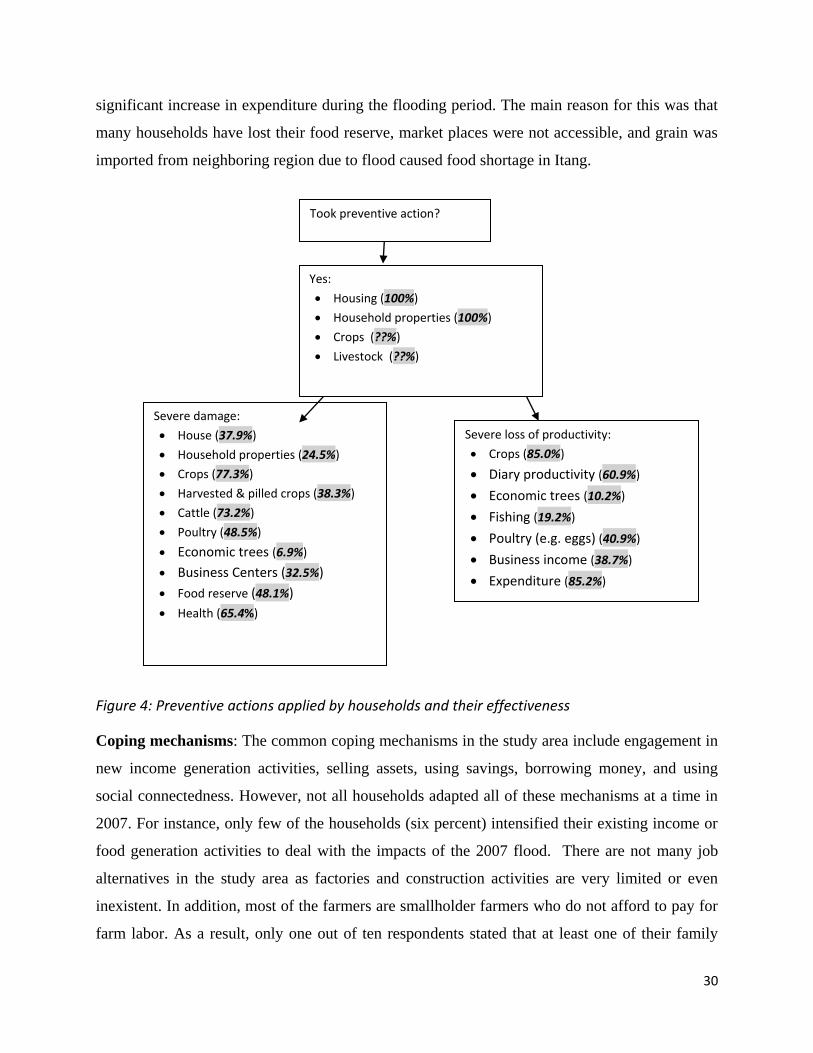
30
significant increase in expenditure during the flooding period. The main reason for this was that
many households have lost their food reserve, market places were not accessible, and grain was
imported from neighboring region due to flood caused food shortage in Itang.
Figure 4: Preventive actions applied by households and their effectiveness
Coping mechanisms: The common coping mechanisms in the study area include engagement in
new income generation activities, selling assets, using savings, borrowing money, and using
social connectedness. However, not all households adapted all of these mechanisms at a time in
2007. For instance, only few of the households (six percent) intensified their existing income or
food generation activities to deal with the impacts of the 2007 flood. There are not many job
alternatives in the study area as factories and construction activities are very limited or even
inexistent. In addition, most of the farmers are smallholder farmers who do not afford to pay for
farm labor. As a result, only one out of ten respondents stated that at least one of their family
Severe damage:
House (37.9%)
Household properties (24.5%)
Crops (77.3%)
Harvested & pilled crops (38.3%)
Cattle (73.2%)
Poultry (48.5%)
Economic trees (6.9%)
Business Centers (32.5%)
Food reserve (48.1%)
Health (65.4%)
Took preventive action?
Yes:
Housing (100%)
Household properties (100%)
Crops (??%)
Livestock (??%)
Severe loss of productivity:
Crops (85.0%)
Diary productivity (60.9%)
Economic trees (10.2%)
Fishing (19.2%)
Poultry (e.g. eggs) (40.9%)
Business income (38.7%)
Expenditure (85.2%)
Increased expenditures
31
members became engaged in new activities to deal with the 2007 flood. The most common new
activities were selling grasses and local alcoholic drinks which were adapted by one out of three
and three out of ten respondents who became involved in new activities, respectively.
Selling assets has the potential to help households to absorb shocks due to climate extremes. In
the study area, the economic condition is not well developed and as such people do not have
many assets to sell. Still 42 percent of the households sold their assets to immediately deal with
the flood impact. The most commonly sold assets were cattle and fowls (by 94 percent of
respondents who sold their properties). Such coping strategies are expected to erode the asset
base of households which may lead to increased vulnerability to impacts of future floods.
Migration was adapted as a coping strategy by more than half of the surveyed households. One
or more family members of the surveyed households migrated for one to two months either to
seek shelter or bring additional food or income to their families during the 2007 flood. Most (85
percent) migrated to other Kebeles of Itang Woreda while the remaining 15 percent moved to
other Woredas of the Gambella region. None migrated outside the Gambella region.
Analysis of the survey data showed that saving was one of the adapted coping strategies in the
study area. Large number of respondents (about six out of ten) mentioned that their family did
not have any saving in 2007 which clearly increased the sensitivity of the households to impacts
of any shock such as extreme flooding. Nearly six out of ten of the respondents who saved
money spent all of their saving to cope with impacts of the flood. This, however, has the
potential to erode coping capacity and increase vulnerability to future flood events.
To deal with the flood impact, 98 percent of the surveyed households utilized their social
network such as relatives, neighbors and friends. This is through receiving financial, material
and food assistance as well as borrowing money and receiving temporary shelter. The most
common are borrowing money or receiving food assistance which each of those were adopted by
three to four out of ten flood affected households. Most relatives offered some grains, clothes,
and shelter to the flood affected while some also gave one of their cows to an affected household
so that the household uses the milk product to deal with food and money shortages. During FGD,
many participants pointed out the importance of financial assistance for the flood affected
people. However, only 17 percent of the affected household received financial assistance from
32
relatives while such assistance from the government and NGOs was very negligible. Several
households used the money they received to buy raw materials for making local alcoholic drinks
for sale. The income from selling local drink helped households to earn additional money for
coping with the adverse impacts of the flood.
Neighbors also played a role in helping flood affected households for instance by slaughtering
one of their cattle to provide food for flood affected households. The meat was dried for
preservation so that it served as a food reserve to be used over the extended flood season. The
other way in which neighbors were found useful in dealing with the flood impact was in terms of
sharing the expensive cost of grains. The 2007 flood caused severe shortage of grains in Itang
which escalated food prices. As such, many households did not afford to buy grains particularly
maize by themselves which is a staple food in Itang. Therefore they came up with a strategy in
which three to four households contributed money to buy a quintal of maize which they shared.
Relying on social networks to deal with floods can be considered erosive coping strategy as
flood affected households cannot always rely on relatives, neighbors or friends. Therefore, those
households that used their social network to deal with the 2007 flooding probably became more
vulnerable to the next flood event. About 73 percent of the respondents stated that the most
significant impact of the 2007 flooding is expressed in terms of economical crisis. A significant
number of the households (23%) stated that the most negative impact of the 2007 flooding on
their households is health problem. The most immediate health impact of flooding is drowning.
According to McCann et al. (2011), it is flash floods that account for the majority of drowning
deaths often because flood affected people underestimate the power of the current and the depth
of the water. The same authors stated that when diarrheal illness do occur, they tend to be due to
pathogens that already existed in the local environment pre-flood event. This was confirmed by
the FGD participants.
Slightly more than half of the respondents stated that their family reduced expenses to deal with
the 2007 flooding. For instance, food expense was substantially reduced and less expensive
foods were bought by 95 percent and 36 percent of the surveyed households. Any substantial
reduction in quantity and quality of household‟s food consumption may have negative
consequences by increasing the vulnerability of people in the study area to flood related diseases
such as Malaria and diarrhea.
33
External assistance to flood affected people can increase effectiveness of coping strategies. In the
study area government agencies, NGOs and religious organizations are playing a significant role
in relief activities. Forty percent of the surveyed households received support from the
government mostly in the form of temporary shelter. NGOs (e.g. UNICEF, ZOA, WFP) played a
crucial role in assisting three out of four of the surveyed households. The most significant
intervention of NGOs was in terms of food and material assistance which were provided for 84
and 70 percent of the surveyed households, respectively. The food assistance was often in terms
of 50 kg of grain per household irrespective of household size or 15 kg of grain per month. Two
bed sheets were supplied to a single household which was not sufficient since many households
have more than 6 members. The temporary shelters were too crowded with up to 50 people
living in a single room.
The discussions in the aforementioned paragraphs suggest that there is a need to build the coping
capacities of households in the study area. Though relief is very important in providing
immediate solution when flood strikes and if it is done based on thorough need assessment and
exact requirement, there is a need to provide other supports that enhance coping capacities. Such
support could be for instance, providing sanitary facilities, safe drinking water, adult education,
agricultural inputs, irrigation, and construction of flood resistance houses. If relief is made
available early enough and is based on victim‟s priorities, this may help households to save at
least some of their asset base and avoid selling assets or reaching the final stage of destitution
(Corbett, 1988). A major observation in the study area is that financial assistance from
Government agencies, NGOs and religious organizations is almost inexistent. Lack of financial
assistance definitely hinders success of coping and recovery process. Households usually use the
financial assistance from their social network for the purpose of starting petty business which
facilitated coping and recovery. In some cases they sold the grains they receive from their social
network in order to get some money to involve in petty business.
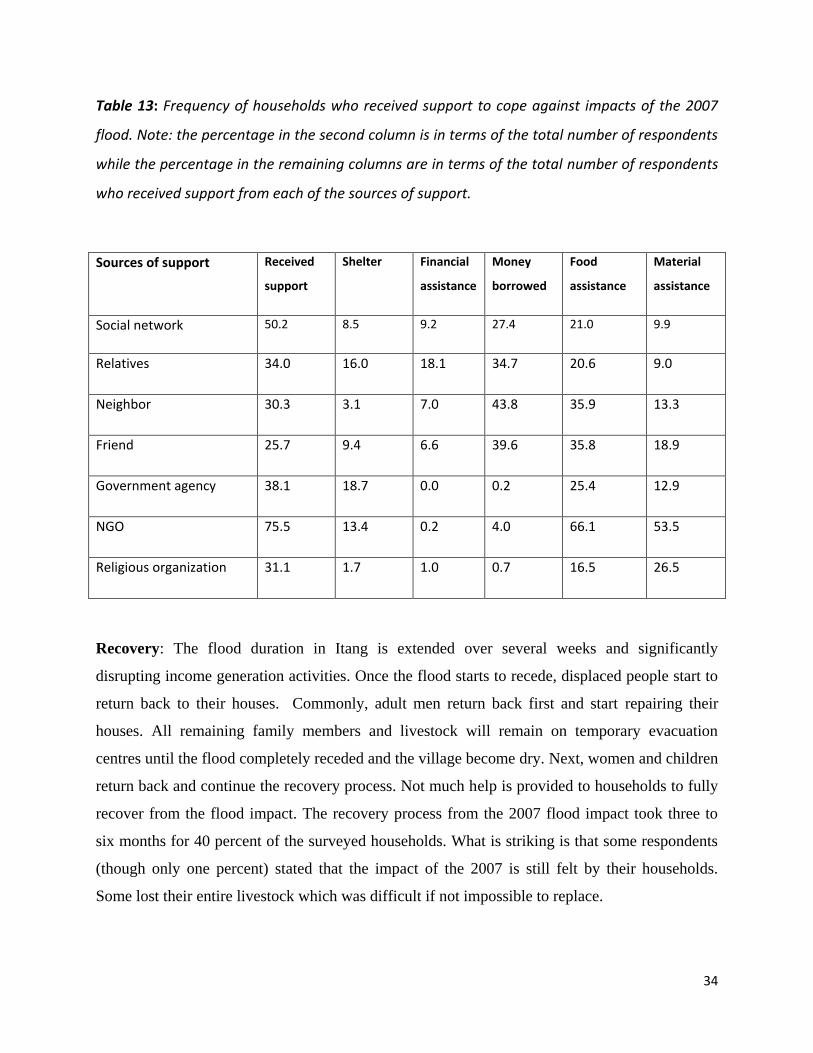
34
Table 13: Frequency of households who received support to cope against impacts of the 2007
flood. Note: the percentage in the second column is in terms of the total number of respondents
while the percentage in the remaining columns are in terms of the total number of respondents
who received support from each of the sources of support.
Sources of support Received
support
Shelter Financial
assistance
Money
borrowed
Food
assistance
Material
assistance
Social network 50.2 8.5 9.2 27.4 21.0 9.9
Relatives 34.0 16.0 18.1 34.7 20.6 9.0
Neighbor 30.3 3.1 7.0 43.8 35.9 13.3
Friend 25.7 9.4 6.6 39.6 35.8 18.9
Government agency 38.1 18.7 0.0 0.2 25.4 12.9
NGO 75.5 13.4 0.2 4.0 66.1 53.5
Religious organization 31.1 1.7 1.0 0.7 16.5 26.5
Recovery: The flood duration in Itang is extended over several weeks and significantly
disrupting income generation activities. Once the flood starts to recede, displaced people start to
return back to their houses. Commonly, adult men return back first and start repairing their
houses. All remaining family members and livestock will remain on temporary evacuation
centres until the flood completely receded and the village become dry. Next, women and children
return back and continue the recovery process. Not much help is provided to households to fully
recover from the flood impact. The recovery process from the 2007 flood impact took three to
six months for 40 percent of the surveyed households. What is striking is that some respondents
(though only one percent) stated that the impact of the 2007 is still felt by their households.
Some lost their entire livestock which was difficult if not impossible to replace.
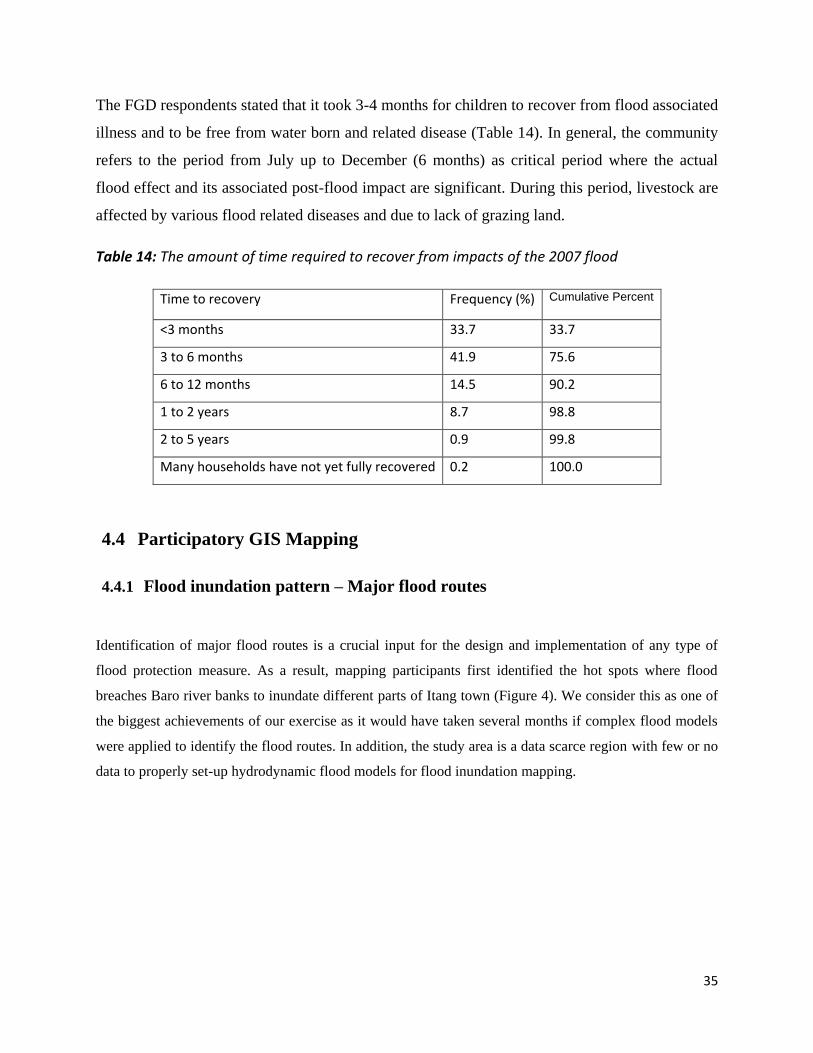
35
The FGD respondents stated that it took 3-4 months for children to recover from flood associated
illness and to be free from water born and related disease (Table 14). In general, the community
refers to the period from July up to December (6 months) as critical period where the actual
flood effect and its associated post-flood impact are significant. During this period, livestock are
affected by various flood related diseases and due to lack of grazing land.
Table 14: The amount of time required to recover from impacts of the 2007 flood
Time to recovery Frequency (%) Cumulative Percent
<3 months 33.7 33.7
3 to 6 months 41.9 75.6
6 to 12 months 14.5 90.2
1 to 2 years 8.7 98.8
2 to 5 years 0.9 99.8
Many households have not yet fully recovered 0.2 100.0
4.4 Participatory GIS Mapping
4.4.1 Flood inundation pattern – Major flood routes
Identification of major flood routes is a crucial input for the design and implementation of any type of
flood protection measure. As a result, mapping participants first identified the hot spots where flood
breaches Baro river banks to inundate different parts of Itang town (Figure 4). We consider this as one of
the biggest achievements of our exercise as it would have taken several months if complex flood models
were applied to identify the flood routes. In addition, the study area is a data scarce region with few or no
data to properly set-up hydrodynamic flood models for flood inundation mapping.
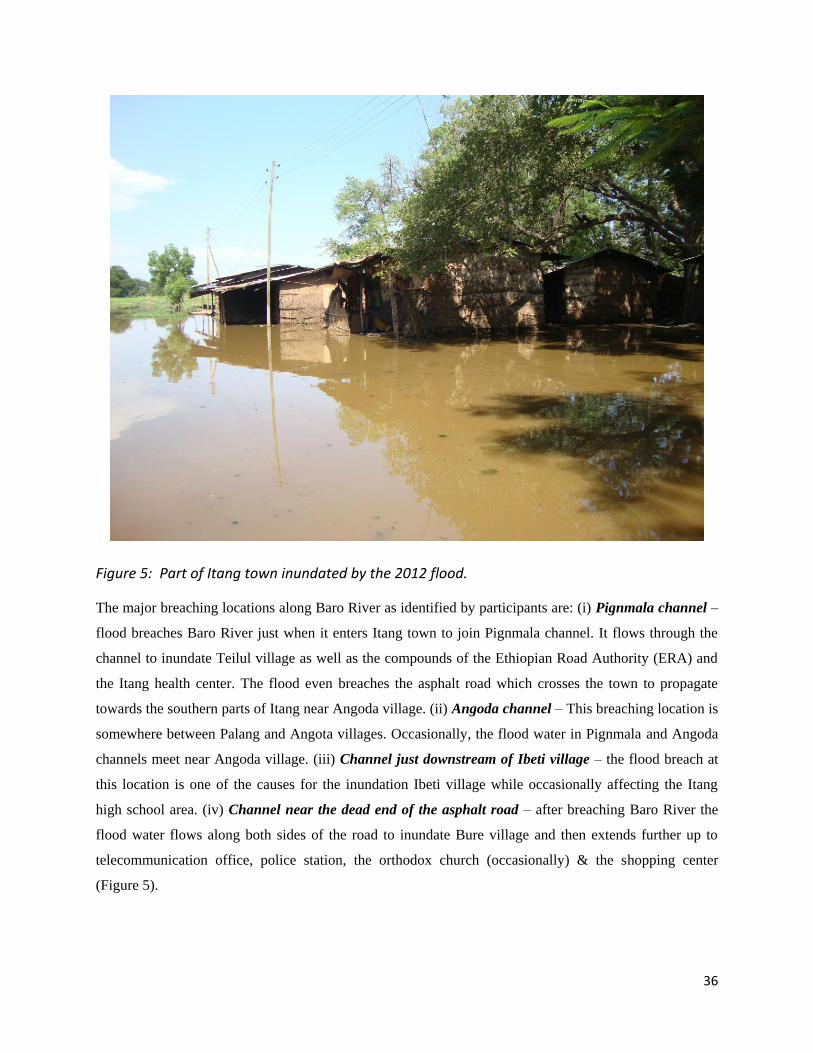
36
Figure 5: Part of Itang town inundated by the 2012 flood.
The major breaching locations along Baro River as identified by participants are: (i) Pignmala channel –
flood breaches Baro River just when it enters Itang town to join Pignmala channel. It flows through the
channel to inundate Teilul village as well as the compounds of the Ethiopian Road Authority (ERA) and
the Itang health center. The flood even breaches the asphalt road which crosses the town to propagate
towards the southern parts of Itang near Angoda village. (ii) Angoda channel – This breaching location is
somewhere between Palang and Angota villages. Occasionally, the flood water in Pignmala and Angoda
channels meet near Angoda village. (iii) Channel just downstream of Ibeti village – the flood breach at
this location is one of the causes for the inundation Ibeti village while occasionally affecting the Itang
high school area. (iv) Channel near the dead end of the asphalt road – after breaching Baro River the
flood water flows along both sides of the road to inundate Bure village and then extends further up to
telecommunication office, police station, the orthodox church (occasionally) & the shopping center
(Figure 5).
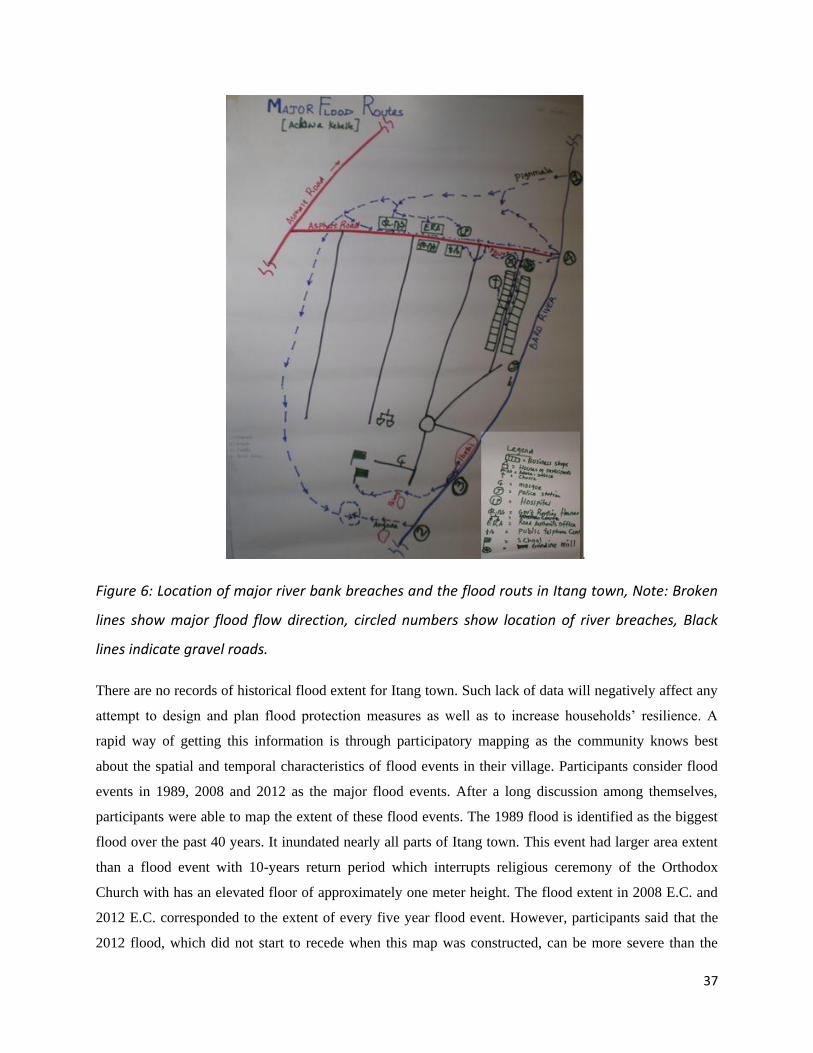
37
Figure 6: Location of major river bank breaches and the flood routs in Itang town, Note: Broken
lines show major flood flow direction, circled numbers show location of river breaches, Black
lines indicate gravel roads.
There are no records of historical flood extent for Itang town. Such lack of data will negatively affect any
attempt to design and plan flood protection measures as well as to increase households‟ resilience. A
rapid way of getting this information is through participatory mapping as the community knows best
about the spatial and temporal characteristics of flood events in their village. Participants consider flood
events in 1989, 2008 and 2012 as the major flood events. After a long discussion among themselves,
participants were able to map the extent of these flood events. The 1989 flood is identified as the biggest
flood over the past 40 years. It inundated nearly all parts of Itang town. This event had larger area extent
than a flood event with 10-years return period which interrupts religious ceremony of the Orthodox
Church with has an elevated floor of approximately one meter height. The flood extent in 2008 E.C. and
2012 E.C. corresponded to the extent of every five year flood event. However, participants said that the
2012 flood, which did not start to recede when this map was constructed, can be more severe than the
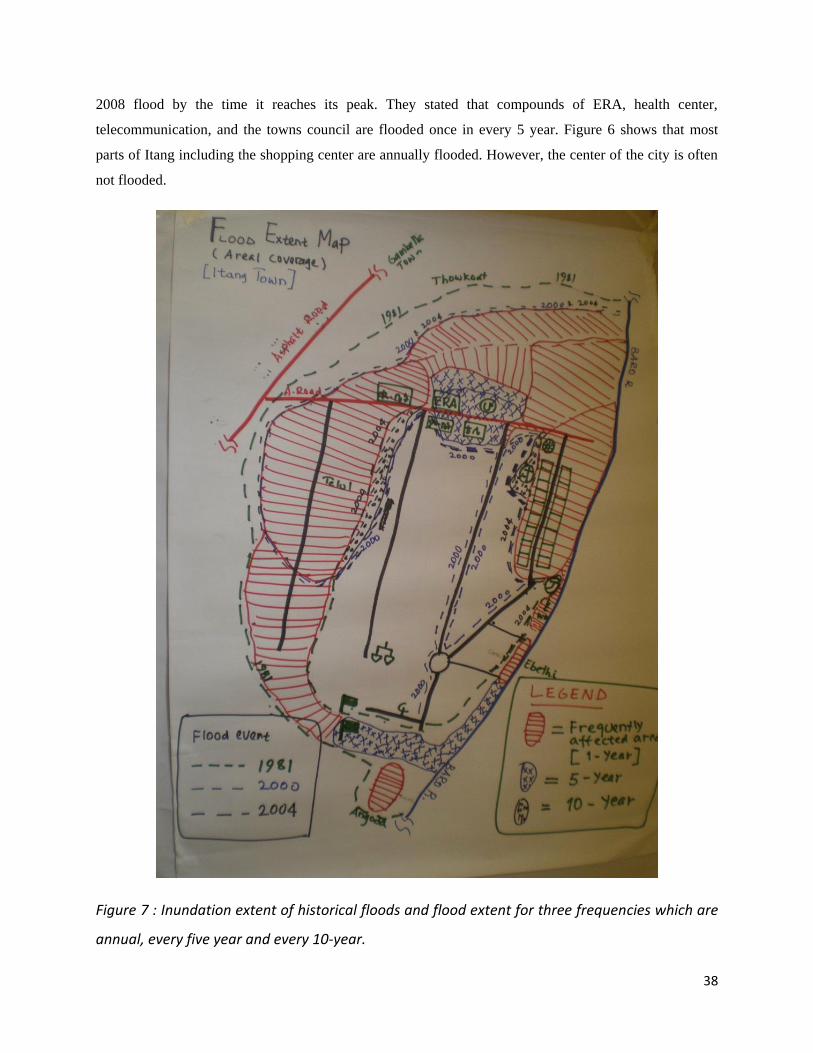
38
2008 flood by the time it reaches its peak. They stated that compounds of ERA, health center,
telecommunication, and the towns council are flooded once in every 5 year. Figure 6 shows that most
parts of Itang including the shopping center are annually flooded. However, the center of the city is often
not flooded.
Figure 7 : Inundation extent of historical floods and flood extent for three frequencies which are
annual, every five year and every 10-year.
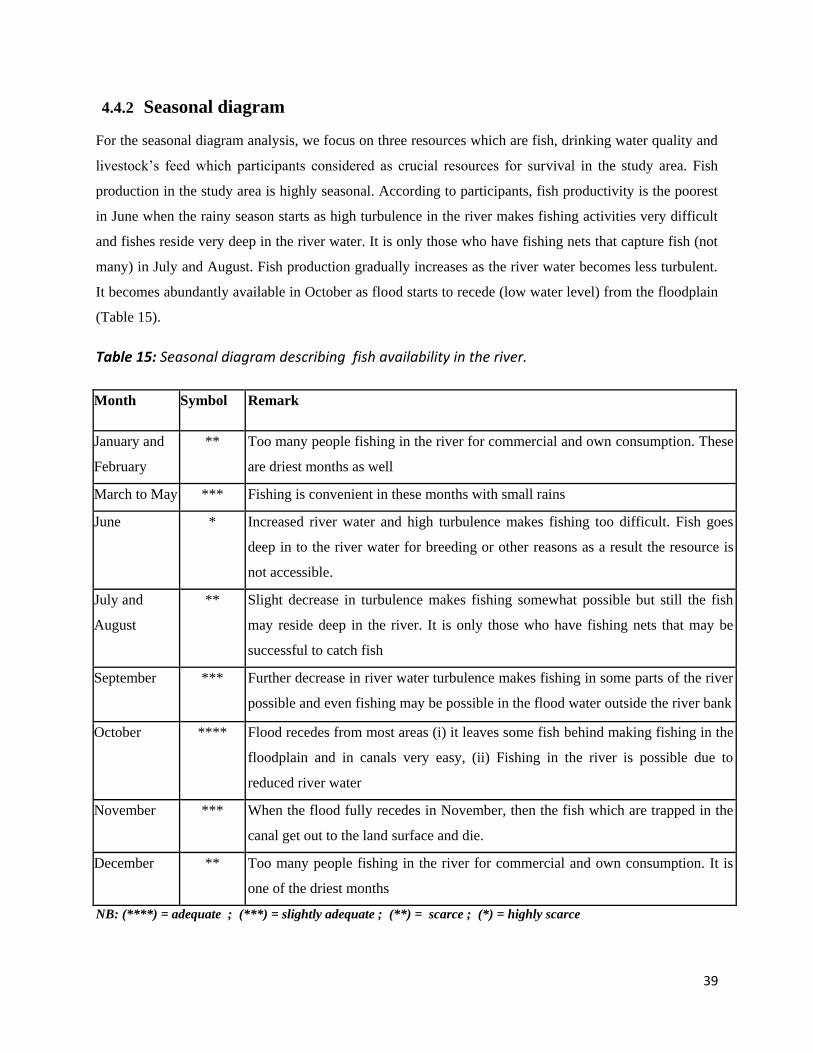
39
4.4.2 Seasonal diagram
For the seasonal diagram analysis, we focus on three resources which are fish, drinking water quality and
livestock‟s feed which participants considered as crucial resources for survival in the study area. Fish
production in the study area is highly seasonal. According to participants, fish productivity is the poorest
in June when the rainy season starts as high turbulence in the river makes fishing activities very difficult
and fishes reside very deep in the river water. It is only those who have fishing nets that capture fish (not
many) in July and August. Fish production gradually increases as the river water becomes less turbulent.
It becomes abundantly available in October as flood starts to recede (low water level) from the floodplain
(Table 15).
Table 15: Seasonal diagram describing fish availability in the river.
Month Symbol Remark
January and
February
** Too many people fishing in the river for commercial and own consumption. These
are driest months as well
March to May *** Fishing is convenient in these months with small rains
June * Increased river water and high turbulence makes fishing too difficult. Fish goes
deep in to the river water for breeding or other reasons as a result the resource is
not accessible.
July and
August
** Slight decrease in turbulence makes fishing somewhat possible but still the fish
may reside deep in the river. It is only those who have fishing nets that may be
successful to catch fish
September *** Further decrease in river water turbulence makes fishing in some parts of the river
possible and even fishing may be possible in the flood water outside the river bank
October **** Flood recedes from most areas (i) it leaves some fish behind making fishing in the
floodplain and in canals very easy, (ii) Fishing in the river is possible due to
reduced river water
November *** When the flood fully recedes in November, then the fish which are trapped in the
canal get out to the land surface and die.
December ** Too many people fishing in the river for commercial and own consumption. It is
one of the driest months
NB: (****) = adequate ; (***) = slightly adequate ; (**) = scarce ; (*) = highly scarce
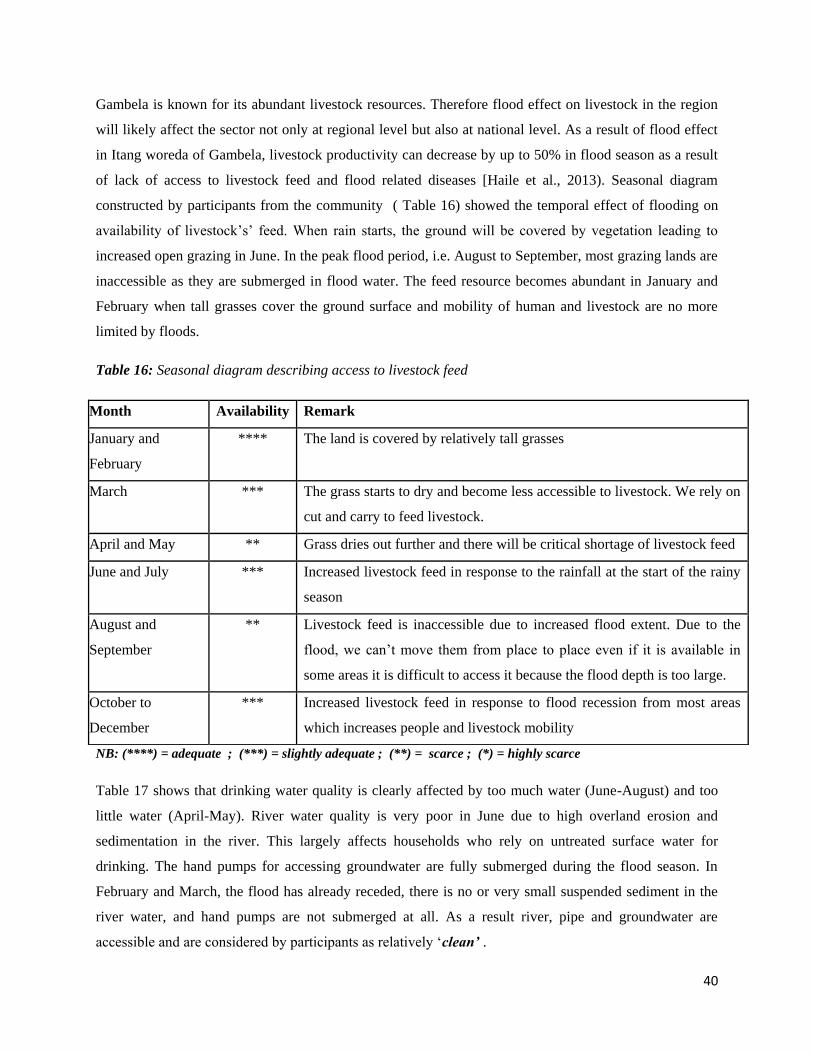
40
Gambela is known for its abundant livestock resources. Therefore flood effect on livestock in the region
will likely affect the sector not only at regional level but also at national level. As a result of flood effect
in Itang woreda of Gambela, livestock productivity can decrease by up to 50% in flood season as a result
of lack of access to livestock feed and flood related diseases [Haile et al., 2013). Seasonal diagram
constructed by participants from the community ( Table 16) showed the temporal effect of flooding on
availability of livestock‟s‟ feed. When rain starts, the ground will be covered by vegetation leading to
increased open grazing in June. In the peak flood period, i.e. August to September, most grazing lands are
inaccessible as they are submerged in flood water. The feed resource becomes abundant in January and
February when tall grasses cover the ground surface and mobility of human and livestock are no more
limited by floods.
Table 16: Seasonal diagram describing access to livestock feed
NB: (****) = adequate ; (***) = slightly adequate ; (**) = scarce ; (*) = highly scarce
Table 17 shows that drinking water quality is clearly affected by too much water (June-August) and too
little water (April-May). River water quality is very poor in June due to high overland erosion and
sedimentation in the river. This largely affects households who rely on untreated surface water for
drinking. The hand pumps for accessing groundwater are fully submerged during the flood season. In
February and March, the flood has already receded, there is no or very small suspended sediment in the
river water, and hand pumps are not submerged at all. As a result river, pipe and groundwater are
accessible and are considered by participants as relatively „clean’ .
Month Availability Remark
January and
February
**** The land is covered by relatively tall grasses
March *** The grass starts to dry and become less accessible to livestock. We rely on
cut and carry to feed livestock.
April and May ** Grass dries out further and there will be critical shortage of livestock feed
June and July *** Increased livestock feed in response to the rainfall at the start of the rainy
season
August and
September
** Livestock feed is inaccessible due to increased flood extent. Due to the
flood, we can‟t move them from place to place even if it is available in
some areas it is difficult to access it because the flood depth is too large.
October to
December
*** Increased livestock feed in response to flood recession from most areas
which increases people and livestock mobility
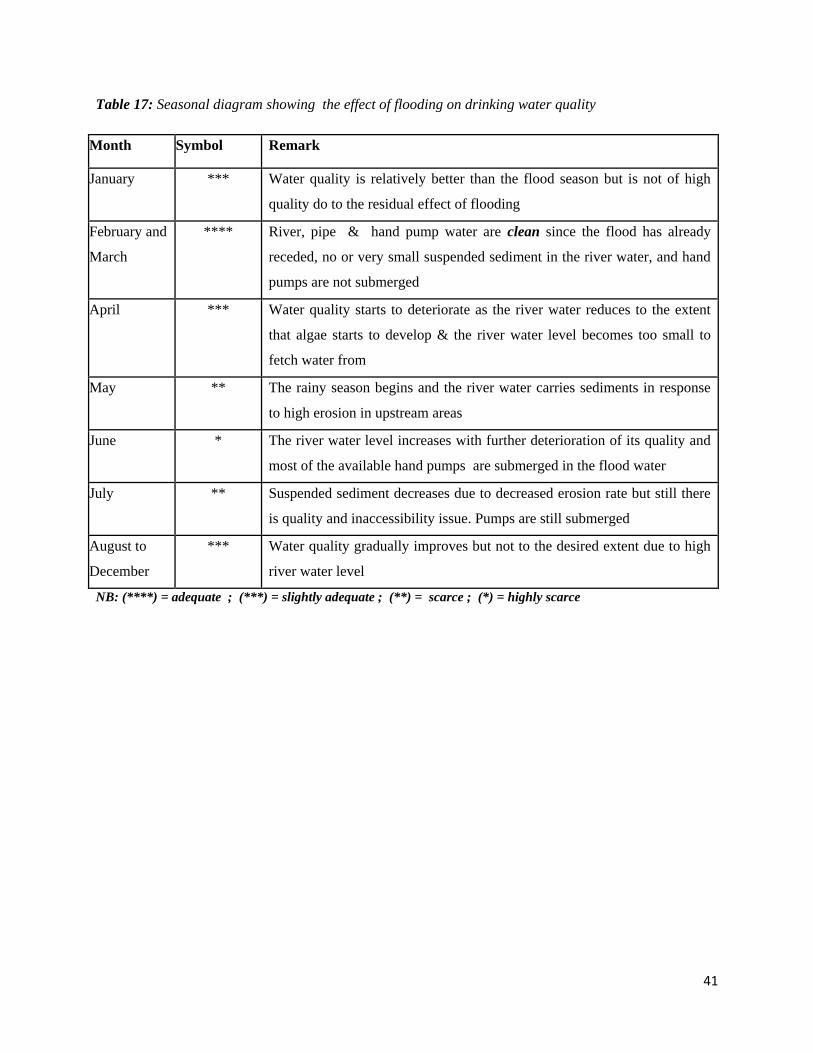
41
Table 17: Seasonal diagram showing the effect of flooding on drinking water quality
Month Symbol Remark
January *** Water quality is relatively better than the flood season but is not of high
quality do to the residual effect of flooding
February and
March
**** River, pipe & hand pump water are clean since the flood has already
receded, no or very small suspended sediment in the river water, and hand
pumps are not submerged
April *** Water quality starts to deteriorate as the river water reduces to the extent
that algae starts to develop & the river water level becomes too small to
fetch water from
May ** The rainy season begins and the river water carries sediments in response
to high erosion in upstream areas
June * The river water level increases with further deterioration of its quality and
most of the available hand pumps are submerged in the flood water
July ** Suspended sediment decreases due to decreased erosion rate but still there
is quality and inaccessibility issue. Pumps are still submerged
August to
December
*** Water quality gradually improves but not to the desired extent due to high
river water level
NB: (****) = adequate ; (***) = slightly adequate ; (**) = scarce ; (*) = highly scarce
42
5. CONCLUSIONS
The Itang woreda of Gambella region has frequently been affected by extreme flood events over
the last couple of decades. The impact of such extreme flood events in the region is manifested
by the loss of life and property observed during extreme flood events. Besides, altered land
use/land cover condition to meet the increasing demand of human and livestock population
aggravated soil erosion and flood volume entering into the main channel. Thus, the carrying
capacity of the channel is limited and significant amount of flood water is overflowing the banks
of the main natural water course and consequently inundating vast majority of the villages. Flush
floods originating from the upstream highland also imparts great deal of flood flow into the
natural channels and affects overwhelming majority of the rural Kebeles in study area. Flood
affected population of the study area use local coping strategies such as raising the foundation
level of the houses, shifting properties and livestock to relatively drier areas during flood season,
temporarily moving to the nearby schools and other government offices for protection, using
local boats to move from one place to the other, reserving food crops for flood season, etc.
However, the coping strategies are not well organized and sometimes could not able to solve the
damages and loss associated to the worst flood events.
In the present study, the existing local knowledge associated to flood events and its ensuing
damage and loss are investigated from the community perspectives. The adaptive mechanisms
that the local community has been using are assessed and their relative merit is discussed. Future
studies should include detail hydrological analysis related to flood forecasting under probable
worst scenario. This will help to identify appropriate coping strategies prior to the flood disaster.
Acknowledgements
This project was funded by the United Nations Economic Commission for Africa, African
Climate Policy Centre.
.