Embed Size (px)
Citation preview
ii
IMPACT OFFORT BLISS,HOLLOMANAFBANDWHITE SANDSMISSILE RANGEON JOBS,INCOMEANDINDUSTRYOUTPUT
INSUPPORTOFTHESOUTHERNNEWMEXICO‐ELPASOCOUNTY JOINTLANDUSESTUDY(JLUS)
1/30/2015
PREPAREDBYBORDERRESEARCH,ANEWMEXICO‐BASEDFIRM,UNDERCONTRACTTOAECOMTECHNICALSERVICES,INC.,ATLANTA,GA30309
ii
TABLEOFCONTENTS
1.0INTRODUCTION.. . . . . . . . . . . . . . . . . . . . . . . . . . . . . . . . . . . . . . . . . . . . . . . . . . . . . . . . . . . . . . . . . . . . . . . . . . . . . . . . . . . . . . . . . . . . . . . . . . . . . . . . . . . . . . . . . . . . . . . . . . . . . . 1
THEJLUSPARTNERSHIP. . . . . . . . . . . . . . . . . . . . . . . . . . . . . . . . . . . . . . . . . . . . . . . . . . . . . . . . . . . . . . . . . . . . . . . . . . . . . . . . . . . . . . . . . . . . . . . . . . . . . . . . . . 1
2.0REGIONALDESCRIPTION.. . . . . . . . . . . . . . . . . . . . . . . . . . . . . . . . . . . . . . . . . . . . . . . . . . . . . . . . . . . . . . . . . . . . . . . . . . . . . . . . . . . . . . . . . . . . . . . . . . . . . . . . . . . . . . 2
2.1 POPULATION.. . . . . . . . . . . . . . . . . . . . . . . . . . . . . . . . . . . . . . . . . . . . . . . . . . . . . . . . . . . . . . . . . . . . . . . . . . . . . . . . . . . . . . . . . . . . . . . . . . . . . . . . . . . . . . . . . . . . . . . . . . . . 6
2.2 HOUSEHOLDS. . . . . . . . . . . . . . . . . . . . . . . . . . . . . . . . . . . . . . . . . . . . . . . . . . . . . . . . . . . . . . . . . . . . . . . . . . . . . . . . . . . . . . . . . . . . . . . . . . . . . . . . . . . . . . . . . . . . . . . . . . . . 7
2.3 AGE. . . . . . . . . . . . . . . . . . . . . . . . . . . . . . . . . . . . . . . . . . . . . . . . . . . . . . . . . . . . . . . . . . . . . . . . . . . . . . . . . . . . . . . . . . . . . . . . . . . . . . . . . . . . . . . . . . . . . . . . . . . . . . . . . . . . . . . . . . 10
2.4 ETHNICITY. . . . . . . . . . . . . . . . . . . . . . . . . . . . . . . . . . . . . . . . . . . . . . . . . . . . . . . . . . . . . . . . . . . . . . . . . . . . . . . . . . . . . . . . . . . . . . . . . . . . . . . . . . . . . . . . . . . . . . . . . . . . . . 11
2.5 EDUCATIONALATTAINMENT.. . . . . . . . . . . . . . . . . . . . . . . . . . . . . . . . . . . . . . . . . . . . . . . . . . . . . . . . . . . . . . . . . . . . . . . . . . . . . . . . . . . . . . . . . . . . . 12
2.6 EMPLOYMENT.. . . . . . . . . . . . . . . . . . . . . . . . . . . . . . . . . . . . . . . . . . . . . . . . . . . . . . . . . . . . . . . . . . . . . . . . . . . . . . . . . . . . . . . . . . . . . . . . . . . . . . . . . . . . . . . . . . . . . . . 13
2.7 LABORFORCEANDUNEMPLOYMENT.. . . . . . . . . . . . . . . . . . . . . . . . . . . . . . . . . . . . . . . . . . . . . . . . . . . . . . . . . . . . . . . . . . . . . . . . . . . . . . . 15
2.8 EMPLOYMENTBYINDUSTRY.. . . . . . . . . . . . . . . . . . . . . . . . . . . . . . . . . . . . . . . . . . . . . . . . . . . . . . . . . . . . . . . . . . . . . . . . . . . . . . . . . . . . . . . . . . . . . 16
3.0ECONOMICPERFORMANCE.. . . . . . . . . . . . . . . . . . . . . . . . . . . . . . . . . . . . . . . . . . . . . . . . . . . . . . . . . . . . . . . . . . . . . . . . . . . . . . . . . . . . . . . . . . . . . . . . . . . . . . . . 19
3.1 PERCAPITAINCOME.......................................................................................................................................................19
3.2 REALWAGESANDSALARIES....................................................................................................................................20
3.3 POVERTYINDICATOR.....................................................................................................................................................21
3.4 OCCUPATIONALMIX........................................................................................................................................................22
3.5 EMPLOYMENTDIVERSITY...........................................................................................................................................24
4.0 METHODOLOGY............................................................................................................................................................................25
4.1 DATACOLLECTION...........................................................................................................................................................25
4.2 MILITARYINSTALLATIONS........................................................................................................................................26
FORTBLISS.............................................................................................................................................................................26
HOLLOMANAFB..................................................................................................................................................................27
WHITESANDSMISSILERANGE...............................................................................................................................28
4.3 DATAANALYSIS...................................................................................................................................................................31
4.4 IMPACTANALYSISANDMULTIPLIERS..............................................................................................................32
5.0 FINDINGS........................................................................................................................................................................................33
5.1 REGIONALESTIMATES...................................................................................................................................................33
5.2 COUNTYESTIMATES........................................................................................................................................................36
5.3 COMMUTINGPATTERNS...............................................................................................................................................39
5.4 IMPACTSOFSPACEPORTAMERICA.....................................................................................................................39
6.0 SUMMARY.......................................................................................................................................................................................40
1
IMPACTOFFORTBLISS,HOLLOMAN AFBANDWHITE SANDSMISSILE RANGEONJOBS,INCOME ANDINDUSTRYOUTPUT
INSUPPORTOFTHESOUTHERNNEWMEXICO‐ELPASOCOUNTYJOINTLANDUSESTUDY
1.0 INTRODUCTION
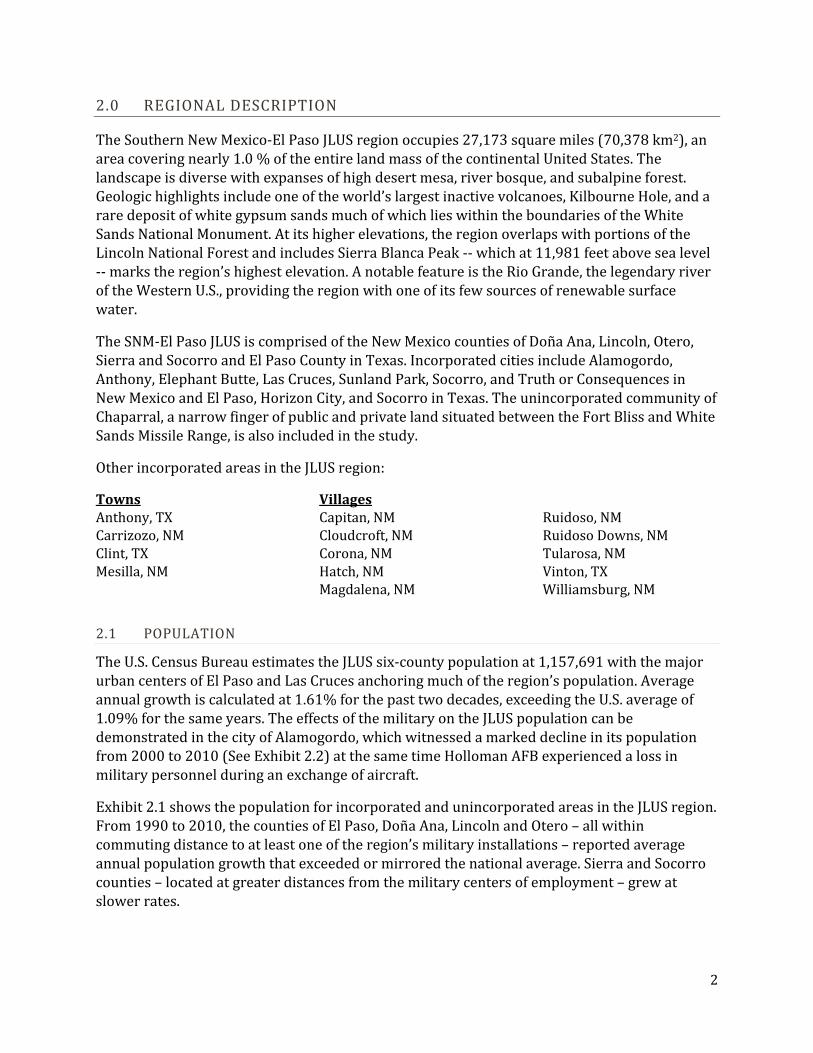
InAugust2012,theU.S.DepartmentofDefense’sOfficeofEconomicAdjustment(OEA)awardedagranttoapartnershipofsixcountiesandthreecitiesinNewMexicoandTexastoconductaJointLandUseStudy(JLUS)fortheregionencompassingFortBliss,HollomanAirForceBaseandWhiteSandsMissileRange(WSMR).Thestudyexaminestheuseofland,airspaceandotherresourcesforthepurposeofestablishingacommonvisionforregionalgrowthwhilesafeguardingtheassetsofthemilitaryinstallations.Duetothelargesizeoftheregion(27,173squaremiles)andthesignificanceoftheinstallationstothenation’sdefense,theSouthernNewMexico‐ElPaso(SNM‐ElPaso)studyranksamongthelargestandmostambitiousJLUSeffortsundertakenbyOEA.
ThisreportaddressestheeconomicimpacttaskoftheSNM‐ElPasostudy.Theobjectiveofthereportistodescribethesocioeconomicconditionsofthesix‐countyregion,characterizetheregion’seconomicperformance,andestimatetheimpactsofFortBliss,HollomanandWSMRonlocaljobs,incomesandindustryoutput.
THEJLUSPARTNERSHIP
TolaunchtheSNM‐ElPasoJLUS,aMemorandumofAgreementwasadoptedinSeptember2012bytheninegovernmentpartners:
CitiesAlamogordo,NMElPaso,TXLasCruces,NM
CountiesDoñaAna,NMElPaso,TXLincoln,NM
Otero,NMSierra,NMSocorro,NM
AccordingtotheAgreement,thepartnersconsenttocontributetothefinalcostofthestudyandpromoteimplementationofthestudy’sfinalrecommendations.Toguidetheeffort,theAgreementestablishesaRegionalPlanningOrganizationsupportedbyTechnicalandPolicycommitteesandassignscommitteemembershiptorepresentativesfromeachoftheregion’sthreemilitaryinstallations,theNewMexicoStateLandOffice,theBureauofLandManagementandseveralstateagenciesandcommissions.DoñaAnaCountyisappointedfiscalagentfortheOEAgrant.
2
2.0 REGIONALDESCRIPTION
TheSouthernNewMexico‐ElPasoJLUSregionoccupies27,173squaremiles(70,378km2),anareacoveringnearly1.0%oftheentirelandmassofthecontinentalUnitedStates.Thelandscapeisdiversewithexpansesofhighdesertmesa,riverbosque,andsubalpineforest.Geologichighlightsincludeoneoftheworld’slargestinactivevolcanoes,KilbourneHole,andararedepositofwhitegypsumsandsmuchofwhichlieswithintheboundariesoftheWhiteSandsNationalMonument.Atitshigherelevations,theregionoverlapswithportionsoftheLincolnNationalForestandincludesSierraBlancaPeak‐‐whichat11,981feetabovesealevel‐‐markstheregion’shighestelevation.AnotablefeatureistheRioGrande,thelegendaryriveroftheWesternU.S.,providingtheregionwithoneofitsfewsourcesofrenewablesurfacewater.
TheSNM‐ElPasoJLUSiscomprisedoftheNewMexicocountiesofDoñaAna,Lincoln,Otero,SierraandSocorroandElPasoCountyinTexas.IncorporatedcitiesincludeAlamogordo,Anthony,ElephantButte,LasCruces,SunlandPark,Socorro,andTruthorConsequencesinNewMexicoandElPaso,HorizonCity,andSocorroinTexas.TheunincorporatedcommunityofChaparral,anarrowfingerofpublicandprivatelandsituatedbetweentheFortBlissandWhiteSandsMissileRange,isalsoincludedinthestudy.
OtherincorporatedareasintheJLUSregion:
TownsAnthony,TXCarrizozo,NMClint,TXMesilla,NM
VillagesCapitan,NMCloudcroft,NMCorona,NMHatch,NMMagdalena,NM
Ruidoso,NMRuidosoDowns,NMTularosa,NMVinton,TXWilliamsburg,NM
2.1 POPULATION
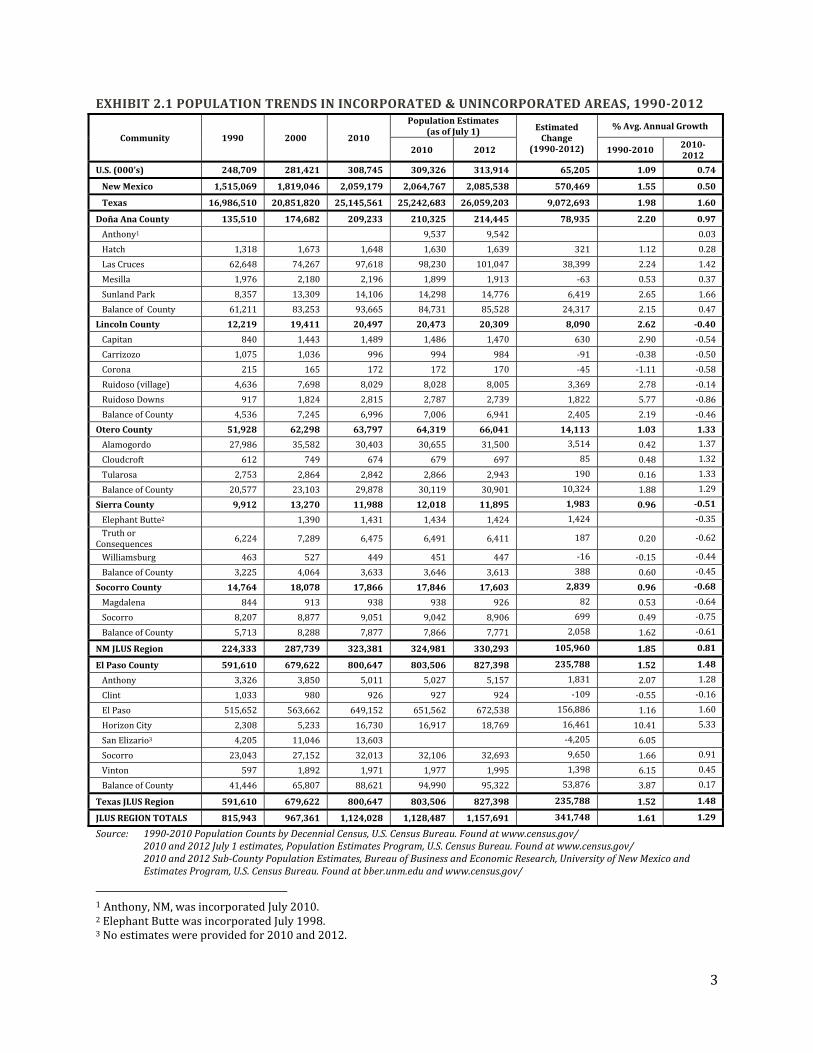
TheU.S.CensusBureauestimatestheJLUSsix‐countypopulationat1,157,691withthemajorurbancentersofElPasoandLasCrucesanchoringmuchoftheregion’spopulation.Averageannualgrowthiscalculatedat1.61%forthepasttwodecades,exceedingtheU.S.averageof1.09%forthesameyears.TheeffectsofthemilitaryontheJLUSpopulationcanbedemonstratedinthecityofAlamogordo,whichwitnessedamarkeddeclineinitspopulationfrom2000to2010(SeeExhibit2.2)atthesametimeHollomanAFBexperiencedalossinmilitarypersonnelduringanexchangeofaircraft.
Exhibit2.1showsthepopulationforincorporatedandunincorporatedareasintheJLUSregion.From1990to2010,thecountiesofElPaso,DoñaAna,LincolnandOtero–allwithincommutingdistancetoatleastoneoftheregion’smilitaryinstallations–reportedaverageannualpopulationgrowththatexceededormirroredthenationalaverage.SierraandSocorrocounties–locatedatgreaterdistancesfromthemilitarycentersofemployment–grewatslowerrates.
3
EXHIBIT2.1POPULATIONTRENDSININCORPORATED&UNINCORPORATEDAREAS,1990‐2012
Source: 1990‐2010PopulationCountsbyDecennialCensus,U.S.CensusBureau.Foundatwww.census.gov/2010and2012July1estimates,PopulationEstimatesProgram,U.S.CensusBureau.Foundatwww.census.gov/2010and2012Sub‐CountyPopulationEstimates,BureauofBusinessandEconomicResearch,UniversityofNewMexicoandEstimatesProgram,U.S.CensusBureau.Foundatbber.unm.eduandwww.census.gov/
1Anthony,NM,wasincorporatedJuly2010.2ElephantButtewasincorporatedJuly1998.3Noestimateswereprovidedfor2010and2012.
Community 1990 2000 2010
PopulationEstimates(asofJuly1) Estimated
Change(1990‐2012)
%Avg.AnnualGrowth
2010 2012 1990‐2010 2010‐2012
U.S.(000’s) 248,709 281,421 308,745 309,326 313,914 65,205 1.09 0.74
NewMexico 1,515,069 1,819,046 2,059,179 2,064,767 2,085,538 570,469 1.55 0.50
Texas 16,986,510 20,851,820 25,145,561 25,242,683 26,059,203 9,072,693 1.98 1.60
DoñaAnaCounty 135,510 174,682 209,233 210,325 214,445 78,935 2.20 0.97
Anthony1 9,537 9,542 0.03
Hatch 1,318 1,673 1,648 1,630 1,639 321 1.12 0.28
LasCruces 62,648 74,267 97,618 98,230 101,047 38,399 2.24 1.42
Mesilla 1,976 2,180 2,196 1,899 1,913 ‐63 0.53 0.37
SunlandPark 8,357 13,309 14,106 14,298 14,776 6,419 2.65 1.66
BalanceofCounty 61,211 83,253 93,665 84,731 85,528 24,317 2.15 0.47
LincolnCounty 12,219 19,411 20,497 20,473 20,309 8,090 2.62 ‐0.40
Capitan 840 1,443 1,489 1,486 1,470 630 2.90 ‐0.54
Carrizozo 1,075 1,036 996 994 984 ‐91 ‐0.38 ‐0.50
Corona 215 165 172 172 170 ‐45 ‐1.11 ‐0.58
Ruidoso(village) 4,636 7,698 8,029 8,028 8,005 3,369 2.78 ‐0.14
RuidosoDowns 917 1,824 2,815 2,787 2,739 1,822 5.77 ‐0.86
BalanceofCounty 4,536 7,245 6,996 7,006 6,941 2,405 2.19 ‐0.46
OteroCounty 51,928 62,298 63,797 64,319 66,041 14,113 1.03 1.33
Alamogordo 27,986 35,582 30,403 30,655 31,500 3,514 0.42 1.37
Cloudcroft 612 749 674 679 697 85 0.48 1.32
Tularosa 2,753 2,864 2,842 2,866 2,943 190 0.16 1.33
BalanceofCounty 20,577 23,103 29,878 30,119 30,901 10,324 1.88 1.29
SierraCounty 9,912 13,270 11,988 12,018 11,895 1,983 0.96 ‐0.51
ElephantButte2 1,390 1,431 1,434 1,424 1,424 ‐0.35
TruthorConsequences 6,224 7,289 6,475 6,491 6,411 187 0.20 ‐0.62
Williamsburg 463 527 449 451 447 ‐16 ‐0.15 ‐0.44
BalanceofCounty 3,225 4,064 3,633 3,646 3,613 388 0.60 ‐0.45
SocorroCounty 14,764 18,078 17,866 17,846 17,603 2,839 0.96 ‐0.68
Magdalena 844 913 938 938 926 82 0.53 ‐0.64
Socorro 8,207 8,877 9,051 9,042 8,906 699 0.49 ‐0.75
BalanceofCounty 5,713 8,288 7,877 7,866 7,771 2,058 1.62 ‐0.61
NMJLUSRegion 224,333 287,739 323,381 324,981 330,293 105,960 1.85 0.81
ElPasoCounty 591,610 679,622 800,647 803,506 827,398 235,788 1.52 1.48
Anthony 3,326 3,850 5,011 5,027 5,157 1,831 2.07 1.28
Clint 1,033 980 926 927 924 ‐109 ‐0.55 ‐0.16
ElPaso 515,652 563,662 649,152 651,562 672,538 156,886 1.16 1.60
HorizonCity 2,308 5,233 16,730 16,917 18,769 16,461 10.41 5.33
SanElizario3 4,205 11,046 13,603 ‐4,205 6.05
Socorro 23,043 27,152 32,013 32,106 32,693 9,650 1.66 0.91
Vinton 597 1,892 1,971 1,977 1,995 1,398 6.15 0.45
BalanceofCounty 41,446 65,807 88,621 94,990 95,322 53,876 3.87 0.17
TexasJLUSRegion 591,610 679,622 800,647 803,506 827,398 235,788 1.52 1.48
JLUSREGIONTOTALS 815,943 967,361 1,124,028 1,128,487 1,157,691 341,748 1.61 1.29
4
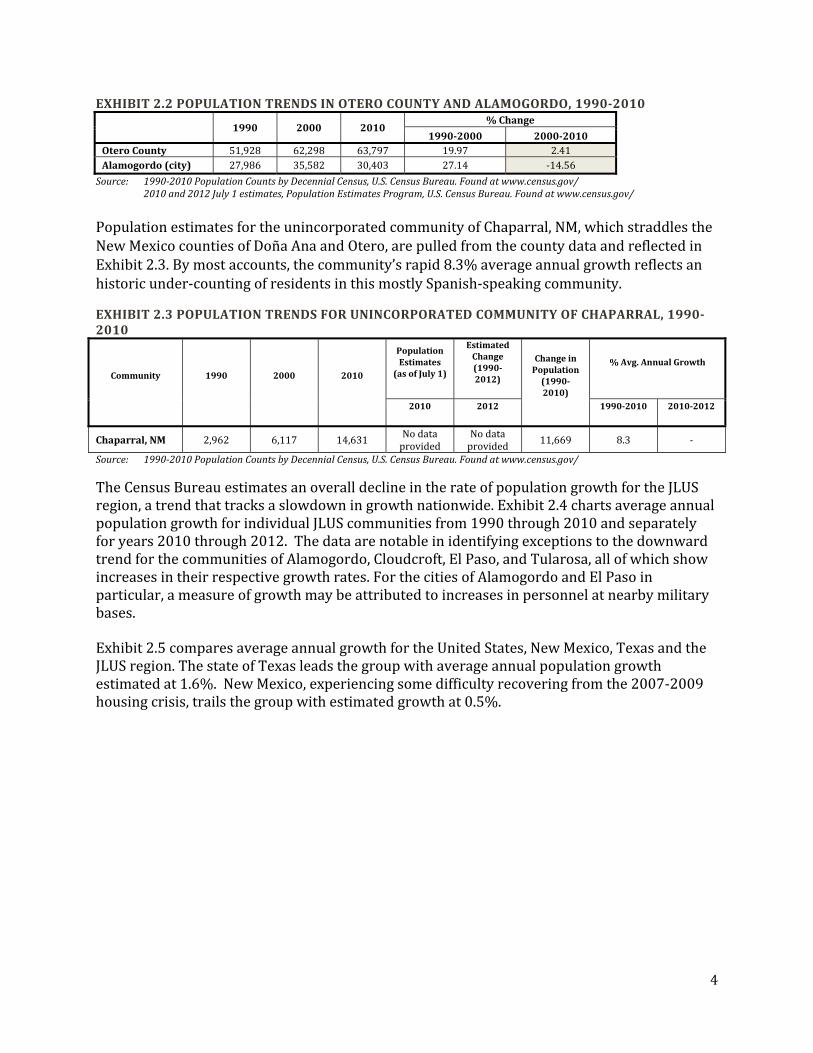
EXHIBIT2.2POPULATIONTRENDSINOTEROCOUNTYANDALAMOGORDO,1990‐2010
1990 2000 2010%Change
1990‐2000 2000‐2010OteroCounty 51,928 62,298 63,797 19.97 2.41Alamogordo(city) 27,986 35,582 30,403 27.14 ‐14.56
Source: 1990‐2010PopulationCountsbyDecennialCensus,U.S.CensusBureau.Foundatwww.census.gov/2010and2012July1estimates,PopulationEstimatesProgram,U.S.CensusBureau.Foundatwww.census.gov/
PopulationestimatesfortheunincorporatedcommunityofChaparral,NM,whichstraddlestheNewMexicocountiesofDoñaAnaandOtero,arepulledfromthecountydataandreflectedinExhibit2.3.Bymostaccounts,thecommunity’srapid8.3%averageannualgrowthreflectsanhistoricunder‐countingofresidentsinthismostlySpanish‐speakingcommunity.
EXHIBIT2.3POPULATIONTRENDSFORUNINCORPORATEDCOMMUNITYOFCHAPARRAL,1990‐2010
Community 1990 2000 2010
PopulationEstimates(asofJuly1)
EstimatedChange(1990‐2012)
ChangeinPopulation(1990‐2010)
%Avg.AnnualGrowth
2010 2012 1990‐2010 2010‐2012
Chaparral,NM 2,962 6,117 14,631Nodataprovided
Nodataprovided
11,669 8.3 ‐
Source: 1990‐2010PopulationCountsbyDecennialCensus,U.S.CensusBureau.Foundatwww.census.gov/
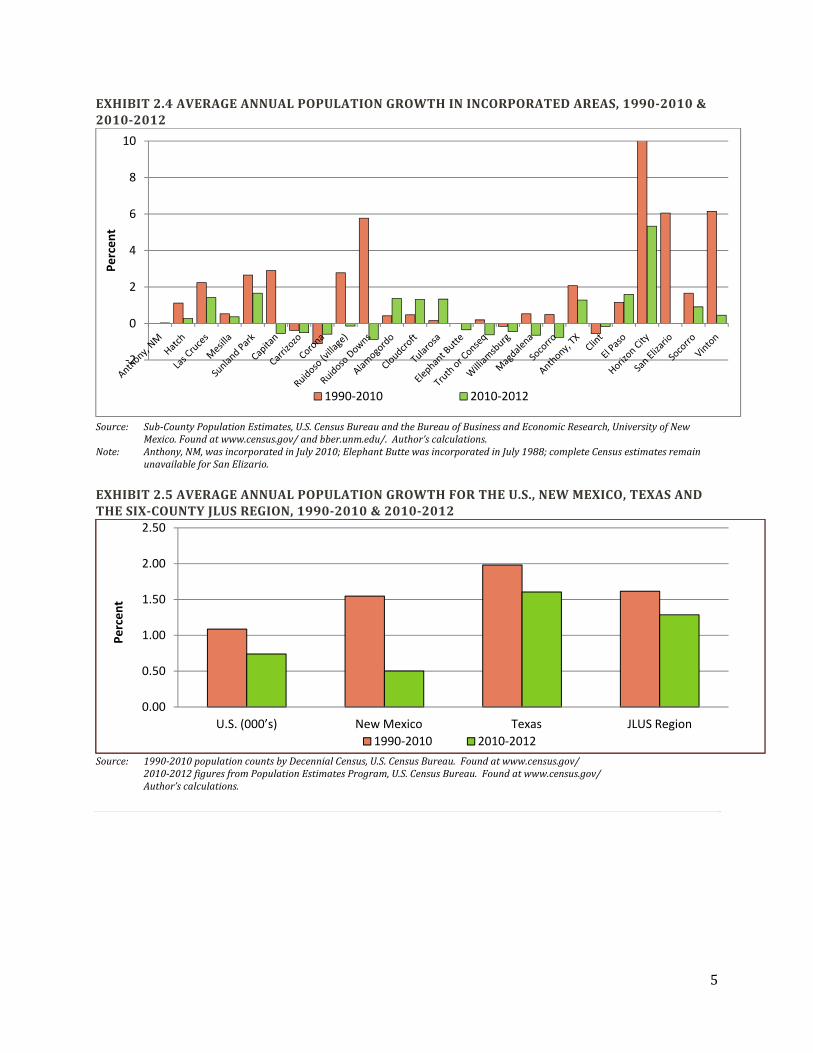
TheCensusBureauestimatesanoveralldeclineintherateofpopulationgrowthfortheJLUSregion,atrendthattracksaslowdowningrowthnationwide.Exhibit2.4chartsaverageannualpopulationgrowthforindividualJLUScommunitiesfrom1990through2010andseparatelyforyears2010through2012.ThedataarenotableinidentifyingexceptionstothedownwardtrendforthecommunitiesofAlamogordo,Cloudcroft,ElPaso,andTularosa,allofwhichshowincreasesintheirrespectivegrowthrates.ForthecitiesofAlamogordoandElPasoinparticular,ameasureofgrowthmaybeattributedtoincreasesinpersonnelatnearbymilitarybases.Exhibit2.5comparesaverageannualgrowthfortheUnitedStates,NewMexico,TexasandtheJLUSregion.ThestateofTexasleadsthegroupwithaverageannualpopulationgrowthestimatedat1.6%.NewMexico,experiencingsomedifficultyrecoveringfromthe2007‐2009housingcrisis,trailsthegroupwithestimatedgrowthat0.5%.
5
EXHIBIT2.4AVERAGEANNUALPOPULATIONGROWTHININCORPORATEDAREAS,1990‐2010&2010‐2012
Source: Sub‐CountyPopulationEstimates,U.S.CensusBureauandtheBureauofBusinessandEconomicResearch,UniversityofNew
Mexico.Foundatwww.census.gov/andbber.unm.edu/.Author’scalculations.Note: Anthony,NM,wasincorporatedinJuly2010;ElephantButtewasincorporatedinJuly1988;completeCensusestimatesremain
unavailableforSanElizario.EXHIBIT2.5AVERAGEANNUALPOPULATIONGROWTHFORTHEU.S.,NEWMEXICO,TEXASANDTHESIX‐COUNTYJLUSREGION,1990‐2010&2010‐2012
Source: 1990‐2010populationcountsbyDecennialCensus,U.S.CensusBureau.Foundatwww.census.gov/
2010‐2012figuresfromPopulationEstimatesProgram,U.S.CensusBureau.Foundatwww.census.gov/Author’scalculations.
‐2
0
2
4
6
8
10
Percent
1990‐2010 2010‐2012
0.00
0.50
1.00
1.50
2.00
2.50
U.S. (000’s) New Mexico Texas JLUS Region
Percent
1990‐2010 2010‐2012
6
2.2 HOUSEHOLDS
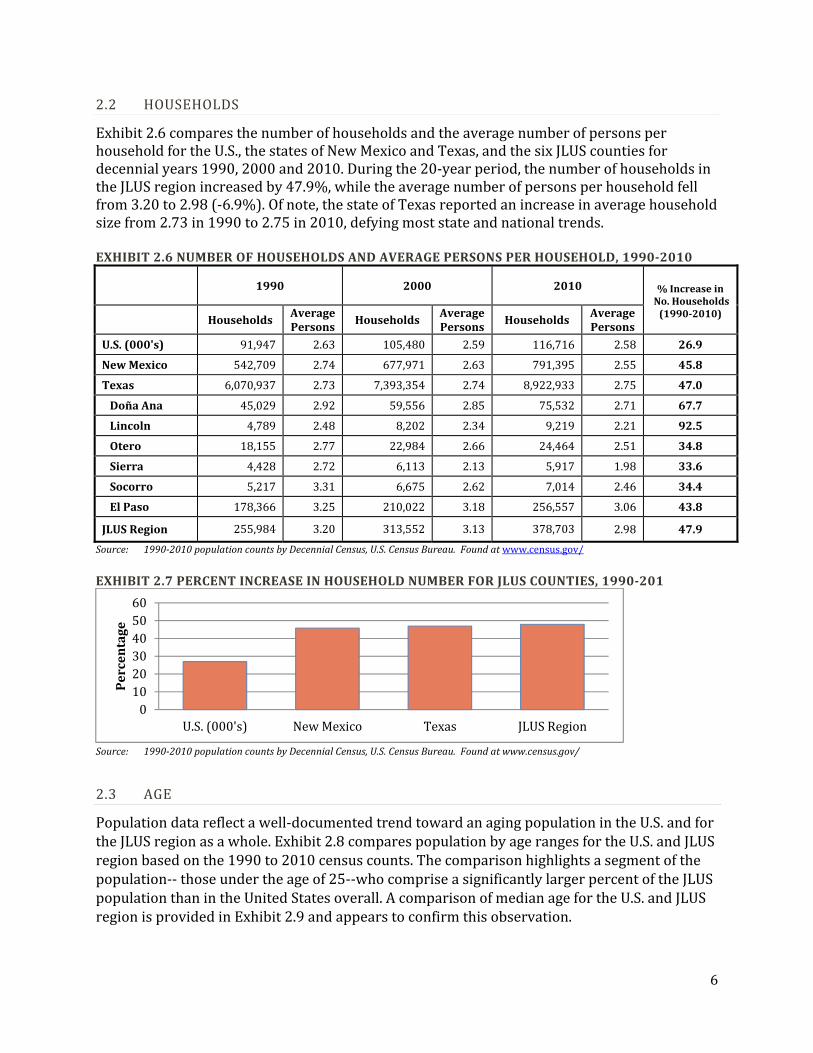
Exhibit2.6comparesthenumberofhouseholdsandtheaveragenumberofpersonsperhouseholdfortheU.S.,thestatesofNewMexicoandTexas,andthesixJLUScountiesfordecennialyears1990,2000and2010.Duringthe20‐yearperiod,thenumberofhouseholdsintheJLUSregionincreasedby47.9%,whiletheaveragenumberofpersonsperhouseholdfellfrom3.20to2.98(‐6.9%).Ofnote,thestateofTexasreportedanincreaseinaveragehouseholdsizefrom2.73in1990to2.75in2010,defyingmoststateandnationaltrends.EXHIBIT2.6NUMBEROFHOUSEHOLDSANDAVERAGEPERSONSPERHOUSEHOLD,1990‐2010
1990 2000 2010 %IncreaseinNo.Households(1990‐2010)
HouseholdsAveragePersons
HouseholdsAveragePersons
HouseholdsAveragePersons
U.S.(000's) 91,947 2.63 105,480 2.59 116,716 2.58 26.9
NewMexico 542,709 2.74 677,971 2.63 791,395 2.55 45.8
Texas 6,070,937 2.73 7,393,354 2.74 8,922,933 2.75 47.0
DoñaAna 45,029 2.92 59,556 2.85 75,532 2.71 67.7
Lincoln 4,789 2.48 8,202 2.34 9,219 2.21 92.5
Otero 18,155 2.77 22,984 2.66 24,464 2.51 34.8
Sierra 4,428 2.72 6,113 2.13 5,917 1.98 33.6
Socorro 5,217 3.31 6,675 2.62 7,014 2.46 34.4
ElPaso 178,366 3.25 210,022 3.18 256,557 3.06 43.8
JLUSRegion 255,984 3.20 313,552 3.13 378,703 2.98 47.9
Source: 1990‐2010populationcountsbyDecennialCensus,U.S.CensusBureau.Foundatwww.census.gov/
EXHIBIT2.7PERCENTINCREASEINHOUSEHOLDNUMBERFORJLUSCOUNTIES,1990‐201
Source: 1990‐2010populationcountsbyDecennialCensus,U.S.CensusBureau.Foundatwww.census.gov/
2.3 AGE
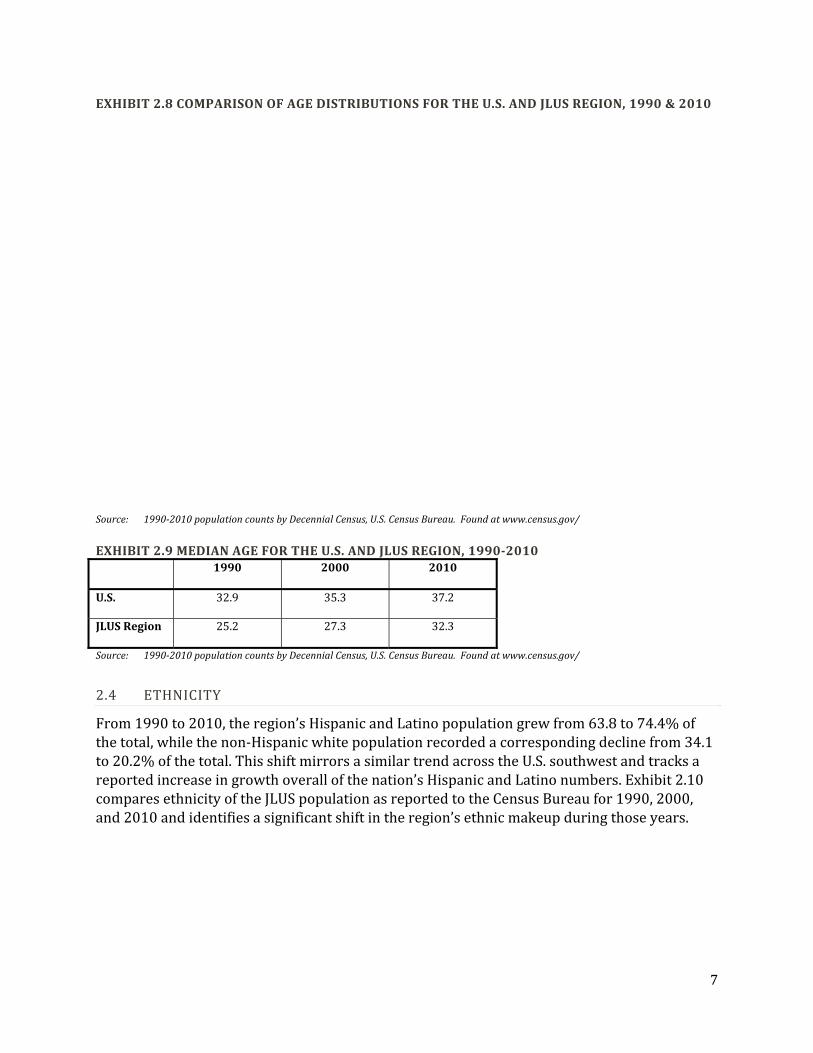
Populationdatareflectawell‐documentedtrendtowardanagingpopulationintheU.S.andfortheJLUSregionasawhole.Exhibit2.8comparespopulationbyagerangesfortheU.S.andJLUSregionbasedonthe1990to2010censuscounts.Thecomparisonhighlightsasegmentofthepopulation‐‐thoseundertheageof25‐‐whocompriseasignificantlylargerpercentoftheJLUSpopulationthanintheUnitedStatesoverall.AcomparisonofmedianagefortheU.S.andJLUSregionisprovidedinExhibit2.9andappearstoconfirmthisobservation.
0102030405060
U.S.(000's) NewMexico Texas JLUSRegion
Percentage
7
EXHIBIT2.8COMPARISONOFAGEDISTRIBUTIONSFORTHEU.S.ANDJLUSREGION,1990&2010
Source: 1990‐2010populationcountsbyDecennialCensus,U.S.CensusBureau.Foundatwww.census.gov/
EXHIBIT2.9MEDIANAGEFORTHEU.S.ANDJLUSREGION,1990‐2010
1990 2000 2010
U.S. 32.9 35.3 37.2
JLUSRegion 25.2 27.3 32.3
Source: 1990‐2010populationcountsbyDecennialCensus,U.S.CensusBureau.Foundatwww.census.gov/
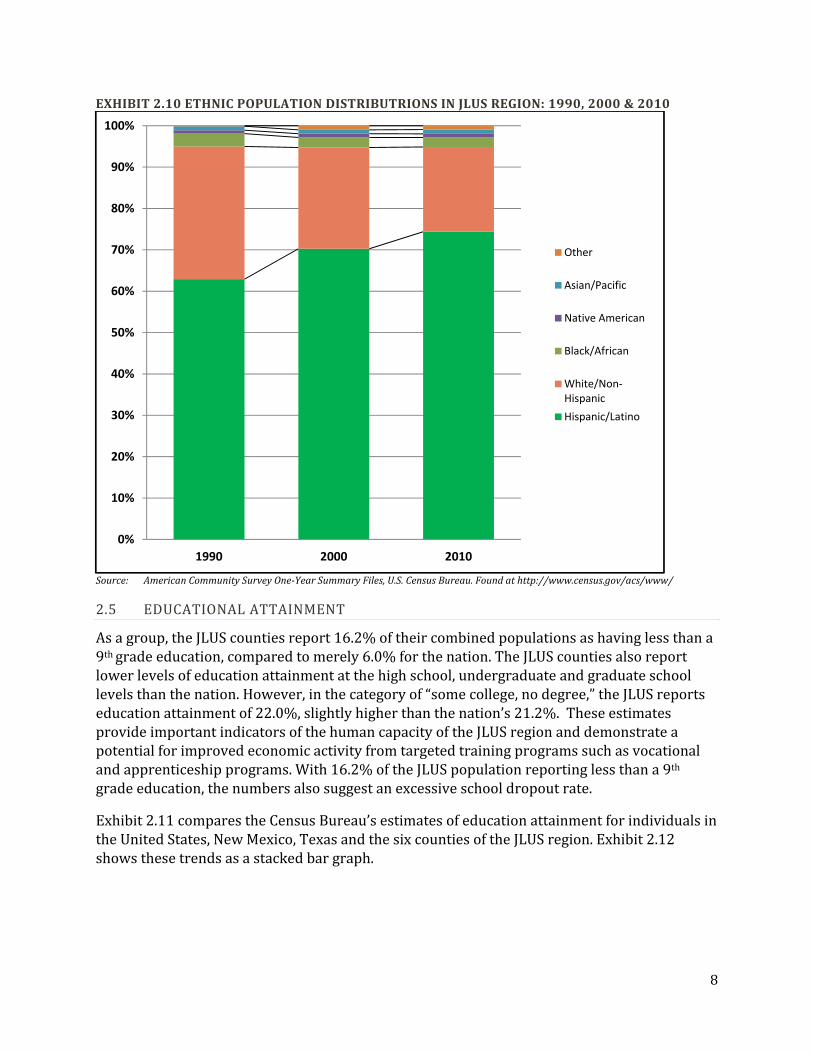
2.4 ETHNICITY
From1990to2010,theregion’sHispanicandLatinopopulationgrewfrom63.8to74.4%ofthetotal,whilethenon‐Hispanicwhitepopulationrecordedacorrespondingdeclinefrom34.1to20.2%ofthetotal.ThisshiftmirrorsasimilartrendacrosstheU.S.southwestandtracksareportedincreaseingrowthoverallofthenation’sHispanicandLatinonumbers.Exhibit2.10comparesethnicityoftheJLUSpopulationasreportedtotheCensusBureaufor1990,2000,and2010andidentifiesasignificantshiftintheregion’sethnicmakeupduringthoseyears.
8
EXHIBIT2.10ETHNICPOPULATIONDISTRIBUTRIONSINJLUSREGION:1990,2000&2010
Source: AmericanCommunitySurveyOne‐YearSummaryFiles,U.S.CensusBureau.Foundathttp://www.census.gov/acs/www/
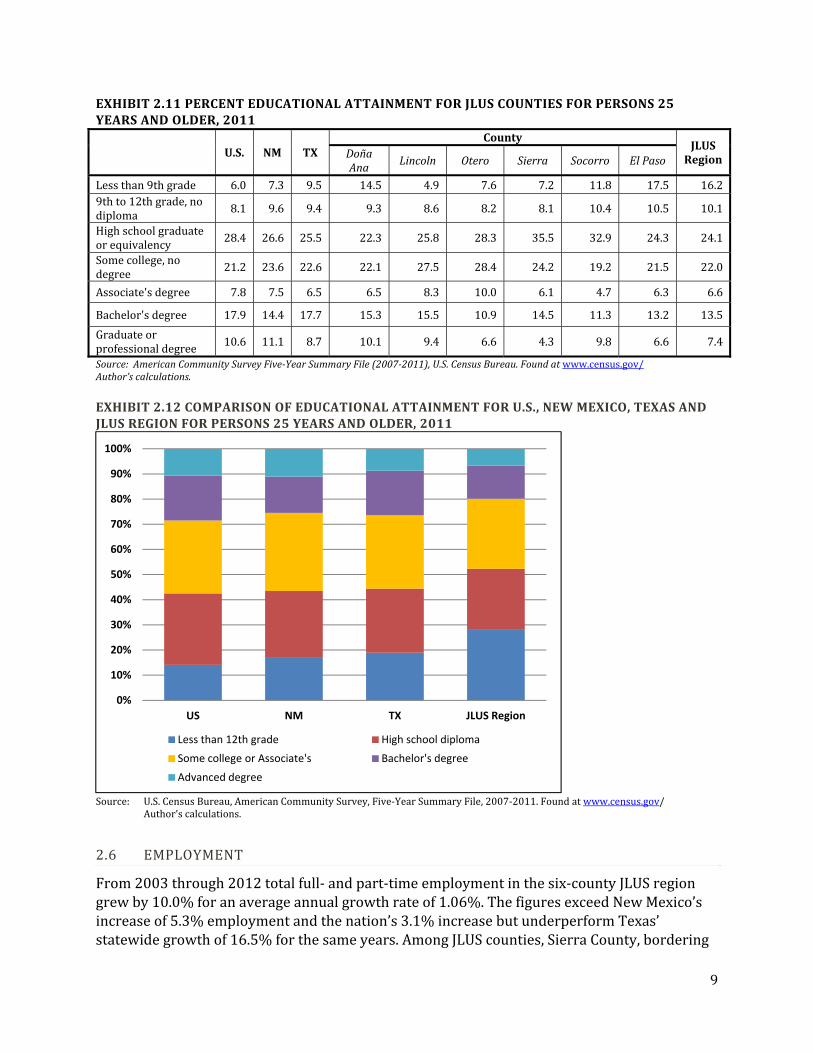
2.5 EDUCATIONALATTAINMENT
Asagroup,theJLUScountiesreport16.2%oftheircombinedpopulationsashavinglessthana9thgradeeducation,comparedtomerely6.0%forthenation.TheJLUScountiesalsoreportlowerlevelsofeducationattainmentatthehighschool,undergraduateandgraduateschoollevelsthanthenation.However,inthecategoryof“somecollege,nodegree,”theJLUSreportseducationattainmentof22.0%,slightlyhigherthanthenation’s21.2%.TheseestimatesprovideimportantindicatorsofthehumancapacityoftheJLUSregionanddemonstrateapotentialforimprovedeconomicactivityfromtargetedtrainingprogramssuchasvocationalandapprenticeshipprograms.With16.2%oftheJLUSpopulationreportinglessthana9thgradeeducation,thenumbersalsosuggestanexcessiveschooldropoutrate.
Exhibit2.11comparestheCensusBureau’sestimatesofeducationattainmentforindividualsintheUnitedStates,NewMexico,TexasandthesixcountiesoftheJLUSregion.Exhibit2.12showsthesetrendsasastackedbargraph.
0%
10%
20%
30%
40%
50%
60%
70%
80%
90%
100%
1990 2000 2010
Other
Asian/Pacific
Native American
Black/African
White/Non‐Hispanic
Hispanic/Latino
9
EXHIBIT2.11PERCENTEDUCATIONALATTAINMENTFORJLUSCOUNTIESFORPERSONS25YEARSANDOLDER,2011
U.S. NM TXCounty
JLUSRegionDoña
AnaLincoln Otero Sierra Socorro ElPaso
Lessthan9thgrade 6.0 7.3 9.5 14.5 4.9 7.6 7.2 11.8 17.5 16.29thto12thgrade,nodiploma
8.1 9.6 9.4 9.3 8.6 8.2 8.1 10.4 10.5 10.1
Highschoolgraduateorequivalency
28.4 26.6 25.5 22.3 25.8 28.3 35.5 32.9 24.3 24.1
Somecollege,nodegree
21.2 23.6 22.6 22.1 27.5 28.4 24.2 19.2 21.5 22.0
Associate'sdegree 7.8 7.5 6.5 6.5 8.3 10.0 6.1 4.7 6.3 6.6
Bachelor'sdegree 17.9 14.4 17.7 15.3 15.5 10.9 14.5 11.3 13.2 13.5
Graduateorprofessionaldegree
10.6 11.1 8.7 10.1 9.4 6.6 4.3 9.8 6.6 7.4
Source:AmericanCommunitySurveyFive‐YearSummaryFile(2007‐2011),U.S.CensusBureau.Foundatwww.census.gov/Author’scalculations.EXHIBIT2.12COMPARISONOFEDUCATIONALATTAINMENTFORU.S.,NEWMEXICO,TEXASANDJLUSREGIONFORPERSONS25YEARSANDOLDER,2011
Source: U.S.CensusBureau,AmericanCommunitySurvey,Five‐YearSummaryFile,2007‐2011.Foundatwww.census.gov/
Author’scalculations.
2.6 EMPLOYMENT
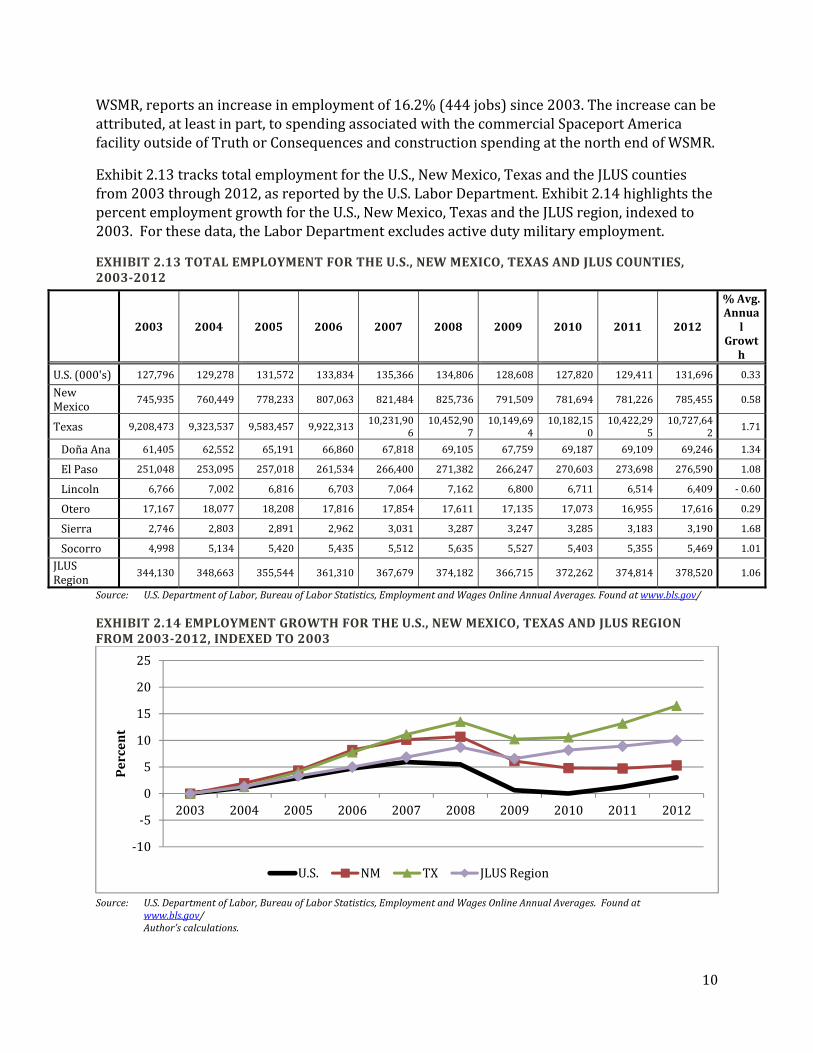
From2003through2012totalfull‐andpart‐timeemploymentinthesix‐countyJLUSregiongrewby10.0%foranaverageannualgrowthrateof1.06%.ThefiguresexceedNewMexico’sincreaseof5.3%employmentandthenation’s3.1%increasebutunderperformTexas’statewidegrowthof16.5%forthesameyears.AmongJLUScounties,SierraCounty,bordering
0%
10%
20%
30%
40%
50%
60%
70%
80%
90%
100%
US NM TX JLUS Region
Less than 12th grade High school diploma
Some college or Associate's Bachelor's degree
Advanced degree
10
WSMR,reportsanincreaseinemploymentof16.2%(444jobs)since2003.Theincreasecanbeattributed,atleastinpart,tospendingassociatedwiththecommercialSpaceportAmericafacilityoutsideofTruthorConsequencesandconstructionspendingatthenorthendofWSMR.
Exhibit2.13trackstotalemploymentfortheU.S.,NewMexico,TexasandtheJLUScountiesfrom2003through2012,asreportedbytheU.S.LaborDepartment.Exhibit2.14highlightsthepercentemploymentgrowthfortheU.S.,NewMexico,TexasandtheJLUSregion,indexedto2003.Forthesedata,theLaborDepartmentexcludesactivedutymilitaryemployment.
EXHIBIT2.13TOTALEMPLOYMENTFORTHEU.S.,NEWMEXICO,TEXASANDJLUSCOUNTIES,2003‐2012
Source: U.S.DepartmentofLabor,BureauofLaborStatistics,EmploymentandWagesOnlineAnnualAverages.Foundatwww.bls.gov/
EXHIBIT2.14EMPLOYMENTGROWTHFORTHEU.S.,NEWMEXICO,TEXASANDJLUSREGIONFROM2003‐2012,INDEXEDTO2003
Source: U.S.DepartmentofLabor,BureauofLaborStatistics,EmploymentandWagesOnlineAnnualAverages.Foundat
www.bls.gov/Author’scalculations.
‐10
‐5
0
5
10
15
20
25
2003 2004 2005 2006 2007 2008 2009 2010 2011 2012
Percent
U.S. NM TX JLUSRegion
2003 2004 2005 2006 2007 2008 2009 2010 2011 2012
%Avg.Annua
lGrowth
U.S.(000's) 127,796 129,278 131,572 133,834 135,366 134,806 128,608 127,820 129,411 131,696 0.33
NewMexico
745,935 760,449 778,233 807,063 821,484 825,736 791,509 781,694 781,226 785,455 0.58
Texas 9,208,473 9,323,537 9,583,457 9,922,31310,231,90
610,452,90
710,149,69
410,182,15
010,422,29
510,727,64
21.71
DoñaAna 61,405 62,552 65,191 66,860 67,818 69,105 67,759 69,187 69,109 69,246 1.34
ElPaso 251,048 253,095 257,018 261,534 266,400 271,382 266,247 270,603 273,698 276,590 1.08
Lincoln 6,766 7,002 6,816 6,703 7,064 7,162 6,800 6,711 6,514 6,409 ‐0.60
Otero 17,167 18,077 18,208 17,816 17,854 17,611 17,135 17,073 16,955 17,616 0.29
Sierra 2,746 2,803 2,891 2,962 3,031 3,287 3,247 3,285 3,183 3,190 1.68
Socorro 4,998 5,134 5,420 5,435 5,512 5,635 5,527 5,403 5,355 5,469 1.01
JLUSRegion
344,130 348,663 355,544 361,310 367,679 374,182 366,715 372,262 374,814 378,520 1.06
11
2.7 LABORFORCEANDUNEMPLOYMENT
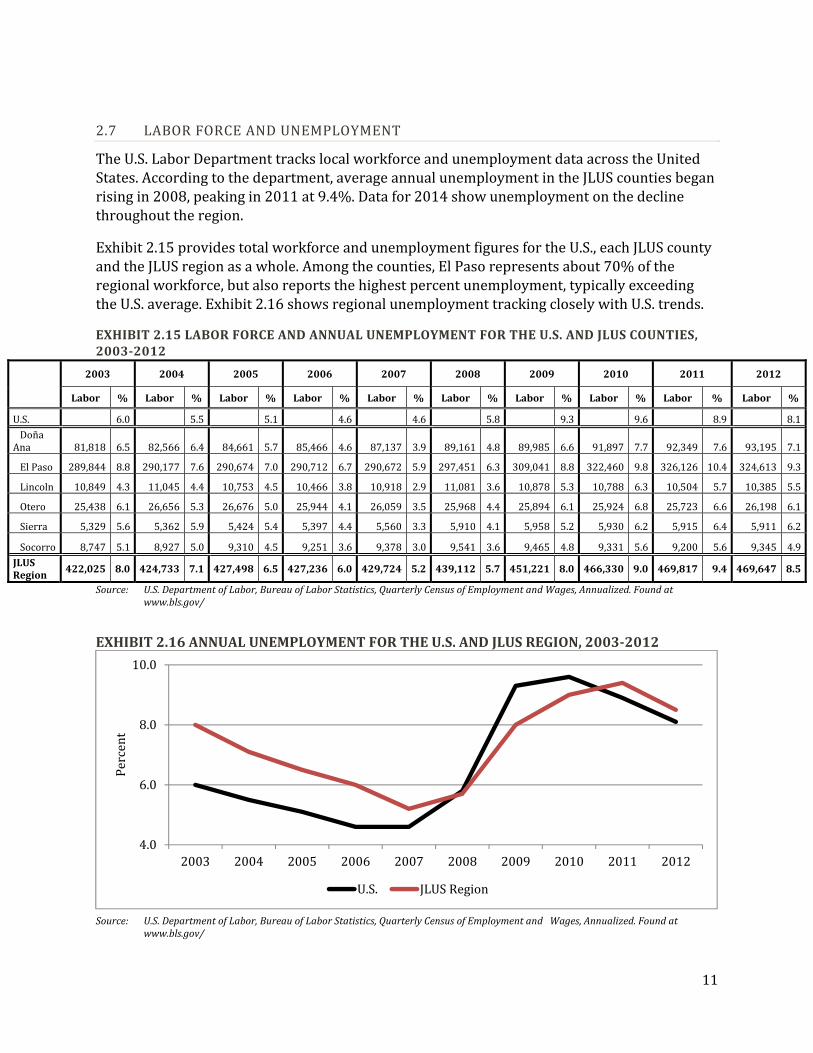
TheU.S.LaborDepartmenttrackslocalworkforceandunemploymentdataacrosstheUnitedStates.Accordingtothedepartment,averageannualunemploymentintheJLUScountiesbeganrisingin2008,peakingin2011at9.4%.Datafor2014showunemploymentonthedeclinethroughouttheregion.
Exhibit2.15providestotalworkforceandunemploymentfiguresfortheU.S.,eachJLUScountyandtheJLUSregionasawhole.Amongthecounties,ElPasorepresentsabout70%oftheregionalworkforce,butalsoreportsthehighestpercentunemployment,typicallyexceedingtheU.S.average.Exhibit2.16showsregionalunemploymenttrackingcloselywithU.S.trends.
EXHIBIT2.15LABORFORCEANDANNUALUNEMPLOYMENTFORTHEU.S.ANDJLUSCOUNTIES,2003‐2012
Source: U.S.DepartmentofLabor,BureauofLaborStatistics,QuarterlyCensusofEmploymentandWages,Annualized.Foundatwww.bls.gov/
EXHIBIT2.16ANNUALUNEMPLOYMENTFORTHEU.S.ANDJLUSREGION,2003‐2012
Source: U.S.DepartmentofLabor,BureauofLaborStatistics,QuarterlyCensusofEmploymentandWages,Annualized.Foundat
www.bls.gov/
4.0
6.0
8.0
10.0
2003 2004 2005 2006 2007 2008 2009 2010 2011 2012
Percent
U.S. JLUSRegion
2003 2004 2005 2006 2007 2008 2009 2010 2011 2012
Labor % Labor % Labor % Labor % Labor % Labor % Labor % Labor % Labor % Labor %
U.S. 6.0 5.5 5.1 4.6 4.6 5.8 9.3 9.6 8.9 8.1DoñaAna 81,818 6.5 82,566 6.4 84,661 5.7 85,466 4.6 87,137 3.9 89,161 4.8 89,985 6.6 91,897 7.7 92,349 7.6 93,195 7.1
ElPaso 289,844 8.8 290,177 7.6 290,674 7.0 290,712 6.7 290,672 5.9 297,451 6.3 309,041 8.8 322,460 9.8 326,126 10.4 324,613 9.3
Lincoln 10,849 4.3 11,045 4.4 10,753 4.5 10,466 3.8 10,918 2.9 11,081 3.6 10,878 5.3 10,788 6.3 10,504 5.7 10,385 5.5
Otero 25,438 6.1 26,656 5.3 26,676 5.0 25,944 4.1 26,059 3.5 25,968 4.4 25,894 6.1 25,924 6.8 25,723 6.6 26,198 6.1
Sierra 5,329 5.6 5,362 5.9 5,424 5.4 5,397 4.4 5,560 3.3 5,910 4.1 5,958 5.2 5,930 6.2 5,915 6.4 5,911 6.2
Socorro 8,747 5.1 8,927 5.0 9,310 4.5 9,251 3.6 9,378 3.0 9,541 3.6 9,465 4.8 9,331 5.6 9,200 5.6 9,345 4.9JLUSRegion
422,025 8.0 424,733 7.1 427,498 6.5 427,236 6.0 429,724 5.2 439,112 5.7 451,221 8.0 466,330 9.0 469,817 9.4 469,647 8.5
12
2.8 EMPLOYMENTBYINDUSTRY
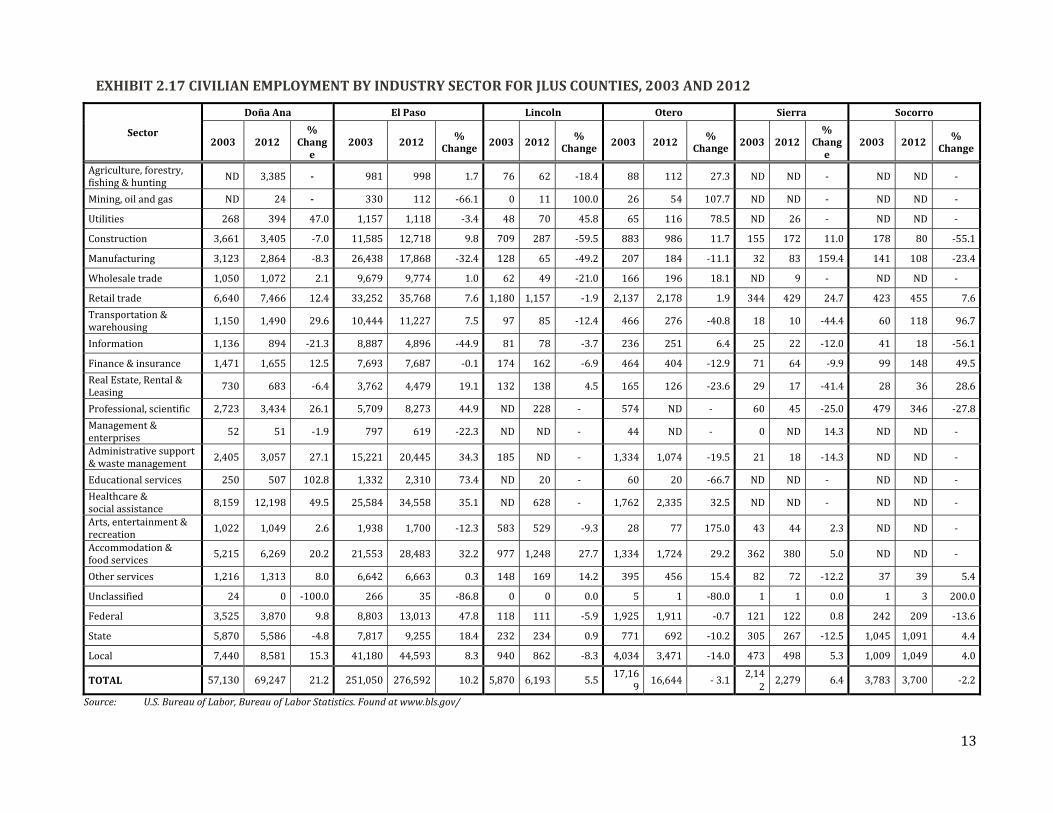
EmploymentwithintheJLUSregiondemonstratesaheavyrelianceongovernmentspending,accountingforoneineveryfourjobs.Withintheprivatesector,retailtradecontributessignificantlytoemployment,particularlyinElPasoCountywhere35,768jobs(12.9%ofthecountytotal)areidentifiedwiththesector.RecentchangesthatallowMexicanshoppersgreaterentryintotheborderregionofNewMexicoholdpromisethatthissectorwillcontinuetogrow.Asisthecasethroughouttheregion,publicspendingonhealthcareandsocialassistancecontributestotheemploymentbase.
Exhibit2.17showscountyemploymentbyindustrysectorforyears2003and2012.Theexhibithighlightsemploymentpatternswithineachcounty.AmongJLUScounties,ElPasoisnotableforgrowthinrealestate‐relatedemployment(19.1%),atrendthatdefiesthenationandmuchoftheremainingJLUSregion.DoñaAnaCounty,aregionalcenterformedicalservices,reportsalargeincrease(49.5%)inemploymentinhealthcareandsocialassistance.LincolnCounty,adestinationfortourismandoutdoorrecreation,demonstratesgrowth(27.7%)inaccommodationandfoodservicejobs.ThecountiesofOtero,SierraandSocorroreportsharpspikesincertainsectorsthatincludemanufacturing(Sierra),artsandentertainment(Otero),andtransportationandwarehousing(Socorro).
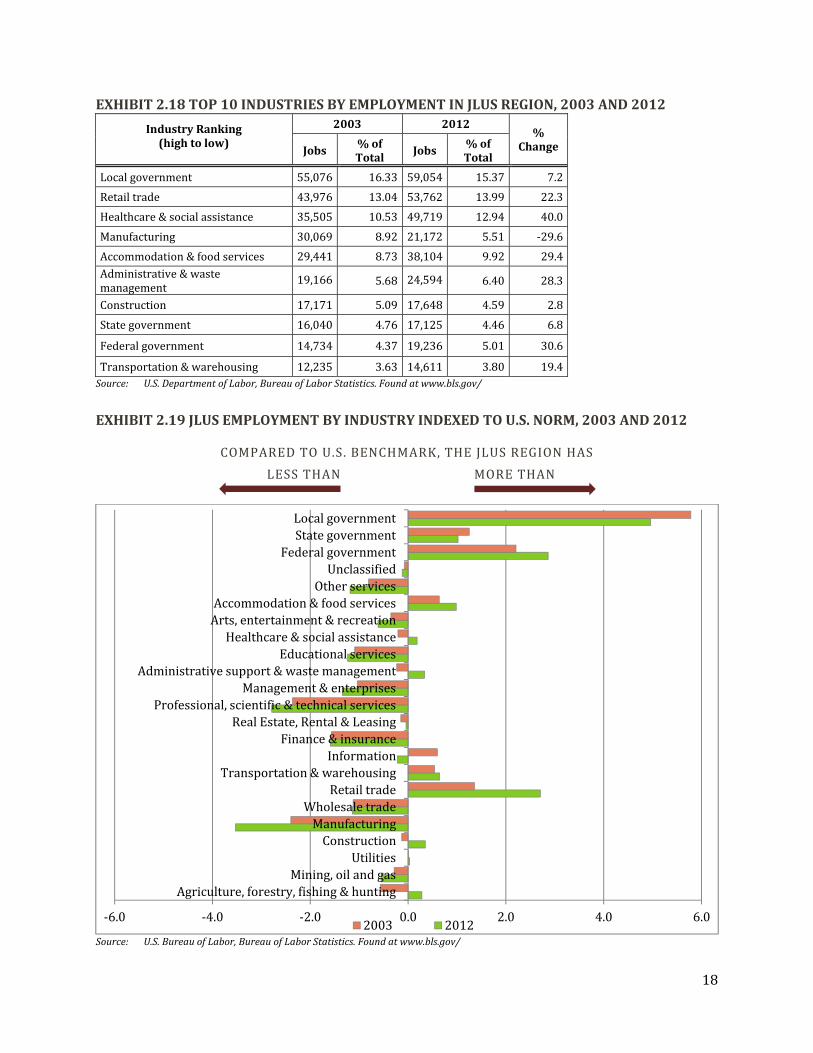
Theregion’stop10industrysectorsbyemploymentarelistedinExhibit2.18.Overall,privatesectoremploymentinretail,healthcare,manufacturing,andaccommodationandfoodservicedominateemploymentwithanotabledownturninElPasointheformerlydominantmanufacturingsector.Exhibit2.19chartsregionalemploymentbyindustryindexedtoU.S.averages.Thecharthighlightstheregion’sheavyrelianceongovernmentjobsandmapstheregion’sremarkableincreaseinretailemploymentfrom2003to2012.
13
EXHIBIT2.17CIVILIANEMPLOYMENTBYINDUSTRYSECTORFORJLUSCOUNTIES,2003AND2012
Source: U.S.BureauofLabor,BureauofLaborStatistics.Foundatwww.bls.gov/
Sector
DoñaAna ElPaso Lincoln Otero Sierra Socorro
2003 2012%
Change
2003 2012%
Change2003 2012
%Change
2003 2012%
Change2003 2012
%Change
2003 2012%
Change
Agriculture,forestry,fishing&hunting
ND 3,385 ‐ 981 998 1.7 76 62 ‐18.4 88 112 27.3 ND ND ‐ ND ND ‐
Mining,oilandgas ND 24 ‐ 330 112 ‐66.1 0 11 100.0 26 54 107.7 ND ND ‐ ND ND ‐
Utilities 268 394 47.0 1,157 1,118 ‐3.4 48 70 45.8 65 116 78.5 ND 26 ‐ ND ND ‐
Construction 3,661 3,405 ‐7.0 11,585 12,718 9.8 709 287 ‐59.5 883 986 11.7 155 172 11.0 178 80 ‐55.1
Manufacturing 3,123 2,864 ‐8.3 26,438 17,868 ‐32.4 128 65 ‐49.2 207 184 ‐11.1 32 83 159.4 141 108 ‐23.4
Wholesaletrade 1,050 1,072 2.1 9,679 9,774 1.0 62 49 ‐21.0 166 196 18.1 ND 9 ‐ ND ND ‐
Retailtrade 6,640 7,466 12.4 33,252 35,768 7.6 1,180 1,157 ‐1.9 2,137 2,178 1.9 344 429 24.7 423 455 7.6
Transportation&warehousing
1,150 1,490 29.6 10,444 11,227 7.5 97 85 ‐12.4 466 276 ‐40.8 18 10 ‐44.4 60 118 96.7
Information 1,136 894 ‐21.3 8,887 4,896 ‐44.9 81 78 ‐3.7 236 251 6.4 25 22 ‐12.0 41 18 ‐56.1
Finance&insurance 1,471 1,655 12.5 7,693 7,687 ‐0.1 174 162 ‐6.9 464 404 ‐12.9 71 64 ‐9.9 99 148 49.5
RealEstate,Rental&Leasing
730 683 ‐6.4 3,762 4,479 19.1 132 138 4.5 165 126 ‐23.6 29 17 ‐41.4 28 36 28.6
Professional,scientific 2,723 3,434 26.1 5,709 8,273 44.9 ND 228 ‐ 574 ND ‐ 60 45 ‐25.0 479 346 ‐27.8
Management&enterprises
52 51 ‐1.9 797 619 ‐22.3 ND ND ‐ 44 ND ‐ 0 ND 14.3 ND ND ‐
Administrativesupport&wastemanagement
2,405 3,057 27.1 15,221 20,445 34.3 185 ND ‐ 1,334 1,074 ‐19.5 21 18 ‐14.3 ND ND ‐
Educationalservices 250 507 102.8 1,332 2,310 73.4 ND 20 ‐ 60 20 ‐66.7 ND ND ‐ ND ND ‐
Healthcare&socialassistance
8,159 12,198 49.5 25,584 34,558 35.1 ND 628 ‐ 1,762 2,335 32.5 ND ND ‐ ND ND ‐
Arts,entertainment&recreation
1,022 1,049 2.6 1,938 1,700 ‐12.3 583 529 ‐9.3 28 77 175.0 43 44 2.3 ND ND ‐
Accommodation&foodservices
5,215 6,269 20.2 21,553 28,483 32.2 977 1,248 27.7 1,334 1,724 29.2 362 380 5.0 ND ND ‐
Otherservices 1,216 1,313 8.0 6,642 6,663 0.3 148 169 14.2 395 456 15.4 82 72 ‐12.2 37 39 5.4
Unclassified 24 0 ‐100.0 266 35 ‐86.8 0 0 0.0 5 1 ‐80.0 1 1 0.0 1 3 200.0
Federal 3,525 3,870 9.8 8,803 13,013 47.8 118 111 ‐5.9 1,925 1,911 ‐0.7 121 122 0.8 242 209 ‐13.6
State 5,870 5,586 ‐4.8 7,817 9,255 18.4 232 234 0.9 771 692 ‐10.2 305 267 ‐12.5 1,045 1,091 4.4
Local 7,440 8,581 15.3 41,180 44,593 8.3 940 862 ‐8.3 4,034 3,471 ‐14.0 473 498 5.3 1,009 1,049 4.0
TOTAL 57,130 69,247 21.2 251,050 276,592 10.2 5,870 6,193 5.517,16
916,644 ‐3.1
2,142
2,279 6.4 3,783 3,700 ‐2.2
18
EXHIBIT2.18TOP10INDUSTRIESBYEMPLOYMENTINJLUSREGION,2003AND2012
IndustryRanking(hightolow)
2003 2012%
ChangeJobs %ofTotal
Jobs %ofTotal
Localgovernment 55,076 16.33 59,054 15.37 7.2
Retailtrade 43,976 13.04 53,762 13.99 22.3
Healthcare&socialassistance 35,505 10.53 49,719 12.94 40.0
Manufacturing 30,069 8.92 21,172 5.51 ‐29.6
Accommodation&foodservices 29,441 8.73 38,104 9.92 29.4Administrative&wastemanagement
19,166 5.68 24,594 6.40 28.3
Construction 17,171 5.09 17,648 4.59 2.8
Stategovernment 16,040 4.76 17,125 4.46 6.8
Federalgovernment 14,734 4.37 19,236 5.01 30.6
Transportation&warehousing 12,235 3.63 14,611 3.80 19.4Source: U.S.DepartmentofLabor,BureauofLaborStatistics.Foundatwww.bls.gov/
EXHIBIT2.19JLUSEMPLOYMENTBYINDUSTRYINDEXEDTOU.S.NORM,2003AND2012
COMPAREDTOU.S.BENCHMARK,THEJLUSREGIONHAS
LESSTHAN MORETHAN
Source: U.S.BureauofLabor,BureauofLaborStatistics.Foundatwww.bls.gov/
‐6.0 ‐4.0 ‐2.0 0.0 2.0 4.0 6.0
Agriculture,forestry,fishing &huntingMining,oil and gas
UtilitiesConstruction
ManufacturingWholesale trade
Retail tradeTransportation &warehousing
InformationFinance &insurance
Real Estate,Rental &LeasingProfessional,scientific&technical services
Management &enterprisesAdministrative support &waste management
Educational servicesHealthcare &social assistance
Arts,entertainment&recreationAccommodation &food services
Other servicesUnclassified
FederalgovernmentStategovernmentLocalgovernment
2003 2012
19
3.0 ECONOMICPERFORMANCE
ThissectionanalyzestheeconomicperformanceoftheJLUSregionandincludesananalysisofpercapitaincome,wagesandsalaries,occupationalmix,employmentdiversity,andemploymentconcentrationbywage.Thesectionincludesadiscussiononeducationalachievementasameansofimprovingeconomicperformance.
3.1 PERCAPITAINCOME
Percapitaincomeisoftenseenasameasureofrelativeeconomicperformance.Typically,therateofeconomicprogressisgaugedbycomparingregionalrateswithnationalaveragesovertime,withtheexpectationthatpoororunder‐performingareaswillmoveclosertotheaverage.Forthisreport,percapitaincomeisdefinedasincomeperperson,madeupofwages,salaries,benefits,investmentincome,andsocialassistancepayments.
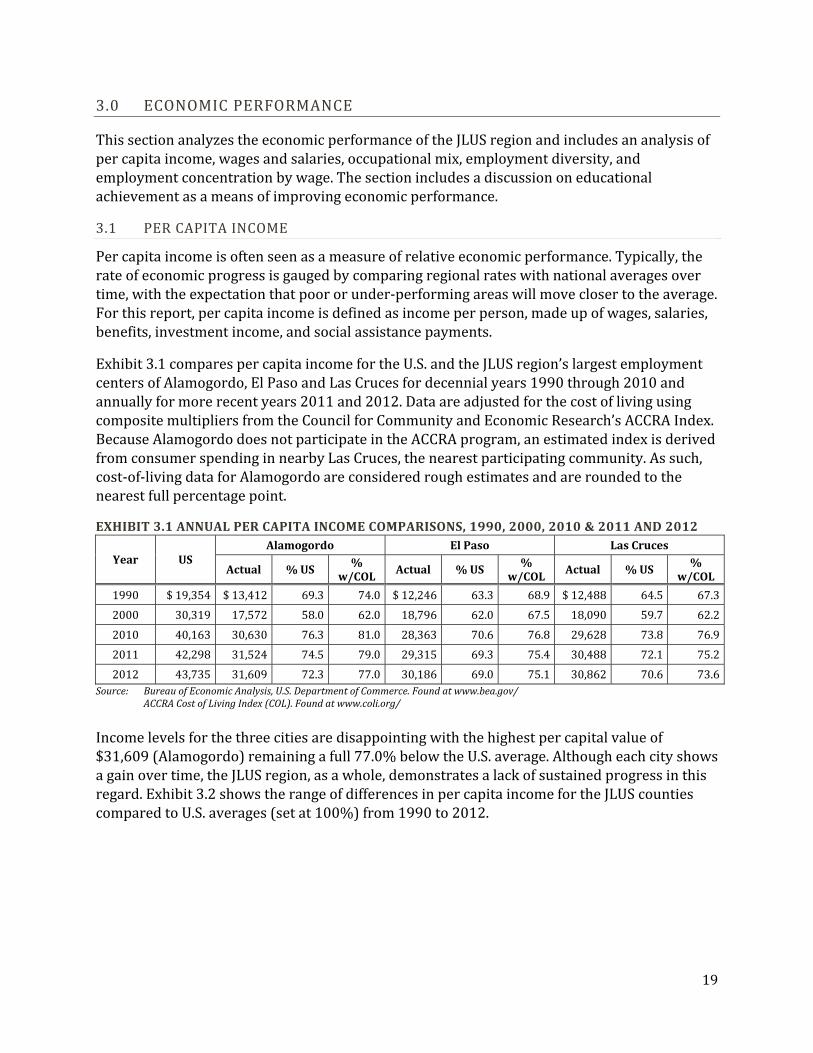
Exhibit3.1comparespercapitaincomefortheU.S.andtheJLUSregion’slargestemploymentcentersofAlamogordo,ElPasoandLasCrucesfordecennialyears1990through2010andannuallyformorerecentyears2011and2012.DataareadjustedforthecostoflivingusingcompositemultipliersfromtheCouncilforCommunityandEconomicResearch’sACCRAIndex.BecauseAlamogordodoesnotparticipateintheACCRAprogram,anestimatedindexisderivedfromconsumerspendinginnearbyLasCruces,thenearestparticipatingcommunity.Assuch,cost‐of‐livingdataforAlamogordoareconsideredroughestimatesandareroundedtothenearestfullpercentagepoint.
EXHIBIT3.1ANNUALPERCAPITAINCOMECOMPARISONS,1990,2000,2010&2011AND2012
Year USAlamogordo ElPaso LasCruces
Actual %US%
w/COLActual %US
%w/COL
Actual %US%
w/COL
1990 $19,354 $13,412 69.3 74.0 $12,246 63.3 68.9 $12,488 64.5 67.3
2000 30,319 17,572 58.0 62.0 18,796 62.0 67.5 18,090 59.7 62.2
2010 40,163 30,630 76.3 81.0 28,363 70.6 76.8 29,628 73.8 76.9
2011 42,298 31,524 74.5 79.0 29,315 69.3 75.4 30,488 72.1 75.2
2012 43,735 31,609 72.3 77.0 30,186 69.0 75.1 30,862 70.6 73.6Source: BureauofEconomicAnalysis,U.S.DepartmentofCommerce.Foundatwww.bea.gov/
ACCRACostofLivingIndex(COL).Foundatwww.coli.org/
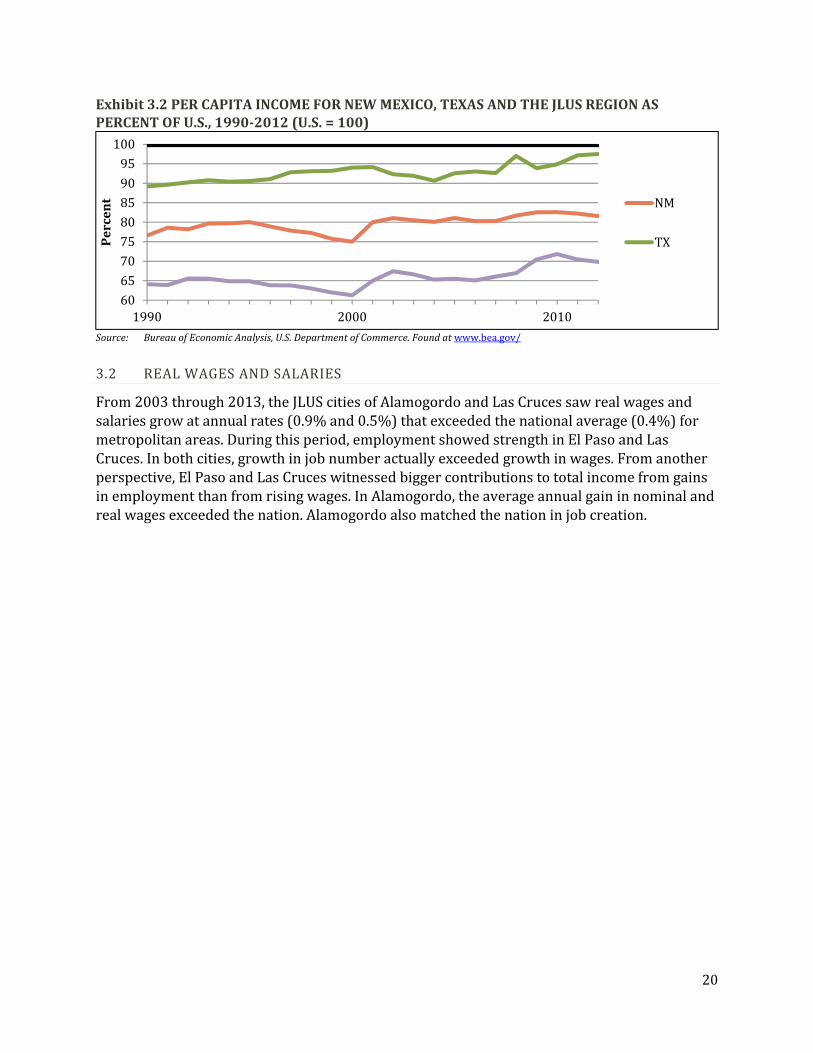
Incomelevelsforthethreecitiesaredisappointingwiththehighestpercapitalvalueof$31,609(Alamogordo)remainingafull77.0%belowtheU.S.average.Althougheachcityshowsagainovertime,theJLUSregion,asawhole,demonstratesalackofsustainedprogressinthisregard.Exhibit3.2showstherangeofdifferencesinpercapitaincomefortheJLUScountiescomparedtoU.S.averages(setat100%)from1990to2012.
20
Exhibit3.2PERCAPITAINCOMEFORNEWMEXICO,TEXASANDTHEJLUSREGIONASPERCENTOFU.S.,1990‐2012(U.S.=100)
Source: BureauofEconomicAnalysis,U.S.DepartmentofCommerce.Foundatwww.bea.gov/
3.2 REALWAGESANDSALARIES
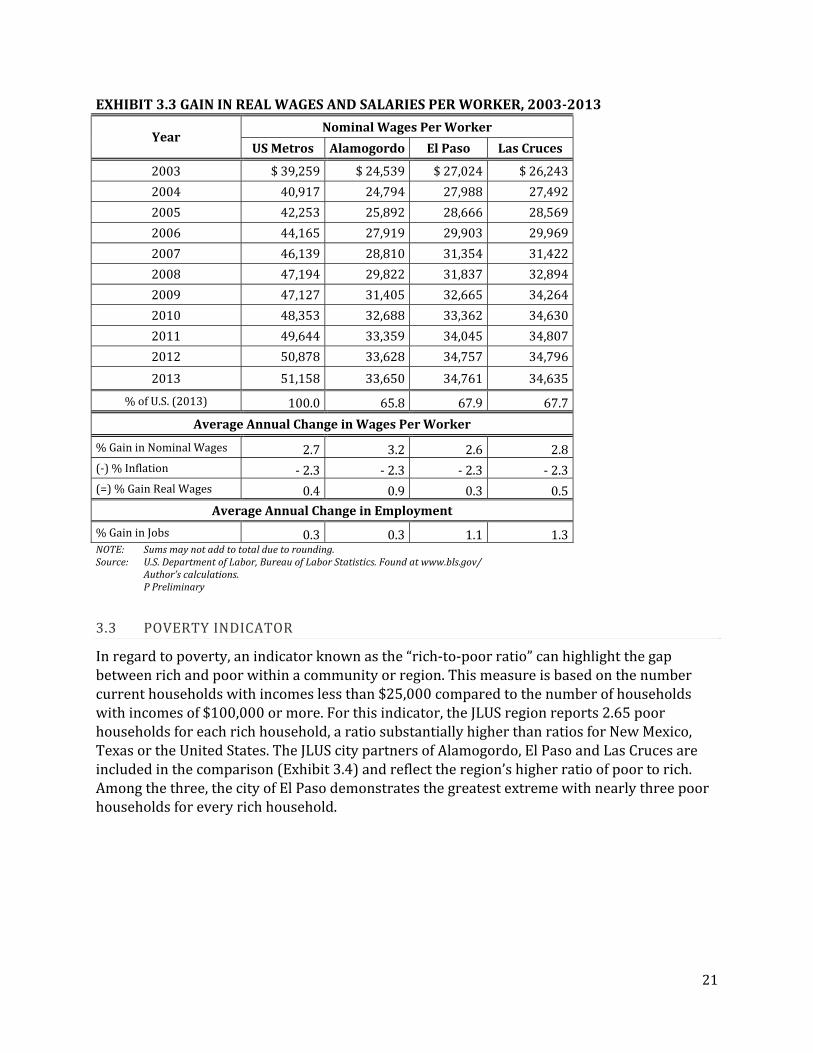
From2003through2013,theJLUScitiesofAlamogordoandLasCrucessawrealwagesandsalariesgrowatannualrates(0.9%and0.5%)thatexceededthenationalaverage(0.4%)formetropolitanareas.Duringthisperiod,employmentshowedstrengthinElPasoandLasCruces.Inbothcities,growthinjobnumberactuallyexceededgrowthinwages.Fromanotherperspective,ElPasoandLasCruceswitnessedbiggercontributionstototalincomefromgainsinemploymentthanfromrisingwages.InAlamogordo,theaverageannualgaininnominalandrealwagesexceededthenation.Alamogordoalsomatchedthenationinjobcreation.
6065
7075808590
95100
1990 2000 2010
Percent NM
TX
21
EXHIBIT3.3GAININREALWAGESANDSALARIESPERWORKER,2003‐2013
YearNominalWagesPerWorker
USMetros Alamogordo ElPaso LasCruces
2003 $39,259 $24,539 $27,024 $26,243
2004 40,917 24,794 27,988 27,492
2005 42,253 25,892 28,666 28,569
2006 44,165 27,919 29,903 29,969
2007 46,139 28,810 31,354 31,422
2008 47,194 29,822 31,837 32,894
2009 47,127 31,405 32,665 34,264
2010 48,353 32,688 33,362 34,630
2011 49,644 33,359 34,045 34,807
2012 50,878 33,628 34,757 34,796
2013 51,158 33,650 34,761 34,635
%ofU.S.(2013) 100.0 65.8 67.9 67.7
AverageAnnualChangeinWagesPerWorker
%GaininNominalWages 2.7 3.2 2.6 2.8(‐)%Inflation ‐2.3 ‐2.3 ‐2.3 ‐2.3(=)%GainRealWages 0.4 0.9 0.3 0.5
AverageAnnualChangeinEmployment
%GaininJobs 0.3 0.3 1.1 1.3NOTE: Sumsmaynotaddtototalduetorounding.Source: U.S.DepartmentofLabor,BureauofLaborStatistics.Foundatwww.bls.gov/
Author’scalculations.PPreliminary
3.3 POVERTYINDICATOR
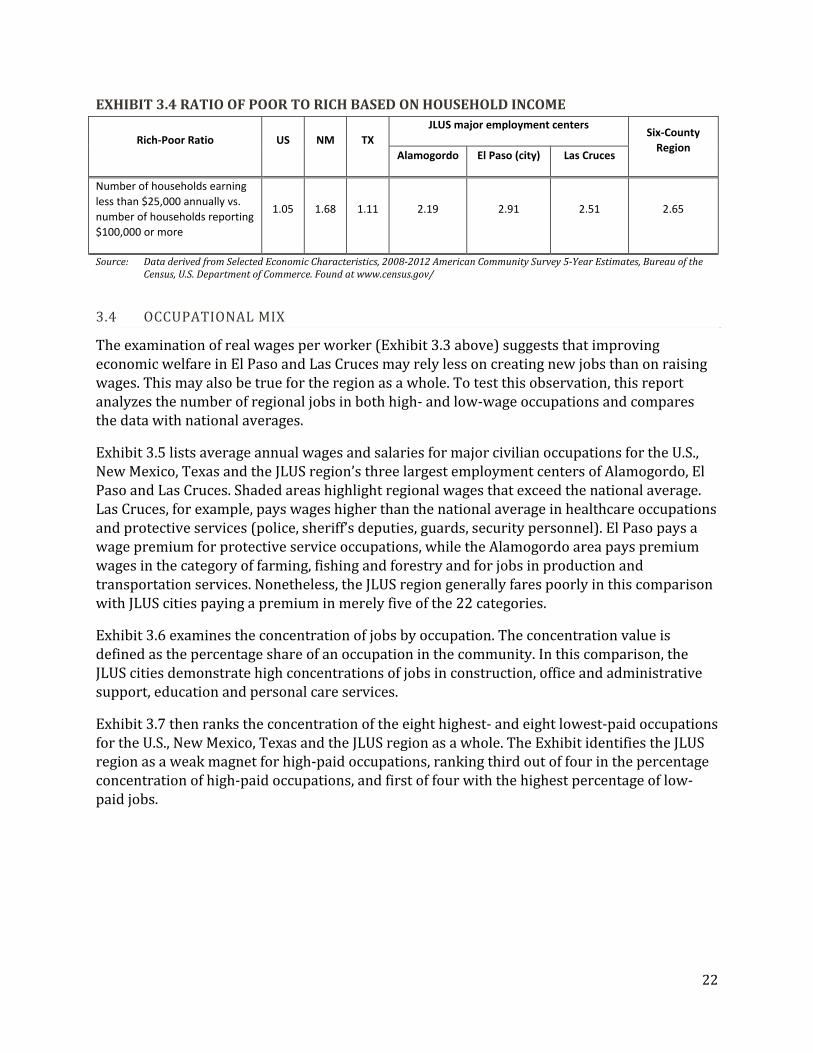
Inregardtopoverty,anindicatorknownasthe“rich‐to‐poorratio”canhighlightthegapbetweenrichandpoorwithinacommunityorregion.Thismeasureisbasedonthenumbercurrenthouseholdswithincomeslessthan$25,000comparedtothenumberofhouseholdswithincomesof$100,000ormore.Forthisindicator,theJLUSregionreports2.65poorhouseholdsforeachrichhousehold,aratiosubstantiallyhigherthanratiosforNewMexico,TexasortheUnitedStates.TheJLUScitypartnersofAlamogordo,ElPasoandLasCrucesareincludedinthecomparison(Exhibit3.4)andreflecttheregion’shigherratioofpoortorich.Amongthethree,thecityofElPasodemonstratesthegreatestextremewithnearlythreepoorhouseholdsforeveryrichhousehold.
22
EXHIBIT3.4RATIOOFPOORTORICHBASEDONHOUSEHOLDINCOME
Source: DataderivedfromSelectedEconomicCharacteristics,2008‐2012AmericanCommunitySurvey5‐YearEstimates,BureauoftheCensus,U.S.DepartmentofCommerce.Foundatwww.census.gov/
3.4 OCCUPATIONALMIX
Theexaminationofrealwagesperworker(Exhibit3.3above)suggeststhatimprovingeconomicwelfareinElPasoandLasCrucesmayrelylessoncreatingnewjobsthanonraisingwages.Thismayalsobetruefortheregionasawhole.Totestthisobservation,thisreportanalyzesthenumberofregionaljobsinbothhigh‐andlow‐wageoccupationsandcomparesthedatawithnationalaverages.
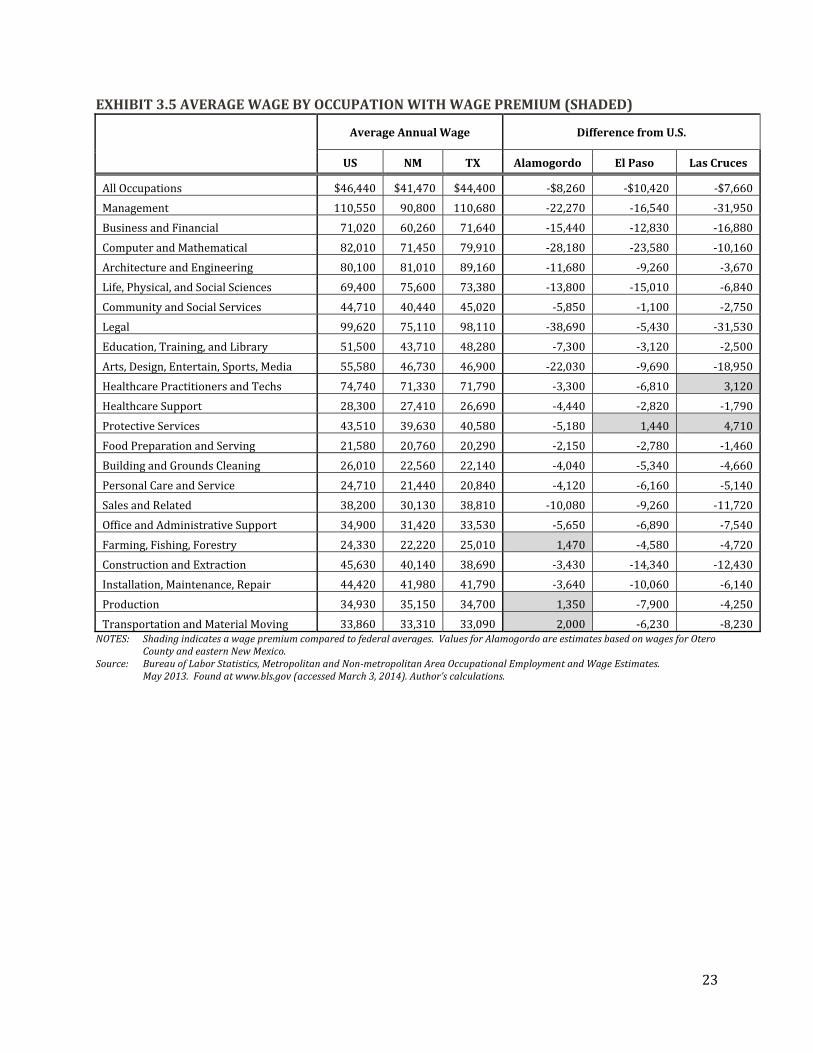
Exhibit3.5listsaverageannualwagesandsalariesformajorcivilianoccupationsfortheU.S.,NewMexico,TexasandtheJLUSregion’sthreelargestemploymentcentersofAlamogordo,ElPasoandLasCruces.Shadedareashighlightregionalwagesthatexceedthenationalaverage.LasCruces,forexample,payswageshigherthanthenationalaverageinhealthcareoccupationsandprotectiveservices(police,sheriff’sdeputies,guards,securitypersonnel).ElPasopaysawagepremiumforprotectiveserviceoccupations,whiletheAlamogordoareapayspremiumwagesinthecategoryoffarming,fishingandforestryandforjobsinproductionandtransportationservices.Nonetheless,theJLUSregiongenerallyfarespoorlyinthiscomparisonwithJLUScitiespayingapremiuminmerelyfiveofthe22categories.
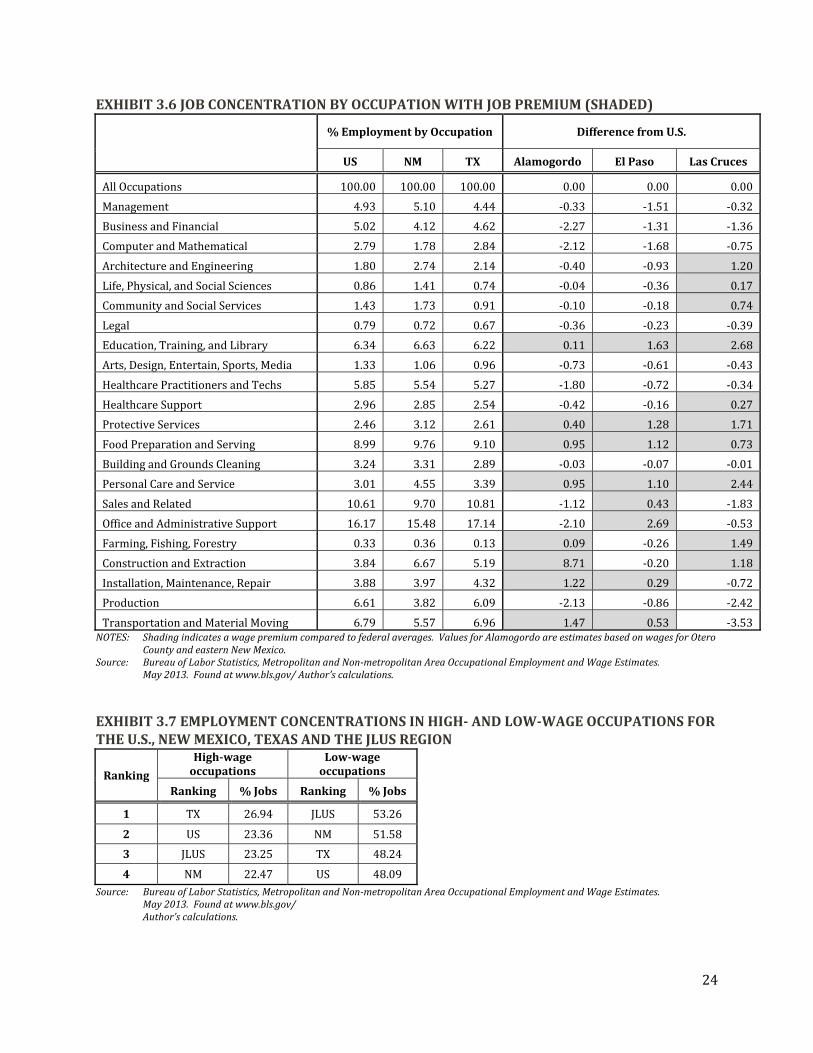
Exhibit3.6examinestheconcentrationofjobsbyoccupation.Theconcentrationvalueisdefinedasthepercentageshareofanoccupationinthecommunity.Inthiscomparison,theJLUScitiesdemonstratehighconcentrationsofjobsinconstruction,officeandadministrativesupport,educationandpersonalcareservices.
Exhibit3.7thenrankstheconcentrationoftheeighthighest‐andeightlowest‐paidoccupationsfortheU.S.,NewMexico,TexasandtheJLUSregionasawhole.TheExhibitidentifiestheJLUSregionasaweakmagnetforhigh‐paidoccupations,rankingthirdoutoffourinthepercentageconcentrationofhigh‐paidoccupations,andfirstoffourwiththehighestpercentageoflow‐paidjobs.
Rich‐Poor Ratio US NM TXJLUS major employment centers
Six‐County
RegionAlamogordo El Paso (city) Las Cruces
Number of households earning
less than $25,000 annually vs.
number of households reporting
$100,000 or more
1.05 1.68 1.11 2.19 2.91 2.51 2.65
23
EXHIBIT3.5AVERAGEWAGEBYOCCUPATIONWITHWAGEPREMIUM(SHADED)
AverageAnnualWage DifferencefromU.S.
US NM TX Alamogordo ElPaso LasCruces
AllOccupations $46,440 $41,470 $44,400 ‐$8,260 ‐$10,420 ‐$7,660
Management 110,550 90,800 110,680 ‐22,270 ‐16,540 ‐31,950
BusinessandFinancial 71,020 60,260 71,640 ‐15,440 ‐12,830 ‐16,880
ComputerandMathematical 82,010 71,450 79,910 ‐28,180 ‐23,580 ‐10,160
ArchitectureandEngineering 80,100 81,010 89,160 ‐11,680 ‐9,260 ‐3,670
Life,Physical,andSocialSciences 69,400 75,600 73,380 ‐13,800 ‐15,010 ‐6,840
CommunityandSocialServices 44,710 40,440 45,020 ‐5,850 ‐1,100 ‐2,750
Legal 99,620 75,110 98,110 ‐38,690 ‐5,430 ‐31,530
Education,Training,andLibrary 51,500 43,710 48,280 ‐7,300 ‐3,120 ‐2,500
Arts,Design,Entertain,Sports,Media 55,580 46,730 46,900 ‐22,030 ‐9,690 ‐18,950
HealthcarePractitionersandTechs 74,740 71,330 71,790 ‐3,300 ‐6,810 3,120
HealthcareSupport 28,300 27,410 26,690 ‐4,440 ‐2,820 ‐1,790
ProtectiveServices 43,510 39,630 40,580 ‐5,180 1,440 4,710
FoodPreparationandServing 21,580 20,760 20,290 ‐2,150 ‐2,780 ‐1,460
BuildingandGroundsCleaning 26,010 22,560 22,140 ‐4,040 ‐5,340 ‐4,660
PersonalCareandService 24,710 21,440 20,840 ‐4,120 ‐6,160 ‐5,140
SalesandRelated 38,200 30,130 38,810 ‐10,080 ‐9,260 ‐11,720
OfficeandAdministrativeSupport 34,900 31,420 33,530 ‐5,650 ‐6,890 ‐7,540
Farming,Fishing,Forestry 24,330 22,220 25,010 1,470 ‐4,580 ‐4,720
ConstructionandExtraction 45,630 40,140 38,690 ‐3,430 ‐14,340 ‐12,430
Installation,Maintenance,Repair 44,420 41,980 41,790 ‐3,640 ‐10,060 ‐6,140
Production 34,930 35,150 34,700 1,350 ‐7,900 ‐4,250
TransportationandMaterialMoving 33,860 33,310 33,090 2,000 ‐6,230 ‐8,230NOTES: Shadingindicatesawagepremiumcomparedtofederalaverages.ValuesforAlamogordoareestimatesbasedonwagesforOtero
CountyandeasternNewMexico.Source: BureauofLaborStatistics,MetropolitanandNon‐metropolitanAreaOccupationalEmploymentandWageEstimates.
May2013.Foundatwww.bls.gov(accessedMarch3,2014).Author’scalculations.
24
EXHIBIT3.6JOBCONCENTRATIONBYOCCUPATIONWITHJOBPREMIUM(SHADED)
%EmploymentbyOccupation DifferencefromU.S.
US NM TX Alamogordo ElPaso LasCruces
AllOccupations 100.00 100.00 100.00 0.00 0.00 0.00
Management 4.93 5.10 4.44 ‐0.33 ‐1.51 ‐0.32
BusinessandFinancial 5.02 4.12 4.62 ‐2.27 ‐1.31 ‐1.36
ComputerandMathematical 2.79 1.78 2.84 ‐2.12 ‐1.68 ‐0.75
ArchitectureandEngineering 1.80 2.74 2.14 ‐0.40 ‐0.93 1.20
Life,Physical,andSocialSciences 0.86 1.41 0.74 ‐0.04 ‐0.36 0.17
CommunityandSocialServices 1.43 1.73 0.91 ‐0.10 ‐0.18 0.74
Legal 0.79 0.72 0.67 ‐0.36 ‐0.23 ‐0.39
Education,Training,andLibrary 6.34 6.63 6.22 0.11 1.63 2.68
Arts,Design,Entertain,Sports,Media 1.33 1.06 0.96 ‐0.73 ‐0.61 ‐0.43
HealthcarePractitionersandTechs 5.85 5.54 5.27 ‐1.80 ‐0.72 ‐0.34
HealthcareSupport 2.96 2.85 2.54 ‐0.42 ‐0.16 0.27
ProtectiveServices 2.46 3.12 2.61 0.40 1.28 1.71
FoodPreparationandServing 8.99 9.76 9.10 0.95 1.12 0.73
BuildingandGroundsCleaning 3.24 3.31 2.89 ‐0.03 ‐0.07 ‐0.01
PersonalCareandService 3.01 4.55 3.39 0.95 1.10 2.44
SalesandRelated 10.61 9.70 10.81 ‐1.12 0.43 ‐1.83
OfficeandAdministrativeSupport 16.17 15.48 17.14 ‐2.10 2.69 ‐0.53
Farming,Fishing,Forestry 0.33 0.36 0.13 0.09 ‐0.26 1.49
ConstructionandExtraction 3.84 6.67 5.19 8.71 ‐0.20 1.18
Installation,Maintenance,Repair 3.88 3.97 4.32 1.22 0.29 ‐0.72
Production 6.61 3.82 6.09 ‐2.13 ‐0.86 ‐2.42
TransportationandMaterialMoving 6.79 5.57 6.96 1.47 0.53 ‐3.53NOTES: Shadingindicatesawagepremiumcomparedtofederalaverages.ValuesforAlamogordoareestimatesbasedonwagesforOtero
CountyandeasternNewMexico.Source: BureauofLaborStatistics,MetropolitanandNon‐metropolitanAreaOccupationalEmploymentandWageEstimates.
May2013.Foundatwww.bls.gov/Author’scalculations.
EXHIBIT3.7EMPLOYMENTCONCENTRATIONSINHIGH‐ANDLOW‐WAGEOCCUPATIONSFORTHEU.S.,NEWMEXICO,TEXASANDTHEJLUSREGION
Ranking
High‐wageoccupations
Low‐wageoccupations
Ranking %Jobs Ranking %Jobs
1 TX 26.94 JLUS 53.26
2 US 23.36 NM 51.58
3 JLUS 23.25 TX 48.24
4 NM 22.47 US 48.09Source: BureauofLaborStatistics,MetropolitanandNon‐metropolitanAreaOccupationalEmploymentandWageEstimates.
May2013.Foundatwww.bls.gov/Author’scalculations.
25
Onekeytomovinguptheoccupationalladderispreparationoftheworkforcethrougheducationandtraining.TheroleofeducationisapparentasshowninExhibit2.11,whichshowstheeducationalattainmentofthose25yearsandolderintheU.S.,NewMexico,TexasthesixJLUScountiesandtheSNM‐ElPasoregion.Lookingatthepercentageofthepopulationwithcollegetraining,forexample,wefindtheregionwellabovethenationalnormforindividualswithoutahighschooldiplomaandfallingshort‐‐evenwithinDoñaAnaCounty,whichhostsbothacommunitycollegeandalargelandgrantresearchuniversity‐‐inmeetingnationalaveragesforassociate,bachelorandgraduatedegrees.
Insomerespects,theSNM‐ElPasoregion’sinabilitytocapitalizeonitsassets–land,climate,costofliving,universitiesandmilitaryinfrastructure–rests,atleastinpart,withtherelativelypooreducationalachievementofitslaborforce.Fortheregion,occupationalwageandemploymentdata,combinedwithinformationoneducationalattainment,suggestthatbuildingamorehighlyeducatedandbettertrainedworkforcemaybeanimportantfactorinimprovingeconomicperformance.
3.5 EMPLOYMENTDIVERSITY
Employmentdiversityranksasanimportantfactorinevaluatingtheresilienceofalocaleconomy.Diversityemploymentmeasuresarequantitativetoolsusedforthispurpose.Themeasuresarebasedontheprinciplethatabroad‐basedeconomyisindicativeofastrongeconomy,onethatcanmoreeasilywithstanddownturnsoreconomicinsults.Severaldiversitymeasuresareavailable.OnemeasureistheShannon‐WeaverDiversityIndex.Itcanbefoundonlineormaybecalculatedassuch:
ln ]–[(S‐1)/2N]
Where:
= relativeabundanceofjobsinagivenindustry ,calculatedasthenumberofjobsinagivenindustrytothetotalnumberofjobsinthecommunity:
= numberofjobsinanindustry = totalnumberofalljobsinthecommunity
= totalnumberofallpossibleindustrysectors TheShannon‐WeavervalueiscalculatedhereforeachJLUScountyusing2012data:
ElPasoCounty = 0.68561DoñaAnaCounty = 0.67196LincolnCounty = 0.67160SierraCounty = 0.64041OteroCounty = 0.61140SocorroCounty = 0.56764
Usingthismethod,thecloseraneconomycomestoreachingfulldiversity,thecloseritsindexvaluewillbeto1.AmongtheJLUScounties,ElPaso’sShannon‐Weavervaluedemonstratesthegreatestdiversity.DoñaAnaandLincolncountiesfollowinsecondandthirdplace,whileOtero
26
andSocorrocountiesdemonstratethelowestdiversityinemployment.OfthesixJLUScounties,Otero,withthethirdhighestnumberofjobs,demonstratesthesecondlowestemploymentdiversityscore.Thiscombinationofstrongjobnumbersandweakemploymentdiversitydemonstratesaneconomyespeciallyvulnerabletodownturnsorchange.
4.0 METHODOLOGY
AnimportantobjectiveofthisreportistoprovideJLUSpartners,themilitaryandlocalofficialswithestimatesoftheeconomicimpactsfromemploymentandspendingattheregion’sthreemilitaryinstallations:FortBliss,HollomanAFB,andWhiteSandsMissileRange.Toaccomplishthis,theauthorschosethemethodofInput‐Output(I/O)analysistomodelthemilitary’simpactsonjobs,incomesandindustryoutput.UsingI/Oanalysis,thereportmodelstheimpactsforeachJLUScountyindividuallyandthenaggregatesthedatatodetermineoverallimpactsontheregion.Ineachcase,themodelusesmultipliersandassignsjobimpactsbasedonthecountyinwhichaworkerresides,ratherthanthecountyofemployment.
4.1 DATACOLLECTION
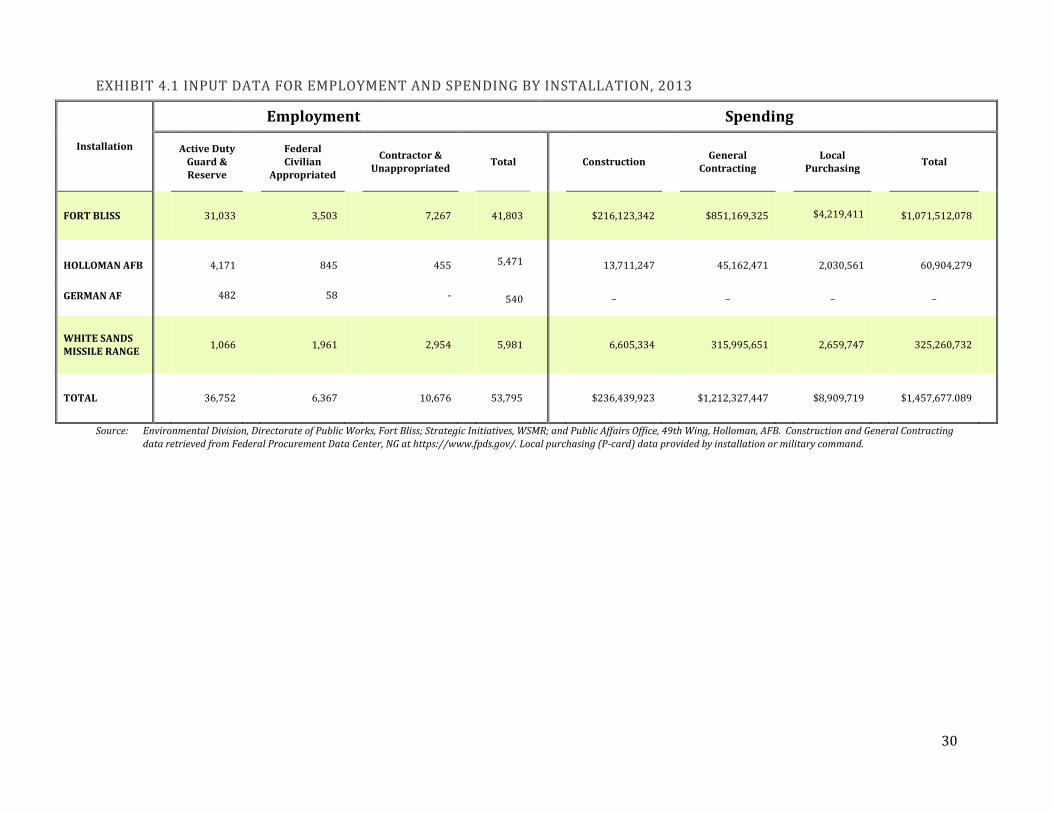
Exhibit4.1providesbaselineemploymentandspendingdata(inputs)providedbyeachinstallation.TheanalysisisconductedusingfederalFiscalYear(FY)2013data,whichwasfoundtobethemostcurrentacrossallinstallationsandagencies.Allthreemilitaryinstallationsparticipatedindatacollection,andanumberofindividualsateachinstallationweretappedtogatherinformationonemployment,localpurchasing,militaryconstructionandcontractspending.TheAECOMteamextendsitssincereappreciationtothemanyofficialswhohelpedwiththiseffort.
Includedhereisalistofofficialsbyinstallationwhoservedaspointsofcontactfordatacollection:
BrianD.Knight,RPAConservationBranch,EnvironmentalDivisionDirectorateofPublicWorksFortBliss,Texas79916MarietteJ.MealorBusinessDevelopmentSpecialistWhiteSandsMissileRange,NM88002Capt.StephanieL.SchonbergerChiefofPublicAffairs49thWingHollomanAFB,NM88330
27
4.2 MILITARYINSTALLATIONS
FORTBLISS
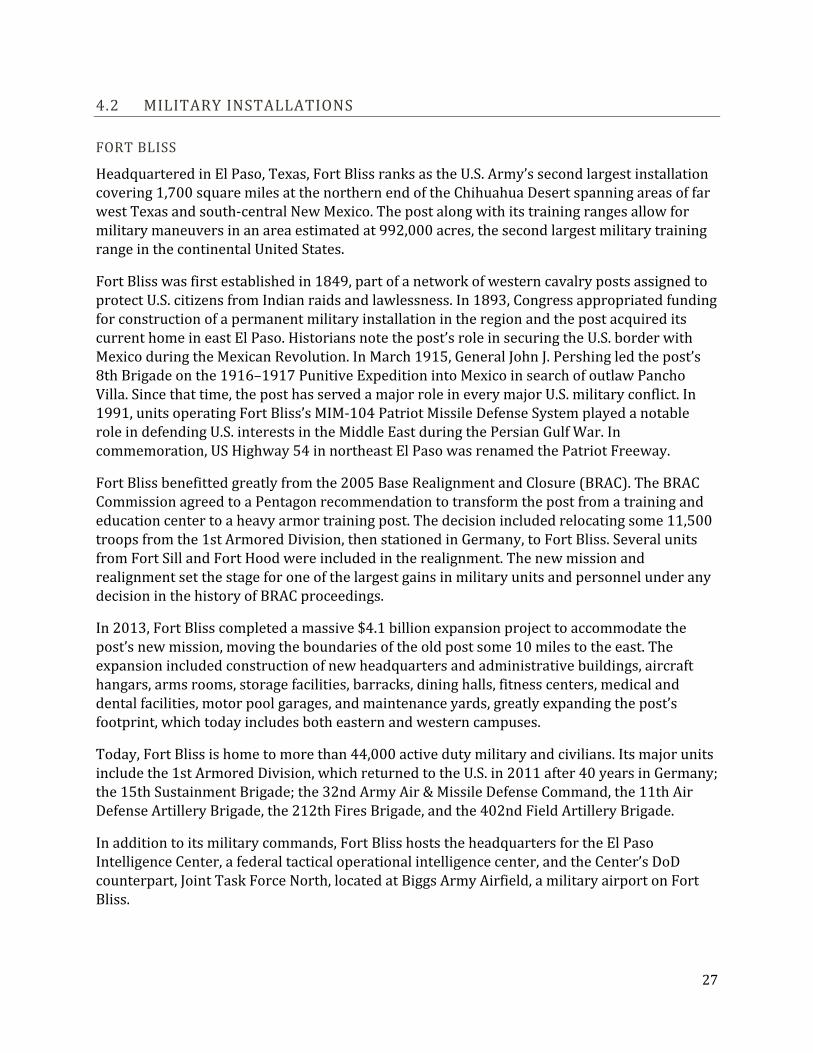
HeadquarteredinElPaso,Texas,FortBlissranksastheU.S.Army’ssecondlargestinstallationcovering1,700squaremilesatthenorthernendoftheChihuahuaDesertspanningareasoffarwestTexasandsouth‐centralNewMexico.Thepostalongwithitstrainingrangesallowformilitarymaneuversinanareaestimatedat992,000acres,thesecondlargestmilitarytrainingrangeinthecontinentalUnitedStates.
FortBlisswasfirstestablishedin1849,partofanetworkofwesterncavalrypostsassignedtoprotectU.S.citizensfromIndianraidsandlawlessness.In1893,CongressappropriatedfundingforconstructionofapermanentmilitaryinstallationintheregionandthepostacquireditscurrenthomeineastElPaso.Historiansnotethepost’sroleinsecuringtheU.S.borderwithMexicoduringtheMexicanRevolution.InMarch1915,GeneralJohnJ.Pershingledthepost’s8thBrigadeonthe1916–1917PunitiveExpeditionintoMexicoinsearchofoutlawPanchoVilla.Sincethattime,theposthasservedamajorroleineverymajorU.S.militaryconflict.In1991,unitsoperatingFortBliss’sMIM‐104PatriotMissileDefenseSystemplayedanotableroleindefendingU.S.interestsintheMiddleEastduringthePersianGulfWar.Incommemoration,USHighway54innortheastElPasowasrenamedthePatriotFreeway.
FortBlissbenefittedgreatlyfromthe2005BaseRealignmentandClosure(BRAC).TheBRACCommissionagreedtoaPentagonrecommendationtotransformthepostfromatrainingandeducationcentertoaheavyarmortrainingpost.Thedecisionincludedrelocatingsome11,500troopsfromthe1stArmoredDivision,thenstationedinGermany,toFortBliss.SeveralunitsfromFortSillandFortHoodwereincludedintherealignment.ThenewmissionandrealignmentsetthestageforoneofthelargestgainsinmilitaryunitsandpersonnelunderanydecisioninthehistoryofBRACproceedings.
In2013,FortBlisscompletedamassive$4.1billionexpansionprojecttoaccommodatethepost’snewmission,movingtheboundariesoftheoldpostsome10milestotheeast.Theexpansionincludedconstructionofnewheadquartersandadministrativebuildings,aircrafthangars,armsrooms,storagefacilities,barracks,dininghalls,fitnesscenters,medicalanddentalfacilities,motorpoolgarages,andmaintenanceyards,greatlyexpandingthepost’sfootprint,whichtodayincludesbotheasternandwesterncampuses.
Today,FortBlissishometomorethan44,000activedutymilitaryandcivilians.Itsmajorunitsincludethe1stArmoredDivision,whichreturnedtotheU.S.in2011after40yearsinGermany;the15thSustainmentBrigade;the32ndArmyAir&MissileDefenseCommand,the11thAirDefenseArtilleryBrigade,the212thFiresBrigade,andthe402ndFieldArtilleryBrigade.
Inadditiontoitsmilitarycommands,FortBlisshoststheheadquartersfortheElPasoIntelligenceCenter,afederaltacticaloperationalintelligencecenter,andtheCenter’sDoDcounterpart,JointTaskForceNorth,locatedatBiggsArmyAirfield,amilitaryairportonFortBliss.

28
HOLLOMANAFB
OnMarch11,2014,acrowdof300localsupportersandahostofpoliticaldignitariesgatheredatHollomanAFBtowelcomeitsnewtenant,the54thFighterGroup,anF‐16trainingunit.Theceremonywasawistfulevent,precipitatedbythelossofHolloman’sF‐22advancedfighterjets,whichhadmovedtoFloridaunderanearlierAirForcefleetconsolidationplan.Today,localofficialsremainoptimisticaboutchangesattheairbase.Withitsnewtenant,HollomanwillsoonacquiretwosquadronsofF‐16’sandbegintrainingnewpilotsandsupportpersonnel,anetgaininaircraftandpersonnelatthebase.
HollomanAFBwasestablishedin1942asAlamogordoAirField.InitialplansfortheairfieldcalledfordevelopmentofacenterfortheBritishOverseasTrainingProgram.TheBritishhopedtotraintheirWWIIaircrewsovertheopenNewMexicoskies.Thoseplanschanged,however,whentheJapaneselaunchedasurpriseattackonPearlHarboronDecember7,1941.TheBritishdecidednottopursueanoverseastrainingprogram,andtheUnitedStatessawthelocationasidealfortrainingitsowngrowingmilitary.
Foryears,Hollomanhasservedashometothenation’smostadvancedfighteraircraft.In1992,Hollomanbeganhostingthenation’sfleetoffamedF‐177ANighthawk“Stealth”fighters,theproductofLockheed’ssecretSkunkWorksprogram.TheremarkableF117swereforyearsblockedfrompublicview,butin1988wereunveiledtothepublicandservedinvariousrolesonbehalfofthenation’sdefense.Morerecently,HollomanservedashometotwosquadronsofF‐22Raptors,anaircraftuniqueindeliveringbothfighterandstrategicbombingcapabilities.AdvancedaircraftarenottheonlyfeatureuniquetoHolloman.Thebaseisalsohometothelongest(50,788feet,oralmost10miles)andfastest(approaching10,000feetpersecond,orMach9)testtrackintheworld.The846thTestSquadronsettheworldlandspeedrecordatHollomanforarailedvehiclewitharunof6,453mph,orMach8.5.
Theairbasefillsanotherrole,servingashosttotheGermanAirForceTacticalTrainingCenter.GermanaircrewsarriveatHollomanforapproximatelythreeweeksforadvancedtacticaltrainingandthenreturntoGermany.TheGermanAirForcealsoconductsaFighterWeaponsInstructorCourseforthePanaviaTornadoaircraft.AircrewsforthiscoursetrainatHollomanforaboutsixmonths.InMarch2013,theGermanAirForceannouncedthetransferofGermanAirForceunitsfromFortBlisstoHolloman.Today,morethan500GermanAirForcemembersarepermanentlyassignedtotheairbase.
MajorunitsatHollomanincludetheremaining49thWing,whichtrainsground‐basedpilotsandsensoroperatorsfortheunmannedMQ‐1PredatorandMQ‐9Reaperaircraft;the96thTestGroup;theGermanAirForceTacticalTrainingCenterandassociateunits,andthenewlyactivated54thFighterGroup,aunitofthe56thFighterWingheadquarteredinArizona.
WHITESANDSMISSILERANGE
WhiteSandsProvingGroundswasestablishedinJuly1945intheTularosaBasinofsouth‐centralNewMexico,acombinationofanexistingfiringrange,theAlamogordoBombingRangeandlargetractsofprivateandpubliclands.Almost3,200squaremilesinsize,theRangeisspeckledtodaywiththeabandonedranchhousesandwindmillsofanearliertime.Therealso
29
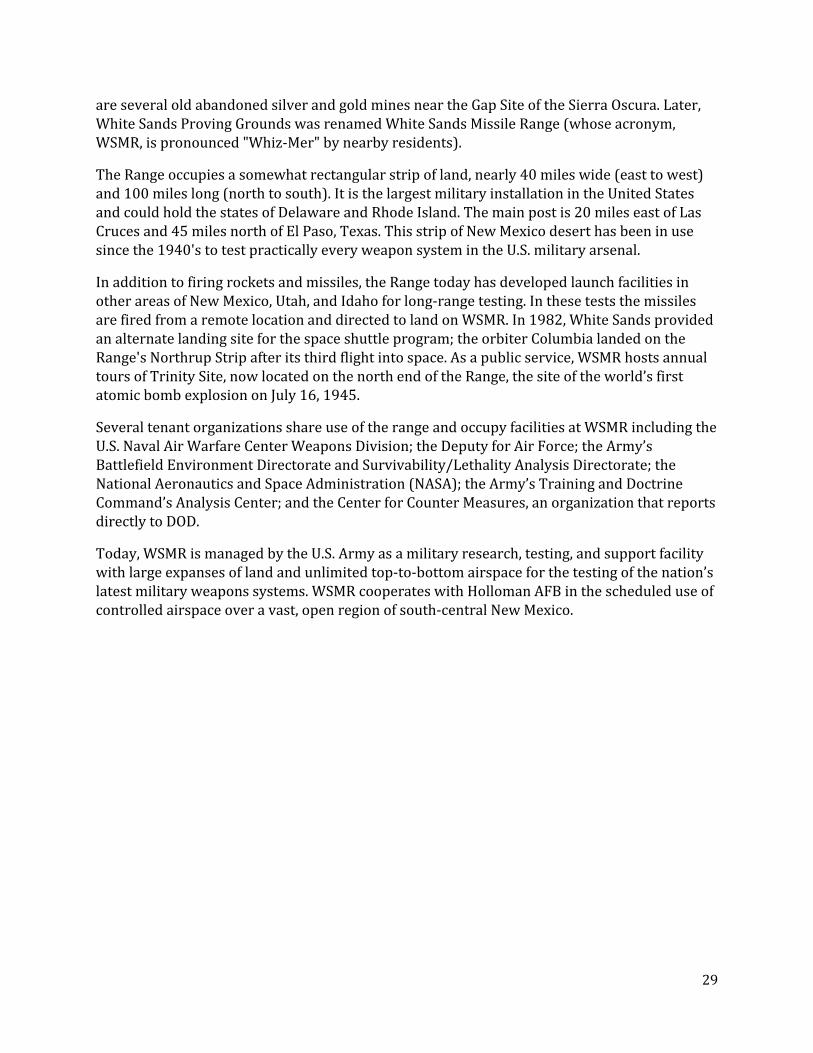
areseveraloldabandonedsilverandgoldminesneartheGapSiteoftheSierraOscura.Later,WhiteSandsProvingGroundswasrenamedWhiteSandsMissileRange(whoseacronym,WSMR,ispronounced"Whiz‐Mer"bynearbyresidents).
TheRangeoccupiesasomewhatrectangularstripofland,nearly40mileswide(easttowest)and100mileslong(northtosouth).ItisthelargestmilitaryinstallationintheUnitedStatesandcouldholdthestatesofDelawareandRhodeIsland.Themainpostis20mileseastofLasCrucesand45milesnorthofElPaso,Texas.ThisstripofNewMexicodeserthasbeeninusesincethe1940'stotestpracticallyeveryweaponsystemintheU.S.militaryarsenal.
Inadditiontofiringrocketsandmissiles,theRangetodayhasdevelopedlaunchfacilitiesinotherareasofNewMexico,Utah,andIdahoforlong‐rangetesting.IntheseteststhemissilesarefiredfromaremotelocationanddirectedtolandonWSMR.In1982,WhiteSandsprovidedanalternatelandingsiteforthespaceshuttleprogram;theorbiterColumbialandedontheRange'sNorthrupStripafteritsthirdflightintospace.Asapublicservice,WSMRhostsannualtoursofTrinitySite,nowlocatedonthenorthendoftheRange,thesiteoftheworld’sfirstatomicbombexplosiononJuly16,1945.
SeveraltenantorganizationsshareuseoftherangeandoccupyfacilitiesatWSMRincludingtheU.S.NavalAirWarfareCenterWeaponsDivision;theDeputyforAirForce;theArmy’sBattlefieldEnvironmentDirectorateandSurvivability/LethalityAnalysisDirectorate;theNationalAeronauticsandSpaceAdministration(NASA);theArmy’sTrainingandDoctrineCommand’sAnalysisCenter;andtheCenterforCounterMeasures,anorganizationthatreportsdirectlytoDOD.
Today,WSMRismanagedbytheU.S.Armyasamilitaryresearch,testing,andsupportfacilitywithlargeexpansesoflandandunlimitedtop‐to‐bottomairspaceforthetestingofthenation’slatestmilitaryweaponssystems.WSMRcooperateswithHollomanAFBinthescheduleduseofcontrolledairspaceoveravast,openregionofsouth‐centralNewMexico.
30
EXHIBIT4.1INPUTDATAFOREMPLOYMENTANDSPENDINGBYINSTALLATION,2013
Source: EnvironmentalDivision,DirectorateofPublicWorks,FortBliss;StrategicInitiatives,WSMR;andPublicAffairsOffice,49thWing,Holloman,AFB.ConstructionandGeneralContractingdataretrievedfromFederalProcurementDataCenter,NGathttps://www.fpds.gov/.Localpurchasing(P‐card)dataprovidedbyinstallationormilitarycommand.
Installation
Employment Spending
ActiveDutyGuard&Reserve
FederalCivilian
Appropriated
Contractor&Unappropriated
Total
Construction General
Contracting
LocalPurchasing
Total
FORTBLISS 31,033 3,503 7,267 41,803 $216,123,342 $851,169,325 $4,219,411 $1,071,512,078
HOLLOMANAFB 4,171 845 455 5,471
13,711,247 45,162,471 2,030,561
60,904,279
GERMANAF 482 58 ‐ 540 _ _ _ _
WHITESANDSMISSILERANGE 1,066 1,961 2,954 5,981
6,605,334 315,995,651 2,659,747
325,260,732
TOTAL 36,752 6,367 10,676 53,795 $236,439,923 $1,212,327,447 $8,909,719 $1,457,677.089
31
4.3 DATAANALYSIS
Input‐Output(I/O)analysisisascientificallyreliablemethodformeasuringtheeconomicconsequencesofchangesinemploymentorspending.Themethodisusedheretodeterminetheimpactsonemployment(jobs),laborincome(salariesandwages),andtotalindustryoutput(valueofmaterials,services,laborandinter‐industrydependencies)onthesix‐countySNM‐ElPasoregionandindividuallywithineachofthesixcounties.
TheequationforI/Omodelingcanbewrittenas:
∆ ∆
Where:
∆ Changeintotalemployment,laborincomeorindustryoutput
Multiplier,basedoninterdependencecoefficients(I‐a)
∆ Changeinemploymentorspendingatmilitaryinstallation
InformationontheindustrylinkageswithFortBliss,HollomanandWSMRisobtainedfromtheIMPLAN3.1.1001database,amodelingprogramusedtoestimatetheimpactofchangesinemploymentandspendingin440industrysectorsnationwide.AnolderversionoftheIMPLANsoftwarewasusedbyDODanditsmilitaryservicesforimpactestimationsduringthe2005BRACprocess.
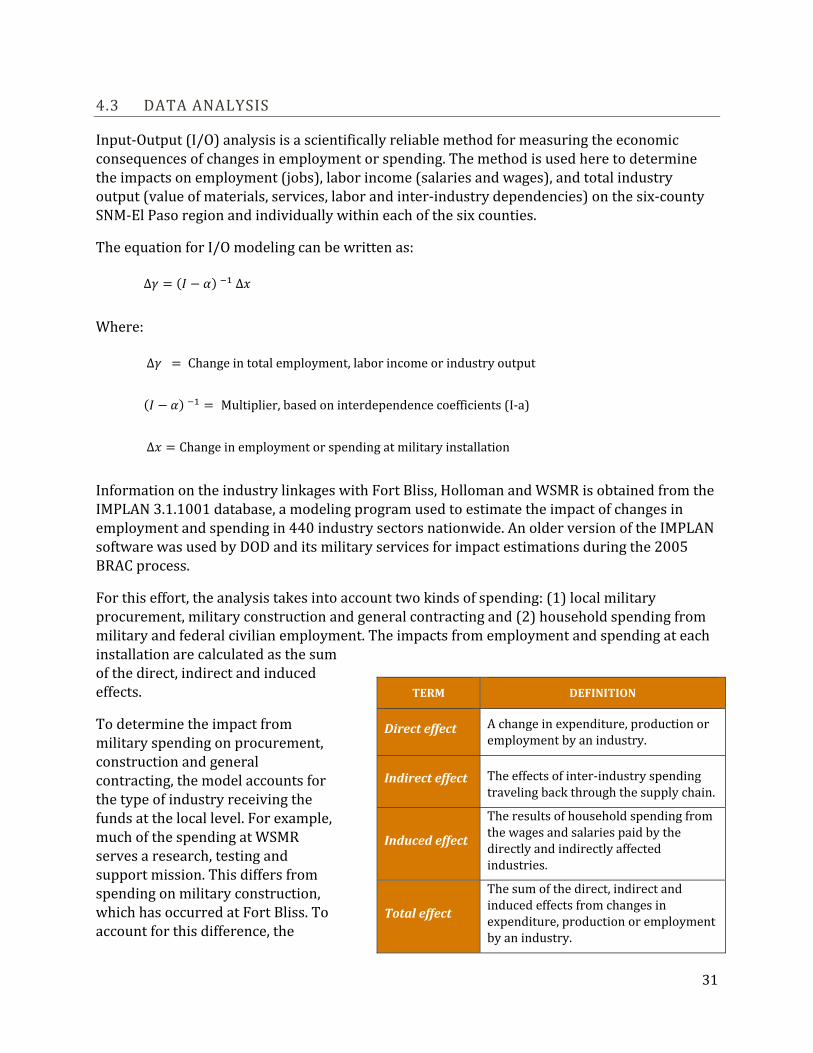
Forthiseffort,theanalysistakesintoaccounttwokindsofspending:(1)localmilitaryprocurement,militaryconstructionandgeneralcontractingand(2)householdspendingfrommilitaryandfederalcivilianemployment.Theimpactsfromemploymentandspendingateachinstallationarecalculatedasthesumofthedirect,indirectandinducedeffects.
Todeterminetheimpactfrommilitaryspendingonprocurement,constructionandgeneralcontracting,themodelaccountsforthetypeofindustryreceivingthefundsatthelocallevel.Forexample,muchofthespendingatWSMRservesaresearch,testingandsupportmission.Thisdiffersfromspendingonmilitaryconstruction,whichhasoccurredatFortBliss.Toaccountforthisdifference,the
TERM DEFINITION
Directeffect Achangeinexpenditure,productionoremploymentbyanindustry.
Indirecteffect Theeffectsofinter‐industryspendingtravelingbackthroughthesupplychain.
Inducedeffect
Theresultsofhouseholdspendingfromthewagesandsalariespaidbythedirectlyandindirectlyaffectedindustries.
Totaleffect
Thesumofthedirect,indirectandinducedeffectsfromchangesinexpenditure,productionoremploymentbyanindustry.
32
IMPLANdatabaseprovidesseparateindustriessectorsfor“ScientificResearchandDevelopment”(376)and“Non‐residentialConstruction”(36).
Forthisanalysis,militaryjobsaremodeledusingthemilitaryindustry(440)sectorasaproxy.Federalcivilianemploymentismodeledaspartoftheregion’sfederalgovernmentsector(439).ToaccountforperiodsofmilitarydeploymenttoAfghanistanandelsewhere,anadjustmentfactorof0.85isusedonhouseholdspendingforactivedutymilitary,astandardpercentageforstudiesofthistype.
Themodelestimateseconomicimpactor,fromanotherperspective,thegain(orloss)totheregionshouldlocalmilitaryemploymentorspendingbeincreased(orreduced).Themodeldoesnotpredicttheexpansionorreductionofaninstallationoramilitarytenantorganization.
AwordhereaboutI/Omodeling:Nosingleanalyticaltechniqueisperfectforallpurposes.Assuch,thefollowingstatementsdescribesomeassumptionsofI/Omodelingthatshouldbetakenintoaccountwheninterpretingtheresultsofthisanalysis:
Impactsarecalculatedasnumericallylinearandproportionaltochangesinspending; Eachindustryisassumedtohaveunlimitedaccesstothematerialsnecessaryforits
productionatpricescurrentlychargedforthosematerials; Changesintheeconomyareassumedtoaffectanindustry’soutputbutwillnotalterthe
mixofmaterialsandservicesthatarerequiredtomakeanindustry’sproducts;and Eachindustryistreatedasifitprovidesasingleprimaryormainproduct,andallother
productsofthatindustryareviewedasbyproducts.
4.4 IMPACTANALYSISANDMULTIPLIERS
Impactanalysisinvolvestheuseofmultipliers[the intheearlierequation]toestimatethedirect,indirectandinducedimpactsofachangeinspendingonaregionaleconomy.Thepremiseunderlyingthemultipliermethodisthatoneindividual’sspendingtranslatesintoanotherperson’sincome.Aninitialinjectionoffundsintoaneconomystimulatestherecipienttospend.Thespendingbecomesincomeforanother.Thesecondrecipientwillspendsomeofthatincome,whichbecomesathirdrecipient’sincome,andsoon.Inmostcases,notalloftheinitialinjectionoffundswillstayinthelocaleconomy.Someincomewillbesaved;somewillbepaidintaxes;andsomewillbespentongoodsandservicesoutsideofthelocalarea.
Asarule,thesizeofacommunity’smultiplierisafunctionofthelocaleconomy’spropensitytoimportfromoutsidethearea,theinclinationofindividualstosaveandtheamountoftaxespaid.Forthecurrentstudy,hundredsofmultipliersarecalculatedspecifictotheSNM‐ElPasoregion,eachoftheregion’ssixcountiesandforeachoftheregion’sactiveindustrialsectors.
33
Anexampleofemploymentmultipliersusedinthestudy:4
Constructionofnon‐residentialstructures 1.578077Engineeringservices 1.682023Environmentalconsulting 1.644253Securityservices 1.664822Scientificresearch&development 1.669689
5.0 FINDINGS
ThissectionshowsestimatedimpactsfromemploymentandspendingatFortBliss,HollomanAFBandWSMRbyregion,installationandcounty.Impactsareidentifiedforemployment,laborincomeandtotalindustryoutput.Employmentisdefinedasthenumberoffull‐andpart‐timeannualaveragejobsforemployeesandself‐employedindividuals.Seasonalworkersarecountedbasedondurationofemployment.Forexample,if12constructionworkerseachworkedsixmonths,theywouldaccountforsixannualfulltimeequivalentjobs.Laborincomeiscalculatedasthesumofwagesandbenefitspaidtoemployeesplustheprofitsearnedbyself‐employedworkers.Industryoutputiscalculatedhereasthedollarvalueofproductionofallindustriesimpactedbyregionalmilitaryemploymentandspending.
Totalimpactsarepresentedasapercentage(fifthcolumnineachtable)oftheircontributiontotheregion’stotaleconomy.
5.1 REGIONALESTIMATES
Regionalestimatesidentifyimpactsforthesix‐countyregionfrommilitaryemploymentandspendingatallthreeinstallations.Thesummarydatarepresentthelargestdollarvaluesandjobimpactsinthisreport.
4Normally,two‐andthree‐digitmultipliersareadequateforpresentingtheresultsofI/Oanalysis.However,moreprecisemultiplierswererequiredforthisanalysistomodeleffectivelythelargeabsolutevaluesassociatedwithregionalmilitaryspending.
34
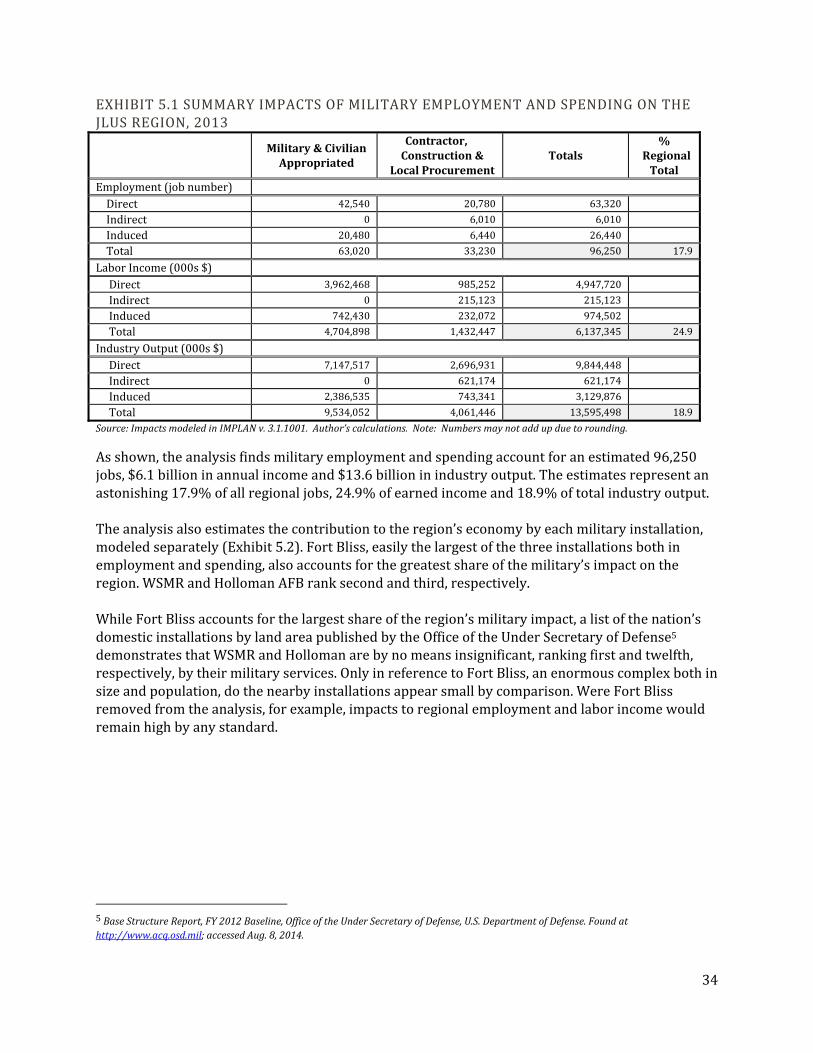
EXHIBIT5.1SUMMARYIMPACTSOFMILITARYEMPLOYMENTANDSPENDINGONTHEJLUSREGION,2013
Military&CivilianAppropriated
Contractor,Construction&
LocalProcurementTotals
%RegionalTotal
Employment(jobnumber)Direct 42,540 20,780 63,320
Indirect 0 6,010 6,010
Induced 20,480 6,440 26,440
Total 63,020 33,230 96,250 17.9
LaborIncome(000s$)
Direct 3,962,468 985,252 4,947,720
Indirect 0 215,123 215,123
Induced 742,430 232,072 974,502
Total 4,704,898 1,432,447 6,137,345 24.9
IndustryOutput(000s$)
Direct 7,147,517 2,696,931 9,844,448
Indirect 0 621,174 621,174
Induced 2,386,535 743,341 3,129,876
Total 9,534,052 4,061,446 13,595,498 18.9
Source:ImpactsmodeledinIMPLANv.3.1.1001.Author’scalculations.Note:Numbersmaynotaddupduetorounding.Asshown,theanalysisfindsmilitaryemploymentandspendingaccountforanestimated96,250jobs,$6.1billioninannualincomeand$13.6billioninindustryoutput.Theestimatesrepresentanastonishing17.9%ofallregionaljobs,24.9%ofearnedincomeand18.9%oftotalindustryoutput.Theanalysisalsoestimatesthecontributiontotheregion’seconomybyeachmilitaryinstallation,modeledseparately(Exhibit5.2).FortBliss,easilythelargestofthethreeinstallationsbothinemploymentandspending,alsoaccountsforthegreatestshareofthemilitary’simpactontheregion.WSMRandHollomanAFBranksecondandthird,respectively.WhileFortBlissaccountsforthelargestshareoftheregion’smilitaryimpact,alistofthenation’sdomesticinstallationsbylandareapublishedbytheOfficeoftheUnderSecretaryofDefense5demonstratesthatWSMRandHollomanarebynomeansinsignificant,rankingfirstandtwelfth,respectively,bytheirmilitaryservices.OnlyinreferencetoFortBliss,anenormouscomplexbothinsizeandpopulation,dothenearbyinstallationsappearsmallbycomparison.WereFortBlissremovedfromtheanalysis,forexample,impactstoregionalemploymentandlaborincomewouldremainhighbyanystandard.
5BaseStructureReport,FY2012Baseline,OfficeoftheUnderSecretaryofDefense,U.S.DepartmentofDefense.Foundathttp://www.acq.osd.mil;accessedAug.8,2014.
35
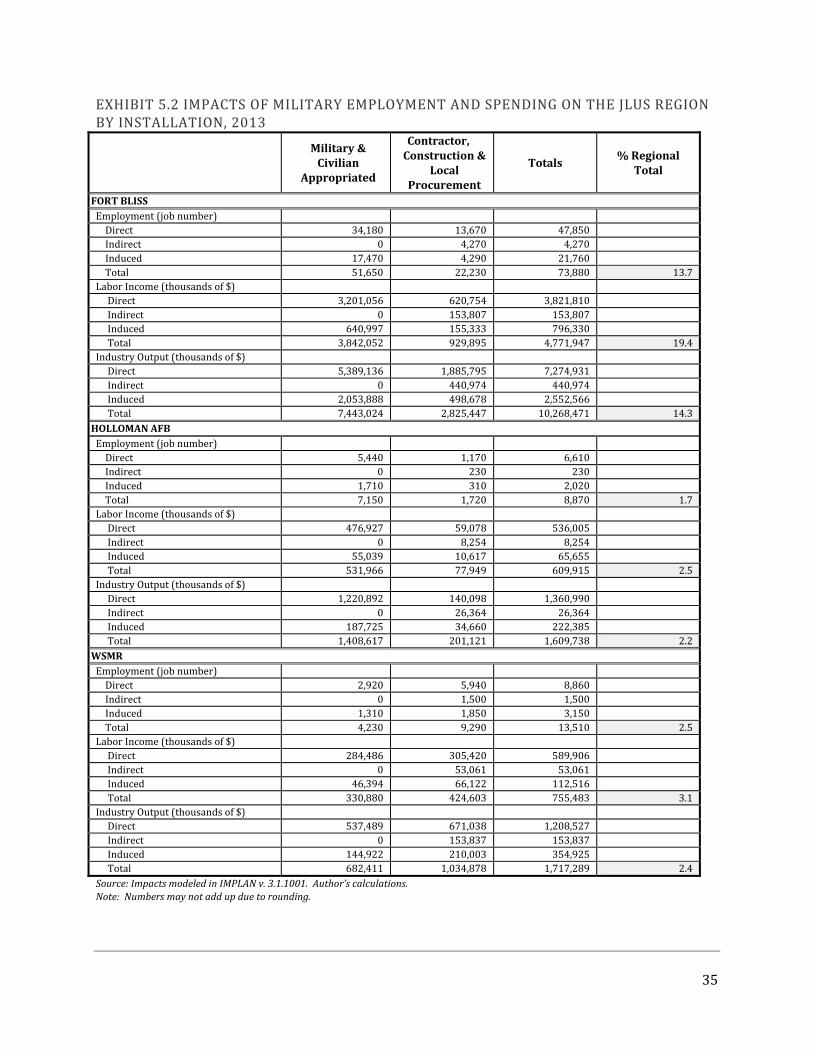
EXHIBIT5.2IMPACTSOFMILITARYEMPLOYMENTANDSPENDINGONTHEJLUSREGIONBYINSTALLATION,2013
Military&Civilian
Appropriated
Contractor,Construction&
LocalProcurement
Totals%Regional
Total
FORTBLISSEmployment(jobnumber) Direct 34,180 13,670 47,850 Indirect 0 4,270 4,270 Induced 17,470 4,290 21,760 Total 51,650 22,230 73,880 13.7LaborIncome(thousandsof$) Direct 3,201,056 620,754 3,821,810 Indirect 0 153,807 153,807 Induced 640,997 155,333 796,330 Total 3,842,052 929,895 4,771,947 19.4IndustryOutput(thousandsof$) Direct 5,389,136 1,885,795 7,274,931 Indirect 0 440,974 440,974 Induced 2,053,888 498,678 2,552,566 Total 7,443,024 2,825,447 10,268,471 14.3HOLLOMANAFBEmployment(jobnumber) Direct 5,440 1,170 6,610 Indirect 0 230 230 Induced 1,710 310 2,020 Total 7,150 1,720 8,870 1.7LaborIncome(thousandsof$) Direct 476,927 59,078 536,005 Indirect 0 8,254 8,254 Induced 55,039 10,617 65,655 Total 531,966 77,949 609,915 2.5IndustryOutput(thousandsof$) Direct 1,220,892 140,098 1,360,990 Indirect 0 26,364 26,364 Induced 187,725 34,660 222,385 Total 1,408,617 201,121 1,609,738 2.2WSMREmployment(jobnumber) Direct 2,920 5,940 8,860 Indirect 0 1,500 1,500 Induced 1,310 1,850 3,150 Total 4,230 9,290 13,510 2.5LaborIncome(thousandsof$) Direct 284,486 305,420 589,906 Indirect 0 53,061 53,061 Induced 46,394 66,122 112,516 Total 330,880 424,603 755,483 3.1IndustryOutput(thousandsof$) Direct 537,489 671,038 1,208,527 Indirect 0 153,837 153,837 Induced 144,922 210,003 354,925 Total 682,411 1,034,878 1,717,289 2.4Source:ImpactsmodeledinIMPLANv.3.1.1001.Author’scalculations.Note:Numbersmaynotaddupduetorounding.
36
5.2 COUNTYESTIMATES
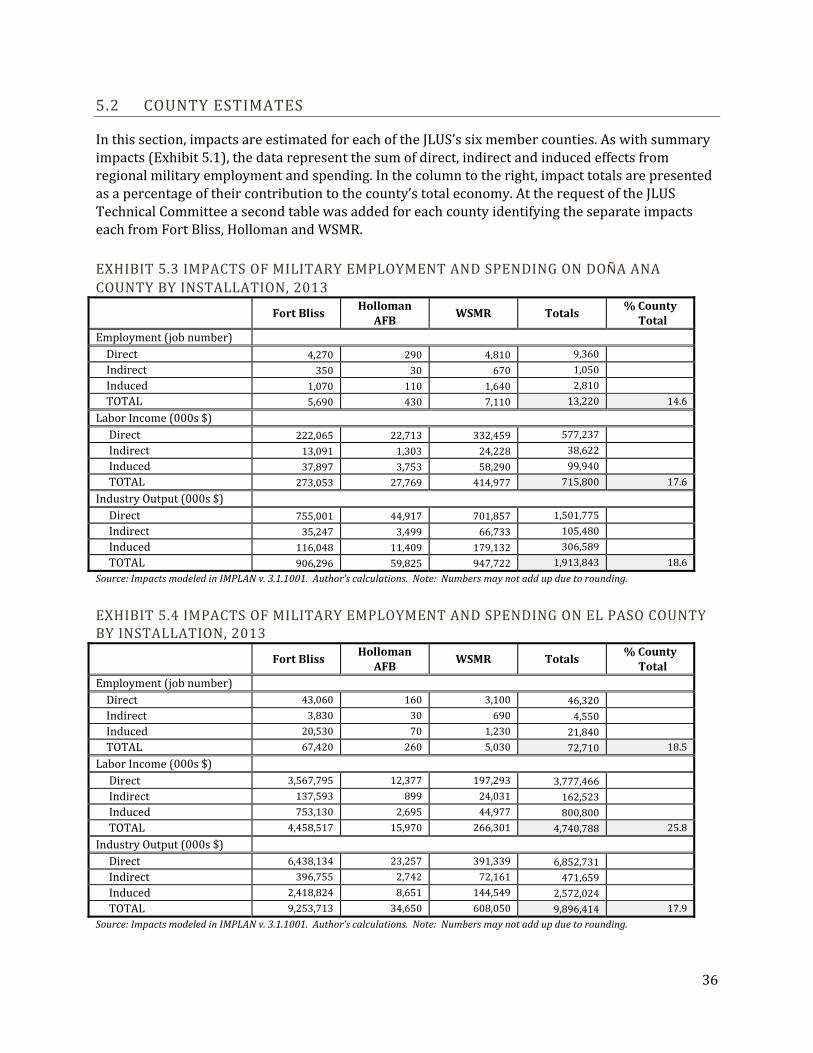
Inthissection,impactsareestimatedforeachoftheJLUS’ssixmembercounties.Aswithsummaryimpacts(Exhibit5.1),thedatarepresentthesumofdirect,indirectandinducedeffectsfromregionalmilitaryemploymentandspending.Inthecolumntotheright,impacttotalsarepresentedasapercentageoftheircontributiontothecounty’stotaleconomy.AttherequestoftheJLUSTechnicalCommitteeasecondtablewasaddedforeachcountyidentifyingtheseparateimpactseachfromFortBliss,HollomanandWSMR.
EXHIBIT5.3IMPACTSOFMILITARYEMPLOYMENTANDSPENDINGONDOÑAANACOUNTYBYINSTALLATION,2013
FortBliss
HollomanAFB
WSMR Totals%CountyTotal
Employment(jobnumber)Direct 4,270 290 4,810 9,360
Indirect 350 30 670 1,050
Induced 1,070 110 1,640 2,810
TOTAL 5,690 430 7,110 13,220 14.6
LaborIncome(000s$)
Direct 222,065 22,713 332,459 577,237
Indirect 13,091 1,303 24,228 38,622
Induced 37,897 3,753 58,290 99,940
TOTAL 273,053 27,769 414,977 715,800 17.6
IndustryOutput(000s$)
Direct 755,001 44,917 701,857 1,501,775
Indirect 35,247 3,499 66,733 105,480
Induced 116,048 11,409 179,132 306,589
TOTAL 906,296 59,825 947,722 1,913,843 18.6
Source:ImpactsmodeledinIMPLANv.3.1.1001.Author’scalculations.Note:Numbersmaynotaddupduetorounding.
EXHIBIT5.4IMPACTSOFMILITARYEMPLOYMENTANDSPENDINGONELPASOCOUNTYBYINSTALLATION,2013
FortBliss
HollomanAFB
WSMR Totals%CountyTotal
Employment(jobnumber)Direct 43,060 160 3,100 46,320
Indirect 3,830 30 690 4,550
Induced 20,530 70 1,230 21,840
TOTAL 67,420 260 5,030 72,710 18.5
LaborIncome(000s$)
Direct 3,567,795 12,377 197,293 3,777,466
Indirect 137,593 899 24,031 162,523
Induced 753,130 2,695 44,977 800,800
TOTAL 4,458,517 15,970 266,301 4,740,788 25.8
IndustryOutput(000s$)
Direct 6,438,134 23,257 391,339 6,852,731
Indirect 396,755 2,742 72,161 471,659
Induced 2,418,824 8,651 144,549 2,572,024
TOTAL 9,253,713 34,650 608,050 9,896,414 17.9
Source:ImpactsmodeledinIMPLANv.3.1.1001.Author’scalculations.Note:Numbersmaynotaddupduetorounding.
37
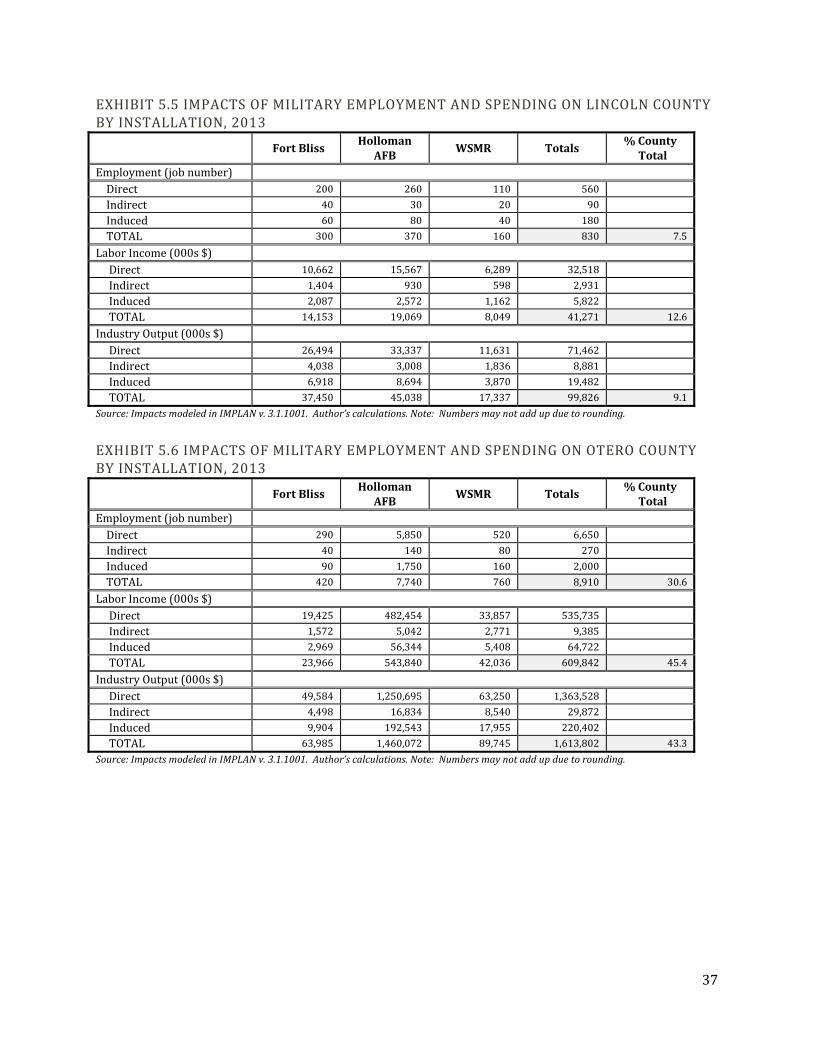
EXHIBIT5.5IMPACTSOFMILITARYEMPLOYMENTANDSPENDINGONLINCOLNCOUNTYBYINSTALLATION,2013
FortBliss
HollomanAFB
WSMR Totals%CountyTotal
Employment(jobnumber)Direct 200 260 110 560
Indirect 40 30 20 90
Induced 60 80 40 180
TOTAL 300 370 160 830 7.5
LaborIncome(000s$)
Direct 10,662 15,567 6,289 32,518
Indirect 1,404 930 598 2,931
Induced 2,087 2,572 1,162 5,822
TOTAL 14,153 19,069 8,049 41,271 12.6
IndustryOutput(000s$)
Direct 26,494 33,337 11,631 71,462
Indirect 4,038 3,008 1,836 8,881
Induced 6,918 8,694 3,870 19,482
TOTAL 37,450 45,038 17,337 99,826 9.1
Source:ImpactsmodeledinIMPLANv.3.1.1001.Author’scalculations.Note:Numbersmaynotaddupduetorounding.
EXHIBIT5.6IMPACTSOFMILITARYEMPLOYMENTANDSPENDINGONOTEROCOUNTYBYINSTALLATION,2013
FortBliss
HollomanAFB
WSMR Totals%CountyTotal
Employment(jobnumber)Direct 290 5,850 520 6,650
Indirect 40 140 80 270
Induced 90 1,750 160 2,000
TOTAL 420 7,740 760 8,910 30.6
LaborIncome(000s$)
Direct 19,425 482,454 33,857 535,735
Indirect 1,572 5,042 2,771 9,385
Induced 2,969 56,344 5,408 64,722
TOTAL 23,966 543,840 42,036 609,842 45.4
IndustryOutput(000s$)
Direct 49,584 1,250,695 63,250 1,363,528
Indirect 4,498 16,834 8,540 29,872
Induced 9,904 192,543 17,955 220,402
TOTAL 63,985 1,460,072 89,745 1,613,802 43.3
Source:ImpactsmodeledinIMPLANv.3.1.1001.Author’scalculations.Note:Numbersmaynotaddupduetorounding.
38
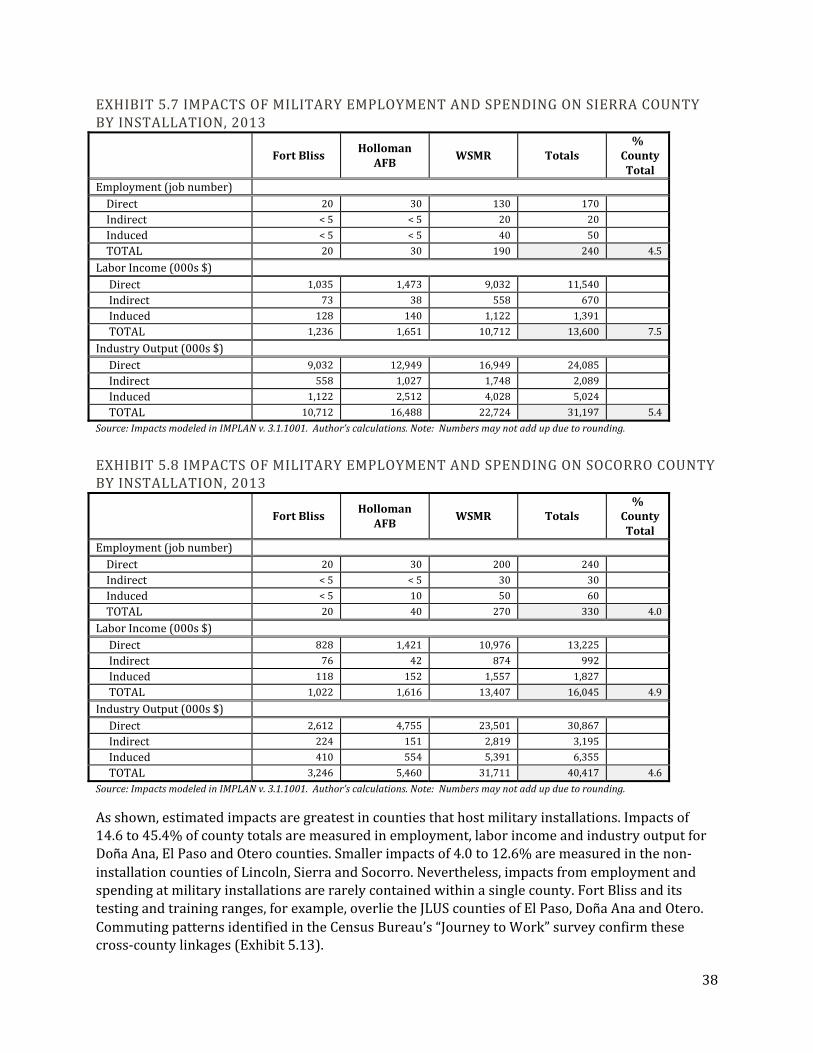
EXHIBIT5.7IMPACTSOFMILITARYEMPLOYMENTANDSPENDINGONSIERRACOUNTYBYINSTALLATION,2013
FortBliss
HollomanAFB
WSMR Totals%
CountyTotal
Employment(jobnumber)Direct 20 30 130 170
Indirect <5 <5 20 20
Induced <5 <5 40 50
TOTAL 20 30 190 240 4.5
LaborIncome(000s$)
Direct 1,035 1,473 9,032 11,540
Indirect 73 38 558 670
Induced 128 140 1,122 1,391
TOTAL 1,236 1,651 10,712 13,600 7.5
IndustryOutput(000s$)
Direct 9,032 12,949 16,949 24,085
Indirect 558 1,027 1,748 2,089
Induced 1,122 2,512 4,028 5,024
TOTAL 10,712 16,488 22,724 31,197 5.4
Source:ImpactsmodeledinIMPLANv.3.1.1001.Author’scalculations.Note:Numbersmaynotaddupduetorounding.
EXHIBIT5.8IMPACTSOFMILITARYEMPLOYMENTANDSPENDINGONSOCORROCOUNTYBYINSTALLATION,2013
FortBliss
HollomanAFB
WSMR Totals%
CountyTotal
Employment(jobnumber)Direct 20 30 200 240
Indirect <5 <5 30 30
Induced <5 10 50 60
TOTAL 20 40 270 330 4.0
LaborIncome(000s$)
Direct 828 1,421 10,976 13,225
Indirect 76 42 874 992
Induced 118 152 1,557 1,827
TOTAL 1,022 1,616 13,407 16,045 4.9
IndustryOutput(000s$)
Direct 2,612 4,755 23,501 30,867
Indirect 224 151 2,819 3,195
Induced 410 554 5,391 6,355
TOTAL 3,246 5,460 31,711 40,417 4.6
Source:ImpactsmodeledinIMPLANv.3.1.1001.Author’scalculations.Note:Numbersmaynotaddupduetorounding.
Asshown,estimatedimpactsaregreatestincountiesthathostmilitaryinstallations.Impactsof14.6to45.4%ofcountytotalsaremeasuredinemployment,laborincomeandindustryoutputforDoñaAna,ElPasoandOterocounties.Smallerimpactsof4.0to12.6%aremeasuredinthenon‐installationcountiesofLincoln,SierraandSocorro.Nevertheless,impactsfromemploymentandspendingatmilitaryinstallationsarerarelycontainedwithinasinglecounty.FortBlissanditstestingandtrainingranges,forexample,overlietheJLUScountiesofElPaso,DoñaAnaandOtero.CommutingpatternsidentifiedintheCensusBureau’s“JourneytoWork”surveyconfirmthesecross‐countylinkages(Exhibit5.13).
39
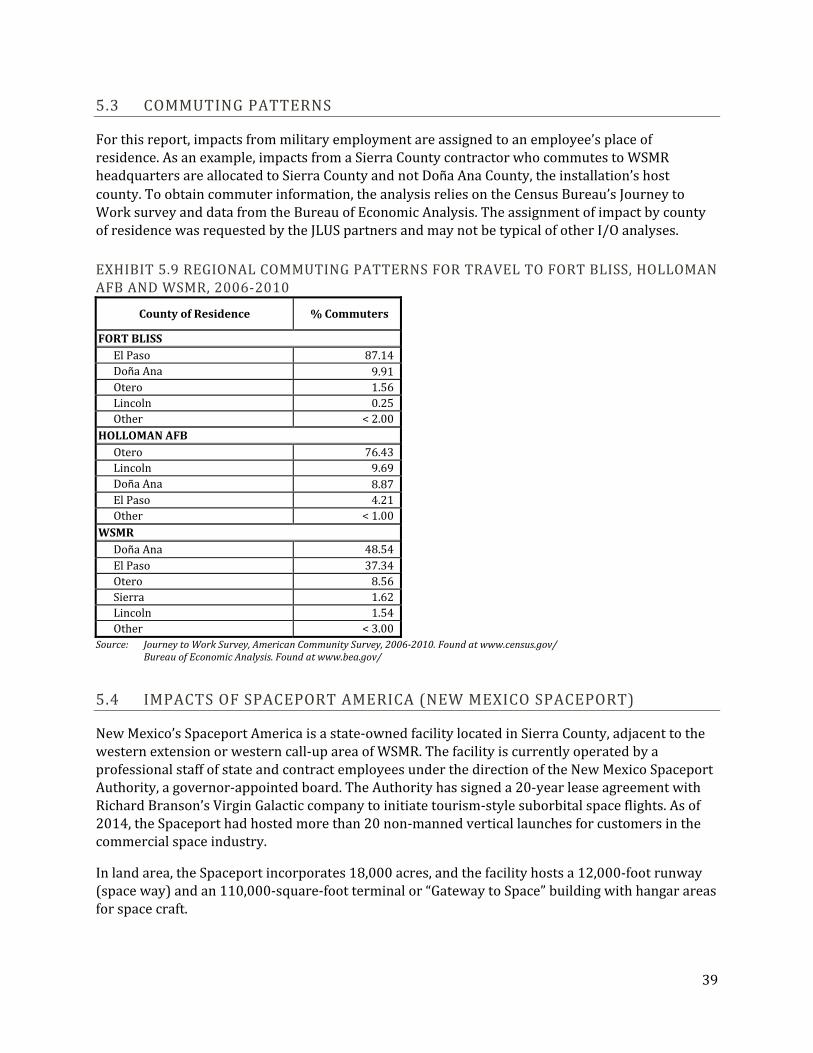
5.3 COMMUTINGPATTERNS
Forthisreport,impactsfrommilitaryemploymentareassignedtoanemployee’splaceofresidence.Asanexample,impactsfromaSierraCountycontractorwhocommutestoWSMRheadquartersareallocatedtoSierraCountyandnotDoñaAnaCounty,theinstallation’shostcounty.Toobtaincommuterinformation,theanalysisreliesontheCensusBureau’sJourneytoWorksurveyanddatafromtheBureauofEconomicAnalysis.TheassignmentofimpactbycountyofresidencewasrequestedbytheJLUSpartnersandmaynotbetypicalofotherI/Oanalyses.
EXHIBIT5.9REGIONALCOMMUTINGPATTERNSFORTRAVELTOFORTBLISS,HOLLOMANAFBANDWSMR,2006‐2010
CountyofResidence %Commuters
FORTBLISSElPaso 87.14DoñaAna 9.91Otero 1.56Lincoln 0.25Other < 2.00HOLLOMANAFBOtero 76.43Lincoln 9.69DoñaAna 8.87ElPaso 4.21Other <1.00WSMRDoñaAna 48.54ElPaso 37.34Otero 8.56Sierra 1.62Lincoln 1.54Other <3.00
Source: JourneytoWorkSurvey,AmericanCommunitySurvey,2006‐2010.Foundatwww.census.gov/BureauofEconomicAnalysis.Foundatwww.bea.gov/
5.4 IMPACTSOFSPACEPORTAMERICA(NEWMEXICOSPACEPORT)
NewMexico’sSpaceportAmericaisastate‐ownedfacilitylocatedinSierraCounty,adjacenttothewesternextensionorwesterncall‐upareaofWSMR.ThefacilityiscurrentlyoperatedbyaprofessionalstaffofstateandcontractemployeesunderthedirectionoftheNewMexicoSpaceportAuthority,agovernor‐appointedboard.TheAuthorityhassigneda20‐yearleaseagreementwithRichardBranson’sVirginGalacticcompanytoinitiatetourism‐stylesuborbitalspaceflights.Asof2014,theSpaceporthadhostedmorethan20non‐mannedverticallaunchesforcustomersinthecommercialspaceindustry.
Inlandarea,theSpaceportincorporates18,000acres,andthefacilityhostsa12,000‐footrunway(spaceway)andan110,000‐square‐footterminalor“GatewaytoSpace”buildingwithhangarareasforspacecraft.
40
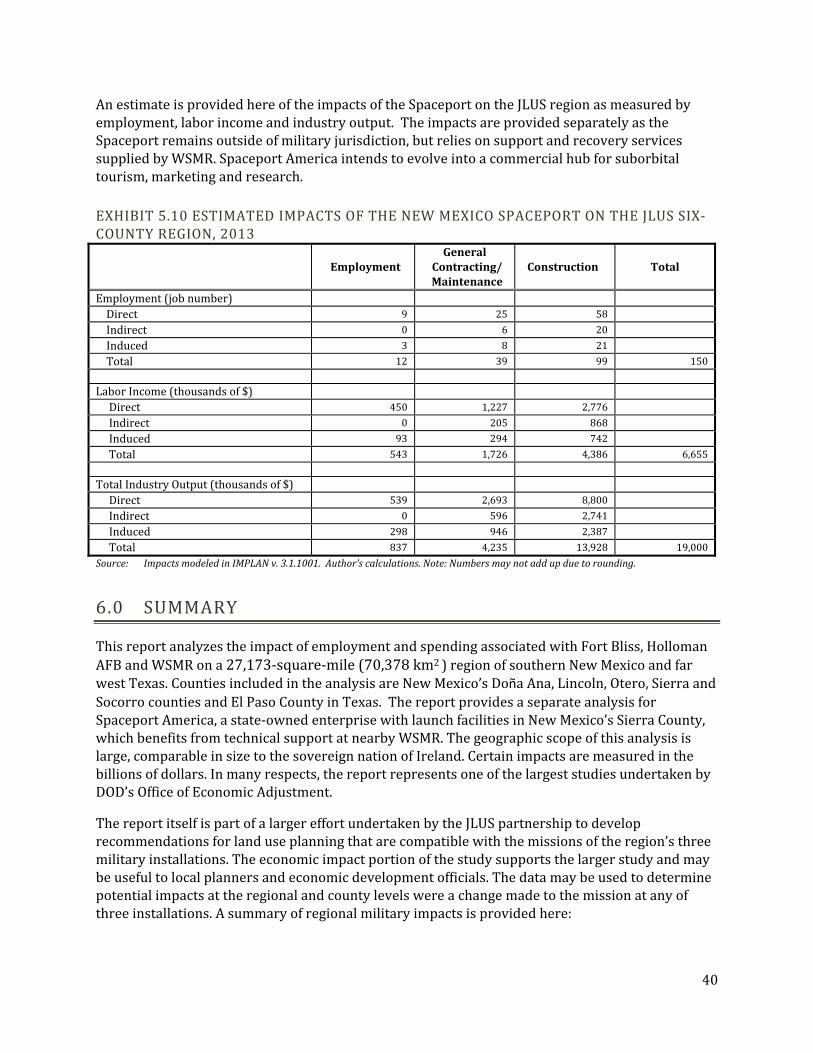
AnestimateisprovidedhereoftheimpactsoftheSpaceportontheJLUSregionasmeasuredbyemployment,laborincomeandindustryoutput.TheimpactsareprovidedseparatelyastheSpaceportremainsoutsideofmilitaryjurisdiction,butreliesonsupportandrecoveryservicessuppliedbyWSMR.SpaceportAmericaintendstoevolveintoacommercialhubforsuborbitaltourism,marketingandresearch.
EXHIBIT5.10ESTIMATEDIMPACTSOFTHENEWMEXICOSPACEPORTONTHEJLUSSIX‐COUNTYREGION,2013
EmploymentGeneral
Contracting/Maintenance
Construction Total
Employment(jobnumber)
Direct 9 25 58
Indirect 0 6 20
Induced 3 8 21
Total 12 39 99 150
LaborIncome(thousandsof$)
Direct 450 1,227 2,776
Indirect 0 205 868
Induced 93 294 742
Total 543 1,726 4,386 6,655
TotalIndustryOutput(thousandsof$)
Direct 539 2,693 8,800
Indirect 0 596 2,741
Induced 298 946 2,387
Total 837 4,235 13,928 19,000
Source: ImpactsmodeledinIMPLANv.3.1.1001.Author’scalculations.Note:Numbersmaynotaddupduetorounding.
6.0 SUMMARY
ThisreportanalyzestheimpactofemploymentandspendingassociatedwithFortBliss,HollomanAFBandWSMRona27,173‐square‐mile(70,378km2)regionofsouthernNewMexicoandfarwestTexas.CountiesincludedintheanalysisareNewMexico’sDoñaAna,Lincoln,Otero,SierraandSocorrocountiesandElPasoCountyinTexas.ThereportprovidesaseparateanalysisforSpaceportAmerica,astate‐ownedenterprisewithlaunchfacilitiesinNewMexico’sSierraCounty,whichbenefitsfromtechnicalsupportatnearbyWSMR.Thegeographicscopeofthisanalysisislarge,comparableinsizetothesovereignnationofIreland.Certainimpactsaremeasuredinthebillionsofdollars.Inmanyrespects,thereportrepresentsoneofthelargeststudiesundertakenbyDOD’sOfficeofEconomicAdjustment.
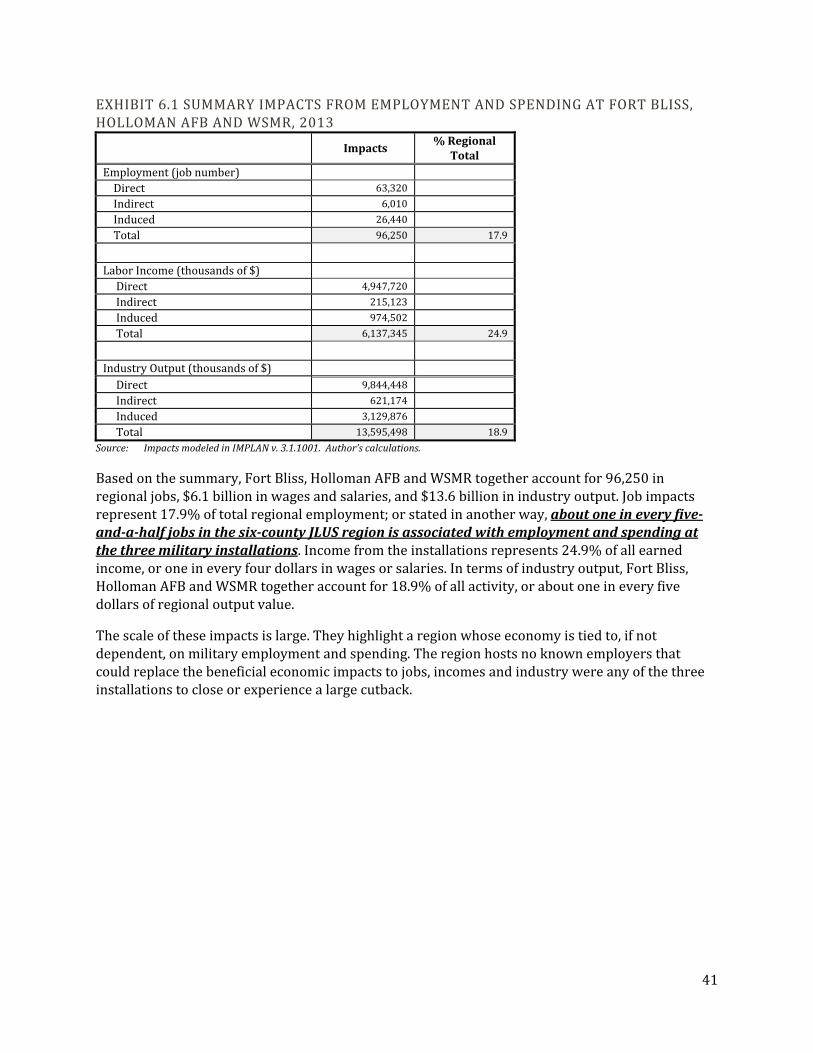
ThereportitselfispartofalargereffortundertakenbytheJLUSpartnershiptodeveloprecommendationsforlanduseplanningthatarecompatiblewiththemissionsoftheregion’sthreemilitaryinstallations.Theeconomicimpactportionofthestudysupportsthelargerstudyandmaybeusefultolocalplannersandeconomicdevelopmentofficials.Thedatamaybeusedtodeterminepotentialimpactsattheregionalandcountylevelswereachangemadetothemissionatanyofthreeinstallations.Asummaryofregionalmilitaryimpactsisprovidedhere:
41
EXHIBIT6.1SUMMARYIMPACTSFROMEMPLOYMENTANDSPENDINGATFORTBLISS,HOLLOMANAFBANDWSMR,2013
Impacts%Regional
TotalEmployment(jobnumber)Direct 63,320
Indirect 6,010
Induced 26,440
Total 96,250 17.9
LaborIncome(thousandsof$)Direct 4,947,720
Indirect 215,123
Induced 974,502
Total 6,137,345 24.9
IndustryOutput(thousandsof$)
Direct 9,844,448
Indirect 621,174
Induced 3,129,876
Total 13,595,498 18.9
Source: ImpactsmodeledinIMPLANv.3.1.1001.Author’scalculations. Basedonthesummary,FortBliss,HollomanAFBandWSMRtogetheraccountfor96,250inregionaljobs,$6.1billioninwagesandsalaries,and$13.6billioninindustryoutput.Jobimpactsrepresent17.9%oftotalregionalemployment;orstatedinanotherway,aboutoneineveryfive‐and‐a‐halfjobsinthesix‐countyJLUSregionisassociatedwithemploymentandspendingatthethreemilitaryinstallations.Incomefromtheinstallationsrepresents24.9%ofallearnedincome,oroneineveryfourdollarsinwagesorsalaries.Intermsofindustryoutput,FortBliss,HollomanAFBandWSMRtogetheraccountfor18.9%ofallactivity,oraboutoneineveryfivedollarsofregionaloutputvalue.
Thescaleoftheseimpactsislarge.Theyhighlightaregionwhoseeconomyistiedto,ifnotdependent,onmilitaryemploymentandspending.Theregionhostsnoknownemployersthatcouldreplacethebeneficialeconomicimpactstojobs,incomesandindustrywereanyofthethreeinstallationstocloseorexperiencealargecutback.