Embed Size (px)
Citation preview
nutrients
Article
Impact of Genetic Polymorphisms on the Metabolic Pathwayof Vitamin D and Survival in Non-Small Cell Lung Cancer
Laura Elena Pineda Lancheros 1 , Cristina Pérez Ramírez 1,2,*, Almudena Sánchez Martín 1,José María Gálvez Navas 1,2 , Fernando Martínez Martínez 3, María del Carmen Ramírez Tortosa 2
and Alberto Jiménez Morales 1
�����������������
Citation: Pineda Lancheros, L.E.;
Pérez Ramírez, C.; Sánchez Martín,
A.; Gálvez Navas, J.M.; Martínez
Martínez, F.; Ramírez Tortosa, M.d.C.;
Jiménez Morales, A. Impact of
Genetic Polymorphisms on the
Metabolic Pathway of Vitamin D and
Survival in Non-Small Cell Lung
Cancer. Nutrients 2021, 13, 3783.
https://doi.org/10.3390/nu13113783
Academic Editor: Carsten Carlberg
Received: 23 September 2021
Accepted: 21 October 2021
Published: 25 October 2021
Publisher’s Note: MDPI stays neutral
with regard to jurisdictional claims in
published maps and institutional affil-
iations.
Copyright: © 2021 by the authors.
Licensee MDPI, Basel, Switzerland.
This article is an open access article
distributed under the terms and
conditions of the Creative Commons
Attribution (CC BY) license (https://
creativecommons.org/licenses/by/
4.0/).
1 Pharmacy Service, Pharmacogenetics Unit, University Hospital Virgen de las Nieves, 18014 Granada, Spain;[email protected] (L.E.P.L.); [email protected] (A.S.M.); [email protected] (J.M.G.N.);[email protected] (A.J.M.)
2 Center of Biomedical Research, Department of Biochemistry and Molecular Biology II, Institute of Nutritionand Food Technology “José Mataix”, University of Granada, Avda. del Conocimiento s/n.,18016 Granada, Spain; [email protected]
3 Department of Pharmacy and Pharmaceutical Technology, Social and Legal Assistance Pharmacy Section,Faculty of Pharmacy, University of Granada, 18071 Granada, Spain; [email protected]
* Correspondence: [email protected]
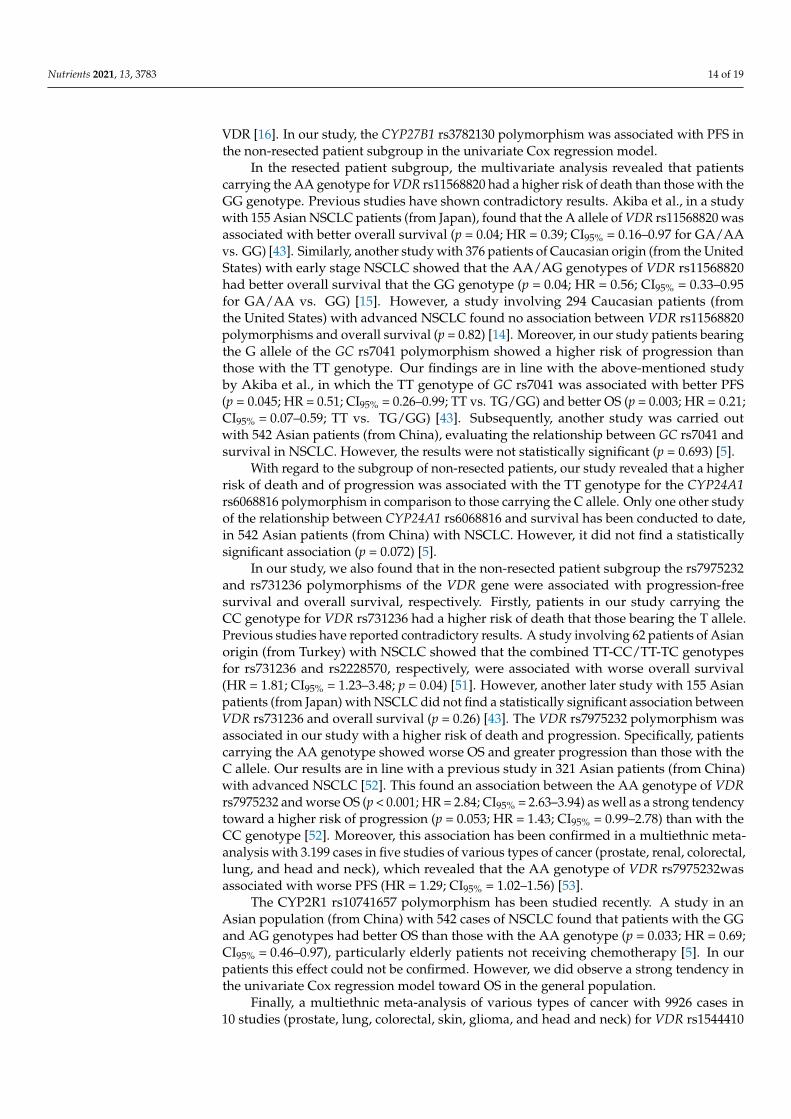
Abstract: Vitamin D has been associated with risk, development, and progression of cancer. However,the genes involved in its metabolism are highly polymorphic, compromising its activity. The aim ofthis study is to evaluate the association between the gene polymorphisms involved in the metabolicpathway of vitamin D and survival in patients with non-small-cell lung cancer (NSCLC). The studywas designed as an observational cohort which included 194 Caucasians patients from southern Spainwith NSCLC. Real-time polymerase chain reaction was used to analyze the following polymorphisms:CYP27B1 rs4646536, rs3782130, and rs10877012; CYP24A1 rs6068816 and rs4809957; GC rs7041;CYP2R1 rs10741657; VDR rs1544410 (BsmI), rs11568820 (Cdx-2), rs2228570 (FokI), rs7975232 (ApaI),and rs731236 (TaqI). Progression-free survival (PFS) and overall survival were assessed. Cox regres-sion showed that rs4646536 was associated with PFS in the general population (p = 0.0233) and in thenon-resected NSCLC subgroup (p = 0.0233). In the resected NSCLC subgroup, rs11568820 was associ-ated with OS (p = 0.0129) and rs7041 with PFS (p = 0.0447). In the non-resected NSCLC subgroup,rs6068816 was associated with PFS (p = 0.0048) and OS (p = 0.0089) and rs731236 and rs7975232were associated with OS (p = 0.0005) and PFS (p = 0.0002), respectively. The other polymorphismsshowed no effect on the results. The rs4646536, rs6068816, rs7041, rs11568820, rs731236, and rs7975232polymorphisms are associated with survival in NSCLC and may have a substantial role as prognosticmarkers of the disease.
Keywords: vitamin D metabolism; survival; non-small-cell lung cancer; single nucleotide polymor-phisms; CYP27B1; CYP24A1; CYP2R1; GC; VDR
1. Introduction
Lung cancer is the second most commonly diagnosed type of cancer, after breastcancer, with a global incidence of around 11.4% [1]. It represents the leading cause ofcancer death worldwide (18.0%) [1]. According to the latest cancer statistics, it is estimatedthat there will be more than 235,760 new cases and 131,880 deaths in the United States in2021 [2].
Non-small-cell lung cancer (NSCLC) represents around 80–85% of all lung cancers [3].Survival of lung cancer patients 5 years after diagnosis is between 10% and 20% in mostcountries, even after surgery, chemotherapy, and radiotherapy [4]. There is therefore a needto look for new prognostic biomarkers that will improve survival in these patients [5].The main factor influencing disease prognosis is the initial tumor stage [6–8]. However,
Nutrients 2021, 13, 3783. https://doi.org/10.3390/nu13113783 https://www.mdpi.com/journal/nutrients
Nutrients 2021, 13, 3783 2 of 19
studies in patients diagnosed with the same stage have shown variability in survival, whichsuggests that other factors may influence the prognosis of NSCLC [9–12]. It should beemphasized that genetic alterations such as single nucleotide polymorphisms (SNPs) maybe the cause of this interindividual variability in survival of patients with NSCLC [5,13–15].
Vitamin D is notable for its wide-ranging biological functions, which involve, amongother things, suppressing metastasis by inhibiting tumor progression, angiogenesis, and cellproliferation, or by apoptosis promotion in cancer cells [5,16–20]. In lung cancer, specifically,in vivo and in vitro studies have been carried out, showing that 1,25-dihydroxycholecalciferolinhibits growth of lung cancerous cell lines and affects cell cycle regulation in squamouscell carcinoma models [21–23]. In mouse models, calcitriol proved to inhibit growth oflung tumors and metastases [24,25]. Furthermore, observational studies have found thatlung cancer mortality is lower during the autumn and summer months, the times of yearassociated with the highest vitamin D levels [26,27]. Risk, development, and growth ofsolid and non-solid tumors have been associated with vitamin D low levels [19].
Vitamin D has two basic isoforms: vitamin D2 (ergocalciferol) and vitamin D3 (chole-calciferol). Both are produced endogenously following sun exposure and by direct con-sumption through diet or supplements [27–30]. The two isoforms of vitamin D (D2 and D3)bind to the vitamin D binding protein (VDBP), encoded by the group-specific component(vitamin D binding protein) gene (GC), facilitating their transport [29,31–33]. Both formsare subsequently metabolized in the liver to 25-hydroxycholecalciferol, by 25-hydroxylases(encoded by CYP2R1 and CYP27A1), this being its main circulating form [29,31,34,35]; 1α-hydroxylase (encoded by CYP27B1) converts it to 1,25-dihydroxycholecalciferol, either inthe kidney (where it is released into circulation) or in specific target organs, converting it toits biologically active form [16,27–29,31]. In the target tissues, 1,25-dihydroxycholecalciferolbinds to the vitamin D receptor (VDR) and interacts with the retinoid X receptor (RXR),forming a heterodimer complex (VDR-RXR), which is translocated to the nucleus, bind-ing to the VDR response elements in numerous genomic loci, some of which have an-ticancer properties [16,31,36,37]. Finally, circulating 1,25-dihydroxycholecalciferol and25-hydroxycholecalciferol are degraded by 24-hydroxylase (encoded by CYP24A1) to cal-citroic acid and other hydrosoluble products which are inactive and are excreted in bile orurine [27,29,31,36].
The genes that encode the enzymes involved in the vitamin D pathway are highlypolymorphic [27]. These genetic alterations may influence the expression of those genes inlung tumor tissue, modifying the activity of vitamin D [15,28,36,38–41]. Therefore, theymay play a vital part in the development, progression, and prognosis of NSCLC [5]. In thiscontext, polymorphisms in the genes that mediate the metabolic pathway of vitamin D(CYP27B1, CYP24A1, CYP2R1, GC, and VDR) may have a crucial role in the survival ofpatients with NSCLC [5,14,15,31,42,43].
On the basis of the foregoing, this study was design to evaluate the association ofSNP-type polymorphisms in the genes implicated in the vitamin D metabolic pathwaywith progression-free survival (PFS) and overall survival (OS) in Caucasian patients (fromSpain) with NSCLC.
2. Materials and Methods2.1. Study Design
A prospective observational cohort study was carried out.
2.2. Ethics Statement
This study was conducted with the approvement of the Ethics and Research Commit-tee of the Sistema Andaluz de Salud (Andalusian Health Service) (SAS) and in accordancewith the Declaration of Helsinki (code: 1322-N-20). A written informed consent formwas signed by the patients for collection of saliva or blood samples and its further do-nation to the biobank. The confidentiality of the sample treatment was ensured throughtheir codification.
Nutrients 2021, 13, 3783 3 of 19
2.3. Study Population
The study included 194 patients of Caucasian origin from southern Spain with NSCLC,recruited in the Hospital Universitario Virgen de las Nieves, Granada, Spain, diagnosedbetween 2003 and 2019 and followed up until December 2020. The inclusion criteria forthe patient group were age 18 years or over, confirmed histologic or cytologic diagnosis ofNSCLC (stages I-IV), adequate organ function, measurable disease on computed tomogra-phy, with no previous treatment and available clinical data. The patients were treated inaccordance with the National Comprehensive Cancer Network (NCCN) guidelines [44].
2.4. Sociodemographic and Clinical Variables
From the clinical records we collected sociodemographic information, including familyhistory of cancer, gender, smoking status, previous lung disease, drinking status, body massindex (BMI), and age at diagnosis. Individuals were classified as active smokers if theyhad smoked 100 or more cigarettes in their lives and currently smoked, as ex-smokers ifthey had smoked 100 or more cigarettes in their lives but did not currently smoke, and asnon-smokers if they had never smoked or had smoked fewer than 100 cigarettes in theirlives. Individuals were classified by standard drink units (SDUs) as non-drinkers if theywere teetotalers or did not consume alcohol regularly, as active drinkers if their alcoholconsumption was greater than 4 SDUs per day in men and greater than 2.5 SDUs perday in women, and as ex-drinkers if their alcohol consumption was greater than 4 SDUsper day in men and greater than 2.5 SDUs per day in women, but they did not currentlydrink [45]. Histopathologic data (tumor histology and stage) and first-line treatment werealso collected. The guidelines of the AJCC staging system criteria were followed in thetumor classification [46].
2.5. Genetic Variables2.5.1. DNA Isolation
The DNA samples, isolated from saliva or blood, were obtained from the Biobankof the Hospital Universitario Virgen de las Nieves, which is part of the SAS Biobank.BD FalconTM 50 mL conical tubes were used in saliva samples collection (BD, Plymouth,UK). BD Vacutainer® tubes with anticoagulant were (3 mL of EDTA K3) were used inblood samples collection. QIAamp DNA Mini kit (Qiagen GmbH, Hilden, Germany)were used in the DNA extraction performance, following the specifications provided bythe manufacturer for purification of DNA from saliva or blood, and stored at −40 ◦C.The concentration and purity of the DNA were assessed using a NanoDrop 2000™ UVspectrophotometer with 280/260 and 280/230 absorbance ratios.
2.5.2. Detection of Gene Polymorphisms
We determined the gene polymorphisms by real-time PCR allelic discrimination assayusing TaqMan® probes (ABI Applied Biosystems, QuantStudio 3 Real-Time PCR System),following the manufacturer’s instructions (Table 1).
Table 1. Gene polymorphisms and TaqMan® ID.
Gene dbSNP ID Assay ID
VDR
rs1544410 (BsmI) AN324M4 *rs11568820 (Cdx-2) C___2880808_10
rs2228570 (FokI) C__12060045_20rs7975232 (ApaI) C__28977635_10rs731236 (TaqI) C___2404008_10
CYP27B1rs4646536 C__25623453_10rs3782130 ANGZRHH *rs10877012 C__26237740_10
Nutrients 2021, 13, 3783 4 of 19
Table 1. Cont.
Gene dbSNP ID Assay ID
CYP24A1rs6068816 C__25620091_20rs4809957 C___3120981_20
GC rs7041 C___3133594_30CYP2R1 rs10741657 C___2958430_10
* The polymorphisms were analyzed using custom assays by ThermoFisher Scientific (Waltham, MA, USA).
2.6. Survival Variables
PFS and OS were used in survival measurement.Survival was measured by PFS and OS. We evaluated OS as the time from cancer
diagnosis to death or final follow-up and calculated PFS as the time from start of treatmentto last known follow-up, death, or relapse. The mortality data were obtained from theclinical histories and the Granada population-based cancer registry.
2.7. Statistical Analysis
The quantitative data were expressed as the mean (plus/minus standard deviation) forvariables with normal distribution or medians and percentiles (25 and 75) for variables withnon-normal distribution. Normality was assessed with the usage of the Shapiro–Wilk test.
We used the Kaplan–Meier method and log-rank test to analyze the associations be-tween survival and the demographic, genetic, and clinical variables. The Cox proportionalhazards regression model was used for the multivariate analysis (stepwise backward se-lection method) to obtain the adjusted hazard ratio (HR) and the 95% confidence interval(95% CI) for the possible survival prognostic factors.
All the tests were bilateral with a significance level of p < 0.05. R 4.0.2 software wasused to perform the data analysis [47].
The linkage disequilibrium, Hardy–Weinberg equilibrium, and haplotype frequencywere determined through the D’ and r2 coefficients and were estimated using the PLINKand Haploview 4.2 programs [48,49].
3. Results3.1. Patient Characteristics
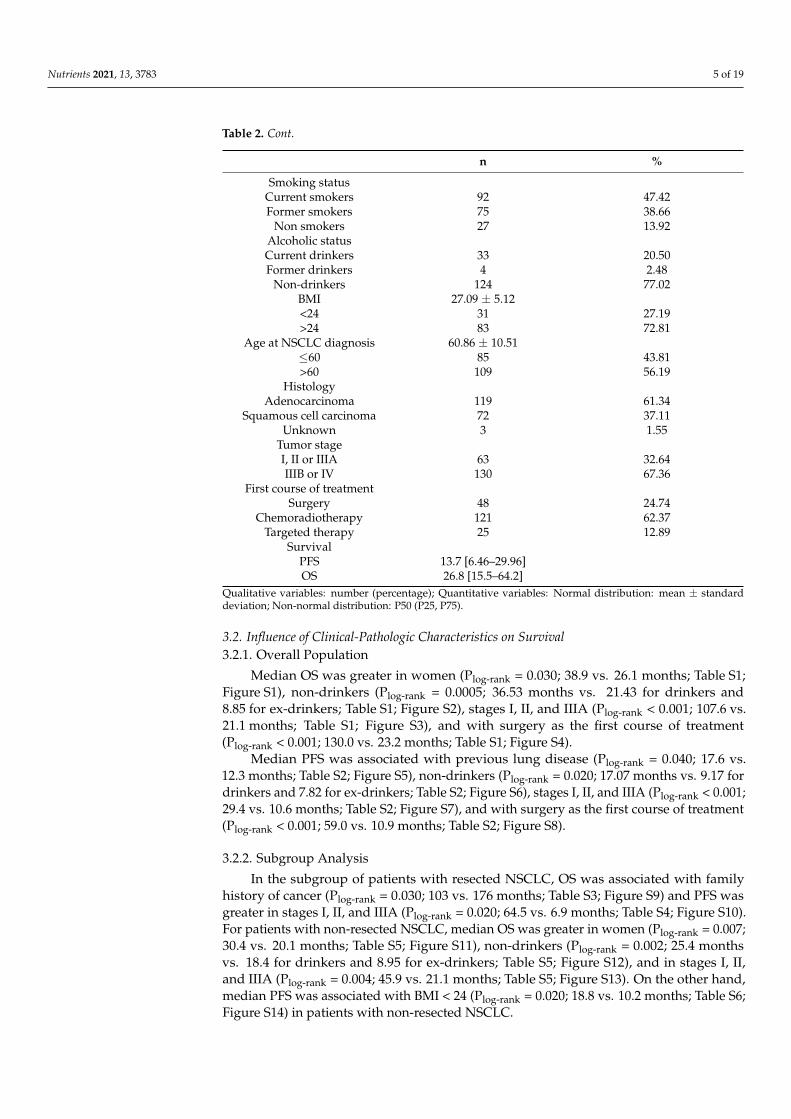
A total of 194 Caucasian patients from southern Spain with NSCLC were included inthe study. Their sociodemographic, clinical, and pathologic characteristics are summarizedin Table 2. The mean age of the patients was 60.86 ± 10.51 years, 141 were men (141/194;72.68%), and 130 were stage IIIB-IV (130/194; 67.36%). Surgery was the first course oftreatment for 48 patients (48/194; 24.74%), of whom 97.91% (47/48) had stage I-IIIA. Duringfollow-up, 154 fatal events were recorded. For all patients, the median OS and PFS were26.8 (15.5–64.20 and 13.7 (6.46–29.9) months, respectively.
Table 2. Classification of the 194 NSCLC patients according to the clinico-pathologic characteristics.
n %
GenderFemale 53 27.32Male 141 72.68
Family history of cancerYes 102 53.4No 89 46.6
Previous lung diseaseYes 55 28.35No 139 71.65
Nutrients 2021, 13, 3783 5 of 19
Table 2. Cont.
n %
Smoking statusCurrent smokers 92 47.42Former smokers 75 38.66
Non smokers 27 13.92Alcoholic statusCurrent drinkers 33 20.50Former drinkers 4 2.48
Non-drinkers 124 77.02BMI 27.09 ± 5.12<24 31 27.19>24 83 72.81
Age at NSCLC diagnosis 60.86 ± 10.51≤60 85 43.81>60 109 56.19
HistologyAdenocarcinoma 119 61.34
Squamous cell carcinoma 72 37.11Unknown 3 1.55
Tumor stageI, II or IIIA 63 32.64IIIB or IV 130 67.36
First course of treatmentSurgery 48 24.74
Chemoradiotherapy 121 62.37Targeted therapy 25 12.89
SurvivalPFS 13.7 [6.46–29.96]OS 26.8 [15.5–64.2]
Qualitative variables: number (percentage); Quantitative variables: Normal distribution: mean ± standarddeviation; Non-normal distribution: P50 (P25, P75).
3.2. Influence of Clinical-Pathologic Characteristics on Survival3.2.1. Overall Population
Median OS was greater in women (Plog-rank = 0.030; 38.9 vs. 26.1 months; Table S1;Figure S1), non-drinkers (Plog-rank = 0.0005; 36.53 months vs. 21.43 for drinkers and8.85 for ex-drinkers; Table S1; Figure S2), stages I, II, and IIIA (Plog-rank < 0.001; 107.6 vs.21.1 months; Table S1; Figure S3), and with surgery as the first course of treatment(Plog-rank < 0.001; 130.0 vs. 23.2 months; Table S1; Figure S4).
Median PFS was associated with previous lung disease (Plog-rank = 0.040; 17.6 vs.12.3 months; Table S2; Figure S5), non-drinkers (Plog-rank = 0.020; 17.07 months vs. 9.17 fordrinkers and 7.82 for ex-drinkers; Table S2; Figure S6), stages I, II, and IIIA (Plog-rank < 0.001;29.4 vs. 10.6 months; Table S2; Figure S7), and with surgery as the first course of treatment(Plog-rank < 0.001; 59.0 vs. 10.9 months; Table S2; Figure S8).
3.2.2. Subgroup Analysis
In the subgroup of patients with resected NSCLC, OS was associated with familyhistory of cancer (Plog-rank = 0.030; 103 vs. 176 months; Table S3; Figure S9) and PFS wasgreater in stages I, II, and IIIA (Plog-rank = 0.020; 64.5 vs. 6.9 months; Table S4; Figure S10).For patients with non-resected NSCLC, median OS was greater in women (Plog-rank = 0.007;30.4 vs. 20.1 months; Table S5; Figure S11), non-drinkers (Plog-rank = 0.002; 25.4 monthsvs. 18.4 for drinkers and 8.95 for ex-drinkers; Table S5; Figure S12), and in stages I, II,and IIIA (Plog-rank = 0.004; 45.9 vs. 21.1 months; Table S5; Figure S13). On the other hand,median PFS was associated with BMI < 24 (Plog-rank = 0.020; 18.8 vs. 10.2 months; Table S6;Figure S14) in patients with non-resected NSCLC.
Nutrients 2021, 13, 3783 6 of 19
3.3. Genotype Distribution
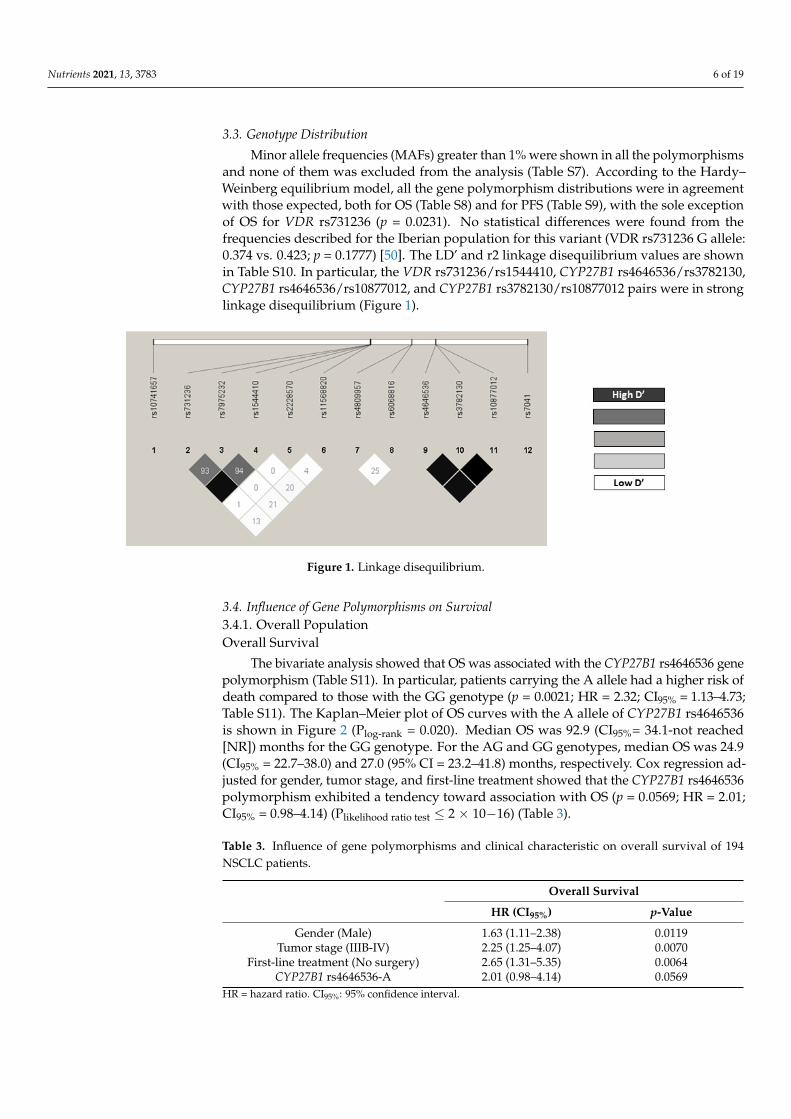
Minor allele frequencies (MAFs) greater than 1% were shown in all the polymorphismsand none of them was excluded from the analysis (Table S7). According to the Hardy–Weinberg equilibrium model, all the gene polymorphism distributions were in agreementwith those expected, both for OS (Table S8) and for PFS (Table S9), with the sole exceptionof OS for VDR rs731236 (p = 0.0231). No statistical differences were found from thefrequencies described for the Iberian population for this variant (VDR rs731236 G allele:0.374 vs. 0.423; p = 0.1777) [50]. The LD’ and r2 linkage disequilibrium values are shownin Table S10. In particular, the VDR rs731236/rs1544410, CYP27B1 rs4646536/rs3782130,CYP27B1 rs4646536/rs10877012, and CYP27B1 rs3782130/rs10877012 pairs were in stronglinkage disequilibrium (Figure 1).
Nutrients 2021, 13, x FOR PEER REVIEW 6 of 19
For patients with non-resected NSCLC, median OS was greater in women (Plog-rank = 0.007; 30.4 vs. 20.1 months; Table S5; Figure S11), non-drinkers (Plog-rank = 0.002; 25.4 months vs. 18.4 for drinkers and 8.95 for ex-drinkers; Table S5; Figure S12), and in stages I, II, and IIIA (Plog-rank = 0.004; 45.9 vs. 21.1 months; Table S5; Figure S13). On the other hand, median PFS was associated with BMI < 24 (Plog-rank = 0.020; 18.8 vs. 10.2 months; Table S6; Figure S14) in patients with non-resected NSCLC.
3.3. Genotype Distribution Minor allele frequencies (MAFs) greater than 1% were shown in all the polymor-
phisms and none of them was excluded from the analysis (Table S7). According to the Hardy–Weinberg equilibrium model, all the gene polymorphism distributions were in agreement with those expected, both for OS (Table S8) and for PFS (Table S9), with the sole exception of OS for VDR rs731236 (p = 0.0231). No statistical differences were found from the frequencies described for the Iberian population for this variant (VDR rs731236 G allele: 0.374 vs. 0.423; p = 0.1777) [50]. The LD’ and r2 linkage disequilibrium values are shown in Table S10. In particular, the VDR rs731236/rs1544410, CYP27B1 rs4646536/rs3782130, CYP27B1 rs4646536/rs10877012, and CYP27B1 rs3782130/rs10877012 pairs were in strong linkage disequilibrium (Figure 1).
Figure 1. Linkage disequilibrium.
3.4. Influence of Gene Polymorphisms on Survival 3.4.1. Overall Population Overall Survival
The bivariate analysis showed that OS was associated with the CYP27B1 rs4646536 gene polymorphism (Table S11). In particular, patients carrying the A allele had a higher risk of death compared to those with the GG genotype (p = 0.0021; HR = 2.32; CI95% = 1.13–4.73; Table S11). The Kaplan–Meier plot of OS curves with the A allele of CYP27B1 rs4646536 is shown in Figure 2 (Plog-rank = 0.020). Median OS was 92.9 (CI95%= 34.1-not reached [NR]) months for the GG genotype. For the AG and GG genotypes, median OS was 24.9 (CI95% = 22.7–38.0) and 27.0 (95% CI = 23.2–41.8) months, respectively. Cox regres-sion adjusted for gender, tumor stage, and first-line treatment showed that the CYP27B1 rs4646536 polymorphism exhibited a tendency toward association with OS (p = 0.0569; HR = 2.01; CI95% = 0.98–4.14) (Plikelihood ratio test ≤ 2 × 10⁻¹⁶) (Table 3).
Figure 1. Linkage disequilibrium.
3.4. Influence of Gene Polymorphisms on Survival3.4.1. Overall PopulationOverall Survival
The bivariate analysis showed that OS was associated with the CYP27B1 rs4646536 genepolymorphism (Table S11). In particular, patients carrying the A allele had a higher risk ofdeath compared to those with the GG genotype (p = 0.0021; HR = 2.32; CI95% = 1.13–4.73;Table S11). The Kaplan–Meier plot of OS curves with the A allele of CYP27B1 rs4646536is shown in Figure 2 (Plog-rank = 0.020). Median OS was 92.9 (CI95%= 34.1-not reached[NR]) months for the GG genotype. For the AG and GG genotypes, median OS was 24.9(CI95% = 22.7–38.0) and 27.0 (95% CI = 23.2–41.8) months, respectively. Cox regression ad-justed for gender, tumor stage, and first-line treatment showed that the CYP27B1 rs4646536polymorphism exhibited a tendency toward association with OS (p = 0.0569; HR = 2.01;CI95% = 0.98–4.14) (Plikelihood ratio test ≤ 2 × 10⁻¹⁶) (Table 3).
Table 3. Influence of gene polymorphisms and clinical characteristic on overall survival of 194NSCLC patients.
Overall Survival
HR (CI95%) p-Value
Gender (Male) 1.63 (1.11–2.38) 0.0119Tumor stage (IIIB-IV) 2.25 (1.25–4.07) 0.0070
First-line treatment (No surgery) 2.65 (1.31–5.35) 0.0064CYP27B1 rs4646536-A 2.01 (0.98–4.14) 0.0569
HR = hazard ratio. CI95%: 95% confidence interval.
Nutrients 2021, 13, 3783 7 of 19Nutrients 2021, 13, x FOR PEER REVIEW 7 of 19
Figure 2. Kaplan–Meier plot of overall survival curves with the A allele of the CYP27B1 rs4646536 gene polymorphism in 194 patients with NSCLC.
Table 3. Influence of gene polymorphisms and clinical characteristic on overall survival of 194 NSCLC patients.
Overall Survival
HR (CI95%) p-Value Gender (Male) 1.63 (1.11–2.38) 0.0119
Tumor stage (IIIB-IV) 2.25 (1.25–4.07) 0.0070 First-line treatment (No surgery) 2.65 (1.31–5.35) 0.0064
CYP27B1 rs4646536-A 2.01 (0.98–4.14) 0.0569 HR = hazard ratio. CI95%: 95% confidence interval.
Progression-Free Survival Patients carrying the A allele for the CYP27B1 rs4646536 gene polymorphism showed
a higher risk of progression compared to those carrying the GG genotype (p = 0.0266; HR = 2.07; CI95% =1.08–3.93; Table S12). The Kaplan–Meier plot of PFS curves with the A allele of CYP27B1 rs4646536 is shown in Figure 3 (Plog-rank = 0.020). Median PFS was 30.0 (CI95% =
12.3-NR) months for the GG genotype. For AG and GG carriers, median PFS was 12.3 (CI95% = 9.17–17.6) and 13.3 (CI95% = 10.9–17.6) months, respectively. Cox regression ad-justed for first-line treatment showed that the CYP27B1 rs4646536 polymorphism was as-sociated with PFS (p = 0.0233; HR = 2.11; CI95% = 1.11–4.04) (Plikelihood ratio test = 1 × 10⁻¹²) (Table 4).
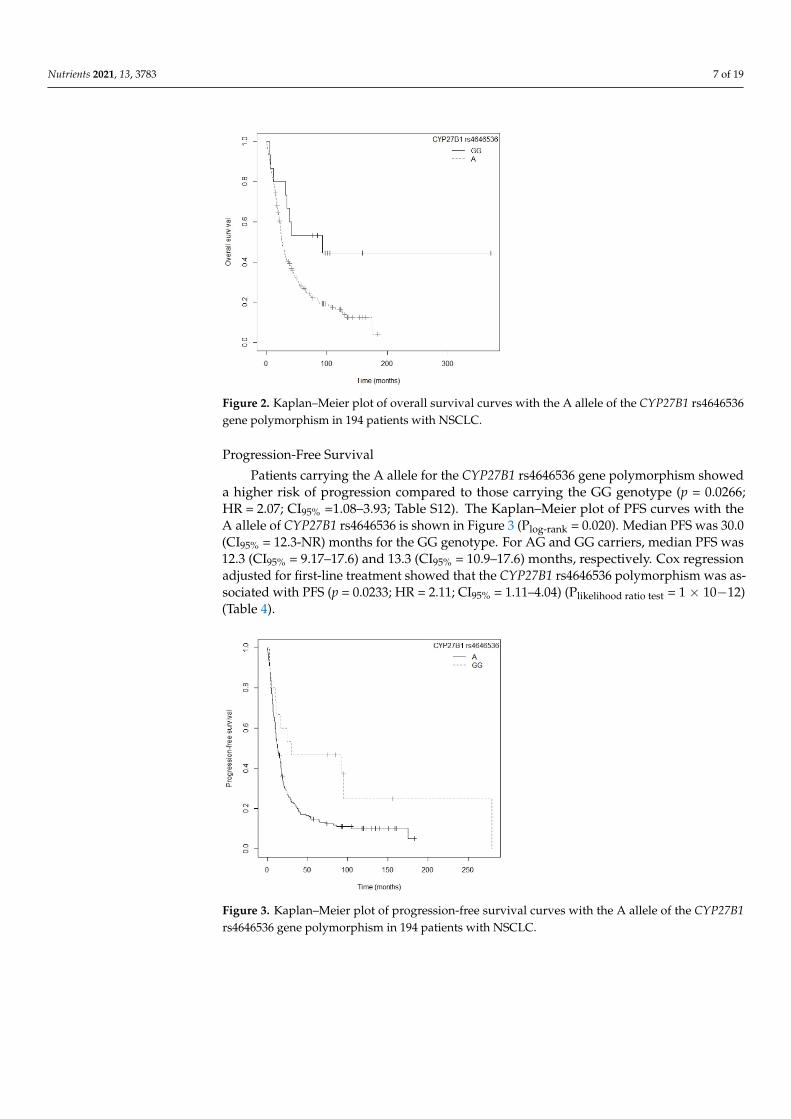
Figure 2. Kaplan–Meier plot of overall survival curves with the A allele of the CYP27B1 rs4646536gene polymorphism in 194 patients with NSCLC.
Progression-Free Survival
Patients carrying the A allele for the CYP27B1 rs4646536 gene polymorphism showeda higher risk of progression compared to those carrying the GG genotype (p = 0.0266;HR = 2.07; CI95% =1.08–3.93; Table S12). The Kaplan–Meier plot of PFS curves with theA allele of CYP27B1 rs4646536 is shown in Figure 3 (Plog-rank = 0.020). Median PFS was 30.0(CI95% = 12.3-NR) months for the GG genotype. For AG and GG carriers, median PFS was12.3 (CI95% = 9.17–17.6) and 13.3 (CI95% = 10.9–17.6) months, respectively. Cox regressionadjusted for first-line treatment showed that the CYP27B1 rs4646536 polymorphism was as-sociated with PFS (p = 0.0233; HR = 2.11; CI95% = 1.11–4.04) (Plikelihood ratio test = 1 × 10⁻¹²)(Table 4).
Nutrients 2021, 13, x FOR PEER REVIEW 8 of 19
Figure 3. Kaplan–Meier plot of progression-free survival curves with the A allele of the CYP27B1 rs4646536 gene polymorphism in 194 patients with NSCLC.
Table 4. Influence of gene polymorphisms and clinical characteristics on progression-free survival of 194 NSCLC patients.
Progression-Free Survival HR (CI95%) p-Value
First-line treatment (no surgery) 3.89 (2.54–5.96) <0.001 CYP27B1 rs4646536_A 2.11 (1.11–4.04) 0.0233
HR = hazard ratio. CI95%: 95% confidence interval.
3.4.2. Subgroup Analysis Overall Survival
In the subgroup of resected NSCLC patients, those carrying the GG genotype for the GC rs7041 polymorphism had a higher risk of death compared to those with the T allele (p = 0.0242; HR = 2.72; CI95% = 1.14–6.47; Table S13). Median OS for the GG genotype was 61.2 (CI95% = 24.3-NR) months, while for the GT and TT genotypes it was 107.6 (CI95% = 75.0-NR) and 176.1 (CI95% = 126.4-NR) months, respectively. The Kaplan–Meier plot of OS curves with the T allele of GC rs7041 is shown in Figure S15 (Plog-rank = 0.020). Similarly, patients carrying the AA genotype for the VDR rs11568820 polymorphism were associ-ated with a higher risk of death than those with the GG genotype (p = 0.0129; HR = 7.43; CI95% =1.53–36.15; Table S13). The Kaplan–Meier curve for OS with the T allele of VDR Cdx-2 (rs11568820) is shown in Figure 4 (Plog-rank = 0.003). The median OS for the GG geno-type was 130.0 (CI95% = 107.6-NR) months and for the AA genotype it was 27.2 (CI95% = 24.3-NR) months, while for the AG genotype it was not reached. Multivariate Cox regression, adjusted for family history of cancer, showed that the VDR rs11568820 polymorphism was the only independent factor associated with OS in patients with resected NSCLC (p = 0.0129; HR = 7.43; CI95% = 1.53–36.15) (Plikelihood ratio test = 0.04) (Table 5).
Figure 3. Kaplan–Meier plot of progression-free survival curves with the A allele of the CYP27B1rs4646536 gene polymorphism in 194 patients with NSCLC.
Nutrients 2021, 13, 3783 8 of 19
Table 4. Influence of gene polymorphisms and clinical characteristics on progression-free survival of194 NSCLC patients.
Progression-Free Survival
HR (CI95%) p-Value
First-line treatment (no surgery) 3.89 (2.54–5.96) <0.001CYP27B1 rs4646536_A 2.11 (1.11–4.04) 0.0233
HR = hazard ratio. CI95%: 95% confidence interval.
3.4.2. Subgroup AnalysisOverall Survival
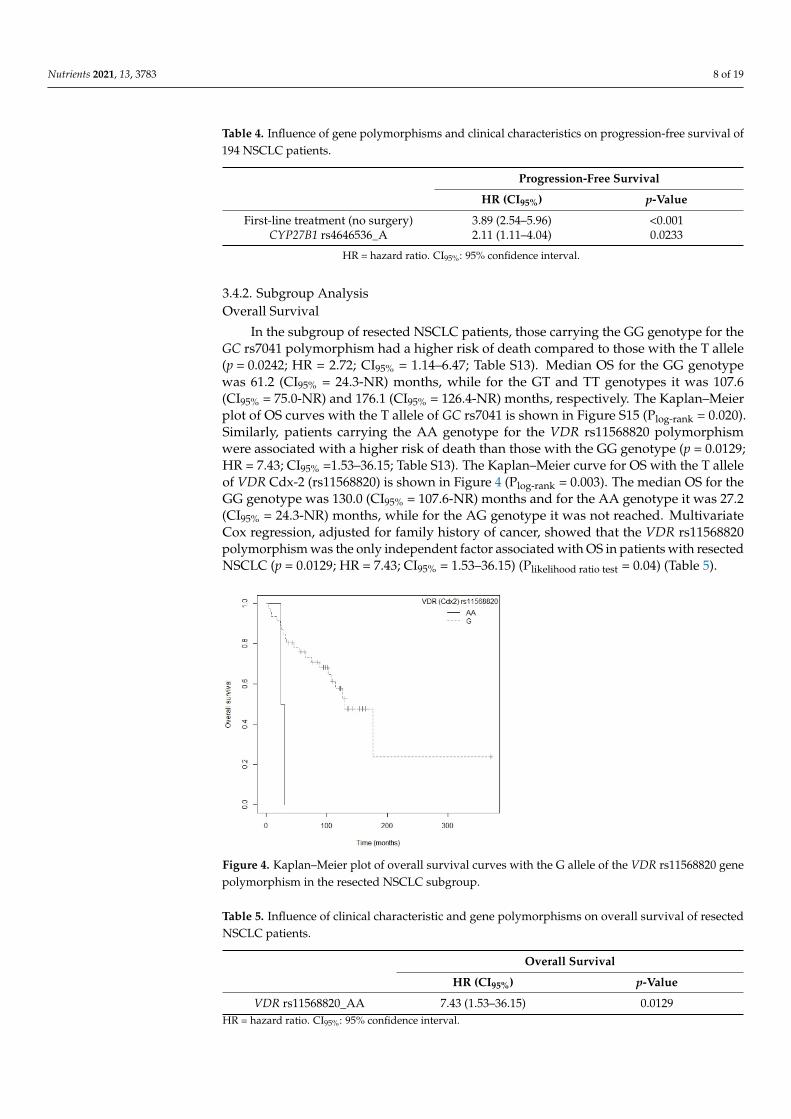
In the subgroup of resected NSCLC patients, those carrying the GG genotype for theGC rs7041 polymorphism had a higher risk of death compared to those with the T allele(p = 0.0242; HR = 2.72; CI95% = 1.14–6.47; Table S13). Median OS for the GG genotypewas 61.2 (CI95% = 24.3-NR) months, while for the GT and TT genotypes it was 107.6(CI95% = 75.0-NR) and 176.1 (CI95% = 126.4-NR) months, respectively. The Kaplan–Meierplot of OS curves with the T allele of GC rs7041 is shown in Figure S15 (Plog-rank = 0.020).Similarly, patients carrying the AA genotype for the VDR rs11568820 polymorphismwere associated with a higher risk of death than those with the GG genotype (p = 0.0129;HR = 7.43; CI95% =1.53–36.15; Table S13). The Kaplan–Meier curve for OS with the T alleleof VDR Cdx-2 (rs11568820) is shown in Figure 4 (Plog-rank = 0.003). The median OS for theGG genotype was 130.0 (CI95% = 107.6-NR) months and for the AA genotype it was 27.2(CI95% = 24.3-NR) months, while for the AG genotype it was not reached. MultivariateCox regression, adjusted for family history of cancer, showed that the VDR rs11568820polymorphism was the only independent factor associated with OS in patients with resectedNSCLC (p = 0.0129; HR = 7.43; CI95% = 1.53–36.15) (Plikelihood ratio test = 0.04) (Table 5).
Nutrients 2021, 13, x FOR PEER REVIEW 9 of 19
Figure 4. Kaplan–Meier plot of overall survival curves with the G allele of the VDR rs11568820 gene polymorphism in the resected NSCLC subgroup.
Table 5. Influence of clinical characteristic and gene polymorphisms on overall survival of resected NSCLC patients.
Overall Survival
HR (CI95%) p-Value VDR rs11568820_AA 7.43 (1.53–36.15) 0.0129
HR = hazard ratio. CI95%: 95% confidence interval.
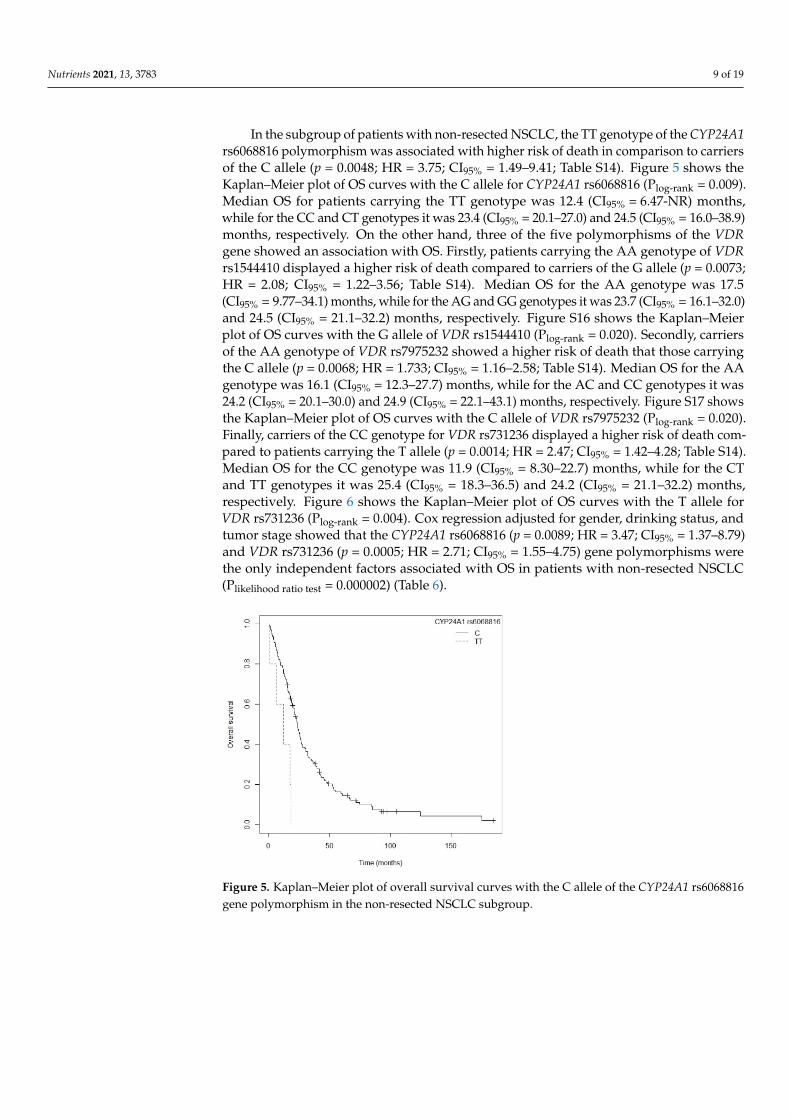
In the subgroup of patients with non-resected NSCLC, the TT genotype of the CYP24A1 rs6068816 polymorphism was associated with higher risk of death in compari-son to carriers of the C allele (p = 0.0048; HR = 3.75; CI95% = 1.49–9.41; Table S14). Figure 5 shows the Kaplan–Meier plot of OS curves with the C allele for CYP24A1 rs6068816 (Plog-
rank = 0.009). Median OS for patients carrying the TT genotype was 12.4 (CI95% = 6.47-NR) months, while for the CC and CT genotypes it was 23.4 (CI95% = 20.1–27.0) and 24.5 (CI95%
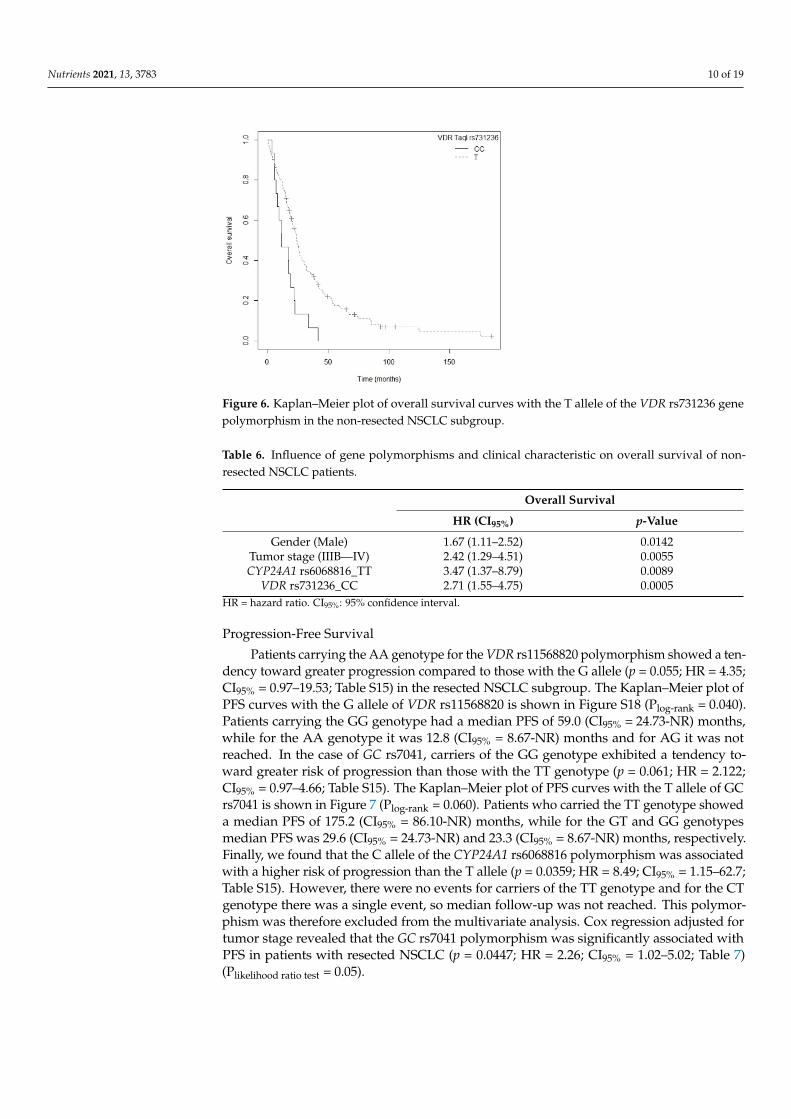
= 16.0–38.9) months, respectively. On the other hand, three of the five polymorphisms of the VDR gene showed an association with OS. Firstly, patients carrying the AA genotype of VDR rs1544410 displayed a higher risk of death compared to carriers of the G allele (p = 0.0073; HR = 2.08; CI95% = 1.22–3.56; Table S14). Median OS for the AA genotype was 17.5 (CI95% = 9.77–34.1) months, while for the AG and GG genotypes it was 23.7 (CI95% = 16.1–32.0) and 24.5 (CI95% = 21.1–32.2) months, respectively. Figure S16 shows the Kaplan–Meier plot of OS curves with the G allele of VDR rs1544410 (Plog-rank = 0.020). Secondly, carriers of the AA genotype of VDR rs7975232 showed a higher risk of death that those carrying the C allele (p = 0.0068; HR = 1.733; CI95% = 1.16–2.58; Table S14). Median OS for the AA geno-type was 16.1 (CI95% = 12.3–27.7) months, while for the AC and CC genotypes it was 24.2 (CI95% = 20.1–30.0) and 24.9 (CI95% = 22.1–43.1) months, respectively. Figure S17 shows the Kaplan–Meier plot of OS curves with the C allele of VDR rs7975232 (Plog-rank = 0.020). Fi-nally, carriers of the CC genotype for VDR rs731236 displayed a higher risk of death com-pared to patients carrying the T allele (p = 0.0014; HR = 2.47; CI95% = 1.42–4.28; Table S14). Median OS for the CC genotype was 11.9 (CI95% = 8.30–22.7) months, while for the CT and TT genotypes it was 25.4 (CI95% = 18.3–36.5) and 24.2 (CI95% = 21.1–32.2) months, respec-tively. Figure 6 shows the Kaplan–Meier plot of OS curves with the T allele for VDR rs731236 (Plog-rank = 0.004). Cox regression adjusted for gender, drinking status, and tumor stage showed that the CYP24A1 rs6068816 (p = 0.0089; HR = 3.47; CI95% = 1.37–8.79) and VDR rs731236 (p = 0.0005; HR = 2.71; CI95% = 1.55–4.75) gene polymorphisms were the only
Figure 4. Kaplan–Meier plot of overall survival curves with the G allele of the VDR rs11568820 genepolymorphism in the resected NSCLC subgroup.
Table 5. Influence of clinical characteristic and gene polymorphisms on overall survival of resectedNSCLC patients.
Overall Survival
HR (CI95%) p-Value
VDR rs11568820_AA 7.43 (1.53–36.15) 0.0129HR = hazard ratio. CI95%: 95% confidence interval.
Nutrients 2021, 13, 3783 9 of 19
In the subgroup of patients with non-resected NSCLC, the TT genotype of the CYP24A1rs6068816 polymorphism was associated with higher risk of death in comparison to carriersof the C allele (p = 0.0048; HR = 3.75; CI95% = 1.49–9.41; Table S14). Figure 5 shows theKaplan–Meier plot of OS curves with the C allele for CYP24A1 rs6068816 (Plog-rank = 0.009).Median OS for patients carrying the TT genotype was 12.4 (CI95% = 6.47-NR) months,while for the CC and CT genotypes it was 23.4 (CI95% = 20.1–27.0) and 24.5 (CI95% = 16.0–38.9)months, respectively. On the other hand, three of the five polymorphisms of the VDRgene showed an association with OS. Firstly, patients carrying the AA genotype of VDRrs1544410 displayed a higher risk of death compared to carriers of the G allele (p = 0.0073;HR = 2.08; CI95% = 1.22–3.56; Table S14). Median OS for the AA genotype was 17.5(CI95% = 9.77–34.1) months, while for the AG and GG genotypes it was 23.7 (CI95% = 16.1–32.0)and 24.5 (CI95% = 21.1–32.2) months, respectively. Figure S16 shows the Kaplan–Meierplot of OS curves with the G allele of VDR rs1544410 (Plog-rank = 0.020). Secondly, carriersof the AA genotype of VDR rs7975232 showed a higher risk of death that those carryingthe C allele (p = 0.0068; HR = 1.733; CI95% = 1.16–2.58; Table S14). Median OS for the AAgenotype was 16.1 (CI95% = 12.3–27.7) months, while for the AC and CC genotypes it was24.2 (CI95% = 20.1–30.0) and 24.9 (CI95% = 22.1–43.1) months, respectively. Figure S17 showsthe Kaplan–Meier plot of OS curves with the C allele of VDR rs7975232 (Plog-rank = 0.020).Finally, carriers of the CC genotype for VDR rs731236 displayed a higher risk of death com-pared to patients carrying the T allele (p = 0.0014; HR = 2.47; CI95% = 1.42–4.28; Table S14).Median OS for the CC genotype was 11.9 (CI95% = 8.30–22.7) months, while for the CTand TT genotypes it was 25.4 (CI95% = 18.3–36.5) and 24.2 (CI95% = 21.1–32.2) months,respectively. Figure 6 shows the Kaplan–Meier plot of OS curves with the T allele forVDR rs731236 (Plog-rank = 0.004). Cox regression adjusted for gender, drinking status, andtumor stage showed that the CYP24A1 rs6068816 (p = 0.0089; HR = 3.47; CI95% = 1.37–8.79)and VDR rs731236 (p = 0.0005; HR = 2.71; CI95% = 1.55–4.75) gene polymorphisms werethe only independent factors associated with OS in patients with non-resected NSCLC(Plikelihood ratio test = 0.000002) (Table 6).
Nutrients 2021, 13, x FOR PEER REVIEW 10 of 19
independent factors associated with OS in patients with non-resected NSCLC (Plikelihood ratio
test = 0.000002) (Table 6).
Figure 5. Kaplan–Meier plot of overall survival curves with the C allele of the CYP24A1 rs6068816 gene polymorphism in the non-resected NSCLC subgroup.
Figure 6. Kaplan–Meier plot of overall survival curves with the T allele of the VDR rs731236 gene polymorphism in the non-resected NSCLC subgroup.
Table 6. Influence of gene polymorphisms and clinical characteristic on overall survival of non-resected NSCLC patients.
Overall Survival
HR (CI95%) p-Value Gender (Male) 1.67 (1.11–2.52) 0.0142
Tumor stage (IIIB—IV) 2.42 (1.29–4.51) 0.0055 CYP24A1 rs6068816_TT 3.47 (1.37–8.79) 0.0089
VDR rs731236_CC 2.71 (1.55–4.75) 0.0005 HR = hazard ratio. CI95%: 95% confidence interval.
Figure 5. Kaplan–Meier plot of overall survival curves with the C allele of the CYP24A1 rs6068816gene polymorphism in the non-resected NSCLC subgroup.
Nutrients 2021, 13, 3783 10 of 19
Nutrients 2021, 13, x FOR PEER REVIEW 10 of 19
independent factors associated with OS in patients with non-resected NSCLC (Plikelihood ratio
test = 0.000002) (Table 6).
Figure 5. Kaplan–Meier plot of overall survival curves with the C allele of the CYP24A1 rs6068816 gene polymorphism in the non-resected NSCLC subgroup.
Figure 6. Kaplan–Meier plot of overall survival curves with the T allele of the VDR rs731236 gene polymorphism in the non-resected NSCLC subgroup.
Table 6. Influence of gene polymorphisms and clinical characteristic on overall survival of non-resected NSCLC patients.
Overall Survival
HR (CI95%) p-Value Gender (Male) 1.67 (1.11–2.52) 0.0142
Tumor stage (IIIB—IV) 2.42 (1.29–4.51) 0.0055 CYP24A1 rs6068816_TT 3.47 (1.37–8.79) 0.0089
VDR rs731236_CC 2.71 (1.55–4.75) 0.0005 HR = hazard ratio. CI95%: 95% confidence interval.
Figure 6. Kaplan–Meier plot of overall survival curves with the T allele of the VDR rs731236 genepolymorphism in the non-resected NSCLC subgroup.
Table 6. Influence of gene polymorphisms and clinical characteristic on overall survival of non-resected NSCLC patients.
Overall Survival
HR (CI95%) p-Value
Gender (Male) 1.67 (1.11–2.52) 0.0142Tumor stage (IIIB—IV) 2.42 (1.29–4.51) 0.0055CYP24A1 rs6068816_TT 3.47 (1.37–8.79) 0.0089
VDR rs731236_CC 2.71 (1.55–4.75) 0.0005HR = hazard ratio. CI95%: 95% confidence interval.
Progression-Free Survival
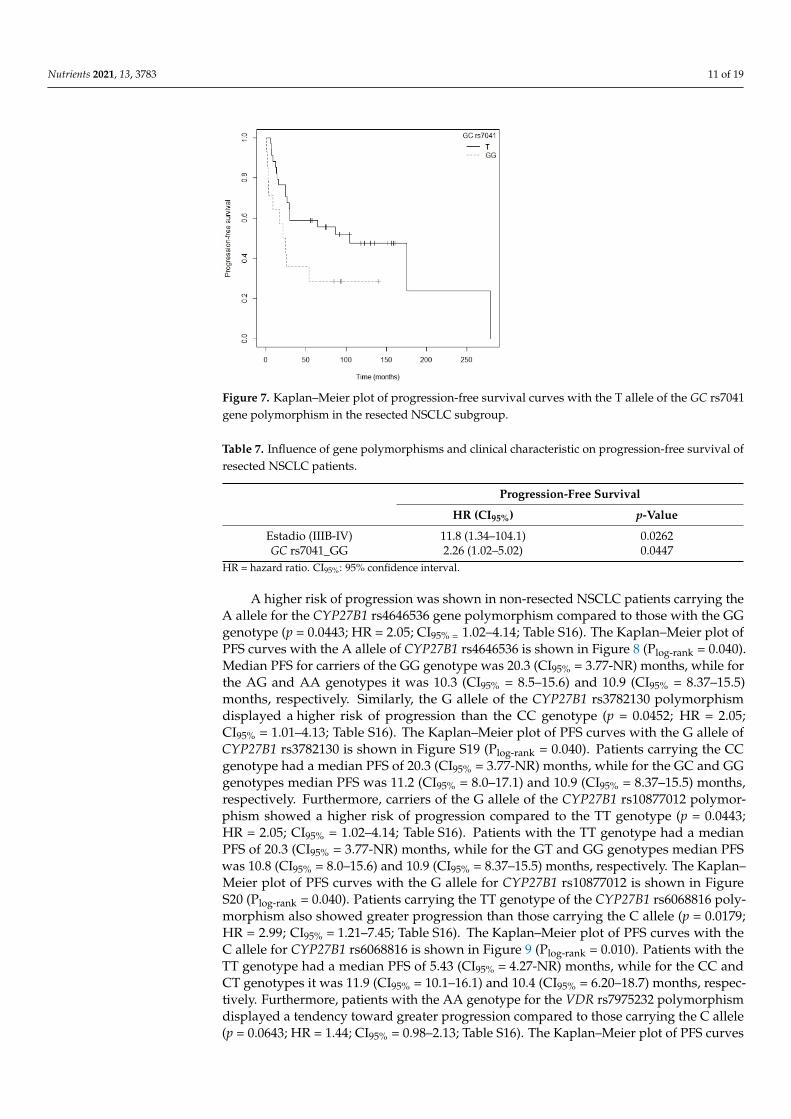
Patients carrying the AA genotype for the VDR rs11568820 polymorphism showed a ten-dency toward greater progression compared to those with the G allele (p = 0.055; HR = 4.35;CI95% = 0.97–19.53; Table S15) in the resected NSCLC subgroup. The Kaplan–Meier plot ofPFS curves with the G allele of VDR rs11568820 is shown in Figure S18 (Plog-rank = 0.040).Patients carrying the GG genotype had a median PFS of 59.0 (CI95% = 24.73-NR) months,while for the AA genotype it was 12.8 (CI95% = 8.67-NR) months and for AG it was notreached. In the case of GC rs7041, carriers of the GG genotype exhibited a tendency to-ward greater risk of progression than those with the TT genotype (p = 0.061; HR = 2.122;CI95% = 0.97–4.66; Table S15). The Kaplan–Meier plot of PFS curves with the T allele of GCrs7041 is shown in Figure 7 (Plog-rank = 0.060). Patients who carried the TT genotype showeda median PFS of 175.2 (CI95% = 86.10-NR) months, while for the GT and GG genotypesmedian PFS was 29.6 (CI95% = 24.73-NR) and 23.3 (CI95% = 8.67-NR) months, respectively.Finally, we found that the C allele of the CYP24A1 rs6068816 polymorphism was associatedwith a higher risk of progression than the T allele (p = 0.0359; HR = 8.49; CI95% = 1.15–62.7;Table S15). However, there were no events for carriers of the TT genotype and for the CTgenotype there was a single event, so median follow-up was not reached. This polymor-phism was therefore excluded from the multivariate analysis. Cox regression adjusted fortumor stage revealed that the GC rs7041 polymorphism was significantly associated withPFS in patients with resected NSCLC (p = 0.0447; HR = 2.26; CI95% = 1.02–5.02; Table 7)(Plikelihood ratio test = 0.05).
Nutrients 2021, 13, 3783 11 of 19
Nutrients 2021, 13, x FOR PEER REVIEW 11 of 19
Progression-Free Survival Patients carrying the AA genotype for the VDR rs11568820 polymorphism showed a
tendency toward greater progression compared to those with the G allele (p = 0.055; HR = 4,35; CI95% = 0.97–19.53; Table S15) in the resected NSCLC subgroup. The Kaplan–Meier plot of PFS curves with the G allele of VDR rs11568820 is shown in Figure S18 (Plog-rank =
0.040). Patients carrying the GG genotype had a median PFS of 59.0 (CI95% = 24.73-NR) months, while for the AA genotype it was 12.8 (CI95% = 8.67-NR) months and for AG it was not reached. In the case of GC rs7041, carriers of the GG genotype exhibited a tendency toward greater risk of progression than those with the TT genotype (p = 0.061; HR = 2.122; CI95% = 0.97–4.66; Table S15). The Kaplan–Meier plot of PFS curves with the T allele of GC rs7041 is shown in Figure 7 (Plog-rank = 0.060). Patients who carried the TT genotype showed a median PFS of 175.2 (CI95% = 86.10-NR) months, while for the GT and GG genotypes me-dian PFS was 29.6 (CI95% = 24.73-NR) and 23.3 (CI95% = 8.67-NR) months, respectively. Fi-nally, we found that the C allele of the CYP24A1 rs6068816 polymorphism was associated with a higher risk of progression than the T allele (p = 0.0359; HR = 8.49; CI95% = 1.15–62.7; Table S15). However, there were no events for carriers of the TT genotype and for the CT genotype there was a single event, so median follow-up was not reached. This polymor-phism was therefore excluded from the multivariate analysis. Cox regression adjusted for tumor stage revealed that the GC rs7041 polymorphism was significantly associated with PFS in patients with resected NSCLC (p = 0.0447; HR = 2.26; CI95% = 1.02–5.02; Table 7) (Plikelihood ratio test = 0.05).
Figure 7. Kaplan–Meier plot of progression-free survival curves with the T allele of the GC rs7041 gene polymorphism in the resected NSCLC subgroup.
Table 7. Influence of gene polymorphisms and clinical characteristic on progression-free survival of resected NSCLC patients.
Progression-Free Survival HR (CI95%) p-Value
Estadio (IIIB-IV) 11.8 (1.34–104.1) 0.0262 GC rs7041_GG 2.26 (1.02–5.02) 0.0447
HR = hazard ratio. CI95%: 95% confidence interval.
A higher risk of progression was shown in non-resected NSCLC patients carrying the A allele for the CYP27B1 rs4646536 gene polymorphism compared to those with the GG genotype (p = 0.0443; HR = 2.05; CI95% = 1.02–4.14; Table S16). The Kaplan–Meier plot of PFS curves with the A allele of CYP27B1 rs4646536 is shown in Figure 8 (Plog-rank = 0.040).
Figure 7. Kaplan–Meier plot of progression-free survival curves with the T allele of the GC rs7041gene polymorphism in the resected NSCLC subgroup.
Table 7. Influence of gene polymorphisms and clinical characteristic on progression-free survival ofresected NSCLC patients.
Progression-Free Survival
HR (CI95%) p-Value
Estadio (IIIB-IV) 11.8 (1.34–104.1) 0.0262GC rs7041_GG 2.26 (1.02–5.02) 0.0447
HR = hazard ratio. CI95%: 95% confidence interval.
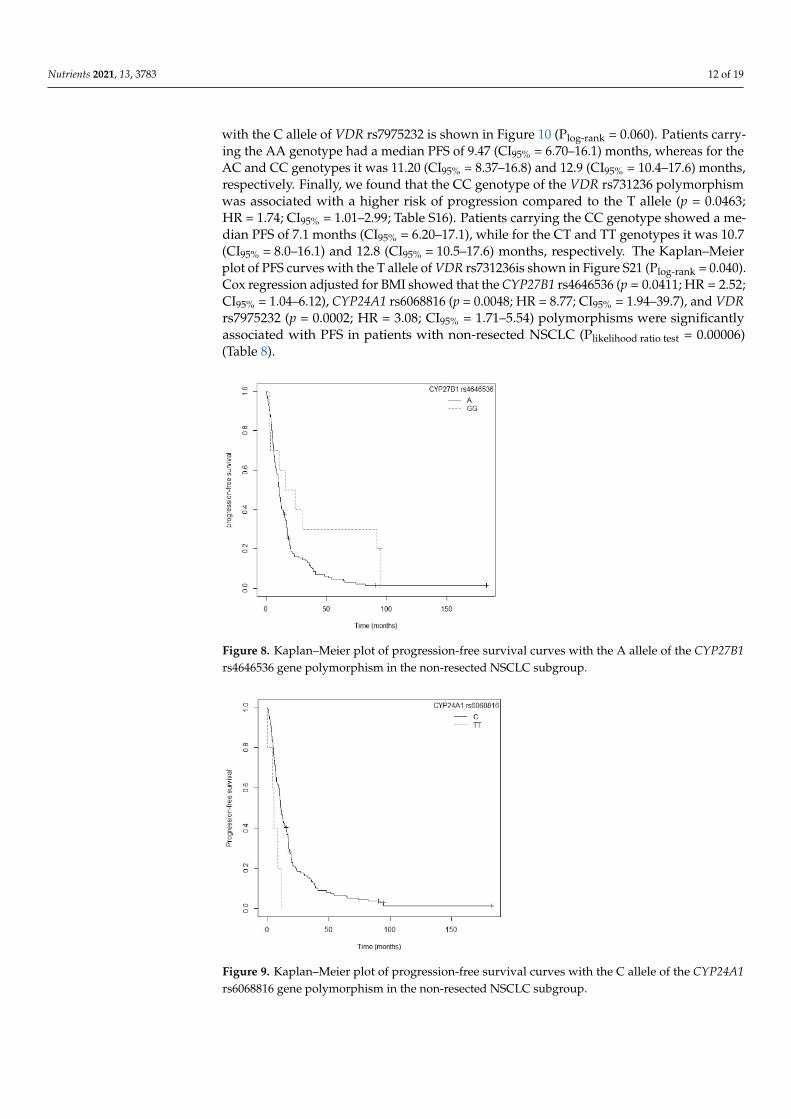
A higher risk of progression was shown in non-resected NSCLC patients carrying theA allele for the CYP27B1 rs4646536 gene polymorphism compared to those with the GGgenotype (p = 0.0443; HR = 2.05; CI95% = 1.02–4.14; Table S16). The Kaplan–Meier plot ofPFS curves with the A allele of CYP27B1 rs4646536 is shown in Figure 8 (Plog-rank = 0.040).Median PFS for carriers of the GG genotype was 20.3 (CI95% = 3.77-NR) months, while forthe AG and AA genotypes it was 10.3 (CI95% = 8.5–15.6) and 10.9 (CI95% = 8.37–15.5)months, respectively. Similarly, the G allele of the CYP27B1 rs3782130 polymorphismdisplayed a higher risk of progression than the CC genotype (p = 0.0452; HR = 2.05;CI95% = 1.01–4.13; Table S16). The Kaplan–Meier plot of PFS curves with the G allele ofCYP27B1 rs3782130 is shown in Figure S19 (Plog-rank = 0.040). Patients carrying the CCgenotype had a median PFS of 20.3 (CI95% = 3.77-NR) months, while for the GC and GGgenotypes median PFS was 11.2 (CI95% = 8.0–17.1) and 10.9 (CI95% = 8.37–15.5) months,respectively. Furthermore, carriers of the G allele of the CYP27B1 rs10877012 polymor-phism showed a higher risk of progression compared to the TT genotype (p = 0.0443;HR = 2.05; CI95% = 1.02–4.14; Table S16). Patients with the TT genotype had a medianPFS of 20.3 (CI95% = 3.77-NR) months, while for the GT and GG genotypes median PFSwas 10.8 (CI95% = 8.0–15.6) and 10.9 (CI95% = 8.37–15.5) months, respectively. The Kaplan–Meier plot of PFS curves with the G allele for CYP27B1 rs10877012 is shown in FigureS20 (Plog-rank = 0.040). Patients carrying the TT genotype of the CYP27B1 rs6068816 poly-morphism also showed greater progression than those carrying the C allele (p = 0.0179;HR = 2.99; CI95% = 1.21–7.45; Table S16). The Kaplan–Meier plot of PFS curves with theC allele for CYP27B1 rs6068816 is shown in Figure 9 (Plog-rank = 0.010). Patients with theTT genotype had a median PFS of 5.43 (CI95% = 4.27-NR) months, while for the CC andCT genotypes it was 11.9 (CI95% = 10.1–16.1) and 10.4 (CI95% = 6.20–18.7) months, respec-tively. Furthermore, patients with the AA genotype for the VDR rs7975232 polymorphismdisplayed a tendency toward greater progression compared to those carrying the C allele(p = 0.0643; HR = 1.44; CI95% = 0.98–2.13; Table S16). The Kaplan–Meier plot of PFS curves
Nutrients 2021, 13, 3783 12 of 19
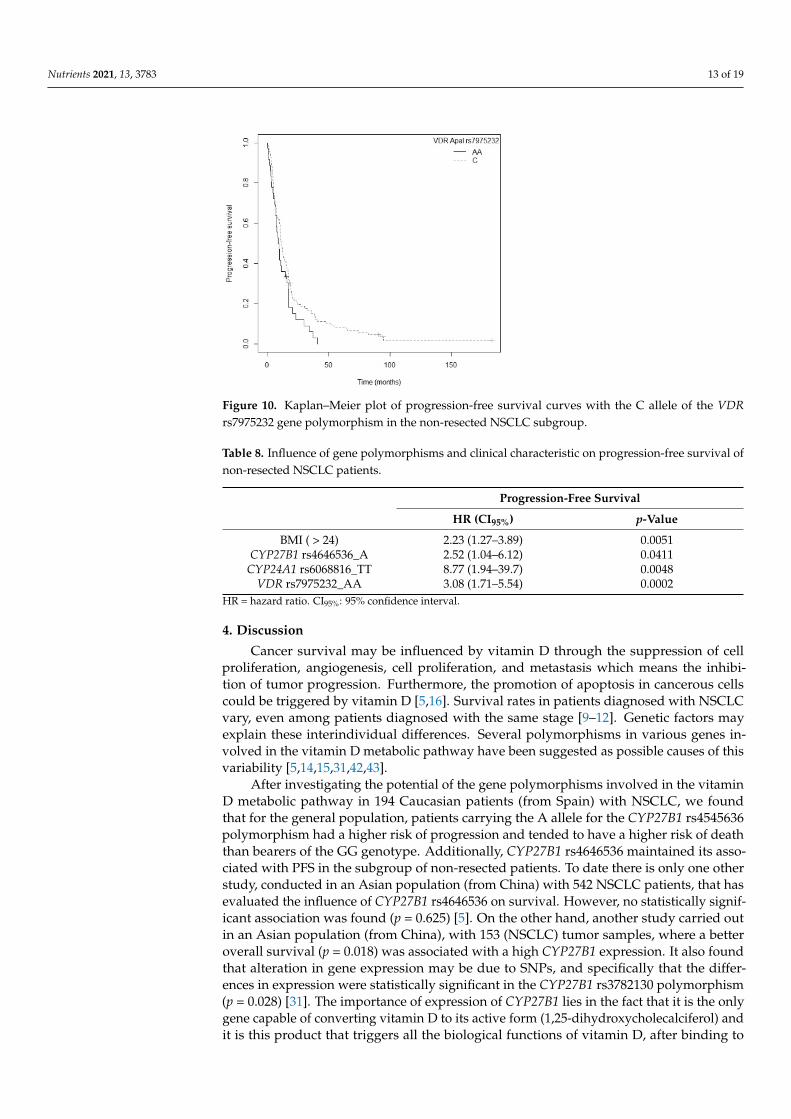
with the C allele of VDR rs7975232 is shown in Figure 10 (Plog-rank = 0.060). Patients carry-ing the AA genotype had a median PFS of 9.47 (CI95% = 6.70–16.1) months, whereas for theAC and CC genotypes it was 11.20 (CI95% = 8.37–16.8) and 12.9 (CI95% = 10.4–17.6) months,respectively. Finally, we found that the CC genotype of the VDR rs731236 polymorphismwas associated with a higher risk of progression compared to the T allele (p = 0.0463;HR = 1.74; CI95% = 1.01–2.99; Table S16). Patients carrying the CC genotype showed a me-dian PFS of 7.1 months (CI95% = 6.20–17.1), while for the CT and TT genotypes it was 10.7(CI95% = 8.0–16.1) and 12.8 (CI95% = 10.5–17.6) months, respectively. The Kaplan–Meierplot of PFS curves with the T allele of VDR rs731236is shown in Figure S21 (Plog-rank = 0.040).Cox regression adjusted for BMI showed that the CYP27B1 rs4646536 (p = 0.0411; HR = 2.52;CI95% = 1.04–6.12), CYP24A1 rs6068816 (p = 0.0048; HR = 8.77; CI95% = 1.94–39.7), and VDRrs7975232 (p = 0.0002; HR = 3.08; CI95% = 1.71–5.54) polymorphisms were significantlyassociated with PFS in patients with non-resected NSCLC (Plikelihood ratio test = 0.00006)(Table 8).
Nutrients 2021, 13, x FOR PEER REVIEW 12 of 19
Median PFS for carriers of the GG genotype was 20.3 (CI95% = 3.77-NR) months, while for the AG and AA genotypes it was 10.3 (CI95% = 8.5–15.6) and 10.9 (CI95% = 8.37–15.5) months, respectively. Similarly, the G allele of the CYP27B1 rs3782130 polymorphism displayed a higher risk of progression than the CC genotype (p = 0.0452; HR = 2.05; CI95% = 1.01–4.13; Table S16). The Kaplan–Meier plot of PFS curves with the G allele of CYP27B1 rs3782130 is shown in Figure S19 (Plog-rank = 0.040). Patients carrying the CC genotype had a median PFS of 20.3 (CI95% = 3.77-NR) months, while for the GC and GG genotypes median PFS was 11.2 (CI95% = 8.0–17.1) and 10.9 (CI95% = 8.37–15.5) months, respectively. Furthermore, carri-ers of the G allele of the CYP27B1 rs10877012 polymorphism showed a higher risk of pro-gression compared to the TT genotype (p = 0.0443; HR = 2.05; CI95% = 1.02–4.14; Table S16). Patients with the TT genotype had a median PFS of 20.3 (CI95% = 3.77-NR) months, while for the GT and GG genotypes median PFS was 10.8 (CI95% = 8.0–15.6) and 10.9 (CI95% = 8.37–15.5) months, respectively. The Kaplan–Meier plot of PFS curves with the G allele for CYP27B1 rs10877012 is shown in Figure S20 (Plog-rank = 0.040). Patients carrying the TT gen-otype of the CYP27B1 rs6068816 polymorphism also showed greater progression than those carrying the C allele (p = 0.0179; HR = 2.99; CI95% = 1.21–7.45; Table S16). The Kaplan–Meier plot of PFS curves with the C allele for CYP27B1 rs6068816 is shown in Figure 9 (Plog-rank = 0.010). Patients with the TT genotype had a median PFS of 5.43 (CI95% = 4.27-NR) months, while for the CC and CT genotypes it was 11.9 (CI95% = 10.1–16.1) and 10.4 (CI95%
= 6.20–18.7) months, respectively. Furthermore, patients with the AA genotype for the VDR rs7975232 polymorphism displayed a tendency toward greater progression com-pared to those carrying the C allele (p = 0.0643; HR = 1.44; CI95% = 0.98–2.13; Table S16). The Kaplan–Meier plot of PFS curves with the C allele of VDR rs7975232 is shown in Figure 10 (Plog-rank = 0.060). Patients carrying the AA genotype had a median PFS of 9.47 (CI95% = 6.70–16.1) months, whereas for the AC and CC genotypes it was 11.20 (CI95% = 8.37–16.8) and 12.9 (CI95% = 10.4–17.6) months, respectively. Finally, we found that the CC genotype of the VDR rs731236 polymorphism was associated with a higher risk of progression compared to the T allele (p = 0.0463; HR = 1.74; CI95% = 1.01–2.99; Table S16). Patients carrying the CC genotype showed a median PFS of 7.1 months (CI95% = 6.20–17.1), while for the CT and TT genotypes it was 10.7 (CI95% = 8.0–16.1) and 12.8 (CI95% = 10.5–17.6) months, respectively. The Kaplan–Meier plot of PFS curves with the T allele of VDR rs731236is shown in Figure S21 (Plog-rank = 0.040). Cox regression adjusted for BMI showed that the CYP27B1 rs4646536 (p = 0.0411; HR = 2.52; CI95% = 1.04–6.12), CYP24A1 rs6068816 (p = 0.0048; HR = 8.77; CI95% =
1.94–39.7), and VDR rs7975232 (p = 0.0002; HR = 3.08; CI95% = 1.71–5.54) polymorphisms were significantly associated with PFS in patients with non-resected NSCLC (Plikelihood ratio
test = 0.00006) (Table 8).
Figure 8. Kaplan–Meier plot of progression-free survival curves with the A allele of the CYP27B1rs4646536 gene polymorphism in the non-resected NSCLC subgroup.
Nutrients 2021, 13, x FOR PEER REVIEW 13 of 19
Figure 8. Kaplan–Meier plot of progression-free survival curves with the A allele of the CYP27B1 rs4646536 gene polymorphism in the non-resected NSCLC subgroup.
Figure 9. Kaplan–Meier plot of progression-free survival curves with the C allele of the CYP24A1 rs6068816 gene polymorphism in the non-resected NSCLC subgroup.
Figure 10. Kaplan–Meier plot of progression-free survival curves with the C allele of the VDR rs7975232 gene polymorphism in the non-resected NSCLC subgroup.
Table 8. Influence of gene polymorphisms and clinical characteristic on progression-free survival of non-resected NSCLC patients.
Progression-Free Survival HR (CI95%) p-Value
BMI ( > 24) 2.23 (1.27–3.89) 0.0051 CYP27B1 rs4646536_A 2.52 (1.04–6.12) 0.0411
CYP24A1 rs6068816_TT 8.77 (1.94–39.7) 0.0048 VDR rs7975232_AA 3.08 (1.71–5.54) 0.0002
HR = hazard ratio. CI95%: 95% confidence interval.
Figure 9. Kaplan–Meier plot of progression-free survival curves with the C allele of the CYP24A1rs6068816 gene polymorphism in the non-resected NSCLC subgroup.
Nutrients 2021, 13, 3783 13 of 19
Nutrients 2021, 13, x FOR PEER REVIEW 13 of 19
Figure 8. Kaplan–Meier plot of progression-free survival curves with the A allele of the CYP27B1 rs4646536 gene polymorphism in the non-resected NSCLC subgroup.
Figure 9. Kaplan–Meier plot of progression-free survival curves with the C allele of the CYP24A1 rs6068816 gene polymorphism in the non-resected NSCLC subgroup.
Figure 10. Kaplan–Meier plot of progression-free survival curves with the C allele of the VDR rs7975232 gene polymorphism in the non-resected NSCLC subgroup.
Table 8. Influence of gene polymorphisms and clinical characteristic on progression-free survival of non-resected NSCLC patients.
Progression-Free Survival HR (CI95%) p-Value
BMI ( > 24) 2.23 (1.27–3.89) 0.0051 CYP27B1 rs4646536_A 2.52 (1.04–6.12) 0.0411
CYP24A1 rs6068816_TT 8.77 (1.94–39.7) 0.0048 VDR rs7975232_AA 3.08 (1.71–5.54) 0.0002
HR = hazard ratio. CI95%: 95% confidence interval.
Figure 10. Kaplan–Meier plot of progression-free survival curves with the C allele of the VDRrs7975232 gene polymorphism in the non-resected NSCLC subgroup.
Table 8. Influence of gene polymorphisms and clinical characteristic on progression-free survival ofnon-resected NSCLC patients.
Progression-Free Survival
HR (CI95%) p-Value
BMI ( > 24) 2.23 (1.27–3.89) 0.0051CYP27B1 rs4646536_A 2.52 (1.04–6.12) 0.0411
CYP24A1 rs6068816_TT 8.77 (1.94–39.7) 0.0048VDR rs7975232_AA 3.08 (1.71–5.54) 0.0002
HR = hazard ratio. CI95%: 95% confidence interval.
4. Discussion
Cancer survival may be influenced by vitamin D through the suppression of cellproliferation, angiogenesis, cell proliferation, and metastasis which means the inhibi-tion of tumor progression. Furthermore, the promotion of apoptosis in cancerous cellscould be triggered by vitamin D [5,16]. Survival rates in patients diagnosed with NSCLCvary, even among patients diagnosed with the same stage [9–12]. Genetic factors mayexplain these interindividual differences. Several polymorphisms in various genes in-volved in the vitamin D metabolic pathway have been suggested as possible causes of thisvariability [5,14,15,31,42,43].
After investigating the potential of the gene polymorphisms involved in the vitaminD metabolic pathway in 194 Caucasian patients (from Spain) with NSCLC, we foundthat for the general population, patients carrying the A allele for the CYP27B1 rs4545636polymorphism had a higher risk of progression and tended to have a higher risk of deaththan bearers of the GG genotype. Additionally, CYP27B1 rs4646536 maintained its asso-ciated with PFS in the subgroup of non-resected patients. To date there is only one otherstudy, conducted in an Asian population (from China) with 542 NSCLC patients, that hasevaluated the influence of CYP27B1 rs4646536 on survival. However, no statistically signif-icant association was found (p = 0.625) [5]. On the other hand, another study carried outin an Asian population (from China), with 153 (NSCLC) tumor samples, where a betteroverall survival (p = 0.018) was associated with a high CYP27B1 expression. It also foundthat alteration in gene expression may be due to SNPs, and specifically that the differ-ences in expression were statistically significant in the CYP27B1 rs3782130 polymorphism(p = 0.028) [31]. The importance of expression of CYP27B1 lies in the fact that it is the onlygene capable of converting vitamin D to its active form (1,25-dihydroxycholecalciferol) andit is this product that triggers all the biological functions of vitamin D, after binding to
Nutrients 2021, 13, 3783 14 of 19
VDR [16]. In our study, the CYP27B1 rs3782130 polymorphism was associated with PFS inthe non-resected patient subgroup in the univariate Cox regression model.
In the resected patient subgroup, the multivariate analysis revealed that patientscarrying the AA genotype for VDR rs11568820 had a higher risk of death than those with theGG genotype. Previous studies have shown contradictory results. Akiba et al., in a studywith 155 Asian NSCLC patients (from Japan), found that the A allele of VDR rs11568820 wasassociated with better overall survival (p = 0.04; HR = 0.39; CI95% = 0.16–0.97 for GA/AAvs. GG) [43]. Similarly, another study with 376 patients of Caucasian origin (from the UnitedStates) with early stage NSCLC showed that the AA/AG genotypes of VDR rs11568820had better overall survival that the GG genotype (p = 0.04; HR = 0.56; CI95% = 0.33–0.95for GA/AA vs. GG) [15]. However, a study involving 294 Caucasian patients (fromthe United States) with advanced NSCLC found no association between VDR rs11568820polymorphisms and overall survival (p = 0.82) [14]. Moreover, in our study patients bearingthe G allele of the GC rs7041 polymorphism showed a higher risk of progression thanthose with the TT genotype. Our findings are in line with the above-mentioned studyby Akiba et al., in which the TT genotype of GC rs7041 was associated with better PFS(p = 0.045; HR = 0.51; CI95% = 0.26–0.99; TT vs. TG/GG) and better OS (p = 0.003; HR = 0.21;CI95% = 0.07–0.59; TT vs. TG/GG) [43]. Subsequently, another study was carried outwith 542 Asian patients (from China), evaluating the relationship between GC rs7041 andsurvival in NSCLC. However, the results were not statistically significant (p = 0.693) [5].
With regard to the subgroup of non-resected patients, our study revealed that a higherrisk of death and of progression was associated with the TT genotype for the CYP24A1rs6068816 polymorphism in comparison to those carrying the C allele. Only one other studyof the relationship between CYP24A1 rs6068816 and survival has been conducted to date,in 542 Asian patients (from China) with NSCLC. However, it did not find a statisticallysignificant association (p = 0.072) [5].
In our study, we also found that in the non-resected patient subgroup the rs7975232and rs731236 polymorphisms of the VDR gene were associated with progression-freesurvival and overall survival, respectively. Firstly, patients in our study carrying theCC genotype for VDR rs731236 had a higher risk of death that those bearing the T allele.Previous studies have reported contradictory results. A study involving 62 patients of Asianorigin (from Turkey) with NSCLC showed that the combined TT-CC/TT-TC genotypesfor rs731236 and rs2228570, respectively, were associated with worse overall survival(HR = 1.81; CI95% = 1.23–3.48; p = 0.04) [51]. However, another later study with 155 Asianpatients (from Japan) with NSCLC did not find a statistically significant association betweenVDR rs731236 and overall survival (p = 0.26) [43]. The VDR rs7975232 polymorphism wasassociated in our study with a higher risk of death and progression. Specifically, patientscarrying the AA genotype showed worse OS and greater progression than those with theC allele. Our results are in line with a previous study in 321 Asian patients (from China)with advanced NSCLC [52]. This found an association between the AA genotype of VDRrs7975232 and worse OS (p < 0.001; HR = 2.84; CI95% = 2.63–3.94) as well as a strong tendencytoward a higher risk of progression (p = 0.053; HR = 1.43; CI95% = 0.99–2.78) than with theCC genotype [52]. Moreover, this association has been confirmed in a multiethnic meta-analysis with 3.199 cases in five studies of various types of cancer (prostate, renal, colorectal,lung, and head and neck), which revealed that the AA genotype of VDR rs7975232wasassociated with worse PFS (HR = 1.29; CI95% = 1.02–1.56) [53].
The CYP2R1 rs10741657 polymorphism has been studied recently. A study in anAsian population (from China) with 542 cases of NSCLC found that patients with the GGand AG genotypes had better OS than those with the AA genotype (p = 0.033; HR = 0.69;CI95% = 0.46–0.97), particularly elderly patients not receiving chemotherapy [5]. In ourpatients this effect could not be confirmed. However, we did observe a strong tendency inthe univariate Cox regression model toward OS in the general population.
Finally, a multiethnic meta-analysis of various types of cancer with 9926 cases in10 studies (prostate, lung, colorectal, skin, glioma, and head and neck) for VDR rs1544410
Nutrients 2021, 13, 3783 15 of 19
and 11,334 cases in 12 studies (breast, prostate, lung, colorectal, skin, glioma, ovarian, andhead and neck) for VDR rs2228570 evaluated the association of these two polymorphismswith OS. In particular, the AA/AG genotypes of VDR rs1544410 were associated withworse OS (HR = 1.40; CI95% = 1.05–1.75; AA/AG vs. GG) [53]. In our study, the univariateCox regression model showed that the AA genotype for the VDR rs1544410 polymorphismwas associated with worse OS in non-resected patients compared to the G allele. However,after the multivariate Cox regression this association was not sustained. The VDR rs2228570polymorphism was not associated with OS in the meta-analysis described above (HR = 1.26;CI95% = 0.96–1.56) [53]. Our study is in agreement with those results, since we did not obtainstatistically significant associations for VDR rs2228570 in any of the subgroups analyzed.
Vitamin D is strongly related to survival and risk of NSCLC. There is therefore a pre-sumption that alterations in the genes involved in the metabolic pathway of vitamin D mayaffect their expression and functionality [15,28,36–40]. Each of the genes fulfills a uniqueand characteristic function within the metabolic process of vitamin D. We can therefore sur-mise that variations in one or more genes may entail a worse prognosis. Thus far, we knowthat the genetic expression of CYP24A1, CYP27B1, and VDR in lung cancer is affected bytumor differentiation and characterization. When the tumor is poorly differentiated, thereis greater expression of CYP24A1 and reduced expression of CYP27B1 [36,38]. Increasedexpression of VDR in lung cancer is associated with better survival [40,54]. This may berelated to a lower proliferative state and G1-phase arrest of high VDR-expressing tumorcells [40,54]. Continued research is needed on the mechanism by which the SNPs associatedwith the vitamin D metabolic pathway affect overall survival and progression-free survivalin patients with NSCLC.
This study presents a cohort of patients diagnosed with NSCLC from the same insti-tution and treated under the same therapeutic protocol, ensuring the uniformity of thesample in the measurement of the survival variables analyzed. Although the sample sizein our study is limited and it was not possible to detect some associations, the effect of thepolymorphisms in the CYP27B1, CYP24A1, GC y VDR genes was clear.
5. Conclusions
This study found that the CYP27B1 rs4646535, CYP24A1 rs6068816, GC rs7041, VDRrs11568820, VDR rs731236, and VDR rs7975232 polymorphisms are associated with survivalin NSCLC and may have a substantial role as prognostic markers of the disease. We foundno relationship between the CYP27B1 rs3782130, CYP27B1 rs10877012, CYP24A1 rs4809957,CYP2R1 rs10741657, VDR rs1544410, and VDR rs2228570 polymorphisms and survival inour patients.
Supplementary Materials: The following are available online at https://www.mdpi.com/article/10.3390/nu13113783/s1, Table S1: Clinical characteristics and association with overall survival of the194 NSCLC patients. Table S2: Clinical characteristics and association with progression-free survivalof the 194 NSCLC patients. Table S3: Clinical characteristics and association with overall survivalof the resected NSCLC patients. Table S4: Clinical characteristics and association with progression-free survival of the resected NSCLC patients. Table S5: Clinical characteristics and associationwith overall survival of the non-resected NSCLC patients. Table S6: Clinical characteristics andassociation with progression-free survival of the non-resected NSCLC patients. Table S7: Minorallele frequencies of SNPs. Table S8: Hardy–Weinberg Equilibrium (OS). Table S9: Hardy–WeinbergEquilibrium (PFS). Table S10: Linkage disequilibrium. Table S11: Polymorphisms and associationwith overall survival of the 194 NSCLC patients. Table S12: Polymorphisms and association withprogression-free survival of the 194 NSCLC patients. Table S13: Polymorphisms and association withoverall survival of the resected NSCLC patients. Table S14: Polymorphisms and association withoverall survival of the non-resected NSCLC patients. Table S15: Polymorphisms and association withprogression-free survival of the resected NSCLC patients. Table S16: Polymorphisms and associationwith progression-free survival of the non-resected NSCLC patients. Figure S1. Kaplan–Meier plotof overall survival curves by gender in 194 patients with NSCLC. Figure S2. Kaplan–Meier plot ofoverall survival curves by drinking status in 194 patients with NSCLC. Figure S3. Kaplan–Meier plot
Nutrients 2021, 13, 3783 16 of 19
of overall survival curves by tumor stage in 194 patients with NSCLC. Figure S4. Kaplan–Meier plotof overall survival curves by first-line treatment (divided by surgery) in 194 patients with NSCLC.Figure S5. Kaplan–Meier plot of progression-free survival curves with previous lung disease in 194patients with NSCLC. Figure S6. Kaplan–Meier plot of progression-free survival curves by drinkingstatus in 194 patients with NSCLC. Figure S7. Kaplan–Meier plot of progression-free survival curvesby tumor stage in 194 patients with NSCLC. Figure S8. Kaplan–Meier plot of progression-freesurvival curves by first-line treatment (divided by surgery) in 194 patients with NSCLC. Figure S9.Kaplan–Meier plot of overall survival curves with family history of cancer in the resected NSCLCsubgroup. Figure S10. Kaplan–Meier plot of progression-free survival curves by tumor stage in theresected NSCLC subgroup. Figure S11. Kaplan–Meier plot of overall survival curves by gender inthe non-resected NSCLC subgroup. Figure S12. Kaplan–Meier plot of overall survival curves bydrinking status in the non-resected NSCLC subgroup. Figure S13. Kaplan–Meier plot of overallsurvival curves by tumor stage in the non-resected NSCLC subgroup. Figure S14. Kaplan–Meierplot of progression-free survival curves by body mass index in the non-resected NSCLC subgroup.Figure S15. Kaplan–Meier plot of overall survival curves with the T allele of the GC rs7041 genepolymorphism in the resected NSCLC subgroup. Figure S16. Kaplan–Meier plot of overall survivalcurves with the G allele of the VDR rs1544410 gene polymorphism in the non-resected NSCLCsubgroup. Figure S17. Kaplan–Meier plot of overall survival curves with the C allele of the VDRrs7975232 gene polymorphism in the non-resected NSCLC subgroup. Figure S18. Kaplan–Meier plotof progression-free survival curves with the G allele of the VDR rs11568820 gene polymorphism inthe resected NSCLC subgroup. Figure S19. Kaplan–Meier plot of progression-free survival curveswith the G allele of the CYP27B1 rs3782130 gene polymorphism in the non-resected NSCLC subgroup.Figure S20. Kaplan–Meier plot of progression-free survival curves with the G allele of the CYP27B1rs10877012 gene polymorphism in the non-resected NSCLC subgroup. Figure S21. Kaplan–Meierplot of progression-free survival curves with the T allele of the VDR rs731236 gene polymorphism inthe non-resected NSCLC subgroup.
Author Contributions: L.E.P.L. and C.P.R. conceived and designed the experiments; L.E.P.L. per-formed the experiments; L.E.P.L. and J.M.G.N. collected samples; L.E.P.L. and C.P.R. analyzed thedata; F.M.M. and A.S.M. contributed materials and analysis tools; L.E.P.L. prepared the original draft;C.P.R., A.S.M., F.M.M., and M.d.C.R.T. reviewed and edited the draft; L.E.P.L., C.P.R., and A.S.M.reviewed the analysis and interpretation; A.J.M. supervised funding acquisition. All the authorsparticipated in critically reviewing the manuscript and improving its intellectual content. All authorshave read and agreed to the published version of the manuscript.
Funding: The ERDF funds (EU) from the Instituto de Salud Carlos III (PT13/0010/0039) supportedby cofounding grants the Virgen de las Nieves University Hospital Biobank.
Institutional Review Board Statement: The guidelines of the Declaration of Helsinki and approvedby the Ethics and Research Committee of the Sistema Andaluz de Salud (code: 1322-N-20) werefollowed in the conductance of this study.
Informed Consent Statement: All subjects involved in the study signed the written informedconsent form.
Acknowledgments: The results of this study are part of the doctoral thesis presented by Laura ElenaPineda Lancheros at the University of Granada.
Conflicts of Interest: The authors declare that there is no competing financial interest in relation tothe work described in this article and that there is no conflict of interest that could be perceived asprejudicing the impartiality of the research reported.
Abbreviations
AJCC: American Joint Committee on Cancer; CI: confidence interval; CYP24A1: cytochrome P450family 24 subfamily A member 1; CYP27B1: cytochrome P450 family 27 subfamily B member 1;CYP2R1: cytochrome P450 family 2 subfamily R member 1; GC: GC Vitamin D Binding Protein(gene); HR: hazard ratio; BMI: body mass index; MAF: minor allele frequency; NA: not available;NR: not reached; NSCLC: non-small-cell lung cancer; OS: overall survival; PCR: polymerase chainreaction; PFS: progression-free survival; SAS: Sistema Andaluz de Salud (Andalusian Health Service);
Nutrients 2021, 13, 3783 17 of 19
SNP: single nucleotide polymorphism; VDBP: vitamin D binding protein; VDR: vitamin D receptor(gene);VDR: vitamin D receptor (protein); RXR: retinoid X receptor.
References1. Sung, H.; Ferlay, J.; Siegel, R.L.; Laversanne, M.; Soerjomataram, I.; Jemal, A.; Bray, F. Global Cancer Statistics 2020: GLOBO-
CAN Estimates of Incidence and Mortality Worldwide for 36 Cancers in 185 Countries. CA Cancer J. Clin. 2021, 71, 209–249.[CrossRef] [PubMed]
2. Siegel, R.L.; Miller, K.D.; Fuchs, H.E.; Jemal, A. Cancer Statistics, 2021. CA Cancer J. Clin. 2021, 71, 7–33. [CrossRef]3. Marshall, A.L.; Christiani, D.C. Genetic susceptibility to lung cancer-light at the end of the tunnel? Carcinogenesis 2013, 34, 487–502.
[CrossRef] [PubMed]4. Ge, N.; Chu, X.M.; Xuan, Y.P.; Ren, D.Q.; Wang, Y.; Ma, K.; Gao, H.J.; Jiao, W.J. Associations between abnormal vitamin D
metabolism pathway function and non-small cell lung cancer. Oncol. Lett. 2017, 14, 7538–7544. [CrossRef] [PubMed]5. Kong, J.; Chen, X.; Wang, J.; Li, J.; Xu, F.; Gao, S.; Yu, H.; Qian, B. Genetic Polymorphisms in the Vitamin D Pathway and
Non-small Cell Lung Cancer Survival. Pathol. Oncol. Res. 2020, 26, 1709–1715. [CrossRef] [PubMed]6. Asselain, B.; Barrière, J.R.; Clarot, C.; Vabre, J.P.; Gentil Le Pecq, B.; Duval, Y.; Thomas, P.; Herman, D.; Grivaux, M.; Debieuvre, D.
Metastatic NSCLC: Clinical, molecular, and therapeutic factors associated with long-term survival. Respir. Med. Res. 2019, 76,38–44. [CrossRef] [PubMed]
7. Blandin Knight, S.; Crosbie, P.A.; Balata, H.; Chudziak, J.; Hussell, T.; Dive, C. Progress and prospects of early detection in lungcancer. Open. Biol. 2017, 7. [CrossRef]
8. Goldstraw, P.; Chansky, K.; Crowley, J.; Rami-Porta, R.; Asamura, H.; Eberhardt, W.E.; Nicholson, A.G.; Groome, P.; Mitchell, A.;Bolejack, V. The IASLC Lung Cancer Staging Project: Proposals for Revision of the TNM Stage Groupings in the Forthcoming(Eighth) Edition of the TNM Classification for Lung Cancer. J. Thorac. Oncol. 2016, 11, 39–51. [CrossRef] [PubMed]
9. Davis, J.S.; Prophet, E.; Peng, H.L.; Lee, H.Y.; Tidwell, R.S.S.; Lee, J.J.; Thomas, A.; Szabo, E.; Chang, S. Potential Influence onClinical Trials of Long-Term Survivors of Stage IV Non-small cell Lung Cancer. JNCI Cancer Spectr. 2019, 3, pkz010. [CrossRef]
10. Wang, T.; Nelson, R.A.; Bogardus, A.; Grannis, F.W., Jr. Five-year lung cancer survival: Which advanced stage nonsmall cell lungcancer patients attain long-term survival? Cancer 2010, 116, 1518–1525. [CrossRef]
11. Simeone, J.C.; Nordstrom, B.L.; Patel, K.; Klein, A.B. Treatment patterns and overall survival in metastatic non-small-cell lungcancer in a real-world, US setting. Future Oncol. 2019, 15, 3491–3502. [CrossRef]
12. Cornwell, L.D.; Echeverria, A.E.; Samuelian, J.; Mayor, J.; Casal, R.F.; Bakaeen, F.G.; Omer, S.; Preventza, O.; Mai, W.;Chen, G.; et al. Video-assisted thoracoscopic lobectomy is associated with greater recurrence-free survival than stereotacticbody radiotherapy for clinical stage I lung cancer. J. Thorac. Cardiovasc. Surg. 2018, 155, 395–402. [CrossRef] [PubMed]
13. Pérez-Ramírez, C.; Cañadas-Garre, M.; Alnatsha, A.; Molina, M.; Robles, A.I.; Villar, E.; Delgado, J.R.; Faus-Dáder, M.J.;Calleja-Hernández, M. Interleukins as new prognostic genetic biomarkers in non-small cell lung cancer. Surg. Oncol. 2017, 26,278–285. [CrossRef]
14. Heist, R.S.; Zhou, W.; Wang, Z.; Liu, G.; Neuberg, D.; Su, L.; Asomaning, K.; Hollis, B.W.; Lynch, T.J.; Wain, J.C.; et al. Circulating25-hydroxyvitamin D, VDR polymorphisms, and survival in advanced non-small-cell lung cancer. J. Clin. Oncol. 2008, 26,5596–5602. [CrossRef] [PubMed]
15. Zhou, W.; Heist, R.S.; Liu, G.; Neuberg, D.S.; Asomaning, K.; Su, L.; Wain, J.C.; Lynch, T.J.; Giovannucci, E.; Christiani, D.C.Polymorphisms of vitamin D receptor and survival in early-stage non-small cell lung cancer patients. Cancer Epidemiol. Biomark.Prev. 2006, 15, 2239–2245. [CrossRef] [PubMed]
16. Latacz, M.; Snarska, J.; Kostyra, E.; Fiedorowicz, E.; Savelkoul, H.F.; Grzybowski, R.; Cieslinska, A. Single Nucleotide Polymor-phisms in 25-Hydroxyvitamin D3 1-Alpha-Hydroxylase (CYP27B1) Gene: The Risk of Malignant Tumors and Other ChronicDiseases. Nutrients 2020, 12, 801. [CrossRef]
17. Yu, W.D.; Ma, Y.; Flynn, G.; Muindi, J.R.; Kong, R.X.; Trump, D.L.; Johnson, C.S. Calcitriol enhances gemcitabine anti-tumoractivity in vitro and in vivo by promoting apoptosis in a human pancreatic carcinoma model system. Cell Cycle 2010, 9,3022–3029. [CrossRef]
18. El-Sharkawy, A.; Malki, A. Vitamin D Signaling in Inflammation and Cancer: Molecular Mechanisms and Therapeutic Implications.Molecules 2020, 25, 3219. [CrossRef]
19. Negri, M.; Gentile, A.; de Angelis, C.; Montò, T.; Patalano, R.; Colao, A.; Pivonello, R.; Pivonello, C. Vitamin D-Induced MolecularMechanisms to Potentiate Cancer Therapy and to Reverse Drug-Resistance in Cancer Cells. Nutrients 2020, 12, 1798. [CrossRef]
20. Scazzone, C.; Agnello, L.; Lo Sasso, B.; Salemi, G.; Gambino, C.M.; Ragonese, P.; Candore, G.; Ciaccio, A.M.; Giglio, R.V.;Bivona, G.; et al. FOXP3 and GATA3 Polymorphisms, Vitamin D3 and Multiple Sclerosis. Brain Sci. 2021, 11, 415. [CrossRef]
21. Higashimoto, Y.; Ohata, M.; Nishio, K.; Iwamoto, Y.; Fujimoto, H.; Uetani, K.; Suruda, T.; Nakamura, Y.; Funasako, M.; Saijo, N.1 alpha, 25-dihydroxyvitamin D3 and all-trans-retinoic acid inhibit the growth of a lung cancer cell line. Anticancer Res. 1996, 16,2653–2659.
22. Light, B.W.; Yu, W.D.; McElwain, M.C.; Russell, D.M.; Trump, D.L.; Johnson, C.S. Potentiation of cisplatin antitumor activityusing a vitamin D analogue in a murine squamous cell carcinoma model system. Cancer Res. 1997, 57, 3759–3764. [PubMed]

Nutrients 2021, 13, 3783 18 of 19
23. Hershberger, P.A.; McGuire, T.F.; Yu, W.D.; Zuhowski, E.G.; Schellens, J.H.; Egorin, M.J.; Trump, D.L.; Johnson, C.S. Cisplatinpotentiates 1,25-dihydroxyvitamin D3-induced apoptosis in association with increased mitogen-activated protein kinase kinasekinase 1 (MEKK-1) expression. Mol. Cancer Ther. 2002, 1, 821–829. [PubMed]
24. Young, M.R.; Ihm, J.; Lozano, Y.; Wright, M.A.; Prechel, M.M. Treating tumor-bearing mice with vitamin D3 diminishes tumor-induced myelopoiesis and associated immunosuppression, and reduces tumor metastasis and recurrence. Cancer Immunol.Immunother. 1995, 41, 37–45. [CrossRef] [PubMed]
25. Nakagawa, K.; Kawaura, A.; Kato, S.; Takeda, E.; Okano, T. 1 alpha,25-Dihydroxyvitamin D(3) is a preventive factor in themetastasis of lung cancer. Carcinogenesis 2005, 26, 429–440. [CrossRef]
26. Anic, G.M.; Weinstein, S.J.; Mondul, A.M.; Männistö, S.; Albanes, D. Serum vitamin D, vitamin D binding protein, and lungcancer survival. Lung Cancer 2014, 86, 297–303. [CrossRef]
27. Wu, X.; Cheng, J.; Yang, K. Vitamin D-Related Gene Polymorphisms, Plasma 25-Hydroxy-Vitamin D, Cigarette Smoke andNon-Small Cell Lung Cancer (NSCLC) Risk. Int. J. Mol. Sci. 2016, 17, 1597. [CrossRef]
28. Haznadar, M.; Krausz, K.W.; Margono, E.; Diehl, C.M.; Bowman, E.D.; Manna, S.K.; Robles, A.I.; Ryan, B.M.; Gonzalez, F.J.;Harris, C.C. Inverse association of vitamin D(3) levels with lung cancer mediated by genetic variation. Cancer Med. 2018, 7,2764–2775. [CrossRef]
29. Jeon, S.M.; Shin, E.A. Exploring vitamin D metabolism and function in cancer. Exp. Mol. Med. 2018, 50, 1–14. [CrossRef]30. Bivona, G.; Agnello, L.; Ciaccio, M. The immunological implication of the new vitamin D metabolism. Cent. Eur. J. Immunol. 2018,
43, 331–334. [CrossRef]31. Kong, J.; Xu, F.; Qu, J.; Wang, Y.; Gao, M.; Yu, H.; Qian, B. Genetic polymorphisms in the vitamin D pathway in relation to lung
cancer risk and survival. Oncotarget 2015, 6, 2573–2582. [CrossRef]32. Rozmus, D.; Ciesielska, A.; Płominski, J.; Grzybowski, R.; Fiedorowicz, E.; Kordulewska, N.; Savelkoul, H.; Kostyra, E.;
Cieslinska, A. Vitamin D Binding Protein (VDBP) and Its Gene Polymorphisms-The Risk of Malignant Tumors and Other Diseases.Int. J. Mol. Sci. 2020, 21, 7822. [CrossRef]
33. Agnello, L.; Scazzone, C.; Lo Sasso, B.; Bellia, C.; Bivona, G.; Realmuto, S.; Brighina, F.; Schillaci, R.; Ragonese, P.; Salemi, G.; et al.VDBP, CYP27B1, and 25-Hydroxyvitamin D Gene Polymorphism Analyses in a Group of Sicilian Multiple Sclerosis Patients.Biochem. Genet. 2017, 55, 183–192. [CrossRef]
34. Duan, L.; Xue, Z.; Ji, H.; Zhang, D.; Wang, Y. Effects of CYP2R1 gene variants on vitamin D levels and status: A systematic reviewand meta-analysis. Gene 2018, 678, 361–369. [CrossRef]
35. Scazzone, C.; Agnello, L.; Ragonese, P.; Lo Sasso, B.; Bellia, C.; Bivona, G.; Schillaci, R.; Salemi, G.; Ciaccio, M. Association ofCYP2R1 rs10766197 with MS risk and disease progression. J. Neurosci. Res. 2018, 96, 297–304. [CrossRef] [PubMed]
36. Parise, R.A.; Egorin, M.J.; Kanterewicz, B.; Taimi, M.; Petkovich, M.; Lew, A.M.; Chuang, S.S.; Nichols, M.; El-Hefnawy, T.;Hershberger, P.A. CYP24, the enzyme that catabolizes the antiproliferative agent vitamin D, is increased in lung cancer.Int. J. Cancer 2006, 119, 1819–1828. [CrossRef] [PubMed]
37. Cancela Díez, B.; Pérez-Ramírez, C.; Maldonado-Montoro, M.D.M.; Carrasco-Campos, M.I.; Sánchez Martín, A.; Pineda Lancheros, L.E.;Martínez-Martínez, F.; Calleja-Hernández, M.; Ramírez-Tortosa, M.C.; Jiménez-Morales, A. Association between polymorphismsin the vitamin D receptor and susceptibility to multiple sclerosis. Pharm. Genom. 2021, 31, 40–47. [CrossRef]
38. Yokomura, K.; Suda, T.; Sasaki, S.; Inui, N.; Chida, K.; Nakamura, H. Increased expression of the 25-hydroxyvitamin D(3)-1alpha-hydroxylase gene in alveolar macrophages of patients with lung cancer. J. Clin. Endocrinol. Metab. 2003, 88, 5704–5709.[CrossRef] [PubMed]
39. Wang, W.; Hu, W.; Xue, S.; Chen, Q.; Jiang, Y.; Zhang, H.; Zuo, W. Vitamin D and Lung Cancer; Association, Prevention, andTreatment. Nutr. Cancer 2020, 1–13. [CrossRef]
40. Srinivasan, M.; Parwani, A.V.; Hershberger, P.A.; Lenzner, D.E.; Weissfeld, J.L. Nuclear vitamin D receptor expression is associatedwith improved survival in non-small cell lung cancer. J. Steroid Biochem. Mol. Biol. 2011, 123, 30–36. [CrossRef]
41. Scazzone, C.; Agnello, L.; Sasso, B.L.; Ragonese, P.; Bivona, G.; Realmuto, S.; Iacolino, G.; Gambino, C.M.; Bellia, C.; Salemi, G.; et al.Klotho and vitamin D in multiple sclerosis: An Italian study. Arch. Med. Sci. 2020, 16, 842–847. [CrossRef] [PubMed]
42. Liu, Y.; Chen, W.; Hu, Z.B.; Xu, L.; Shu, Y.Q.; Pan, S.Y.; Dai, J.C.; Jin, G.F.; Ma, H.X.; Shen, H.B. Plasma Vitamin D Levels andVitamin D Receptor Polymorphisms Are Associated with Survival of Non-small Cell Lung Cancer. Chin. J. Cancer Res. 2011, 23,33–37. [CrossRef] [PubMed]
43. Akiba, T.; Morikawa, T.; Odaka, M.; Nakada, T.; Kamiya, N.; Yamashita, M.; Yabe, M.; Inagaki, T.; Asano, H.; Mori, S.; et al.Vitamin D Supplementation and Survival of Patients with Non-small Cell Lung Cancer: A Randomized, Double-Blind, Pla-cebo-Controlled Trial. Clin. Cancer. Res. 2018, 24, 4089–4097. [CrossRef]
44. Ettinger, D.S.; Wood, D.E.; Aggarwal, C.; Aisner, D.L.; Akerley, W.; Bauman, J.R.; Bharat, A.; Bruno, D.S.; Chang, J.Y.;Chi-rieac, L.R.; et al. NCCN Guidelines Insights: Non-Small Cell Lung Cancer, Version 1.2020. J. Natl. Compr. Cancer Netw. 2019,17, 1464–1472. [CrossRef] [PubMed]
45. Ochoa Mangado, E.; Madoz-Gúrpide, A.; Vicente Muelas, N. Diagnóstico y tratamiento de la dependencia de alcohol. Med. Segur.Trab. 2009, 55, 26–40. [CrossRef]
46. Edge, S.; Byrd, D.R.; Compton, C.C.; Fritz, A.G.; Green, F.L.; Trotti, A. (Eds.) AJCC Cancer Staging Manual; Springer-Verlag New York:New York, NY, USA, 2010; Volume 7.
47. Team RC. R: A Language and Environment for Statistical Computing 4.0.2.; R Core Team: Vienna, Austria, 2020.
Nutrients 2021, 13, 3783 19 of 19
48. Purcell, S.; Neale, B.; Todd-Brown, K.; Thomas, L.; Ferreira, M.A.; Bender, D.; Maller, J.; Sklar, P.; de Bakker, P.I.; Daly, M.J.; et al.PLINK: A tool set for whole-genome association and population-based linkage analyses. Am. J. Hum. Genet. 2007, 81,559–575. [CrossRef]
49. Barrett, J.C.; Fry, B.; Maller, J.; Daly, M.J. Haploview: Analysis and visualization of LD and haplotype maps. Bioinformatics 2005,21, 263–265. [CrossRef]
50. Auton, A.; Brooks, L.D.; Durbin, R.M.; Garrison, E.P.; Kang, H.M.; Korbel, J.O.; Marchini, J.L.; McCarthy, S.; McVean, G.A.;Abecasis, G.R. A global reference for human genetic variation. Nature 2015, 526, 68–74. [CrossRef]
51. Turna, A.; Pekçolaklar, A.; Metin, M.; Yaylim, I.; Gurses, A. The effect of season of operation on the survival of patients withresected non-small cell lung cancer. Interact. Cardiovasc. Thorac. Surg. 2012, 14, 151–155. [CrossRef]
52. Xiong, L.; Cheng, J.; Gao, J.; Wang, J.; Liu, X.; Wang, L. Vitamin D receptor genetic variants are associated with chemotherapyresponse and prognosis in patients with advanced non-small-cell lung cancer. Clin. Lung. Cancer. 2013, 14, 433–439. [CrossRef]
53. Vaughan-Shaw, P.G.; O’Sullivan, F.; Farrington, S.M.; Theodoratou, E.; Campbell, H.; Dunlop, M.G.; Zgaga, L. The impactof vitamin D pathway genetic variation and circulating 25-hydroxyvitamin D on cancer outcome: Systematic review andme-ta-analysis. Br. J. Cancer 2017, 116, 1092–1110. [CrossRef] [PubMed]
54. Kim, S.H.; Chen, G.; King, A.N.; Jeon, C.K.; Christensen, P.J.; Zhao, L.; Simpson, R.U.; Thomas, D.G.; Giordano, T.J.;Brenner, D.E.; et al. Characterization of vitamin D receptor (VDR) in lung adenocarcinoma. Lung Cancer 2012, 77, 265–271.[CrossRef] [PubMed]