Embed Size (px)
Citation preview
Impact of heat waves (HWs) on air pollution
(case study for HWs episode in July-August 2010 in the
Kiev city (Ukraine)
Prof. Sergiy Snizhko,
Dr. Olga Shevchenko
Taras Shevchenko University,
Kiev, Ukraine
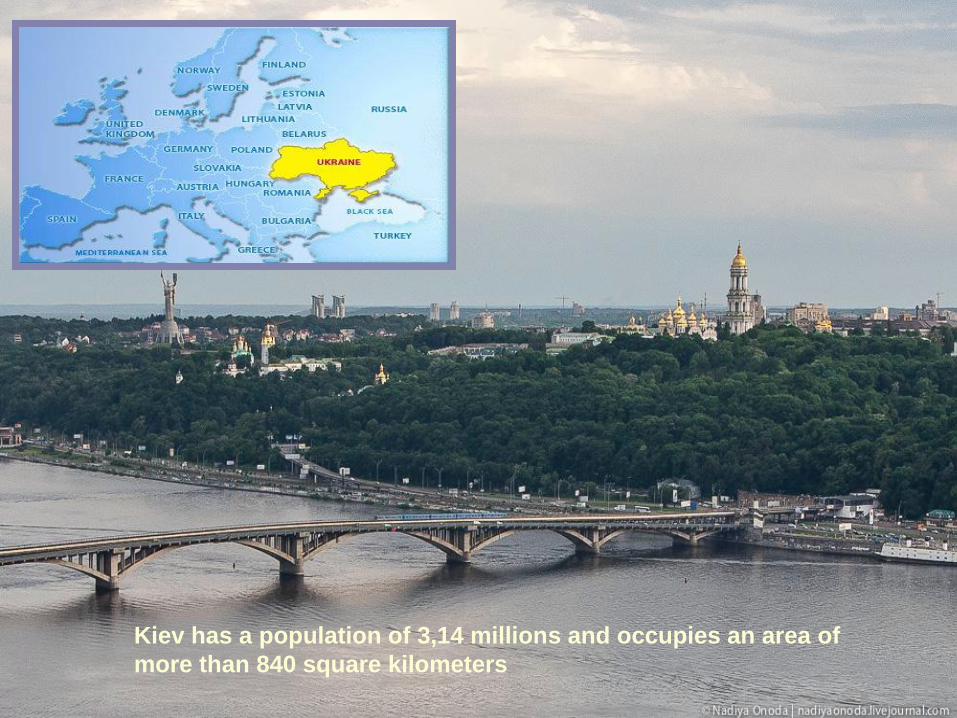
Kiev has a population of 3,14 millions and occupies an area of
more than 840 square kilometers
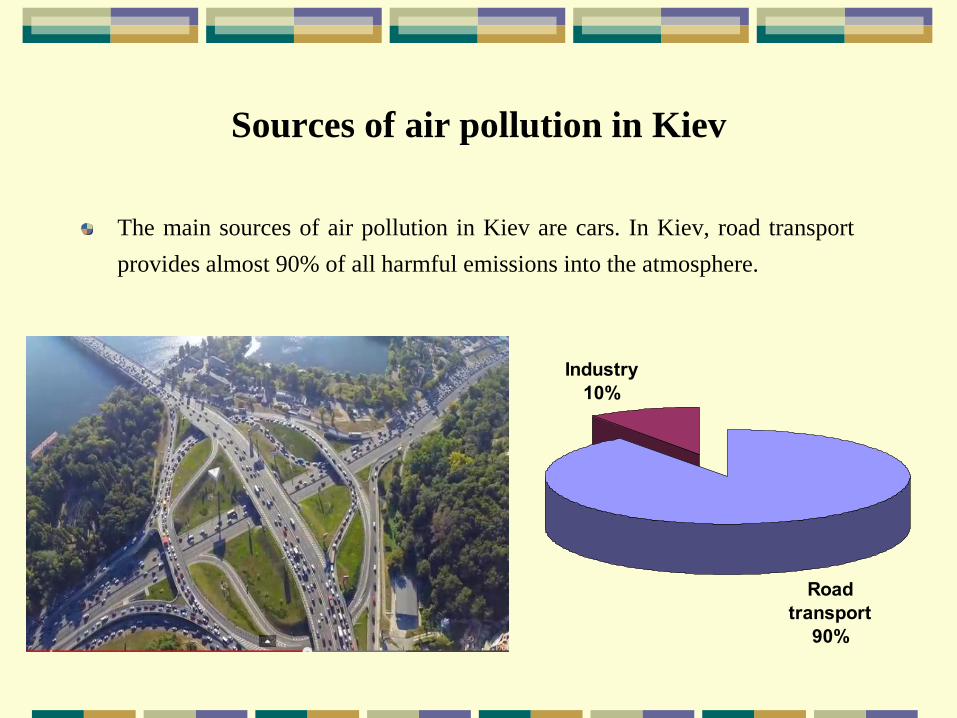
Sources of air pollution in Kiev
The main sources of air pollution in Kiev are cars. In Kiev, road transport
provides almost 90% of all harmful emissions into the atmosphere.
Road
transport
90%
Industry
10%
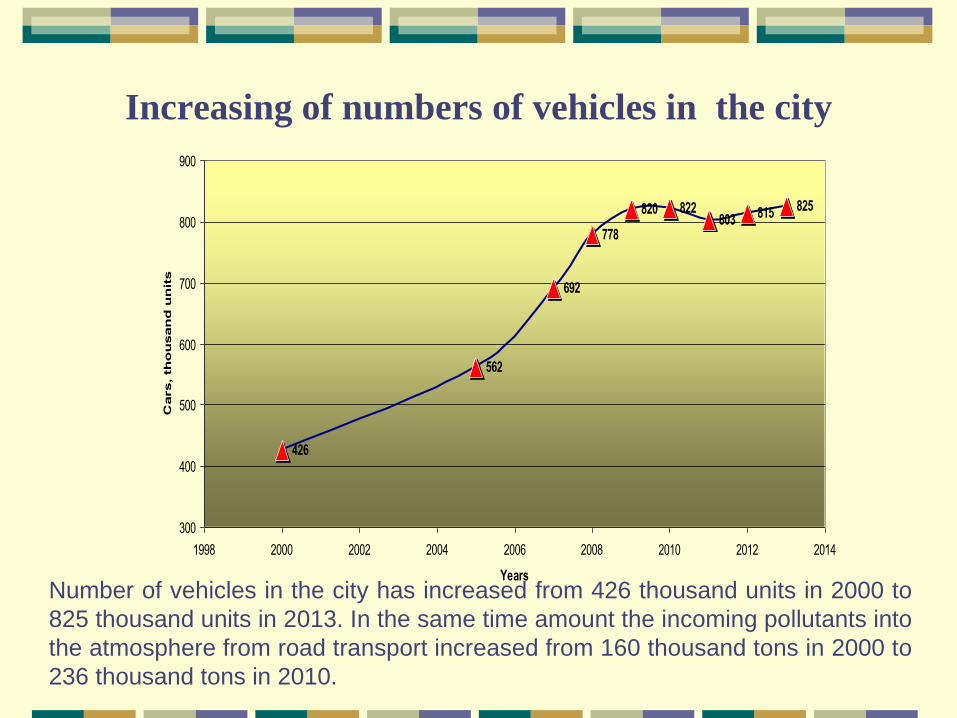
Increasing of numbers of vehicles in the city
Number of vehicles in the city has increased from 426 thousand units in 2000 to
825 thousand units in 2013. In the same time amount the incoming pollutants into
the atmosphere from road transport increased from 160 thousand tons in 2000 to
236 thousand tons in 2010.
426
562
692
778
820 822803 815 825
300
400
500
600
700
800
900
1998 2000 2002 2004 2006 2008 2010 2012 2014
Years
Cars, th
ou
san
d u
nit
s
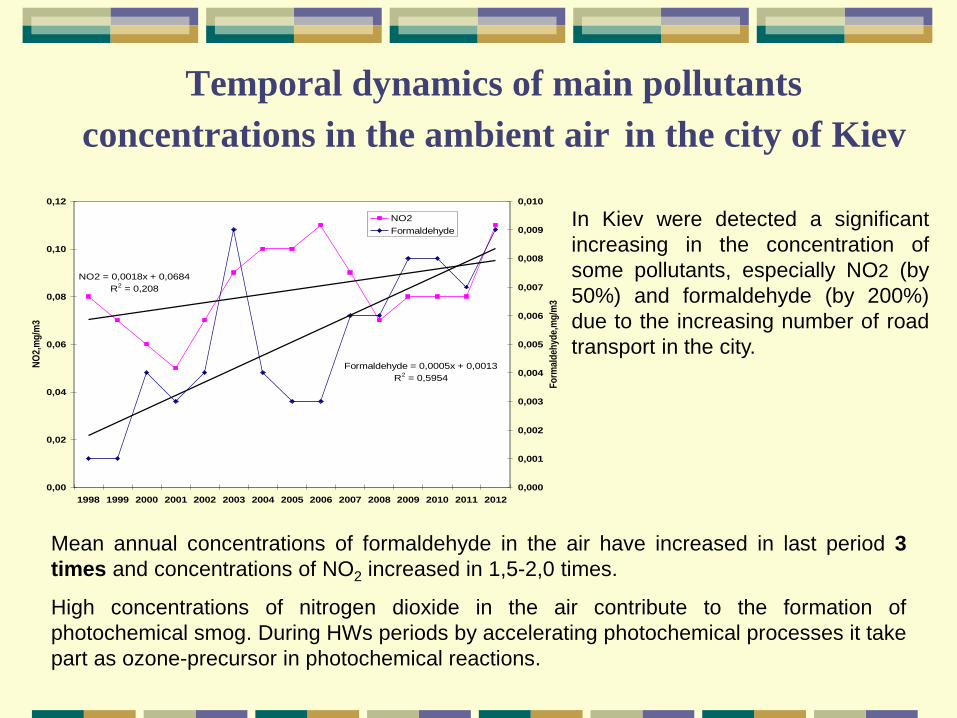
Temporal dynamics of main pollutants
concentrations in the ambient air in the city of Kiev
NO2 = 0,0018x + 0,0684
R2 = 0,208
Formaldehyde = 0,0005x + 0,0013
R2 = 0,5954
0,00
0,02
0,04
0,06
0,08
0,10
0,12
1998 1999 2000 2001 2002 2003 2004 2005 2006 2007 2008 2009 2010 2011 2012
NO
2,m
g/m
3
0,000
0,001
0,002
0,003
0,004
0,005
0,006
0,007
0,008
0,009
0,010
Fo
rmal
deh
yde,
mg
/m3
NO2
FormaldehydeIn Kiev were detected a significant
increasing in the concentration of
some pollutants, especially NO2 (by
50%) and formaldehyde (by 200%)
due to the increasing number of road
transport in the city.
Mean annual concentrations of formaldehyde in the air have increased in last period 3
times and concentrations of NO2 increased in 1,5-2,0 times.
High concentrations of nitrogen dioxide in the air contribute to the formation of
photochemical smog. During HWs periods by accelerating photochemical processes it take
part as ozone-precursor in photochemical reactions.
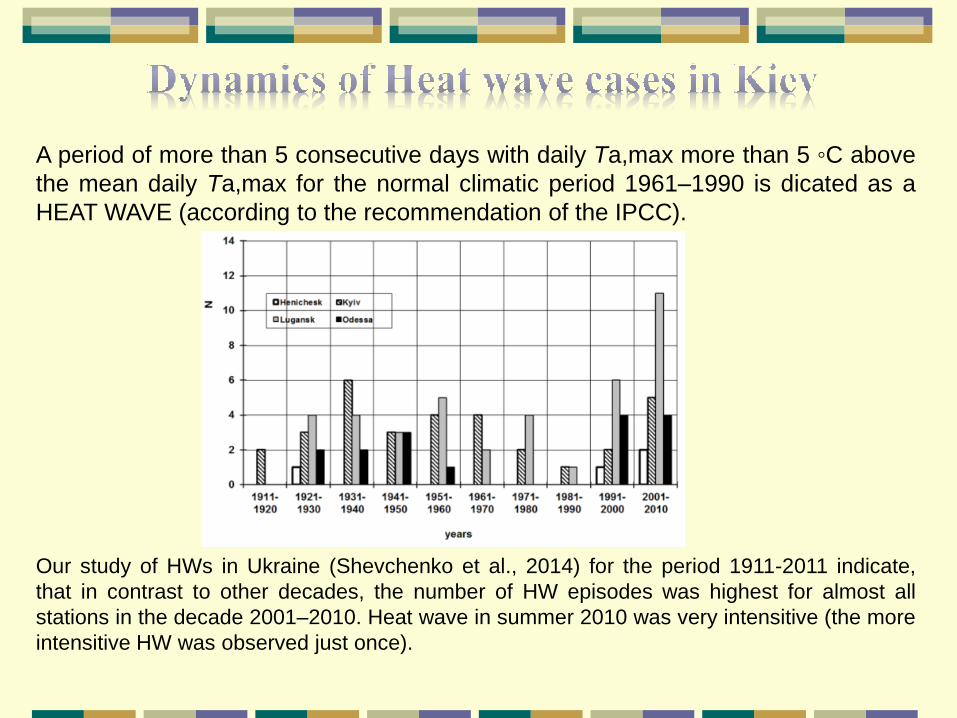
Our study of HWs in Ukraine (Shevchenko et al., 2014) for the period 1911-2011 indicate,
that in contrast to other decades, the number of HW episodes was highest for almost all
stations in the decade 2001–2010. Heat wave in summer 2010 was very intensitive (the more
intensitive HW was observed just once).
A period of more than 5 consecutive days with daily Ta,max more than 5 ◦C above
the mean daily Ta,max for the normal climatic period 1961–1990 is dicated as a
HEAT WAVE (according to the recommendation of the IPCC).
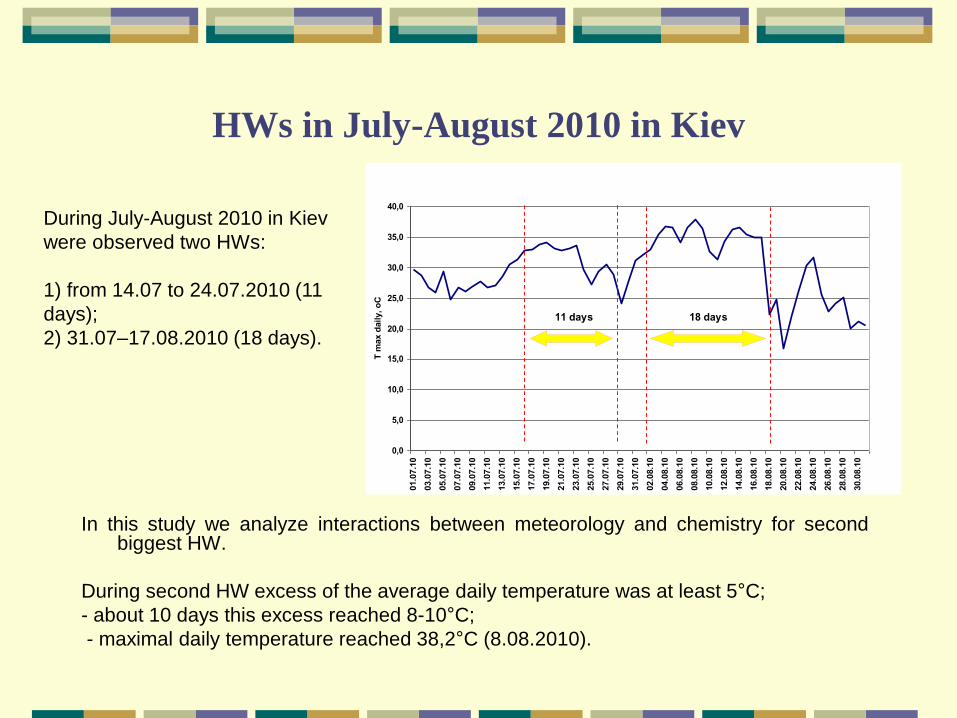
HWs in July-August 2010 in Kiev
In this study we analyze interactions between meteorology and chemistry for second biggest HW.
During second HW excess of the average daily temperature was at least 5°C;
- about 10 days this excess reached 8-10°C;
- maximal daily temperature reached 38,2°C (8.08.2010).
0,0
5,0
10,0
15,0
20,0
25,0
30,0
35,0
40,0
01.0
7.1
0
03.0
7.1
0
05.0
7.1
0
07.0
7.1
0
09.0
7.1
0
11.0
7.1
0
13.0
7.1
0
15.0
7.1
0
17.0
7.1
0
19.0
7.1
0
21.0
7.1
0
23.0
7.1
0
25.0
7.1
0
27.0
7.1
0
29.0
7.1
0
31.0
7.1
0
02.0
8.1
0
04.0
8.1
0
06.0
8.1
0
08.0
8.1
0
10.0
8.1
0
12.0
8.1
0
14.0
8.1
0
16.0
8.1
0
18.0
8.1
0
20.0
8.1
0
22.0
8.1
0
24.0
8.1
0
26.0
8.1
0
28.0
8.1
0
30.0
8.1
0
T m
ax d
aily, o
C
11 days 18 days
During July-August 2010 in Kiev
were observed two HWs:
1) from 14.07 to 24.07.2010 (11
days);
2) 31.07–17.08.2010 (18 days).
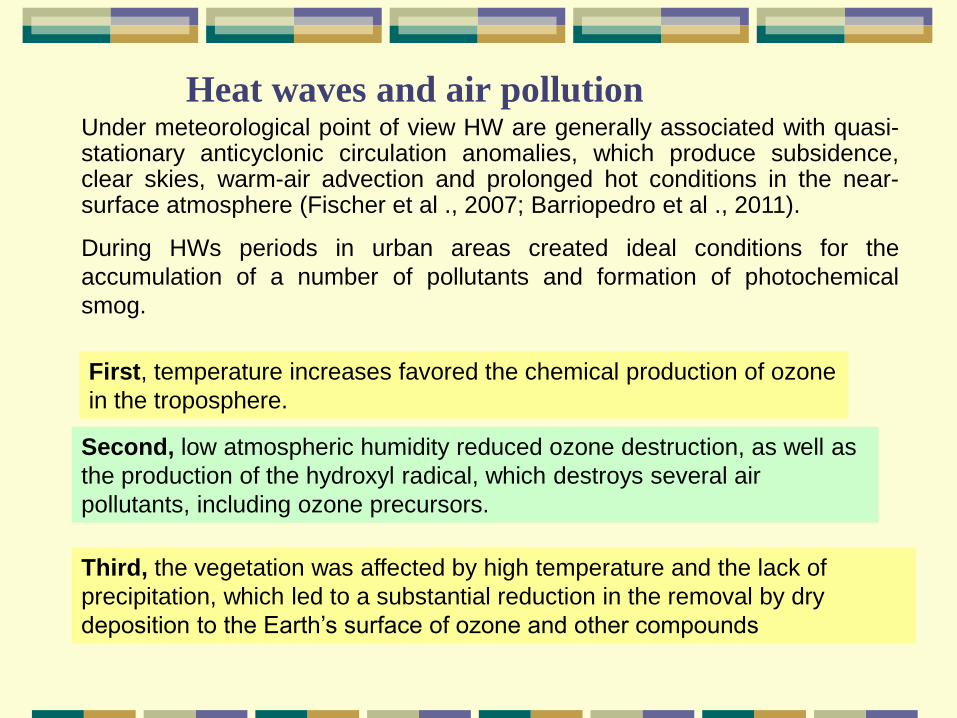
Heat waves and air pollution Under meteorological point of view HW are generally associated with quasi-stationary anticyclonic circulation anomalies, which produce subsidence, clear skies, warm-air advection and prolonged hot conditions in the near-surface atmosphere (Fischer et al ., 2007; Barriopedro et al ., 2011).
During HWs periods in urban areas created ideal conditions for the
accumulation of a number of pollutants and formation of photochemical
smog.
First, temperature increases favored the chemical production of ozone
in the troposphere.
Second, low atmospheric humidity reduced ozone destruction, as well as
the production of the hydroxyl radical, which destroys several air
pollutants, including ozone precursors.
Third, the vegetation was affected by high temperature and the lack of
precipitation, which led to a substantial reduction in the removal by dry
deposition to the Earth’s surface of ozone and other compounds

Air quality monitoring net in Kiev
Three stations are on the left bank of the
Dnipro river (monitoring station 3, 4 and
9), station 15 is situated on the Venetian
island of Dnipro river and 12 stations are
situated on the right bank of the Dnipro
and represents air quality in the central
part of the city.
Measurement of basic air pollutants
makes 4 times per day (at 01, 07, 13, 19
hours).
Stations 6,7
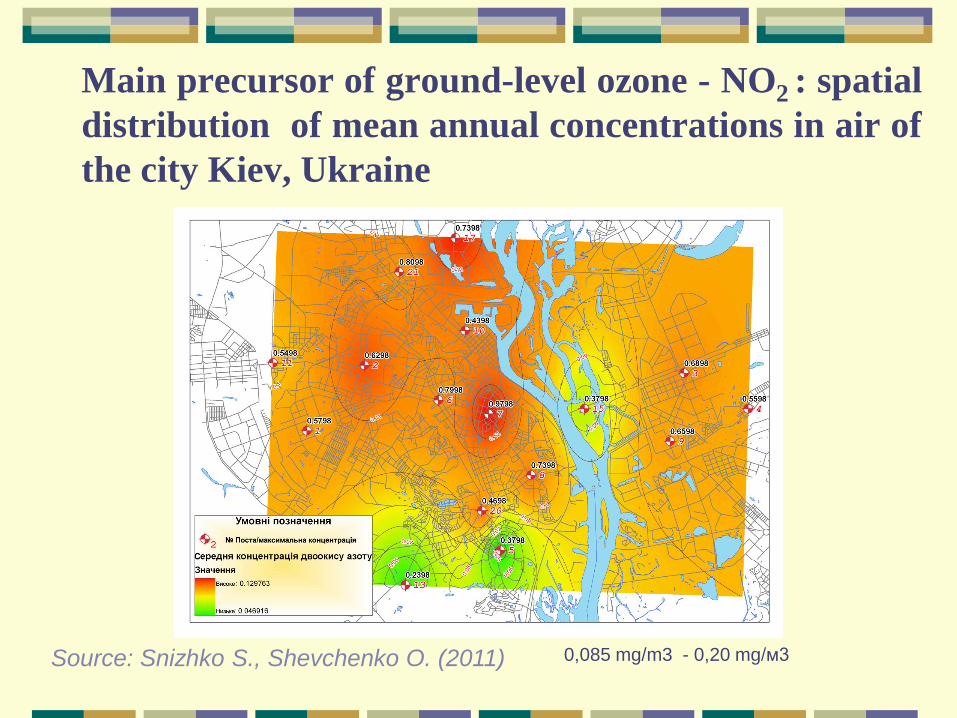
Main precursor of ground-level ozone - NO2 : spatial
distribution of mean annual concentrations in air of
the city Kiev, Ukraine
Source: Snizhko S., Shevchenko O. (2011) 0,085 mg/m3 - 0,20 mg/м3

Interactions between meteorology and chemistry
during heat waves episode in July-August 2010
All plots shows sufficient increasing both substances during period of HW. Contentration of
formaldehyde increases with increasing temperature and reaches a maximum in the hottest days
of this period.
Content of NO2 raised at the beginning of the HW and then slightly decreases.
This behavior of NO2 may be connected with his participation in photochemical processes.
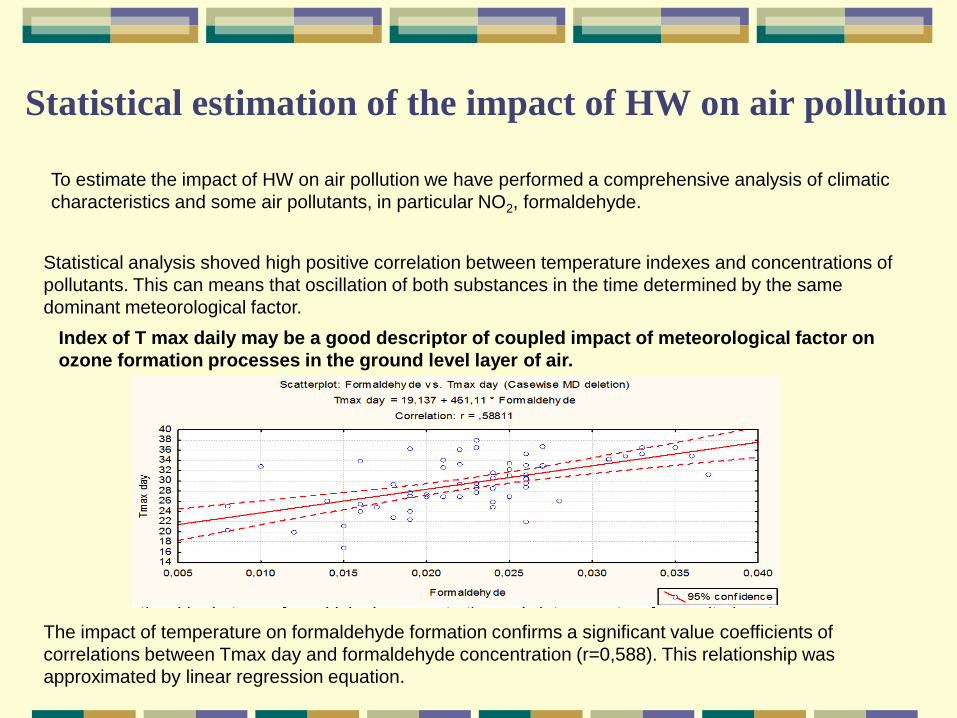
Statistical estimation of the impact of HW on air pollution
To estimate the impact of HW on air pollution we have performed a comprehensive analysis of climatic
characteristics and some air pollutants, in particular NO2, formaldehyde.
Statistical analysis shoved high positive correlation between temperature indexes and concentrations of
pollutants. This can means that oscillation of both substances in the time determined by the same
dominant meteorological factor.
Index of T max daily may be a good descriptor of coupled impact of meteorological factor on
ozone formation processes in the ground level layer of air.
The impact of temperature on formaldehyde formation confirms a significant value coefficients of
correlations between Tmax day and formaldehyde concentration (r=0,588). This relationship was
approximated by linear regression equation.
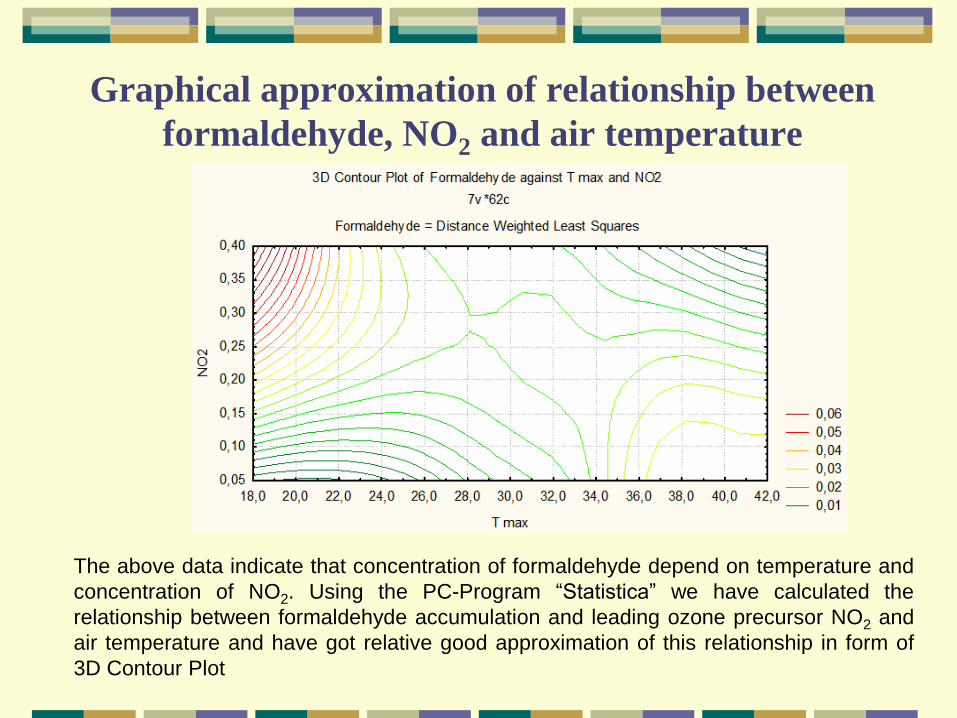
Graphical approximation of relationship between
formaldehyde, NO2 and air temperature
The above data indicate that concentration of formaldehyde depend on temperature and
concentration of NO2. Using the PC-Program “Statistica” we have calculated the
relationship between formaldehyde accumulation and leading ozone precursor NO2 and
air temperature and have got relative good approximation of this relationship in form of
3D Contour Plot
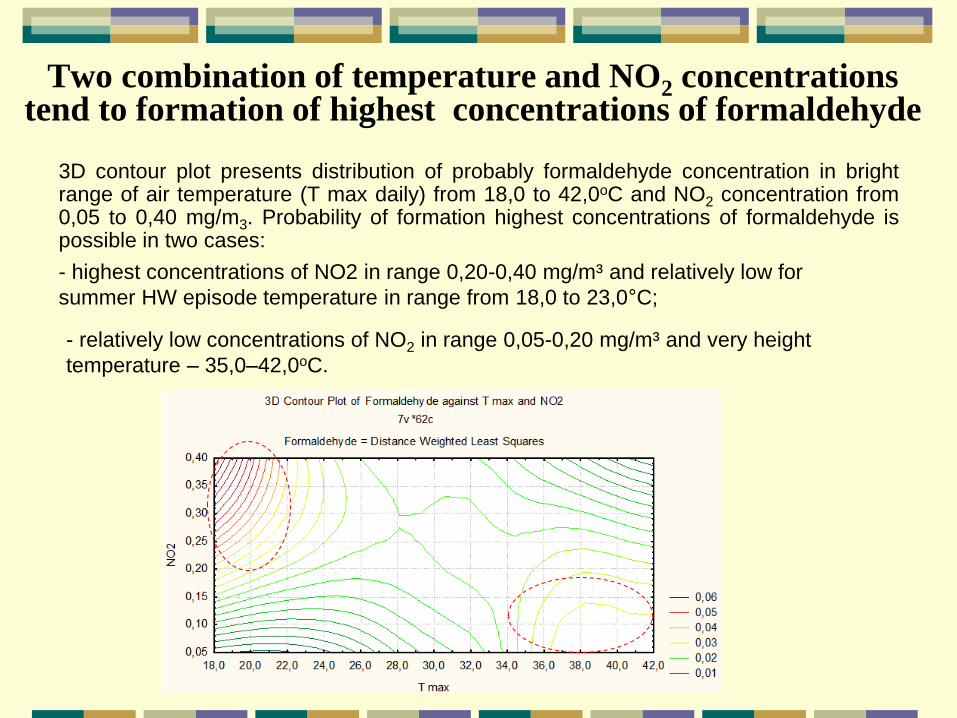
Two combination of temperature and NO2 concentrations tend to formation of highest concentrations of formaldehyde
3D contour plot presents distribution of probably formaldehyde concentration in bright range of air temperature (T max daily) from 18,0 to 42,0oC and NO2 concentration from 0,05 to 0,40 mg/m3. Probability of formation highest concentrations of formaldehyde is possible in two cases:
- highest concentrations of NO2 in range 0,20-0,40 mg/m³ and relatively low for
summer HW episode temperature in range from 18,0 to 23,0°C;
- relatively low concentrations of NO2 in range 0,05-0,20 mg/m³ and very height
temperature – 35,0–42,0oC.
Statistical model of temporal dynamics of
formaldehyde during HW
0
0,005
0,01
0,015
0,02
0,025
0,03
0,035
0,04
01.07.10
03.07.10
05.07.10
07.07.10
09.07.10
11.07.10
13.07.10
15.07.10
17.07.10
19.07.10
21.07.10
23.07.10
25.07.10
27.07.10
29.07.10
31.07.10
02.08.10
04.08.10
06.08.10
08.08.10
10.08.10
12.08.10
14.08.10
16.08.10
18.08.10
20.08.10
22.08.10
24.08.10
26.08.10
28.08.10
30.08.10
mg/
m3
Formaldehyde (monitoring dates)
Formaldehyde forecast
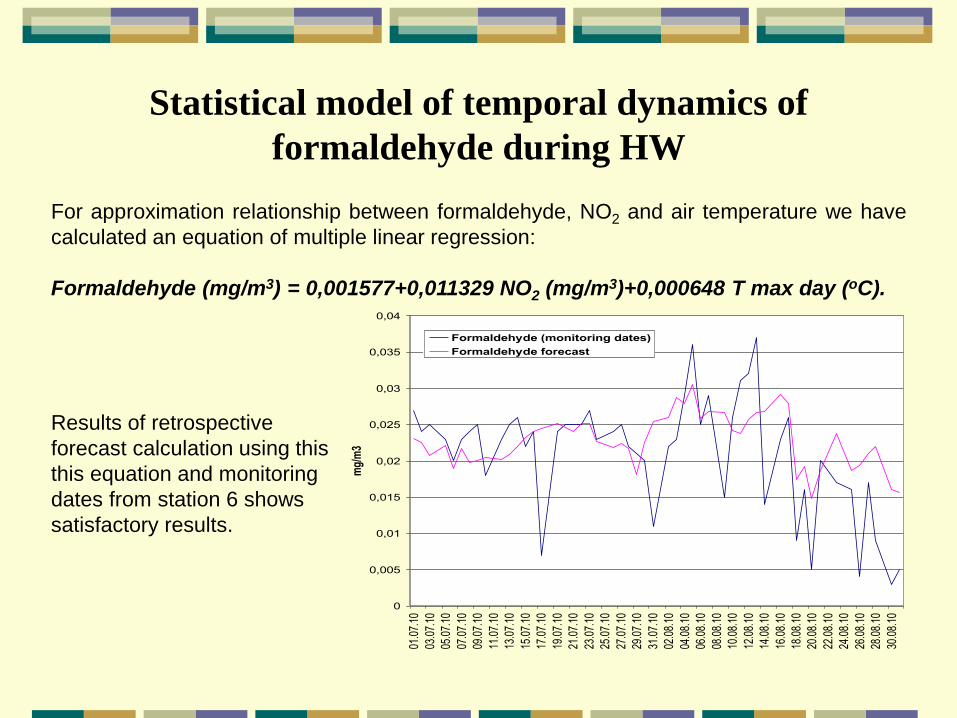
For approximation relationship between formaldehyde, NO2 and air temperature we have
calculated an equation of multiple linear regression:
Formaldehyde (mg/m3) = 0,001577+0,011329 NO2 (mg/m3)+0,000648 T max day (oC).
Results of retrospective
forecast calculation using this
this equation and monitoring
dates from station 6 shows
satisfactory results.
Conclusions 1. In Kiev have been detected a significant increasing of the concentration of some
pollutants, especially NO2 (by 50%) and formaldehyde (by 200%) due to the
increasing number of road transport in the city.
2. Have been detected sufficient increasing NO2 and formaldehyde during period of
HW. Concentration of formaldehyde increases with increasing temperature and
reaches a maximum in the hottest days of this period. Concentration of NO2 raised
at the beginning of the HW and then slightly decreases.
3. The impact of temperature on formaldehyde formation confirms a significant value
coefficients of correlations between Tmax daily and formaldehyde concentration
(r=0,588).
4. Was developed statistical model of temporal dynamics of formaldehyde during
HW.
This model can use as statistical model for short-time expert assessment of
formaldehyde accumulation in urban air during HW cases if not available a more
modern numerical forecast models.

17
Thank you for your attention!