Embed Size (px)
Citation preview

IMPACT OF HEMOZOIN ON HEMATOLOGICAL OUTCOMES AND INNATE
INFLAMMATORY MEDIATOR PRODUCTION IN INFANTS AND YOUNG CHILDREN WITH MALARIAL ANEMIA
by
Jan Kristoff
B.A., Bryn Mawr College, 1993
Submitted to the Graduate Faculty of
Graduate School of Public Health in partial fulfillment
of the requirements for the degree of
Master of Science
University of Pittsburgh
2006

UNIVERSITY OF PITTSBURGH
GRADUATE SCHOOL OF PUBLIC HEALTH
This thesis was presented
by
Jan Kristoff
And it was defended on
September 29th, 2006
and approved by
Thesis Advisor: D.J. Perkins, Ph.D. Assistant Professor
Department of Infectious Diseases and Microbiology Graduate School of Public Health
University of Pittsburgh
Committee Member: Jeremy J. Martinson, Ph.D.
Assistant Professor Department of Infectious Diseases and Microbiology
Graduate School of Public Health University of Pittsburgh
Committee Member: Karen A. Norris, Ph.D.
Associate Professor Department of Immunology
School of Medicine University of Pittsburgh
ii

Copyright © by Jan Kristoff
2006
iii

ACKNOWLEDGEMENT
This study was supported by the National Institutes of Health grant AI 51305-01
(DJP). I would like to thank the children and parents of Siaya District, western Kenya,
for their participation in this study. I extend my sincere thanks to my thesis advisor, Dr.
D. J. Perkins, for his guidance, and to members of the Perkins lab for helpful discussions.
The laboratories of Dr. Robert Ferrell and Dr. David Rowe are recognized for the use of
their TaqMan® instruments. Finally, I am grateful to my family for their continuous
encouragement and support, without which this work would not have been possible.
iv

Douglas J. Perkins, Ph.D. IMPACT OF HEMOZOIN ON HEMATOLOGICAL OUTCOMES AND INNATE
INFLAMMATORY MEDIATOR PRODUCTION IN INFANTS AND YOUNG CHILDREN WITH MALARIAL ANEMIA
Jan Kristoff, M.S.
University of Pittsburgh, 2006
Malaria causes 300-500 million clinical cases and 1-3 million deaths per year, the
majority of which occur in young African children. Ingestion of hemozoin by peripheral
blood mononuclear cells (PBMC) initiates the cytokine-mediated cascade of immune
dysregulation in malaria. Innate immunity plays a critical role in protective responses
against infection, which are determined by an appropriate balance between pro- and anti-
inflammatory mediators. Pro-inflammatory mediators (TNF-α, IL-12, IFN-γ) that control
parasitemia also contribute to pathology. Over-production of immunomodulatory
cytokines (TGF-β1, IL-10) suppresses the protective pro-inflammatory immune response.
The effects of hemozoin on hematological outcomes and inflammatory mediator
production in children with malarial anemia and the temporal kinetics of hemozoin-
induced cytokine dysregulation in cultured PBMC were investigated in this study.
Hematological analyses of healthy control (HC), uncomplicated malaria (UM), mild
malarial anemia (MlMA), moderate malarial anemia (MdMA), and severe malarial
anemia (SMA) groups revealed that age, temperature, and all erythrocyte, leukocyte, and
platelet indices were significantly different between clinical categories. Neither
parasitemia nor the prevalence of high density parasitemia (HDP) differed significantly
between clinical groups. Stratification of study participants according to proportion of
pigment-containing monocytes (PCM) demonstrated that parasitemia, HDP, temperature,
and most leukocyte, erythrocyte, and platelet indices were significantly different between
0%, ≤ 10%, and > 10% PCM categories. The > 10% PCM category contained children
with the lowest hemoglobin, hematocrit, and erythrocyte counts and the greatest
proportion of children with SMA. Plasma IFN-α, IL-4, IL-6, IL-10, and IL-12p40/p70
levels differed significantly between clinical categories but not between UM and SMA
groups. Plasma IFN-α, IFN-γ, TNF -α, IL-1β, IL-2, IL-4, IL-6, IL-10, and IL-12p40/p70
v

were not significantly associated with % PCM. β-hematin-induced IL-1β, IL-2, IL-6, IL-
12p35, IL-12p40, IL-18, IFN-α, IFN-γ, TNF-α, LT-α, NOS-2A, COX-1, COX-2, IL-4,
IL-10, and TGF-β1 expression in cultured PBMC revealed a pro-inflammatory response
that varied in magnitude among individuals. Importantly, innate inflammatory mediators
modulate the adaptive immune response to Plasmodium parasites. Of public health
significance, a better understanding of the molecular mechanisms governing these
responses will facilitate the development of more immunogenic vaccines, through
inclusion of cytokines or other compounds that activate the innate immune system.
vi

TABLE OF CONTENTS
ACKNOWLEDGEMENT............................................................................................... iv
1.0 INTRODUCTION.................................................................................................... 1
1.1 P. falciparum Life Cycle .............................................................................. 2
1.2 Properties of Hemozoin and β-hematin ..................................................... 3
1.3 Inflammatory Response/Pathology ............................................................ 5
1.4 Malarial Anemia .......................................................................................... 6
1.5 Cytokine Dysregulation ............................................................................... 8
1.6 Hypothesis and Objectives ........................................................................ 10
2.0 MATERIALS AND METHODS .........................................................................12
2.1 PBMC Culture and Isolation .....................................................................12
2.2 β-hematin Preparation ...............................................................................12
2.3 RNA Isolation..............................................................................................12
2.4 Quantitative Real Time RT-PCR ..............................................................13
2.5 Hematology/Malarial Pigment Data .........................................................14
2.6 Multiplex Assay...........................................................................................15
2.7 Statistical Analyses......................................................................................16
3.0 RESULTS ..............................................................................................................18
3.1 Hematology and Malarial Pigment Data ..................................................18
3.1.1 Clinical and laboratory parameters ...........................................18
3.2 Multiplex Assay...........................................................................................29
3.2.1 Clinical and laboratory parameters ...........................................29
3.3 Quantitative Real Time RT-PCR ..............................................................35
vii

3.3.1 Laboratory parameters ...............................................................35
3.3.2 Pro-inflammatory mediator production ....................................35
3.3.2.1 Temporal effect of β-hematin on IL-1β
transcripts......................................................................35
3.3.2.2 Temporal effect of β-hematin on IL-2
transcripts.....................................................................36
3.3.2.3 Temporal effect of β-hematin on IL-6
transcripts.....................................................................37
3.3.2.4 Temporal effect of β-hematin on IL-12p35
transcripts......................................................................38
3.3.2.5 Temporal effect of β-hematin on IL-12p40
transcripts.....................................................................39
3.3.2.6 Temporal effect of β-hematin on IL-18
transcripts.....................................................................40
3.3.2.7 Temporal effect of β-hematin on IFN-α
transcripts.....................................................................41
3.3.2.8 Temporal effect of β-hematin on IFN-γ
transcripts.....................................................................42
3.3.2.9 Temporal effect of β-hematin on TNF-α
transcripts.....................................................................43
3.3.2.10 Temporal effect of β-hematin on LT-α
transcripts.....................................................................44
3.3.2.11 Temporal effect of β-hematin on NOS-2A
transcripts.....................................................................45
3.3.2.12 Temporal effect of β-hematin on COX-1
transcripts.....................................................................46
3.3.2.13 Temporal effect of β-hematin on COX-2
transcripts.....................................................................47
3.3.3 Anti-inflammatory mediator production ...................................48
3.3.3.1 Temporal effect of β-hematin on IL-4 transcripts .....48
viii

3.3.3.2 Temporal effect of β-hematin on IL-10
transcripts.....................................................................49
3.3.3.3 Temporal effect of β-hematin on TGF-β1
transcripts.....................................................................50
4.0 DISCUSSION..........................................................................................................52
4.1 Effect of hemozoin on hematological outcomes in infants and children
with malarial anemia ..................................................................................52
4.2 Effect of hemozoin on inflammatory mediator production in infants and
children with malarial anemia...................................................................53
4.3 Temporal effect of β-hematin on cytokine and effector molecule
transcript production in cultured human peripheral blood mononuclear
cells ...............................................................................................................57
4.3.1 Effect of β-hematin on IL-1β transcripts...................................59
4.3.2 Effect of β-hematin on IL-2 transcripts .....................................59
4.3.3 Effect of β-hematin on IL-6 transcripts .....................................60
4.3.4 Effect of β-hematin on IL-12p35 and IL-12p40 transcripts.....60
4.3.5 Effect of β-hematin on IL-18 transcripts ...................................62
4.3.6 Effect of β-hematin on IFN-α transcripts..................................62
4.3.7 Effect of β-hematin on IFN-γ transcripts...................................63
4.3.8 Effect of β-hematin on TNF-α transcripts.................................64
4.3.9 Effect of β-hematin on LT-α transcripts ...................................64
4.3.10 Effect of β-hematin on NOS-2A transcripts ..............................65
4.3.11 Effect of β-hematin on COX-1 and COX-2 transcripts............66
4.3.12 Effect of β-hematin on IL-4 transcripts .....................................67
4.3.13 Effect of β-hematin on IL-10 transcripts ...................................69
4.3.14 Effect of β-hematin on TGF-β1 transcripts...............................69
5.0 CONCLUSIONS ...................................................................................................72
ix

BIBLIOGRAPHY............................................................................................................74
x

LIST OF TABLES
Table 1: Clinical and demographic characteristics of study participants .........................21 Table 2: Clinical and demographic characteristics of parasitemic study participants
stratified according to percent of pigment-containing monocytes .....................25 Table 3: Plasma cytokine levels of study participants ......................................................31 Table 4: Plasma cytokine levels of parasitemic study participants stratified according to
percent of pigment-containing monocytes..........................................................33
xi

LIST OF FIGURES
Figure 1: Plasmodium falciparum life cycle in the human host and mosquito vector .......3 Figure 2: Structure of hemozoin and β-hematin .................................................................5 Figure 3: Model of innate immune response to malaria .....................................................9 Figure 4: Temporal effect of β-hematin on IL-1β transcripts...........................................36 Figure 5: Temporal effect of β-hematin on IL-2 transcripts.............................................37 Figure 6: Temporal effect of β-hematin on IL-6 transcripts.............................................38 Figure 7: Temporal effect of β-hematin on IL-12p35 transcripts.....................................39 Figure 8: Temporal effect of β-hematin on IL-12p40 transcripts.....................................40 Figure 9: Temporal effect of β-hematin on IL-18 transcripts............................................41 Figure 10: Temporal effect of β-hematin on IFN-α transcripts.........................................42 Figure 11: Temporal effect of β-hematin on IFN-γ transcripts .........................................43 Figure 12: Temporal effect of β-hematin on TNF-α transcripts .......................................44 Figure 13: Temporal effect of β-hematin on LT-α transcripts .........................................45 Figure 14: Temporal effect of β-hematin on NOS-2A transcripts ...................................46 Figure 15: Temporal effect of β-hematin on COX-1 transcripts .....................................47 Figure 16: Temporal effect of β-hematin on COX-2 transcripts .....................................48 Figure 17: Temporal effect of β-hematin on IL-4 transcripts...........................................49 Figure 18: Temporal effect of β-hematin on IL-10 transcripts.........................................50 Figure 19: Temporal effect of β-hematin on TGF-β1 transcripts.....................................51
xii

Figure 20: Temporal model of peak β-hematin-induced cytokine and effector molecule transcript production ........................................................................................58
xiii
1.0 INTRODUCTION
In humans, the protozoan parasites Plasmodium vivax, Plasmodium malariae,
Plasmodium ovale, and Plasmodium falciparum cause malaria, a disease transmitted by
the bite of an infected female Anopheles mosquito. Endemic to tropical and subtropical
regions of the world, malaria causes 300-500 million clinical cases resulting in one to
three million deaths per year (Stevenson and Riley, 2004; Struik and Riley, 2004; Snow
et al., 1999; Zambrano-Villa, 2002). Whereas adults living in hyperendemic areas
typically develop semi-immunity following frequent episodes of childhood malaria,
children may develop severe malaria with hyperparasitemia and life-threatening
complications such as severe anemia, hypoglycemia, and cerebral malaria (Perkins et al.,
1999). Plasmodium falciparum produces the majority of severe malaria cases and deaths,
including up to 35% of infant and child mortality in some areas of Africa (Korenromp et
al., 2003). Children less than five years of age are at greatest risk of mortality due to
their non-immune status (Perkins et al., 1999). Malaria control methods including the
use of insecticide-treated bed nets, vector control, and chemotherapy have not achieved
substantial reductions in morbidity and mortality (Struik and Riley, 2004). In addition,
resistance against anti-malarial drugs such as chloroquine and sulphadoxine-
pyrimethamine has developed in recent years (Ridley, 2003). Currently, the only
effective treatment for multidrug-resistant malaria are the sesquiterpene lactone
artemisinin drugs (derived from the Chinese herb qinghao) (Eckstein-Ludwig et al.,
2003; Ridley, 2003). Development of an effective vaccine against P. falciparum malaria
has been slow, due in part to numerous species- and stage-specific parasite target antigens
and to the lack of long-term immunological memory responses in the human host (Struik
and Riley, 2004; Stevenson and Riley, 2004). For these reasons, understanding the innate
immune responses that mediate protection against malaria will be critical in designing
alternative therapies. The purpose of this study is to investigate the impact of naturally
1

acquired Plasmodium falciparum hemozoin on hematological outcomes and
inflammatory mediator production in infants and young children with malarial anemia,
and the temporal kinetics of hemozoin-induced cytokine transcript dysregulation in
cultured human peripheral blood mononuclear cells.
1.1 P. falciparum Life Cycle
The life cycle of P. falciparum is complex, having intra- and extracellular stages
(Figure 1). During a bloodmeal, the female Anopheles mosquito injects haploid
sporozoites into the host’s bloodstream. These sporozoites migrate to the liver and
invade hepatocytes. Following five to seven days of replication by asexual mitosis, these
sporozoite-infected hepatocytes produce exoerythrocytic schizonts that rupture and
release thousands of merozoites into the bloodstream (Struik and Riley, 2004).
Merozoites invade erythrocytes and develop into erythrocytic schizonts via asexual
mitotic replication. Each erythrocytic schizont contains up to 20 daughter merozoites,
which upon schizont rupture invade new erythrocytes and give rise to new schizonts.
The rupture of erythrocytic schizonts is characterized by episodes of fever, rigors, nausea,
and headaches that result from the systemic pro-inflammatory cytokine cascade initiated
by cells of the innate immune system (Miller et al., 2002). This cyclical pattern of blood-
stage infection continues for 48-72 hours (Struik and Riley, 2004). During
intraerythrocytic infection, parasites catabolize hemoglobin as a source of amino acids
and transform toxic heme released during hemoglobin catabolism into the insoluble, inert
crystal hemozoin (malarial pigment) (Chong and Sullivan, 2003). In some instances,
merozoites do not invade erythrocytes, but instead differentiate into male and female
gametocytes. Following ingestion by a mosquito, these gametocytes develop into
extracellular gametes. Male and female gametes then fuse during sexual replication in
the mosquito midgut to produce motile zygotes that penetrate the midgut wall and form
oocysts. Following meiosis, oocysts develop into haploid sporozoites that migrate to the
mosquito salivary glands and can be transmitted to the next host, beginning the cycle
anew.
2

Figure 1. Plasmodium falciparum life cycle in the human host and mosquito vector. The female Anopheles mosquito injects haploid sporozoites into the host’s bloodstream, where they migrate to the liver to invade hepatocytes. Sporozoites undergo 5-7 days of replication by asexual mitosis to produce exoerythrocytic (liver) schizonts. This stage of infection is asymptomatic. Upon rupture, liver schizonts release thousands of merozoites into the bloodstream. Merozoites invade erythrocytes and develop into erythrocytic schizonts via asexual mitotic replication. Erythrocytic schizonts rupture, releasing up to 20 daughter merozoites that invade new erythrocytes and give rise to new schizonts. The rupture of erythrocytic schizonts triggers a cascade of pro-inflammatory cytokines leading to episodes of fever, rigors, nausea, and headaches. This cyclical pattern of blood-stage infection lasts for 48-72 hours. Some merozoites do not invade erythrocytes, but instead differentiate into male and female gametocytes that develop into extracellular gametes following ingestion by a mosquito. Male (micro) and female (macro) gametes fuse during sexual reproduction in the mosquito midgut, producing motile zygotes (ookinetes) that penetrate the midgut wall and form oocysts. Oocysts develop into haploid sporozoites via meiosis. Infective sporozoites migrate to the mosquito salivary glands, where they can be transmitted to the next host. (adapted with permission from Struik and Riley, 2004) 1.2 Properties of Hemozoin and β-hematin
Hemozoin (malarial pigment) is formed in the digestive vacuoles of late
trophozoites and schizonts during intraerythrocytic development as the end product of
host hemoglobin digestion (Day et al., 1996). During this process, heme released as a
3
byproduct is autoxidized to toxic hematin [aquaferriprotoporphyrin IX, H2O-
Fe(III)PPIX], which is subsequently detoxified by conversion to hemozoin (Ladan et al.,
1993; Scheibel and Sherman, 1988). Heme polymerase catalyzes the polymerization of
hemozoin through linkage of heme groups via iron carboxylate bonds (Slater and Cerami,
1992; Day et al., 1996). The core Fe(III)PPIX structure of hemozoin (Figure 2) is
surrounded by proteins, carbohydrates, lipids, and nucleic acids (Goldie et al., 1990).
Hemozoin has been shown to induce both pro-inflammatory and anti-inflammatory
cytokines in cultured peripheral blood mononuclear cells (PBMC) (Pichyangkul et al.,
1994; Mordmüller et al., 1998). Human monocyte-derived macrophages that
phagocytose trophozoite-parasitized red blood cells (RBCs) or free pigment are unable to
degrade the ingested pigment heme, repeat phagocytosis, and generate the oxidative burst
(Schwarzer et al., 1992). As such, pigment formation not only protects the parasite from
toxic heme, but also from the host immune reponse. The toxicity of hemozoin may be
attributed to the covalent iron carboxylate bonds that contribute to its stability and
indigestibility in both the phagolysosome and the parasite food vacuole (Slater et al.,
1991).
β-hematin (synthetic hemozoin) is a crystalline cyclic dimer of Fe(III)PPIX that is
chemically, crystallographically, and spectroscopically identical to hemozoin (Egan et
al., 2001; Fitch and Kanjananggulpan, 1987; Slater et al., 1991; Bohle et al., 1994,1997).
β-hematin (Figure 2) is formed by reciprocal iron-carboxylate bonds that link the ionized
heme-propionate side chain of one Fe(III)PPIX to the central Fe(III) of another (Pagola et
al., 2000; Egan et al., 2001). Fe(III)PPIX dimers stack in the crystal lattice to form
parallel iron porphyrin rings. Studies in our laboratory have demonstrated that similar to
hemozoin, β-hematin elicits pro- and anti-inflammatory cytokine synthesis in cultured
peripheral blood mononuclear cells (PBMC) (Keller et al., 2004a, 2006, manuscript
submitted).
4

A B
Figure 2. Structure of hemozoin and β-hematin. (A) Reciprocal iron-carboxylate Fe(III)PPIX dimer (adapted with permission from Tekwani and Walker, 2005). (B) Packing diagram of the crystal structure of β-hematin (core structure of hemozoin). C atoms are illustrated in grey; O, red; N, green; Fe, blue. (adapted with permission from Pagola et al., 2000) 1.3 Inflammatory Response/Pathology
Plasmodium evades the immune response by altering its surface antigens
throughout the various stages of its life cycle (Bull et al., 1998; Zambrano-Villa et al.,
2002). Each phase of the life cycle is characterized by the transient expression of
species-specific proteins that are highly polymorphic and antigenically variable. The
erythrocytic stage of P. falciparum infection is responsible for all disease pathology in
malaria and is characterized by dysregulatory processes that prevent the induction of
robust immune responses (Luke and Hoffman, 2003). During schizogony, parasitized red
blood cells (pRBC) burst, creating RBC ghosts and releasing daughter merozoites and
hemozoin into the blood stream (Phu et al., 1994). Scavenger monocytes and neutrophils
ingest malarial pigment through phagocytosis of mature pRBCs, RBC ghosts, living or
dead pigment-containing phagocytes, and particulate material released at schizogony
5

(Day et al., 1996). Ingestion of opsonized hemozoin by monocytes impairs their
expression of MHC class II molecules, CD54, and CD11c, as well as generation of the
oxidative burst, protein kinase C activity, and their ability to repeat phagocytosis (Arese
and Scwarzer, 1997; Schwarzer et al., 1992, 1993, 1998). Intracellular hemozoin
released into the circulation upon schizont rupture becomes concentrated in resident
macrophages of the reticuloendothelial system (Schwarzer et al., 1998). Impaired
antigen presentation to T cells results from the suppression of dendritic cell maturation by
parasitized red blood cells (Urban et al., 1999). Parasitized red blood cells can also cause
apoptosis of malaria-specific B cells and T cells (Good, 2005).
P. falciparum infection is characterized by anemia, metabolic acidosis, and/or
cerebra
.4 Malarial Anemia
(MA) is complex and results not only from immune destruction
of para
l malaria (Stevenson and Riley, 2004). Disease pathology is caused by the
destruction of erythrocytes, bone marrow suppression, and impaired circulation resulting
from peripheral hypotension and the adherence of infected erythrocytes to the vascular
endothelium (Stevenson and Riley, 2004). Hypoxia, hypoglycemia, and lactic acidosis
resulting from the increased metabolic demands of the parasite are associated with
erythrocyte destruction and bone marrow suppression (Stevenson and Riley, 2004).
1
Malarial anemia
sitized erythrocytes, but also from excess removal of nonparasitized erythrocytes
and bone marrow dysfunction (Ekvall, 2003). The severity of anemia in acute malaria
most likely depends on the degree of RBC destruction, whereas ineffective erythropoiesis
and dyserythropoiesis play a greater a role in chronic infection with low parasitemia.
Severe malarial anemia (SMA) is the predominant clinical manifestation of severe
falciparum malaria in areas of holoendemic (high/sustained) transmission, whereas
cerebral malaria and metabolic acidosis are more prevalent in areas of lower/seasonal
transmission (Day, 1996; Ekvall, 2003). In addition, children aged less than 24 months
are more susceptible to malarial anemia, whereas cerebral malaria peaks in children
approximately 3 years of age (Ekvall, 2003). The leading cause of death among children
with malaria, SMA accounts for 190,000-974,000 deaths per year in children less than
five years of age (WHO, Children and malaria, http://www.who.int/cmcupload/0/000/
6

015/367/RBMInfosheet6.htm). Due to antimalarial drug resistance, many children fail to
clear parasitemia after treatment and remain anemic; others who require blood
transfusions to survive are at risk of contracting HIV and other blood-borne diseases.
Destruction of uninfected erythrocytes accounts for more than 90% of erythrocyte
loss in
e decreased
respons
adults with acute uncomplicated malaria, and is the primary cause of severe
malarial anemia (SMA) (Stoute et al., 2003; Ekvall, 2003). Several mechanisms are
thought to play a role in this destruction. For example, alterations in the membranes of
non-parasitized RBCs may target them for removal from circulation and destruction in
the spleen. Oxygen and nitrogen radicals released from macrophages as a result of pro-
inflammatory cytokine secretion cause oxidative damage to non-parasitized RBCs in the
form of membrane disruption, which leads to enhanced RBC removal (Griffiths et al.,
2001; Perkins et al., 2000; Greve et al., 1999). Reduced RBC deformability, which
correlates with disease severity and degree of anemia, may play a role in non-parasitized
RBC destruction by immune effector cells in malaria (Dondorp et al., 1999). Reduced
RBC deformability is also thought to be responsible for the removal of normal senescent
erythrocytes from the circulation. In addition, parasite-induced complement activation
may contribute to RBC destruction. Complement can act synergistically with Ig to
induce phagocytosis or may cause direct lysis of non-parasitized RBCs (Ekvall, 2003).
Furthermore, deficiencies in surface complement regulatory proteins (such as CR1 and
CD55) that protect RBCs from complement-mediated lysis have been implicated in the
pathogenesis of malarial anemia (Devine, 1991; Waitumbi et al., 2000).
Bone marrow dysfunction in malarial anemia results from th
iveness of erythroid progenitor cells to erythropoietin and to the impaired
production of erythropoietin, both of which are regulated by inflammatory cytokines
(Ekvall, 2003). Elevated plasma TNF and IL-10 levels are found in children with
malarial anemia and high-density parasitemia, and a low IL-10/TNF ratio is specifically
associated with malarial anemia in these children (Kurtzhals et al., 1998; Mordmüller et
al., 1997; Othoro et. al., 1999; Shaffer et al., 1991). Since IL-10 inhibits P. falciparum-
induced TNF production, low levels of IL-10 may facilitate high levels of TNF, resulting
in anemia (Ho et al., 1995, 1998). Acute childhood malaria is characterized by bone
marrow suppression, sometimes in conjunction with decreased erythropoiesis (Kurtzhals
7

et al., 1997). Hyperactive bone marrow, accompanied by morphologic dyserythropoiesis
and the absence of reticulocyte release, is more common in chronic malaria
(Wickramasinghe and Abdalla, 2000). Though elevated erythropoietin levels in African
children with malaria would seem to indicate increased erythropoiesis, bone marrow
suppression still occurs (Nussenblatt et al., 2001; Menendez et al., 2001; Verhoef et al.,
2001). Possible mechanisms for this inhibition include the direct effect of
parasites/parasite products on the bone marrow, macrophage dysfunction, secretion of
cytokines such as TNF-α, IFN-γ, and MIF (macrophage migration inhibitory factor) by
activated T cells, and the local release of reactive oxygen and nitrogen species (Clark and
Chaudri, 1988; Martiney et al., 2000; Kremsner et al., 2000; Kun et al., 2001; Schwarzer
et al., 1992; Wickramasinghe and Abdalla, 2000).
1.5 Cytokine Dysregulation
erythrocytes contributes significantly to P. falciparum
malaria
While the destruction of
, the same pro-inflammatory mediators that contribute to the control of parasite
replication also increase the severity of the disease (Kwiatkowski et al., 1997; Hunt and
Grau, 2003; Artavanis-Tsakonas et al., 2003a; Riley, 1999). Like many infectious and
noninfectious acute diseases, malaria may be characterized as a cytokine release
syndrome (Clark et al., 2004). The rupture of schizont-infected erythrocytes triggers a
cascade of inflammatory cytokines that can result in death (Artavanis-Tsakonas et al.,
2003; Riley, 1999). As illustrated in Figure 3, the differential effects of hemozoin
ingestion by phagocytes on cytokine production play a critical role in this dysregulation.
For example, the pro-inflammatory cytokine IL-12 is required during the early cell-
mediated immune response to malaria infection (Crutcher et al., 1995; Mosmann and
Coffman, 1989; Trinchieri, 1993). IL-12-induced up-regulation of TNF-α and IFN-γ
facilitate parasite killing, partially due to increased production of nitric oxide (NO)
(Stevenson et al., 1995; Yoshimoto et al., 1998). However, IL-12 production by
monocytes is suppressed following the ingestion of hemozoin, whereas TNF-α and IL-10
production are enhanced (Mordmüller et al., 1998). Anti-inflammatory IL-10 inhibits IL-
12 production by monocytes, and elevated levels of TNF-α promote the development of
severe anemia (Luty et al., 2000; Storkus et al., 1998). Increased NO production has
8

been associated with accelerated parasite clearance in Gabonese children and adults with
malaria, but prolonged overproduction of NO can lead to SMA through suppression of
erythropoiesis and induction of apoptosis in CD34+ hematopoietic stem cells (Kremsner
et al., 1996; Reykdal et al., 1999; Shami and Weinberg, 1996). Furthermore, low IL-12
levels have been associated with increased susceptibility to severe P. falciparum malaria
(Luty et al., 2000).
p
pRRBBCC
Hemozoin
Monocyte IL-18
Monocyte
Monocyte
Hemozoin
IIFFNN--γγ NF-T α
T Lymphocyte
IL-12
N
O
iNOS
Parasite Killing
PGE2
COX-1/2
IL-12 p40
IL-6
Per hery
Bone Marrow
ip
~~~~BFU-E/CFU-E Reticulocyte RBC
IL-2 IL-10
IL-1β
TNF-α
IL-12
TGF-β1
IL-4 LT-αB Lymphocyte
T ll DifferentiatioH2 Ce n
TNF-α IL-6 NO
Parasite Killing
IFN-α
Figure 3. odel of innate immune response to malaria. Protective immunity against malaria is regulated by both pro- and anti-inflamma ry cytokines, the balance of which determines disease outcome. Pro-inflammatory mediators are illustrated in red text, and anti-inflammatory cytokines are illustrated in green text. Enzymes and effector molecules are shown in blue. Solid lines represent positive signaling, whereas dashed lines represent suppression. Exposure of monocytes/macrophages to parasitized red blood cells (pRBC) or hemozoin initiates the inflammatory cascade through release of IL-12. Alone or in conjunction with IL-18, IL-12 promotes IFN-γ secretion from T helper 1 cells. Activated T lymphocytes secrete IL-2, which acts in an autocrine fashion to promote T cell growth and differentiation. IL-12 and IFN-γ stimulate monocytes/macrophages to produce TNF-α, which facilitates parasite killing through generation of toxic free radicals such as nitric oxide (NO), via the enzymatic activity of inducible nitric oxide synthase (iNOS). Production of IFN-α by monocytes and of LT-α by T- or B lymphocytes also induces NO-mediated parasite killing. While pro-inflammatory mediators such as IL-1β, IL-6, and TNF-α control parasitemia, elevated levels of these cytokines promote the development of severe malarial anemia (SMA) through suppression of erythropoiesis. In response to parasitic products, cyclooxygenase-2 (COX-2) is inducibly expressed to enhance prostaglandin E2 (PGE2) synthesis. TNF-α-induced PGE2 negatively regulates production of TNF-α and of the IL-12p40 subunit. Induction of anti-inflammatory mediators is required to counteract the pathological effects of prolonged pro-inflammatory cytokine production during acute malaria. Monocytic release of anti-inflammatory cytokines IL-10 and TGF-β1 down-regulates the pro-inflammatory response through suppression of IL-12, IFN-γ, and TNF-α. In addition, IL-4 production by T cells activates B lymphocytes and induces TH2 cell differentiation.
Mto
9

However, the ability of immunoregulatory cytokines to control circulating levels
of pro-inflammatory cytokines may facilitate parasite clearance without triggering
pathology (Stevenson and Riley, 2004). In mice and humans, IL-10 and TGF-β
(transforming-growth factor-β) negatively regulate both innate and adaptive immune
responses by inhibiting pro-inflammatory cytokine responses (IFN-γ, IL-12) (Omer and
Riley, 1998; Omer et al., 2003a; Li et al., 2003; Kurtzhals et al., 1998; Dodoo et al.,
2002; Tsutsui and Kamiyama, 1999). As in the case of IL-12, reduced plasma levels of
TGF-β are characteristic of severe malaria (Perkins et al., 2000). IL-10 also suppresses
TNF-α and IL-1β production through inhibition of NF-κB (Wang et al., 1995). NO
serves a homeostatic role in falciparum malaria by down-regulating TNF-α (which
generates NO via the enzymatic activity of inducible nitric oxide synthase, iNOS/NOS-
2A) through inhibition of NF-κB (Iuvone et al., 1996; Otterbein et al., 2000; Sarady et
al., 2002). NO further reduces TNF-α levels by inhibiting the adhesion of pRBCs to the
vascular endothelium (which is required for maximal TNF production) (Serirom et al.,
2003; O’Dea and Pasvol, 2003). The balance of pro- and anti-inflammatory cytokines
and effector molecules determines whether a protective or a pathogenic response
develops (Perkins et al., 2000). The mechanism by which this balance is achieved is
unknown, but has been linked to naturally acquired immunity to malaria in endemic
areas, whereby chronic, low-grade infections allow the host to remain asymptomatic
(premunition) (Stevenson and Riley, 2004; Struik and Riley, 2004; Targett, 2005).
1.6 Hypothesis and Objectives
Since the ingestion of hemozoin by peripheral blood mononuclear cells (PBMC)
initiates the cytokine-mediated cascade of immune dysregulation in malaria, we decided
to investigate the temporal effects of malarial pigment on cytokine production in vitro. In
addition, as MA is the most prevalent clinical outcome of pigment-induced immune
dysregulation in areas of holoendemic P. falciparum transmission (Bloland et al., 1999),
and SMA is the leading cause of morbidity and mortality among children under 5 years
of age in these areas (WHO, 2000; Breman et al., 2001), we studied the impact of
hemozoin on hematological indices and plasma cytokine protein levels in children with
varying degrees of parasitemia and malarial anemia.
10

The main hypothesis of this study is that dysregulation in innate immune
responses to malaria occurs at the level of de novo cytokine transcription. Furthermore,
malarial pigment-induced changes in hematological parameters lead to MA. While level
of parasitemia is not necessarily predictive of MA or disease severity (Ong’echa et al.,
2006; McElroy et al., 2000), we propose that the percent of pigment-containing
monocytes in the blood of infected children correlates with the severity of anemia.
To illustrate the effect of hemozoin on hematological outcomes, blood was drawn
from parasitemic and aparasitemic children with/without varying degrees of MA.
Complete blood counts were performed, and study participants (n = 648) were stratified
by clinical (anemia) category to examine the category-specific effects of malarial
pigment on hematological measurements. Parasitemic study participants were then
stratified according to percent of pigment-containing monocytes (% PCM) to determine if
pigment content was related to severity of anemia. To determine the relationship
between in vivo innate inflammatory mediator production and monocytic acquisition of
hemozoin, plasma levels of IL-12p40/p70, IFN-α, IFN-γ, TNF-α, IL-1β, IL-2, IL-4, IL-6,
and IL-10 from children (n = 189) with/without varying degrees of MA were determined
by multiplex assay. Parasitemic study participants were further stratified according to
blood content of pigment-containing monocytes to examine whether plasma cytokine
levels were correlated with % PCM.
To investigate the temporal effect of pigment on in vitro cytokine transcript
production, β-hematin (synthetic hemozoin), which is chemically, crystallographically,
and spectroscopically identical to the core ferriprotoporphyrin IX [Fe(III)PPIX] of
hemozoin (Fitch et al., 1987; Slater et al., 1991; Bohle et al., 1994,1997), was used to
stimulate cultured PBMC isolated from the blood of malaria-nave donors. RNA was
isolated from harvested cells, reverse transcribed into cDNA, and analyzed by
quantitative real time PCR for expression of the following cytokines: TNF-α, IL-12A
(p35), IL-12B (p40), IL-10, TGF-β1, IFN-α, IFN-γ, IL-2, IL-4, IL-6, IL-18, IL-1β, LT-α,
NOS-2A, COX-1, and COX-2.
11
2.0 MATERIALS AND METHODS
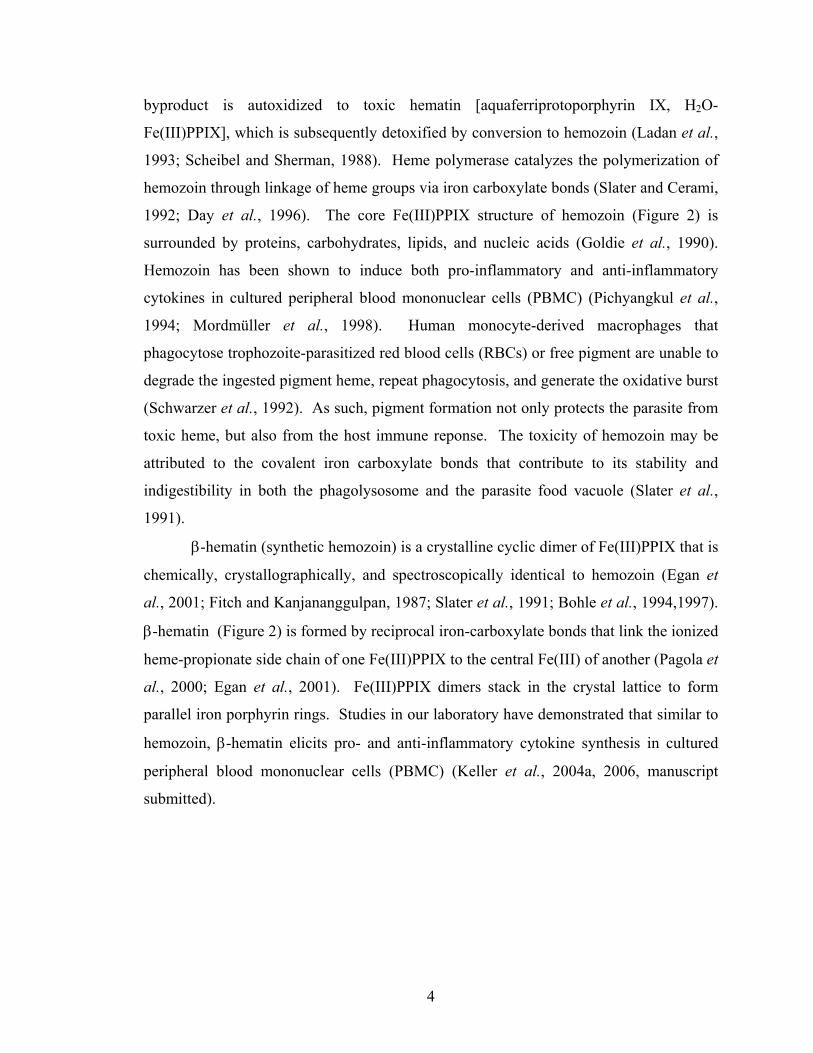
2.1 PBMC Culture and Isolation: Venous blood (70 mL) from malaria-naïve human
donors (n = 9) was drawn into heparin-containing vials. PBMC were isolated using
ficoll/Hypaque and plated at a density of 1 x 10⁶ cells/mL in Dulbecco’s Modified Eagle
Medium (DMEM) containing 10% human serum (heat-inactivated at 56°C for 30 min).
Cultures were stimulated with media alone (controls) or β-hematin (10 μg/mL). β-
hematin preparations were sonicated an average of 25 times prior to addition to the
cultures and were vortexed periodically during addition. Concentrations of β-hematin
used in the present study were comparable to physiological levels of hemozoin measured
in children with severe malaria (Keller et al., 2004b).
2.2 β-hematin Preparation: β-hematin was formed according to the method of Egan
et al. (Egan et al., 2001) by dissolving hemin chloride (bovine, ICN Biomedicals, Aurora,
OH) in 0.1 M NaOH, followed by the addition of HCl and acetate stock solution (12.8 M,
pH 5) at 60°C. After incubation at 60°C for 150 min in the absence of stirring, the
mixture was centrifuged at 10,000 rpm for 10 min, washed with filter-sterilized H2O, and
dried on a heat block at 65°C. The resulting pellet was weighed and resuspended at 1.0
mg/mL in filter-sterilized H2O. The resuspended β-hematin was sonicated thoroughly
before freezing at -20°C. Endotoxin levels were determined to be less than 0.25 EU/mL
(0.05 ng/mL) using the Limulus Amebocyte Lysate test (Cambrex Bio Science,
Walkersville, MD).
2.3 RNA Isolation: Following the removal of culture supernatants, 1.0 mL of
Solution D per 2 x 10⁶ PBMC was added to culture plates, which were stored at -20°C.
Total RNA, was isolated by the GITC method (Chomczynski and Sacchi, 1987).
Briefly, thawed PBMC in Solution D were transferred to sterile baked glass tubes.
12
Following addition of 100 μL of 2M sodium acetate (pH 4.0), 1 mL phenol, and 200 μL
chloroform/isoamyl alcohol (49:1), glass tubes were covered in parafilm and vortexed at
high speed for 10 min. Samples were incubated on ice for 30 min, and then centrifuged
at 3750 rpm for 30 min at 4°C. Three quarters (750 μL) of the upper aqueous phase of
each centrifuged sample was transferred to a sterile micro-centrifuge tube. An equal
volume of cold isopropanol was added to the extracted RNA in each tube, after which the
solution was mixed thoroughly and precipitated at -20°C for a minimum of 2 days.
Precipitated RNA was pelleted by centrifugation at 10,000 rpm for 30 min at 4°C.
Isopropanol was decanted, and tubes were centrifuged repeatedly to remove residual
isopropanol with a pipette. Open tubes were placed upside-down under a fume hood for
15-30 min to allow isopropanol to evaporate, without complete drying of the RNA pellet.
RNA was subsequently dissolved on ice with a minimal (15 μL) volume of DEPC-treated
water. RNA samples were then tritriated, held on ice for 15 min, and heated at 65°C for
10 min to solubilize the RNA. Samples were stored at -20°C.
2.4 Quantitative Real Time RT-PCR: Total RNA (1 μg/(L) was reverse-transcribed
into cDNA using a PTC-100 Peltier Thermal Cycler (MJ Research, Inc., Waltham, MA).
Cytokine gene expression was analyzed by quantitative real time PCR on either an ABI
Prism 7700 Sequence Detection System, an Applied Biosystems 7500 Real Time PCR
System, or an ABI Prism 7900HT instrument (Applied Biosystems, Foster City, CA).
All experiments involving use of the ABI Prism 7900HT instrument were conducted by
the TaqMan® core facility of the University of Pittsburgh Genomics and Proteomics
Core Laboratories. cDNA was amplified in duplicate with the following primer/probe
sets (Applied Biosystems, Foster City, CA): TNF-α (Assay ID Number
Hs00174128m1), IL-12A (p35) (Hs00168405m1), IL-12B (p40) (Hs00233688m1), IL-10
(Hs00174086m1), TGF-β1 (Hs00171257m1), IFN-γ (Hs00174143), IFN-α
(Hs00256882s1), IL-2 (Hs00174114m1), IL-4 (Hs00174122m1), IL-6 (Hs00174131m1),
IL-18 (Hs00155517m1), IL-1β (Hs00174097m1), LT-α (Hs00236874), NOS-2A
(Hs00167248m1), COX-1 (Hs00377721m1), and COX-2 (Hs00153133m1). The
endogenous control gene β-actin [Ascession Number NM001101 (Applied Biosystems,
13
Foster City, CA )] was used as a reference gene to normalize the expression levels of
target genes by correcting differences in the amount of cDNA loaded between samples.
No template controls were included in quadruplicate for each gene to control for
nonspecific background fluorescence. Data were analyzed using the comparative CT
method (ΔΔCT) (Keller et al., 2004b). The change in CT (ΔCT) for each experimental
sample was derived by subtracting the endogenous control gene (β-actin) CT from the
experimental gene CT. The ΔCT for each experimental sample was then subtracted from
the ΔCT of the control (medium alone) sample. Fold change was expressed as 2-ΔΔCT
relative to control conditions.
2.5 Hematology/Malarial Pigment Data: The ongoing hospital-based study is being
conducted at the pediatric ward of the Siaya District Hospital in Siaya District, Nyanza
Province, western Kenya, and at the University of Pittsburgh/KEMRI clinical laboratories
(Ong’echa et al., 2006). Study participants (n = 648) included children from 0 to 3 years
of age, who had visited the hospital with symptoms of malaria. Heel/finger prick blood
(< 100μL) was used to screen for hemoglobin (Hb) levels and to prepare blood smears for
the determination of parasitemia. Hb levels were determined using a HemoCue system
(HemoCue AB, Angelholm, Sweden). Geimsa-stained blood smears were examined
under oil immersion for malaria parasites, which were counted against 300 leukocytes.
Parasite densities (/μL of blood) were estimated using leukocyte counts (/μL of blood)
for the same samples. Complete blood counts were performed with a Beckman Coulter®
AcT diff2™ coulter counter (Beckman-Coulter Corporation, Miami, USA). Reticulocyte
counts were determined from thin blood films stained with new methylene blue.
Reticulocyte index (RI) was calculated as reticulocyte count (%) x (hematocrit/0.36)
(Ong’echa et al., manuscript submitted). Reticulocyte production index (RPI) was
derived as RI/maturation factor (MF), where MF = b + (m)(x), b = 1, m = 0.05, and x =
(average normal population hematocrit – patient’s hematocrit) (Turgeon, 1993). Our
measurements of Hb levels and hematocrit values in age-matched healthy children in
Siaya revealed a normal hemoglobin value of 12.0 g/dL and an average normal
population hematocrit value of 36.0 (Ong’echa et al., manuscript submitted). Thus,
based on age- and geographically-matched normal Hb and hematocrit values obtained
14

from over 1000 children enrolled in this study, a hematocrit value of 36.0 was used to
normalize the reticulocyte counts (Ong’echa et al., manuscript submitted). This
correction takes into account the increased shift in reticulocyte extravasation from the
bone marrow (reticulocyte shift) in anemic patients and the dependence of reticulocyte
maturation time on the degree of anemia (Clark and Hippel, 2002). The percent of
pigment-containing monocytes (% PCM) was calculated as the number of monocytes
containing malarial pigment (hemozoin)/30 x 100, where 30 is the number of monocytes
counted from a blood film.
Based on Hb and parasitemia test results, children were placed into one of six
clinical categories: Healthy Controls (HC), Hospitalized Controls (HosC), Uncomplicated
Malaria (UM), Mild Malarial Anemia (MlMA), Moderate Malarial Anemia (MdMA),
and Severe Malarial Anemia(SMA). Anemia was defined as Hb < 11.0 g/dL, according
to standard guidelines for children under 5 years of age in developing nations (Murray
and Lopez, 1996). The HC group included aparasitemic children with Hb ≥ 11.0 g/dL,
no prior hospitalizations, and absence of fever or diarrhea in the last 14 days (Ong’echa
et. al, 2006). HosC included aparasitemic children with Hb < 11.0 g/dL, who were
treated for non-malarial diseases. Children with UM were defined as having parasitemia
(P. falciparum) of any density, Hb < 11.0 g/dL, and no symptoms of severe malaria (such
as hypoglycemia). Children in the MlMA group had parasitemia of any density, 11.0
g/dL > Hb ≥ 8.00 g/dL, and no symptoms of severe malaria. MdMA subjects were
defined by parasitemia of any density, 8.00 g/dL > Hb ≥ 6.00 g/dL, and no symptoms of
severe malaria. Children with SMA were defined as having parasitemia of any density
and Hb < 6.00 g/dL. Children with cerebral malaria and children who had received
antimalarial treatment within two weeks prior to visiting the hospital were excluded from
the study (Ong’echa et al., 2006). Due to our particular interest in malarial anemia, the
HosC group was excluded from these analyses.
2.6 Multiplex Assay: Plasma cytokine protein levels (IFN-α, IFN-γ, TNF-α, IL-1β,
IL-2, IL-4, IL-6, IL-10, and IL-12p40/p70) of the study participants described above (n =
189) were determined using the BioSource Human Cytokine 25-Plex Antibody Bead Kit
(BioSource, International, Inc., Camarillo, CA). The assay was performed according to
15

the manufacturers specifications, using the Luminex® 100™ System analyzer (Luminex
Corporation, Austin, TX). Briefly, wells of filter bottom microplates were pre-wetted
with Working Wash Solution (200 μL) and then aspirated with a vacuum manifold.
Followed by a second wash, incubation buffer (50 μL) was pipetted into the wells. Beads
(25 μL) of defined spectral properties conjugated to analyte-specific capture antibodies,
standards (100 μL) of known analyte concentration, control samples (100 μL), and
unknown (plasma) samples (100 μL) were pipetted into designated wells. Standards,
controls, and unknown samples were assayed in duplicate. Plasma samples (50 μL) were
centrifuged at 14,000 rpm (and/or filtered) and diluted 1:1 with Assay Diluent (50 μL)
prior to addition to the wells. Sealed, foil-wrapped plates were incubated at room
temperature for 2 hrs on an orbital shaker, after which wells were aspirated and washed
twice with Working Wash Solution (200 μL). Following addition of analyte-specific
Biotinylated Detector Antibody (100 μL) to each well, the plates were incubated at room
temperature for 1 hr on an orbital shaker. Wells were then aspirated and washed twice,
before addition of Streptavidin-R-Phycoerythrin (100 μL/well). After a 30-min
incubation at room temperature on an orbital shaker, wells were aspirated, and the beads
were washed three times. 100 μL of Working Wash Solution was dispensed to each well,
and the plates were placed on an orbital shaker for 2-3 min to resuspend the beads.
Analyte concentrations were determined by analyzing the spectral properties of the
capture beads and the amount of associated R-Phycoerythrin fluorescence with a
Luminex® 100™ instrument.
2.7 Statistical Analyses: Data were analyzed using the Minitab statistical program
(Minitab Release 14 for Windows, Minitab, Inc.). β-actin, TNF-α, IL-12A (p35), IL-12B
(p40), IL-10, TGF-β1, IFN-α, IFN-γ, IL-2, IL-4, IL-6, IL-18, IL-1β, LT-α, NOS-2A,
COX-1, and COX-2 mRNA transcripts were measured in duplicate. Pairwise
comparisons between conditions were performed using the paired Student’s t test, with
statistical significance set at P < 0.05. To adjust for multiple comparisons, a Bonferroni
correction was applied, and P < 0.01 was considered statistically significant.
16

For Tables 1-4, multiple group comparisons were performed by Kruskal-Wallis
tests, and differences between proportions were determined by Chi-square analysis.
Pairwise analyses of UM vs. SMA groups (Table 3) were performed by Mann-Whitney U
tests for variables that were significantly different by Kruskal-Wallis tests. Statistical
significance was set at P < 0.05 for all tests.
17

3.0 RESULTS
Specific Aim 1: To determine the effect of naturally acquired Plasmodium falciparum
hemozoin on hematological outcomes in infants and young children
with malarial anemia
3.1 Results: Hematology and Malarial Pigment Data
3.1.1 Clinical and laboratory parameters:
Due to the importance of elucidating the pathological effects of malarial pigment
(hemozoin) on hematopoietic development and its role in malarial anemia (MA), we
chose to examine hematological data obtained from healthy children and children with
varying degrees of MA. Study participants included infants and children aged 0-3 years
from an area of holoendemic Plasmodium falciparum transmission (Siaya District,
Nyanza Province, western Kenya) (Ong’echa et al., 2006). These children were chosen
as participants in the hospital-based study, since malaria is the primary cause of
morbidity and mortality in African children in this age group (WHO, 2000).
Furthermore, MA causes the majority of malaria-related morbidity and mortality among
children less than five years of age (Breman et al., 2001; WHO, 2000). In western
Kenya, the prevalence of malaria in children 1-4 years of age is 83%, and the prevalence
of anemia in children under 5 years of age ranges from 60-90% (Bloland et al., 1999;
McElroy et al., 2000).
Heel/finger prick blood (< 100μL) was obtained from subjects to screen for
hemoglobin (Hb) levels and parasitemia, and to perform complete blood counts. Based on
Hb and parasitemia (P. falciparum) test results, children (n = 648) were placed into one
of six clinical categories: Healthy Controls (HC), Hospitalized Controls (HosC),
Uncomplicated Malaria (UM), Mild Malarial Anemia (MlMA), Moderate Malarial
18

Anemia (MdMA), and Severe Malarial Anemia (SMA). Anemia was defined as Hb <
11.0 g/dL, according to standard guidelines for children under 5 years of age in
developing nations (Murray et al., 1996). The HC group included aparasitemic children
with Hb ≥ 11.0 g/dL, no prior hospitalizations, and absence of fever or diarrhea in the last
14 days (Ong’echa et. al, 2006). HosC included aparasitemic children with Hb < 11.0
g/dL, who were treated for non-malarial diseases. This group was excluded from the
analyses, which focus on malarial anemia. Children with UM were defined as having
parasitemia of any density, Hb < 11.0 g/dL, and no symptoms of severe malaria (such as
hypoglycemia). Children in the MlMA group had parasitemia of any density, 11.0 g/dL
> Hb ≥ 8.00 g/dL, and no symptoms of severe malaria. MdMA subjects were defined by
parasitemia of any density, 8.00 g/dL > Hb ≥ 6.00 g/dL, and no symptoms of severe
malaria. Children with SMA were defined as having parasitemia of any density and Hb <
6.00 g/dL. Multiple group comparisons were performed by Kruskal-Wallis tests, and
differences between proportions were determined by Chi-square analysis, with statistical
significance set at P < 0.05 for all tests.
Table 1 summarizes the clinical and demographic characteristics of study
participants (n = 648), stratified according to clinical category. Specifically, leukocytic,
erythrocytic, platelet, and parasitological indices were analyzed. The distribution of
study participants among the five clinical categories was as follows: HC, n = 63; UM, n =
36; MlMA, n = 146; MdMA, n = 167; and SMA, n = 236. Enrolled subjects included
327 males and 314 females, and the proportion of males and females in the different
clinical categories was not significantly different (P = 0.079). Multiple group
comparisons revealed that age was significantly associated with disease severity (P <
0.0001). Children in the HC group were the youngest, with a mean enrollment age of
9.35 ± 0.85 months (mean ± SEM), followed by children with SMA (10.76 ± 0.45
months). Mean enrollment ages of subjects in the UM, MlMA, and MdMA categories
were 12.24 ± 1.51, 12.87 ± 0.58, and 12.38 ± 0.53 months, respectively. Thus, among
children with malaria, those with SMA were the youngest.
Mean axillary temperature (°C) differed significantly among the clinical groups
(P < 0.0001), but parasitemia was not significantly associated with disease severity (P =
.358). The UM group exhibited the highest mean parasitemia (76,737 ± 15,948/μL),
19
followed by those children in the SMA group (63,245 ± 6,148/μL). The MdMA group
had the lowest mean parasitemia (51,074 ± 5,638/μL). High density parasitemia (HDP, ≥
10,000 parasites/μL) was also not significantly different among the groups (P = 0.764).
The UM group contained the greatest proportion of subjects with HDP (77.78%),
whereas the MdMA group contained the least (69.46%).
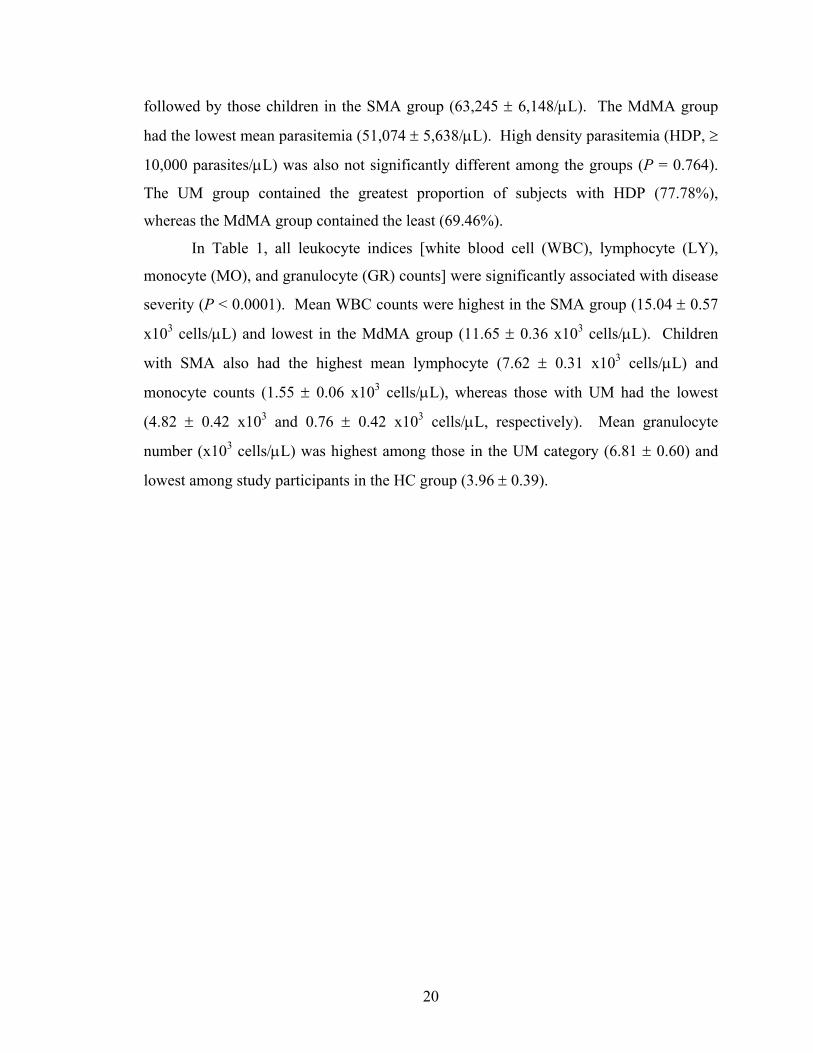
In Table 1, all leukocyte indices [white blood cell (WBC), lymphocyte (LY),
monocyte (MO), and granulocyte (GR) counts] were significantly associated with disease
severity (P < 0.0001). Mean WBC counts were highest in the SMA group (15.04 ± 0.57
x103 cells/μL) and lowest in the MdMA group (11.65 ± 0.36 x10³ cells/μL). Children
with SMA also had the highest mean lymphocyte (7.62 ± 0.31 x10³ cells/μL) and
monocyte counts (1.55 ± 0.06 x10³ cells/μL), whereas those with UM had the lowest
(4.82 ± 0.42 x10³ and 0.76 ± 0.42 x10³ cells/μL, respectively). Mean granulocyte
number (x103 cells/μL) was highest among those in the UM category (6.81 ± 0.60) and
lowest among study participants in the HC group (3.96 ± 0.39).
20

Table 1. Clinical and demographic characteristics of study participants
HC UM MlMA MdMA SMA P No. of subjects 63 36 146 167 236 Demographic Factors Age, mos. 9.35 (0.85) 12.24 (1.51) 12.87 (0.58) 12.38 (0.53) 10.76 (0.45) <0.0001a
Sex Female, n (%) 38 (60.32) 20 (58.82) 59 (40.97) 80 (48.48) 117 (49.79) 0.079b
Male, n (%) 25 (39.68) 14 (41.18) 85 (59.03) 85 (51.52) 118 (50.21)
Clinical/Parasitological Factors Temperature, ˚C 36.77 (0.10) 37.66 (0.19) 37.60 (0.09) 37.73 (0.09) 37.56 (0.06) <0.0001a
Parasitemia, /μL 0 (0) 76,737 (15,948) 51,172 (5,091) 51,074 (5,638) 63,245 (6,148) 0.358c
HDP, n (%) 0 (0) 28 (77.78) 106 (72.60) 116 (69.46) 169 (71.61) 0.764d
Leukocytic Factors WBC, x103 cells/μL 11.88 (0.57) 12.39 (0.72) 11.65 (0.36) 12.02 (0.39) 15.04 (0.57) <0.0001a
LY, x103 cells/μL 7.05 (0.38) 4.82 (0.42) 5.52 (0.23) 6.03 (0.22) 7.62 (0.31) <0.0001a
MO, x103 cells/μL 0.89 (0.05) 0.76 (0.07) 0.96 (0.05) 1.12 (0.05) 1.55 (0.06) <0.0001a
GR, x103 cells/μL 3.96 (0.39) 6.81 (0.60) 5.17 (0.24) 4.88 (0.24) 5.87 (0.29) <0.0001a
21
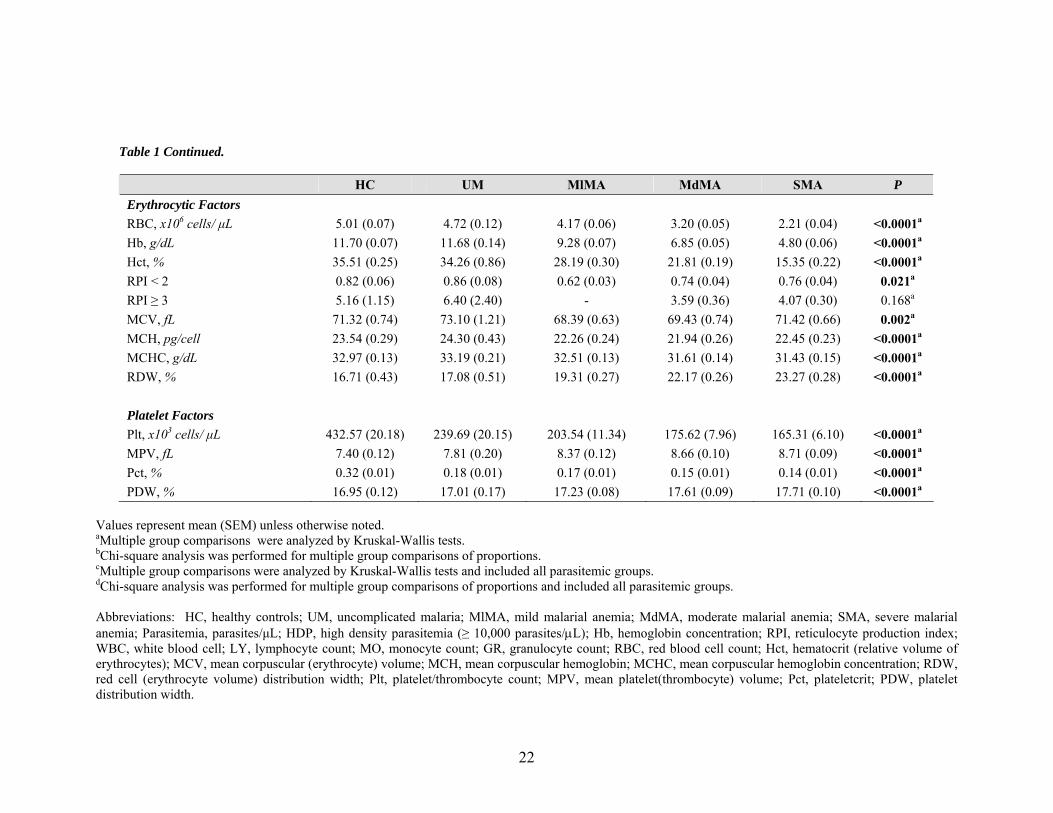
Table 1 Continued.
HC UM MlMA MdMA SMA P Erythrocytic Factors RBC, x106 cells/ μL 5.01 (0.07) 4.72 (0.12) 4.17 (0.06) 3.20 (0.05) 2.21 (0.04) <0.0001a
Hb, g/dL 11.70 (0.07) 11.68 (0.14) 9.28 (0.07) 6.85 (0.05) 4.80 (0.06) <0.0001a
Hct, % 35.51 (0.25) 34.26 (0.86) 28.19 (0.30) 21.81 (0.19) 15.35 (0.22) <0.0001a
RPI < 2 0.82 (0.06) 0.86 (0.08) 0.62 (0.03) 0.74 (0.04) 0.76 (0.04) 0.021a
RPI ≥ 3 5.16 (1.15) 6.40 (2.40) - 3.59 (0.36) 4.07 (0.30) 0.168a
MCV, fL 71.32 (0.74) 73.10 (1.21) 68.39 (0.63) 69.43 (0.74) 71.42 (0.66) 0.002a
MCH, pg/cell 23.54 (0.29) 24.30 (0.43) 22.26 (0.24) 21.94 (0.26) 22.45 (0.23) <0.0001a
MCHC, g/dL 32.97 (0.13) 33.19 (0.21) 32.51 (0.13) 31.61 (0.14) 31.43 (0.15) <0.0001a
RDW, % 16.71 (0.43) 17.08 (0.51) 19.31 (0.27) 22.17 (0.26) 23.27 (0.28) <0.0001a
Platelet Factors Plt, x103 cells/ μL 432.57 (20.18) 239.69 (20.15) 203.54 (11.34) 175.62 (7.96) 165.31 (6.10) <0.0001a
MPV, fL 7.40 (0.12) 7.81 (0.20) 8.37 (0.12) 8.66 (0.10) 8.71 (0.09) <0.0001a
Pct, % 0.32 (0.01) 0.18 (0.01) 0.17 (0.01) 0.15 (0.01) 0.14 (0.01) <0.0001a
PDW, % 16.95 (0.12) 17.01 (0.17) 17.23 (0.08) 17.61 (0.09) 17.71 (0.10) <0.0001a
Values represent mean (SEM) unless otherwise noted. aMultiple group comparisons were analyzed by Kruskal-Wallis tests. bChi-square analysis was performed for multiple group comparisons of proportions. cMultiple group comparisons were analyzed by Kruskal-Wallis tests and included all parasitemic groups. dChi-square analysis was performed for multiple group comparisons of proportions and included all parasitemic groups. Abbreviations: HC, healthy controls; UM, uncomplicated malaria; MlMA, mild malarial anemia; MdMA, moderate malarial anemia; SMA, severe malarial anemia; Parasitemia, parasites/μL; HDP, high density parasitemia (≥ 10,000 parasites/μL); Hb, hemoglobin concentration; RPI, reticulocyte production index; WBC, white blood cell; LY, lymphocyte count; MO, monocyte count; GR, granulocyte count; RBC, red blood cell count; Hct, hematocrit (relative volume of erythrocytes); MCV, mean corpuscular (erythrocyte) volume; MCH, mean corpuscular hemoglobin; MCHC, mean corpuscular hemoglobin concentration; RDW, red cell (erythrocyte volume) distribution width; Plt, platelet/thrombocyte count; MPV, mean platelet(thrombocyte) volume; Pct, plateletcrit; PDW, platelet distribution width.
22

All erythrocyte parameters were significantly different among clinical categories
at P < 0.0001, with the exception of mean corpuscular volume (MCV), which was
significant at P = 0.002. The mean hemoglobin (Hb, g/dL) concentrations for the groups
were 11.70 ± 0.07 (HC), 11.68 ± 0.14 (UM), 9.28 ± 0.07 (MlMA), 6.85 ± 0.05 (MdMA),
and 4.80 ± 0.06 (SMA). As expected, mean red blood cell (RBC) counts (x106 cells/μL)
were highest in the HC group (5.01 ± 0.07) and lowest in the SMA category (2.21 ±
0.04). In agreement with this finding, mean hematocrit (Hct, %) was highest among
healthy controls (35.51 ± 0.25) and lowest among children with SMA (15.35 ± 0.22).
Reticulocyte production index (RPI), which is a function of reticulocyte maturation time
and dependent on the degree of anemia (Clark and Hippel, 2002), was stratified as RPI <
2 or RPI ≥ 3. A reticulocyte production index less than 2 (RPI < 2), indicative of an
inadequate bone marrow proliferative response or ineffective erythropoiesis, differed
significantly among HC, UM, MlMA, MdMA, and SMA groups (P = 0.021). An RPI
less than 2 was lowest in children with mild MA (0.62 ± 0.03) and highest among those
with uncomplicated malaria (0.86 ± 0.08). A reticulocyte production index greater than
or equal to 3 (RPI ≥ 3), which indicates an erythropoietic response appropriate for the
degree of anemia, was not significantly different between clinical categories (P = 0.168).
MCV (mean corpuscular/erythrocyte volume, fL) correlated with RPI, being lowest in the
MdMA category (68.39 ± 0.63) and highest in the UM category (73.10 ± 1.21). Mean
corpuscular hemoglobin (MCH, pg/cell) was greatest in the UM group and lowest in the
MdMA group. Mean corpuscular hemoglobin concentration (MCHC, g/dL) was also
highest in the UM group, but lowest in children with SMA. Red cell distribution width
(RDW, %), which represents the coefficient of variation of the RBC size, was lowest in
HC subjects (16.71 ± 0.43) and highest in the SMA group (23.27 ± 0.28).
Platelet indices were also significantly different among the clinical categories (P
< 0.0001), with the most extreme values occurring between the HC and SMA groups.
The HC group had the highest mean platelet counts (432.57 ± 20.18 x10³ cells/μL) and
mean plateletcrit (0.32 ± 0.01%), and the SMA group had the lowest (165.31 ± 6.10 and
0.14 ±0.01, respectively). Conversely, mean platelet volume (MPV, fL) was highest in
the SMA clinical category (8.71 ± 0.09) and lowest in healthy control subjects (7.40 ±
23

0.12). Platelet distribution width (PDW, %), which represents the coefficient of variance
of platelet size, was highest in the SMA group (17.71 ± 0.10) and lowest in healthy
children (16.95 ± 0.12).
Table 2 summarizes the clinical and demographic characteristics of parasitemic
study participants (UM, MlMA, MdMA, and SMA groups, n = 555), stratified according
to percent of pigment-containing monocytes (% PCM). Children were grouped as such,
since the presence of intraleukocytic pigment is a useful prognostic indicator of severe
malaria infection after clearance of parasites from the peripheral blood (Phu et al., 1994;
Day et al., 1996). Furthermore, hemozoin is present in the peripheral blood phagocytes
of > 90% of patients with severe malaria (Day et al., 1996).
Monocyte pigment categories were designated as 0% PCM, ≤ 10% PCM, and >
10% PCM. Distribution of study participants among the different pigment categories was
as follows: 0% PCM, n = 284; ≤ 10% PCM, n = 110; and > 10% PCM, n = 161. The
proportion of males and females in each group was not significantly different (P = 0.068).
Multiple group comparisons showed that age was not significantly associated with blood
content of pigment-containing monocytes (P = 0.216), though children with > 10% PCM
were the youngest (11.15 ± 0.54 months). Mean axillary temperature (°C) was
significantly different among pigment categories (P = 0.034). Parasitemia was
significantly associated (P = 0.002) with percent of pigment-containing monocytes and
increased with increasing % PCM. The > 10% PCM group contained subjects with the
highest mean parasitemia (76,133 ± 7,983 parasites/μL), followed by the ≤ 10% and 0%
PCM groups (56,348 ± 7,505 and 45,337 ± 3,532, respectively). However, the ≤ 10%
PCM group contained the greatest proportion of subjects with HDP (78%), which also
differed significantly between groups (P = 0.032).
All leukocyte indices were significantly different between pigment categories (P
< .0001), with the exception of granulocyte count (P = 0.441). WBC, lymphocyte, and
monocyte counts increased with the percent of pigment-containing monocytes.
24
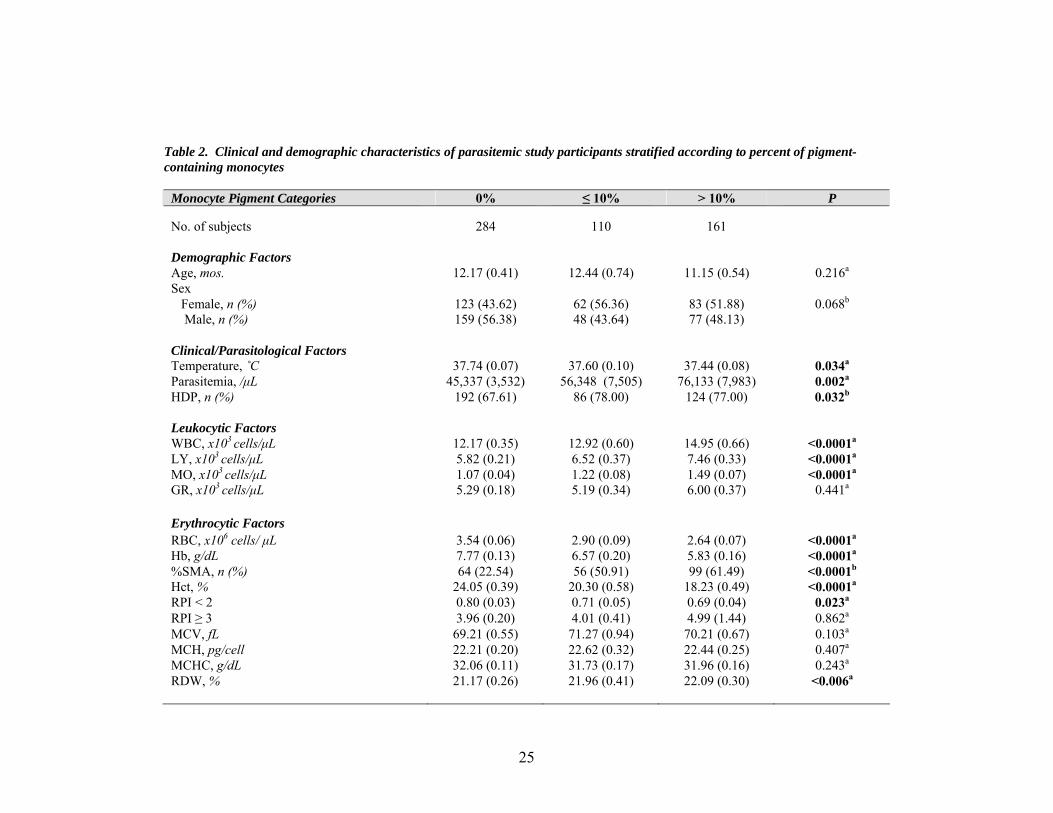
Table 2. Clinical and demographic characteristics of parasitemic study participants stratified according to percent of pigment-containing monocytes
Monocyte Pigment Categories 0% ≤ 10% > 10% P No. of subjects 284 110 161 Demographic Factors Age, mos. 12.17 (0.41) 12.44 (0.74) 11.15 (0.54) 0.216a
Sex Female, n (%) 123 (43.62) 62 (56.36) 83 (51.88) 0.068b
Male, n (%) 159 (56.38) 48 (43.64) 77 (48.13) Clinical/Parasitological Factors Temperature, ˚C 37.74 (0.07) 37.60 (0.10) 37.44 (0.08) 0.034a
Parasitemia, /μL 45,337 (3,532) 56,348 (7,505) 76,133 (7,983) 0.002a
HDP, n (%) 192 (67.61) 86 (78.00) 124 (77.00) 0.032b
Leukocytic Factors WBC, x103 cells/μL 12.17 (0.35) 12.92 (0.60) 14.95 (0.66) <0.0001a
LY, x103 cells/μL 5.82 (0.21) 6.52 (0.37) 7.46 (0.33) <0.0001a
MO, x103 cells/μL 1.07 (0.04) 1.22 (0.08) 1.49 (0.07) <0.0001a
GR, x103 cells/μL 5.29 (0.18) 5.19 (0.34) 6.00 (0.37) 0.441a
Erythrocytic Factors RBC, x106 cells/ μL 3.54 (0.06) 2.90 (0.09) 2.64 (0.07) <0.0001a
Hb, g/dL 7.77 (0.13) 6.57 (0.20) 5.83 (0.16) <0.0001a
%SMA, n (%) 64 (22.54) 56 (50.91) 99 (61.49) <0.0001b
Hct, % 24.05 (0.39) 20.30 (0.58) 18.23 (0.49) <0.0001a
RPI < 2 0.80 (0.03) 0.71 (0.05) 0.69 (0.04) 0.023a
RPI ≥ 3 3.96 (0.20) 4.01 (0.41) 4.99 (1.44) 0.862a
MCV, fL 69.21 (0.55) 71.27 (0.94) 70.21 (0.67) 0.103a
MCH, pg/cell 22.21 (0.20) 22.62 (0.32) 22.44 (0.25) 0.407a
MCHC, g/dL 32.06 (0.11) 31.73 (0.17) 31.96 (0.16) 0.243a
RDW, % 21.17 (0.26) 21.96 (0.41) 22.09 (0.30) <0.006a
25

Table 2 Continued.
Monocyte Pigment Categories 0% ≤ 10% > 10% P Platelet Factors Plt, x103 cells/ μL 201.87 (7.21) 164.01 (8.52) 156.78 (6.26) <0.0001a
Pct, % 8.34 (0.08) 8.61 (0.14) 8.90 (0.11) <0.0001a
MPV, fL 0.17 (0.01) 0.14 (0.01) 0.14 (0.01) 0.004a
PDW, % 17.44 (0.07) 17.42 (0.10) 17.74 (0.08) 0.014a
Values represent mean (SEM) unless otherwise noted. aMultiple group comparisons were analyzed by Kruskal-Wallis tests. bChi-square analysis was performed for multiple group comparisons of proportions. Abbreviations: Parasitemia, parasites/μL; HDP, high density parasitemia (≥ 10,000 parasites/μL); Hb, hemoglobin concentration; %SMA, percent severe malarial anemia; RPI, reticulocyte production index; WBC, white blood cell; LY, lymphocyte count; MO, monocyte count; GR, granulocyte count; RBC, red blood cell count; Hct, hematocrit (relative volume of erythrocytes); MCV, mean corpuscular (erythrocyte) volume; MCH, mean corpuscular hemoglobin; MCHC, mean corpuscular hemoglobin concentration; RDW, red cell (erythrocyte volume) distribution width; Plt, platelet/thrombocyte count; MPV, mean platelet(thrombocyte) volume; Pct, plateletcrit; PDW, platelet distribution width.
26

Among erythrocyte indices, RBC count, Hb, and hematocrit were significantly
different (P < 0.0001) between pigment categories. The 0% PCM category contained
children having the highest RBC counts (3.54 ± 0.06 x10⁶ cells/μL), Hb (7.77 ± 0.13
g/dL), and hematocrit (24.05 ± 0.39 %), whereas the > 10% PCM category contained
children with the lowest (2.62 ± 0.07 x10⁶ cells/μL, 5.83 ± 0.16 g/dL, and 18.23 ± 0.49
%, respectively). Notably, the percent of study participants diagnosed with SMA was
significantly different among PCM categories (P < 0.0001), and the greatest proportion of
children with SMA (61.49%) were included in the > 10% PCM group. RPI < 2
(suppression of erythropoiesis) was significantly associated with pigment category (P =
.023), decreasing with increasing % PCM. RPI ≥ 3 (appropriate erythropoietic response
for the degree of anemia) did not differ significantly between pigment categories. Taken
together, these results demonstrate that percent of pigment-containing monocytes may be
predictive of the severity of MA. However, erythrocytic factors that were not
significantly associated with pigment category included MCV (P = 0.103), MCH (P =
0.407), and MCHC (P = 0.243). RDW was significantly different between groups (P =
0.006) and increased with increasing % PCM.
In addition, all platelet indices were significantly different among monocyte
pigment categories. Mean platelet count (P < 0.0001) was inversely associated with
percent of pigment-containing monocytes. Mean platelet volume (P < 0.0001) increased
with increasing % PCM. Plateletcrit (P = 0.004) was highest in the 0% PCM category
and equivalent in the ≤ 10% PCM and > 10% PCM categories. Platelet distribution width
(P = 0.014) was greatest in the > 10% pigment group (17.74 ± 0.08).
In summary, results presented in Tables 1 and 2 indicate that monocytic
acquisition of hemozoin is significantly associated with hematological parameters in
children with varying severities of malarial anemia. Leukocyte, erythrocyte, and platelet
indices were significantly different between HC, UM, MlMA, MdMA, and SMA clinical
groups. The majority of leukocyte, erythrocyte, and platelet indices were also
significantly different between pigment-containing monocyte categories. Temperature
was significantly associated with clinical category and with proportion of pigment-
27

containing monocytes. Age was significantly different between clinical groups but not
between PCM categories. However, among children with malaria, those with SMA and
those with > 10% pigment-containing monocytes were the youngest. Parasitemia (/μL)
and high density parasitemia (%) were significantly associated with proportion of
pigment containing monocytes but not with clinical group. Suppression of
erythropoiesis, as indicated by a reticulocyte production index less than 2, was greatest
(lowest RPI) in children with mild MA (Table 1) and in those children with the greatest
proportion (> 10%) of pigment-containing monocytes (Table 2). Children in the > 10%
pigment-containing monocyte group exhibited the lowest Hb, hematocrit, and erythrocyte
counts. In addition, the > 10% PCM group contained the greatest proportion of children
with SMA. Taken together, these results suggest that the development of SMA is
mediated, at least in part, by the phagocytosis of hemozoin by monocytes. Of relevance,
malarial immunity is defined by concomitant interactions between a large number of
different innate inflammatory mediators, and ingestion of hemozoin by peripheral blood
mononuclear cells promotes dysregulation of inflammatory mediator production in
children with malaria. Since these measurements have not been performed previously in
children with malaria, we decided to measure numerous innate inflammatory mediators in
children with varying severities of malarial anemia using a cytokine multiplex assay.
28

Specific Aim 2: To determine the relationship between in vivo innate inflammatory
mediator production and monocytic acquisition of Plasmodium
falciparum hemozoin in infants and young children with malarial
anemia
3.2 Results: Multiplex Assay
3.2.1 Clinical and laboratory parameters:
In order to compare cytokine protein levels among children with (and without)
varying degrees of malarial anemia (MA), plasma levels of IL-12p40/p70, IFN-α, IFN-γ,
TNF-α, IL-1β, IL-2, IL-4, IL-6, and IL-10 from study participants described previously
(n = 189) were determined by multiplex assay. Plasma cytokine levels of parasitemic
study participants (UM, MlMA, MdMA, and SMA groups) were further stratified
according to blood content of pigment-containing monocytes to examine whether
cytokine production was positively correlated with percent of pigment-containing
monocytes (% PCM). Multiple group comparisons were performed by Kruskal-Wallis
tests, with statistical significance set at P < 0.05 for all analyses. Due to our interest in
understanding the role of these cytokines in mediating the development of uncomplicated
versus severe disease (anemia), pairwise comparisons of UM versus SMA groups were
performed by Mann-Whitney U tests for variables that were significantly different by
Kruskal-Wallis tests.
Table 3 illustrates the plasma cytokine profiles of study participants, stratified by
clinical category (HC, n = 34; UM, n = 20; MlMA, n = 38; MdMA, n = 13; and SMA, n
= 84). Multiple group comparisons revealed that plasma levels (pg/mL) of IFN-γ (P =
0.138), TNF-α (P = 0.465), IL-1β (P = 0.816), and IL-2 (P = 0.673) were not
significantly different between clinical groups. Plasma IFN-α was significantly different
among clinical categories (P < 0.0001). The HC group had the highest mean (mean ±
SEM) IFN-α levels (93.71 ± 14.95), and those subjects with moderate MA had the lowest
IFN-α levels (9.97 ± 4.04). Pairwise comparison of UM (43.77 ± 12.63) versus SMA
(71.56 ± 32.47) groups showed that mean plasma IFN-α levels were not significantly
29

different (P = 0.586) between the groups. Mean plasma levels of IL-4 and IL-6 were
significantly different among clinical categories (P = 0.004 and P < 0.0001, respectively).
Consistent with IFN-α levels, plasma IL-4 was highest among healthy controls (34.26 ±
8.53) and lowest in the MdMA group (4.68 ± 1.16). Pairwise comparison of UM (10.42
± 2.72) versus SMA (13.17 ± 2.15) groups indicated that plasma IL-4 levels were not
significantly different between these clinical categories (P = 0.745). Plasma IL-6 levels
were highest in children with severe malarial anemia (273.09 ± 56.64) and lowest in
healthy control subjects (56.24 ± 13.06), but were not significantly different (P = 0.289)
between UM and SMA groups. Study participants with uncomplicated malaria had the
highest plasma levels of IL-10 (978.82 ± 478.34), which were determined to be
significantly different among clinical groups (P < 0.0001). The HC group contained
those subjects with the lowest levels of IL-10 (118.03 ± 24.82). However, pairwise
comparison of UM versus SMA clinical groups revealed that plasma IL-10 levels were
not significantly different (P = 0.539) between the two groups. Plasma IL-12p40/p70
also differed significantly among clinical categories (P = 0.009). Children in the MlMA
group had the highest levels of IL-12p40/p70 (564.68 ± 69.93), whereas plasma IL-
12p40/p70 was lowest among those with moderate malarial anemia (309.18 ± 32.91). IL-
12 levels were not significantly different between UM and SMA clinical categories (P =
0.911).
30

Table 3. Plasma cytokine levels of study participants
HC UM MlMA MdMA SMA P P (UM vs. SMA) No. of subjects 34 20 38 13 84
Cytokine (pg/mL) IFN-α 93.71 (14.95) 43.77 (12.63) 52.42 (13.47) 9.97 (4.04) 71.56 (32.47) <0.0001a 0.568b
IFN-γ 35.22 (7.28) 46.36 (20.59) 18.93 (5.58) 15.46 (5.06) 19.09 (4.50) 0.138a TNF-α 103.45 (57.48) 36.18 (7.19) 54.85 (12.48) 27.23 (7.63) 48.77 (5.26) 0.465a IL-1β 300.08 (73.63) 169.25 (46.17) 278.59 (71.67) 272.67 (86.68) 234.57 (28.77) 0.816a IL-2 117.52 (39.31) 41.03 (14.08) 114.53 (52.12) 81.67 (38.36) 90.91 (32.18) 0.673a IL-4 34.26 (8.53) 10.42 (2.72) 17.89 (7.14) 4.68 (1.16) 13.17 (2.15) 0.004a 0.745b
IL-6 56.24 (13.06) 159.95 (53.96) 248.23 (65.10) 121.37 (48.26) 273.09 (56.64) <0.0001a 0.289b
IL-10 118.03 (24.82) 978.82 (478.34) 926.72 (253.57) 302.40 (103.82) 538.96 (76.16) <0.0001a 0.539b
IL-12p40/p70 557.39 (59.51) 400.48 (45.81) 564.68 (69.93) 309.18 (22.91) 418.95 (26.73) 0.009a 0.911b
Values represent mean (SEM) unless otherwise noted. aMultiple group comparisons were analyzed by Kruskal-Wallis tests. bPairwise analyses of UM vs. SMA groups were performed by Mann-Whitney U tests for variables that were significantly different by Kruskal-Wallis tests. Abbreviations: HC, healthy controls; UM, uncomplicated malaria; MlMA, mild malarial anemia; MdMA, moderate malarial anemia; SMA, severe malarial anemia.
31

Table 4 summarizes the plasma cytokine protein levels of parasitemic study
participants (UM, MlMA, MdMA, and SMA groups; n = 155), stratified according to
percent of pigment-containing monocytes (0%, ≤ 10%, and > 10%). Distribution of study
participants among the three pigment categories was as follows: 0% PCM, n = 73; ≤
10% PCM, n = 32; and > 10% PCM, n = 50. Multiple group comparisons showed that
when subjects were grouped according to percent of pigment-containing monocytes (%
PCM), mean plasma levels of IFN-γ (P = 0.211), IL-1β (P = 0.761), and IL-2 (P = 0.509)
were not significantly different among pigment categories. Plasma IFN-γ was lowest
among children in the ≤ 10% PCM category and highest among those with 0% pigment-
containing monocytes. Relative to IL-1β levels of subjects with 0% pigment-containing
monocytes, plasma IL-1β was elevated in the ≤ 10% PCM group and suppressed in the >
10% PCM group. Children with 0% pigment-containing monocytes exhibited the lowest
levels of IL-2, whereas children in the ≤ 10% PCM category had the highest levels of IL-
2.
Although IFN-α, IL-4, IL-6, IL-10 and IL-12p40/p70 levels had been determined
to differ significantly between clinical groups (Table 3), these cytokines were also not
significantly associated with the proportion of pigment-containing monocytes (P = 0.579,
P = 0.300, P = 0.542, and P = 0.172, respectively). Mean plasma IFN-α and IL-4 were
highest among children in the > 10% PCM category and lowest in the ≤ 10% PCM group.
Relative to children with 0% pigment-containing monocytes, those in the ≤ 10% PCM
category had elevated levels of IL-6 and IL-12p40/p70, and those in the > 10% PCM
category exhibited decreased levels of IL-6 and IL-12p40/p70. Plasma levels of IL-10
were inversely associated with proportion of pigment-containing monocytes.
Differences in plasma TNF-α between pigment-containing monocyte categories
bordered statistical significance at P = 0.051. Parasitemic children in the ≤ 10% PCM
group exhibited the highest levels (pg/mL) of TNF-α (61.42 ± 13.06), whereas those with
0% PCM had the lowest plasma TNF-α (39.92 ± 6.21).
32

Table 4. Plasma cytokine levels of parasitemic study participants stratified according to percent of pigment-containing monocytes
Monocyte Pigment Categories 0% ≤ 10% > 10% P No. of subjects 73 32 50 Cytokine (pg/mL) IFN-α 45.22 (9.62) 32.04 (9.06) 93.64 (53.67) 0.579a
IFN-γ 26.60 (6.62) 9.72 (3.14) 23.97 (6.91) 0.211a
TNF-α 39.92 (6.21) 61.42 (13.06) 47.57 (5.28) 0.051a
IL-1β 239.54 (32.00) 300.48 (89.98) 202.35 (25.12) 0.761a
IL-2 69.07 (12.69) 131.15 (65.01) 92.64 (50.67) 0.509a
IL-4 13.79 (3.83) 9.27 (2.16) 15.04 (3.29) 0.300a
IL-6 228.35 (48.66) 342.13 (118.02) 190.61 (37.63) 0.221a
IL-10 835.29 (195.56) 611.96 (108.12) 468.73 (74.69) 0.542a
IL-12p40/p70 454.50 (37.00) 502.20 (58.61) 388.60 (33.45) 0.172a
Values represent mean (SEM) unless otherwise noted. aMultiple group comparisons were analyzed by Kruskal-Wallis tests.
33

Taken together, results presented in Tables 3 and 4 demonstrate that plasma levels
of IFN-α, IL-4, IL-6, IL-10, and IL-12p40/p70 are significantly different among HC,
UM, MlMA, MdMA, and SMA clinical categories. Differences in plasma levels of these
inflammatory mediators between children with uncomplicated malaria and children with
severe MA are not statistically significant. Furthermore, among parasitemic children,
plasma IFN-α, IL-4, IL-6, IL-10, and IL-12p40/p70 are not significantly associated with
percent of pigment-containing monocytes. Differences in plasma TNF-α are not
significant between clinical groups but approach statistical significance between 0%, ≤
10%, and > 10% PCM categories. Mean plasma levels of IFN-γ, IL-1β, and IL-2 are not
significantly different among clinical groups or pigment-containing monocyte categories.
In summary, stratification of children according to the proportion of pigment-
containing monocytes revealed distinct patterns of cytokine production that differed
substantially for the different inflammatory mediators. In children with and without
varying degrees of malarial anemia, hemozoin produced a dose-response effect on plasma
cytokine levels, differentially up-regulating production of some inflammatory mediators
while down-regulating production of others. These results suggest that malarial pigment
plays an important role in promoting changes in cytokine production during malaria
infection which contribute to the development of severe malarial anemia. Importantly,
malarial immunity is determined by concomitant interactions between numerous innate
inflammatory mediators, and the role of hemozoin in regulating the temporal kinetics of
cytokine production has not been previously investigated concomitantly for a large
number of innate immune response genes. For this reason, we next sought to determine
the temporal kinetics of several innate immune response genes thought to be important
mediators of the pathogenesis of malarial anemia.
34

Specific Aim 3: To determine the temporal kinetics of hemozoin-induced dysregulation in innate inflammatory mediators in cultured human peripheral blood mononuclear cells
3.3 Results: Quantitative Real Time RT-PCR 3.3.1 Laboratory parameters:
PBMC isolated from malaria-nave donors (n = 9) were stimulated with media
alone or a high dose of β-hematin (10 μg/mL), and cells were harvested at 4, 8, 24, 48,
and 72 hrs. To investigate the temporal effect of β-hematin on de novo cytokine
transcription, RNA was extracted from cells and reverse transcribed for real time RT-
PCR analysis. Results are expressed as fold change ± SEM relative to control (media
alone) conditions. Statistical significance of the difference in means between baseline
and stimulated conditions or between fold change at each time point and 4 hrs (time zero)
was determined by paired t-tests. P < 0.05 was considered statistically significant for
stimulated versus control conditions. To adjust for multiple comparisons of fold change
at 8, 24, 48, and 72 hrs relative to fold change at 4 hrs, a Bonferroni correction was
applied, and P < 0.01 was deemed statistically significant.
3.3.2 Pro-inflammatory mediator production 3.3.2.1 Temporal effect of β-hematin on IL-1β transcripts:
IL-1β mRNA was detectable in stimulated cells at 4 hrs and continued to increase
at 8 and 24 hrs (Figure 4). The difference in means between transcript production under
stimulated versus baseline conditions was statistically significant at all time points
(indicated by asterisks). In the majority of donors, transcript production peaked at 48 hrs,
as evidenced by a > 300- to 1300-fold increase relative to untreated cells. β-hematin
significantly augmented donor 5 IL-1β mRNA at 24 hrs, producing a > 2400-fold
increase over unstimulated conditions. By 72 hrs, IL-1β transcripts began to decrease to
levels below 600-fold over baseline. Relative to the 4 hr time point (time zero), IL-1β
mRNA production was significantly elevated at 48 (P = 0.001) and 72 hrs (P = 0.003).
35

0
500
1000
1500
2000
2500
3000
4hrs 8hrs 24hrs 48hrs 72hrs
Time (hrs)
1
Figure 4. Temporal effect of β-hematin on IL-1β transcripts. PBMC were isolated from venous blood (70 mL) obtained from nine healthy, malaria-nave donors. Cultured PBMC (106 cells/mL) were stimulated with media alone or with β-hematin (10 μg/mL). RNA was isolated from harvested cells at 4, 8, 24, 48, and 72 hrs for IL-1β mRNA quantification by real-time RT-PCR. Results are expressed as fold change relative to unstimulated (baseline) conditions. Values shown are the means ± SEM of results from duplicate samples at each time point. Statistical significance was determined by paired t-tests. * denotes statistical significance of stimulated versus baseline conditions at P < 0.05. ** denotes statistical significance of stimulated versus baseline conditions at P < 0.01.
3.3.2.2 Temporal effect of β-hematin on IL-2 transcripts:
In the presence of β-hematin, IL-2 transcript production at 4, 8, and 24 hrs
fluctuated at or slightly above baseline levels in most donors (Figure 5). IL-2 mRNA
increased between 24 and 48 hrs, peaking in the majority of subjects at 48 hrs. Donors 6
and 9 exhibited a sharp increase in IL-2 transcript production at 8 (> 18-fold) and 24 hrs
(> 17-fold), respectively. The difference in means between IL-2 transcript production
under stimulated versus control conditions was statistically significant (P < 0.05) only at
48 hrs. IL-2 mRNA decreased by 72 hrs in 5 of 9 donors. After correcting for multiple
comparisons, it was determined that fold change in IL-2 was not significantly augmented
at any subsequent time point, relative to 4 hrs.
IL-1β
mR
NA
(F
old
Cha
nge
over
Con
trol
)
2
3
4
5
6
7
8
9
**P < 0.01*P < 0.05
**
**
*
***
0
500
1000
1500
2000
2500
3000
4hrs 8hrs 24hrs 48hrs 72hrs
Time (hrs)
(Fol
d C
hang
e ov
er C
ontr
ol)
1
IL-1β
mR
NA
2
3
4
5
6
7
8
9
**P < 0.01*P < 0.05
**
**
*
*
0
500
1000
1500
2000
2500
3000
4hrs 8hrs 24hrs 48hrs 72hrs
Time (hrs)
(Fol
d C
hang
e ov
er C
ontr
ol)
1
IL-1β
mR
NA
2
3
4
5
6
7
8
9
**P < 0.01*P < 0.05
**
**
*
0
500
1000
1500
2000
2500
3000
4hrs 8hrs 24hrs 48hrs 72hrs
Time (hrs)
(Fol
d C
hang
e ov
er C
ontr
ol)
1
IL-1β
mR
NA
2
3
4
5
6
7
8
9
**P < 0.01*P < 0.05
**
**
0
500
1000
1500
2000
2500
3000
4hrs 8hrs 24hrs 48hrs 72hrs
Time (hrs)
(Fol
d C
hang
e ov
er C
ontr
ol)
1
IL-1β
mR
NA
2
3
4
5
6
7
8
9
**P < 0.01*P < 0.05
**
0
500
1000
1500
2000
2500
3000
4hrs 8hrs 24hrs 48hrs 72hrs
Time (hrs)
(Fol
d C
hang
e ov
er C
ontr
ol)
1
IL-1β
mR
NA
2
3
4
5
6
7
8
9
**P < 0.01*P < 0.05
0
500
1000
1500
2000
2500
3000
4hrs 8hrs 24hrs 48hrs 72hrs
Time (hrs)
(Fol
d C
hang
e ov
er C
ontr
ol)
1
IL-1β
mR
NA
2
3
4
5
6
7
8
9
0
500
1000
1500
2000
2500
3000
4hrs 8hrs 24hrs 48hrs 72hrs
Time (hrs)
(Fol
d C
hang
e ov
er C
ontr
ol)
12
3
4
IL-1β
mR
NA
5
6
7
8
9
**P < 0.01*P < 0.05
**
**
*
***
36

0
2
4
6
8
10
12
14
16
18
20
4hrs 8hrs 24hrs 48hrs 72hrs
Time (hrs)
IL-2
mR
NA
(F
old
Cha
nge
over
Con
trol
)1
2
3
4
5
6
7
8
9
*P < 0.05
*
0
2
4
6
8
10
12
14
16
18
20
4hrs 8hrs 24hrs 48hrs 72hrs
Time (hrs)
IL-2
mR
NA
(F
old
Cha
nge
over
Con
trol
)1
2
3
4
5
6
7
8
9
*P < 0.05
0
2
4
6
8
10
12
14
16
18
20
4hrs 8hrs 24hrs 48hrs 72hrs
Time (hrs)
IL-2
mR
NA
(F
old
Cha
nge
over
Con
trol
)1
2
3
4
5
6
7
8
9
0
2
4
6
8
10
12
14
16
18
20
4hrs 8hrs 24hrs 48hrs 72hrs
Time (hrs)
IL-2
mR
NA
(F
old
Cha
nge
over
Con
trol
)1
2
3
4
5
6
7
8
9
*P < 0.05
*
Figure 5. Temporal effect of β-hematin on IL-2 transcripts. PBMC were isolated from venous blood (70 mL) obtained from nine healthy, malaria-nave donors. Cultured PBMC (106 cells/mL) were stimulated with media alone or with β-hematin (10 μg/mL). RNA was isolated from harvested cells at 4, 8, 24, 48, and 72 hrs for IL-2 mRNA quantification by real-time RT-PCR. Results are expressed as fold change relative to unstimulated (baseline) conditions. Values shown are the means ± SEM of results from duplicate samples at each time point. Statistical significance was determined by paired t-tests. * denotes statistical significance of stimulated versus baseline conditions at P < 0.05. ** denotes statistical significance of stimulated versus baseline conditions at P < 0.01. 3.3.2.3 Temporal effect of β-hematin on IL-6 transcripts:
Relative to baseline conditions, mean IL-6 transcript production in cells
stimulated with a high dose of β-hematin was statistically significant at all time points
(Figure 6). IL-6 mRNA peaked in the majority of subjects at 24 hrs, reaching levels > 12
to 1300 times those measured in unstimulated cells. Fold change in IL-6 transcript
production increased significantly between 4 and 48 hrs (P = 0.008). β-hematin-induced
IL-6 mRNA production decreased in 8 of 9 donors by 72 hrs.
37
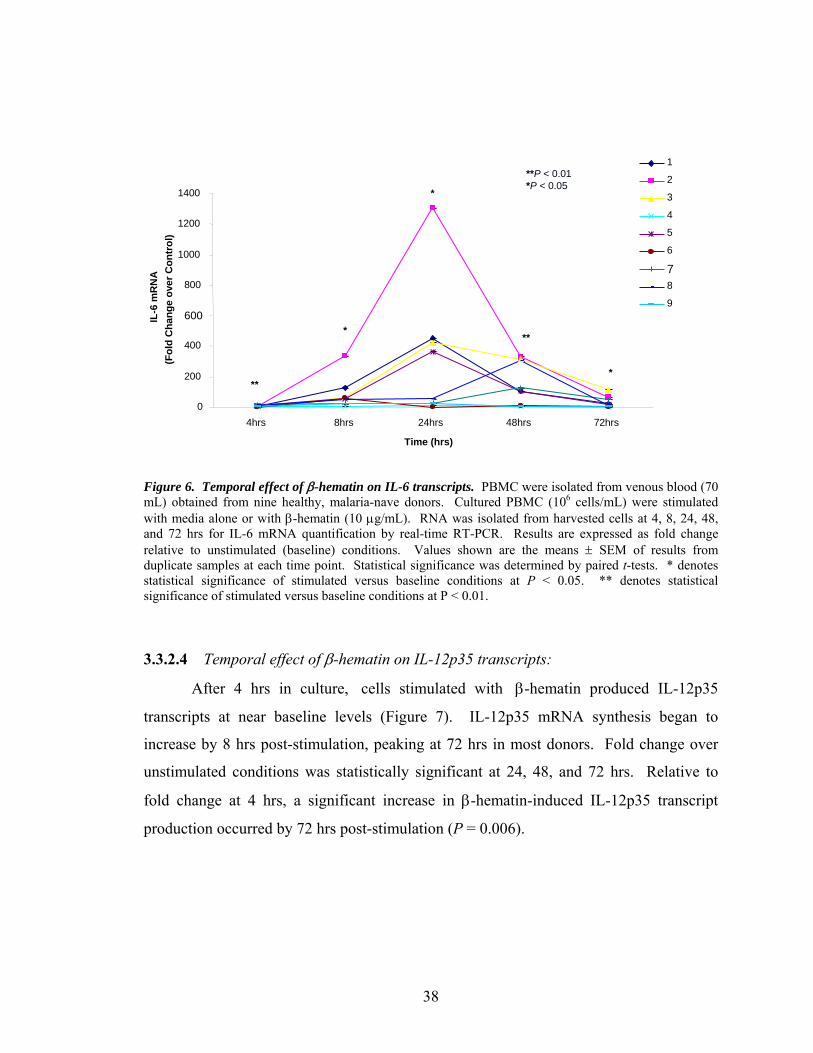
0
200
400
600
800
1000
1200
1400
4hrs 8hrs 24hrs 48hrs 72hrs
Time (hrs)
1
Figure 6. Temporal effect of β-hematin on IL-6 transcripts. PBMC were isolated from venous blood (70 mL) obtained from nine healthy, malaria-nave donors. Cultured PBMC (106 cells/mL) were stimulated with media alone or with β-hematin (10 μg/mL). RNA was isolated from harvested cells at 4, 8, 24, 48, and 72 hrs for IL-6 mRNA quantification by real-time RT-PCR. Results are expressed as fold change relative to unstimulated (baseline) conditions. Values shown are the means ± SEM of results from duplicate samples at each time point. Statistical significance was determined by paired t-tests. * denotes statistical significance of stimulated versus baseline conditions at P < 0.05. ** denotes statistical significance of stimulated versus baseline conditions at P < 0.01.
3.3.2.4 Temporal effect of β-hematin on IL-12p35 transcripts:
After 4 hrs in culture, cells stimulated with β-hematin produced IL-12p35
transcripts at near baseline levels (Figure 7). IL-12p35 mRNA synthesis began to
increase by 8 hrs post-stimulation, peaking at 72 hrs in most donors. Fold change over
unstimulated conditions was statistically significant at 24, 48, and 72 hrs. Relative to
fold change at 4 hrs, a significant increase in β-hematin-induced IL-12p35 transcript
production occurred by 72 hrs post-stimulation (P = 0.006).
IL-6
mR
NA
(Fol
d C
hang
e ov
er C
ontr
ol)
2
3
4
5
6
78
9
**P < 0.01*P < 0.05
**
*
*
**
*
1
0
200
400
600
800
1000
1200
1400
4hrs 8hrs 24hrs 48hrs 72hrs
Time (hrs)
A(F
old
Cha
nge
over
Con
trol
)IL
-6 m
RN
2
3
4
5
6
78
9
**P < 0.01*P < 0.05
**
*
*
**
1
0
200
400
600
800
1000
1200
1400
4hrs 8hrs 24hrs 48hrs 72hrs
Time (hrs)
A(F
old
Cha
nge
over
Con
trol
)IL
-6 m
RN
2
3
4
5
6
78
9
**P < 0.01*P < 0.05
**
*
*
1
0
200
400
600
800
1000
1200
1400
4hrs 8hrs 24hrs 48hrs 72hrs
Time (hrs)
A(F
old
Cha
nge
over
Con
trol
)IL
-6 m
RN
2
3
4
5
6
78
9
**P < 0.01*P < 0.05
**
*
1
0
200
400
600
800
1000
1200
1400
4hrs 8hrs 24hrs 48hrs 72hrs
Time (hrs)
A(F
old
Cha
nge
over
Con
trol
)IL
-6 m
RN
2
3
4
5
6
78
9
**P < 0.01*P < 0.05
**
1
0
200
400
600
800
1000
1200
1400
4hrs 8hrs 24hrs 48hrs 72hrs
Time (hrs)
A(F
old
Cha
nge
over
Con
trol
)IL
-6 m
RN
2
3
4
5
6
78
9
**P < 0.01*P < 0.05
1
0
200
400
600
800
1000
1200
1400
4hrs 8hrs 24hrs 48hrs 72hrs
Time (hrs)
A(F
old
Cha
nge
over
Con
trol
)IL
-6 m
RN
2
3
4
5
6
78
9
1
2
0
200
400
600
800
1000
1200
1400
4hrs 8hrs 24hrs 48hrs 72hrs
Time (hrs)
A(F
old
Cha
nge
over
Con
trol
)
3
4
5
6
7
IL-6
mR
N 8
9
**P < 0.01*P < 0.05
**
*
*
**
*
38

0
2
4
6
8
10
12
14
16
18
20
4hrs 8hrs 24hrs 48hrs 72hrs
Time (hrs)
IL-1
2p35
mR
NA
(F
old
Cha
nge
over
Con
trol
)1
2
3
4
5
6
7
8
9
**P < 0.01*P < 0.05
**
**
0
2
4
6
8
10
12
14
16
18
20
4hrs 8hrs 24hrs 48hrs 72hrs
Time (hrs)
IL-1
2p35
mR
NA
(F
old
Cha
nge
over
Con
trol
)1
2
3
4
5
6
7
8
9
**P < 0.01*P < 0.05
**
0
2
4
6
8
10
12
14
16
18
20
4hrs 8hrs 24hrs 48hrs 72hrs
Time (hrs)
IL-1
2p35
mR
NA
(F
old
Cha
nge
over
Con
trol
)1
2
3
4
5
6
7
8
9
**P < 0.01*P < 0.05
*
0
2
4
6
8
10
12
14
16
18
20
4hrs 8hrs 24hrs 48hrs 72hrs
Time (hrs)
IL-1
2p35
mR
NA
(F
old
Cha
nge
over
Con
trol
)1
2
3
4
5
6
7
8
9
**P < 0.01*P < 0.05
0
2
4
6
8
10
12
14
16
18
20
4hrs 8hrs 24hrs 48hrs 72hrs
Time (hrs)
IL-1
2p35
mR
NA
(F
old
Cha
nge
over
Con
trol
)1
2
3
4
5
6
7
8
9
0
2
4
6
8
10
12
14
16
18
20
4hrs 8hrs 24hrs 48hrs 72hrs
Time (hrs)
IL-1
2p35
mR
NA
(F
old
Cha
nge
over
Con
trol
)1
2
3
4
5
6
7
8
9
**P < 0.01*P < 0.05
**
**
Figure 7. Temporal effect of β-hematin on IL-12p35 transcripts. PBMC were isolated from venous blood (70 mL) obtained from nine healthy, malaria-nave donors. Cultured PBMC (106 cells/mL) were stimulated with media alone or with β-hematin (10 μg/mL). RNA was isolated from harvested cells at 4, 8, 24, 48, and 72 hrs for IL-12p35 mRNA quantification by real-time RT-PCR. Results are expressed as fold change relative to unstimulated (baseline) conditions. Values shown are the means ± SEM of results from duplicate samples at each time point. Statistical significance was determined by paired t-tests. * denotes statistical significance of stimulated versus baseline conditions at P < 0.05. ** denotes statistical significance of stimulated versus baseline conditions at P < 0.01. 3.3.2.5 Temporal effect of β-hematin on IL-12p40 transcripts:
In the presence of β-hematin, IL-12p40 mRNA was detectable in most subjects at
4 hrs (Figure 8). Peak IL-12p40 transcript production occurred at 24 hrs post-stimulation
in the majority of donors and varied markedly in magnitude (> 4- to 850-fold over
unstimulated cells). IL-12p40 mRNA decreased by 48 hrs and continued to decrease at
72 hrs in 8 of 9 subjects. Donor 7 IL-12p40 transcript production peaked at 4 hrs and
fluctuated over the course of 72 hrs. Mean fold change in IL-12p40 transcript production
under stimulated versus baseline conditions was statistically significant at all time points
(P < 0.05).
39

0
100
200
300
400
500
600
700
800
900
4hrs 8hrs 24hrs 48hrs 72hrs
Time (hrs)
IL-1
2p40
mR
NA
(F
old
Cha
nge
over
Con
trol
)
1
2
3
4
5
6
7
8
9
*P < 0.05
*
*
*
*
*
0
100
200
300
400
500
600
700
800
900
4hrs 8hrs 24hrs 48hrs 72hrs
Time (hrs)
IL-1
2p40
mR
NA
(F
old
Cha
nge
over
Con
trol
)
1
2
3
4
5
6
7
8
9
*P < 0.05
*
*
*
*
0
100
200
300
400
500
600
700
800
900
4hrs 8hrs 24hrs 48hrs 72hrs
Time (hrs)
IL-1
2p40
mR
NA
(F
old
Cha
nge
over
Con
trol
)
1
2
3
4
5
6
7
8
9
*P < 0.05
*
*
*
0
100
200
300
400
500
600
700
800
900
4hrs 8hrs 24hrs 48hrs 72hrs
Time (hrs)
IL-1
2p40
mR
NA
(F
old
Cha
nge
over
Con
trol
)
1
2
3
4
5
6
7
8
9
*P < 0.05
*
*
0
100
200
300
400
500
600
700
800
900
4hrs 8hrs 24hrs 48hrs 72hrs
Time (hrs)
IL-1
2p40
mR
NA
(F
old
Cha
nge
over
Con
trol
)
1
2
3
4
5
6
7
8
9
*P < 0.05
*
0
100
200
300
400
500
600
700
800
900
4hrs 8hrs 24hrs 48hrs 72hrs
Time (hrs)
IL-1
2p40
mR
NA
(F
old
Cha
nge
over
Con
trol
)
1
2
3
4
5
6
7
8
9
*P < 0.05
0
100
200
300
400
500
600
700
800
900
4hrs 8hrs 24hrs 48hrs 72hrs
Time (hrs)
IL-1
2p40
mR
NA
(F
old
Cha
nge
over
Con
trol
)
1
2
3
4
5
6
7
8
9
0
100
200
300
400
500
600
700
800
900
4hrs 8hrs 24hrs 48hrs 72hrs
Time (hrs)
IL-1
2p40
mR
NA
(F
old
Cha
nge
over
Con
trol
)
1
2
3
4
5
6
7
8
9
*P < 0.05
*
*
*
*
*
Figure 8. Temporal effect of β-hematin on IL-12p40 transcripts. PBMC were isolated from venous blood (70 mL) obtained from nine healthy, malaria-nave donors. Cultured PBMC (106 cells/mL) were stimulated with media alone or with β-hematin (10 μg/mL). RNA was isolated from harvested cells at 4, 8, 24, 48, and 72 hrs for IL-12p40 mRNA quantification by real-time RT-PCR. Results are expressed as fold change relative to unstimulated (baseline) conditions. Values shown are the means ± SEM of results from duplicate samples at each time point. Statistical significance was determined by paired t-tests. * denotes statistical significance of stimulated versus baseline conditions at P < 0.05. ** denotes statistical significance of stimulated versus baseline conditions at P < 0.01. 3.3.2.6 Temporal effect of β-hematin on IL-18 transcripts:
Fold change in β-hematin-induced IL-18 transcript production was statistically
significant (P < 0.05) at 4 hrs post-stimulation (Figure 9). Peak IL-18 mRNA production
was divided among donors between 4 and 8 hrs. Whereas peak transcript production
ranged from levels slightly above baseline to approximately 6-fold over control in most
subjects, donor 6 exhibited a > 57-fold change in IL-18 mRNA. With the exception of
one donor, IL-18 transcripts decreased by 24 hrs and were suppressed from this time
onward.
40

-10
0
10
20
30
40
50
60
4hrs 8hrs 24hrs 48hrs 72hrs
Time (hrs)
IL-1
8 m
RN
A(F
old
Cha
nge
over
Con
trol
)1
2
3
4
5
67
8
9
*P < 0.05
*
-10
0
10
20
30
40
50
60
4hrs 8hrs 24hrs 48hrs 72hrs
Time (hrs)
IL-1
8 m
RN
A(F
old
Cha
nge
over
Con
trol
)1
2
3
4
5
67
8
9
*P < 0.05
-10
0
10
20
30
40
50
60
4hrs 8hrs 24hrs 48hrs 72hrs
Time (hrs)
IL-1
8 m
RN
A(F
old
Cha
nge
over
Con
trol
)1
2
3
4
5
67
8
9
-10
0
10
20
30
40
50
60
4hrs 8hrs 24hrs 48hrs 72hrs
Time (hrs)
IL-1
8 m
RN
A(F
old
Cha
nge
over
Con
trol
)1
2
3
4
5
67
8
9
*P < 0.05
*
Figure 9. Temporal effect of β-hematin on IL-18 transcripts. PBMC were isolated from venous blood (70 mL) obtained from nine healthy, malaria-nave donors. Cultured PBMC (106 cells/mL) were stimulated with media alone or with β-hematin (10 μg/mL). RNA was isolated from harvested cells at 4, 8, 24, 48, and 72 hrs for IL-18 mRNA quantification by real-time RT-PCR. Results are expressed as fold change relative to unstimulated (baseline) conditions. Values shown are the means ± SEM of results from duplicate samples at each time point. Statistical significance was determined by paired t-tests. * denotes statistical significance of stimulated versus baseline conditions at P < 0.05. ** denotes statistical significance of stimulated versus baseline conditions at P < 0.01.
3.3.2.7 Temporal effect of β-hematin on IFN-α transcripts:
β-hematin-induced IFN-α mRNA was detectable near baseline levels at 4 hrs in
most subjects and fluctuated above and below baseline throughout the time course
(Figure 10). Peak transcript production was distributed among the five time points but
occurred at 48 hrs in the majority of donors (3). While most subjects showed a 2- to 13-
fold increase in IFN-α mRNA at peak transcript production, donor 9 exhibited a > 120-
fold increase in IFN-α mRNA. The difference in means between IFN-α transcript
production under stimulated versus baseline conditions was statistically significant at 48
hrs post-challenge (P < 0.05).
41

-15
5
25
45
65
85
105
125
4hrs 8hrs 24hrs 48hrs 72hrs
Time (hrs)
IFN
-αm
RN
A
(Fol
d C
hang
e ov
er C
ontr
ol)
1
2
3
4
5
6
7
8
9
*
*P < 0.05
-15
5
25
45
65
85
105
125
4hrs 8hrs 24hrs 48hrs 72hrs
Time (hrs)
IFN
-αm
RN
A
(Fol
d C
hang
e ov
er C
ontr
ol)
1
2
3
4
5
6
7
8
9
*
-15
5
25
45
65
85
105
125
4hrs 8hrs 24hrs 48hrs 72hrs
Time (hrs)
IFN
-αm
RN
A
(Fol
d C
hang
e ov
er C
ontr
ol)
1
2
3
4
5
6
7
8
9
-15
5
25
45
65
85
105
125
4hrs 8hrs 24hrs 48hrs 72hrs
Time (hrs)
IFN
-αm
RN
A
(Fol
d C
hang
e ov
er C
ontr
ol)
1
2
3
4
5
6
7
8
9
*
*P < 0.05 Figure 10. Temporal effect of β-hematin on IFN-α transcripts. PBMC were isolated from venous blood (70 mL) obtained from nine healthy, malaria-nave donors. Cultured PBMC (106 cells/mL) were stimulated with media alone or with β-hematin (10 μg/mL). RNA was isolated from harvested cells at 4, 8, 24, 48, and 72 hrs for IFN-α mRNA quantification by real-time RT-PCR. Results are expressed as fold change relative to unstimulated (baseline) conditions. Values shown are the means ± SEM of results from duplicate samples at each time point. Statistical significance was determined by paired t-tests. * denotes statistical significance of stimulated versus baseline conditions at P < 0.05. ** denotes statistical significance of stimulated versus baseline conditions at P < 0.01. 3.3.2.8 Temporal effect of β-hematin on IFN-γ transcripts:
β-hematin produced IFN-γ mRNA expression patterns that varied significantly
among donors (Figure 11). IFN-γ transcripts were detectable at 4hrs post-stimulation and
fluctuated over time. Peak transcript production occurred at 24 hrs in the majority of
subjects (3) but was observed at 4, 8, 48, and 72 hrs, as well. Peak levels of IFN-γ
mRNA ranged from 4 to 22 times those measured in unstimulated cells. Fold change in
IFN-γ mRNA was statistically significant at 4, 24, and 72 hrs.
42

-5
0
5
10
15
20
25
4hrs 8hrs 24hrs 48hrs 72hrs
Time (hrs)
IFN
-γm
RN
A
(Fol
d C
hang
e ov
er C
ontr
ol)
1
2
3
4
5
6
7
8
9
*
** **
**P < 0.01*P < 0.05
-5
0
5
10
15
20
25
4hrs 8hrs 24hrs 48hrs 72hrs
Time (hrs)
IFN
-γm
RN
A
(Fol
d C
hang
e ov
er C
ontr
ol)
1
2
3
4
5
6
7
8
9
*
** **
-5
0
5
10
15
20
25
4hrs 8hrs 24hrs 48hrs 72hrs
Time (hrs)
IFN
-γm
RN
A
(Fol
d C
hang
e ov
er C
ontr
ol)
1
2
3
4
5
6
7
8
9
*
**
-5
0
5
10
15
20
25
4hrs 8hrs 24hrs 48hrs 72hrs
Time (hrs)
IFN
-γm
RN
A
(Fol
d C
hang
e ov
er C
ontr
ol)
1
2
3
4
5
6
7
8
9
*
-5
0
5
10
15
20
25
4hrs 8hrs 24hrs 48hrs 72hrs
Time (hrs)
IFN
-γm
RN
A
(Fol
d C
hang
e ov
er C
ontr
ol)
1
2
3
4
5
6
7
8
9
-5
0
5
10
15
20
25
4hrs 8hrs 24hrs 48hrs 72hrs
Time (hrs)
IFN
-γm
RN
A
(Fol
d C
hang
e ov
er C
ontr
ol)
1
2
3
4
5
6
7
8
9
*
** **
**P < 0.01*P < 0.05
Figure 11. Temporal effect of β-hematin on IFN-γ transcripts. PBMC were isolated from venous blood (70 mL) obtained from nine healthy, malaria-nave donors. Cultured PBMC (106 cells/mL) were stimulated with media alone or with β-hematin (10 μg/mL). RNA was isolated from harvested cells at 4, 8, 24, 48, and 72 hrs for IFN-γ mRNA quantification by real-time RT-PCR. Results are expressed as fold change relative to unstimulated (baseline) conditions. Values shown are the means ± SEM of results from duplicate samples at each time point. Statistical significance was determined by paired t-tests. * denotes statistical significance of stimulated versus baseline conditions at P < 0.05. ** denotes statistical significance of stimulated versus baseline conditions at P < 0.01.
3.3.2.9 Temporal effect of β-hematin on TNF-α transcripts:
After 4 hrs in culture, cells stimulated with β-hematin produced a 3- to 10-fold
increase in TNF-α transcripts (Figure 12). In most subjects, mRNA expression continued
to increase at 8 hrs post-challenge, peaking at levels > 3- to 14-fold over baseline. TNF-
α mRNA decreased by 24hrs and peaked slightly at 48 hrs in 5 of 9 donors. By 72 hrs,
TNF-α transcripts had decreased to levels < 3-fold over baseline. Fold change in β-
hematin-induced TNF-α production was statistically significant at all time points (P <
0.01).
43

0
2
4
6
8
10
12
14
16
4hrs 8hrs 24hrs 48hrs 72hrs
Time (hrs)
TNF-α
mR
NA
(F
old
Cha
nge
over
Con
trol
)1
2
3
4
5
6
7
8
9
**
**
****
**
**P < 0.01
0
2
4
6
8
10
12
14
16
4hrs 8hrs 24hrs 48hrs 72hrs
Time (hrs)
TNF-α
mR
NA
(F
old
Cha
nge
over
Con
trol
)1
2
3
4
5
6
7
8
9
**
**
****
**
0
2
4
6
8
10
12
14
16
4hrs 8hrs 24hrs 48hrs 72hrs
Time (hrs)
TNF-α
mR
NA
(F
old
Cha
nge
over
Con
trol
)1
2
3
4
5
6
7
8
9
**
**
****
0
2
4
6
8
10
12
14
16
4hrs 8hrs 24hrs 48hrs 72hrs
Time (hrs)
TNF-α
mR
NA
(F
old
Cha
nge
over
Con
trol
)1
2
3
4
5
6
7
8
9
**
**
**
0
2
4
6
8
10
12
14
16
4hrs 8hrs 24hrs 48hrs 72hrs
Time (hrs)
TNF-α
mR
NA
(F
old
Cha
nge
over
Con
trol
)1
2
3
4
5
6
7
8
9
**
**
0
2
4
6
8
10
12
14
16
4hrs 8hrs 24hrs 48hrs 72hrs
Time (hrs)
TNF-α
mR
NA
(F
old
Cha
nge
over
Con
trol
)1
2
3
4
5
6
7
8
9
**
0
2
4
6
8
10
12
14
16
4hrs 8hrs 24hrs 48hrs 72hrs
Time (hrs)
TNF-α
mR
NA
(F
old
Cha
nge
over
Con
trol
)1
2
3
4
5
6
7
8
9
0
2
4
6
8
10
12
14
16
4hrs 8hrs 24hrs 48hrs 72hrs
Time (hrs)
TNF-α
mR
NA
(F
old
Cha
nge
over
Con
trol
)1
2
3
4
5
6
7
8
9
**
**
****
**
**P < 0.01
Figure 12. Temporal effect of β-hematin on TNF-α transcripts. PBMC were isolated from venous blood (70 mL) obtained from nine healthy, malaria-nave donors. Cultured PBMC (106 cells/mL) were stimulated with media alone or with β-hematin (10 μg/mL). RNA was isolated from harvested cells at 4, 8, 24, 48, and 72 hrs for TNF-α mRNA quantification by real-time RT-PCR. Results are expressed as fold change relative to unstimulated (baseline) conditions. Values shown are the means ± SEM of results from duplicate samples at each time point. Statistical significance was determined by paired t-tests. * denotes statistical significance of stimulated versus baseline conditions at P < 0.05. ** denotes statistical significance of stimulated versus baseline conditions at P < 0.01.
3.3.2.10 Temporal effect of β-hematin on LT-α transcripts:
At 4 hrs, β-hematin induced LT-α mRNA at levels slightly above baseline
(Figure 13). LT-α transcripts increased gradually over time, peaking in 7 of 9 donors at
72 hrs. Peak mRNA expression was measured at levels > 2 to 8 times those observed in
unstimulated cells. The difference in means between LT-α mRNA expression under
stimulated versus baseline conditions was statistically significant at all time points (P <
0.01). Relative to fold change at 4 hrs, fold change in LT-α mRNA increased
significantly at 48 (P = 0.007) and 72 hrs (P = 0.001).
44

0
1
2
3
4
5
6
7
8
9
10
4hrs 8hrs 24hrs 48hrs 72hrs
Time (hrs)
LT-α
mR
NA
(F
old
Cha
nge
over
Con
trol
)
1
2
3
4
5
6
7
8
9
**P < 0.01
**
**
**
**
**
0
1
2
3
4
5
6
7
8
9
10
4hrs 8hrs 24hrs 48hrs 72hrs
Time (hrs)
LT-α
mR
NA
(F
old
Cha
nge
over
Con
trol
)
1
2
3
4
5
6
7
8
9
**P < 0.01
**
**
**
**
0
1
2
3
4
5
6
7
8
9
10
4hrs 8hrs 24hrs 48hrs 72hrs
Time (hrs)
LT-α
mR
NA
(F
old
Cha
nge
over
Con
trol
)
1
2
3
4
5
6
7
8
9
**P < 0.01
**
**
**
0
1
2
3
4
5
6
7
8
9
10
4hrs 8hrs 24hrs 48hrs 72hrs
Time (hrs)
LT-α
mR
NA
(F
old
Cha
nge
over
Con
trol
)
1
2
3
4
5
6
7
8
9
**P < 0.01
**
**
0
1
2
3
4
5
6
7
8
9
10
4hrs 8hrs 24hrs 48hrs 72hrs
Time (hrs)
LT-α
mR
NA
(F
old
Cha
nge
over
Con
trol
)
1
2
3
4
5
6
7
8
9
**P < 0.01
**
0
1
2
3
4
5
6
7
8
9
10
4hrs 8hrs 24hrs 48hrs 72hrs
Time (hrs)
LT-α
mR
NA
(F
old
Cha
nge
over
Con
trol
)
1
2
3
4
5
6
7
8
9
**P < 0.01
0
1
2
3
4
5
6
7
8
9
10
4hrs 8hrs 24hrs 48hrs 72hrs
Time (hrs)
LT-α
mR
NA
(F
old
Cha
nge
over
Con
trol
)
1
2
3
4
5
6
7
8
9
0
1
2
3
4
5
6
7
8
9
10
4hrs 8hrs 24hrs 48hrs 72hrs
Time (hrs)
LT-α
mR
NA
(F
old
Cha
nge
over
Con
trol
)
1
2
3
4
5
6
7
8
9
**P < 0.01
**
**
**
**
**
Figure 13. Temporal effect of β-hematin on LT-α transcripts. PBMC were isolated from venous blood (70 mL) obtained from nine healthy, malaria-nave donors. Cultured PBMC (106 cells/mL) were stimulated with media alone or with β-hematin (10 μg/mL). RNA was isolated from harvested cells at 4, 8, 24, 48, and 72 hrs for LT-α mRNA quantification by real-time RT-PCR. Results are expressed as fold change relative to unstimulated (baseline) conditions. Values shown are the means ± SEM of results from duplicate samples at each time point. Statistical significance was determined by paired t-tests. * denotes statistical significance of stimulated versus baseline conditions at P < 0.05. ** denotes statistical significance of stimulated versus baseline conditions at P < 0.01.
(70 mL) obtained from nine healthy, malaria-nave donors. Cultured PBMC (10
6 cells/mL) were stimulated with media alone or with β-hematin (10 μg/mL). RNA was isolated from harvested cells at 4, 8, 24, 48, and 72 hrs for LT-α mRNA quantification by real-time RT-PCR. Results are expressed as fold change relative to unstimulated (baseline) conditions. Values shown are the means ± SEM of results from duplicate samples at each time point. Statistical significance was determined by paired t-tests. * denotes statistical significance of stimulated versus baseline conditions at P < 0.05. ** denotes statistical significance of stimulated versus baseline conditions at P < 0.01.
3.3.2.11 Temporal effect of β-hematin on NOS-2A transcripts: 3.3.2.11 Temporal effect of β-hematin on NOS-2A transcripts:
Patterns of NOS-2A transcript production varied temporally and in magnitude
among donors (Figure 14). In response to β-hematin, NOS-2A mRNA fluctuated
throughout the time course, peaking at levels > 3- to 17-fold over baseline. Peak
transcript production was divided among the majority of subjects between 24 and 48 hrs.
The difference in means between transcript production under stimulated versus control
conditions was statistically significant at 24, 48, and 72 hrs post-stimulation. Fold
change in NOS-2A mRNA expression increased significantly between 4 and 72 hrs (P =
0.006).
45

-2
0
2
4
6
8
10
12
14
16
18
20
4hrs 8hrs 24hrs 48hrs 72hrs
Time (hrs)
NO
S-2A
mR
NA
(F
old
Cha
nge
over
Con
trol
)
1
2
3
4
5
6
7
8
9*
*
**
**P < 0.01*P < 0.05
-2
0
2
4
6
8
10
12
14
16
18
20
4hrs 8hrs 24hrs 48hrs 72hrs
Time (hrs)
NO
S-2A
mR
NA
(F
old
Cha
nge
over
Con
trol
)
1
2
3
4
5
6
7
8
9*
*
**
-2
0
2
4
6
8
10
12
14
16
18
20
4hrs 8hrs 24hrs 48hrs 72hrs
Time (hrs)
NO
S-2A
mR
NA
(F
old
Cha
nge
over
Con
trol
)
1
2
3
4
5
6
7
8
9*
*
-2
0
2
4
6
8
10
12
14
16
18
20
4hrs 8hrs 24hrs 48hrs 72hrs
Time (hrs)
NO
S-2A
mR
NA
(F
old
Cha
nge
over
Con
trol
)
1
2
3
4
5
6
7
8
9*
-2
0
2
4
6
8
10
12
14
16
18
20
4hrs 8hrs 24hrs 48hrs 72hrs
Time (hrs)
NO
S-2A
mR
NA
(F
old
Cha
nge
over
Con
trol
)
1
2
3
4
5
6
7
8
9
-2
0
2
4
6
8
10
12
14
16
18
20
4hrs 8hrs 24hrs 48hrs 72hrs
Time (hrs)
NO
S-2A
mR
NA
(F
old
Cha
nge
over
Con
trol
)
1
2
3
4
5
6
7
8
9*
*
**
**P < 0.01*P < 0.05
Figure 14. Temporal effect of β-hematin on NOS-2A transcripts. PBMC were isolated from venous blood (70 mL) obtained from nine healthy, malaria-nave donors. Cultured PBMC (106 cells/mL) were stimulated with media alone or with β-hematin (10 μg/mL). RNA was isolated from harvested cells at 4, 8, 24, 48, and 72 hrs for NOS-2A mRNA quantification by real-time RT-PCR. Results are expressed as fold change relative to unstimulated (baseline) conditions. Values shown are the means ± SEM of results from duplicate samples at each time point. Statistical significance was determined by paired t-tests. * denotes statistical significance of stimulated versus baseline conditions at P < 0.05. ** denotes statistical significance of stimulated versus baseline conditions at P < 0.01.
3.3.2.12 Temporal effect of β-hematin on COX-1 transcripts:
In the presence of β-hematin, COX-1 transcripts were produced slightly above or
below baseline levels throughout the 72 hr-time course (Figure 15). Peak transcript
production was detected in 6 of 9 subjects at 4 hrs post-stimulation, at which time fold
change over control conditions was statistically significant (P < 0.01). With the
exception of one donor, fold change in COX-1 mRNA did not exceed 2 times that
observed in unstimulated cells.
46

Figure 15. Temporal effect of β-hematin on COX-1 transcripts. PBMC were isolated from venous blood (70 mL) obtained from three healthy, malaria-naïve donors. Cultured PBMC (106 cells/mL) were stimulated with media alone or with β-hematin (10 μg/mL). RNA was isolated from harvested cells at 4, 8, 24, 48, and 72 hrs for COX-1 mRNA quantification by real-time RT-PCR. Results are expressed as fold change relative to unstimulated (baseline) conditions. Values shown are the means ± SEM of results from duplicate samples at each time point. Statistical significance was determined by paired t-tests. * denotes statistical significance of stimulated versus baseline conditions at P < 0.05. ** denotes statistical significance of stimulated versus baseline conditions at P < 0.01.
(70 mL) obtained from three healthy, malaria-naïve donors. Cultured PBMC (10
-1
0
1
2
3
4
5
4hrs 8hrs 24hrs 48hrs 72hrs
Time (hrs)
CO
X-1
mR
NA
(Fol
d C
hang
e ov
er C
ontr
ol)
1
23
4
5
6
7
8
9**
**P < 0.01
-1
0
1
2
3
4
5
4hrs 8hrs 24hrs 48hrs 72hrs
Time (hrs)
CO
X-1
mR
NA
(Fol
d C
hang
e ov
er C
ontr
ol)
1
23
4
5
6
7
8
9**
-1
0
1
2
3
4
5
4hrs 8hrs 24hrs 48hrs 72hrs
Time (hrs)
CO
X-1
mR
NA
(Fol
d C
hang
e ov
er C
ontr
ol)
1
23
4
5
6
7
8
9
-1
0
1
2
3
4
5
4hrs 8hrs 24hrs 48hrs 72hrs
Time (hrs)
CO
X-1
mR
NA
(Fol
d C
hang
e ov
er C
ontr
ol)
1
23
4
5
6
7
8
9**
**P < 0.01
6 cells/mL) were stimulated with media alone or with β-hematin (10 μg/mL). RNA was isolated from harvested cells at 4, 8, 24, 48, and 72 hrs for COX-1 mRNA quantification by real-time RT-PCR. Results are expressed as fold change relative to unstimulated (baseline) conditions. Values shown are the means ± SEM of results from duplicate samples at each time point. Statistical significance was determined by paired t-tests. * denotes statistical significance of stimulated versus baseline conditions at P < 0.05. ** denotes statistical significance of stimulated versus baseline conditions at P < 0.01.
3.3.2.13 Temporal effect of β-hematin on COX-2 transcripts: 3.3.2.13 Temporal effect of β-hematin on COX-2 transcripts:
COX-2 mRNA expression was detectable at 4 hrs post-stimulation,
progressively increasing at 8 and 24 hrs (Figure 16). Transcript production peaked in the
majority of subjects at 24 hrs, reaching levels from > 17- to 180-fold over those observed
under unstimulated conditions. β-hematin induced a progressive decrease in COX-2
transcripts at 48 and 72 hrs in these individuals. The difference in means between COX-
2 mRNA expression under stimulated versus baseline conditions was statistically
significant at all time points. Relative to the 4-hr time point, fold change in COX-2
transcript production was significantly elevated at 8 (P < 0.0001) and 48 hrs (P = 0.003).
47

0
20
40
60
80
100
120
140
160
180
200
4hrs 8hrs 24hrs 48hrs 72hrs
Time (hrs)
CO
X-2
mR
NA
(Fol
d C
hang
e ov
er C
ontr
ol)
1
2
3
4
5
6
7
8
9
**
**
*
**
*
**P < 0.01*P < 0.05
0
20
40
60
80
100
120
140
160
180
200
4hrs 8hrs 24hrs 48hrs 72hrs
Time (hrs)
CO
X-2
mR
NA
(Fol
d C
hang
e ov
er C
ontr
ol)
1
2
3
4
5
6
7
8
9
**
**
*
**
*
0
20
40
60
80
100
120
140
160
180
200
4hrs 8hrs 24hrs 48hrs 72hrs
Time (hrs)
CO
X-2
mR
NA
(Fol
d C
hang
e ov
er C
ontr
ol)
1
2
3
4
5
6
7
8
9
**
**
*
**
0
20
40
60
80
100
120
140
160
180
200
4hrs 8hrs 24hrs 48hrs 72hrs
Time (hrs)
CO
X-2
mR
NA
(Fol
d C
hang
e ov
er C
ontr
ol)
1
2
3
4
5
6
7
8
9
**
**
*
0
20
40
60
80
100
120
140
160
180
200
4hrs 8hrs 24hrs 48hrs 72hrs
Time (hrs)
CO
X-2
mR
NA
(Fol
d C
hang
e ov
er C
ontr
ol)
1
2
3
4
5
6
7
8
9
**
**
0
20
40
60
80
100
120
140
160
180
200
4hrs 8hrs 24hrs 48hrs 72hrs
Time (hrs)
CO
X-2
mR
NA
(Fol
d C
hang
e ov
er C
ontr
ol)
1
2
3
4
5
6
7
8
9
**
0
20
40
60
80
100
120
140
160
180
200
4hrs 8hrs 24hrs 48hrs 72hrs
Time (hrs)
CO
X-2
mR
NA
(Fol
d C
hang
e ov
er C
ontr
ol)
1
2
3
4
5
6
7
8
9
0
20
40
60
80
100
120
140
160
180
200
4hrs 8hrs 24hrs 48hrs 72hrs
Time (hrs)
CO
X-2
mR
NA
(Fol
d C
hang
e ov
er C
ontr
ol)
1
2
3
4
5
6
7
8
9
**
**
*
**
*
**P < 0.01*P < 0.05
Figure 16. Temporal effect of β-hematin on COX-2 transcripts. PBMC were isolated from venous blood (70 mL) obtained from three healthy, malaria-naïve donors. Cultured PBMC (106 cells/mL) were stimulated with media alone or with β-hematin (10 μg/mL). RNA was isolated from harvested cells at 4, 8, 24, 48, and 72 hrs for COX-2 mRNA quantification by real-time RT-PCR. Results are expressed as fold change relative to unstimulated (baseline) conditions. Values shown are the means ± SEM of results from duplicate samples at each time point. Statistical significance was determined by paired t-tests. * denotes statistical significance of stimulated versus baseline conditions at P < 0.05. ** denotes statistical significance of stimulated versus baseline conditions at P < 0.01. 3.3.3 Anti-inflammatory mediator production 3.3.3.1 Temporal effect of β-hematin on IL-4 transcripts:
β-hematin induced patterns of IL-4 mRNA expression that varied markedly
among donors (Figure 17). At 4 hrs, IL-4 transcripts were detectable at levels near
baseline. IL-4 mRNA levels began to peak at 8 hrs post-stimulation and fluctuated over
time. β-hematin produced a 3- to 26-fold increase in IL-4 mRNA at 72 hrs, at which time
the majority of donors exhibited peak transcript production. IL-4 fold change over
control was statistically significant at 4, 48, and 72 hrs post-stimulation.
48

-5
0
5
10
15
20
25
30
35
40
4hrs 8hrs 24hrs 48hrs 72hrs
Time (hrs)
IL-4
mR
NA
(Fol
d C
hang
e ov
er C
ontr
ol)
1
2
3
4
5
6
7
8
9
*
*
**
**P < 0.01*P < 0.05
-5
0
5
10
15
20
25
30
35
40
4hrs 8hrs 24hrs 48hrs 72hrs
Time (hrs)
IL-4
mR
NA
(Fol
d C
hang
e ov
er C
ontr
ol)
1
2
3
4
5
6
7
8
9
*
*
**
-5
0
5
10
15
20
25
30
35
40
4hrs 8hrs 24hrs 48hrs 72hrs
Time (hrs)
IL-4
mR
NA
(Fol
d C
hang
e ov
er C
ontr
ol)
1
2
3
4
5
6
7
8
9
*
*
-5
0
5
10
15
20
25
30
35
40
4hrs 8hrs 24hrs 48hrs 72hrs
Time (hrs)
IL-4
mR
NA
(Fol
d C
hang
e ov
er C
ontr
ol)
1
2
3
4
5
6
7
8
9
*
-5
0
5
10
15
20
25
30
35
40
4hrs 8hrs 24hrs 48hrs 72hrs
Time (hrs)
IL-4
mR
NA
(Fol
d C
hang
e ov
er C
ontr
ol)
1
2
3
4
5
6
7
8
9
-5
0
5
10
15
20
25
30
35
40
4hrs 8hrs 24hrs 48hrs 72hrs
Time (hrs)
IL-4
mR
NA
(Fol
d C
hang
e ov
er C
ontr
ol)
1
2
3
4
5
6
7
8
9
*
*
**
**P < 0.01*P < 0.05
Figure 17. Temporal effect of β-hematin on IL-4 transcripts. PBMC were isolated from venous blood (70 mL) obtained from three healthy, malaria-naïve donors. Cultured PBMC (106 cells/mL) were stimulated with media alone or with β-hematin (10 μg/mL). RNA was isolated from harvested cells at 4, 8, 24, 48, and 72 hrs for IL-4 mRNA quantification by real-time RT-PCR. Results are expressed as fold change relative to unstimulated (baseline) conditions. Values shown are the means ± SEM of results from duplicate samples at each time point. Statistical significance was determined by paired t-tests. * denotes statistical significance of stimulated versus baseline conditions at P < 0.05. ** denotes statistical significance of stimulated versus baseline conditions at P < 0.01. 3.3.3.2 Temporal effect of β-hematin on IL-10 transcripts:
β-hematin-induced IL-10 mRNA was detectable at 4 hrs post-stimulation in most
subjects (Figure 18). 5 of 9 donors exhibited a decrease in IL-10 mRNA expression at
8hrs, while the remainder showed an increase in transcript production. Peak IL-10
transcript production occurred at 24 hrs, at levels ranging from near baseline to > 13-fold
over unstimulated cells. IL-10 mRNA synthesis decreased at 48 hrs in the majority of
donors, becoming suppressed by 72 hrs. Fold change in IL-10 mRNA expression was
statistically significant at 4, 24, and 48 hrs (P < 0.05).
49
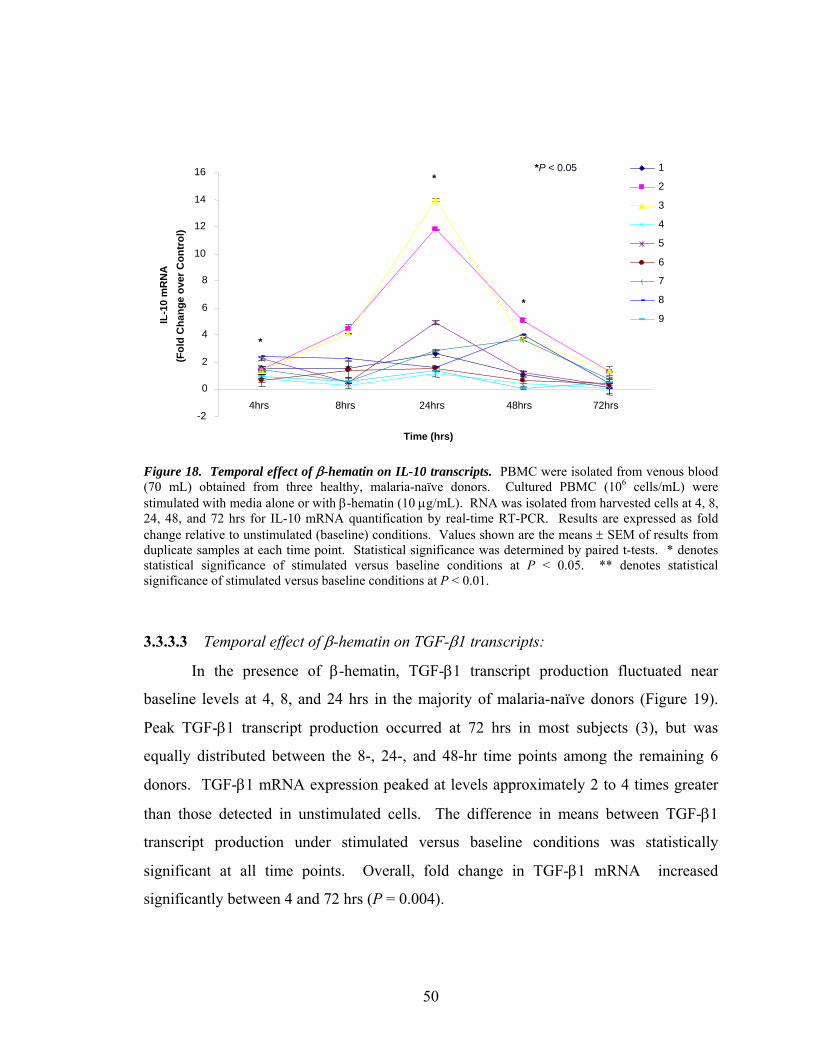
-2
0
2
4
6
8
10
12
14
16
4hrs 8hrs 24hrs 48hrs 72hrs
Time (hrs)
IL-1
0 m
RN
A(F
old
Cha
nge
over
Con
trol
)1
2
3
4
5
6
7
8
9
*
*
*
*P < 0.05
-2
0
2
4
6
8
10
12
14
16
4hrs 8hrs 24hrs 48hrs 72hrs
Time (hrs)
IL-1
0 m
RN
A(F
old
Cha
nge
over
Con
trol
)1
2
3
4
5
6
7
8
9
*
*
*
-2
0
2
4
6
8
10
12
14
16
4hrs 8hrs 24hrs 48hrs 72hrs
Time (hrs)
IL-1
0 m
RN
A(F
old
Cha
nge
over
Con
trol
)1
2
3
4
5
6
7
8
9
*
*
-2
0
2
4
6
8
10
12
14
16
4hrs 8hrs 24hrs 48hrs 72hrs
Time (hrs)
IL-1
0 m
RN
A(F
old
Cha
nge
over
Con
trol
)1
2
3
4
5
6
7
8
9
*
-2
0
2
4
6
8
10
12
14
16
4hrs 8hrs 24hrs 48hrs 72hrs
Time (hrs)
IL-1
0 m
RN
A(F
old
Cha
nge
over
Con
trol
)1
2
3
4
5
6
7
8
9
-2
0
2
4
6
8
10
12
14
16
4hrs 8hrs 24hrs 48hrs 72hrs
Time (hrs)
IL-1
0 m
RN
A(F
old
Cha
nge
over
Con
trol
)1
2
3
4
5
6
7
8
9
*
*
*
*P < 0.05
Figure 18. Temporal effect of β-hematin on IL-10 transcripts. PBMC were isolated from venous blood (70 mL) obtained from three healthy, malaria-naïve donors. Cultured PBMC (106 cells/mL) were stimulated with media alone or with β-hematin (10 μg/mL). RNA was isolated from harvested cells at 4, 8, 24, 48, and 72 hrs for IL-10 mRNA quantification by real-time RT-PCR. Results are expressed as fold change relative to unstimulated (baseline) conditions. Values shown are the means ± SEM of results from duplicate samples at each time point. Statistical significance was determined by paired t-tests. * denotes statistical significance of stimulated versus baseline conditions at P < 0.05. ** denotes statistical significance of stimulated versus baseline conditions at P < 0.01.
3.3.3.3 Temporal effect of β-hematin on TGF-β1 transcripts:
In the presence of β-hematin, TGF-β1 transcript production fluctuated near
baseline levels at 4, 8, and 24 hrs in the majority of malaria-naïve donors (Figure 19).
Peak TGF-β1 transcript production occurred at 72 hrs in most subjects (3), but was
equally distributed between the 8-, 24-, and 48-hr time points among the remaining 6
donors. TGF-β1 mRNA expression peaked at levels approximately 2 to 4 times greater
than those detected in unstimulated cells. The difference in means between TGF-β1
transcript production under stimulated versus baseline conditions was statistically
significant at all time points. Overall, fold change in TGF-β1 mRNA increased
significantly between 4 and 72 hrs (P = 0.004).
50

0
1
2
3
4
5
6
7
8
9
10
4hrs 8hrs 24hrs 48hrs 72hrs
Time (hrs)
TGF-β1
mR
NA
(Fol
d C
hang
e ov
er C
ontr
ol)
1
2
3
4
5
6
7
8
9
** *
***
**
**P < 0.01*P < 0.05
0
1
2
3
4
5
6
7
8
9
10
4hrs 8hrs 24hrs 48hrs 72hrs
Time (hrs)
TGF-β1
mR
NA
(Fol
d C
hang
e ov
er C
ontr
ol)
1
2
3
4
5
6
7
8
9
** *
***
**
0
1
2
3
4
5
6
7
8
9
10
4hrs 8hrs 24hrs 48hrs 72hrs
Time (hrs)
TGF-β1
mR
NA
(Fol
d C
hang
e ov
er C
ontr
ol)
1
2
3
4
5
6
7
8
9
** *
***
0
1
2
3
4
5
6
7
8
9
10
4hrs 8hrs 24hrs 48hrs 72hrs
Time (hrs)
TGF-β1
mR
NA
(Fol
d C
hang
e ov
er C
ontr
ol)
1
2
3
4
5
6
7
8
9
** *
*
0
1
2
3
4
5
6
7
8
9
10
4hrs 8hrs 24hrs 48hrs 72hrs
Time (hrs)
TGF-β1
mR
NA
(Fol
d C
hang
e ov
er C
ontr
ol)
1
2
3
4
5
6
7
8
9
** *
0
1
2
3
4
5
6
7
8
9
10
4hrs 8hrs 24hrs 48hrs 72hrs
Time (hrs)
TGF-β1
mR
NA
(Fol
d C
hang
e ov
er C
ontr
ol)
1
2
3
4
5
6
7
8
9
**
0
1
2
3
4
5
6
7
8
9
10
4hrs 8hrs 24hrs 48hrs 72hrs
Time (hrs)
TGF-β1
mR
NA
(Fol
d C
hang
e ov
er C
ontr
ol)
1
2
3
4
5
6
7
8
9
0
1
2
3
4
5
6
7
8
9
10
4hrs 8hrs 24hrs 48hrs 72hrs
Time (hrs)
TGF-β1
mR
NA
(Fol
d C
hang
e ov
er C
ontr
ol)
1
2
3
4
5
6
7
8
9
** *
***
**
**P < 0.01*P < 0.05
Figure 19. Temporal effect of β-hematin on TGF-β1 transcripts. PBMC were isolated from venous blood (70 mL) obtained from three healthy, malaria-naïve donors. Cultured PBMC (106 cells/mL) were stimulated with media alone or with β-hematin (10 μg/mL). RNA was isolated from harvested cells at 4, 8, 24, 48, and 72 hrs for TGF-β1 mRNA quantification by real-time RT-PCR. Results are expressed as fold change relative to unstimulated (baseline) conditions. Values shown are the means ± SEM of results from duplicate samples at each time point. Statistical significance was determined by paired t-tests. * denotes statistical significance of stimulated versus baseline conditions at P < 0.05. ** denotes statistical significance of stimulated versus baseline conditions at P < 0.01.
Overall, real time RT-PCR analyses revealed an early and predominantly pro-
inflammatory response to β-hematin that varied in magnitude among malaria-naïve
individuals. Temporal patterns of β-hematin-induced transcript production were similar
among individuals for IL-1β, IL-6, IL-12p40, IL-18, TNF-α, LT-α, COX-1, COX-2, IL-
4, and IL-10. IL-2, IL-12p35, IFN-α, IFN-γ, NOS-2A, and TGF-β1 mRNA expression
were more variable among donors. Although IL-10 was also induced, it did not suppress
pro-inflammatory mediator production within 72 hrs of β-hematin stimulation. TGF-β1
was expressed at near baseline levels in the majority of individuals and did not appear to
serve an immunoregulatory role. In addition, increases in IL-4 mRNA expression at 72
hrs post-stimulation may indicate a switch from a pro-inflammatory (Th1) to an anti-
inflammatory (Th2) immune response.
51

4.0 DISCUSSION
4.1 Effect of hemozoin on hematological outcomes in infants and children with
malarial anemia
One aim of this study was to examine the in vivo effects of hemozoin on
hematological indices, as a measure of the physiological dysregulatory processes that
lead to malarial anemia. Analyses of complete blood counts obtained from healthy
children, children with uncomplicated malaria, and children with mild, moderate, or
severe malarial anemia, revealed that several factors were significantly associated with
disease status (Table 1). Age was determined to be significantly different among clinical
groups, and those subjects in the SMA group were the youngest at enrollment. Mean
axillary temperature was significantly associated with clinical category, although further
analyses must be performed to determine whether temperature is predictive of disease
severity. However, previous studies in African children residing in areas of holoendemic
malaria transmission have demonstrated that while fever is associated with parasitemia, it
is not correlated with MA (Ong’echa et al., 2006; Smith et al., 1995).
Results of these analyses indicated that neither parasitemia nor the prevalence of
high-density parasitemia (HDP) were significantly different among clinical groups. This
finding is in agreement with previous studies showing that concurrent parasitemia levels
are not predictive of malaria disease severity in this region (McElroy et al., 2000;
Ong’echa et al., 2006). Multiple group comparisons of leukocyte, erythrocyte, and
platelet indices revealed that all of these factors differed significantly between HC, UM,
MlMA, MdMA, and SMA groups. Taken together, these findings are in support of the
hypothesis that ingestion of malarial pigment by mononuclear phagocytes creates
pathological changes in hematological parameters that contribute to malaria disease
severity.
52
Since MA is the most common clinical manifestation of hemozoin-induced
immune dysregulation among infants and young children in areas of holoendemic malaria
transmission (such as western Kenya), we sought to determine the relationship between
prevalence of pigment-containing monocytes in the blood of parasitemic children and
severity of anemia. Following stratification of study participants according to percent of
pigment-containing monocytes (0% PCM, ≤ 10% PCM, and > 10% PCM), hematological
parameters analyzed in Table 1 were compared across pigment categories. Age was not
significantly different between pigment categories, but mean axillary temperature was
still significantly different between groups. Although an association between parasitemia
and clinical category or between HDP and clinical category could not be found in
previous analyses (Table 1), both mean parasitemia and prevalence of HDP were
significantly associated with % PCM categories (Table 2). Interestingly, children in the >
10% PCM group had the highest mean parasitemia, whereas HDP was most prevalent in
the ≤ 10% PCM group. In addition to platelet indices, all leukocyte indices except
granulocyte count were significantly different between pigment categories. As when
compared across clinical categories, most erythrocytic factors differed significantly
between monocyte pigment categories. Mean corpuscular volume (MCV), mean
corpuscular hemoglobin (MCH), and mean corpuscular hemoglobin concentration
(MCHC) were not, however, significantly different between pigment groups. Consistent
with the hypothesis that pigment-induced phagocyte incapacitation leads to MA, mean
RBC counts, hematocrit, and Hb levels were lowest in the > 10% PCM category, and
proportion of subjects with SMA were highest. Taken together, these results suggest that
the dysregulatory processes involved in the development of MA are mediated, at least in
part, by the ingestion of hemozoin by peripheral blood monocytes.
4.2 Effect of hemozoin on inflammatory mediator production in infants and
children with malarial anemia
The second aim of this study was to determine whether innate inflammatory
mediator production in infants and children with varying degrees of malarial anemia is
related to disease severity and/or to percent of pigment-containing monocytes.
Specifically, differences between the plasma cytokine levels of children with
53

uncomplicated malaria (UM) and children with severe malarial anemia (SMA) were
examined to elucidate the potential involvement of these cytokines in the development of
uncomplicated versus severe disease.
Results detailed in Table 3 revealed that plasma levels of IFN-α, IL-4, IL-6, IL-
10, and IL-12p40/p70 were significantly different among HC, UM, MlMA, MdMA, and
SMA clinical categories. IFN-α has been shown to induce NOS-2 and NO production,
which are essential for an effective pro-inflammatory response to malaria parasites
(Sharara et al., 1997). Likewise, IL-12 production is inversely associated with risk of
severe malaria and positively associated with hemoglobin levels (implying protection
from MA) (Dodoo et al., 2002; Luty et al., 2000; Perkins et al., 2000). Equally important
is the role of IL-10 in regulating the production of pro-inflammatory cytokines that
contribute to malarial pathogenesis. Therefore, it is not surprising that plasma IFN-α,
IL-10, and IL-12p40/p70 levels would differ among individuals with varying degrees of
disease severity. Due to its function in fever induction and acute phase protein secretion,
IL-6 might also be expected to play a central role in the early pro-inflammatory response
that determines protection against malaria, and therefore, to differ among disease
categories. Furthermore, since IL-4 enhances IL-12 production by amplifying
transcription of the genes encoding the IL-12p35 and p40 subunits (D’Andrea et al.,
1995; Marshall et al., 1997), it follows that plasma levels of IL-4 may differ between HC,
UM, MlMA, MdMA, and SMA groups if IL-12 levels were determined to be statistically
significant between these clinical groups. Differences in IL-4 levels may also reflect a
shift in the balance between Th1 and Th2 cells that has been shown to exist among
malaria-exposed individuals in P. falciparum-endemic areas (Elghazi et al., 1997). In
these individuals, increased ratios of IL-4/IFN-γ-producing cells facilitate production of
elevated plasma IgE, which is thought to be required for complete elimination of
parasitemia (Elghazi et al., 1997; Stevenson and Riley, 2004).
However, multiple group comparisons indicated that plasma levels of IFN-γ,
TNF-α, IL-1β, and IL-2 were not significantly different between clinical categories. It is
unexpected that plasma TNF-α, IL-1β and IFN-γ levels did not differ significantly
between clinical categories, since these cytokines mediate both protective and
pathological immune responses in malaria. For example, while TNF-α is required for an
54
effective pro-inflammatory response, high levels of TNF promote development of severe
pathology and MA (Clark and Chaudri, 1988; Grau et al., 1989; Keller et al., 2006;
Kwiatkowski et al., 1990). Overproduction of IL-1β, which produces the same clinical
symptoms as TNF-α, has also been linked to malaria disease severity (Kwiatkowski et
al., 1990; Walsh et al., 1992). Furthermore, due to its ability to activate macrophages
and increase NO production, IFN-γ plays a central role in the early pro-inflammatory
response to malaria infection. As such, the ability to mount a rapid IFN-γ response has
been linked to a more favorable clinical outcome in most animal models of malaria and in
humans (Deloron et al., 1991; Dodoo et al., 2002; Jacobs et al., 1996; Luty et al., 1999;
Sedegah et al., 1994). IL-2, which is known to induce TNF-α, might also be expected to
differ between HC, UM, MlMA, MdMA, and SMA clinical categories. However, data
presented here suggest that IL-2 may not be as essential in the early pro-inflammatory
response.
Pairwise comparisons of plasma IFN-α, IL-4, IL-6, IL-10, and IL-12p40/p70
levels in the UM and SMA groups were performed, since differences in levels of these
cytokines were found to be statistically significant between the five clinical groups.
Statistical analyses demonstrated that levels of none of these inflammatory mediators
were significantly different between children with uncomplicated malaria and children
with severe malarial anemia (Table 3). This finding suggests that although plasma IFN-
α, IL-4, IL-6, IL-10, and IL-12p40/p70 differ significantly between healthy children and
those with varying degrees of MA, the development of uncomplicated versus severe
disease is not necessarily mediated by these cytokines. Further analyses are required to
clarify the specific involvement of these cytokines in the progression to MA.
Stratification of parasitemic study participants (UM, MlMA, MdMA, and SMA
groups; n = 155) according to percent of pigment-containing monocytes (%PCM) was
performed to determine whether plasma cytokine levels were altered by increased loading
of monocytes with hemozoin (Table 4). The presence of phagocyte pigment has been
used as a prognostic indicator of severe malaria infection and an alternative for diagnosis
(Phu et al., 1994). In a study by Day et al., 88% of patients treated for severe falciparum
malaria exhibited symptoms of the disease that persisted after parasite clearance but
before the clearance of intraphagocytic pigment (Day et al., 1996). Since the immune
55
dysregulation caused by monocytic ingestion of hemozoin is cytokine-mediated, one
would expect the degree of cytokine imbalance to be positively correlated with the
number of hemozoin-containing monocytes. Accordingly, one might expect that plasma
cytokine levels, which modulate such clinical symptoms of malaria as fever, rigors,
nausea, headache, and fatigue, would vary according to monocyte pigment content.
Multiple group comparisons revealed that statistical differences in plasma TNF-α
levels between 0% PCM, ≤ 10% PCM, and > 10% PCM categories were borderline
significant (P = .051), indicating that monocytic acquisition of hemozoin may impact
production of this inflammatory mediator. Children in the ≤ 10% PCM category
exhibited the highest levels (pg/mL) of TNF-α, whereas plasma TNF-α was lowest
among children in the 0% PCM group. TNF-α production was suppressed in the > 10%
PCM group (47.57 ± 5.28) relative to children with ≤ 10% PCM (61.42 ± 13.06),
although it was elevated relative to the 0% PCM group (39.92 ± 6.21). This trend
suggests that elevated production of TNF-α is required in early infection to limit
parasitemia but may become impaired as blood content of pigment-containing monocytes
surpasses 10%. As such, TNF-α production may be suppressed by increased loading of
monocytes with hemozoin.
Plasma levels of IFN-α, IFN-γ, IL-1β, IL-2, IL-4, IL-6, IL-10, and IL-12p40/p70
were not significantly different between 0% PCM, ≤ 10% PCM, and > 10% PCM
categories. Results presented here suggest that plasma levels of these cytokines are not a
function of the blood content of hemozoin-containing monocytes in parasitemic
individuals. However, it is important to note that murine and human dendritic cells
(DCs) can be activated by hemozoin (as well as synthetic hemozoin) through TLR-9
(toll-like receptor 9) and are capable of producing cytokines that influence both innate
and adaptive immune responses (Pichyangkul et al., 2004; Janeway, 2005). DCs produce
TNF-α, IL-1, IL-12, IL-6, IL-18, IFN-γ, and IFN-α (Janeway, 2005), but IFN-α is the
principal cytokine produced by plasmacytoid DCs in response to TLR-9 ligand (Hemmi
et al., 2000). Furthermore, whereas hemozoin has been shown to enhance human DC
maturation (Coban et al., 2002), P. falciparum-infected erythrocytes inhibit the
maturation of DCs (Urban et al., 1999). As such, the potential contribution of DCs to
cytokine dysregulation in malaria warrants further investigation.
56

4.3 Temporal effect of β-hematin on cytokine and effector molecule transcript
production in cultured human peripheral blood mononuclear cells
The final part of this study focused on determining the temporal kinetics of in
vitro cytokine and effector molecule mRNA expression in severe P. falciparum malaria.
PBMC isolated from healthy, malaria-naïve donors were stimulated with a
physiologically relevant dose of β-hematin in order to investigate its impact on de novo
inflammatory mediator production. Figure 20 depicts the temporal profile of peak
cytokine mRNA production among nine donors for those transcripts detected by real time
RT-PCR.
57

0
stimulation of PBMC with 10
μg/mL β-hematin
Time (hrs)
4 8 24 48
TNF-α IL-18
IL-12p40 IFN-γ IL-6 COX-2 IL-10 NOS-2A
IFN-α IL-1β IL-2 NOS-
TGF-β1 IL-4 IL-12p35 LT-α
2A
IL-18 COX-1
72
Figure 20. Temporal model of peak β-hematin-induced cytokine and effector molecule transcript production. PBMC were isolated from nine healthy, malaria-naïve donors. Cultured PBMC (106 cells/mL) were stimulated with media alone or with β-hematin (10 μg/mL). RNA was isolated from harvested cells at 4, 8, 24, 48, and 72 hrs for mRNA quantification by real-time RT-PCR. Peak mRNA production of cytokines/effector molecules listed occurred at the time points indicated. Peak IL-18 transcript production was divided among donors between 4 and 8 hrs. Peak NOS-2A mRNA expression was divided between 24 and 48 hrs. Pro-inflammatory cytokines are illustrated in red type, and anti-inflammatory cytokines are illustrated in blue type.
58

4.3.1 Effect of β-hematin on IL-1β transcripts:
β-hematin induced patterns of IL-1β transcript production that were temporally
similar but differed markedly in magnitude among donors (Figure 4). Peak IL-1β mRNA
expression occurred at 48 hrs in the majority of subjects, reaching levels > 300- to 2400-
fold over those measured under unstimulated conditions. Like TNF-α, IL-1 (produced in
α and β forms) is a pro-inflammatory cytokine that is released by murine macrophages
and by human monocytes, macrophages, and PBMC in response to malaria infection, and
has been shown to induce NO generation in vivo (Pichyangkul et al., 1994; Rockett et al.,
1992; Schofield et al., 1993; Wahlgren et al., 1995; Wood and Clark, 1984). Formerly
known as “endogenous pyrogen,” IL-1 (in its recombinant form) shares with recombinant
TNF the ability to generate fever, rigors, nausea, headache, and fatigue in human subjects
(Clark et al., 2004; Walsh et al., 1992). Furthermore, high serum levels of IL-1β have
been associated with the severity of P. falciparum malaria in West Africa (Kwiatkowski
et al., 1990). As such, results presented here are not surprising, since IL-1β would play
an equally important role in the early pro-inflammatory immune response to malaria
infection. The magnitude of the observed in vitro responses to a high dose of β-hematin
may mimic the high levels of IL-1β produced in severe falciparum malaria.
4.3.2 Effect of β-hematin on IL-2 transcripts:
IL-2 is synthesized by activated T cells and acts in an autocrine fashion to drive
their proliferation and differentiation into armed effector T cells (Janeway, 2005). Th1
cells secrete IL-2 to induce the proliferation of CD8 T cells. IL-2 also acts synergistically
with IL-12 to induce the proliferation of lymphokine-activated killer (LAK) cells and the
production of IFN-γ (Chan et al., 1991, 1992). However, the IL-2-induced proliferation
of NK and T cells can also be inhibited by IL-12 (Perussia et al., 1992). In murine
malaria, macrophages, B cells, and bone-marrow-derived dendritic cells (DCs) are
capable of processing and presenting malaria antigens to T cells and of promoting T cell
IFN-γ production, but these antigen presenting cells (APCs) have been shown to inhibit
the production of IL-2 by T cells (Luyendyk et al., 2002; Quin et al., 2001).
59

Furthermore, inhibition of IL-2 production may account for the inadequate responses to
unrelated antigens that have been observed during acute malaria (Greenwood et al., 1972;
McGregor and Barr, 1962).
Results presented here indicated a peak in IL-2 mRNA production at 24 to 48 hrs
post-stimulation with β-hematin (Figure 5). IL-2 transcripts increased approximately 2-
to 18-fold over control conditions at these time points. This pattern may represent the
induction of T cell proliferation in response to β-hematin, which would be characteristic
of the early Th1 type, cell-mediated response that is required for protective immunity to
malaria during natural infection.
4.3.3 Effect of β-hematin on IL-6 transcripts:
β-hematin-induced IL-6 mRNA expression patterns were temporally similar
among donors but differed in magnitude (Figure 6). IL-6 transcript production peaked at
24 hrs, showing a 12- to 1300-fold increase over unstimulated conditions. Levels of IL-6
mRNA detected were similar to levels of IL-1β induced by β-hematin (although IL-1β
transcript production peaked at 48 hrs post-stimulation). As IL-6 is also an endogenous
pyrogen and can be induced by TNF-α, LT-α, and IL-1β (Clark et al., 1992; Janeway,
2005) it may be expected that high levels of IL-6 mRNA would be produced during the
early phase of the immune response to β-hematin. The increase in TNF-α and IL-1β
transcript production that occurred in all donors prior to and at 24 hrs could have
contributed to the up-regulation of IL-6 mRNA expression observed at 24 hrs.
4.3.4 Effect of β-hematin on IL-12p35 and IL-12p40 transcripts:
As mentioned previously, protective immunity against malaria requires an early
Th1-type, pro-inflammatory response characterized by enhanced production of IL-12
(Crutcher et al., 1995; Mosmann and Coffman, 1989; Trinchieri, 1993), whereas IL-12
suppression increases susceptibility to severe malaria (Luty et al., 2000; Perkins et al.,
2000). The protective effects of IL-12 have been supported by data obtained from
prospective epidemiological studies in an area of holoendemic P. falciparum
transmission (Dodoo et al., 2002). These studies demonstrated that IL-12 production is
inversely associated with risk of clinical infection and positively associated with
60

hemoglobin concentration and TNF-α and IFN-γ production (Dodoo et al., 2002). This
positive association between IL-12 production and hemoglobin levels indicates a possible
role for IL-12 in protection from malarial anemia as well, a finding that has also been
supported by rodent studies (Dodoo et al., 2002; Mohan and Stevenson, 1998).
Biologically active IL-12 (IL-12p70) is a heterodimeric cytokine comprised of IL-
12p35 and IL-12p40 subunits that are encoded by separate genes (Kobayashi et al., 1989;
Trinchieri, 1998). IL-12p35 mRNA is present in numerous cell types, whereas IL-12p40
mRNA is restricted to cells that produce the bioactive heterodimer (D’Andrea et al.,
1992; Trinchieri, 2003). Transcription of both genes is induced following cell activation
by inflammatory stimuli, though fewer p35 transcripts are synthesized, even in activated
inflammatory cells (Ma and Trinchieri, 2001; Snidjers et al., 1996). Although IL-12p40
is produced in excess over IL-12p70, IL-12p35 is secreted only in association with the
p40 subunit (Kobayashi et al., 1989; Stern et al., 1990; Trinchieri, 2003; Wysocka et al.,
1995). IFN-γ and the anti-inflammatory cytokines IL-4 and IL-13 augment IL-12
production in various cells through enhancement of IL-12p35 and IL-12p40 gene
transcription (D’Andrea et al., 1995; Hayes et al., 1998; Ma et al., 1996). However,
unlike IFN-γ, IL-4 and IL-13 act by initially inhibiting transcription of the p40 gene in
activated cells, and later, by strongly enhancing it (D’Andrea et al., 1995). IL-10 is the
most effective suppressor of IL-12p40 gene transcription (Aste-Amezaga et al., 1998).
Results presented here indicate that individual IL-12p35 transcripts fluctuated
throughout the time course, but overall, showed a gradual increase to levels 2- to 9-fold
greater than those observed under unstimulated conditions by 72 hrs (Figure 7). An
approximate 5- to 850-fold increase in IL-12p40 mRNA expression was detected in the
majority of malaria-naïve donors at 24 hrs, after which β-hematin-induced IL-12p40
transcripts dramatically decreased (Figure 8). This is consistent with previous findings
that IL-12p40 mRNA is restricted to cells that produce biologically active, heterodimeric
IL-12 in response to an inflammatory event and not present in cultured PBMC from
healthy donors (D’Andrea et al., 1992; Keller et al., 2005; Ma and Trinchieri, 2001;
Trinchieri, 2003), and that physiological conditions simulating severe malaria (such as
exposure to a high dose of β-hematin) further down-regulate IL-12 production (Luty et
al., 2000). Taken together, these results suggest an early increase in β-hematin-induced
61

IL-12p40 expression that may have been subsequently suppressed/downregulated by IL-
10.
4.3.5 Effect of β-hematin on IL-18 transcripts:
Structurally related to IL-1β, IL-18 is a pro-inflammatory cytokine that is
produced by the same cell populations and under the same activation conditions as IL-12
(Bazan et al., 1996; Dinarello, 1999). IL-18 acts synergistically with IL-12 to up-
regulate IFN-γ production by macrophages, T cells and NK cells, and to enhance the
cytotoxic functions of NK and T cells (Hunter et al., 1997; Micallef et al., 1996;
Robinson et al., 1997). Alone, IL-18 is ineffective at inducing IFN-γ, does not induce a
Th1 type immune response, and may promote Th2 responses (Barbulescu et al., 1998;
Nakanishi et al., 2001; Walker et al., 2001). As in the case of IL-12, low levels of IL-18
have been associated with severe malarial pathology and anemia (Chaisavaneeyakorn et
al., 2003; Malaguarnera et al., 2002a, 2002b).
Results of this study show a temporal pattern of β-hematin-induced IL-18
transcript production similar to that observed with TNF-α (Figure 9). IL-18 mRNA
peaked at 4 to 8 hrs and became suppressed in most donors by 24 hrs. This pattern
suggests that IL-18 transcription may have been up-regulated concomitantly with IL-12
mRNA expression (which peaked at 8 and 24 hrs) for the induction of IFN-γ. Consistent
with this hypothesis, the majority of subjects exhibited a peak in IFN-γ transcript
production at 24 to 72 hrs post-stimulation.
4.3.6 Effect of β-hematin on IFN-α transcripts:
In addition to its anti-viral properties, IFN-α has been shown to induce increased
expression of human monocyte NOS activity, NOS-2 antigen and mRNA content, and
NO production, both in vitro and in vivo (Sharara et al., 1997). These findings have
important implications in malaria, since NOS activity and NO production serve protective
roles in infection by facilitating parasite clearance (Gyan et al., 1994; Kremsner et al.,
1992; Mellouk et al., 1994; Nussler et al., 1991; Rockett et al., 1991; Stevenson et al.,
1995). Furthermore, the ability to produce NO is a key factor in the development of mild
62

versus severe malaria (Anstey et al., 1996; Kremsner et al., 1996; Perkins et al., 1999).
Much like IL-12, IFN-α induces IFN-γ production and Th1 responses, yet is capable of
suppressing IL-12 (Cousens et al., 1999). IFN-α can also activate NK cells, which have
been shown to interact with parasitized erythrocytes and to play a role in the innate
immune response to blood-stage parasites (Artavanis-Tsakonas et al., 2002, 2003b).
Findings of this study indicate peaks in IFN-α mRNA expression throughout the
72-hr time course, but occurring at 48 hrs post-stimulation in the majority of donors
(Figure 10). β-hematin-induced IFN-α transcripts fluctuated above and below baseline
levels, peaking at levels 2- to 13-fold greater than those detected under unstimulated
conditions. Donor 9 showed a > 120-fold increase in IFN-α mRNA. Elevated IFN-α
transcript production (along with that of other pro-inflammatory cytokines) may have
contributed to corresponding peaks in NOS-2A mRNA exhibited by donors 1, 5, 6, 8, and
9. These results suggest that individuals differ in their abilities to produce IFN-α, and
that perhaps the role of IFN-α in protective immunity against malaria may not be as
essential as that of other cytokines. IFN-α is typically induced by viral infection or by
the recognition of double-stranded RNA (characteristic of many viruses) (Janeway,
2005), and since the molecular mechanisms that regulate IFN-α production in malaria are
unknown at present, the current findings warrant further investigation.
4.3.7 Effect of β-hematin on IFN-γ transcripts:
Production of IFN-γ by innate and adaptive immune cells plays a critical role in
the early pro-inflammatory response to malaria infection. IFN-γ synergizes with TNF-α
to optimize NO production, which facilitates parasite killing in both mice and humans
(Jacobs et al., 1996; Kremsner et al., 1995, 1996; Rockett et al., 1991). In humans, IFN-γ
production is correlated with protection from clinical attacks of malaria and with
resistance to reinfection with P. falciparum (Deloron et al., 1991; Dodoo et al., 2002;
Luty et al., 1999). Recent studies have shown that NK cells are the first producers of
IFN-γ following in vitro exposure of malaria-naïve PBMC to P. falciparum-infected
erythrocytes (Artavanis-Tsakonas and Riley, 2002). These NK cell-mediated IFN-γ
responses are IL-12-dependent, partially IL-18-dependent, and do not occur in all donors
63

(Artavanis-Tsakonas and Riley, 2002). Despite the use of β-hematin (instead of live
parasitized RBCs) to stimulate PBMC, results presented here support such heterogeneity
in the magnitude of IFN-γ responses between donors (Figure 11). β-hematin-induced
IFN-γ mRNA expression fluctuated throughout the time course and peaked at levels
approximately 4- to 21-fold over baseline conditions at 24 to 48 hrs in the majority of
individuals. However, peak transcript production was observed at each of the five time
points. This variation in timing and magnitude of IFN-γ responses may reflect
differences in each donor’s ability to mount a prompt pro-inflammatory response to
simulated infection. In addition, peak IFN-γ mRNA production corresponded to peak IL-
12p40 expression in 5 of 9 subjects (donors 3, 4, 6, 7, and 9), suggesting that increased
IL-12p40 production at these time points augmented IFN-γ gene expression.
4.3.8 Effect of β-hematin on TNF-α transcripts:
Patterns of TNF-α transcript production were consistent among donors, showing a
peak in TNF-α mRNA at 4 to 8 hrs post-stimulation that diminished by 72 hrs (Figure
12). It is possible that peaks in IL-10 transcript production at 24 hrs (Figure 18) may
have down-regulated TNF-α gene expression between 24 and 72 hrs. Consistent with
experiments in cultured monocytes (Pichyangkul et al., 1994; Keller et al., 2006), these
results demonstrate that malarial pigment augments TNF-α production. This ability to
mount a rapid pro-inflammatory response is required for protection against malaria in
both mice and humans, since TNF-α acts synergistically with IFN-γ to promote
phagocytosis of pRBCs and NO release by macrophages (Doolan and Good, 1999;
Kremsner et al., 1995, 1996; Dodoo et al., 2002). Consequently, TNF-α serves a
protective role by limiting parasitemia, but has the potential to produce severe pathology
and anemia at high levels that are characteristic of acute P. falciparum malaria (Clark and
Chaudri, 1988; Grau et al., 1989; Keller et al., 2006; Kwiatkowski et al., 1990).
4.3.9 Effect of β-hematin on LT-α transcripts:
Lymphotoxin-α (LT-α) is another pro-inflammatory cytokine that plays an
important role in both murine and human models of malaria and shares several functions
64

in common with TNF. Previously labeled TNF-β, LT (which is divided into α and β
categories) has the ability to up-regulate TNF expression and shares a receptor with TNF
(Owen-Schaub et al., 1989; Schoenfeld et al., 1991). Like TNF, LT increases cellular
adhesion to the endothelium through up-regulation of ICAM-1 and VCAM-1
(intercellular adhesion molecule 1 and vascular cell adhesion molecule 1, respectively)
and in its recombinant form, induces high levels of IL-6 and hypoglycemia in malaria-
primed mice (Clark et al., 1992; Husson et al., 2000). Similar to TNF and IL-1, LT can
be induced by the malaria toxin GPI (glycosylphosphatidylinositol) and has the ability to
induce NO production in vivo (Ferrante et al., 1990; Rockett et al., 1992; Tachado et al.,
1996). In addition, up-regulated LT has been identified as the primary mediator of
murine cerebral malaria, and a TNF promoter polymorphism that increases LT
transcription is associated with increased risk of cerebral malaria in African children
(Engwerda et al., 2002; Knight et al., 1999, 2003; McGuire et al., 1994). Results of this
study showed an overall increase in LT-α mRNA expression throughout the time course
(Figure 13). By 72 hrs, β-hematin produced a > 2- to 8-fold increase in LT-α transcripts,
consistent with an increasing pro-inflammatory response. Of interest, expression of LT-
α, which is also a product of B lymphocytes, peaked at the same time as expression of
IL-4, an activator of B cells.
4.3.10 Effect of β-hematin on NOS-2A transcripts:
In response to hemozoin, cells of the innate immune system produce pro-
inflammatory cytokines such as IL-12, IFN-γ, and TNF-α, which increase NO
production, and anti-inflammatory cytokines such as IL-10 and TGF-β, which down-
regulate NO synthesis (Oswald et al., 1994; Vodovotz et al., 1993). NO is formed from
arginine via the action of nitric oxide synthase (NOS) (Moncada and Higgs, 1993; Nathan
and Xie, 1994). The NOS family of enzymes includes two forms of NOS that are
constitutively expressed and activated by high levels of local calcium to maintain
biological homeostasis (Clark et al., 2004). Inducible nitric oxide synthase type 2 (NOS-
2, or iNOS) is another form of NOS that operates independently of local calcium
concentration to generate high levels of NO during an inflammatory event (Clark et al.,
2004; Nathan and Xie, 1994).
65

Several studies support the role of NO as molecular determinant that regulates
disease severity in malaria. For example, levels of NO metabolites in plasma and urine
and expression of NOS-2 in PBMC were shown to be inversely related to disease severity
in P. falciparum-infected Tanzanian children (Anstey et al., 1996). In a similar study,
plasma levels of NO metabolites in Gabonese adults and children were shown to increase
with disease severity and were related to accelerated parasite clearance and clinical cure
(Kremsner et al., 1996). Protection against severe malaria in this same population of
Gabonese children was later determined to be related to a promoter polymorphism in the
NOS-2 gene, which greatly enhanced NO production in response to inflammatory stimuli
(Kun et al., 1998, 2001). More recently, elevated NOS-2 activity and NO production
have been implicated in the pathogenesis of malarial anemia (Keller et al., 2004b).
Results of this study illustrate inter-individual variation in the ability to generate
NO following exposure to β-hematin (Figure 14). Peaks in NOS-2A transcript
production were detected at 24 to 48 hours post-stimulation in most donors, at levels 3 to
17 times those observed under unstimulated conditions. However, peaks in NOS-2A
mRNA synthesis also occurred as early as 8 hrs and as late as 72 hrs, which indicates that
genetic variation among individuals (such as promoter polymorphisms) may account for
their ability to mount a more rapid inflammatory response. In addition, timing of NOS-
2A transcript production may have been influenced by levels of both pro- and anti-
inflammatory cytokines being generated in these individuals. For example, elevated
levels of IL-12, TNF-α, IFN-α, or IFN-γ mRNA would have augmented NOS-2A
expression. Conversely, increased IL-10 transcript production could have down-
regulated NOS-2A gene expression through suppression of IL-12 or TNF-α. Likewise,
TGF-β1 may have elicited decreases in NOS-2A transcripts via inhibition of TNF-α or
IFN-γ mRNA synthesis.
4.3.11 Effect of β-hematin on COX-1 and COX-2 transcripts:
Cyclooxygenase-1 (COX-1) and cyclooxegenase-2 (COX-2) are enzymatic
mediators of prostaglandin synthesis (Appleton et al., 1996; Vane et al., 1998).
Prostaglandins (such as prostaglandin E2, PGE2) are effector molecules that regulate
macrophage function, cytokine production, fever, vascular permeability, and adhesion
66

molecule expression (Vane et al., 1998). COX-1, which is constitutively expressed in
numerous tissues, is involved in the generation of prostaglandins for homeostatic
purposes (Seibert and Masferrer, 1994). COX-2 is inducibly expressed for the generation
of high levels of prostaglandins in response to inflammatory stimuli (Seibert and
Masferrer, 1994). Previous studies in our lab have demonstrated that reduced plasma
levels of PGE2, reduced PBMC COX-2 gene expression, and increased plasma levels of
IL-10 are associated with enhanced severity of P. falciparum malaria (Perkins et al.,
2001). Although IL-10 can suppress COX-2 gene expression (Niiro et al., 1995),
subsequent investigations confirmed that the molecular mechanisms by which hemozoin-
induced suppression of COX-2 transcription and PGE2 production occur are independent
of increased IL-10 production (Keller et al., 2004a). Results of the present study indicate
a pattern of COX-2 mRNA expression that was temporally similar among malaria-naive
donors but varied in magnitude (Figure 16). β-hematin produced a peak in COX-2
transcripts at 24 hrs that ranged in magnitude from > 17- to 180-fold over baseline
conditions. Elevated levels of COX-2 transcripts at 24 hrs may have contributed to the
decrease in TNF-α and IL-12p40mRNA expression observed among donors at 24 and at
48 to 72 hrs, respectively, through increased PGE2 production. COX-2 mRNA
expression was subsequently downregulated at 48 to 72 hrs post-stimulation. The
temporal pattern of this pro-inflammatory response is similar to that observed in previous
studies in our lab, in which cultured PBMC were stimulated with hemozoin (Keller et al.,
2004a). COX-1 transcripts fluctuated slightly above or below baseline conditions
throughout the time course (Figure 15). This pattern is consistent with the homeostatic
role of COX-1 in prostaglandin synthesis, since COX-1 transcripts would not be expected
to increase in response to β-hematin.
4.3.12 Effect of β-hematin on IL-4 transcripts:
Similar to IL-10, IL-4 is an anti-inflammatory cytokine that polarizes the immune
response toward a Th2-type response by activating B lymphocytes to up-regulate the
production of malaria-specific antibodies (Luoni et al., 2001). Anti-malaria antibodies
function to block invasion of sporozoites into hepatocytes and invasion of merozoites into
erythrocytes, prevent binding of infected erythrocytes to the vascular endothelium and
67

subsequent sequestration, inhibit induction of the inflammatory cytokine cascade by
neutralizing parasite GPI, and prevent zygote development by mediating complement-
dependent lysis of gametes (Good, 2001; Good and Doolan, 1999; Schofield et al., 2002;
Sherman, 1998). During liver-stage and blood-stage malaria, activated NKT cells
respond rapidly to antigen-specific or polyclonal stimulation by producing high levels of
both IL-4 and IFN-γ, which modulate adaptive immunity and the polarization of Th cells
(Hansen et al., 2003; Roura-Mir and Moody, 2003; Schmieg et al., 2003; Sköld and
Behar, 2003). Winkler et al. have shown that IFN-γ, rather than IL-4, plays a
predominant role in parasite clearance during uncomplicated P. falciparium malaria
(Winkler et al., 1998). However, others believe that while innate immune mechanisms
may limit parasite density, adaptive immune mechanisms ultimately are required for
complete parasite elimination (Stevenson and Riley, 2004). In support of this notion,
other studies have demonstrated a shift in the balance between Th1 and Th2 cells in
malaria-primed individuals residing in P. falciparum-endemic areas (Elghazi et al.,
1997). Compared to malaria-naïve persons, these individuals have elevated anti-P.
falciparum plasma IgE levels, which correlate with an increased ratio of IL-4/IFN-γ-
producing cells (Elghazi et al., 1997). In another study, iron deficiency and high IL-4
mRNA expression levels in Kenyan children were associated with protection from
clinical malaria (Nyakeriga et al., 2005).
Results presented here show that patterns of IL-4 gene expression varied greatly
among malaria-naïve individuals (Figure 17). Detectable at near baseline levels at 4 hrs
post-stimulation, β-hematin-induced IL-4 transcripts fluctuated throughout the time
course, peaking at 72 hrs in the majority of donors. Overall, these findings suggest a
predominantly pro-inflammatory early immune response to β-hematin, and the absence
of an IL-4-induced anti-inflammatory (Th2) response within 3 days of stimulation. This
pattern might be expected in malaria-naïve donors lacking the high number of IL-4-
producing cells present in malaria-exposed individuals. Furthermore, β-hematin lacks the
parasite antigens present in live parasites and probably would not elicit an antibody-
mediated immune response. However, the 3- to 26-fold increase in IL-4 mRNA observed
at 72 hrs may be indicative of the switch to a Th2 immune response.
68

4.3.13 Effect of β-hematin on IL-10 transcripts:
Due to its anti-inflammatory properties, IL-10 serves an immunomodulatory role
in malaria infection by inhibiting the production of pro-inflammatory cytokines that may
cause pathology in the host. IL-10 limits TNF-α production, which can promote anemia
at high levels (Ho et al., 1995, 1998). Murine models of malaria and experiments in
cultured monocyte-derived macrophages have demonstrated that IL-10 negatively
regulates IL-12 production (Aste-Amezaga et al., 1998; Xu et al., 2001). Studies in our
lab have shown that children with malarial anemia and hyperparasitemia residing in an
area of hyperendemic P. falciparum transmission (Gabon) have decreased plasma levels
of IL-12 and increased levels of both TNF-α and IL-10 (Luty et al., 2000; Perkins et al.,
2000). More recent investigations in an area of holoendemic malaria transmission
(western Kenya) have confirmed that hemozoin-induced over-production of IL-10 is
responsible for suppression of IL-12 (Keller et al., manuscript submitted).
Results of this study indicate a peak in β-hematin-induced IL-10 transcript
production among malaria-naïve individuals at 24 hrs post-stimulation (Figure 18).
Though individual responses differed in magnitude, this increase in IL-10 mRNA
suggests an attempt at immunoregulation through down-regulation of pro-inflammatory
cytokine production (TNF-α, IL-12) and a switch to a Th2 type immune response. This
hypothesis is supported by the fact that a peak in IL-10 transcript production followed
surges in TNF-α mRNA at 4 to 8 hrs and in IL-12 mRNA from 4 to 24 hrs.
4.3.14 Effect of β-hematin on TGF-β1 transcripts:
Known for its immunoregulatory properties, TGF-β maintains the balance
between protection from and progression toward severe malaria by negatively regulating
both innate and adaptive immune responses (Perkins et al., 2000; Stevenson and Riley,
2004). Produced by macrophages, NK cells, T cells, and B cells, TGF-β possesses
concentration-dependent pro- and anti-inflammatory properties (Wahl, 1994). At low
concentrations, TGF-β has pro-inflammatory properties, whereas high levels of TGF-β
produce anti-inflammatory effects (Omer et al., 2000). Among its pro-inflammatory
properties is the ability to increase the expression of adhesion molecules that attract
69

immune cells to sites of inflammation (Omer et al., 2000). Anti-inflammatory functions
of TGF-β include the suppression of TNF and NO production from macrophages,
suppression of TNF and IFN-γ production from NK cells, and up-regulation of IL-10
(Omer et al., 2000). In addition, IL-10 may synergize with TGF-β to suppress IL-2, IL-4,
and IL-12 production, facilitating the shift from a Th1-type immune response to a Th2-
type response (Omer et al., 2000). However, unlike IL-10, TGF-β is also capable of
inhibiting IL-12 through destabilization of IL-12p40 mRNA (Du and Sriram, 1998).
Whereas TGF-β initially up-regulates cell-mediated Th1-type responses that control
parasitemia, it later suppresses these responses to reduce the pathological effects of
inflammation.
Of interest, one murine model of malaria infection has demonstrated that a surge
of TGF-β within the first two days of P. yoelii blood-stage infection inhibits early pro-
inflammatory cytokine responses to infection, thus leading to uncontrolled parasite
growth and death (Omer et al., 2003a). A more recent study illustrated the ability of
malaria parasites to activate latent, endogenous TGF-β to its bioactive form, thereby
modulating the host immune response (Omer et al., 2003b). In support of results
obtained from mouse models, human studies have shown an inverse relationship between
plasma levels of TGF-β and malaria disease severity (Chaiyaroj et al., 2004;
Malaguarnera et al., 2002a; Musumeci et al., 2003). Thus, favorable clinical outcomes to
infection depend not only on an appropriate balance between TGF-β and pro-
inflammatory cytokines such as IL-12 and IL-18, but also on the timing of TGF-β
induction in the host (Ndungu et al., 2005; Omer et al., 2003a).
Results presented here demonstrate that in the presence of β-hematin, TGF-β1
mRNA fluctuated at levels near and slightly above baseline conditions, increasing to
approximately 2- to 4-fold over control between 8 and 72 hrs (Figure 19). This pattern of
low-level TGF-β1 expression in the first 1 to 3 days post-stimulation would be consistent
with the desired pattern of TGF-β production during natural infection. At low
concentrations, TGF-β would have a protective pro-inflammatory effect (needed to
control parasitemia) and would not inhibit synthesis of other pro-inflammatory cytokines.
Variation in the timing of increased TGF-β1 transcript production among individuals
70

may represent each donor’s unique response to the β-hematin-induced increase in
synthesis of pro-inflammatory cytokines.
Taken together, results presented here illustrate that the temporal kinetics of β-
hematin-induced cytokine transcript production appear to be similar among individuals
for IL-1β, IL-6, IL-12p40, IL-18, TNF-α, LT-α, COX-1, COX-2, IL-4, and IL-10. IL-2,
IL-12p35, IFN-α, IFN-γ, NOS-2A, and TGF-β1 mRNA expression were more variable
among donors. In summary, these findings support well-established patterns of cytokine
production during malaria infection. Although the complex interplay between pro-
inflammatory and anti-inflammatory cytokines cannot be determined from the current
data, it appears that in malaria-naive donors, a physiologically relevant dose of malarial
pigment induces an early and robust pro-inflammatory immune response. As expected,
IL-10 was also induced, but seemed not to suppress pro-inflammatory cytokine transcript
production within 72 hrs of β-hematin stimulation. TGF-β1 mRNA was produced near
baseline levels throughout the time course, which suggests that it did not serve an
immunoregulatory role within the first 72 hrs of simulated infection. IL-4 transcripts
fluctuated at low levels but increased at 72 hrs post-stimulation, possibly indicating the
switch to a Th2 immune response. Importantly, the temporal sequence of cytokine
induction observed differs from the predicted model of innate immune responsiveness to
malaria (Figure 3), in which TNF-α is induced by IL-12 and IFN-γ. Results of the
present in vitro study indicate that peak β-hematin-induced TNF-α transcript production
precedes IL-12 and IFN-γ expression (Figure 20). In addition, data presented here reflect
heterogeneity in the magnitude of cytokine responses between individuals, perhaps due to
genetic polymorphisms.
71

5.0 CONCLUSIONS
In conclusion, results of this study confirm that malarial pigment modifies
hematological parameters, thereby promoting pathological changes that result in malarial
anemia and severe disease. The development of MA is mediated, at least in part, by the
phagocytosis of hemozoin by peripheral blood monocytes. Plasma levels of IFN-α, IL-4,
IL-6, IL-10, and IL-12p40/p70 were found to differ significantly between healthy
children, children with uncomplicated malaria, and children with mild, moderate or
severe MA, but not specifically between UM and SMA clinical groups. Such findings
imply that these cytokines do not necessarily mediate the development of uncomplicated
versus severe disease. Although they have been shown to play prominent protective and
pathogenic roles in malaria infection, plasma IFN-γ, TNF-α, IL-1β, and IL-2 were not
significantly different between clinical categories. Among parasitemic children, plasma
levels of neither IFN-α, IFN-γ, IL-1β, IL-2, IL-4, IL-6, IL-10, nor IL-12p40/p70 were
significantly associated with percent of pigment-containing monocytes. Differences in
plasma TNF-α between 0%, ≤ 10%, and > 10% PCM categories approached statistical
significance at P = .051. Ongoing studies in our laboratory are aimed at investigating the
relationship between monocytic acquisition of hemozoin and inflammatory mediator
production in the development of MA.
Based on further results of this study, temporal profiles of β-hematin-induced IL-
1β, IL-2, IL-6, IL-12p35, IL-12p40, IL-18, IFN-α, IFN-γ, TNF-α, LT-α, NOS-2A, COX-
1, COX-2, IL-4, IL-10, and TGF-β1 mRNA expression were established. Overall,
patterns of cytokine transcript production revealed an early pro-inflammatory response to
malarial pigment that varied in magnitude among malaria-naïve individuals. Additional
studies are required to address the role of genetic variation in shaping individual cytokine
responses to P. falciparum. Findings presented here are significant, in that inflammatory
mediators produced by innate immune cells shape the adaptive immune response to
72

Plasmodium parasites. A better understanding of the molecular mechanisms governing
these responses will facilitate the development of more effective vaccines and therapeutic
strategies.
73
BIBLIOGRAPHY
Anstey, N., et al. (1996). “Nitric oxide in Tanzanian children with malaria. Inverse
relationship between malaria severity and nitric oxide production/nitric oxide synthase type 2 expression.” J Exp Med 184: 557-567.
Anstey, N., D. Granger, and J. Weinberg (1999). “Nitric oxide in malaria.” In Fang, F. (Ed.) Nitric oxide and infection. Plenum Press, New York: 311-341.
Appleton, I., A. Tomlinson, and D. Willoughby (1996). “Induction of cyclooxygenase and nitric oxide synthase in inflammation.” Adv Pharmacol 35: 27-78.
Arese, P. and E. Schwarzer (1997). “Malarial pigment (haemozoin): a very active ‘inert’ substance.” Ann Trop Med Parasitol 91: 501-516.
Artavanis-Tsakonas, K. and E.M. Riley (2002). “Innate immune response to malaria: rapid induction of IFN-γ from human NK cells by live Plasmodium falciparum-infected erythrocytes.” J Immunol 169: 2956-2963.
Artavanis-Tsakonas, K., J.E. Tongren, and E.M. Riley (2003a). “The war between the malaria parasite and the immune system: immunity, immunoregulation and immunopathology.” Clin Exp Immunol 133: 145-152.
Artavanis-Tsakonas, K., et al. (2003b). “Activation of a subset of human NK cells upon contact with Plasmodium falciparum-infected erythrocytes.” J Immunol 171: 5396-5405.
Aste-Amezaga, M., X. Ma, A. Sartori, and G. Trinchieri (1998). “Molecular mechanisms of the induction of IL-12 and its inhibition by IL-10.” J Immunol 160: 5936-5944. Barbulescu, K. et al. (1998). “Il-12 and IL-18 differentially regulate the transcriptional
activityof the human IFN-γ promoterin primary CD4+ T lymphocytes.” J Immunol 160: 3642-3647.
Bazan, J.F., J.C. Timans, and R.A. Kastelein (1996). “A newly-defined interleukin-1?”
Nature 379: 591.
Bloland, P.B., et al. (1999). “Longitudinal cohort study of the epidemiology of malaria infections in an area of intense malaria transmission I. Description of study site, general methodology, and study population.” Am J Trop Med Hyg 60: 635-640.
74

Bohle, D.S., et al. (1994). “Structural and spectroscopic studies of β-hematin (the heme coordination polymer in malaria pigment).” Am Chem Soc Symp Ser 572: 497-515.
Bohle, D.S., R.E. Dinnebier, S.K. Madsen, and P.W. Stephens (1997). “Characterization of the products of the heme detoxification pathway in malarial late trophozoites by X-ray diffraction.” J Biol Chem 272: 713-716.
Breman, J.G., A. Egan, and G.T. Keusch (2001). “The intolerable burden of malaria: a new look at the numbers.” Am J Trop Med Hyg 64: iv-vii.
Bull, P.C., et al. (1998). “Parasite antigens on the infected red cell surface are targets for naturally acquired immunity to malaria.” Nat Med 4: 358-360.
Chaisavaneeyakorn, S., et al. (2003). “Relationship between plasma interleukin-12 (IL-12) and IL-18 levels and severe malarial anemia in an area of holoendemicity in western Kenya.” Clin Diag Lab Immunol 10(3): 362-266.
Chaiyaroj, S.C., et al. (2004). “Reduced levels of transforming growth factor-beta1, interleukin-12 and increased migration inhibitory factor are associated with severe malaria.” Acta Trop 89: 319-327.
Chan, S.H., et al. (1991). “Induction of interferon γ production by natural killer cell stimulatory factor: characterization of the responder cells and synergy with other inducers.” J Exp Med 173: 869.
Chan, S.H., M. Kobayashi, D. Santoli, B. Perussia, and G. Trinchieri (1992). “Mechanisms of IFN-γ induction by natural killer cell stimulatory factor (NKSF/IL-12): role of transcription and mRNA stability in the synergistic interaction between NKSF and IL-1.” J Immunol 148: 92.
Chomczynski, P. and N. Sacchi (1987). “Single-step method of RNA isolation by acid guanidinium thiocyanate-phenol-chloroform extraction.” Anal Biochem 162: 156-159.
Chong, C.R. and D.J. Sullivan, Jr. (2003). “Inhibition of heme crystal growth by antimalarials and other compounds: implications for drug discovery.” Biochem Pharmacol 66: 2201-2212.
Clark, I.A. and G. Chaudhri (1988). “Tumour necrosis factor may contribute to the anaemia of malaria by causing dyserythropoiesis and erythrophagocytosis.” Br J Haematol 70: 99-103.
Clark, I.A., et al. (1992). “Increased lymphotoxin in human malarial serum, and the ability of this cytokine to increase plasma interleukin-6 and cause hypoglaecemia in mice-implications for malarial pathology.” Trans R Soc Trop Med Hyg 86: 602-607.
75

Clark, I.A., L.M. Alleva, A.C. Mills, and W.B. Cowden (2004). “Pathogenesis of malaria and clinically similar conditions.” Clin Microbiol Rev 17(3): 509-539.
Clark, K.S. and T.G. Hippel (2002). “Routine testing in hematology.” In Rodak, B.F. (Ed.), Hematology: clinical principles and applications, 2nd Edn. W.B. Saunders Company, Philadelphia, PA: 153-170.
Coban, C., K.J. Ishii, D.J. Sullivan, and N. Kumar (2002). “Purified malaria pigment (hemozoin) enhances dendritic cell maturation and modulates the isotype of antibodies induced by a DNA vaccine.” Infec Immun 70: 3939-3943.
Cousens, L.P., et al. (1999). “Two roads diverged: interferon α/β-and-interleukin-12-mediated pathways in promoting T-cell interferon-γ responses during viral infection.” J Inf Med 189: 1315-1328.
Crutcher, J.M., M.M. Stevenson, M. Sedegah, and S.L. Hoffman (1995). “Interleukin-12 and malaria.” Res Immunol 146: 552-559.
D’Andrea, A., et al. (1992). “Production of natural killer cell stimulatory factor (interleukin 12) by peripheral blood mononuclear cells.” J Exp Med 176: 1387-1398.
D’Andrea, A., X. MA, M. Aste-Amezaga, C. Paganin, and G. Trinchieri (1995). “Stimulatory and inhibitory effects of interleukin (IL)-4 and IL-13 on the production of cytokines by human peripheral-blood mononuclear cells: priming for IL-12 and tumor-necrosis factor-α production.” J Exp Med 181: 537-546.
Day, N.P.J., et al. (1996). “Clearance kinetics of parasites and pigment-containing leukocytes in severe malaria.” Blood 88(12): 4694-4700.
Deloron, P., C. Chougnet, J.-P. Lepers, S. Tallet, and P. Coulanges (1991). “Protective value of elevated levels of γ interferon in serum against exoerythrocytic stages of Plasmodium falciparum.” J Clin Microbiol 29: 1757.
Devine, D.V. (1991). “The regulation of complement on cell surfaces.” Transfus Med Rev 5: 123-131.
Dinarello, C.A. (1999). “IL-18: a Th-1 inducing, proinflammatory cytokine and new member of the IL-1 family.”J Allergy Clin Immunol 103: 11-24.
Dodoo, D., et al. (2002). “Absolute levels and ratios of proinflammatory and anti-inflammatory cytokine production in vitro predict clinical immunity to Plasmodium falciparum malaria.” J Infect Dis 185: 971-979.
Dondorp, A.M., et al. (1999). “Red blood cell deformability as a predictor of anemia in severe falciparum malaria.” Am J Trop Med Hyg 60: 733-737.
76

Doolan, D.L. and M. Good (1999). “Immune effector mechanisms in malaria.” Curr Opin Immunol 11: 412-419.
Du, C. and S. Sriram (1998). “Mechanism of inhibition of LPS-induced IL-12p40 production by IL-10 and TGF-β in ANA-1 cells.” J Leukocyte Biol 64: 92-97.
Eckstein-Ludwig, U., et al. (2003). “Artemisinins target the SERCA of Plasmodium falciparum.” Nature 424: 957-961.
Egan, T.J., W.W. Mavuso, and K.K. Ncokazi (2001). “The mechanism of β-hematin formation in acetate solution. Parallels between hemozoin formation and biomineralization processes.” Biochemistry 40: 204-213.
Ekvall, H. (2003). “Malaria and anemia.” Curr Opin Hematol 10: 108-114.
Elghazali, G., H. Perlmann, A.S. Rutta, P. Permann, and M. Troye-Bloomberg (1997). “Elevated plasma levels of IgE in Plasmodium falciparum-primed individuals reflect an increased ratio of IL-4 to interferon-gamma (IFN-gamma)-producing cells.” Clin Exp Immunol 109(1): 84-89.
Engwerda, C.R., T.L. Mynott, S. Sawhney, J.B. de Souza, Q.D. Bickle, and P.M. Kaye (2002). “Locally up-regulated lymphotoxin alpha, not systemic tumor necrosis factor alpha, is the principal mediator of murine cerebral malaria.” J Exp Med 195: 1371-1377.
Ferrante, et al. (1990). “Production of tumor necrosis factors alpha and beta by human mononuclear leukocytes stimulated with mitogens, bacteria, and malarial parasites.” Infect Immun 58: 3996-4003.
Fitch, C.D. and P. Kanjananggulpan (1987). “The state of ferriprotoporphyrin IX in malaria pigment.” J Biol Chem 262: 15552-15555.
Goldie, P., E. Roth Jr., J. Oppenheim, J. Vanderberg (1990). “Biochemical characterization of Plasmodium falciparum hemozoin.” Am J Trop Med Hyg 43: 584-596.
Good, M.F., and D.L. Doolan (1999). “Immune effector mechanisms in malaria.” Curr Opin Immunol 11: 412-419.
Good, M.F. (2001). “Towards a blood-stage vaccine for malaria: are we following all the leads?” Nature Rev Immunol 1: 117-125.
Good, M.F. (2005). “Vaccine-induced immunity to malaria parasites and the need for novel strategies.” Trends Parasitol 21: 29-34.
Grau, G.E., et al. (1989). “Tumor necrosis factor and disease severity in children with falciparum malaria.” N Engl J Med 320: 1586-1591.
77
Greenwood, B.M., A.M. Bradley-Moore, A. Palit, and A.D.M. Bryceson (1972). “Immunosuppression in children with malaria.” Lancet 1: 169-172.
Greve, B., et al. (1999). “High oxygen radical production is associated with fast parasite clearance in children with Plasmodium falciparum malaria.” J Infect Dis 179: 1584-1586.
Griffiths, M.J., et al. (2001). “Oxidative stess and erythrocyte damage in Kenyan children with severe Plasmodium falciparum malaria.” Br J Haemotol 113: 486-491.
Gyan, B., M. Troye-Blomberg, P. Perlmann, and A. Bjorkman (1994). “Human monocytes cultured with and without interferon-gamma inhibit Plasmodium falciparum parasite growth in vitro via secretion of reactive nitrogen intermediates.” Parasite Immunol 16: 371-375.
Hansen, D., M. Siomos, L. Buckingham, A. Scalzo, L. Schofield (2003). “Regulation of murine cerebral malaria pathogenesis by CD1d-restricted NKT cells and the natural killer complex.” Immunity 18: 391-402.
Hayes, M.O., F.J. Murphy, and P.R. Burd (1998). “Interferon-γ-dependent inducible expression of the human interleukin-12 p35 gene in monocytes initiates from a TATA-containing promoter distinct from the CpG-rich promoter active in Epstein-Barr virus-transformed lymphoblastoid cells.” Blood 91: 4645-4651.
Hemmi, H., et al. (2000). “A toll-like receptor receognizes bacterial DNA.” Nature 408: 740.
Ho, M., M. Sexton, P. Tongtawe, S. Looareesuwan, P. Suntharasamai, and K. Webster (1995). “Interleukin-10 inhibits tumor necrosis factor production but not antigen-specific proliferation in acute Plasmodium falciparum malaria.” J Infect Dis 172: 838-844.
Ho, M., T. Schollardt, S. Snape, S. Looareesuwan, P. Suntharasamai, and N.J. White (1998). “Endogenous interleukin-10 modulates proinflammatory response in Plasmodium falciparum malaria.” J Infect Dis 178: 520-525.
Hunt, N., and G.E. Grau (2003). “Cytokines: accelerators and brakes in the pathogenesis of cerebral malaria.” Trends Immunol 24: 491-499.
Hunter, C.A., et al. (1997). “Comparison of the effects of interleukin-1 alpha, interleukin-1 beta and interferon-gamma-inducing factor on the production of interferon-gamma by natural killer.” Eur J Immunol 27: 2787-2792.
Husson, H., et al. (2000). “Functional effects of TNF and lymphotoxin alpha1beta2 on FDC-like cells.” Cell Immunol 203: 134-143.
78

Iuvone, T., F. Dacquisto, R. Carnuccio, and M. Dirosa (1996). “Nitric oxide inhibits LPS-induced tumor necrosis factor synthesis in vitro and in vivo.” Life Sci 59: 207-211.
Jacobs, P., D. Radzioch, and M.M. Stevenson (1996). “In vivo regulation of nitric oxide production by tumor necrosis factor α in the spleen and γ interferon, but not by interleukin-4, during blood stage malaria in mice.” Infect Immun 64: 44-49.
Janeway, C.A. Jr., P. Travers, M. Walport, and M.J. Shlomchik (2005). “Immunobiology: the immune system in health and disease.” Garland Science Publishing, New York.
Keller, C.C. (2005). “Cytokine and effector molecule dysregulation in Plasmodium falciparum malaria.” Ph.D. dissertation, University of Pittsburgh.
Keller, C.C., et al. “Acquisition of hemozoin by monocytes down-regulates IL-12p40 transcripts and circulating IL-12p70 through an IL-10-dependent mechanism: in vivo and in vitro findings in severe malarial anemia.” Manuscript submitted for publication.
Keller, C.C., P.G. Kremsner, J.B. Hittner, M.A. Misukonis, J.B. Weinberg, and D.J. Perkins (2004a). “Elevated nitric oxide production in children with malarial anemia: hemozoin-induced nitric oxide synthase type 2 transcripts and nitric oxide in blood mononuclear cells.” Infect Immun 72(8): 4868-4873.
Keller, C.C., J.B. Hittner, B.K. Nti, J.B. Weinberg, P.G. Kremsner, and D.J. Perkins (2004b). “Reduced peripheral PGE2 biosynthesis in Plasmodium falciparum malaria occurs through hemozoin-induced suppression of blood mononuclear cell cyclooxygenase-2 gene expression via an interleukin-10-independent mechanism.” Mol Med 10(1-6): 45-54.
Keller, C.C., et al. (2006). “Suppression of prostaglandin E2 by malaria parasite products and antipyretics promotes overproduction of tumor necrosis factor-α: association with the pathogenesis of childhood malarial anemia.” J Inf Dis 193: 1384-1393.
Knight, J.C., et al. (1999). “A polymorphism that affects OCT01 binding to the TNF promoter region is associated with severe malaria.” Nature Genet 22: 145-150.
Knight, J.C., B.J. Keating, K.A. Rockett, and D.P. Kwiatkowski (2003). “In vivo characterization of regulatory polymorphisms by allele-specific quantification of RNA polymerase loading.” Nature Genet 33: 469-475.
Kobayashi, M., et al. (1989). “Identification and purification of natural killer cell stimulatory factor (NKSF), a cytokine with multiple biologic effects on human lymphocytes.” J Exp Med 170: 827-846.
79
Korenromp, E.L., B.G. Williams, E. Gouws, C. Dye, and R.W. Snow (2003). “Measurement of trends in childhood malaria mortality in Africa: an assessment of progress toward targets based on verbal autopsy.” Lancet Infect Dis 3: 349-358.
Kremsner, P., S. Nelfer, M. Chaves, R. Rudolph,and U. Bienzle (1992). “Interferon-γ induced lethality in the late phase of Plasmodium vinckei malaria despite effective parasite clearance by chloroquine.” Eur J Immunol 22: 2873-2878.
Kremsner, P.G., et al. (1995). “Prediction of accelerated cure in Plasmodium falciparum malaria by the elevated capacity of tumour necrosis factor production.” Am J Trop Med Hyg 53: 532-538.
Kremsner, P.G., et al. (1996). “High plasma levels of nitrogen oxides are associated with severe disease and correlate with rapid parasitological and clinical cure in Plasmodium falciparum malaria.” Trans R Soc Trop Med Hyg 90: 44-47.
Kremsner, P.G., et al. (2000). “Malarial anaemia in African children associated with high oxygen-radical production.” Lancet 355: 40-41.
Kun, J.F.J., B. Mordmuller, B. Lell, L.G. Lehman, D. Luckner, and P.G. Kremsner (1998). “Polymorphism in promoter region of inducible nitric oxide synthase gene and protection against malaria.” Lancet 351: 265-266.
Kun, J.F., et al. (2001). “Nitric oxide synthase 2(lambarene)(G-954C) increased nitric oxide production, and protection against malaria.” J Inf Dis 184: 330-336.
Kurtzhals, J.A., et al. (1997). “Reversible suppression of bone marrow response to erythropoietin in Plasmodium falciparum malaria.” Br J Haematol 97: 169-174.
Kurtzhals, J.A., et al. (1998). “Low plasma concentrations of interleukin 10 in severe malarial anemia compared with cerebral and uncomplicated malaria.” Lancet 351: 1768-1772.
Kwiatkowski, D., et al. (1990). “TNF concentration in fatal, non-fatal cerebral and uncomplicated Plasmodium falciparum malaria.” Lancet 336: 1201-1204.
Kwiatkowski, D., et al. (1997). “The malarial fever response – pathogenesis, polymorphism, and prospects for intervention.” Ann Trop Med Parasitol 91: 533-542.
Ladan, H., Y. Nitzan, and Z. Malik (1993). “The antibacterial activity of haemin compared with cobalt, zinc and magnesium protoporphyrin and its effect on potassium loss and ultrastructure of Staphylococcus aureus.” FEMS Microbiol Lett 112: 173-177.
Li, C., L.A. Sanni, F.M. Omer, E.M. Riley, and J. Langhorne (2003). “Pathology and mortality of Plasmodium chabaudi chabaudi infection in IL-10-deficients mice is
80

ameliorated by anti-TNF-α and exacerbated by anti-TGF-β antibodies.” Infect Immun 71: 4850-4856.
Luke, T.C. and S.L. Hoffman (2003). “Rationale and plans for developing a non-replicating, metabolically active, radiation-attenuated Plasmodium falciparum sporozoite vaccine.” J Exp Biol 206: 3803-3808.
Luoni, G., et al. (2001). “Antimalarial antibody levels and IL-4 polymorphism in the Fulani of West Africa.” Genes Immun 2: 411-414.
Luty, A.J., et al. (1999). “Interferon-gamma responses are associated with resistance to reinfection with Plasmodium falciparum in young African children.” J Infect Dis 179: 980-988.
Luty, A.J., et al. (2000). “Low interleukin-12 activity in severe Plasmodium falciparum malaria.” Infect Immun 68(7): 3909-3915.
Luyendyk, J., O.R. Olivas, L.A. Ginger, and A.C. Avery (2002). “Antigen-presenting cell function during Plasmodium yoelii infection.” Infect Immun 70: 2941-2949.
Ma, X., et al. (1996). “The interleukin-12 p40 gene promoter is primed by interferon-γ in monocytic cells.” J Exp Med 183: 147-157.
Ma, X. and G. Trinchieri (2001). “Regulation of interleukin-12 production in antigen-presenting cells.” Adv Immunol 79: 55-92.
Malaguarnera, L., S. Pignatelli, J. Simpore, M. Malaguarnera, and S. Musumeci (2002a). “Plasma levels of interleukin-12 (IL-12), interleukin-18 (IL-18) and transforming growth factor beta (TGF-beta) in Plasmodium falciparum malaria.”Eur Cytokine Netw 13: 425-430.
Malaguarnera, L., S. Pignatelli, M. Musumeci, J. Simpore, and S. Musumeci (2002b). “Plasma levels of interleukin-18 and interleukin-12 in Plasmodium falciparum malaria.” Parasite Immunol 24: 489-492.
Marshall, J.D., S.E. Robertson, G. Trinchieri, and J. Chehimi (1997). “Priming with IL-4 and IL-13 during HIV-1 infection restores in vitro IL-12 production by mononuclear cells of HIV-infected patients.” J Immunol 159: 5705-5714.
Martiney, J.A., et al. (2000). “Macrophage migration inhibitory factor release by macrophages after ingestion of Plasmodium chaubadhi-infected erythrocytes; possible role in the pathogenesis of malarial anemia.” Infect Immun 68: 2259-2267.
McElroy, P.D., et al. (2000). “Effect of Plasmodium falciparum parasitemia density on hemoglobin concentrations among full-term, normal birth weight children in western Kenya, IV. The Asembo Bay Cohort Project.” Am J Trop Med Hyg 62: 504-512.
81

McGregor, I.A. and M. Barr (1962). “Antibody responses to tetanus toxoid inoculation in malarious and non-malarious Gambian children.” Trans R Soc Med Hyg 56: 364-367.
McGuire, W., A.V.S. Hill, C.E.M. Allsopp, B.M. Greenwood, and D. Kwiatkowski (1994). “Variation in the TNF α promoter region associated with susceptibility to cerebral malaria.” Nature 371: 508-511.
Mellouk, S., S.L. Hoffman, Z.-Z. Liu, P. de la Vega, T.R. Billiar, and A.K. Nussler (1994). “Nitric oxide-mediated antiplasmodial activity in human and murine hepatocytes induced by gamma interferon and the parasite itself: enhancement by exogenous tetrahydrobiopterin.” Infect Immun 62: 4043-4046.
Menendez, C., et al. (2001). “Effect of malaria on soluble transferring receptor levels in Tanzanian infants.” Am J Trop Med Hyg 65: 138-142.
Micallef, M.J., et al. (1996). “Interferon-gamma-inducing factor enhances T helper 1 cytokine production by stimulated human T cells: synergism with interleukin-12 for interferon-gamma production.” Eur J Immunol 26: 1647-1651.
Miller, L.H., D.I. Baruch, K. Marsh, and O.K. Doumbo (2002). “The pathogenic basis of malaria.” Nature 415: 673-679.
Mohan, K. and M.M. Stevenson (1998). “Interleukin-12 corrects severe anemia during blood-stage Plasmodium chabaudi AS in susceptible A/J mice.” Exp Hematol 26: 45-52.
Moncada, S. and A. Higgs (1993). “The L-arginine-nitric oxide pathway.” N Engl J Med 329: 2002-2012.
Mordmüller, B.G., et al. (1997). “Tumor necrosis factor in Plasmodium falciparum malaria: high plasma level is associated with fever, but high production capacity is associated with rapid fever clearance.” Eur Cytokine Netw 8: 29-35.
Mordmüller, B.G., F. Turrini, H. Long, P.G. Kremsner, and P. Arese (1998). “Neutrophils and monocytes from subjects with the Mediterranean G6PD variant: effect of Plasmodium falciparum hemozoin on G6PD activity, oxidative burst and cytokine production.” Eur Cytokine Netw 9: 239-246.
Mosmann, T. and R. Coffman (1989). “Th1 and Th2 cells: different patterns of lymphokine secretion lead to different functional properties.” Annu Rev Immunol 7: 145-173.
Murray, C.J.L., A.D. Lopez, WHO, and World Bank (1996). “The global burden of disease: a comprehensive assessment of mortality and disability from diseases, injuries, and risk factors in 1990 and projected to 2020.” Published by the Harvard School of Public Health on behalf of the WHO and the World Bank. Distributed by Harvard University Press, Cambridge, MA.
82

Musumeci, M., L. Malaguarnera, J. Simpore, A. Messina, and S. Musumeci (2003). “Modulation of immune response in Plasmodium falciparum malaria: role of IL-12, IL-18 and TGF-beta.” Cytokine 21: 172-178.
Nakanishi, K., T. Yoshimoto, H. Tsutsui, and H. Okamura (2001). “Interleukin-18 regulates both TH1 and TH2 responses.” Annu Rev Immunol 19: 423-474.
Nathan, C. and Q.-W. Xie (1994). “Regulation of biosythesis of nitric oxide.” J Biol Chem 269: 13725-13728.
Ndungu, F.M., B.C. Urban, K. Marsh, and J. Langhorne (2005). “Regulation of immune response by Plasmodium-infected red blood cells.” Parasite Immunol 27: 373-384.
Niiro, H., et al. (1995). “Inhibition by interleukin-10 of inducible cyclooxygenase expression in lipopolysaccharide-stimulated monocytes: its underlying mechanism in comparision with interleukin-4.” Blood 85: 3736-3745.
Nussenblatt, V., et al. (2001). “Anemia and interleukin-10, tumor necrosis factor alpha, and erythropoietin levels among children with acute, uncomplicated Plasmodium falciparum malaria.” Clin Diag Lab Immunol 8: 1164-1170.
Nussler, A., et al. (1991). “L-arginine-dependent destruction of intraheptic malaria parasites in response to tumor necrosis factor and/or interleukin-6 stimulation.” Eur J Immunol 21: 227-230.
Nyakeriga, A.M., et al. (2005). “Cytokine mRNA expression and iron status in children living in a malaria endemic area.” Scand J Immunol 61: 370-375.
O’Dea, K.P. and G. Pasvol (2003). “Optional tumor necrosis factor induction by Plasmodium falciparum requires the highly localized release of parasite products.” Infect Immun 71: 3155-3164.
Omer, F.M. and E.M. Riley (1998). “TGF-β production is inversely correlated with severity of murine malaria infection.” J Exp Med 188: 39-48.
Omer, F.M., J.A.L. Kurtzhals, and E.M. Riley (2000). “Maintaining the immunological balance in parasitic infections: a role for TGF-β?” Parasitol Today 16: 18-23.
Omer, F.M., J.B. de Souza, and E.M. Riley (2003a). “Differential induction of TGF- β regulates pro-inflammatory cytokine production and determines the outcome of lethal and nonlethal Plasmodium yoelii infections.” J Immunol 171: 5430-5436.
Omer, F.M., J.B. de Souza, P.H. Corran, A.A. Sultan, and E.M. Riley (2003b). “Activation of transforming growth factor β by malaria parasite-derived metalloproteinases and a thrombospondin-like molecule.” J Exp Med 198(12): 1817-1827.
83
Ong, echa, J. M., et al. (2006) “Parasitemia, anemia, and malarial anemia in infants and young children in a rural holoendemic Plasmodium falciparum transmission area.” Am J Trop Med Hyg 74(3): 376-385.
Oswald, I.P., T.A. Wynn, A. Sher, and S.L. James (1994). “NO as an effector molecule of parasite killing: modulation of its synthesis by cytokines.” Comp Biochem Physiol Pharamacol Toxicol Endocrinol 108: 11-18.
Othoro, C., A.A. Lal, B. Nahlen, D. Koech, A.S.S. Orago, V. Udhayakumar (1999). “A low interleukin-10 tumar necrosis factor-α ratio is associated with malaria anemia in children residing in a holoendemic malaria region in West. Kenya.” J Infect Dis 179: 279-282.
Otterbein, L.E., et al. (2000). “Carbon monoxide has anti-inflammatory effects involving the mitogen-activated protein kinase pathway.” Nat Med 6: 422-428.
Owen-Schaub, L.B., W.L. Crump, G.I. Morin, and E.A. Grimm (1989). “Regulation of lymphocyte tumor necrosis factor receptors by IL-2.” J Immunol 143: 2236-2241.
Pagola, S., P.W. Stephens, D.S. Bohle, A.D. Kosar, and S.K. Madsen (2000). “The structure of malaria pigment β-haematin.” Nature 404: 307-310.
Perkins, D.J., P.G. Kremsner, D. Schmid, M.A. Misukonis, M.A. Kelly, J.B. Weinberg (1999). “Blood mononuclear cell nitric oxide production and plasma cytokine levels in healthy Gabonese children with prior mild or severe malaria.” Infec Immun 67: 4977-4981.
Perkins, D.J., J.B. Weinberg, and P.G. Kremsner (2000). “Reduced interleukin-12 and transforming growth factor-β1 in severe childhood malaria: relationship of cytokine balance with disease severity.” J Infec Dis 182: 988-992.
Perkins, D.J., P.G. Kremsner, and J.B. Weinberg (2001). “Inverse relationship of plasma prostaglandin E2 and blood mononuclear cell cyclooxygenase-2 with disease severity in children with Plasmodium falciparum malaria.” J Infect Dis 183: 113-118.
Perussia, B., et al. (1992). “Natural killer (NK) cell stimulatory factor or interleukin-12 has differential effects on the proliferation of TCRαβ+, TCRγδ+ T lymphocytes, and NK cells.” J Immunol 149: 3495-3502.
Phu, N.H., N.P.J. Day, P.T. Diep, D.J.P. Ferguson, and N.J. White (1994). “Leukocyte malaria pigment and prognosis in severe malaria.” Trans R Soc Trop Med Hyg 89: 197.
Pichyangkul, S., P. Saengkrai, and H.K. Webster (1994). “Plasmodium falciparum pigment induces monocytes to release high levels of tumor necrosis factor-alpha and interleukin-1 beta.” Am J Trop Med Hyg 51: 430-435.
84

Pichyangkul, S., et al. (2004). “Malaria blood stage parasites activate human plasmacytoid dendritic cells and murine dendritic cells through a toll-like receptor 9-dependent pathway.” J Immunol 172: 4296-4933.
Quin. S.J, et al. (2001). “Low CD4- T cell responses to the C-terminal region of the malaria merozoite surface protein-1 may be attributed to processing within distinct MHC class II pathways.” Eur J Immunol 31:72-81.
Reykdal, S., C. Abboud, and J. Liesveld (1999). “Effect of nitric oxide production and oxygen tension progenitor preservation in ex vivo culture.” Exp Hematol 27: 441-450.
Ridley, R.G. (2003). “To kill a parasite.” Nature 424: 887-889.
Riley, E.M. (1999). “Is T-cell priming required for initiation of pathology in malaria infections?” Immunol Today 20: 228-233.
Robinson, D., et al. (1997). “IGIF does not drive Th1 development but synergizes with IL-12 for interferon-gamma production and activates IRAK and NF kappaB.” Immunity 7: 571-581.
Rockett, K.A., M.M. Awburn, W.B. Cowden, and I.A. Clark (1991). “Killing of Plasmodium falciparum in vitro by nitric oxide derivatives.” Infect Immun 59: 3280.
Rockett, K.A., M.M. Awburn, B.B. Aggarwal, W.B. Cowden, and I.A. Clark (1992). “In vivo induction of nitrite and nitrate by tumor necrosis factor, lymphotoxin, and interleukin-1: possible roles in malaria.” Infect Immun 60: 3725-3730.
Roura-Mir, C. and B. Moody (2003). “Sorting out self and microbial lipid antigens for CD1.” Microbes Immun 5: 1137-1148.
Sarady, J.K., S.L. Otterbein, F. Liu, L.E. Otterbein, and A.M. Choi (2002). “Carbon monoxide modulates endotoxin-induced production of granulocyte macrophage colony-stimulating factor in macrophages.” Am J Respir Cell Mol Biol 27: 739-745.
Scheibel, L.W. and I.W. Sherman (1988). “Malaria: principles and practice of malariology.” (Wernsdorfer, W.H. and I. McGregor, Eds.). Churchill-Livingstone, Edinburgh: 219-252.
Schmeig, J., G. Gonzalez-Asequinolaza, and M. Tsuji (2003). “The role of natural killer T cells and other T cell subsets against infection by the pre-erythrocytic stages of malaria parasites.” Microbes Infect 5: 499-506.
85

Schoenfeld, H.J., et al. (1991). “Efficient purification of recombinant human tumot necrosis factor beta from Escherichia coli yields biologically active protein with a trimeric structure that binds to both tumor necrosis factor receptors.” J Biol Chem 266: 3863-3869.
Schofield, L., L. Vival, F. Hackett, P. Gerold, R.T. Schwarz, and S. Tachado (1993). “Neutralizing monoclonal antibodies to glycosylphosphatidylinositol, the dominant TNF-alpha-inducing toxin of Plasmodium falciparum – prospects for the immunotherapy of severe malaria.” Ann Trop Med Parasitol 87: 617-626.
Schofield, L., M.C. Hewitt, K. Evans, M. Siomos, and P.H. Seeberger (2002). “Synthetic GPI as a candidate anti-toxic vaccine in a model of malaria.” Nature 418: 785-789.
Schwarzer, E., F. Turrini, G. Giribaldi, M. Cappadora, and P. Arese (1992). “Impairment of macrophage functions after ingestion of Plasmodium falciparum infected erythrocytes or isolated malarial pigment.” J Exp Med 176: 1033-1041.
Schwarzer, E., F. Turrini, D. Ulliers, G. Giribaldi, H. Ginsburg, and P. Arese (1993). “Phagocytosis of P. falciparum malarial pigment hemozoin by human monocytes inactivates monocyte protein kinase C.” Biochim Biophys Acta 1181: 51-54.
Schwarzer, E., M. Alessio, D. Ulliers, and P. Arese (1998). “Phagocytosis of the malarial pigment, hemozoin, impairs expression of major histocompatibility complex class II antigen, CD54, and CD11c in human monocytes.” Infect Immun 66: 1601-1606
Sedegah, M., F. Finkelman, and S.L. Hoffman (1994). “Interleukin 12 induction of interferon gamma-dependent protection against malaria.” Proc Natl Acad Sci USA 91: 10700-10702.
Seibert, K. and J.L. Masferrer (1994). “Role of inducible cyclooxygenase (COX-2) in inflammation.” Receptor 4: 17-23.
Serirom, S., W.H. Raharjo, K. Chotivanich, S. Loareesuwan, P. Kubes, and M. Ho (2003). “Anti-adhesive effect of nitric oxide on Plasmodium falciparum cytoadherence under flow.” Am J Pathol 162: 1651-1660.
Shaffer, N. et al. (1991). “Tumor necrosis factor and severe malaria.” J infect Dis 163: 96-101.
Shami, P.J. and J.B. Weinberg (1996). “Differential effects of nitric oxide on erythroid and myeloid colony growth from CD34+ human bone marrow cells.” Blood 87: 977-982.
86

Sharara, A.I., D.J. Perkins, M.A. Misukonis, S.U. Chan, J.A. Dominitz, and J.B. Weinberg (1997). “Interferon (IFN)-α activation of human blood mononuclear cells in vitro and in vivo for nitric oxide synthase (NOS) type 2 mRNA and protein expression: possible relationship of induced NOS2 to the anti-hepatitis C effects of IFN-α in vivo.” J Exp Med 186(9): 1495-1502.
Sherman, I.W. (Ed.) (1998). “Malaria: parasite biology, pathogenesis and protection.” ASM Press, Washington, DC.
Sköld, M. and S.M. Behar (2003). “Role of CD1d-restricted NKT cells in microbial immunity.” Infect Immun 71: 5447-5455.
Slater, A.F.G., et al. (1991). “An iron-carboxylate bond links the heme units of malaria pigment.” Proc Natl Acad Sci USA 88: 325-329.
Slater, A.F.G. and A. Cerami (1992). “Inhibition by chlorochine of a novel haem polymerase enzyme activity in malaria trophozoites.” Nature (Lond) 355: 167.
Smith, T., N. Hurt, T. Teuscher, and M. Tanner (1995). “Is fever a good sign for clinical malaria in surveys of endemic communities?” Am J Trop Med Hyg 52: 306-310.
Snijders, A. et al. (1996). “Regulation of bioactive IL-12 production in lipopolysaccharide-stimulated human monocytes is determined by the expression of the p35 subunit.” J Immunol 156: 1207-1212.
Snow, R.W., M. Craig, U. Deichmann, and K. Marsh (1999). “Estimating mortality, morbidity and disability due to malaria among Africa’s non-pregnant population.” Bull WHO 77(8): 624-640.
Stem, A.S., et al. (1990). “Purification to homogeneity and partial characterization of cytotoxic lymphocyte maturation factor form human B-lymphoblastoid cells.” Proc Natl Acad Sci USA 87: 6808-6812.
Stevenson, M.M., M.F. Tam, S.F. Wolf, and A. Sher (1995). “IL-12-induced protection against blood-stage Plasmodium chabaudi AS requires IFN-gamma and TNF-alpha and occurs via a nitric oxide-dependent mechanism.” J Immunol 155: 2545-2556.
Stevenson, M.M. and E.M. Riley (2004). “Innate immunity to malaria.” Nature Rev Immunol 4: 169-180.
Storkus, W.J., H. Tahara, and M.T. Lotze (1998). “Interleukin-12.” In A.W. Thomson (Ed.), The cytokine handbook, 3rd Edn. Academic Press Inc., San Diego, CA: 391-425.
87

Stoute, J.A., A.O. Odindo, B.O. Owuor, E.K. Mibei, M.O. Opollo, and J.N. Waitumbi (2003). “Loss of red blood cell-complement regulatory proteins and increased levels of circulating immune complexes are associated with severe malarial anemia.” J Infec Dis 187: 522-525.
Struik, S.S. and E.M. Riley (2004). “Does malaria suffer from a lack of memory?” Immunol Rev 201: 268-290.
Tachado, S., et al. (1996). “Glycosylphosphatidylinositol toxin of Plasmodium induces nitric oxide synthase expression in macrophages and vascular endothelial cells by a protein tyrosine kinase-dependent and protein kinase c-dependent signaling pathway.” J Immunol 156: 1897-1907.
Targett, G.A. (2005). “Malaria vaccines 1985-2005: a full circle?” Trends Parasitol 21: 499-503.
Trinchieri, G. (1993). “IL-12 and its role in the generation of Th1 cells.” Immunol Today 14: 335.
Trinchieri, G. (1998). “Interleukin-12: a cytokine at the interface of inflammation and immunity.” Adv Immunol 70: 83-243.
Trinchieri, G. (2003). “Interleukin-12 and the regulation of innate resistance and adaptive immunity.” Nat Rev Immunol 3: 133-146.
Tsutsui, N., and T. Kamiyama (1999). “Transforming growth factor β-induced failure of resistance to infection with blood-stage Plasmodium chabaudi in mice.” Infect Immun 67: 2306-2311.
Turgeon, M.L. (1993). Clinical hematology: theory and procedures, 2nd Edn. Lippincott Williams and Wilkins, Philadelphia, PA.
Urban, B.C., et al. (1999). “Plasmodium falciparum-infected erythrocytes modulate the maturation of dendritic cells.” Nature 400: 73-77.
Vane, J., Y. Bakhle, R. Botting (1998). “Cyclooxygenase 1 and 2.” Ann Rev Pharmacol Toxicol 38: 97-120.
Verhoef, H., et al. (2001). “Serum transferring receptor concentration indicates increased erythropoiesis in Kenyan children with asymptomatic malaria.” Am J Clin Nutr 74: 767-775.
Vodovotz, Y., C. Bogdan, J. Paik, Q.W. Xie, and C. Nathan (1993). “Mechanisms of suppression of macrophage nitric oxide release by transforming growth factor beta.” J Exp Med 178: 605-613.
Waitumbi, J.N., et al. (2000). “Red cell surface changes and erythrophagocytosis in children with severe Plasmodium falciparum anemia.” Blood 95: 1481-1486.
88

Wahl, S.M. (1994). “Transforming growth factor beta: the good, the bad, and the ugly.” J Exp Med 180: 1587-1590.
Wahlgren, M., et al. (1995). “Adhesion of Plasmodium falciparum-infected erythrocytes to human cells and secretion of cytokines (IL-1-beta, IL-1RA, IL-6, IL-8, IL-10, TGF beta, TNF alpha, G-CSF, GM-CSF).” Scand J Immunol 42: 626-636.
Walker, W., M. Aste-Amezaga, R.A. Kastelein, G. Trinchieri, and C.A. Hunter (1999). “Il-18 and CD28 use distinct molecular mechanisms to enhance NK-cell production of IL-12-induced IFN-γ.” J Immunol 162: 5894-5901.
Walsh, C.E., J.M. Liu, S.M. Anderson, J.L. Rossio, A.W. Nienhuis, and N.S. Young (1992). “A trial of recombinant human interleukin-1 in patients with severe refractory aplastic anemia.” Br J Haematol 80: 106-110.
Wang, P., P. Wu, M.I. Siegel, R.W. Egan, and M.M. Billah (1995). “Interleukin (IL)-10 inhibits nuclear factor kappa B (NF kappa B) activation in human monocytes. IL-10 and IL-4 suppress cytokine synthesis by different mechanisms.” J Biol Chem 270: 9558-9563.
WHO. “Children and malaria.” http://www.rbm.who.int/cmc_upload/0/000/015/367/ RBMInfosheet_6.htm.
“WHO expert committee on malaria.” (2000). WHO Tech Rep Ser 892: 1-74.
Wickramasinghe, S.N. and S.H. Abdalla (2000). “Blood and bone marrow changes in malaria.” Baillieres Best Pract Res Clin Haemotol 13: 277-299.
Winkler, S., et al. (1998). “Reciprocal regulation of Th1 and Th2-cytokine-producing T cells during clearance of parasitemia in Plasmodium falciparum malaria.” Infect Immun 66: 6040-6044.
Wood, P.R. and I.A. Clark (1984). “Macrophages from Babesia and malaria infected mice primed for monokine release.” Parasit Immunol 6: 309-317.
Wysocka, M., et al. (1995). “Interleukin-12 is required for interferon-γ production and lethality in lipopolysaccharide-induced shock in mice.” Eur J Immunol 25: 672-676.
Xu, X, et al. (2001). “Down-regulation of IL-12 p40 gene in Plasmodium berghei-infected mice.” J Immunol 167: 235-241.
Yoshimoto, T., T. Yoneto, S. Waki, and H. Nariuchi (1998). “Interleukin-12-dependent mechanisms in the clearance of blood-stage murine malaria parasite Plasmodium berghei XAT, an attenuated variant of P. berghei NK65.” J Infect Dis 177: 1674-1681.
89

Zambrano-Villa, S., D. Rosales-Borjas, J.C. Carrero, and L. Ortiz-Ortiz. (2002). “How protozoan parasites evade the immune response.” Trends Parasitol 18: 272-278.
90