Embed Size (px)
Citation preview
DMD #47993
1
Impact of Hydrolysis Mediated Clearance on the Pharmacokinetics of Novel Anaplastic
Lymphoma Kinase Inhibitors
Yohannes Teffera, Loren M. Berry, Rachael L. Brake, Richard T. Lewis, Douglas C. Saffran,
Earl Moore, Jingzhou Liu, and Zhiyang Zhao
Departments of Pharmacokinetics and Drug Metabolism (Y.T, L.M.B., E.M, J.L., Z.Z.) and
Discovery Research (R.T.L., R.L.B., D.C.S.)
Amgen, Inc., Cambridge, MA 02142.
DMD Fast Forward. Published on November 1, 2012 as doi:10.1124/dmd.112.047993
Copyright 2012 by the American Society for Pharmacology and Experimental Therapeutics.
This article has not been copyedited and formatted. The final version may differ from this version.DMD Fast Forward. Published on November 1, 2012 as DOI: 10.1124/dmd.112.047993
at ASPE
T Journals on February 18, 2020
dmd.aspetjournals.org
Dow
nloaded from
DMD #47993
2
Running Title Page
Running title: Impact of hydrolysis on the PK of ALK inhibitors
Corresponding Author: Yohannes Teffera, Ph.D.,
Department of Pharmacokinetics and Drug Metabolism,
360 Binney Street
Cambridge, MA 02142
Phone: 617-444-5077
Fax: 617-577-9913
e-mail: [email protected]
Number of text pages: 24
Number of Tables: 5
Number of Figures: 7
Number of References: 20
Abstract (words): 266
Introduction (words): 848
Discussion (words): 1444
Non-standard abbreviations: ALK, anaplastic lymphoma kinase; IV, intravenous; PK,
pharmacokinetics; CL, clearance; CLint, intrinsic clearance; LC-MS/MS, liquid chromatography
tandem mass spectrometry; QC, quality control
This article has not been copyedited and formatted. The final version may differ from this version.DMD Fast Forward. Published on November 1, 2012 as DOI: 10.1124/dmd.112.047993
at ASPE
T Journals on February 18, 2020
dmd.aspetjournals.org
Dow
nloaded from

DMD #47993
3
Abstract
Compound 1, a new, potent, selective anaplastic lymphoma kinase (ALK) inhibitor with
potential application for the treatment of cancer, was selected as candidate to advance into
efficacy studies in mice. However, the compound underwent mouse specific enzymatic
hydrolysis in plasma to a primary amine product (M1). Subsequent intravenous (IV) PK studies
in mice showed that compound 1 had high CL and a short half-life. Oral dose escalation studies
in mice indicated that elimination of compound 1 was saturable, with higher doses achieving
sufficient exposures above in vitro IC50. Chemistry efforts to minimize hydrolysis resulted in the
discovery of several analogs that were stable in mouse plasma. Three were taken in vivo into
mice and showed decreased CL corresponding to increased in vitro stability in plasma.
However, the more stable compounds also showed reduced potency against ALK. Kinetic
studies in NADPH fortified and un-fortified microsomes and plasma produced sub-micromolar
Km values and could help explain the saturation of elimination observed in vivo. Predictions of
CL based on kinetics from hydrolysis and NADPH-dependent pathways produced predicted
hepatic CL values of 3.8, 3.0, 1.6, and 1.2 L/(h*kg) for compounds 1, 2, 3, and 4, respectively.
The in vivo observed CL for compounds 1, 2, 3, and 4 were 5.52, 3.51, 2.14, and 2.66 L/hr*kg,
respectively. These results indicate that in vitro metabolism kinetic data, incorporating
contributions from both hydrolysis and NADPH-dependent metabolism, could be used to predict
the systemic CL of compounds cleared via hydrolytic pathways provided that the in vitro assays
thoroughly investigate the processes, including the contribution of other metabolic pathways and
the possibility of saturation kinetics.
This article has not been copyedited and formatted. The final version may differ from this version.DMD Fast Forward. Published on November 1, 2012 as DOI: 10.1124/dmd.112.047993
at ASPE
T Journals on February 18, 2020
dmd.aspetjournals.org
Dow
nloaded from

DMD #47993
4
Introduction
Anaplastic lymphoma kinase (ALK) is a receptor tyrosine kinase member of the insulin
receptor superfamily. Although ALK is expressed at high levels prenatally, its expression is
dramatically decreased in healthy adult tissues. Aberrant expression of full-length ALK occurs in
neuroblastoma (George et al., 2008). In addition, novel fusion-ALK proteins that possess
constitutive kinase activity, and contribute to oncogenic processes are generated by
chromosomal translocation or inversion of the ALK gene. Two of these fusion ALK proteins
nucleophosmin (NPM-ALK) and echinoderm microtubule-associated protein-like 4 (EML4-ALK)
have been validated as driving oncogenes in a subset of anaplastic large cell lymphomas and
non-small cell lung carcinomas, respectively (Morris et al., 1994; Soda et al., 2007). The clinical
validation of EML4-ALK as a therapeutic target by crizotinib has provided compelling evidence
for the importance of ALK in oncology (Shaw et al., 2011).
Compound 1 ((E)-4-fluoro-N-(6-((4-(2-hydroxypropan-2-yl)piperidin-1-yl)methyl)-1-
((1s,4s)-4-(isopropylcarbamoyl)cyclohexyl)-1H-benzo[d]imidazol-2(3H)-ylidene)benzamide), is a
member of a new class of potent and selective anaplastic lymphoma kinase inhibitor with
potential application in the treatment of cancer (Lewis et al., 2012). In vitro screening of
compound 1 resulted in excellent inhibitory activity against the ALK enzyme (IC50 = 1 nM) and
ALK expressing Karpas-299 cells (4 nM) (Lewis et al., 2012). Rat in vivo studies showed
acceptable PK with a CL of 0.8 L/hr/kg, a t1/2 of 5.6 hr, and MRT of 8 hrs (Lewis et al., 2012).
Based on potency and preliminary rodent pharmacokinetics, compound 1 was selected as a
candidate to advance into efficacy studies in mice. However, during bioanalysis it was found
that the compound was subject to extensive hydrolysis to a resultant primary amine product
(M1). Enzyme mediated hydrolytic metabolism of compound 1 was examined to determine
whether or not it would be a liability in the further development of this molecule for potential use
in humans.
This article has not been copyedited and formatted. The final version may differ from this version.DMD Fast Forward. Published on November 1, 2012 as DOI: 10.1124/dmd.112.047993
at ASPE
T Journals on February 18, 2020
dmd.aspetjournals.org
Dow
nloaded from
DMD #47993
5
Although not as common as cytochrome P450 mediated oxidations, hydrolysis reactions
play an important role in the metabolism of xenobiotics (Testa and Mayer, 2003). A variety of
hydrolytic enzymes have been implicated in the hydrolysis of esters, thioesters, amides, and
epoxides. These hydrolytic enzymes include carboxylesterases, cholinesterases,
organophosphatases, and amidases/peptidases. Cholinesterases and aminopeptidases are the
most commonly associated with the hydrolysis of amide bonds (Uetrecht and Trager, 2007).
Species difference in amide hydrolysis is well precedented. For example, considerable species
differences in extent of hydrolysis was observed for lidocaine forty years ago (Keengham and
Boyes, 1972). With regards to compounds containing biaryl amide links, species differences in
extent of hydrolysis have been reported for ameltolide (Potts et al., 1989), the anticonvulsant
agent D2624 (Martin et al., 1997), pranulkast, (Luan et al., 1997), piroxicam (Hobbs and
Twomey, 1981), and more recently a bile acid Takeda G-protein coupled receptor 5 (TGR5)
agonist (Eng et al., 2010) and the Bruton’s Tyrosine Kinase Inhibitor GDC-0834 (Liu et al.,
2011).
Species specific enzyme mediated amide hydrolysis reactions in drug discovery often
present multiple problems, including high CL in PK, instability in in vitro assays that may contain
the hydrolytic enzymes, and instability in bioanalytical matrices such as blood or plasma.
Instability in in vitro and ex vivo assays may lead to erroneous results and potentially causes the
subsequent termination of a promising candidate. Therefore, early identification and
examination of the hydrolytic process(es) can be used to design experiments that deliver more
accurate results, provide rationale for the progression (or early termination) of a lead molecule,
or support the design of hydrolytically stable analogs that might offer better success in
development.
In early development, knowledge of the hydrolysis mediated metabolism of a lead
molecule may influence the approach taken to predict human pharmacokinetics prior to
advancement of the compound to the clinic. For example, although they performed kinetic
This article has not been copyedited and formatted. The final version may differ from this version.DMD Fast Forward. Published on November 1, 2012 as DOI: 10.1124/dmd.112.047993
at ASPE
T Journals on February 18, 2020
dmd.aspetjournals.org
Dow
nloaded from
DMD #47993
6
studies to determine Vmax and Km through formation of the hydrolysis metabolite in multiple
species, Liu and co-authors (2011) used the substrate depletion method at a single arbitrary
concentration to arrive at the predicted CL. They reported substantial uncertainty in the IVIVE
techniques used, given the large species differences observed in the hydrolysis pathway.
Unfortunately, they did not appear to address issues such as plasma protein binding, binding to
microsomal proteins, saturation kinetics, or kinetics of hydrolysis versus other metabolic
pathways such as P450 dependent metabolism. Further study on the impact of hydrolysis on
IVIVE predictive techniques is warranted.
In a discovery setting, extrahepatic metabolism such as hydrolysis in plasma, is
occasionally proposed as a possible explanation for poor predictivity of in vitro-in vivo
extrapolation (IVIVE) based upon data obtained from liver microsomes or hepatocytes. To our
knowledge, there are no reports in the literature that deal with an IVIVE method for hydrolysis
which takes into account plasma hydrolysis, saturation kinetics, and contribution of NADPH
dependent metabolism. In this paper, we report our experiences with compound 1, a novel
potent ALK inhibitor that is rapidly enzymatically hydrolyzed in mouse plasma and liver
microsomes. We report our rationale for the successful guidance of compound progression
and the use of IVIVE of the hydrolysis reaction to drive an informed decision. In addition, the
contributions of hydrolysis in plasma and liver versus NADPH-dependent metabolism in vitro are
considered in this context.
This article has not been copyedited and formatted. The final version may differ from this version.DMD Fast Forward. Published on November 1, 2012 as DOI: 10.1124/dmd.112.047993
at ASPE
T Journals on February 18, 2020
dmd.aspetjournals.org
Dow
nloaded from
DMD #47993
7
Materials and Methods
Materials. Liver microsomes isolated from male Sprague-Dawley rats (n=50), male CD-1
mice (n=200), male beagle dogs (n=5), and human (n=50) were purchased from BD
Biosciences (San Jose, CA). Plasma from male Sprague-Dawley rats, CD-1 mice, beagle dogs
and human was purchased from Bioreclamation, Inc. (Westbury, CT). All fresh plasma and
blood was obtained from the in vivo group at Amgen. All proprietary ALK inhibitors were
synthesized by the Department of Medicinal Chemistry at Amgen (Cambridge, MA) and all
synthetic routes have already been published elsewhere (Lewis et al., 2012). All other
chemicals were purchased from Sigma-Aldrich (Milwaukee, WI) unless otherwise specified
Determination of stability or CLint in plasma. Compound 1 and analogs were incubated in
mouse, rat, dog, or human plasma at 37 C for up to 3 hrs. For initial stability screening in mouse
plasma, test compounds were incubated at a concentration of 0.83 µM. For determination of
metabolism kinetics in mouse plasma selected compounds (compound 1, compound 2,
compound 3, and compound 4) were incubated at a compound concentration range of 0.0023
µM to 5 µM. At various time points, samples were collected from the incubations into
acetonitrile containing internal standard (tolbutamide), centrifuged at 3500 g for 15 min, and
analyzed by LC-MS/MS. For each compound/concentration, peak areas at each time point
were converted to the natural log of the percent remaining relative to the 0-minute samples. The
resulting initial linear portion of the slope (k) of these values relative to time was converted to in
vitro t1/2 where t1/2 = -0.693/k. In determination of metabolism kinetics, observed CLint was
calculated using the relationship (Obach, 2002):
CLint,obs = (0.693/t1/2) x (1/M) Eq. 1
where, in this case, M is the concentration of plasma in the incubation (e.g. 1 mL plasma per mL
of incubation).
This article has not been copyedited and formatted. The final version may differ from this version.DMD Fast Forward. Published on November 1, 2012 as DOI: 10.1124/dmd.112.047993
at ASPE
T Journals on February 18, 2020
dmd.aspetjournals.org
Dow
nloaded from

DMD #47993
8
Determination of CLint in liver microsome. Initial experiments with compound 1 were
conducted in mouse, rat, dog, and human liver microsomes (0.25 mg/mL protein) in phosphate
buffer (0.1 M, pH 7.4). Compound 1 (0.1 and 1 µM) was incubated with NADPH (1 mM).
Samples were collected from the incubations at 0, 10, 20, 30 and 40 min into an equal volume
of acetonitrile containing internal standard (tolbutamide), centrifuged at 3500 g for 15 min, and
analyzed by LC-MS/MS. Subsequent metabolism kinetics (Vmax and Km) for compounds 1, 2, 3
and 4 in mouse liver microsomes were determined as above in the presence and absence of
NADPH at a compound concentration range of 0.0023 µM to 5 µM. For each
compound/concentration, CLint,obs was calculated using Eq. 1, where, in this case, M is the
concentration of microsomes in the incubation.
Plasma protein binding and microsomal binding . Fraction unbound in mouse plasma (fup)
was determined in triplicate by equilibrium dialysis, using the Rapid Equilibrium Dialysis device
(Thermo Scientific, Rockford, IL). Three hundred microliter aliquots of plasma containing 0.1
µM, 0.5 µM or 2 µM test compound were dialyzed against 500 µL of phosphate buffered saline
for 7 h at 37 °C in an incubator maintained at 5% CO2. Preliminary experiments with selected
compounds indicated that a 7 h incubation time was sufficient to achieve equilibrium. Since
some test compounds were rapidly hydrolyzed in plasma, plasma was pre-incubated for 20 min
in the presence of 100 µM diisopropyl flourophosphate (DFP) to inactivate hydrolytic enzymes.
Recovery of test compounds in the presence of DFP was >80%, indicating DFP did an
adequate job of preventing hydrolysis. Aliquots of the post-dialysis buffer were transferred into
an equal volume of blank plasma. Samples of the dialyzed plasma were transferred to an equal
volume of buffer. Samples were extracted with acetonitrile containing internal standard
(tolbutamide), then centrifuged at 3500 g for 15 min and analyzed by LC-MS/MS as described
below. The fraction unbound in plasma was calculated by dividing the amount of drug found in
the post dialysis buffer by the amount found in the dialyzed plasma.
This article has not been copyedited and formatted. The final version may differ from this version.DMD Fast Forward. Published on November 1, 2012 as DOI: 10.1124/dmd.112.047993
at ASPE
T Journals on February 18, 2020
dmd.aspetjournals.org
Dow
nloaded from
DMD #47993
9
The binding of test compounds to liver microsomes was conducted as described above for
plasma, except substituting plasma with 0.25 mg/mL liver microsomes solution in phosphate
buffer.
Blood to plasma ratio (BP). BP was determined in vitro after incubation of compound with and
without DFP in fresh whole blood. Blood was warmed to 37°C and compound was spiked to a
concentration of 1 µM. After incubation for 1 h the blood samples were processed for plasma.
Reference plasma was also spiked with compound to a concentration of 1 µM. The same
incubations were performed after pre-incubation for 20 min with 100 µM of DFP to inhibit amide
hydrolysis. Recovery of test compounds in the presence of DFP was >80%. Samples were
extracted with 6 volumes of acetonitrile containing internal standard, centrifuged, and analyzed on
the LC-MS/MS system described below. BP was calculated by dividing the peak area observed in
the reference plasma (representing nominal blood concentration) by the peak area observed in the
treated plasma (representing plasma concentration).
Pharmacokinetic studies in mice. All animal procedures were conducted under protocols
approved by the Amgen (Cambridge, MA) Institutional Animal Care and Use Committee. Male
CD-1 mice were purchased from Taconic (Germantown, NY). Mice (60) were housed in a
humidity- and temperature-controlled environment subject to a 12 h:12 h light:dark cycle and had
access to water and a standard laboratory diet ad libitum. The animals designated for oral
administration were fasted overnight prior to dosing and food was returned 2 h post-dose.
Following a 5 day acclimation period, the mice were administered a single dose of test
material by bolus intravenous injection through the lateral tail vein (2 mg/kg) or by oral gavage
(20, 50, 100 mg/kg). Mice were euthanized by CO2 asphyxiation at 0.083 (IV only), 0.25, 0.5, 1,
2, 4, 6, 8, and 24 hours after dose administration. Blood samples (0.3 mL) were obtained by
cardiac puncture and then transferred to heparinized tubes on ice. Plasma was separated by
centrifugation at 4 °C and fifty microliters aliquots were immediately transferred to tubes
containing six volumes of a mixture of 0.1% formic acid and IS in acetonitrile. The remaining
This article has not been copyedited and formatted. The final version may differ from this version.DMD Fast Forward. Published on November 1, 2012 as DOI: 10.1124/dmd.112.047993
at ASPE
T Journals on February 18, 2020
dmd.aspetjournals.org
Dow
nloaded from
DMD #47993
10
plasma was flash frozen on dry ice and stored at -80 °C until required for follow-up analysis.
Plasma samples were analyzed using the LC-MS/MS method described below.
Analysis of pharmacokinetic samples. The LC-MS/MS system consisted of a Waters
Acquity UPLC system (Waters) and an API4000 mass spectrometer (Applied Biosystems
Group, Foster City, CA) equipped with either an atmospheric pressure chemical ionization
(APCI) source or electrospray ionization (ESI) source. For each analyte, the mass spectrometer
electronics were tuned to the most intense mass transition. The following transitions were used
for data acquisition: compound 1, m/z 578 → m/z 435.3; compound 2, m/z 596.4 → m/z 453.3;
compound 3, m/z 612.3 → m/z 469.2; compound 4, m/z 628.4 → m/z 485.3; M1, m/z 456.4 →
m/z 313.2.
Calibration curve standards and QC samples were prepared in mouse plasma at
concentrations ranging from 0.3 to 10000 ng/mL for each compound. Fifty microliters of each
plasma sample, calibration standard, and QC sample were extracted by adding 6 volumes of a
mixture containing 0.1% formic acid in water and an internal standard. The samples were
mixed by vortexing and centrifuged. The resulting supernatants were diluted with an equal
volume of water.
Samples were injected onto an Acquity UPLC Phenyl 1.7µm BEH column (2.1X50 mm
Waters) with a 0.5 µm PEEK guard filter. Analytes were separated using a gradient solvent
system consisting of two components: solvent A (water containing 0.1% formic acid) and
solvent B (acetonitrile containing 0.1% formic acid). The percentage of solvent B was increased
in a linear fashion from 10% to 95% over 2 min, then maintained at 95% for an additional 0.5
min; flow rate was 0.6 mL/min.
Raw data was collected using Sciex Analyst 1.5.1 (Applied Biosystems, Foster City, CA)
residing on a computer running a Windows XP operating system. Following peak area integration,
the data was exported to the Small Molecules Discovery Assay (SMDA) Watson® software
package (version 7.0.0.01, Thermo Fisher Scientific, Waltham, MA) where concentrations were
This article has not been copyedited and formatted. The final version may differ from this version.DMD Fast Forward. Published on November 1, 2012 as DOI: 10.1124/dmd.112.047993
at ASPE
T Journals on February 18, 2020
dmd.aspetjournals.org
Dow
nloaded from
DMD #47993
11
determined by a weighted (1/x2) linear regression of peak area ratios versus the peak area ratios of
known calibration standards.
Noncompartment PK Analysis. The non-compartmental pharmacokinetics parameters were
calculated using Small Molecules Discovery Assay (SMDA) Watson® software (version 7.0.0.01;
Thermo Fisher Scientific,Waltham, MA). The area under the plasma concentration-time curve from
time 0 to the last time point (t) with a quantifiable concentration (Cp), AUC0–t, was calculated using
the linear trapezoidal rule. The area under the plasma concentration-time curve was extrapolated
to infinity time (AUC0–inf) by the equation AUC0–inf = AUC0–t + Cp/k, where k is the elimination rate
constant determined by linear regression of the last two to four quantifiable data points in the log
plasma concentration-time curves. Plasma clearance (CL), t1/2, and Vss were calculated by the
equations, CL= Dose / AUC0–inf, t1/ 2 = 0.693/k, and Vss = CL * AUMC0 – inf/ AUC0–inf, where AUMC0–
inf is the area under the first moment of the plasma concentration-time curve from time 0 to infinity.
MRT was calculated by the equation MRT = Vss / CL. Bioavailability (F) was calculated using the
equation F = (AUCp.o. / AUCi.v.) * (Dosei.v./Dosep.o.), where AUCi.v. and AUCp.o. are AUC estimates
after the intravenous and oral administration, respectively, and Dosei.v. and Dosep.o. are the
administered doses for intravenous and oral administration, respectively.
Analysis of samples from in vitro metabolism, blood to plasma ratio, and plasma protein
binding experiments. The LC-MS/MS system consisted of two LC-10AD HPLC pumps and a
DGU-14A degasser (Shimadzu, Columbia, MD), a CTC PAL autoinjector (Leap Technologies,
Carrboro, NC), and either an API3000 or API4000 mass spectrometer (Applied Biosystems,
Foster City, CA), according to the requirements of the compound. For each analyte, the mass
spectrometer electronics were tuned to the most intense mass transition. The following
transitions were used for data acquisition: compound 1, m/z 578 → m/z 435.3; compound 2, m/z
596.4 → m/z 453.3; compound 3, m/z 612.3 → m/z 469.2; compound 4, m/z 628.4 → m/z 485.3;
M1, m/z 456.4 → m/z 313.2. Samples from in vitro experiments were injected onto a Sprite
This article has not been copyedited and formatted. The final version may differ from this version.DMD Fast Forward. Published on November 1, 2012 as DOI: 10.1124/dmd.112.047993
at ASPE
T Journals on February 18, 2020
dmd.aspetjournals.org
Dow
nloaded from
DMD #47993
12
Armor C18 analytical column (20 mm x 2.1 mm, 5 µm pore size; Analytical Sales and Products,
Pompton Plains, NJ) with a 0.5 µm PEEK guard filter. Analytes were separated using a gradient
solvent system consisting of 2 components, solvent A (0.1% formic acid in water) and solvent B
(0.1% formic acid in acetonitrile). The percentage of solvent B was increased in a linear fashion
from 2 to 95% over 1 min; flow rate was 0.4 mL/min.
Metabolite Identification. The LC-MS/MS system consisted of two Shimadzu LC-20AD
HPLC pumps, a DGU-14A degasser and an autosampler (Shimadzu, Columbia, MD), and a
Therm LTQ-Orbitrap (ThermoElectron Corp., San Jose, CA). Electrospray ionization with
positive ion detection was used. The source temperature was set at 250° C, and the ion spray
voltage was held at 5 kV.
Calculation of kinetic constants. Kinetic constants apparent Vmax and Km were determined
for compound 1, compound 2, compound 3, and compound 4 from depletion experiments with
mouse plasma and liver microsomes by assuming that Michaelis-Menten kinetics were sufficient
to describe the metabolic processes. Kinetic constants for the hydrolysis pathways in plasma or
liver microsomes in the absence of NADPH were determined using the relationship:
�����, ����� � � ����, ����� � /���,����� � � �� Eq. 2
where CLint,hydrolysis is the observed CLint due to hydrolysis in plasma or in liver microsomes in the
absence of NADPH, and C is the concentration of test compound in the incubation.
CLint observed in incubations with mouse liver microsomes in the presence of NADPH
(CLint,NADPH) reflects the contribution of hydrolysis together with NADPH-dependent processes.
Therefore, the apparent kinetic constants for NADPH-dependent metabolism were estimated
while considering the contribution of the kinetics of the hydrolysis pathway, as measured in
incubations with mouse liver microsomes in the absence of NADPH. In other words, the
This article has not been copyedited and formatted. The final version may differ from this version.DMD Fast Forward. Published on November 1, 2012 as DOI: 10.1124/dmd.112.047993
at ASPE
T Journals on February 18, 2020
dmd.aspetjournals.org
Dow
nloaded from

DMD #47993
13
apparent Vmax and Km of the hydrolysis pathway were solved first from incubations in the
absence of NADPH. The hydrolysis CLint term was calculated for specific concentrations and
this information was fed into equation 3 in order to estimate the apparent Vmax and Km for
NADPH-dependent metabolism in the presence of NADPH, as shown in the relationship:
�����, ����� � �����, ����� � � ����,�����/���,����� � �� Eq. 3
where CLint,hydrolysis is also concentration dependent and determined by fitting Eq. 2 to results
from incubations in the absence of NADPH. Eqs. 2 and 3 were fit by nonlinear regression using
GraphPad Prism (GraphPad Software, Inc., La Jolla, CA).
Metabolite formation velocity (v) was also simulated using the estimated apparent Vmax and
Km values for hydrolysis or NADPH-dependent metabolism in plasma and liver microsomes
using the relationship:
� � ���� � �/��� � �� Eq. 4
Prediction of CL from in vitro data. CL caused by metabolism in the plasma and liver were
predicted separately using the corresponding apparent kinetic constants. Maximum CLint
(CLint,max) for hydrolysis in plasma, hydrolysis in liver or NADPH-dependent metabolism in liver
was calculated by:
�����,��� � ����/�� Eq. 5
CL caused by hydrolysis in plasma (CL,plasma) was considered independent of blood-flow and
was predicted by the relationship
This article has not been copyedited and formatted. The final version may differ from this version.DMD Fast Forward. Published on November 1, 2012 as DOI: 10.1124/dmd.112.047993
at ASPE
T Journals on February 18, 2020
dmd.aspetjournals.org
Dow
nloaded from

DMD #47993
14
��, ��� �� � �����,��� � ! Eq. 6
where SF is a scaling factor with a value of 48.8 mL plasma per kg body weight in mice (Davies
and Morris, 1993).
CL caused by combined hydrolysis and NADPH-dependent metabolism in the liver
(CL,hepatic) was predicted using the well-stirred model:
RbQhfub
micfu
SFSFhepaticCL
Qhfubmicfu
SFSFhepaticCL
hepaticCL **
,
2*1*int,
**,
2*1*int,
,+
= Eq.7
where CLint,hepatic is the sum of the CLint,max values from the hydrolysis and NADPH-dependent
metabolic pathways in liver microsomes; SF1 and SF2 are scaling factors with values of 45 mg
microsomal protein per g liver and 87.5 g liver per kg body weight in mice, respectively; fu,mic is
the fraction unbound in microsomes; fub is the fraction unbound in blood, equal to the fraction
unbound in plasma (fup) divided by the blood-to-plasma concentration ratio (Rb); and Qh is the
hepatic blood flow, or 5.4 L/(h*kg) in mice. Since a value for SF1 is not available for mouse
liver, the value for SF1 used was that determined for rat liver (Houston and Galetin, 2008), and
was assumed to reasonably represent mouse liver.
This article has not been copyedited and formatted. The final version may differ from this version.DMD Fast Forward. Published on November 1, 2012 as DOI: 10.1124/dmd.112.047993
at ASPE
T Journals on February 18, 2020
dmd.aspetjournals.org
Dow
nloaded from
DMD #47993
15
Results
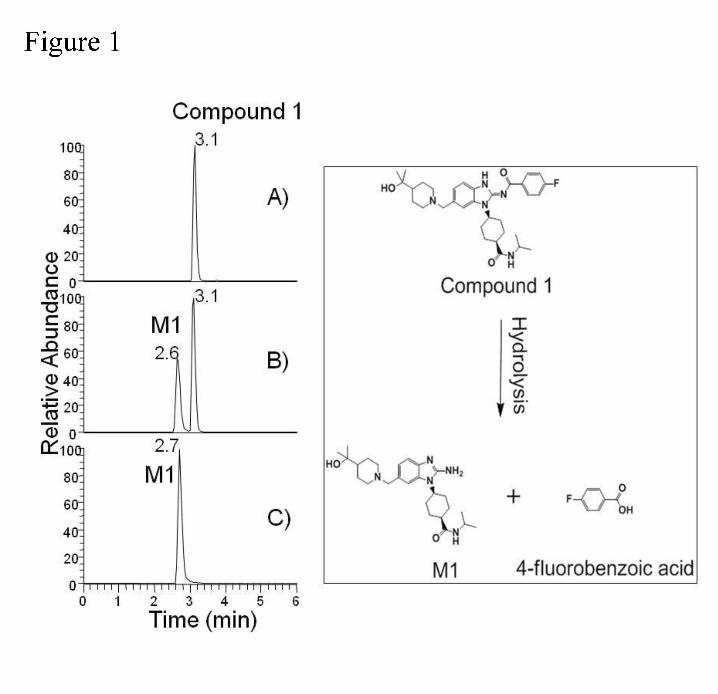
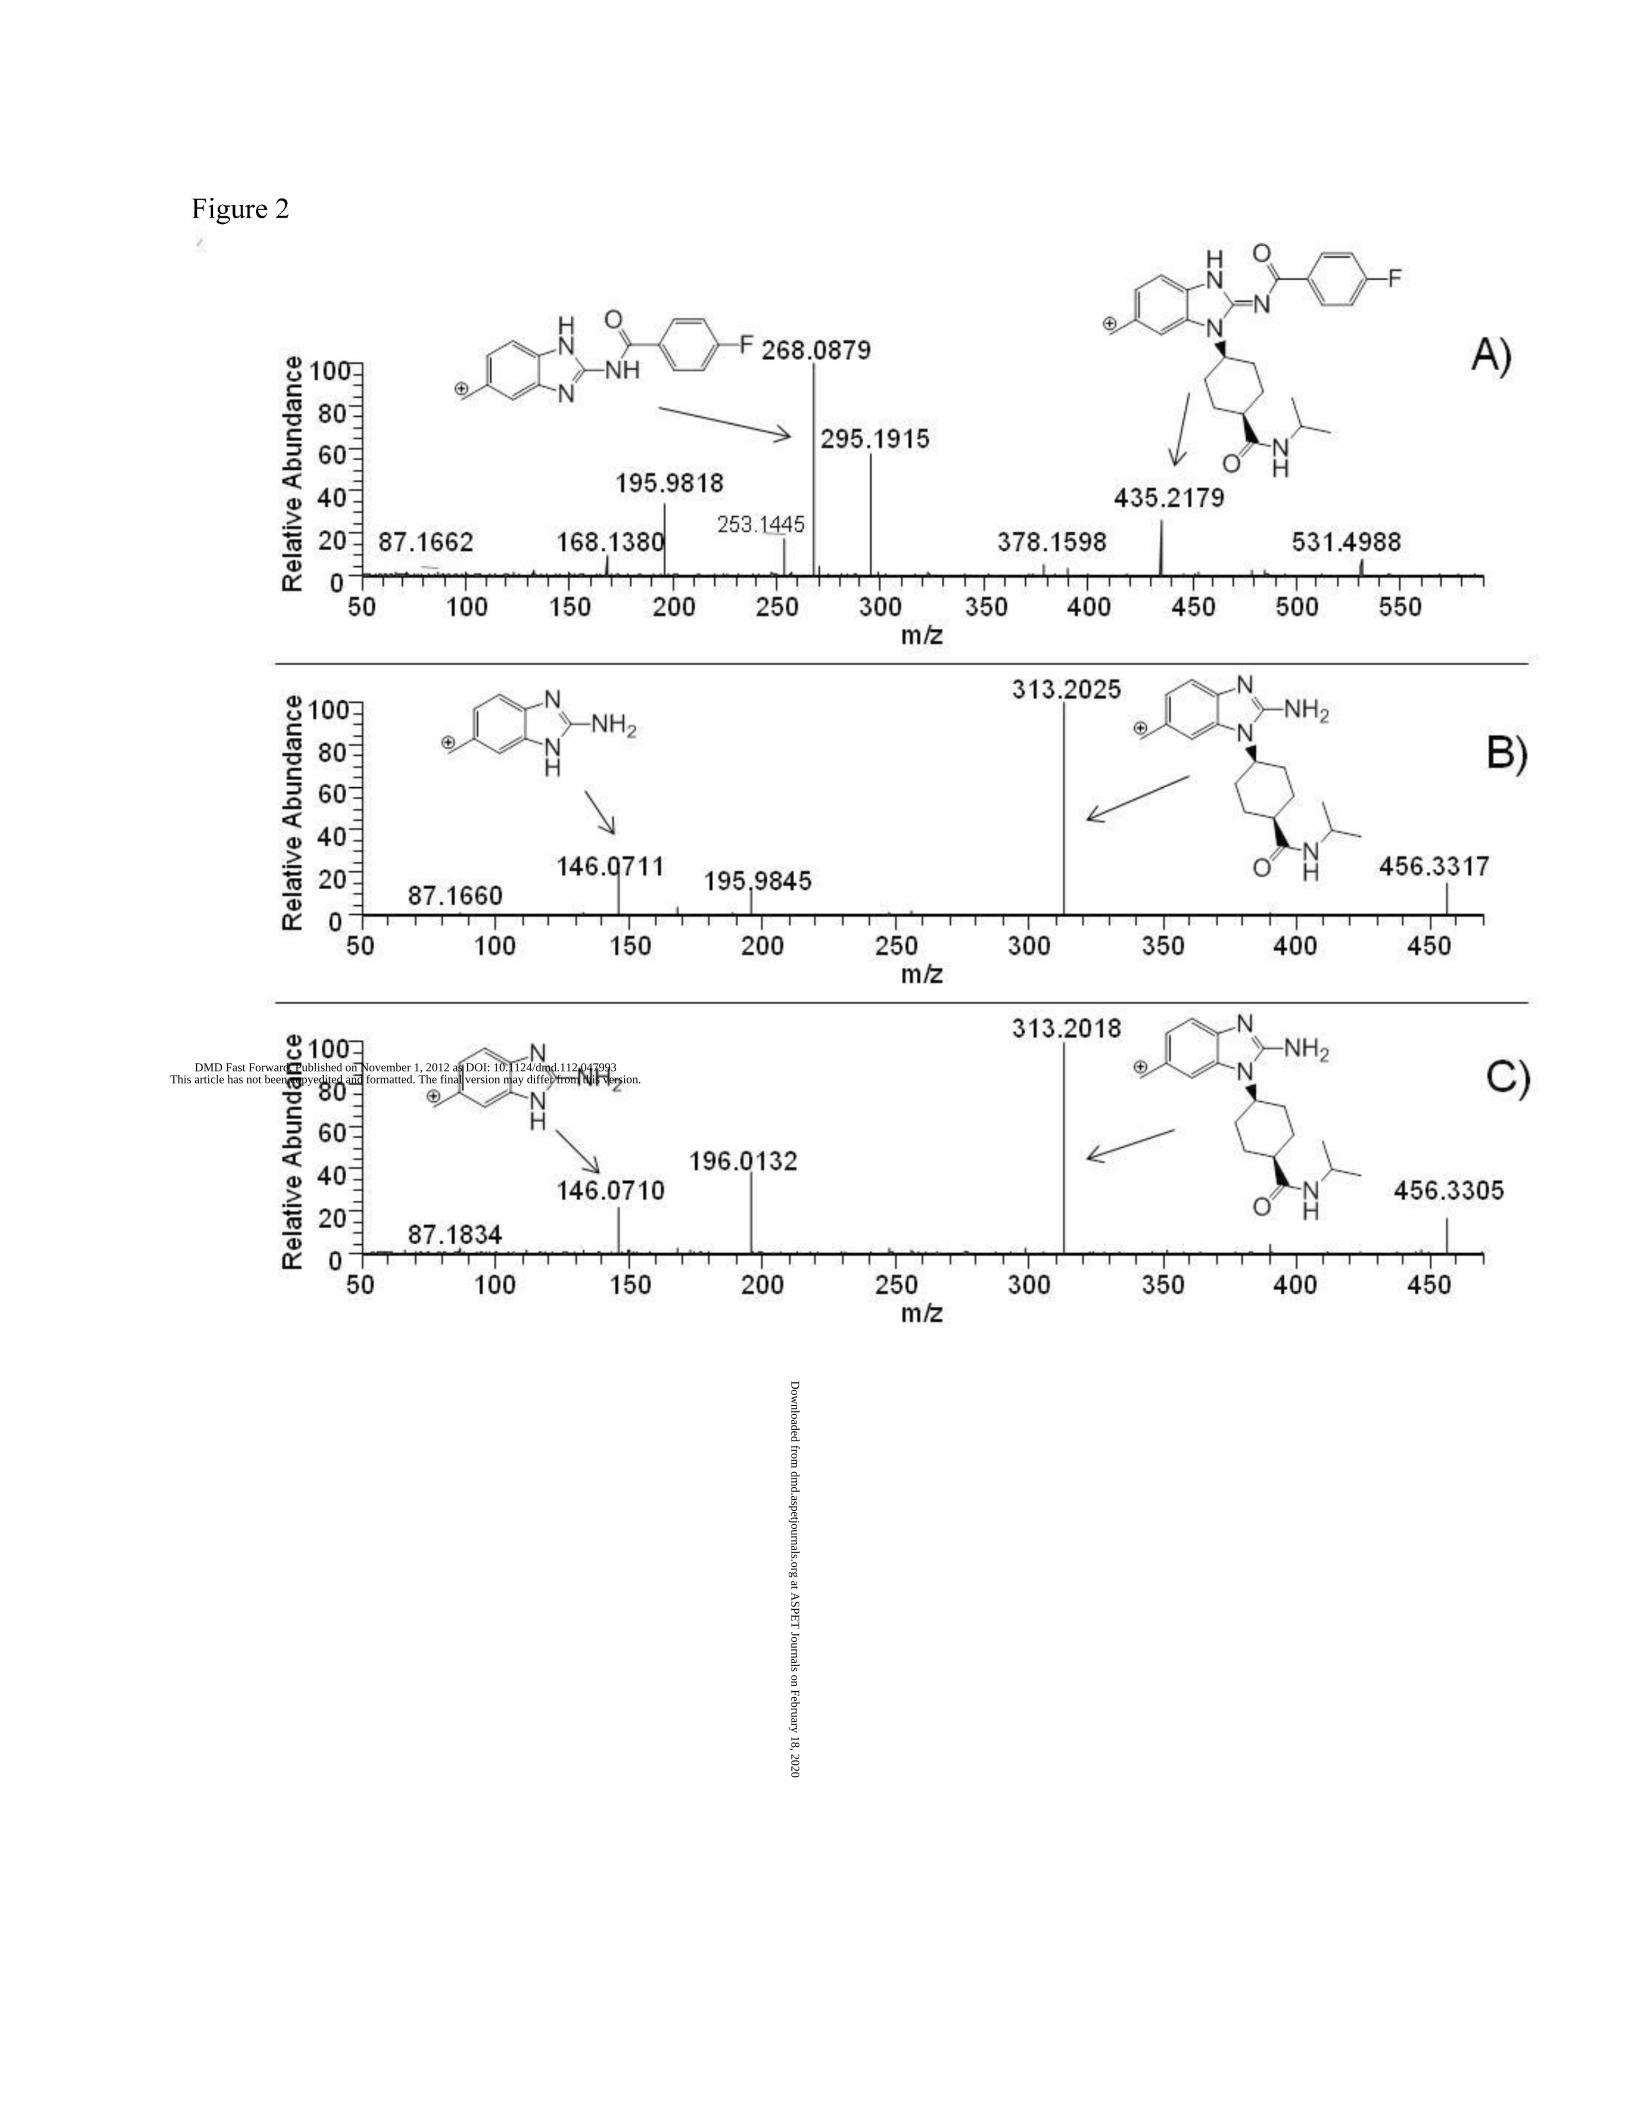
Compound 1 Studies. As a prelude to conducting murine efficacy studies, we investigated
the PK disposition of compound 1 in mice. During analysis, it was discovered that compound 1
rapidly degraded in plasma. Figure 1 shows the chromatogram of mouse plasma incubated
with 5 μM compound 1 at 37 0C for 20 min. The major degradant was identified as resulting
from hydrolysis of the benzamide moiety to release the corresponding primary amine with MH+
ion at m/z 456.3324 and the same chromatographic retention time as the chemically
synthesized authentic standard. The product ion of the MH+ ion of compound 1 shows
fragments of mass 435.2179 and 268.0879 together with the fluorobenzacyl cleavage fragments
of the MH+ ion 313.2025 and 146.0711 (Figure 2). Furthermore, the product ion spectra of M1
and the authentic standard were identical.
Since the hydrolytic reaction was facilitated by increased temperature (data not shown), a
method was developed that minimized the time from sample collection to extraction and the
exposure of the matrix to temperatures greater than 4 0C during storage and processing.
Quality control samples processed under similar conditions (see experimental) were within 20 %
of nominal concentrations across the standard curve (relative standard deviations 5%-20%). In
addition, no hydrolysis products were detected in the processed QC samples or standards.
This method was used for analysis of compound 1 in mouse plasma and a mouse IV PK study
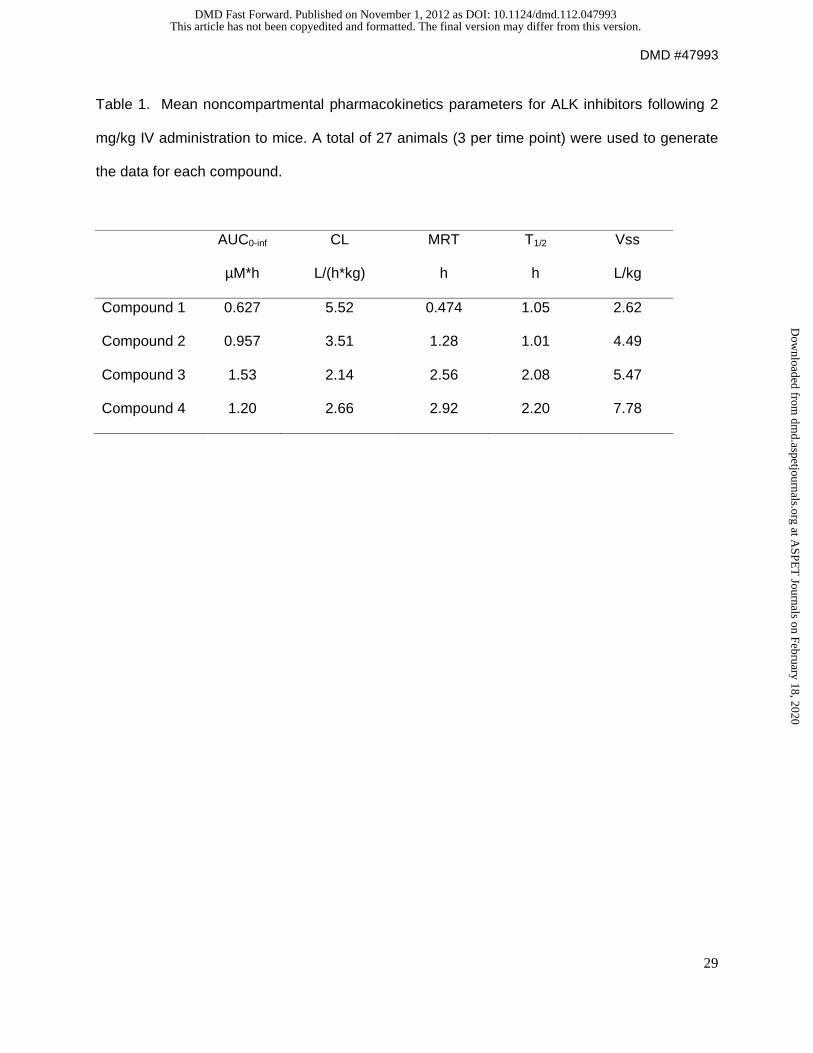
with compound 1 was conducted successfully. As shown in Table 1, compound 1 was rapidly
cleared from plasma with a half life of 1 hr and CL of 5.5 L/hr/kg. Compound 1 was stable to
incubation with rat, dog, and human plasma and liver microsomes, indicating that the observed
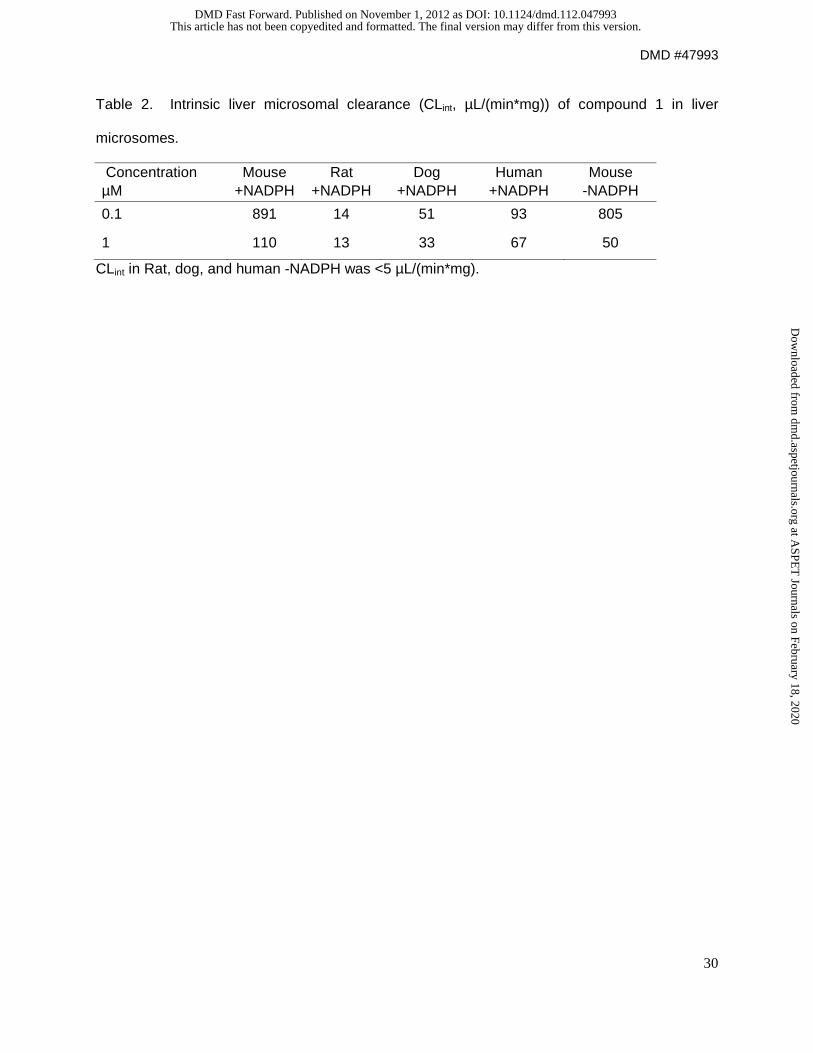
hydrolysis phenomenon was mouse specific. Table 2 shows the CLint values of compound 1 in
liver microsomes from dog, human, rat, and mouse. The mouse is clearly unique as shown by
the NADPH independent CL. To further investigate whether in vivo exposure in mice would
permit achievement of free drug concentrations approaching the in vitro ALK IC50, we
This article has not been copyedited and formatted. The final version may differ from this version.DMD Fast Forward. Published on November 1, 2012 as DOI: 10.1124/dmd.112.047993
at ASPE
T Journals on February 18, 2020
dmd.aspetjournals.org
Dow
nloaded from
DMD #47993
16
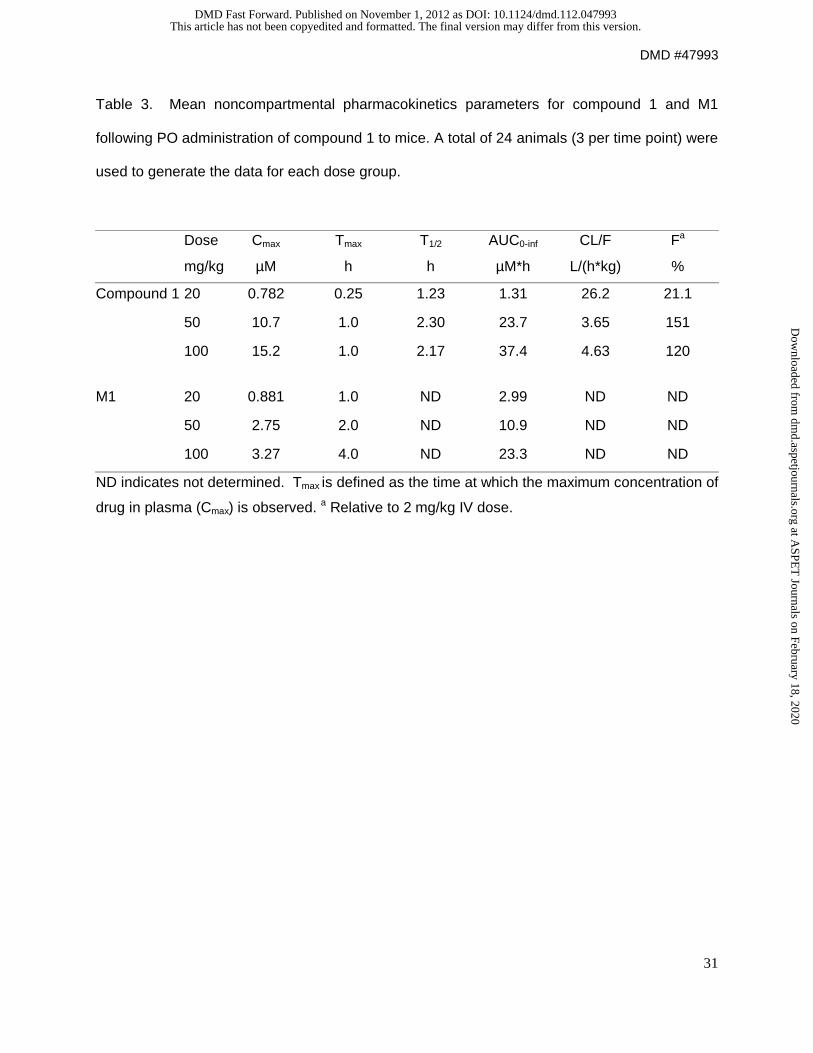
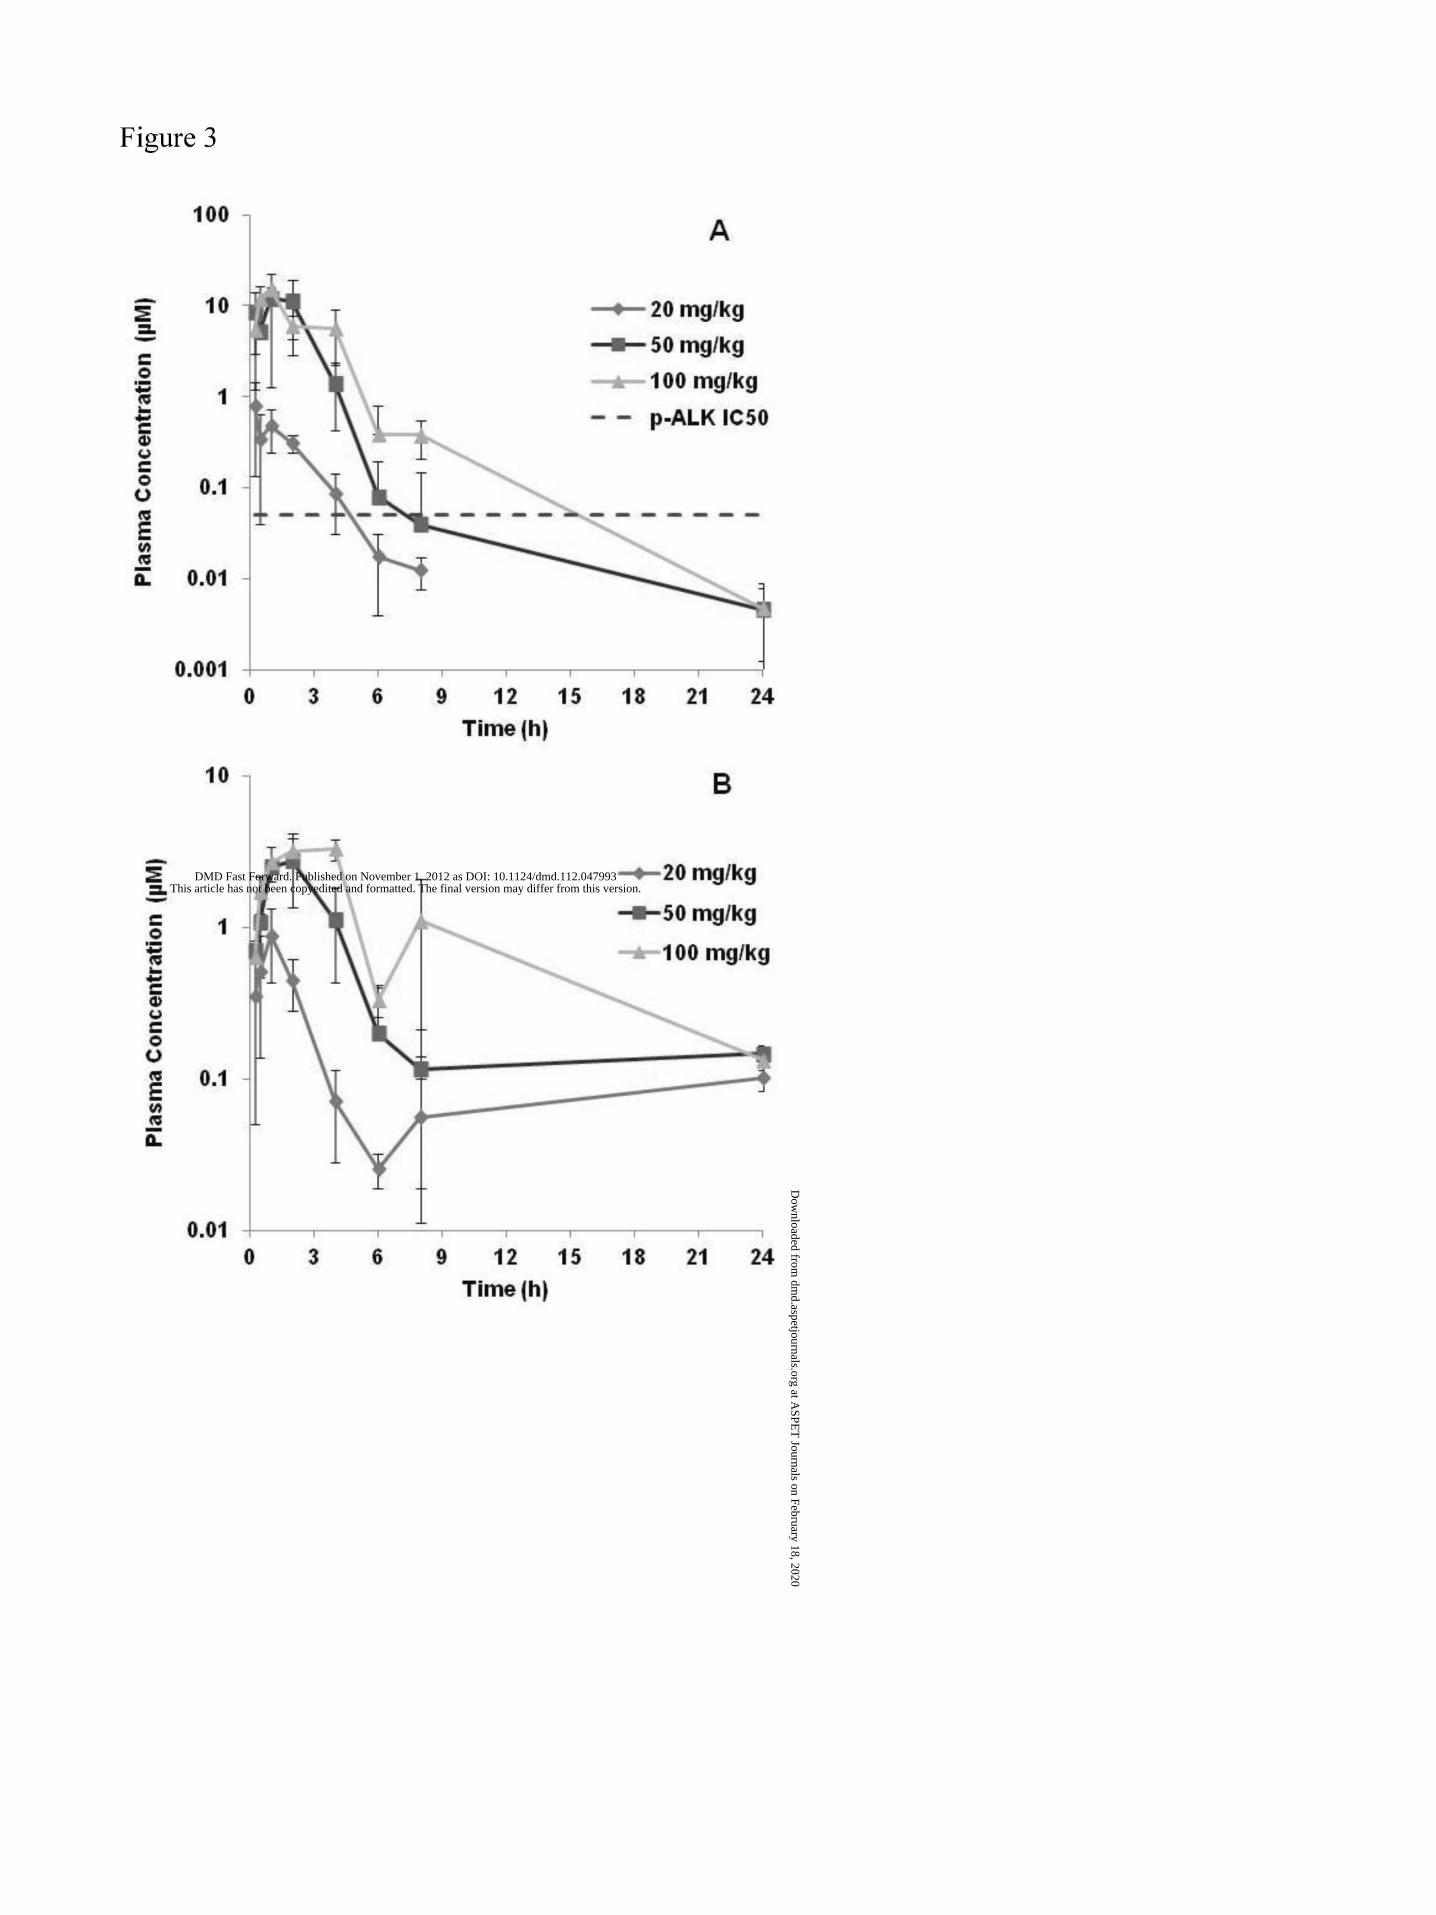
proceeded to dose mice orally at 20, 50, and 100 mpk. Figure 3 shows the plasma levels of
compound 1 and its hydrolysis product after PO dosing with 20, 50, 100 mpk. At a dose of 100
mpk, significant target coverage appeared to be achievable. It can be observed that the
exposures were not dose proportional, with a decrease in CL/F increasing with dose (Table 3).
In addition, the proportion of the exposure of hydrolysis product to compound 1 was significantly
higher at the lower doses. The data suggested saturation kinetics, and additional results and
discussion are given below. In response to the results above, the medicinal chemistry efforts
continued toward the design of compounds with attenuated hydrolysis in mouse plasma.
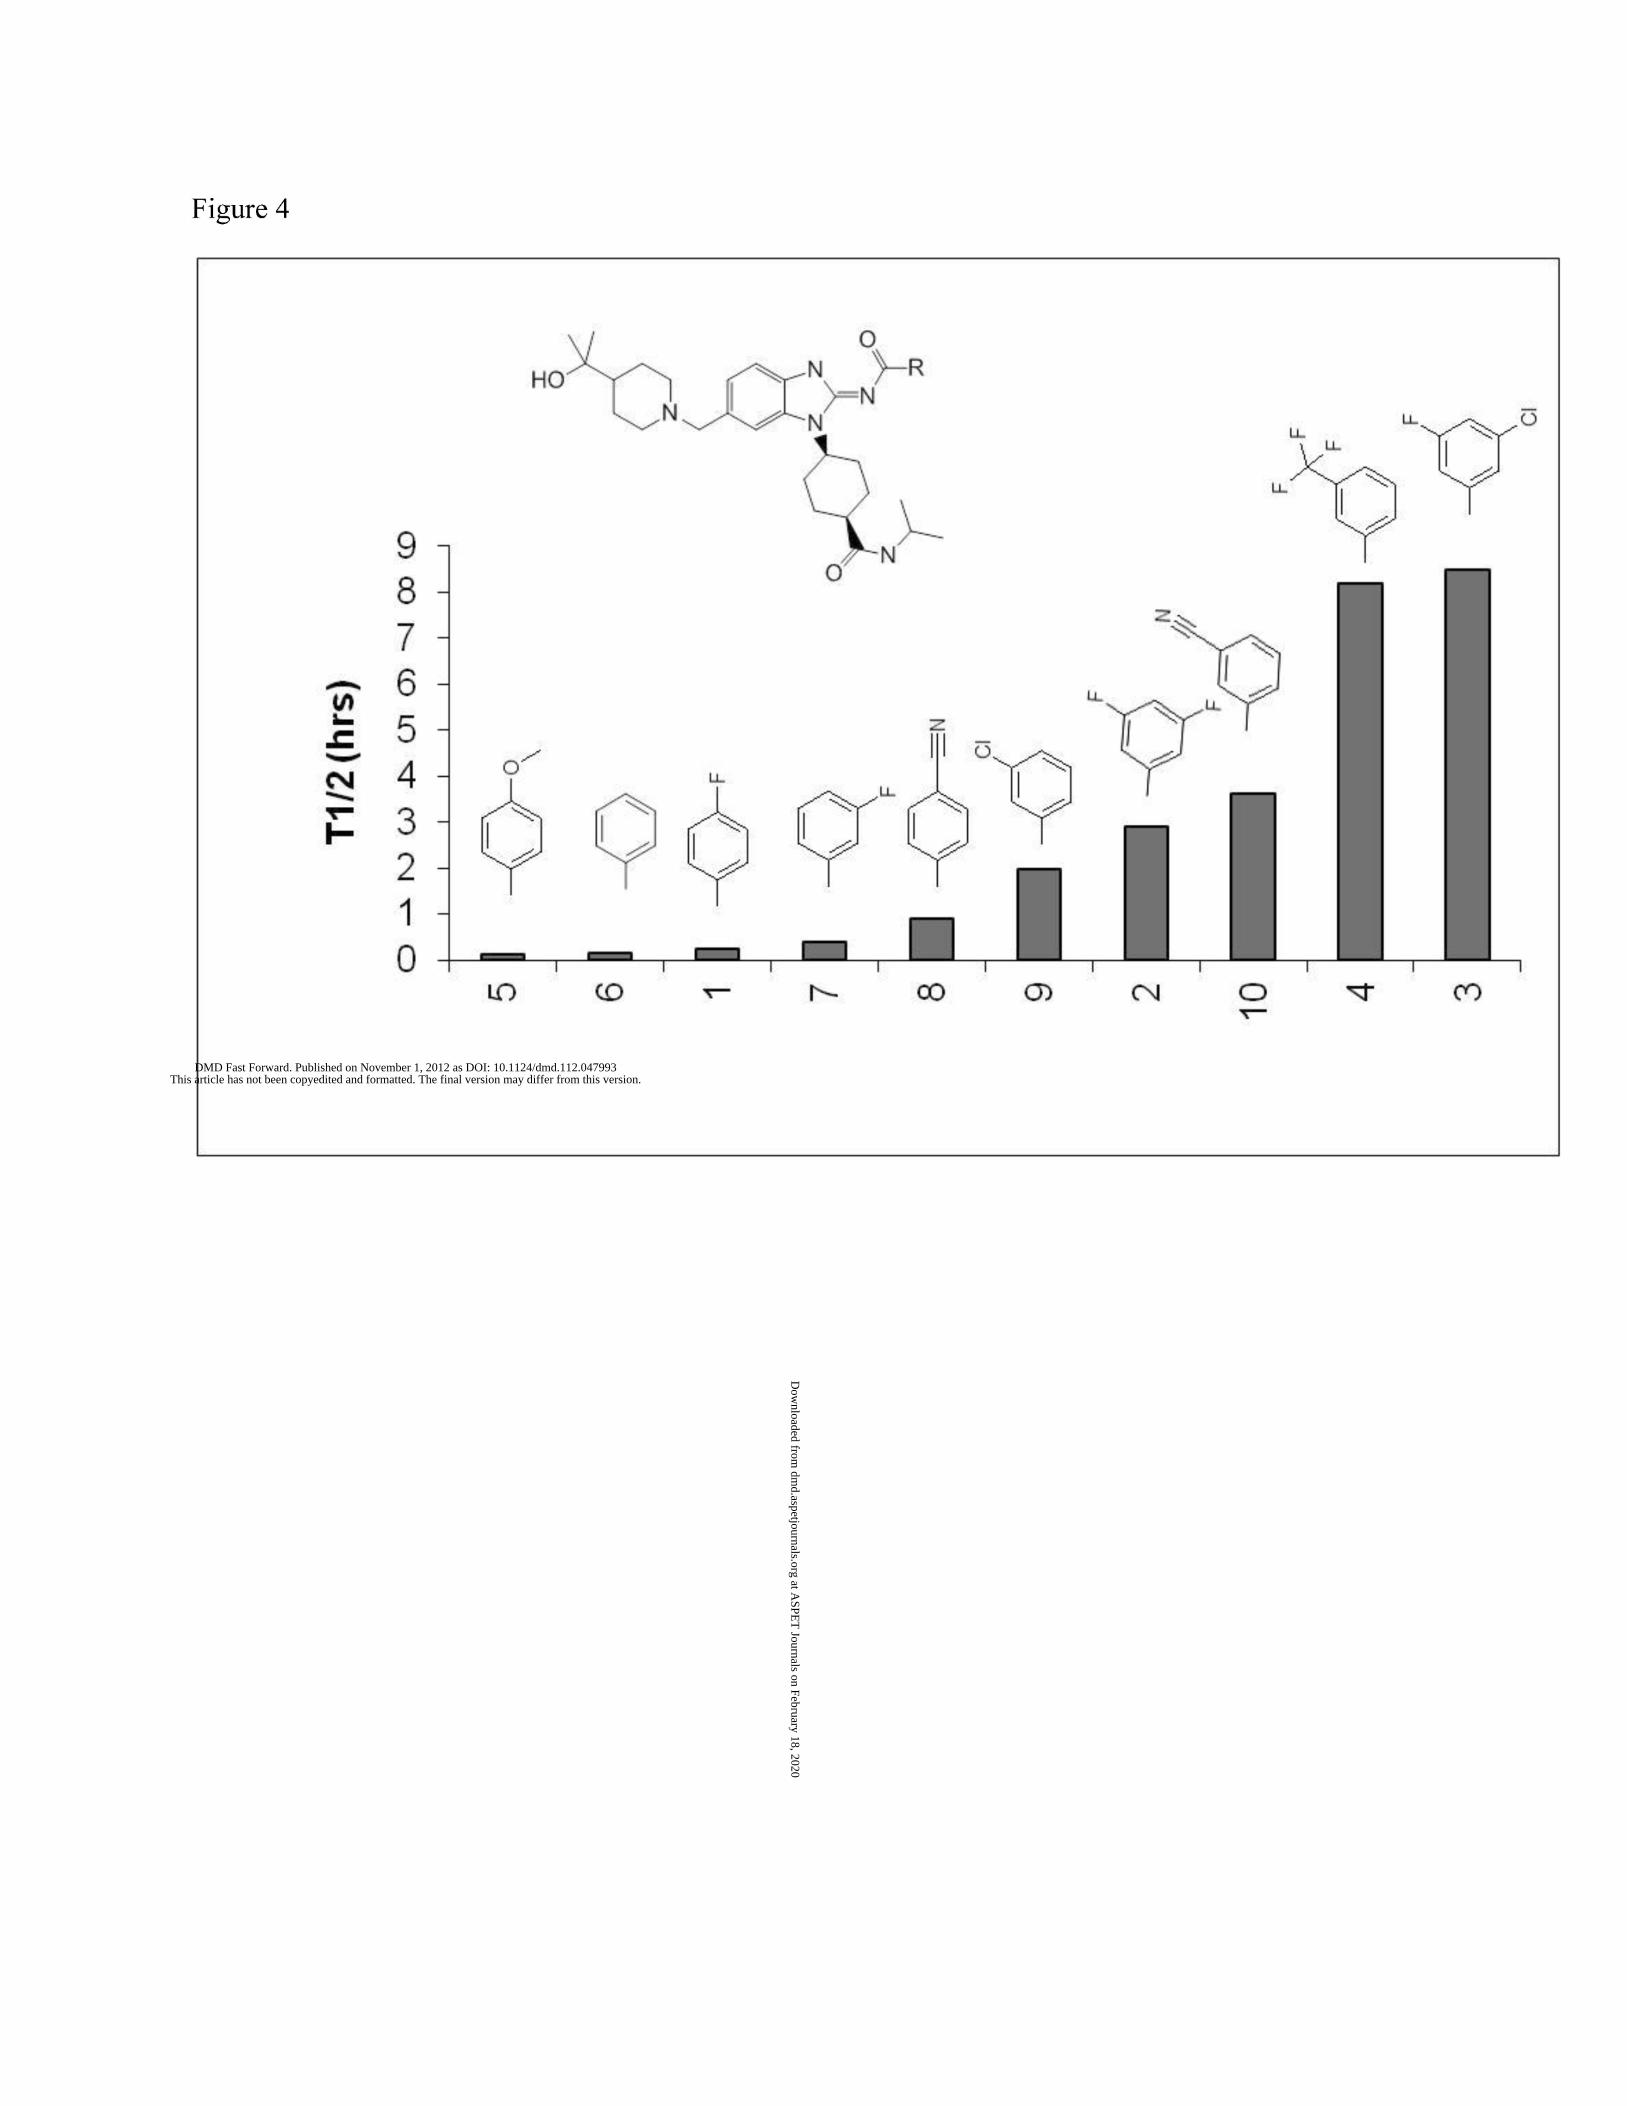
Minimizing Hydrolysis. Discovery efforts focused on minimizing hydrolysis in mouse plasma
showed that the biggest impact on mouse plasma stability was achieved by altering the nature
of the substitutuents on the benzamide ring (Figure 4). Bulky electron withdrawing groups
appear to decrease the rate while no substitution or substitution with electron donating groups
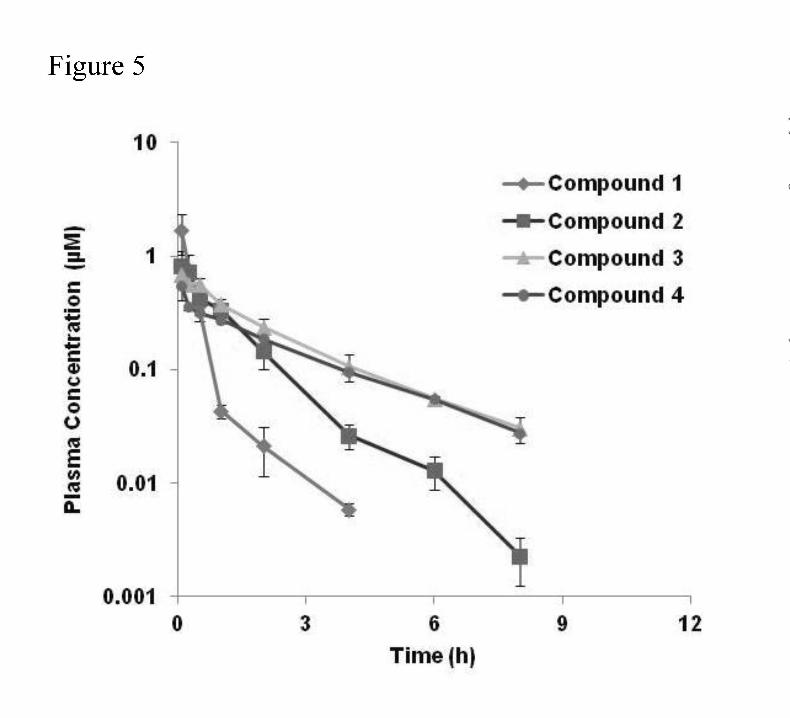
appears to increase the rate. Figure 5 shows the PK profiles of three selected compounds
(compounds 2, 3, and 4) with half-lives of 4 to 8 hrs. Compound 1 was included for comparison.
Table 1 shows the non-compartmental PK parameters of the 4 compounds. A decrease in CL
associated with increased plasma stability was observed.
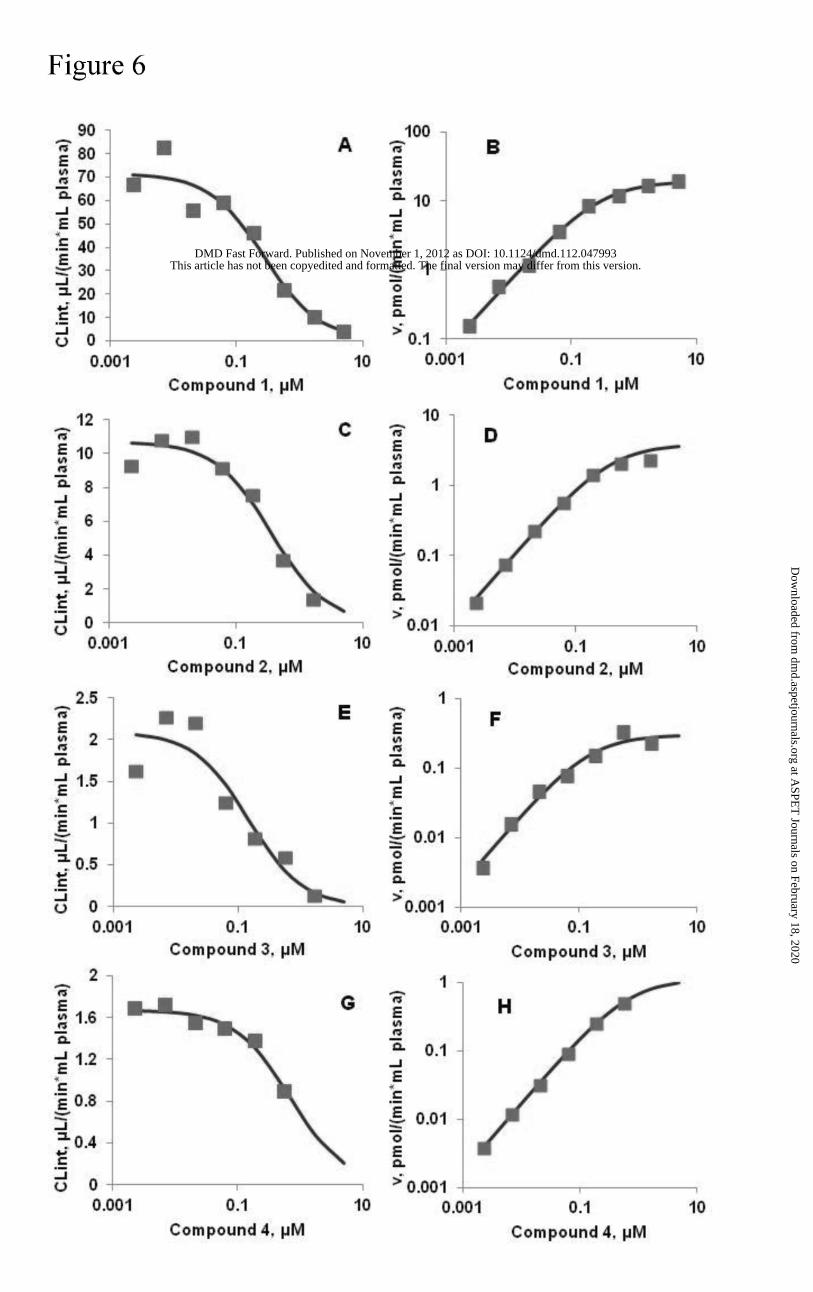
Kinetics of hydrolysis in mouse plasma. Figure 6 shows the kinetics of metabolism of
selected ALK inhibitors versus concentration in mouse plasma. The Vmax and Km values for the
hydrolysis of these compounds in mouse plasma are shown in Table 4. The Vmax for compound
1 hydrolysis in plasma was significantly higher than the other compounds while the Kms for all
were comparable and lower than 1 μM.
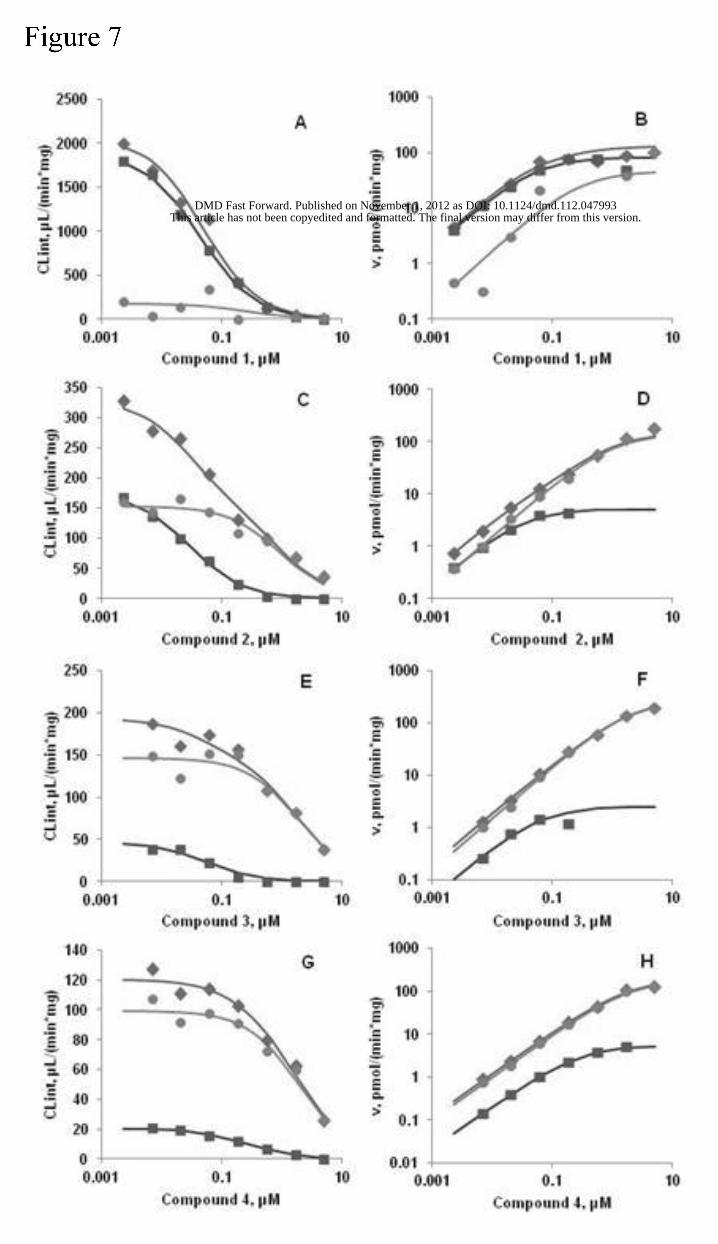
Kinetics of metabolism in mouse liver microsomes. Considering that both hydrolysis and
NADPH-dependent metabolic pathways could contribute to the elimination of these compounds,
the concentration-dependent metabolism kinetics were also determined in liver microsomes in
the absence (hydrolysis only) and presence (hydrolysis + NADPH-dependent metabolism) of
This article has not been copyedited and formatted. The final version may differ from this version.DMD Fast Forward. Published on November 1, 2012 as DOI: 10.1124/dmd.112.047993
at ASPE
T Journals on February 18, 2020
dmd.aspetjournals.org
Dow
nloaded from
DMD #47993
17
NADPH (Figure 7). The Vmax and Km values for the hydrolysis in the absence of NADPH and the
NADPH-dependent metabolism of ALK inhibitors in mouse liver microsomes are shown in Table
4. The Vmax for the hydrolysis of compound 1 is significantly higher than the other compounds
while the Km is comparable. As seen from Figure 7a, the total CLint (Hydrolysis+NADPH-
dependent) and the hydrolytic CLint for compound 1 are similar, indicating very little contribution
of oxidative CL pathways at the concentrations measured. For compounds 2, 3, and 4, the
hydrolytic CL is a progressively smaller fraction as compared to the contribution of the NADPH-
dependent pathways. The Km values for NADPH-dependent metabolism are larger than those
for the hydrolysis pathway (~6 – 30x larger), indicating that the saturation of the hydrolysis
pathway begins at lower concentrations than that of the NADPH-dependent pathways. It should
be noted that uncertainty is evident in the estimates of Vmax and Km for the NADPH-dependent
pathway for compound 1. This is because NADPH-dependent metabolism was estimated by
subtracting out the contribution of the hydrolytic pathway. Since hydrolysis accounted for the
vast majority of the metabolism (>90%) of compound 1 in NADPH-fortified liver microsomes,
only a small amount of residual activity remained from which to estimate the contribution of
NADPH-dependent metabolism. Although there is likely uncertainity in the reported data, there
is still some value in reporting them. For example, it is unlikely that the structural modification of
compound 1 to give analogs 2, 3 and 4 resulted in meaningful changes to the extent of NADPH-
dependent metabolism, as seen in the calculated CLint,max values (Table 4), Therefore, the
primary effect of chemical modification was to reduce extent of hydrolysis among these ALK
inhibitor analogs.
IVIVE. Plasma protein binding, microsomal binding, and blood to plasma ratio were
measured after inactivation of the hydrolytic enzymes with diisopropylfluorophosphate.
Recovery of drug in the presence of DFP was >80%, indicating inhibition of hydrolytic activity.
Blood to plasma concentration ratio for each compound was determined to be close to 1 (0.90-
1.02 with SD 0.02-0.19), therefore fub was taken to be equivalent to fup. Table 5 shows the
This article has not been copyedited and formatted. The final version may differ from this version.DMD Fast Forward. Published on November 1, 2012 as DOI: 10.1124/dmd.112.047993
at ASPE
T Journals on February 18, 2020
dmd.aspetjournals.org
Dow
nloaded from

DMD #47993
18
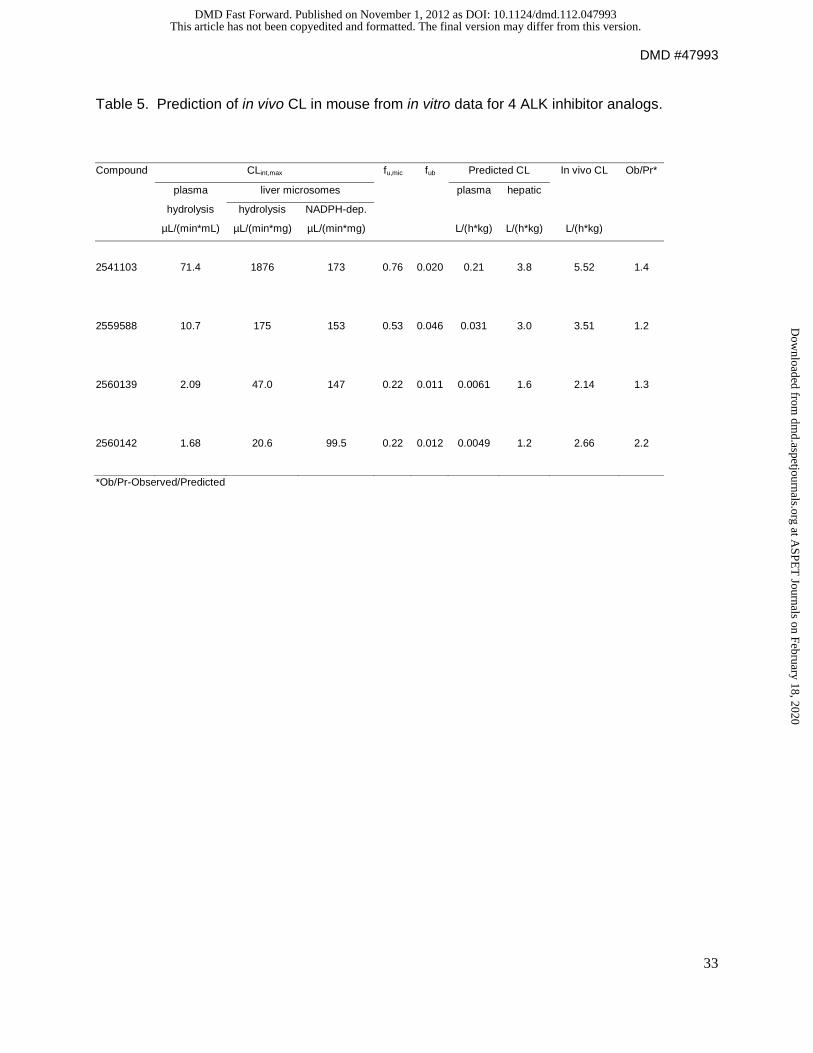
results of the predictions from in vitro data and the comparison to observed in vivo CL. Maximal
compound 1 CLint values in plasma and microsomes via hydrolysis were 71.4 µL/(min*mL) and
1876 µL/(min*mg), respectively. The maximal NADPH-dependent CLint for compound 1 was
estimated to be 173 µL/(min*mg). The predicted CL attributed to hydrolysis in plasma, which
was calculated by scaling for the total plasma volume, was 0.21 L/(h*kg). The predicted hepatic
CL was 3.8 L/(h*kg). The observed CL of compound 1 was 5.52 L/(h*kg). This indicates that
hydrolysis in the liver is likely a substantially more important contributor to CL than hydrolysis in
the plasma following an IV dose in mice, despite the short t1/2 in plasma incubations in vitro.
At low drug concentrations, compound 2 has similar CLint via hydrolysis and NADPH-
dependent metabolism 175 and 153 µL/(min*mg), respectively. The maximal CLint in plasma
was 10.7 µL/(min*mL). The predicted hepatic CL was 3.0 L/(h*kg), which was very close to the
observed CL of 3.51 L/(h*kg). The predicted CL attributed to hydrolysis in plasma was 0.031
L/hr*kg, suggesting hydrolysis in plasma contributes very little to the systemic CL.
Compounds 3 and 4 had predicted hepatic CL of 1.6 and 1.2 L/(h*kg), respectively. The
observed CL for compound 3 and 4 (2.14 and 2.16), were within approximately 2-fold of the
predicted CL. Clearance for these analogs appeared to be primarily driven by NADPH-
dependent metabolic pathways.
This article has not been copyedited and formatted. The final version may differ from this version.DMD Fast Forward. Published on November 1, 2012 as DOI: 10.1124/dmd.112.047993
at ASPE
T Journals on February 18, 2020
dmd.aspetjournals.org
Dow
nloaded from
DMD #47993
19
Discussions
Compound 1 Hydrolysis. The observation of a susceptibility to plasma hydrolysis of
compound 1 early in the drug discovery phase could have presented significant obstacles in the
progression of this class of ALK inhibitors. However, the sequence of experiments described
here quickly quantified the obstacles and allowed a rational decision regarding the progression
of compounds to the efficacy testing phase. The first problem was the stability of the compound
in plasma. This led to inability to accurately quantify the plasma levels. Modification of the
bioanalytical method to prevent hydrolysis post sample-collection enabled us to measure the
plasma levels and obtain PK parameters that correctly reflected the properties of the compound
in-vivo. The second obstacle to the progression was the possible presence or absence of the
hydrolytic cleavage pathway in other species. Experiments to address the species selectivity
showed that the enzymatic hydrolytic pathway was highly specific to mouse with no hydrolysis
observed in vitro (liver microsomes and plasma) in rat, dog, and human. Furthermore, in vivo,
the hydrolysis pathway was not detectable in the plasma of PK samples from rats and dogs.
Species specificity with regard to enzyme mediated hydrolytic cleavage is not uncommon and
has been observed for related amides (Eng et al., 2010; Hobbs and Twomey, 1981; Luan et al.,
1997; Liu et al., 2011; Martin et al. 1997; Potts et al., 1989). High CL due to hydrolysis in
mouse was problematic because of the desire to use readily available immune-compromised
animals for the evaluation of in vivo efficacy in xenograft models of disease. Examining the PO
PK closely showed a saturation of elimination as exemplified by the disproportional increase in
exposure and the increase in bioavailability between the two lowest dose groups. Furthermore,
the ratio of M1 exposure relative to compound 1 decreased with increased dose suggesting that
the hydrolytic pathway was saturation limited. Metabolite M1 was also tested for activity in our
ALK inhibition assays and showed no potency. Exposures levels achieved in the mice used in
disease efficacy models were similar to those observed in the PK studies and full data will be
This article has not been copyedited and formatted. The final version may differ from this version.DMD Fast Forward. Published on November 1, 2012 as DOI: 10.1124/dmd.112.047993
at ASPE
T Journals on February 18, 2020
dmd.aspetjournals.org
Dow
nloaded from
DMD #47993
20
presented in a communication describing the evaluation of compound 1 in mouse xenograft
models.
Minimizing Hydrolysis. The medicinal chemistry efforts attempted to design potent
analogs with reduced hydrolytic potential. Minimizing enzyme mediated hydrolytic cleavage via
changes to the substitution patterns of a benzamide moiety has been described by Douch and
Gahagan in the metabolism of niclosamine (Douch and Gahagan, 1977). Their work showed
that substituents ortho to the benzamide bond substantially decreased hydrolytic potential.
Although this decrease in hydrolysis was attributed to steric hindrance, electronic effects may
also be implicated since substantial decrease in hydrolysis may also be achieved by para
substitution (Testa and Mayer, 2003). In the case of the ALK inhibitors described here, ortho
substitution was not tolerated, most probably due to the distortion of the co-planar conformation
which was required for an optimum interaction with the ALK protein (Lewis et al., 2012). Studies
of meta or para substitution on the benzamide moiety demonstrated clear SAR. Di-substitutions
and bulkier electronegative groups decreased the rate of hydrolysis. Unfortunately, the ALK-cell
potencies of the most hydrolytically stable compounds decreased significantly relative to the
less stable analogs. For example, the cell potencies of the compounds 1, 2, 3 and 4 were 4 nM,
6 nM, 333 nM, and 90 nM, respectively. The in vitro plasma t1/2 for these same compounds
(from Fig 3), compound 1, 2, 3, and 4 were 0.2 hr, 2.9 hr, 8.2 hr, and 8.5 hr respectively. The IV
PK of the compounds with minimized hydrolysis showed decreased CL and better exposures.
The decrease in systemic CL exhibited by hydrolytically stable compounds suggested that the in
vitro stability in plasma qualitatively related to the in vivo exposure. This led us to investigate
the IVIVE relationship to learn if in vitro experimental results could quantitatively predict CL
when hydrolysis contributes to elimination.
IVIVE. In our IVIVE experiments several features were notable. First, in initial
experiments, it was found that the mouse microsomal CLint of compound 1 at 0.01 µM was
significantly higher than that at 1 µM; 898 µL/(min*mg) versus 110 µL/(min*mg). This suggested
This article has not been copyedited and formatted. The final version may differ from this version.DMD Fast Forward. Published on November 1, 2012 as DOI: 10.1124/dmd.112.047993
at ASPE
T Journals on February 18, 2020
dmd.aspetjournals.org
Dow
nloaded from
DMD #47993
21
that the hydrolytic pathway possessed a very low Km and therefore experiments at 1 µM could
dramatically under predict the in vivo CL observed following a low IV dose. Indeed, more
detailed experiments revealed that the Kms of the hydrolytic reaction for all the ALK inhibitors
cited in this work (obtained using the substrate depletion method at concentrations starting at
single nanomolar levels) were far below 1 µM, a default concentration often used in depletion
experiments reported in the literature (e.g. Hallifax et al., 2010; Liu et al., 2011). Therefore it can
be concluded that arbitrarily choosing a single substrate concentration might not always
produce CLint values that can be used for reasonable in vivo prediction. Further investigation of
saturation kinetics is recommended.
Secondly, since these ALK inhibitors were also hydrolyzed in mouse plasma, in vitro
plasma CLint values were also experimentally obtained. The CLint values in plasma were
calculated using a similar approach to the microsomal work. The results show that the
contribution of plasma hydrolysis to the overall CL is likely minor even for the compounds with
the shortest plasma half-lives. This illustrates the potential pitfalls of following only rates of
plasma hydrolysis to screen compounds for stability. Rowland and Riegleman (Rowland and
Riegleman,1968) have also elegantly demonstrated the relatively minor contribution of
hydrolysis in blood to the total CL of acetylsalicylic acid via hydrolysis to salicylic acid. It seems
that half-life determinations in plasma (or blood) can potentially be used help detect the
presence of a hydrolysis mechanism but it should not be automatically inferred that plasma (or
blood) is the main tissue responsible for elimination, even for compounds with short half-lives in
plasma (or blood) in vitro. Subsequent scaling exercises, however, using in vitro half-life data
and appropriate scaling factors can help estimate the contribution of hydrolysis in plasma to CL
relative to the contribution of elimination or metabolism by other organs.
Thirdly, for microsomal CLint experiments in mouse, both hydrolysis and NADPH-
dependent metabolic pathways were considered. Metabolite identification clearly showed that
the only metabolite formed in microsomes in the absence of NADPH was the hydrolysis product.
This article has not been copyedited and formatted. The final version may differ from this version.DMD Fast Forward. Published on November 1, 2012 as DOI: 10.1124/dmd.112.047993
at ASPE
T Journals on February 18, 2020
dmd.aspetjournals.org
Dow
nloaded from

DMD #47993
22
Obach and Reed-Hagen (2002) have shown that measurement of Km and Vmax by the substrate
depletion method gives similar results as those obtained by conventional formation kinetics. In
our work, the CLint from the incubation in the absence of NADPH was considered to be due to
hydrolytic CL and the difference between the +NADPH and -NADPH CL values was attributed
to NADPH-dependent (e.g. P450 mediated) reactions. There was good agreement between the
predicted and the actual CL values for the compounds (~2-fold or less), with a slight trend
toward underprediction of CL. Underprediction of systemic CL has been widely reported by
others investigating IVIVE with liver microsomes or hepatocytes (e.g. Hallifax et al., 2010).
Explanations for the phenomenon have been proposed, including reduced (or a lack of) enzyme
activity in various in vitro preparations compared to in vivo, study designs that do not consider
saturation kinetics, metabolism by organs other than the liver, passive renal or hepatic
elimination, impact of hepatic uptake transporters, and elimination by active transport.
Conclusive explanations for lack of predictive IVIVE are rarely provided. For compounds that
are hydrolyzed by esterases, metabolism in extrahepatic tissues could likely be a major reason
for under prediction, since hydrolytic enzymes are present throughout the body. In the present
example, contrary to expectations, hydrolysis in plasma appeared to contribute little to systemic
CL, and consideration of hepatic metabolism alone was sufficient to achieve a reasonable
prediction of CL. However, the possibility of some relatively minor contribution to CL by other
tissues cannot be ruled out.
In summary, in vitro kinetic and in vivo PK studies indicated that the primary CL pathway
of compound 1 in mouse, amide hydrolysis, was saturation limited, and that plasma levels of
free drug exceeding in-vitro IC50 were achievable at higher doses. Reducing the extent of
hydrolysis was possible through chemical modification of the compound 1 structure leading to
compound 2 with better exposure at lower doses. Compound 2 has substantial efficacy in a
murine xenograft model of ALK driven cancer (Lewis et al, 2012). Rendering this chemotype
more stable to hydrolysis was associated with significant loss in potency against ALK in vitro.
This article has not been copyedited and formatted. The final version may differ from this version.DMD Fast Forward. Published on November 1, 2012 as DOI: 10.1124/dmd.112.047993
at ASPE
T Journals on February 18, 2020
dmd.aspetjournals.org
Dow
nloaded from

DMD #47993
23
Finally, from the prediction results it can be concluded that IVIVE methods can be used to
predict hydrolytically mediated CL, provided that the in vitro assays thoroughly investigate the
processes, including the contribution of other metabolic pathways and the possibility of
saturation kinetics.
This article has not been copyedited and formatted. The final version may differ from this version.DMD Fast Forward. Published on November 1, 2012 as DOI: 10.1124/dmd.112.047993
at ASPE
T Journals on February 18, 2020
dmd.aspetjournals.org
Dow
nloaded from
DMD #47993
24
Acknowledgments
We thank Adria Colletti, Meghan Canfield and John Roberts for conducting the in vivo
procedures.
Authorship Contributions
Participated in research design: Teffera, Lewis, Brake, Saffran, and Zhao
Conducted experiments: Moore, Liu, and Berry
Performed data analysis: Teffera, Berry, Moore, and Liu
Wrote or contributed to the writing of the manuscript: Teffera, Lewis, Berry, and Zhao
This article has not been copyedited and formatted. The final version may differ from this version.DMD Fast Forward. Published on November 1, 2012 as DOI: 10.1124/dmd.112.047993
at ASPE
T Journals on February 18, 2020
dmd.aspetjournals.org
Dow
nloaded from

DMD #47993
25
References
Davies B and Morris T (1993) Physiological parameters in laboratory animals and humans
Pharm Res 10:1093-5
Douch PG and Gahagan HM (1977) The metabolism of niclosamide and related compounds by
Moniezia expansa, Ascaris lumbricoides var suum, and mouse- and sheep-liver enzymes.
Xenobiotica 7: 301-307.
Eng H, Niosi M, McDonald TS, Wolford A, Chen Y, Simila ST, Bauman JN, Warmus J, and
Kalgutkar AS (2010) Utility of the carboxylesterase inhibitor bis-para-
nitrophenylphosphate(BNPP) in the plasma unbound fraction determination for a
hydrolytically unstable amide derivative and agonist of the TGR5 receptor. Xenobiotica
40:369–380.
George RE, Sanda T, Hanna M, Froehling S, Luther W II, Zhang J, Ahn Y, Zhou W, London
WB, McGrady P, Xue L, Zozulya S, Gregor VE, Webb TR, Gray NS, Gilliland DG, Diller L,
Greulich H, Morris SW, Meyerson M, and Look A (2008) Activating mutations in ALK provide
a therapeutic target in neuroblastoma. Nature 455: 975-978.
Hallifax D, Foster JA, and Houston JB (2010) Prediction of human metabolic clearance from in
vitro systems: retrospective analysis and prospective view. Pharm Res 27:2150-2161.
Hobbs DC, Twomey TM (1981) Metabolism of piroxicam by laboratory animals. Drug Metab
Dispos 9:114-118.
Houston JB, Galetin A (2008) Methods for predicting in vivo pharmacokinetics using data from
in vitro assays. Curr Drug Metab 9:940-951.
Keenaghan JB, Boyes RN (1972) The tissue distribution, metabolism, and excretion of lidocaine
in rats, guinea pigs, dogs, and man. J Pharmacol Exp Ther 18:454-461
Lewis RT, Bode CM, Choquette D, Potashman M, Romero K, Stellwagen JC, Teffera Y, Moore
E, Whittington DA, Chen H, Epstein LF, Emkey R, Andrews PS, Yu V, Saffran DC, Xu M,
Drew AE, Merkel P, Szilvassy S, and Brake RL (2012) The discovery and optimization of a
This article has not been copyedited and formatted. The final version may differ from this version.DMD Fast Forward. Published on November 1, 2012 as DOI: 10.1124/dmd.112.047993
at ASPE
T Journals on February 18, 2020
dmd.aspetjournals.org
Dow
nloaded from
DMD #47993
26
novel class of potent, selective and orally bioavailable Anaplastic Lymphoma Kinase (ALK)
Inhibitors with potential utility for the treatment of cancer. J Med Chem 55:6523–6540
Liu L, Halladay JS, Shin Y, Wong S, Coraggio M, La H, Baumgardner M, Le H, Gopaul S,
Boggs J, Kuebler P, Davis JC Jr, Liao XC, Lubach JW, Deese A, Sowell CG, Currie KS,
Young WB, Khojasteh SC, Hop CE, and Wong H (2011) Significant species difference in
amide hydrolysis of GDC-0834, a novel potent and selective Bruton's tyrosine kinase
inhibitor. Drug, Metab Dispos 39:1840–1849.
Luan L, Sugiyama T, Takai S, Usami Y, Adachi T, Katagari Y, and Hirano K (1997) Purification
of and Characterization of Pranlukasat Hydrolase from Rat Liver Microsomes: The
Hydrolase is Identical to Carboxylesteras pI 6.2. Biol Pharm Bull 20:71-75.
Martin SW, Bishop FE, Kerr BM, Moor M, Moore M, Sheffeels P, Rashed M, Slatter JG,
Berthon-Cedille L, Lepage F, Descombe J-J, Picard M, Baillie TA, and Levy RH, (1997)
Pharmackinetics and Metabolism of the Novel anticonvulsant agent N-(2,6-dimethylphenyl)-
5-methyl-3-isoxazolecarboxamide (D2624) in rats and humans. Drug Metab Dispos 25: 40-
46.
Morris SW, Kirstein MN, Valentine MB, Dittmer KG, Shapiro DN, Saltman DL, and Look AT
(1994) Fusion of a kinase gene, ALK, to a nucleolar protein gene, NPM, in Non-Hodgkin’s
lymphoma. Science 263: 1281-1284
Obach RS and Reed-Hagen AE (2002) Measurement of Michaelis constants for cytochrome
P450-mediated biotransformation reactions using a substrate depletion approach. Drug
Metab Dispos 30: 831-7
Potts BD, Gabriel S, and Parli CJ (1989) Metabolism, disposition, and pharmacokinetics of a
potent anticonvulsant, 4-amino-N-(2,6-dimethylphenyl)benzamide (LY201116), in rats. Drug
Metab Dispos 17: 656-661
Rowland M and Riegelman S (1968) Pharmacokinetics of acetylsalicylic acid and salicylic acid
after intravenous administration in man. J Pharm Sci 57:1313–1319
This article has not been copyedited and formatted. The final version may differ from this version.DMD Fast Forward. Published on November 1, 2012 as DOI: 10.1124/dmd.112.047993
at ASPE
T Journals on February 18, 2020
dmd.aspetjournals.org
Dow
nloaded from
DMD #47993
27
Shaw AT, Yasothan U, and Kirkpatrick P (2011) Crizotinib. Nature Reviews Drug Discovery 10:
897-898
Soda M, Choi Y, Enomoto M, Takada S, Yamashita Y, Ishikawa S, Fujiwara S-I., Watanabe H,
Kurashina K, Hatanaka H, Bando M, Ohno S, Ishikawa Y, Aburatani H, Niki T, Sohara Y,
Sugiyama Y, and Mano H (2007) Identification of the transforming EML4–ALK fusion gene
in non-small-cell lung cancer. Nature 448: 561-566.
Testa B and Mayer JM (2003) Hydrolysis in Drug and Prodrug Metabolism: Chemistry,
Biochemistry, and Enzymology, 1st ed, Wiley-VCH, Weinheim, Germany
Uetrecht JP and Trager W (2007) Drug Metabolism: Chemical and Enzymatic Aspects, 1st ed,
Informa Healthcare, New York.
This article has not been copyedited and formatted. The final version may differ from this version.DMD Fast Forward. Published on November 1, 2012 as DOI: 10.1124/dmd.112.047993
at ASPE
T Journals on February 18, 2020
dmd.aspetjournals.org
Dow
nloaded from
DMD #47993
28
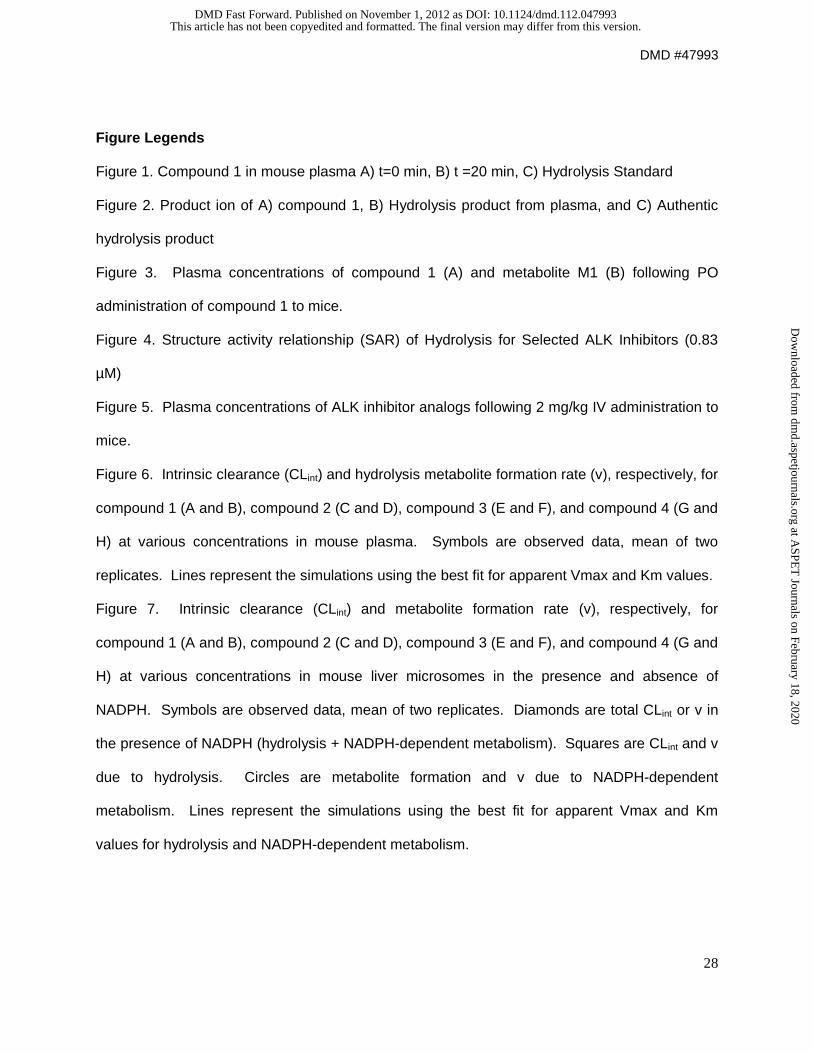
Figure Legends
Figure 1. Compound 1 in mouse plasma A) t=0 min, B) t =20 min, C) Hydrolysis Standard
Figure 2. Product ion of A) compound 1, B) Hydrolysis product from plasma, and C) Authentic
hydrolysis product
Figure 3. Plasma concentrations of compound 1 (A) and metabolite M1 (B) following PO
administration of compound 1 to mice.
Figure 4. Structure activity relationship (SAR) of Hydrolysis for Selected ALK Inhibitors (0.83
µM)
Figure 5. Plasma concentrations of ALK inhibitor analogs following 2 mg/kg IV administration to
mice.
Figure 6. Intrinsic clearance (CLint) and hydrolysis metabolite formation rate (v), respectively, for
compound 1 (A and B), compound 2 (C and D), compound 3 (E and F), and compound 4 (G and
H) at various concentrations in mouse plasma. Symbols are observed data, mean of two
replicates. Lines represent the simulations using the best fit for apparent Vmax and Km values.
Figure 7. Intrinsic clearance (CLint) and metabolite formation rate (v), respectively, for
compound 1 (A and B), compound 2 (C and D), compound 3 (E and F), and compound 4 (G and
H) at various concentrations in mouse liver microsomes in the presence and absence of
NADPH. Symbols are observed data, mean of two replicates. Diamonds are total CLint or v in
the presence of NADPH (hydrolysis + NADPH-dependent metabolism). Squares are CLint and v
due to hydrolysis. Circles are metabolite formation and v due to NADPH-dependent
metabolism. Lines represent the simulations using the best fit for apparent Vmax and Km
values for hydrolysis and NADPH-dependent metabolism.
This article has not been copyedited and formatted. The final version may differ from this version.DMD Fast Forward. Published on November 1, 2012 as DOI: 10.1124/dmd.112.047993
at ASPE
T Journals on February 18, 2020
dmd.aspetjournals.org
Dow
nloaded from
DMD #47993
29
Table 1. Mean noncompartmental pharmacokinetics parameters for ALK inhibitors following 2
mg/kg IV administration to mice. A total of 27 animals (3 per time point) were used to generate
the data for each compound.
AUC0-inf CL MRT T1/2 Vss
µM*h L/(h*kg) h h L/kg
Compound 1 0.627 5.52 0.474 1.05 2.62
Compound 2 0.957 3.51 1.28 1.01 4.49
Compound 3 1.53 2.14 2.56 2.08 5.47
Compound 4 1.20 2.66 2.92 2.20 7.78
This article has not been copyedited and formatted. The final version may differ from this version.DMD Fast Forward. Published on November 1, 2012 as DOI: 10.1124/dmd.112.047993
at ASPE
T Journals on February 18, 2020
dmd.aspetjournals.org
Dow
nloaded from
DMD #47993
30
Table 2. Intrinsic liver microsomal clearance (CLint, µL/(min*mg)) of compound 1 in liver
microsomes.
Concentration Mouse Rat Dog Human Mouse µM +NADPH +NADPH +NADPH +NADPH -NADPH
0.1 891 14 51 93 805
1 110 13 33 67 50
CLint in Rat, dog, and human -NADPH was <5 µL/(min*mg).
This article has not been copyedited and formatted. The final version may differ from this version.DMD Fast Forward. Published on November 1, 2012 as DOI: 10.1124/dmd.112.047993
at ASPE
T Journals on February 18, 2020
dmd.aspetjournals.org
Dow
nloaded from
DMD #47993
31
Table 3. Mean noncompartmental pharmacokinetics parameters for compound 1 and M1
following PO administration of compound 1 to mice. A total of 24 animals (3 per time point) were
used to generate the data for each dose group.
Dose Cmax Tmax T1/2 AUC0-inf CL/F Fa
mg/kg µM h h µM*h L/(h*kg) %
Compound 1 20 0.782 0.25 1.23 1.31 26.2 21.1
50 10.7 1.0 2.30 23.7 3.65 151
100 15.2 1.0 2.17 37.4 4.63 120
M1 20 0.881 1.0 ND 2.99 ND ND
50 2.75 2.0 ND 10.9 ND ND
100 3.27 4.0 ND 23.3 ND ND
ND indicates not determined. Tmax is defined as the time at which the maximum concentration of
drug in plasma (Cmax) is observed. a Relative to 2 mg/kg IV dose.
This article has not been copyedited and formatted. The final version may differ from this version.DMD Fast Forward. Published on November 1, 2012 as DOI: 10.1124/dmd.112.047993
at ASPE
T Journals on February 18, 2020
dmd.aspetjournals.org
Dow
nloaded from

DMD #47993
32
Table 4. Apparent Vmax and Km values ± S.D. for hydrolysis or NADPH-dependent metabolism
of the test compounds in mouse plasma or mouse liver microsomes.
Compound Plasma Liver Microsomes
Hydrolysis Hydrolysis NADPH-dependent metabolism
Vmax
pmol/(min*mL)
Km
µM
Vmax
pmol/(min*mg)
Km
µM
Vmax
pmol/(min*mg)
Km
µM
Compound 1 19.7 ± 5.6 0.276 ± 0.088 82.0 ± 6.0 0.0437 ± 0.0038 45.4 ± 82.6a 0.263 ± 0.532a
Compound 2 3.81 ± 0.85 0.357 ± 0.088
5.12 ± 0.43 0.0292 ± 0.0031
143 ± 38 0.936 ± 0.268
Compound 3 0.305 ± 0.133 0.146 ± 0.072
2.49 ± 0.63 0.0530 ± 0.0174
279 ± 66 1.90 ± 0.49
Compound 4 1.14 ± 0.16 0.680 ± 0.103 5.38 ± 0.32 0.261 ± 0.018 194 ± 34 1.95 ± 0.37
a Model fit parameters for NADPH-dependent metabolism of compound 1 yielded >100% error. Please see text for more information.
This article has not been copyedited and formatted. The final version may differ from this version.DMD Fast Forward. Published on November 1, 2012 as DOI: 10.1124/dmd.112.047993
at ASPE
T Journals on February 18, 2020
dmd.aspetjournals.org
Dow
nloaded from
DMD #47993
33
Table 5. Prediction of in vivo CL in mouse from in vitro data for 4 ALK inhibitor analogs.
Compound CLint,max fu,mic fub Predicted CL In vivo CL Ob/Pr*
plasma liver microsomes
plasma hepatic
hydrolysis hydrolysis NADPH-dep.
µL/(min*mL) µL/(min*mg) µL/(min*mg) L/(h*kg) L/(h*kg) L/(h*kg)
2541103 71.4 1876 173 0.76 0.020 0.21 3.8 5.52 1.4
2559588 10.7 175 153 0.53 0.046 0.031 3.0 3.51 1.2
2560139 2.09 47.0 147 0.22 0.011 0.0061 1.6 2.14 1.3
2560142 1.68 20.6 99.5 0.22 0.012 0.0049 1.2 2.66 2.2
*Ob/Pr-Observed/Predicted
This article has not been copyedited and formatted. The final version may differ from this version.DMD Fast Forward. Published on November 1, 2012 as DOI: 10.1124/dmd.112.047993
at ASPE
T Journals on February 18, 2020
dmd.aspetjournals.org
Dow
nloaded from
This article has not been copyedited and formatted. The final version may differ from this version.DMD Fast Forward. Published on November 1, 2012 as DOI: 10.1124/dmd.112.047993
at ASPE
T Journals on February 18, 2020
dmd.aspetjournals.org
Dow
nloaded from
This article has not been copyedited and formatted. The final version may differ from this version.DMD Fast Forward. Published on November 1, 2012 as DOI: 10.1124/dmd.112.047993
at ASPE
T Journals on February 18, 2020
dmd.aspetjournals.org
Dow
nloaded from
This article has not been copyedited and formatted. The final version may differ from this version.DMD Fast Forward. Published on November 1, 2012 as DOI: 10.1124/dmd.112.047993
at ASPE
T Journals on February 18, 2020
dmd.aspetjournals.org
Dow
nloaded from
This article has not been copyedited and formatted. The final version may differ from this version.DMD Fast Forward. Published on November 1, 2012 as DOI: 10.1124/dmd.112.047993
at ASPE
T Journals on February 18, 2020
dmd.aspetjournals.org
Dow
nloaded from
This article has not been copyedited and formatted. The final version may differ from this version.DMD Fast Forward. Published on November 1, 2012 as DOI: 10.1124/dmd.112.047993
at ASPE
T Journals on February 18, 2020
dmd.aspetjournals.org
Dow
nloaded from
This article has not been copyedited and formatted. The final version may differ from this version.DMD Fast Forward. Published on November 1, 2012 as DOI: 10.1124/dmd.112.047993
at ASPE
T Journals on February 18, 2020
dmd.aspetjournals.org
Dow
nloaded from
This article has not been copyedited and formatted. The final version may differ from this version.DMD Fast Forward. Published on November 1, 2012 as DOI: 10.1124/dmd.112.047993
at ASPE
T Journals on February 18, 2020
dmd.aspetjournals.org
Dow
nloaded from


![A kinetic model of starch hydrolysis by [alpha]- and …kchbi.chtf.stuba.sk/upload_new/file/Miro/Proc problemy...Kinetics of malt starch hydrolysis by endogeneous a- and &amylases](https://img.pdfslide.net/doc/110x75/5e4bb072f0085830d17bafc7/a-kinetic-model-of-starch-hydrolysis-by-alpha-and-kchbichtfstubaskuploadnewfilemiroproc.jpg)