Embed Size (px)
Citation preview
IMPACT OF IN-PIT CRUSHING AND CONVEYING ON PIT SHELL OPTIMIZATION
Marc Johnson, Regional Manager - South America
2
IMPACT OF IPCC ON PIT SHELL OPTIMIZATION
Abstract
In Pit Crushing and Conveying (IPCC) systems have matured as a technology to the point where their inclusion in a mine plan should not be considered purely as a value optimization step at the end of the project planning process, but should be considered as part of the initial planning steps.
Pit shell optimization is one of the first steps in the mine planning process but the results from the pit shell optimization process are heavily dependent upon the initial assumptions made and, in particular, the assumptions around the haulage cost. In many cases, a flat rate per tonne of material moved is assumed, rather than a variable cost.
Deswik Mining Consultants advocate that a variable relationship for haulage costs should be developed for each mineral resource, and can be best incorporated through a strategic planning loop where an initial mine plan is developed and the results from this are used to inform the next pit shell optimization process. This iterative process offers the best opportunity for the mine planning engineer to develop the most appropriate, highest value option for a particular deposit.
The impact that an IPCC system may have upon the unit cost for a particular deposit means that it should be considered an integral part of the planning process to examine the haulage and material transportation strategy up front and as part of the strategic planning cycle and not late in the project process when a number of decisions are already “fixed” in place.
3
IMPACT OF IPCC ON PIT SHELL OPTIMIZATION
1. Introduction
The impact of In Pit Crushing and Conveying (IPCC) equipment on pit shell optimization is a key element that is often overlooked in the early stages of mine planning. Most of the analysis typically completed regarding IPCC is on the potential for cost reduction, whether in an attempt to improve a project’s economics, or to extend mine life.
The successful implementation of an IPCC system has further implications than just cost reduction; it requires a new look at the entire deposit, and may require re-engineering of the deposit or a new view of the transition from open pit to underground mining.
1.1. PIT SHELL OPTIMIZATION
Pit shell optimization involves using the Lerchs-Grossman algorithm (or other alternative algorithms) to find the pit shell that maximizes the undiscounted cashflow for any given deposit. Regardless of the algorithm used, all current software and methods work using undiscounted cashflow.
The algorithm takes into account the variable revenue from each block, as well as the variable extraction costs associated with each block, restricted by the geotechnical constraints (pit wall angles).This process is used extensively in the mining industry for the conversion of potential open pit resources to reserves for reporting on the stock market. Pit shell optimization is almost always the first step in design and scheduling of open pit metal mines.
Typically, incremental product price points (revenue factors) are used to generate a range of different pit shells to give the mining engineer an understanding of a potential development sequence, as well as an understanding about the sensitivity of the resource to variations in both cost and revenue.
The pit shell produced with a revenue factor of one, referring to the increment where the product revenue is equal to the base case price, is nominally selected as the final pit shell for a particular deposit. Resources beyond this point are then normally examined through underground mining methodologies.
1.2. IN PIT CRUSH AND CONVEY
IPCC is an alternative methodology to truck haulage for materials handling. The first large scale conveyor belt based material movement systems were envisaged in the 1960s, however their uptake has been limited due to a number of issues, including high initial capital cost requirements and perceived lack of operational flexibility.
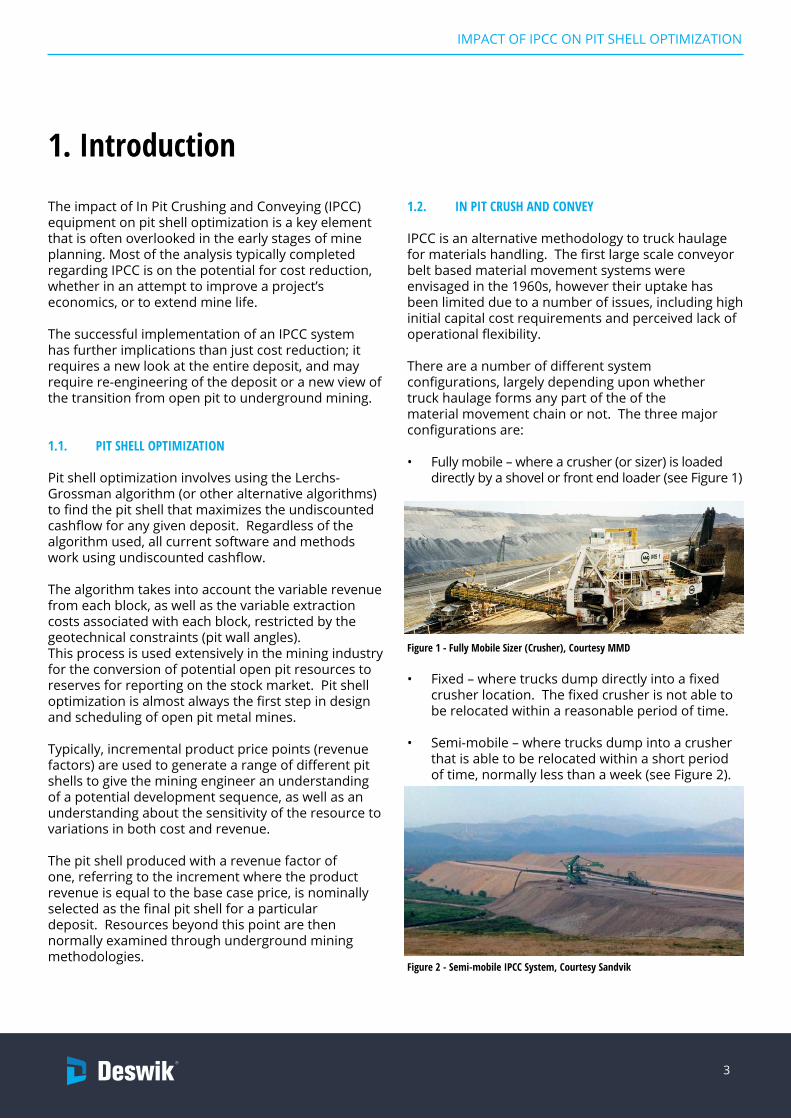
There are a number of different system configurations, largely depending upon whether truck haulage forms any part of the of the material movement chain or not. The three major configurations are:
• Fully mobile – where a crusher (or sizer) is loaded directly by a shovel or front end loader (see Figure 1)
Figure 1 - Fully Mobile Sizer (Crusher), Courtesy MMD
• Fixed – where trucks dump directly into a fixed crusher location. The fixed crusher is not able to be relocated within a reasonable period of time.
• Semi-mobile – where trucks dump into a crusher that is able to be relocated within a short period of time, normally less than a week (see Figure 2).
Figure 2 - Semi-mobile IPCC System, Courtesy Sandvik
4
IMPACT OF IPCC ON PIT SHELL OPTIMIZATION
1.3. HYPOTHESIS
This paper examines the following hypothesis:
That the impact of reduced operating costs from the use of an IPCC system will result in an expanded reserve, which will extend mine life and reduce the risk associated with an underground transition.
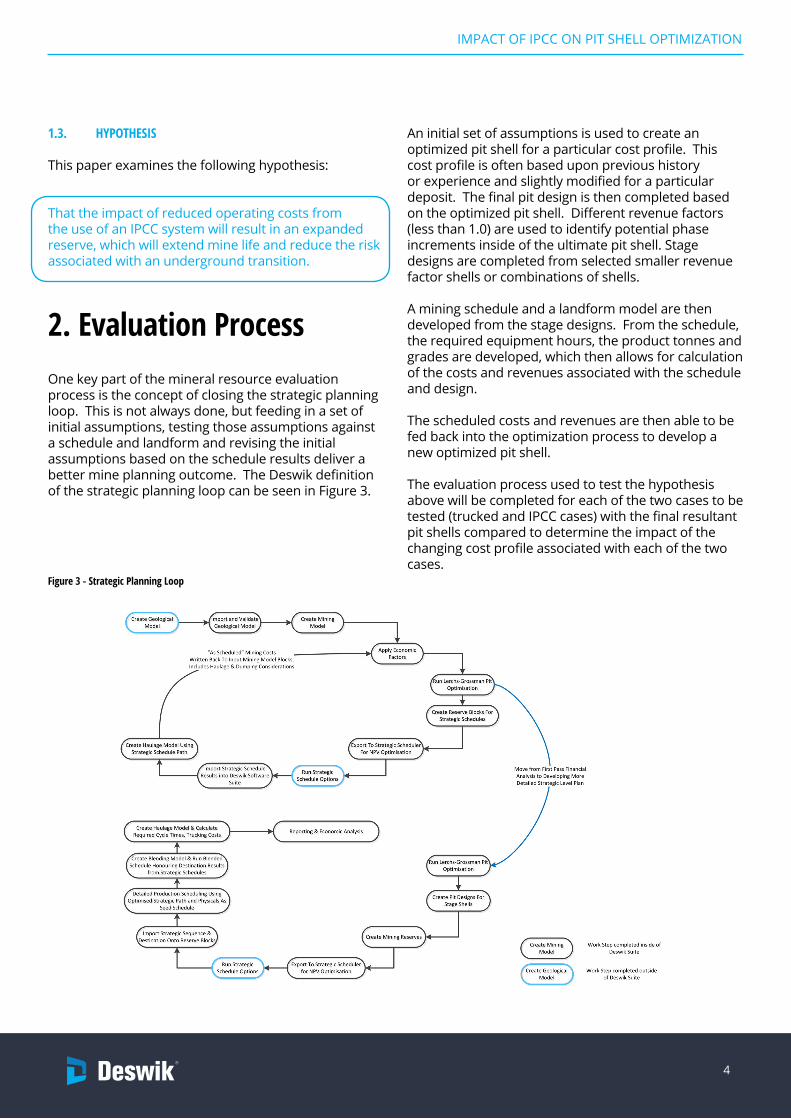
2. Evaluation ProcessOne key part of the mineral resource evaluation process is the concept of closing the strategic planning loop. This is not always done, but feeding in a set of initial assumptions, testing those assumptions against a schedule and landform and revising the initial assumptions based on the schedule results deliver a better mine planning outcome. The Deswik definition of the strategic planning loop can be seen in Figure 3.
Figure 3 - Strategic Planning Loop
An initial set of assumptions is used to create an optimized pit shell for a particular cost profile. This cost profile is often based upon previous history or experience and slightly modified for a particular deposit. The final pit design is then completed based on the optimized pit shell. Different revenue factors (less than 1.0) are used to identify potential phase increments inside of the ultimate pit shell. Stage designs are completed from selected smaller revenue factor shells or combinations of shells.
A mining schedule and a landform model are then developed from the stage designs. From the schedule, the required equipment hours, the product tonnes and grades are developed, which then allows for calculation of the costs and revenues associated with the schedule and design.
The scheduled costs and revenues are then able to be fed back into the optimization process to develop a new optimized pit shell.
The evaluation process used to test the hypothesis above will be completed for each of the two cases to be tested (trucked and IPCC cases) with the final resultant pit shells compared to determine the impact of the changing cost profile associated with each of the two cases.
5
IMPACT OF IPCC ON PIT SHELL OPTIMIZATION
2.1. EVALUATION DATASET
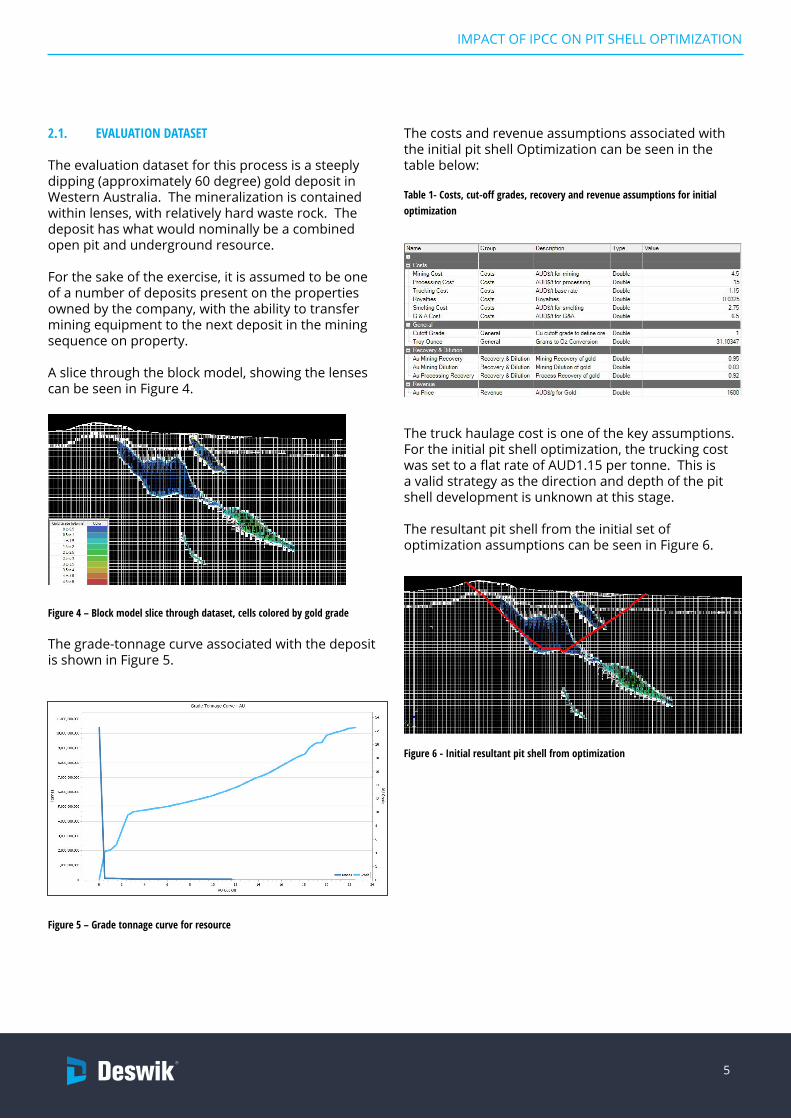
The evaluation dataset for this process is a steeply dipping (approximately 60 degree) gold deposit in Western Australia. The mineralization is contained within lenses, with relatively hard waste rock. The deposit has what would nominally be a combined open pit and underground resource.
For the sake of the exercise, it is assumed to be one of a number of deposits present on the properties owned by the company, with the ability to transfer mining equipment to the next deposit in the mining sequence on property.
A slice through the block model, showing the lenses can be seen in Figure 4.
Figure 4 – Block model slice through dataset, cells colored by gold grade
The grade-tonnage curve associated with the deposit is shown in Figure 5.
Figure 5 – Grade tonnage curve for resource
The costs and revenue assumptions associated with the initial pit shell Optimization can be seen in the table below:
Table 1- Costs, cut-off grades, recovery and revenue assumptions for initial optimization
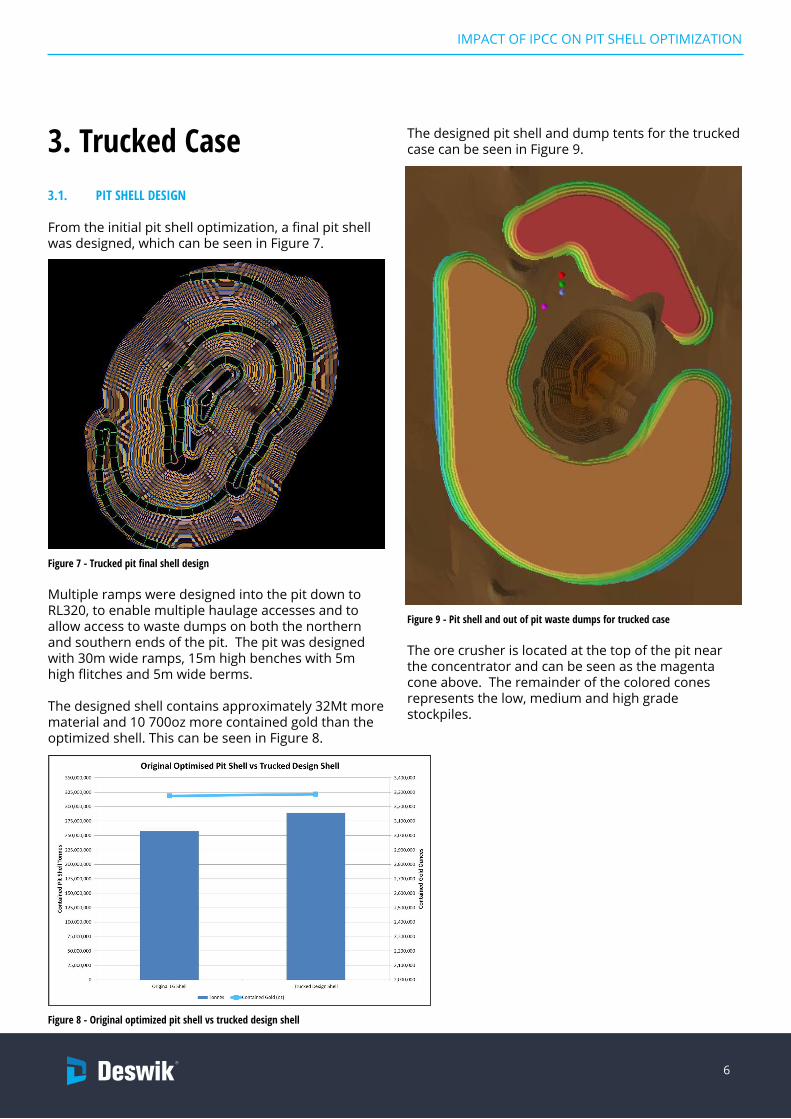
The truck haulage cost is one of the key assumptions. For the initial pit shell optimization, the trucking cost was set to a flat rate of AUD1.15 per tonne. This is a valid strategy as the direction and depth of the pit shell development is unknown at this stage.
The resultant pit shell from the initial set of optimization assumptions can be seen in Figure 6.
Figure 6 - Initial resultant pit shell from optimization
6
IMPACT OF IPCC ON PIT SHELL OPTIMIZATION
3. Trucked Case3.1. PIT SHELL DESIGN
From the initial pit shell optimization, a final pit shell was designed, which can be seen in Figure 7.
Figure 7 - Trucked pit final shell design
Multiple ramps were designed into the pit down to RL320, to enable multiple haulage accesses and to allow access to waste dumps on both the northern and southern ends of the pit. The pit was designed with 30m wide ramps, 15m high benches with 5m high flitches and 5m wide berms.
The designed shell contains approximately 32Mt more material and 10 700oz more contained gold than the optimized shell. This can be seen in Figure 8.
Figure 8 - Original optimized pit shell vs trucked design shell
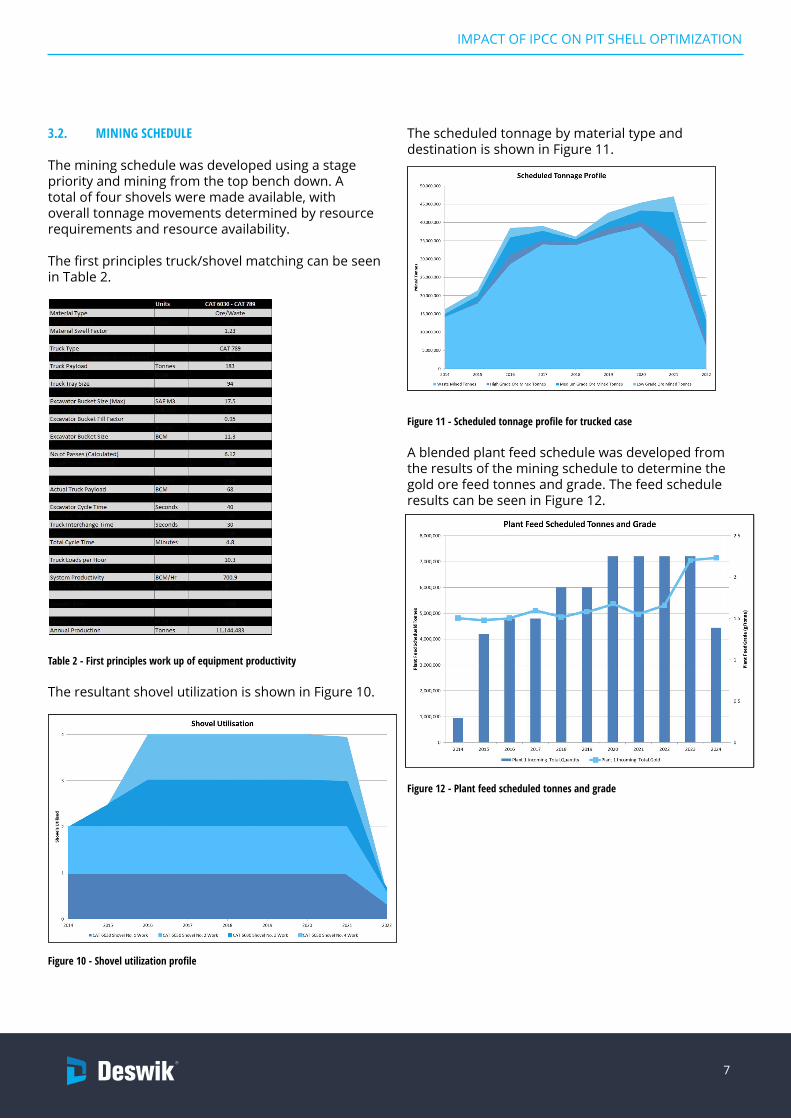
The designed pit shell and dump tents for the trucked case can be seen in Figure 9.
Figure 9 - Pit shell and out of pit waste dumps for trucked case
The ore crusher is located at the top of the pit near the concentrator and can be seen as the magenta cone above. The remainder of the colored cones represents the low, medium and high grade stockpiles.
7
IMPACT OF IPCC ON PIT SHELL OPTIMIZATION
3.2. MINING SCHEDULE
The mining schedule was developed using a stage priority and mining from the top bench down. A total of four shovels were made available, with overall tonnage movements determined by resource requirements and resource availability.
The first principles truck/shovel matching can be seen in Table 2.
Table 2 - First principles work up of equipment productivity
The resultant shovel utilization is shown in Figure 10.
Figure 10 - Shovel utilization profile
The scheduled tonnage by material type and destination is shown in Figure 11.
Figure 11 - Scheduled tonnage profile for trucked case
A blended plant feed schedule was developed from the results of the mining schedule to determine the gold ore feed tonnes and grade. The feed schedule results can be seen in Figure 12.
Figure 12 - Plant feed scheduled tonnes and grade
8
IMPACT OF IPCC ON PIT SHELL OPTIMIZATION
3.3. LANDFORM AND HAULAGE SCHEDULE
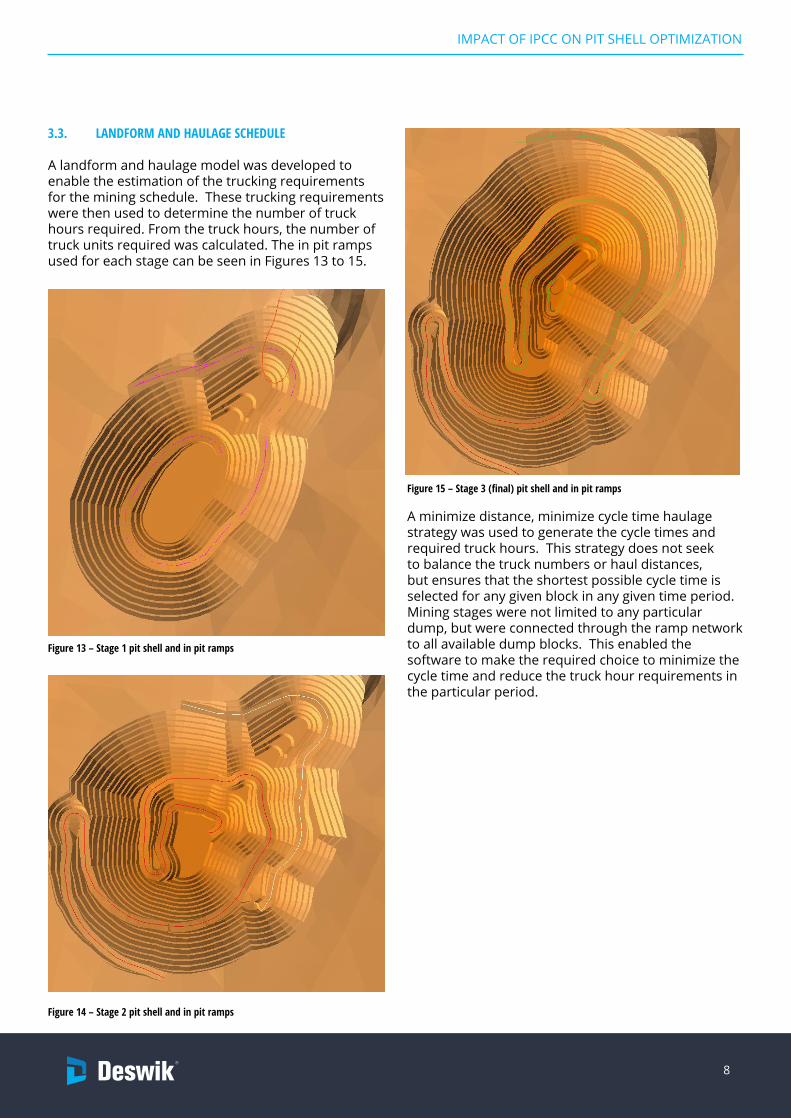
A landform and haulage model was developed to enable the estimation of the trucking requirements for the mining schedule. These trucking requirements were then used to determine the number of truck hours required. From the truck hours, the number of truck units required was calculated. The in pit ramps used for each stage can be seen in Figures 13 to 15.
Figure 13 – Stage 1 pit shell and in pit ramps
Figure 14 – Stage 2 pit shell and in pit ramps
Figure 15 – Stage 3 (final) pit shell and in pit ramps
A minimize distance, minimize cycle time haulage strategy was used to generate the cycle times and required truck hours. This strategy does not seek to balance the truck numbers or haul distances, but ensures that the shortest possible cycle time is selected for any given block in any given time period. Mining stages were not limited to any particular dump, but were connected through the ramp network to all available dump blocks. This enabled the software to make the required choice to minimize the cycle time and reduce the truck hour requirements in the particular period.
9
IMPACT OF IPCC ON PIT SHELL OPTIMIZATION
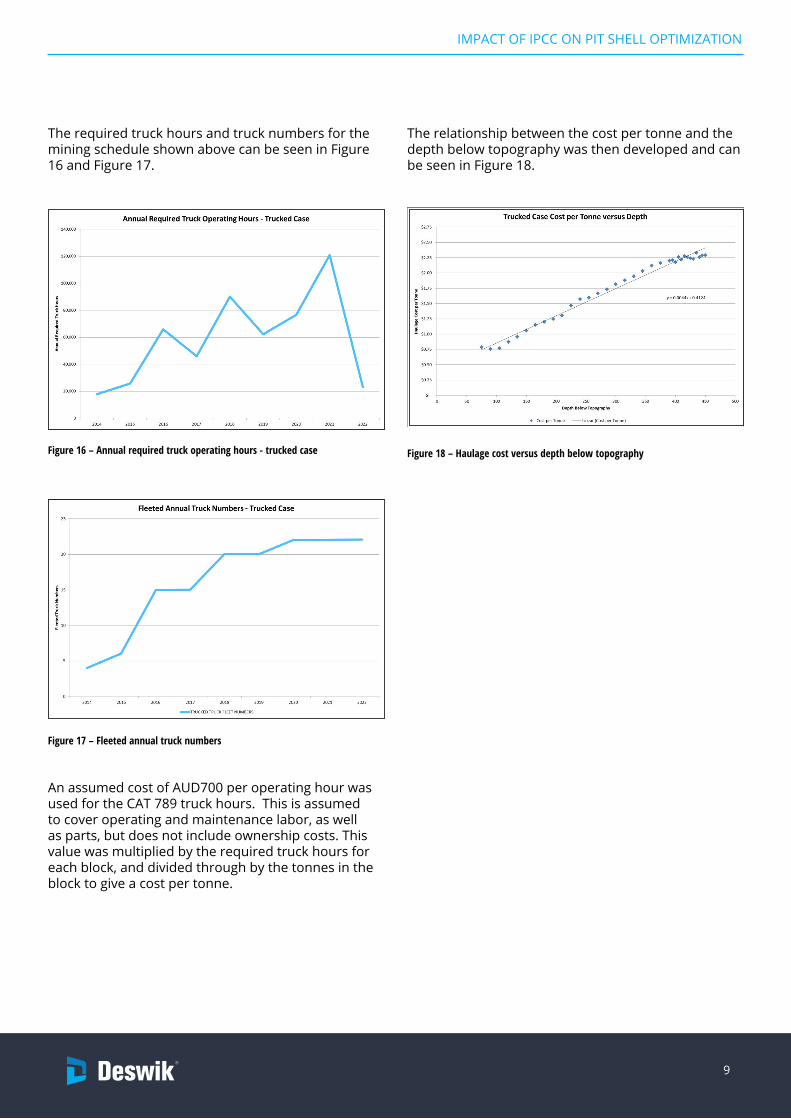
The required truck hours and truck numbers for the mining schedule shown above can be seen in Figure 16 and Figure 17.
Figure 16 – Annual required truck operating hours - trucked case
Figure 17 – Fleeted annual truck numbers
An assumed cost of AUD700 per operating hour was used for the CAT 789 truck hours. This is assumed to cover operating and maintenance labor, as well as parts, but does not include ownership costs. This value was multiplied by the required truck hours for each block, and divided through by the tonnes in the block to give a cost per tonne.
The relationship between the cost per tonne and the depth below topography was then developed and can be seen in Figure 18.
Figure 18 – Haulage cost versus depth below topography
10
IMPACT OF IPCC ON PIT SHELL OPTIMIZATION
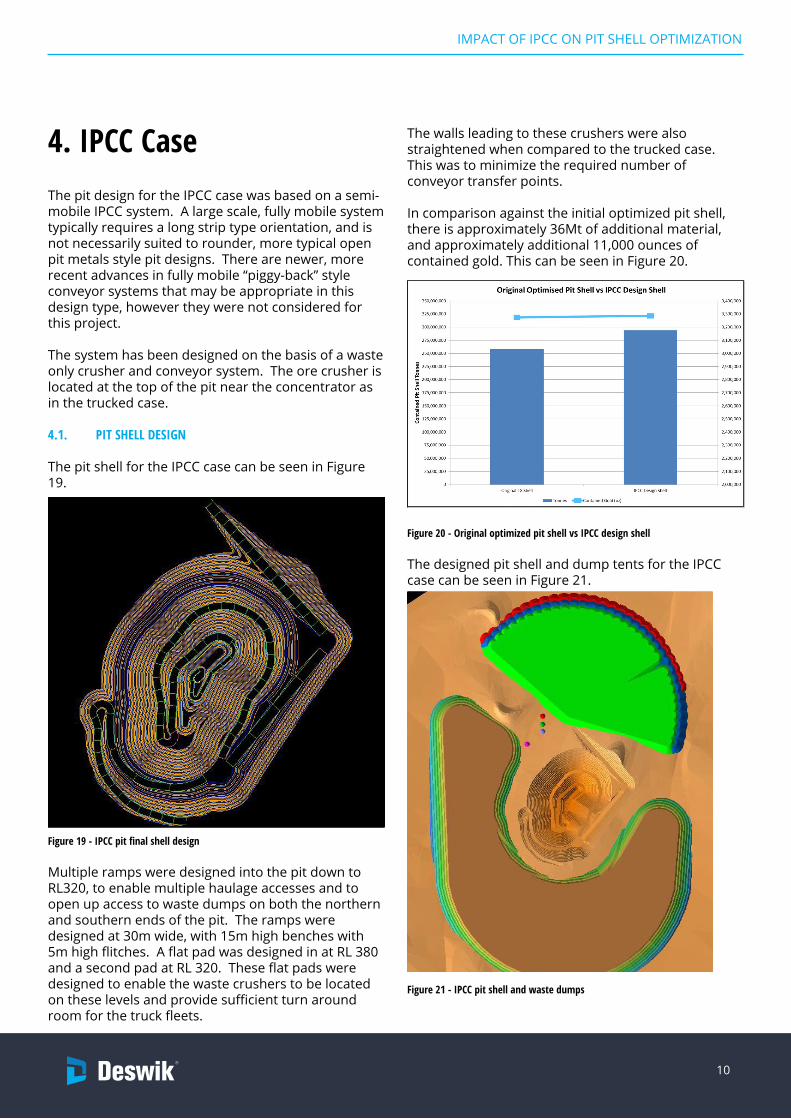
4. IPCC CaseThe pit design for the IPCC case was based on a semi-mobile IPCC system. A large scale, fully mobile system typically requires a long strip type orientation, and is not necessarily suited to rounder, more typical open pit metals style pit designs. There are newer, more recent advances in fully mobile “piggy-back” style conveyor systems that may be appropriate in this design type, however they were not considered for this project.
The system has been designed on the basis of a waste only crusher and conveyor system. The ore crusher is located at the top of the pit near the concentrator as in the trucked case.
4.1. PIT SHELL DESIGN
The pit shell for the IPCC case can be seen in Figure 19.
Figure 19 - IPCC pit final shell design
Multiple ramps were designed into the pit down to RL320, to enable multiple haulage accesses and to open up access to waste dumps on both the northern and southern ends of the pit. The ramps were designed at 30m wide, with 15m high benches with 5m high flitches. A flat pad was designed in at RL 380 and a second pad at RL 320. These flat pads were designed to enable the waste crushers to be located on these levels and provide sufficient turn around room for the truck fleets.
The walls leading to these crushers were also straightened when compared to the trucked case. This was to minimize the required number of conveyor transfer points.
In comparison against the initial optimized pit shell, there is approximately 36Mt of additional material, and approximately additional 11,000 ounces of contained gold. This can be seen in Figure 20.
Figure 20 - Original optimized pit shell vs IPCC design shell
The designed pit shell and dump tents for the IPCC case can be seen in Figure 21.
Figure 21 - IPCC pit shell and waste dumps
11
IMPACT OF IPCC ON PIT SHELL OPTIMIZATION
A further optimization for this work would be to investigate the impact on the designed pit shell of carrying the crushers down a further level into the pit.
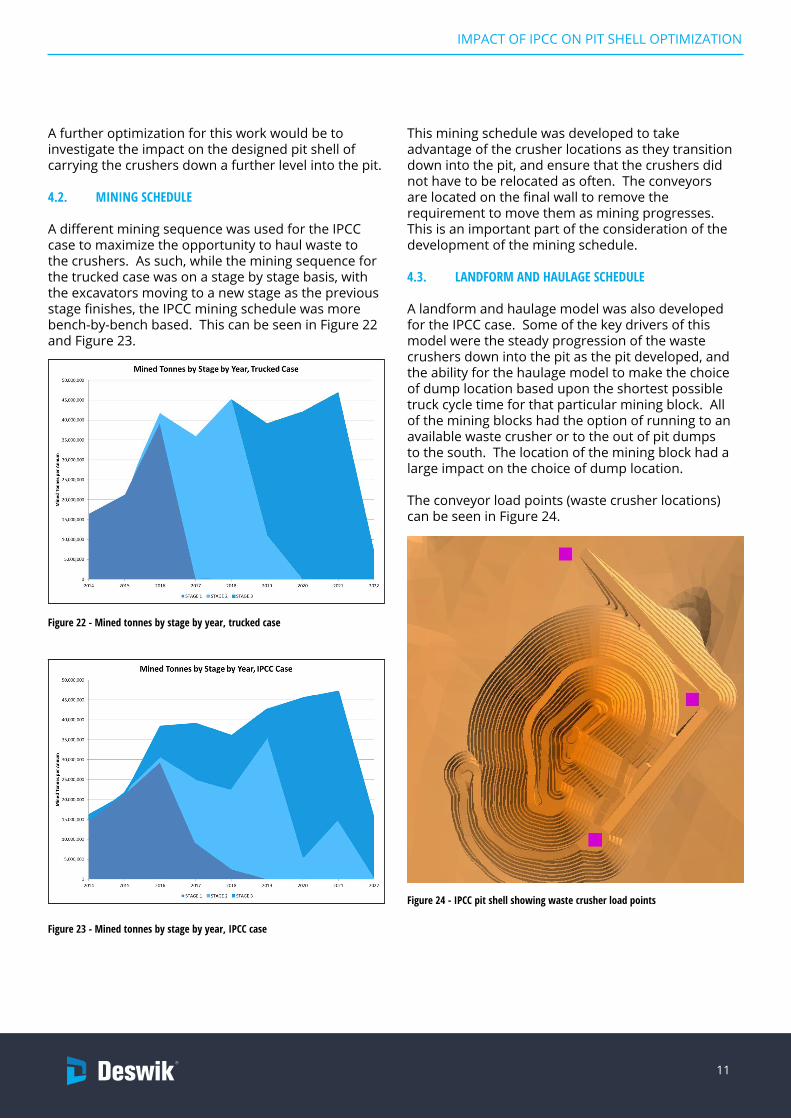
4.2. MINING SCHEDULE
A different mining sequence was used for the IPCC case to maximize the opportunity to haul waste to the crushers. As such, while the mining sequence for the trucked case was on a stage by stage basis, with the excavators moving to a new stage as the previous stage finishes, the IPCC mining schedule was more bench-by-bench based. This can be seen in Figure 22 and Figure 23.
Figure 22 - Mined tonnes by stage by year, trucked case
Figure 23 - Mined tonnes by stage by year, IPCC case
This mining schedule was developed to take advantage of the crusher locations as they transition down into the pit, and ensure that the crushers did not have to be relocated as often. The conveyors are located on the final wall to remove the requirement to move them as mining progresses. This is an important part of the consideration of the development of the mining schedule.
4.3. LANDFORM AND HAULAGE SCHEDULE
A landform and haulage model was also developed for the IPCC case. Some of the key drivers of this model were the steady progression of the waste crushers down into the pit as the pit developed, and the ability for the haulage model to make the choice of dump location based upon the shortest possible truck cycle time for that particular mining block. All of the mining blocks had the option of running to an available waste crusher or to the out of pit dumps to the south. The location of the mining block had a large impact on the choice of dump location.
The conveyor load points (waste crusher locations) can be seen in Figure 24.
Figure 24 - IPCC pit shell showing waste crusher load points
12
IMPACT OF IPCC ON PIT SHELL OPTIMIZATION
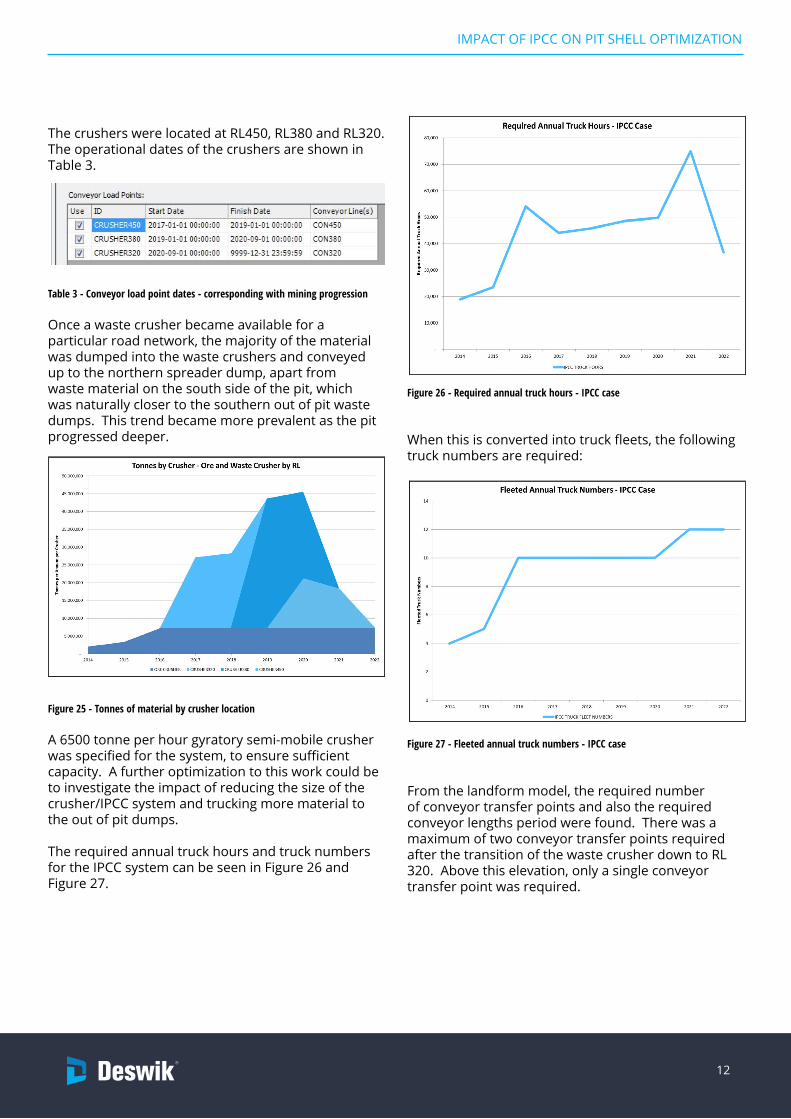
The crushers were located at RL450, RL380 and RL320. The operational dates of the crushers are shown in Table 3.
Table 3 - Conveyor load point dates - corresponding with mining progression
Once a waste crusher became available for a particular road network, the majority of the material was dumped into the waste crushers and conveyed up to the northern spreader dump, apart from waste material on the south side of the pit, which was naturally closer to the southern out of pit waste dumps. This trend became more prevalent as the pit progressed deeper.
Figure 25 - Tonnes of material by crusher location
A 6500 tonne per hour gyratory semi-mobile crusher was specified for the system, to ensure sufficient capacity. A further optimization to this work could be to investigate the impact of reducing the size of the crusher/IPCC system and trucking more material to the out of pit dumps.
The required annual truck hours and truck numbers for the IPCC system can be seen in Figure 26 and Figure 27.
Figure 26 - Required annual truck hours - IPCC case
When this is converted into truck fleets, the following truck numbers are required:
Figure 27 - Fleeted annual truck numbers - IPCC case
From the landform model, the required number of conveyor transfer points and also the required conveyor lengths period were found. There was a maximum of two conveyor transfer points required after the transition of the waste crusher down to RL 320. Above this elevation, only a single conveyor transfer point was required.
13
IMPACT OF IPCC ON PIT SHELL OPTIMIZATION
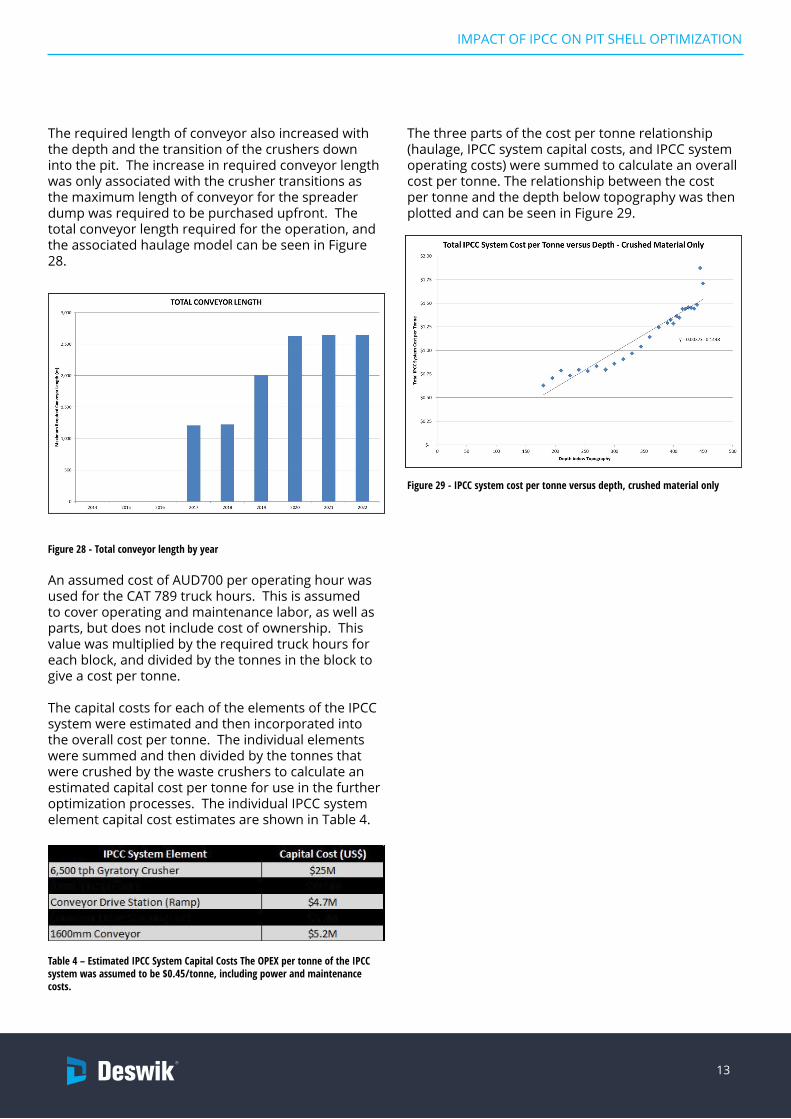
The required length of conveyor also increased with the depth and the transition of the crushers down into the pit. The increase in required conveyor length was only associated with the crusher transitions as the maximum length of conveyor for the spreader dump was required to be purchased upfront. The total conveyor length required for the operation, and the associated haulage model can be seen in Figure 28.
Figure 28 - Total conveyor length by year
An assumed cost of AUD700 per operating hour was used for the CAT 789 truck hours. This is assumed to cover operating and maintenance labor, as well as parts, but does not include cost of ownership. This value was multiplied by the required truck hours for each block, and divided by the tonnes in the block to give a cost per tonne.
The capital costs for each of the elements of the IPCC system were estimated and then incorporated into the overall cost per tonne. The individual elements were summed and then divided by the tonnes that were crushed by the waste crushers to calculate an estimated capital cost per tonne for use in the further optimization processes. The individual IPCC system element capital cost estimates are shown in Table 4.
Table 4 – Estimated IPCC System Capital Costs The OPEX per tonne of the IPCC system was assumed to be $0.45/tonne, including power and maintenance costs.
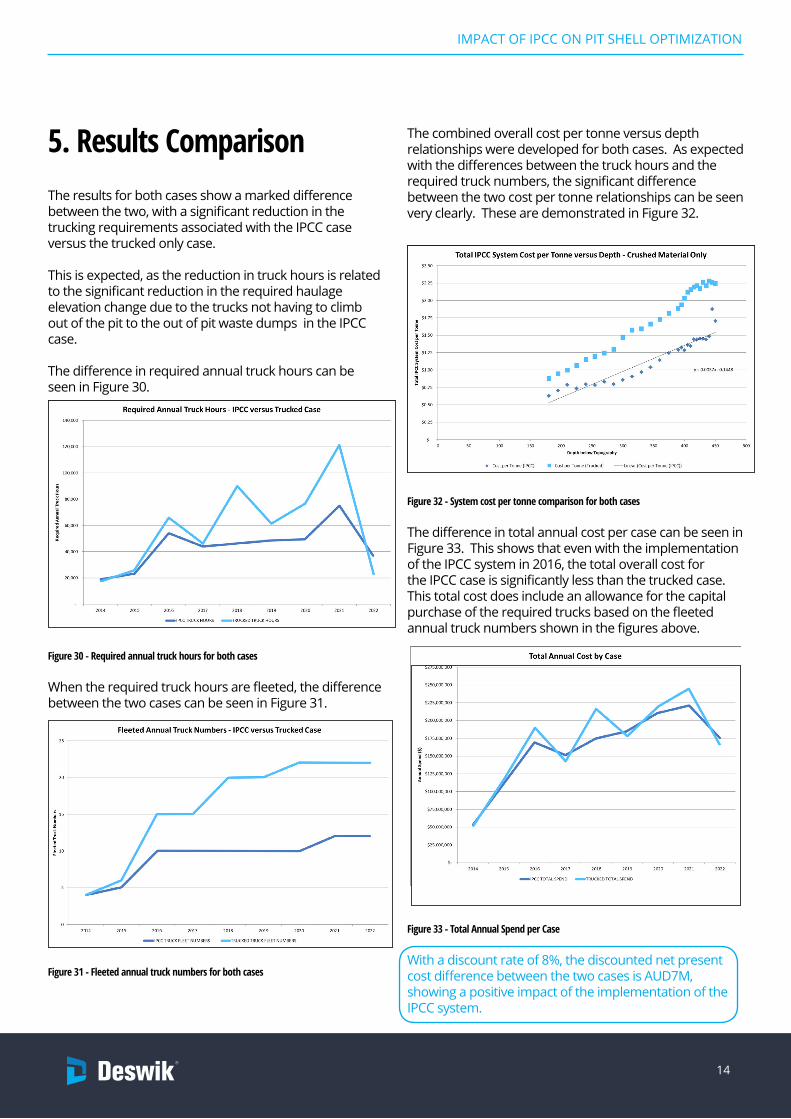
The three parts of the cost per tonne relationship (haulage, IPCC system capital costs, and IPCC system operating costs) were summed to calculate an overall cost per tonne. The relationship between the cost per tonne and the depth below topography was then plotted and can be seen in Figure 29.
Figure 29 - IPCC system cost per tonne versus depth, crushed material only
14
IMPACT OF IPCC ON PIT SHELL OPTIMIZATION
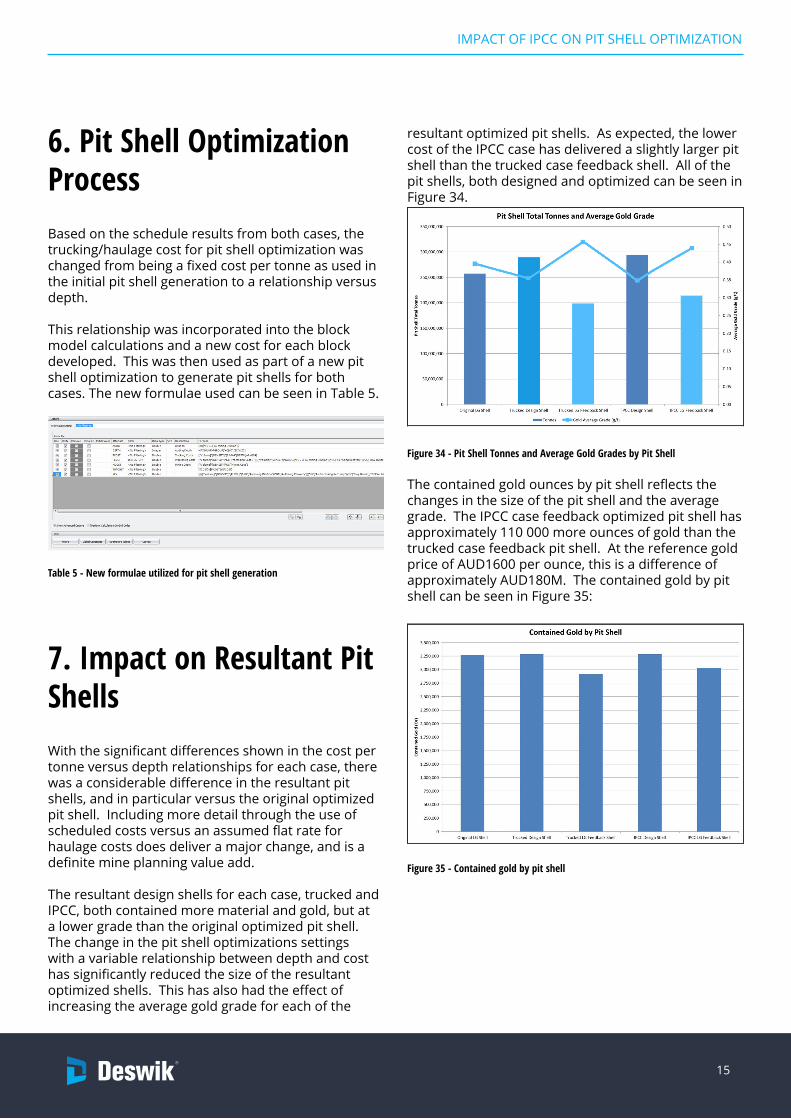
5. Results ComparisonThe results for both cases show a marked difference between the two, with a significant reduction in the trucking requirements associated with the IPCC case versus the trucked only case.
This is expected, as the reduction in truck hours is related to the significant reduction in the required haulage elevation change due to the trucks not having to climb out of the pit to the out of pit waste dumps in the IPCC case.
The difference in required annual truck hours can be seen in Figure 30.
Figure 30 - Required annual truck hours for both cases
When the required truck hours are fleeted, the difference between the two cases can be seen in Figure 31.
Figure 31 - Fleeted annual truck numbers for both cases
The combined overall cost per tonne versus depth relationships were developed for both cases. As expected with the differences between the truck hours and the required truck numbers, the significant difference between the two cost per tonne relationships can be seen very clearly. These are demonstrated in Figure 32.
Figure 32 - System cost per tonne comparison for both cases
The difference in total annual cost per case can be seen in Figure 33. This shows that even with the implementation of the IPCC system in 2016, the total overall cost for the IPCC case is significantly less than the trucked case. This total cost does include an allowance for the capital purchase of the required trucks based on the fleeted annual truck numbers shown in the figures above.
Figure 33 - Total Annual Spend per Case
With a discount rate of 8%, the discounted net present cost difference between the two cases is AUD7M, showing a positive impact of the implementation of the IPCC system.
15
IMPACT OF IPCC ON PIT SHELL OPTIMIZATION
6. Pit Shell Optimization ProcessBased on the schedule results from both cases, the trucking/haulage cost for pit shell optimization was changed from being a fixed cost per tonne as used in the initial pit shell generation to a relationship versus depth.
This relationship was incorporated into the block model calculations and a new cost for each block developed. This was then used as part of a new pit shell optimization to generate pit shells for both cases. The new formulae used can be seen in Table 5.
Table 5 - New formulae utilized for pit shell generation
7. Impact on Resultant Pit ShellsWith the significant differences shown in the cost per tonne versus depth relationships for each case, there was a considerable difference in the resultant pit shells, and in particular versus the original optimized pit shell. Including more detail through the use of scheduled costs versus an assumed flat rate for haulage costs does deliver a major change, and is a definite mine planning value add.
The resultant design shells for each case, trucked and IPCC, both contained more material and gold, but at a lower grade than the original optimized pit shell. The change in the pit shell optimizations settings with a variable relationship between depth and cost has significantly reduced the size of the resultant optimized shells. This has also had the effect of increasing the average gold grade for each of the
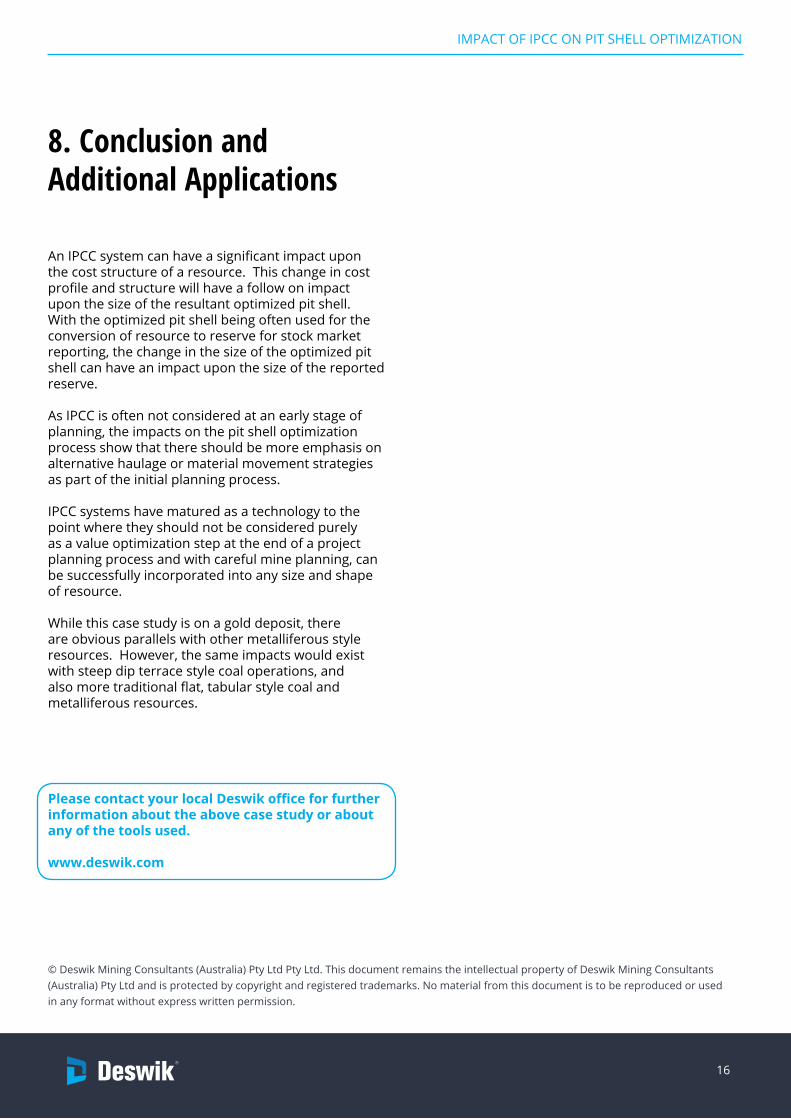
resultant optimized pit shells. As expected, the lower cost of the IPCC case has delivered a slightly larger pit shell than the trucked case feedback shell. All of the pit shells, both designed and optimized can be seen in Figure 34.
Figure 34 - Pit Shell Tonnes and Average Gold Grades by Pit Shell
The contained gold ounces by pit shell reflects the changes in the size of the pit shell and the average grade. The IPCC case feedback optimized pit shell has approximately 110 000 more ounces of gold than the trucked case feedback pit shell. At the reference gold price of AUD1600 per ounce, this is a difference of approximately AUD180M. The contained gold by pit shell can be seen in Figure 35:
Figure 35 - Contained gold by pit shell
16
IMPACT OF IPCC ON PIT SHELL OPTIMIZATION
8. Conclusion and Additional Applications
An IPCC system can have a significant impact upon the cost structure of a resource. This change in cost profile and structure will have a follow on impact upon the size of the resultant optimized pit shell. With the optimized pit shell being often used for the conversion of resource to reserve for stock market reporting, the change in the size of the optimized pit shell can have an impact upon the size of the reported reserve.
As IPCC is often not considered at an early stage of planning, the impacts on the pit shell optimization process show that there should be more emphasis on alternative haulage or material movement strategies as part of the initial planning process.
IPCC systems have matured as a technology to the point where they should not be considered purely as a value optimization step at the end of a project planning process and with careful mine planning, can be successfully incorporated into any size and shape of resource.
While this case study is on a gold deposit, there are obvious parallels with other metalliferous style resources. However, the same impacts would exist with steep dip terrace style coal operations, and also more traditional flat, tabular style coal and metalliferous resources.
Please contact your local Deswik office for further information about the above case study or about any of the tools used.
www.deswik.com
© Deswik Mining Consultants (Australia) Pty Ltd Pty Ltd. This document remains the intellectual property of Deswik Mining Consultants (Australia) Pty Ltd and is protected by copyright and registered trademarks. No material from this document is to be reproduced or used in any format without express written permission.