Embed Size (px)
Citation preview
842019 Impact of Inflation on Purchasing Power
httpslidepdfcomreaderfullimpact-of-inflation-on-purchasing-power 134
ABSTRACT
The purchasing power of a consumer depends upon wealth and the prices of the goodsand services The customer can purchase domestically or from aboard The domestic purchasing power is mainly affected by the inflation rate of individual countries and it isrelatively equitable across mature economies The international purchasing power ismore volatile and is affected by both exchange rate and prices A consumerrsquos buying power is also influenced by the changes in wages relative to inflation Analysis of current exchange rates prices and wages leads to the belief that foreign shoppers can get better bargains in Japan and the US at the present time Consumers in emergingeconomies especially China and Russia have experienced significant improvement in purchasing power recently They may catch up with the living standard of rich countriesin the future if this growth rate sustains
842019 Impact of Inflation on Purchasing Power
httpslidepdfcomreaderfullimpact-of-inflation-on-purchasing-power 234
Acknowledgements
I would like to thanks madam Iram for teaching the basic concepts of DevelopmentEconomics and My Mother for the helpful discussions on the subject and my Brother for proof reading the manuscript
842019 Impact of Inflation on Purchasing Power
httpslidepdfcomreaderfullimpact-of-inflation-on-purchasing-power 334
Topic
Impact of Inflation on purchasing power
Objectives
bull Learn
bull How we can measure inflation and purchasing power
bull Knowing about purchasing power parity
bull Tackle Inflation
bull Affect of inflation on purchasing power
Content
Phase I Acknowledgements
Abstract
Introduction
Phase II
Review of Literature
Phase III
Research Methodology
Phase IV
Conclusion
References
842019 Impact of Inflation on Purchasing Power
httpslidepdfcomreaderfullimpact-of-inflation-on-purchasing-power 434
Introduction of purchasing power
How Does Inflation Affect the Purchasing Power of Money
Inflation and Purchasing Products
Inflation and DebtDeflation and Purchasing ProductsDeflation and Debt
What is Inflation
Measures of inflation are
Producer Price IndicesCommodity price indicesGDP deflator Regional inflationAspect price inflationIssue in measuring7 most harmful effects of inflation
Review of literature
Consumer price indexes of representative economies from 2000 to 2008Relative purchasing power parity of representative economies from 2000 to 2008PPP exchange rate published by the International Monetary Fund (IMF ref 2)Changes of nominal exchange rate from 2000 to 2008Changes of real (CPI) exchange rate from 2000 to 2008Increase in different countries from 2000 to 2008 (source ref 1 3 to 14)Relative purchasing power parity from 2000 to 2008 after adjusting for wageReal exchange rate from 2000 to 2008 after adjusting for wage increaseMarket exchange rate from 2000 to 2008Weekly Wages from 2000 to 2008
Research MethodologyWhat is purchasing power parityUse of purchasing power parity
842019 Impact of Inflation on Purchasing Power
httpslidepdfcomreaderfullimpact-of-inflation-on-purchasing-power 534
Conclusion or Summery
References
842019 Impact of Inflation on Purchasing Power
httpslidepdfcomreaderfullimpact-of-inflation-on-purchasing-power 634
INTRODUCTION
The purchasing power of a consumer depends upon wealth and the prices of the goodsand services The customer can purchase domestically or from aboard if there is a freetrade condition If the purchase occurs in the international market exchange rate will play a role in calculating affordability Furthermore a consumer who is employed earnsincome while spending Hisher buying power also depends on the changes in wagesrelative to inflation This article discusses the factors such as exchange rate prices andwage level affecting the purchasing power of consumers who reside in various countriesin the world from 2000 to 2008
Inflation can be felt at gas pumps and grocery stores The official government consumer price inflation rate was 27 percent higher as of March compared to one year ago It had been zero for all of 2009 and 16 percent for all of 2010 which was the reason providedas to why social security checks did not require a cost-of-living-adjustment this year
However consumer price inflation is building and could easily rise to 4 to 5 percent bythe yearrsquos end and possibly even higher if there is no retreat in gas and food pricesProducer price inflation is already near 6 percent Incredibly however US government bond yields are implying low future inflation The US Treasury can borrow today at alow 34 percent rate for 10 years despite the very high budget deficit and plenty of money printing
Savers lose if there is unexpected inflation because of the loss in purchasing power of themoney saved Conversely borrowers win from unexpected inflation
How does this work The table below shows past returns for people who saved money
with a 10-year US Treasury For example someone who saved $100 via US Treasuryin 1950 would have accumulated $121 in at the end of the 10-year term assuming allannual interest payments have been saved However there was some inflation over thatdecade so their purchasing power was eroded to the point that the original $100investment would have provided only $102 in purchasing power after 10 years Other periods are shown below People who saved money at the start of 1970 actually came outwith much less purchasing power after 10 years
842019 Impact of Inflation on Purchasing Power
httpslidepdfcomreaderfullimpact-of-inflation-on-purchasing-power 734
What about going forward over the next 10 years If you invest $100 in the 10-year US
Treasury bond today you will have $131 in ten years based on todayrsquos 34 percent yieldIt is unlikely that we will experience the same kind of inflation seen in the 1970sHowever if such a high rate of inflation were to occur then the $131 cumulative savingsafter 10 years would translate into only $64 in purchasing power On the other hand if there is low inflation like in the 1950s then the saver would have $104 in purchasing power
Purchasing power
Purchasing power is the number of goodsservices that can be purchased with a unit of currency For example if you had taken one dollar to a store in the 1950s you would
have been able to buy a greater number of items than you would today indicating thatyou would have had a greater purchasing power in the 1950s Currency can be either acommodity money like gold or silver or fiat currency or free-floating market-valuedcurrency like US dollars As Adam Smith noted having money gives one the ability tocommand others labor so purchasing power to some extent is power over other peopleto the extent that they are willing to trade their labor or goods for money or currency
If ones monetary income stays the same but the price level increases the purchasing power of that income falls Inflation does not always imply falling purchasing power of ones money income since it may rise faster than the price level A higher real income means a higher purchasing power since real income refers to the income adjusted for
inflation
For a price index its value in the base year is usually normalized to a value of 100 The purchasing power of a unit of currency say a dollar in a given year expressed in dollarsof the base year is 100 P where P is the price index in that year So by definition the purchasing power of a dollar decreases as the price level rises The purchasing power intodays money of an amount C of money t years into the future can be computed withthe formula for the present value
842019 Impact of Inflation on Purchasing Power
httpslidepdfcomreaderfullimpact-of-inflation-on-purchasing-power 834
Where in this case i is an assumed future annual inflation rate
How Does Inflation Affect The Purchasing Power of Money
Inflation affects how people can spend money Inflation is an economic phenomenon thathas an increasing change in the price of goods and services A closely linked phenomenon to inflation is deflation sometimes called negative inflation Deflationoccurs when there is a decreasing change in the price of goods and services Inflation anddeflation affect how a consumer can buy goods and the value of debt Inflation can occur in wages or prices
Measuring Inflation
Price inflation is typically measured using the consumer price index (CPI) The UnitedStates Bureau of Labor Statistics keeps track of the CPI The CPI takes a constant basketof goods and sees how the price changes from year to year If the price of the basket of goods increases then there is price inflation If the price of the basket of goods decreasesthen there is deflation People measure wage inflation using the employment cost indexThe employment cost index shows how the cost of labor increases or decreases over a period of time
Inflation and Purchasing ProductsPrice inflation decreases peoples ability to pay for goods The concept at a basic levelsays if an employees wages remain steady but the cost of goods increases then theemployee can afford fewer goods As wage inflation occurs people will be able to buymore products A general misconception is that when wages rise prices also rise andaccording to the Federal Reserve Bank of Cleveland there is little support that wageinflations cause price inflation
Inflation and Debt
Price inflation is a debtors best friend and a creditors worst enemy As the pricesincrease the amount borrowed will deteriorate in value so the debtor is paying back lessmoney and the creditor is receiving less money For example a student borrows $100000in 2005 and then inflation occurs over the next couple years Inflation then makes that$100000 comparatively worth only $80000 due to the increase in prices When wagesinflate both the borrowers and the creditors win The borrowers can repay their loansquicker due to higher income The borrowers then should receive loan payments quicker if the borrowers pay back their loans with the increased wages
842019 Impact of Inflation on Purchasing Power
httpslidepdfcomreaderfullimpact-of-inflation-on-purchasing-power 934
Deflation and Purchasing Products
Deflation has the opposite affect of inflation in that consumers will be able to buy more productsas the price for the product decreases Deflation however is not good for the overall economyand can be worse than inflation If a company has costs sunk into production before deflationthese costs will not readjust to the deflation Since the costs remain high to the price of moneythe company will receive less revenue when the product sells at a deflated price As wagesdeflate consumers can buy less with their money because their disposable income is decreased
Deflation and Debt
Deflation and debt has the opposite affect as inflation Debtors will pay back more money than theycomparatively took out and creditors will receive more money As wages deflate people may have a harder time paying off debt which will increase the number of defaults by borrowers
INFLATION
In economics inflation is a rise in the general level of prices of goods and services in aneconomy over a period of time When the general price level rises each unit of currency buys fewer goods and services Consequently inflation also reflects erosion in the purchasing power of money ndash a loss of real value in the internal medium of exchange andunit of account in the economy A chief measure of price inflation is the inflation rate theannualized percentage change in a general price index (normally the Consumer Price Index) over time
Measures of inflation are
Inflation is usually estimated by calculating the inflation rate of a price index usually theConsumer Price Index] The Consumer Price Index measures prices of a selection of goods and services purchased by a typical consumer The inflation rate is the percentage rate of change of a price index over time
For instance in January 2007 the US Consumer Price Index was 202416 and inJanuary 2008 it was 211080 The formula for calculating the annual percentage rateinflation in the CPI over the course of 2007 is
The resulting inflation rate for the CPI in this one year period is 428 meaning thegeneral level of prices for typical US consumers rose by approximately four percentin 2007
Other widely used price indices for calculating price inflation include the following
842019 Impact of Inflation on Purchasing Power
httpslidepdfcomreaderfullimpact-of-inflation-on-purchasing-power 1034
bull Producer price indices (PPIs) which measures average changes in pricesreceived by domestic producers for their output This differs from the CPI in that price subsidization profits and taxes may cause the amount received by the producer to differ from what the consumer paid There is also typically a delay between an increase in the PPI and any eventual increase in the CPI Producer
price index measures the pressure being put on producers by the costs of their raw materials This could be passed on to consumers or it could be absorbed by profits or offset by increasing productivity In India and the United States anearlier version of the PPI was called the Wholesale Price Indexbull Commodity price indices which measure the price of a selection of commodities In the present commodity price indices are weighted by the relativeimportance of the components to the all in cost of an employeebull Core price indices because food and oil prices can change quickly due tochanges in supply and demand conditions in the food and oil markets it can bedifficult to detect the long run trend in price levels when those prices areincluded Therefore most statistical agencies also report a measure of core
inflation which removes the most volatile components (such as food and oil)from a broad price index like the CPI Because core inflation is less affected byshort run supply and demand conditions in specific markets central banks rely onit to better measure the inflationary impact of current monetary policy
Other common measures of inflation are
bull GDP deflator is a measure of the price of all the goods and servicesincluded in gross domestic product (GDP) The US Commerce Department publishes a deflator series for US GDP defined as its nominal GDP measuredivided by its real GDP measurebull
Regional inflation The Bureau of Labor Statistics breaks down CPI-Ucalculations down to different regions of the USbull Historical inflation Before collecting consistent econometric data becamestandard for governments and for the purpose of comparing absolute rather thanrelative standards of living various economists have calculated imputed inflationfigures Most inflation data before the early 20th century is imputed based on theknown costs of goods rather than compiled at the time It is also used to adjustfor the differences in real standard of living for the presence of technologybull Asset price inflation is an undue increase in the prices of real or financialassets such as stock (equity) and real estate While there is no widely acceptedindex of this type some central bankers have suggested that it would be better toaim at stabilizing a wider general price level inflation measure that includes someasset prices instead of stabilizing CPI or core inflation only The reason is that byraising interest rates when stock prices or real estate prices rise and loweringthem when these asset prices fall central banks might be more successful inavoiding bubbles and crashes in asset prices
842019 Impact of Inflation on Purchasing Power
httpslidepdfcomreaderfullimpact-of-inflation-on-purchasing-power 1134
Issues in measuring
Measuring inflation in an economy requires objective means of differentiating changes in
nominal prices on a common set of goods and services and distinguishing them fromthose price shifts resulting from changes in value such as volume quality or performance For example if the price of a 10 oz can of corn changes from $090 to$100 over the course of a year with no change in quality then this price differencerepresents inflation This single price change would not however represent generalinflation in an overall economy To measure overall inflation the price change of a largebasket of representative goods and services is measured This is the purpose of a price index which is the combined price of a basket of many goods and services Thecombined price is the sum of the weighted average prices of items in the basket Aweighted price is calculated by multiplying the unit price of an item to the number of those items the average consumer purchases Weighted pricing is a necessary means to
measuring the impact of individual unit price changes on the economys overall inflationThe Consumer Price Index for example uses data collected by surveying households todetermine what proportion of the typical consumers overall spending is spent on specificgoods and services and weights the average prices of those items accordingly Thoseweighted average prices are combined to calculate the overall price To better relate pricechanges over time indexes typically choose a base year price and assign it a value of 100 Index prices in subsequent years are then expressed in relation to the base year priceWhile comparing inflation measures for various periods one has to take intoconsideration the Base effect (inflation) as well
Inflation measures are often modified over time either for the relative weight of goods in
the basket or in the way in which goods and services from the present are compared withgoods and services from the past Over time adjustments are made to the type of goodsand services selected in order to reflect changes in the sorts of goods and services purchased by typical consumers New products may be introduced older productsdisappear the quality of existing products may change and consumer preferences canshift Both the sorts of goods and services which are included in the basket and theweighted price used in inflation measures will be changed over time in order to keep pacewith the changing marketplace
Inflation numbers are often seasonally adjusted in order to differentiate expected cyclicalcost shifts For example home heating costs are expected to rise in colder months and
seasonal adjustments are often used when measuring for inflation to compensate for cyclical spikes in energy or fuel demand Inflation numbers may be averaged or otherwise subjected to statistical techniques in order to remove statistical noise andvolatility of individual prices
When looking at inflation economic institutions may focus only on certain kinds of prices or special indices such as the core inflation index which is used by central banksto formulate monetary policy Most inflation indices are calculated from weighted
842019 Impact of Inflation on Purchasing Power
httpslidepdfcomreaderfullimpact-of-inflation-on-purchasing-power 1234
averages of selected price changes This necessarily introduces distortion and can lead tolegitimate disputes about what the true inflation rate is This problem can be overcome byincluding all available price changes in the calculation and then choosing the median value
7 most harmful effects of Inflation on different aspects of a developing country like India
Why should we be concerned with the problem of inflation The answer lies in two facts
I Left to itself inflation would move from its initial beneficiary stage to that of a harmfulone For this reason it is necessary to prevent inflation from gaining strength
II A stronger inflation is more difficult to control than a mild one And there is no way to
control a hyperinflation
The beneficial effects of inflation are limited to only its initial phase when the price riseis sufficiently mild During that period there is a favorable impact upon both output andemployment The increase in prices and distributive inequalities are more thancounterbalanced by gains in output and employment
However once inflationary process gathers some strength its ill effects come todominate the scene These have been discussed above and would be only brieflyenumerated here
1 Right from the beginning inflation adds to inequalities of income and wealthHowever in its last phase it is not longer able to do so because money ceases to beanacceptable store of value It is a generally agreed statement that inequalities reduceaggregate social welfare and should be avoided provided in the process productionactivity does not suffer
2 Every economy needs a continuous addition to its productive capacity for which itshould encourage capital formation In a money economy capital formation takes placewhen a part of money income is saved and transferred to the investors who in turn use itfor investment and capital formation However inflation by its very nature discouragessaving activity It makes consumption more attractive than saving
The adverse impact on saving and capital formation is more serious for-anunderdeveloped country because it needs a higher rate of capital accumulation
3 Inflation leads to a shift in the asset preference of wealth holders Their preference for tangible assets may be counterbalanced in the initial phases of inflation by an increase ininterest rate However in later stages of inflation even an upward movement in interestrate fails to neutralize the shift in asset preference
842019 Impact of Inflation on Purchasing Power
httpslidepdfcomreaderfullimpact-of-inflation-on-purchasing-power 1334
4 Inflation leads to balance of payments problems When domestic prices rise faster than prices in foreign countries exports tend to lag behind imports The rate of exchange alsotends to depreciate both on account of falling purchasing power of currency within thecountry and adverse balance of payments In some cases there may also be an outflow of capital A developed country may be able to handle the problem of adverse balance of
payments through structural adjustment but a developing country is not able to do soeasily because they suffer from large institutional and other rigidities
5 Inflation distorts the financial system of the country In its initial stages the system isable to withstand its adverse effect because the financial institutions by their very naturetend to ignore the purchasing power of money and operate with reference to interest ratesand maturity of financial instruments However when inflation gathers strength thefinancial system cannot withstand it and collapses
6 Once inflation crosses its earlier phases strain on the financial system speculationexpectations of further price rise and similar other forces lead to an increase in
unemployment and a fall in output Eventually in the final phase of inflation the outputand employment levels fall to abysmally low levels
7 First Inflation is a hidden tax as it leads to fall in purchasing power of money Ithappens particularly when authorities resort to deficit spending when their tax receiptslag behind and their expenditure does not decrease The taxpayers therefore lose onaccount of reduced purchasing power of their money incomes In other words theauthorities are able to collect resources from the taxpayers without specifically levyingadditional taxes on them Secondly when prices rise the fixed income earners find thatthe purchasing power of their money incomes is falling while the real income of the profit earners is increasing When inflation becomes still stronger the holders of financial
wealth also lose This way inflation is a hidden tax by entrepreneurs on consumers andon recipients of contractual incomes
842019 Impact of Inflation on Purchasing Power
httpslidepdfcomreaderfullimpact-of-inflation-on-purchasing-power 1434
Review of Literature
Figure 1 Consumer price indexes of representative economies from 2000 to 2008
(source ref 3 to16)
650
842019 Impact of Inflation on Purchasing Power
httpslidepdfcomreaderfullimpact-of-inflation-on-purchasing-power 1534
CPI 2000 2001 2002 2003 2004 2005 2006 2007 2008 (May)
United States 1740 1767 1809 1843 1903 1968 2018 2100 2166United Kingdom 937 947 963 973 987 1008 1036 1057 NAEuropean Union 908 926 948 966 989 1011 1031 1062 1082
Brazil 1000 1077 1202 1295 1371 1428 1459 1504 1560
Japan 1022 1015 1006 1003 1003 1000 1003 1003 1017
India 4410 4580 4770 4960 5140 5360 5630 6000 6360China 1004 1011 1003 1015 1055 1074 1090 1167 NA
Canada 970 977 1015 1036 1058 1080 1098 1124 1139
Australia 1313 1354 1395 1428 1465 1506 1555 1601 1622Mexico 932 974 1029 1070 1126 1163 1210 1256 1281
Russia 1000 1214 1406 1598 1773 1997 2190 2388 2709
South Africa 1000 1057 1154 1221 1238 1280 1340 1435 1515Saudi Arabia 989 978 980 986 989 996 1018 1060 1150
Figure 2 Relative purchasing power parity of representative economies from 2000 to
2008
23
842019 Impact of Inflation on Purchasing Power
httpslidepdfcomreaderfullimpact-of-inflation-on-purchasing-power 1634
Rel PPP exchange 2000 2001 2002 2003 2004 2005 2006 2007 2008
United States 1000 1000 1000 1000 1000 1000 1000 1000 1000
United Kingdom 1000 0995 0989 0980 0963 0951 0953 0935 NA
European Union 1000 1005 1004 1005 0996 0985 0979 0969 0958
Brazil 1000 1060 1156 1223 1254 1262 1258 1246 1253
Japan 1000 0978 0947 0927 0897 0865 0846 0813 0799
India 1000 1023 1040 1062 1066 1075 1101 1127 1158
China 1000 0992 0961 0954 0960 0945 0936 0963 NACanada 1000 0992 1006 1008 0997 0984 0976 0960 0943
Australia 1000 1015 1022 1027 1020 1014 1021 1010 0992
Mexico 1000 1028 1061 1083 1104 1103 1119 1116 1104
Russia 1000 1195 1352 1509 1621 1766 1888 1978 2176
South Africa 1000 1041 1110 1153 1132 1132 1155 1189 1217
Saudi Arabia 1000 0974 0953 0941 0914 0890 0888 0888 0934
Figure 3 PPP exchange rate published by the International Monetary Fund (IMF ref 2)
842019 Impact of Inflation on Purchasing Power
httpslidepdfcomreaderfullimpact-of-inflation-on-purchasing-power 1734
16
18
r
Note x100 for Japanese currency
Country 2000 2001 2002 2003 2004 2005 2006 2007
United States 1000 1000 1000 1000 1000 1000 1000 1000
United Kingdom 0645 0645 0654 0662 0663 0659 0661 0669
Germany 0934 0923 0919 0912 0893 0876 0866 0864
Brazil 0867 0909 0985 1111 1172 1211 1231 1270
Japan 1498 1448 1407 1364 1310 1266 1237 1233
India 8473 8570 8630 8803 9006 9235 9593 9989
China 1828 1822 1801 1813 1891 1917 1895 1929
Canada 1218 1203 1193 1207 1215 1221 1206 1211
Australia 1362 1380 1393 1406 1421 1451 1460 1477
Mexico 6195 6411 6737 7171 7501 7696 7792 7964
Russia 6833 7773 8833 9870 11507 13512 15326 16692
South Africa 2110 2219 2413 2476 2569 2633 2707 2808
Saudi Arabia 2678 2526 2554 2649 2864 3250 3534 3698
842019 Impact of Inflation on Purchasing Power
httpslidepdfcomreaderfullimpact-of-inflation-on-purchasing-power 1834
Figure 4 Changes of nominal exchange rate from 2000 to 2008
190
x c h a n g e R a t e
Change (E) Dec-00 Dec-01 Dec-02 Dec-03 Dec-04 Dec-05 Dec-06 Dec-07 Jun-08
US Dollar 10000 10000 10000 10000 10000 10000 10000 10000 10000Pound 10000 10299 9254 8292 7774 8627 7654 7576 7500Euro 10000 10463 8889 7349 6859 7781 7068 6342 5860Real 10000 11897 18205 14821 13641 11795 10974 9128 8205
Yen 10000 11491 10439 9386 9035 10351 10439 9747 9332
Rupee 10000 10310 10267 9733 9283 9626 9507 8388 9176
Yuan 10000 10000 10000 10000 10000 9783 9510 8816 8285
Can $ 10000 10600 10533 8600 8000 7800 7800 6600 6803
Aus $ 10000 10889 9889 7389 7167 7556 7056 6333 5787
Peso 10000 9542 10864 11696 11602 11061 11249 11363 10708
Rouble 10000 10780 11312 10390 9858 10213 9326 8723 8333
Rand 10000 15789 11316 8684 7500 8355 9276 9013 10263
Riyal 10000 10000 10000 10000 10000 10000 10000 10000 10000
842019 Impact of Inflation on Purchasing Power
httpslidepdfcomreaderfullimpact-of-inflation-on-purchasing-power 1934
Figure 5 Changes of real (CPI) exchange rate from 2000 to 2008
170
a n g e R a t e Change (e) Dec-00 Dec-01 Dec-02 Dec-03 Dec-04 Dec-05 Dec-06 Dec-07 Jun-08
United States 10000 10000 10000 10000 10000 10000 10000 10000 10000
United Kingdom 10000 10348 9361 8458 8071 9071 8029 8107 NA
European Union 10000 10412 8854 7313 6885 7902 7221 6543 6120
Brazil 10000 11221 15746 12122 10882 9343 8722 7327 6550
Japan 10000 11750 11025 10130 10069 11965 12336 11988 11675
India 10000 10082 9869 9166 8711 8957 8637 7442 7922China 10000 10085 10408 10477 10412 10348 10162 9155 NA
Canada 10000 10687 10466 8529 8022 7924 7992 6875 7213
Australia 10000 10723 9677 7196 7025 7450 6909 6270 5832
Mexico 10000 9282 10235 10797 10513 10031 10053 10186 9703
Russia 10000 9018 8365 6887 6081 5784 4939 4410 3830
South Africa 10000 15170 10195 7533 6626 7383 8029 7582 8434
Saudi Arabia 10000 10269 10492 10624 10937 11231 11267 11263 10707
842019 Impact of Inflation on Purchasing Power
httpslidepdfcomreaderfullimpact-of-inflation-on-purchasing-power 2034
Figure 6 Wage increase in different countries from 2000 to 2008 (source ref 1 3 to 14)
670
s e
Wage Increase 2000 2001 2002 2003 2004 2005 2006 2007 2008
United States 000 359 479 684 1060 1265 1658 1966 2291
United Kingdom 000 342 724 1125 1624 2055 2554 3033 3209European Union 000 267 531 750 955 1159 1405 1617 NA
Brazil 000 826 1551 1163 1050 1276 1839 5068 5720
Japan 000 -096 -385 -395 -472 -375 -279 -308 -1992
India 000 253 580 967 1379 2387 2929 3688 4123
China 000 1608 3257 4967 7058 9501 12347 NA NA
Canada 000 142 356 497 718 1063 1393 1758 2044
Australia 000 330 692 1087 1422 2021 2577 3073 3158
Mexico 000 1258 2010 2875 3480 4232 5140 -3118 NA
Russia 000 4575 9613 14737 20319 28484 37836 51147 66631
South Africa 000 956 2134 2613 3802 3988 5251 NA NA
842019 Impact of Inflation on Purchasing Power
httpslidepdfcomreaderfullimpact-of-inflation-on-purchasing-power 2134
Figure 7 Relative purchasing power parity from 2000 to 2008 after adjusting for wage
increase
12
13
e
s
Rel PPP adj for
wage 2000 2001 2002 2003 2004 2005 2006 2007 2008
United States 1000 1000 1000 1000 1000 1000 1000 1000 1000
United Kingdom 1000 0997 0966 0941 0916 0889 0885 0858 0000
European Union 1000 1014 0998 0997 1002 0989 0993 0988 NA
Brazil 1000 1014 1049 1170 1255 1261 1239 0989 0979
Japan 1000 1023 1032 1031 1042 1013 1015 1004 1227
India 1000 1033 1030 1034 1036 0977 0993 0985 1008
China 1000 0885 0759 0681 0623 0546 0488 0448 NA
Canada 1000 1013 1018 1026 1029 1002 0999 0977 0962
Australia 1000 1018 1002 0989 0988 0950 0947 0925 0927
Mexico 1000 0946 0926 0899 0905 0873 0862 1940 NA
Russia 1000 0850 0723 0652 0591 0517 0460 0387 0349
South Africa 1000 0984 0959 0976 0907 0911 0883 NA NA
842019 Impact of Inflation on Purchasing Power
httpslidepdfcomreaderfullimpact-of-inflation-on-purchasing-power 2234
Figure 8 Real exchange rate from 2000 to 2008 after adjusting for wage increase
1600
g e s Change e adj for
Wage 2000 2001 2002 2003 2004 2005 2006 2007
United States 10 000 10000 10000 100 00 10 000 1000 0 100 00 10000
United Kingdom 10000 10364 9147 8122 7679 8476 7456 7443
European Union 10000 10505 8804 7255 6929 7938 7327 6673Brazil 10000 10737 14285 11602 10891 9334 8588 5818Japan 10000 12290 12015 11267 11687 14004 14794 14800India 10000 10186 9774 8929 8467 8146 7787 6506China 10000 8999 8226 7479 6751 5978 5302 4260
Canada 10000 10916 10589 8681 8278 8068 8177 6997Australia 10000 10753 9484 6934 6802 6982 6405 5739Mexico 10000 8540 8929 8959 8626 7940 7741 NARussia 10000 6409 4469 2974 2218 1693 1204 863
South Africa 10000 14343 8804 6381 5309 5946 6137 NA
842019 Impact of Inflation on Purchasing Power
httpslidepdfcomreaderfullimpact-of-inflation-on-purchasing-power 2334
Table 1 Market exchange rate from 2000 to 2008
Nominal Exchange Rate (E) Dec-00 Dec-01 Dec-02 Dec-03 Dec-04 Dec-05 Dec-06 Dec-07 Jun-08US Dollar 10 10 10 10 10 10 10 10 10
British Pound 07 07 06 06 05 06 05 05 05Euro 11 11 10 08 07 08 08 07 06
Brazilian Real 20 23 36 29 27 23 21 18 16
Japanese Yen 1140 1310 1190 1070 1030 1180 1190 1111 1064Indian Rupee 468 482 480 455 434 450 444 392 429
Chinese Yuan 83 83 83 83 83 81 79 73 69
Canadian Dollar 15 16 16 13 12 12 12 10 10Australian Dollar 18 20 18 13 13 14 13 11 10
Mexico Peso 96 92 104 112 112 106 108 109 103
Russian Rouble 282 304 319 293 278 288 263 246 235South African Rand 76 120 86 66 57 64 71 69 78
Saudi Arabian Riyal 38 38 38 38 38 38 38 38 38
Table 2 Weekly Wages from 2000 to 2008
Weekly Wage (in US$) 2000 2001 2002 2003 2004 2005 2006 2007 2008United States 5850 6060 6130 6250 6470 6590 6820 7000 7190
United Kingdom 5286 5309 6126 7093 7905 7386 8670 9094 9310
European Union 3635 3567 4310 5327 5825 5239 5909 6725 00
Brazil 983 894 624 740 796 939 1060 1622 1883
Japan 6636 5719 6112 6791 6998 6170 6180 6599 5694
India 144 143 148 162 176 185 196 235 221
China 217 252 287 324 370 432 509 632 00
Canada 4370 4182 4297 5334 5855 6199 6384 7786 7738
Australia 3737 3545 4040 5608 5956 5946 6661 7714 8497
Mexico 771 910 853 849 896 993 1038
Russia 197 266 342 469 606 743 1011 1381 1812
South Africa 1641 1139 1760 2384 3021 2748 2699
Note The EU wage is an average of Germany France Italy and Spain
842019 Impact of Inflation on Purchasing Power
httpslidepdfcomreaderfullimpact-of-inflation-on-purchasing-power 2434
PURCHASING POWER PARITY
The purchasing power parity (PPP) theory uses the long-term equilibrium exchange
rate of two currencies to equalize their purchasing power Developed by Gustav Cassel in1920 it is based on the law of one price the theory states that in ideally efficientmarkets identical goods should have only one price
This purchasing power SEM rate equalizes the purchasing power of different currenciesin their home countries for a given basket of goods Using a PPP basis is arguably moreuseful when comparing differences in living standards on the whole between nations because PPP takes into account the relative cost of living and the inflation rates of different countries rather than just a nominal gross domestic product (GDP) comparisonThe best-known and most-used purchasing power parity exchange rate is the Geary-Khakis dollar (the international dollar)
PPP exchange rates (the real exchange rate) fluctuations are mostly due to marketexchange rates movements Aside from this volatility consistent deviations of the marketand PPP exchange rates are observed for example (market exchange rate) prices of non-traded goods and services are usually lower where incomes are lower (A US dollar exchanged and spent in India will buy more haircuts than a dollar spent in the UnitedStates) PPP takes into account this lower cost of living and adjusts for it as though allincome was spent locally In other words PPP is the amount of a certain basket of basicgoods which can be bought in the given country with the money it produces
There can be marked differences between PPP and market exchange rates [1] For
example the World Banks World Development Indicators 2005 estimated that in 2003one United States dollar was equivalent to about 18 Chinese Yuan by purchasing power parity [2] - considerably different from the nominal exchange rate that put one dollar equalto 76 Yuan This discrepancy has large implications for instance GDP per capita in thePeoples Republic of China is about US$1800 while on a PPP basis it is about US$7204This is frequently used to assert that China is the worlds second-largest economy butsuch a calculation would only be valid under the PPP theory At the other extremeJapans nominal GDP per capita is around US$37600 but its PPP figure is onlyUS$30615
842019 Impact of Inflation on Purchasing Power
httpslidepdfcomreaderfullimpact-of-inflation-on-purchasing-power 2534
First letrsquos look at the situation of domestic buying Gustav Cassel developed the purchasing power parity (PPP) theory in 1920 to compare the purchasing power of different currencies in their home countries based on the assumption that identical goodsshould have the same price (law of one price) PPP exchange rate is defined in Equation1
For
Dom
P
P PPP = (Eq 1)
Where PDom is domestic price and PFor is foreign price
The relative purchasing power parity relates the inflation rate (change of prices) in eachcountry to the change in the market exchange rate and is given in Equation 2
Dom
t
Dom
t
For t
For t
rel
P P
P P PPP
1
1
minus
minus
= (Eq 2)
Where Pt is the price level in period t To calculate the relative purchasing power parityof all of the goods and services consumed in a country we can substitute P t with theconsumer price index (CPI) of that country which leads to Equation 3
Dom
t
Dom
t
For
t
For
t
rel
CPI CPI
CPI CPI PPP
1
1
minus
minus
= (Eq 3)
Figure 1 shows the consumer price indexes of thirteen relatively large countries or economies The inflation rate is higher in the emerging economies than in the developedcountries because of the higher rate of economic growth
Figure 2 shows the changes in relative purchasing power parity of the above economiescalculated by Equation 3 By this calculation one may conclude that the US dollar hasappreciated against the Mexican Indian South African Brazilian and Russian currencies
by 10 to 217 while depreciated against the Australian European Canadian BritishChinese and Saudi Arabian currencies by 1 to 10 from 2000 to 2008 if theconsumptions are domestic This can be attributed to the difference in inflation rate of these countries Japanrsquos disinflation condition between 2000 and 2008 caused the USdollar to weaken approximately 20 over the same time period
842019 Impact of Inflation on Purchasing Power
httpslidepdfcomreaderfullimpact-of-inflation-on-purchasing-power 2634
The International Monetary Fund (IMF) has conducted similar calculation that includesmore factors such as gross domestic product (GDP) The PPP exchange rates published by the IMF are displayed in the following Figure 3 The data shown in Figure 2 areconsistent with the IMF data
It was recognized by many economists that the PPP exchange rate calculation is not perfect because of the difficulties in finding the same baskets of goods to compare acrosscountries The weighing of goods and services in the CPI index is not identical amongdifferent countries Often times the quality of goods and service purchased variesconsiderably for example Americans probably drive better cars and drink cleaner water than many people in developing countries Moreover many social benefits offered bythe welfare countries may not be included in the CPI calculations and this makes directcomparison of purchasing power difficult Nevertheless this methodology gives us arough idea how consumers are doing in different economies
REAL EXCHANGE RATE IN INTERNATIONAL TRADE
When consumers or businesses purchase goods and services from foreign countries theywill need to exchange the available domestic currency to foreign currencies in order tofulfill the trade The price of one currency in terms of another currency is called theexchange rate and it is determined by the currency market and in some cases by
individual governments The exchange rates of twelve foreign currencies to the USdollar from 2000 to 2008 are shown in Table 1 The US dollar depreciated against mostcurrencies in terms of market exchange rate after 2002 except for the Mexican Peso andBrazilian Real (until 2006)
Many people misunderstand the real prices if only the nominal (market) exchange rate isconsidered for the trade For example a three-bedroom apartment in China costs about1500000 Yuan while a similar apartment in the US cost about 400000 Dollar A post-doctorate position in Oxford University in England is paid about 40000 Pound per year
while a similar position in Massachusetts Institute of Technology in the US is paid60000 Dollar per year The market exchange rates do not reflect the real difference of the prices Therefore the real exchange rate which considers both the nominal exchangerate and prices should be used for international trade The real exchange rate is definedin Equation 4
For
Dom
P
P E Rate Exchangeal min Noe Rate Exchangeal Re times= )()( (Eq 4)
842019 Impact of Inflation on Purchasing Power
httpslidepdfcomreaderfullimpact-of-inflation-on-purchasing-power 2734
where PDom is domestic price and PFor is foreign price Using the above two examplesthe real exchange rates would be 18 Chinese apartment = 1 American apartment and075 Oxford salary = 1 MIT salary in 2008
If we substitute prices with CPI indexes in the above equation the real exchange for allthe goods and services can be estimated by Equation 5
For
Dom
CPI
CPI E e times= (Eq 5)
Figure 4 and Figure 5 show the percent changes of nominal exchange rate and real (CPI)exchange rate from 2000 to 2008 and the values are not the same When inflation (price
change) rates are taken into account the dollar actually strengthens against the JapaneseYen and Saudi Arabian Riyal while the advantage over the Peso and the Real (until 2005)diminished The magnitude of depreciation of the US dollar against the British Poundthe Euro the Canadian Dollar and the Chinese Yuan is 2-5 better in the real rate thanin the nominal rate On the other hand the dollar depreciated more against the IndianRupee the South African Rand (after 2002) and the Russian Ruble in the real rate than inthe nominal rate The real rate and the nominal rate for the Australian dollar are verysimilar This analysis indicates that one would make different decisions in buyingforeign goods and services when using the real exchange rate versus the nominalexchange rate
In addition if we compare the data in Figure 2 and Figure 5 it is obvious that the PPPexchange rate fluctuates less dramatically than the foreign exchange rate (except theRussian Ruble) In other words foreign exchange rates affect international trade morethan domestic consumption
WAGE FACTOR
Most consumers except the unemployed and retirees earn wages to make a livingEmployers usually give employees a small wages increase every year to offset inflationFigure 6 shows the percentage of wage increase in different countries The wage increasein the US EU and India is a few percent less than inflation over eight years while thewages in Canada Brazil and Australia outpaced inflation by a few percents in the same period The wage increase in UK Mexico South Africa China and Russia is even faster
842019 Impact of Inflation on Purchasing Power
httpslidepdfcomreaderfullimpact-of-inflation-on-purchasing-power 2834
double to triple digits gain over inflation is observed in these nations Japanrsquos wage isstagnant (or dropping slightly) from 2000 to 2008 It is unclear what exactly causes thesedifferences one may speculate that it may relate to the fiscal condition and account balance of the nations as well as how the governments want to regulate their economyFor example commodity producing countries is benefited from the recent purge of
commodity prices China has a large trade surplus the Japanese prices may have comedown from a very high level from decays ago It will be interested to see how the fastwage increase in some nations would impact their inflation situation in the future
The difference in wage changes certainly would have an impact to consumerrsquos purchasing power If we modify Equation 3 and Equation 5 for calculating relative PPPand real (CPI) exchange rate by a wage factor the following equations will results
For
t
For
t
Dom
t
Dom
t
Dom
t
Dom
t
For
t
For
t
rel
W W
W W
CPI CPI
CPI CPI PPP
1
1
1
1
minus
minus
minus
minus
times= (Eq 6)
For
Dom
For
Dom
W
W
CPI
CPI E e timestimes= (Eq 7)
where W denotes wages Using this modified calculation both domestic and foreign purchasing power will change Figure 7 and Figure 8 shows the relative PPP and realexchange rate after adjusting for wage increase After adjusting for wages the relativePPP become almost the same for the US EU Canada Japan (until 2007) India andBrazil (after 2006) Australia UK South Africa Mexico become the out performerswhich is not the case without adjusting for wages China and Russia demonstrate the bestimprovement in relative PPP because of the large increase of their wages
After adjusting for wages the buying power of Americans in international marketsweakens further relative to most foreign consumers except the Japanese Meanwhile thedepreciation of the US dollar against the Euro is about 5 less than before adjustment(using the 2008 figure) because of the wage advantage for Americans As pointed outearlier there are pitfalls for direct cross-comparison using the CPI index Additionallyother factors such as taxation may complicate the purchasing power calculation For example American income taxes are less than many industrialized countries while poorer nations probably donrsquot tax on income as much
842019 Impact of Inflation on Purchasing Power
httpslidepdfcomreaderfullimpact-of-inflation-on-purchasing-power 2934
Based on the above analysis the emerging economies have made big progress inenhancing the international purchasing power of their citizens thanks to increases of international trade employment and work force productivity Having said that the gap
of incomes between citizens of developed and developing countries are still quite large asshown in the Table 2 Additionally the consequences of environmental damages andincreased energy consumptions in developing countries due to rapid industrialization may be debatable issues
842019 Impact of Inflation on Purchasing Power
httpslidepdfcomreaderfullimpact-of-inflation-on-purchasing-power 3034
Conclusion
Exchange rate pricesinflation and wage level influence the purchasing power of consumers in domestic and international markets The domestic purchasing power ismainly affected by the inflation rate of individual countries and it is relatively equitableacross mature economies The international purchasing power is more volatile and isaffected by both exchange rate and prices Wage changes can further compensate or deprive purchasing power of consumers Analysis of current exchange rates prices andwages leads to the belief that foreign shoppers can get better bargains in Japan and theUS at the present time Consumers in emerging economies especially China and Russiahave experienced significant improvement in purchasing power recently when compared
to themselves They may catch up with the living standard of rich countries in the futureif this growth rate sustains Finally it will be interesting to research the fundamentaleconomic forces which influence the gauges that are measured in the articleWhen prices are rising you can buy less with a given amount of money When hotdogsare expensive a given amount of money will buy a small number of hotdogs But whenhotdogs are inexpensive that is the price is low your given hot dog allowance will purchase a lot more satisfaction There is a relationship between prices and purchasing power that is a reciprocal relationship and thatrsquos the relationship that wersquore going to bestudying in this lesson When prices are going from low prices to high prices that iswhen there is inflation in the economy the value of the dollar is shrinking that is your Purchasing power is going from being able to buy a lot to being able to buy a little Inthis lesson Irsquom going to begin by giving a simple numerical example and then wersquoll talk about how you can use the GDP deflator to show the relationship between the inflationrate and purchasing power
Letrsquos start by assuming that we are in a period of inflation and letrsquos let hotdogs be arepresentative good that is the price of all goods and services across the economy isincreasing at some general rate and wersquore going to look at the price of hotdogs in order toinfer what is happening to purchasing power as prices are rising Wersquore going to befocusing now on the reciprocal relationship between the price level and the purchasing power of the dollar that is what a dollar will buy as the price level is changing And Irsquovewritten out here as clearly as I can the formula that shows this reciprocal relationship thatis one over the price level equals the purchasing power of a dollar Let me make thisvery clear Letrsquos suppose that the price of a hotdog is five cents Well whatrsquos the purchasing power of your dollar Five cents is the same thing as one twentieth of adollar Therefore the reciprocal of one twentieth is twenty Your dollar will buy twentyhotdogs Thatrsquos its purchasing power
842019 Impact of Inflation on Purchasing Power
httpslidepdfcomreaderfullimpact-of-inflation-on-purchasing-power 3134
Now suppose wersquore in a period of inflation so that prices are rising and the price of ahotdog goes up to two dollars Whatrsquos happened to your purchasing power Well your dollar will no longer buy even a whole hotdog Two dollars or 2 has a reciprocal of onehalf that is you can now only afford half a hotdog Your purchasing power has shrunk from twenty hotdogs at a price of five cents a piece to one half a hotdog whenever the
price is two dollars per hotdog This simple example makes clear that the price level andthe purchasing power of the dollar are reciprocals
Now letrsquos look at some examples using the GDP deflator Suppose that wersquore in the year 2000 which is our base year for calculating the GDP deflator and we calculate the priceof a market basket of goods and services- that is a little bit of Housing and a little bit of transportation a little bit of medical care a little bit of clothingetc And wersquore going to call the price level in the year 2000 one hundred because itrsquos our base year
We look at those prices again in 2002 and we find that the price of the goods and
services as a ratio of the same prices in 2000 is equal to 104 That is prices haveincreased by about 4 percent between the year 2000 and 2002 So if we write the GDPdeflator not in the form we usually write it that is multiplied by 100 to get 104 but letrsquoswrite it now as in hundredths 104 to show the 4 percent increase in prices between theyear 2000 and 2002 Well whatrsquos happened to the purchasing power of a dollar betweenthe year 2000 and 2002 That is how much can we afford to buy in 2002 with a dollar if we measure it in the prices of the year 2000 Prices are higher in 2002 therefore thedollar wonrsquot buy as much Well if you takethe reciprocal of the GDP deflator 104 you get 096 Whatrsquos that saying Itrsquos saying thatwhat you could have bought for 96 cents back in the year 2000 now it costs you a dollar to buy in 2002 That is a dollar in 2002 is only worth what 96 cents was worth back inthe year 2000 You can afford to buy less Your purchasing power has shrunk by about 4 percent Your purchasing power shrinks at the same rate that the price level increases because the price level and your purchasing power are reciprocals of each other
Well letrsquos take another example during a period of deflation If we look at the years between 1929 and 1933 wersquoll see falling prices If we choose 1929 as the base year andif we call the price level in that 200000 or 100 if we look at prices in 1933 during thegreat depression we see that the price level has fallen by about 24 percent That is wersquovegone from 100 down to 076 So we now have lower prices in 1933 than we had in 1929
Now what does that mean What is going to happen to the purchasing power of your dollar when prices are lower Itrsquos clearly going to increase Yoursquore going to go from asmall purchasing power to a bigger purchasing power And if you takethe reciprocal of 76 percent you get 132 That is the purchasing power of the dollar hasincreased by about 32 percent in this example Now the reason the numbers donrsquot add upexactly the reason I canrsquot say a 24 percent decrease in prices is equal to a 24 percentincrease in purchasing power is because once your percentages start getting large yourun into this problem that a fifty percent increase is sorry that a 100 percent increase isthe reciprocal of a 50 percent decrease you wind up with this problem that wersquove
842019 Impact of Inflation on Purchasing Power
httpslidepdfcomreaderfullimpact-of-inflation-on-purchasing-power 3234
discussed earlier about the calculation of percentage changes but you can still use thisformula any time it always works One over the price level gives you the purchasing power of the dollar and when the price level is only 76 percent what it was before your purchasing power is going to be 132 percent of what it was before Falling prices give us an increase in the purchasing power of the dollar
842019 Impact of Inflation on Purchasing Power
httpslidepdfcomreaderfullimpact-of-inflation-on-purchasing-power 3334
REFERENCES
1 httpwwwworldsalariesorg
2 International Monetary Fund World Economic Outlook Database September
2006
3 Website of Australian Bureau of Statistics
4 Website of Blanco de Mexico
5 Website of Bank of England
6 Website of Central Bank of Brazil
7 Website of European Central bank
8 Website of International Organization of Labor
9 Website of the Labor Department of India
10 Website of the Ministry of Economics and Planning of Saudi Arabia
11 Website of the Ministry of Finance of the Russian Federation
12 Website of National Bureau of Statistics of China
13 Website of Statistics Bureau of Japan
14 Website of Statistics Canada
15 Website of Statistics South Africa
16 Website of the United States Labor Department
17 Website of Wikipedia on purchasing power parity and consumer price index
842019 Impact of Inflation on Purchasing Power
httpslidepdfcomreaderfullimpact-of-inflation-on-purchasing-power 3434

842019 Impact of Inflation on Purchasing Power
httpslidepdfcomreaderfullimpact-of-inflation-on-purchasing-power 234
Acknowledgements
I would like to thanks madam Iram for teaching the basic concepts of DevelopmentEconomics and My Mother for the helpful discussions on the subject and my Brother for proof reading the manuscript
842019 Impact of Inflation on Purchasing Power
httpslidepdfcomreaderfullimpact-of-inflation-on-purchasing-power 334
Topic
Impact of Inflation on purchasing power
Objectives
bull Learn
bull How we can measure inflation and purchasing power
bull Knowing about purchasing power parity
bull Tackle Inflation
bull Affect of inflation on purchasing power
Content
Phase I Acknowledgements
Abstract
Introduction
Phase II
Review of Literature
Phase III
Research Methodology
Phase IV
Conclusion
References
842019 Impact of Inflation on Purchasing Power
httpslidepdfcomreaderfullimpact-of-inflation-on-purchasing-power 434
Introduction of purchasing power
How Does Inflation Affect the Purchasing Power of Money
Inflation and Purchasing Products
Inflation and DebtDeflation and Purchasing ProductsDeflation and Debt
What is Inflation
Measures of inflation are
Producer Price IndicesCommodity price indicesGDP deflator Regional inflationAspect price inflationIssue in measuring7 most harmful effects of inflation
Review of literature
Consumer price indexes of representative economies from 2000 to 2008Relative purchasing power parity of representative economies from 2000 to 2008PPP exchange rate published by the International Monetary Fund (IMF ref 2)Changes of nominal exchange rate from 2000 to 2008Changes of real (CPI) exchange rate from 2000 to 2008Increase in different countries from 2000 to 2008 (source ref 1 3 to 14)Relative purchasing power parity from 2000 to 2008 after adjusting for wageReal exchange rate from 2000 to 2008 after adjusting for wage increaseMarket exchange rate from 2000 to 2008Weekly Wages from 2000 to 2008
Research MethodologyWhat is purchasing power parityUse of purchasing power parity
842019 Impact of Inflation on Purchasing Power
httpslidepdfcomreaderfullimpact-of-inflation-on-purchasing-power 534
Conclusion or Summery
References
842019 Impact of Inflation on Purchasing Power
httpslidepdfcomreaderfullimpact-of-inflation-on-purchasing-power 634
INTRODUCTION
The purchasing power of a consumer depends upon wealth and the prices of the goodsand services The customer can purchase domestically or from aboard if there is a freetrade condition If the purchase occurs in the international market exchange rate will play a role in calculating affordability Furthermore a consumer who is employed earnsincome while spending Hisher buying power also depends on the changes in wagesrelative to inflation This article discusses the factors such as exchange rate prices andwage level affecting the purchasing power of consumers who reside in various countriesin the world from 2000 to 2008
Inflation can be felt at gas pumps and grocery stores The official government consumer price inflation rate was 27 percent higher as of March compared to one year ago It had been zero for all of 2009 and 16 percent for all of 2010 which was the reason providedas to why social security checks did not require a cost-of-living-adjustment this year
However consumer price inflation is building and could easily rise to 4 to 5 percent bythe yearrsquos end and possibly even higher if there is no retreat in gas and food pricesProducer price inflation is already near 6 percent Incredibly however US government bond yields are implying low future inflation The US Treasury can borrow today at alow 34 percent rate for 10 years despite the very high budget deficit and plenty of money printing
Savers lose if there is unexpected inflation because of the loss in purchasing power of themoney saved Conversely borrowers win from unexpected inflation
How does this work The table below shows past returns for people who saved money
with a 10-year US Treasury For example someone who saved $100 via US Treasuryin 1950 would have accumulated $121 in at the end of the 10-year term assuming allannual interest payments have been saved However there was some inflation over thatdecade so their purchasing power was eroded to the point that the original $100investment would have provided only $102 in purchasing power after 10 years Other periods are shown below People who saved money at the start of 1970 actually came outwith much less purchasing power after 10 years
842019 Impact of Inflation on Purchasing Power
httpslidepdfcomreaderfullimpact-of-inflation-on-purchasing-power 734
What about going forward over the next 10 years If you invest $100 in the 10-year US
Treasury bond today you will have $131 in ten years based on todayrsquos 34 percent yieldIt is unlikely that we will experience the same kind of inflation seen in the 1970sHowever if such a high rate of inflation were to occur then the $131 cumulative savingsafter 10 years would translate into only $64 in purchasing power On the other hand if there is low inflation like in the 1950s then the saver would have $104 in purchasing power
Purchasing power
Purchasing power is the number of goodsservices that can be purchased with a unit of currency For example if you had taken one dollar to a store in the 1950s you would
have been able to buy a greater number of items than you would today indicating thatyou would have had a greater purchasing power in the 1950s Currency can be either acommodity money like gold or silver or fiat currency or free-floating market-valuedcurrency like US dollars As Adam Smith noted having money gives one the ability tocommand others labor so purchasing power to some extent is power over other peopleto the extent that they are willing to trade their labor or goods for money or currency
If ones monetary income stays the same but the price level increases the purchasing power of that income falls Inflation does not always imply falling purchasing power of ones money income since it may rise faster than the price level A higher real income means a higher purchasing power since real income refers to the income adjusted for
inflation
For a price index its value in the base year is usually normalized to a value of 100 The purchasing power of a unit of currency say a dollar in a given year expressed in dollarsof the base year is 100 P where P is the price index in that year So by definition the purchasing power of a dollar decreases as the price level rises The purchasing power intodays money of an amount C of money t years into the future can be computed withthe formula for the present value
842019 Impact of Inflation on Purchasing Power
httpslidepdfcomreaderfullimpact-of-inflation-on-purchasing-power 834
Where in this case i is an assumed future annual inflation rate
How Does Inflation Affect The Purchasing Power of Money
Inflation affects how people can spend money Inflation is an economic phenomenon thathas an increasing change in the price of goods and services A closely linked phenomenon to inflation is deflation sometimes called negative inflation Deflationoccurs when there is a decreasing change in the price of goods and services Inflation anddeflation affect how a consumer can buy goods and the value of debt Inflation can occur in wages or prices
Measuring Inflation
Price inflation is typically measured using the consumer price index (CPI) The UnitedStates Bureau of Labor Statistics keeps track of the CPI The CPI takes a constant basketof goods and sees how the price changes from year to year If the price of the basket of goods increases then there is price inflation If the price of the basket of goods decreasesthen there is deflation People measure wage inflation using the employment cost indexThe employment cost index shows how the cost of labor increases or decreases over a period of time
Inflation and Purchasing ProductsPrice inflation decreases peoples ability to pay for goods The concept at a basic levelsays if an employees wages remain steady but the cost of goods increases then theemployee can afford fewer goods As wage inflation occurs people will be able to buymore products A general misconception is that when wages rise prices also rise andaccording to the Federal Reserve Bank of Cleveland there is little support that wageinflations cause price inflation
Inflation and Debt
Price inflation is a debtors best friend and a creditors worst enemy As the pricesincrease the amount borrowed will deteriorate in value so the debtor is paying back lessmoney and the creditor is receiving less money For example a student borrows $100000in 2005 and then inflation occurs over the next couple years Inflation then makes that$100000 comparatively worth only $80000 due to the increase in prices When wagesinflate both the borrowers and the creditors win The borrowers can repay their loansquicker due to higher income The borrowers then should receive loan payments quicker if the borrowers pay back their loans with the increased wages
842019 Impact of Inflation on Purchasing Power
httpslidepdfcomreaderfullimpact-of-inflation-on-purchasing-power 934
Deflation and Purchasing Products
Deflation has the opposite affect of inflation in that consumers will be able to buy more productsas the price for the product decreases Deflation however is not good for the overall economyand can be worse than inflation If a company has costs sunk into production before deflationthese costs will not readjust to the deflation Since the costs remain high to the price of moneythe company will receive less revenue when the product sells at a deflated price As wagesdeflate consumers can buy less with their money because their disposable income is decreased
Deflation and Debt
Deflation and debt has the opposite affect as inflation Debtors will pay back more money than theycomparatively took out and creditors will receive more money As wages deflate people may have a harder time paying off debt which will increase the number of defaults by borrowers
INFLATION
In economics inflation is a rise in the general level of prices of goods and services in aneconomy over a period of time When the general price level rises each unit of currency buys fewer goods and services Consequently inflation also reflects erosion in the purchasing power of money ndash a loss of real value in the internal medium of exchange andunit of account in the economy A chief measure of price inflation is the inflation rate theannualized percentage change in a general price index (normally the Consumer Price Index) over time
Measures of inflation are
Inflation is usually estimated by calculating the inflation rate of a price index usually theConsumer Price Index] The Consumer Price Index measures prices of a selection of goods and services purchased by a typical consumer The inflation rate is the percentage rate of change of a price index over time
For instance in January 2007 the US Consumer Price Index was 202416 and inJanuary 2008 it was 211080 The formula for calculating the annual percentage rateinflation in the CPI over the course of 2007 is
The resulting inflation rate for the CPI in this one year period is 428 meaning thegeneral level of prices for typical US consumers rose by approximately four percentin 2007
Other widely used price indices for calculating price inflation include the following
842019 Impact of Inflation on Purchasing Power
httpslidepdfcomreaderfullimpact-of-inflation-on-purchasing-power 1034
bull Producer price indices (PPIs) which measures average changes in pricesreceived by domestic producers for their output This differs from the CPI in that price subsidization profits and taxes may cause the amount received by the producer to differ from what the consumer paid There is also typically a delay between an increase in the PPI and any eventual increase in the CPI Producer
price index measures the pressure being put on producers by the costs of their raw materials This could be passed on to consumers or it could be absorbed by profits or offset by increasing productivity In India and the United States anearlier version of the PPI was called the Wholesale Price Indexbull Commodity price indices which measure the price of a selection of commodities In the present commodity price indices are weighted by the relativeimportance of the components to the all in cost of an employeebull Core price indices because food and oil prices can change quickly due tochanges in supply and demand conditions in the food and oil markets it can bedifficult to detect the long run trend in price levels when those prices areincluded Therefore most statistical agencies also report a measure of core
inflation which removes the most volatile components (such as food and oil)from a broad price index like the CPI Because core inflation is less affected byshort run supply and demand conditions in specific markets central banks rely onit to better measure the inflationary impact of current monetary policy
Other common measures of inflation are
bull GDP deflator is a measure of the price of all the goods and servicesincluded in gross domestic product (GDP) The US Commerce Department publishes a deflator series for US GDP defined as its nominal GDP measuredivided by its real GDP measurebull
Regional inflation The Bureau of Labor Statistics breaks down CPI-Ucalculations down to different regions of the USbull Historical inflation Before collecting consistent econometric data becamestandard for governments and for the purpose of comparing absolute rather thanrelative standards of living various economists have calculated imputed inflationfigures Most inflation data before the early 20th century is imputed based on theknown costs of goods rather than compiled at the time It is also used to adjustfor the differences in real standard of living for the presence of technologybull Asset price inflation is an undue increase in the prices of real or financialassets such as stock (equity) and real estate While there is no widely acceptedindex of this type some central bankers have suggested that it would be better toaim at stabilizing a wider general price level inflation measure that includes someasset prices instead of stabilizing CPI or core inflation only The reason is that byraising interest rates when stock prices or real estate prices rise and loweringthem when these asset prices fall central banks might be more successful inavoiding bubbles and crashes in asset prices
842019 Impact of Inflation on Purchasing Power
httpslidepdfcomreaderfullimpact-of-inflation-on-purchasing-power 1134
Issues in measuring
Measuring inflation in an economy requires objective means of differentiating changes in
nominal prices on a common set of goods and services and distinguishing them fromthose price shifts resulting from changes in value such as volume quality or performance For example if the price of a 10 oz can of corn changes from $090 to$100 over the course of a year with no change in quality then this price differencerepresents inflation This single price change would not however represent generalinflation in an overall economy To measure overall inflation the price change of a largebasket of representative goods and services is measured This is the purpose of a price index which is the combined price of a basket of many goods and services Thecombined price is the sum of the weighted average prices of items in the basket Aweighted price is calculated by multiplying the unit price of an item to the number of those items the average consumer purchases Weighted pricing is a necessary means to
measuring the impact of individual unit price changes on the economys overall inflationThe Consumer Price Index for example uses data collected by surveying households todetermine what proportion of the typical consumers overall spending is spent on specificgoods and services and weights the average prices of those items accordingly Thoseweighted average prices are combined to calculate the overall price To better relate pricechanges over time indexes typically choose a base year price and assign it a value of 100 Index prices in subsequent years are then expressed in relation to the base year priceWhile comparing inflation measures for various periods one has to take intoconsideration the Base effect (inflation) as well
Inflation measures are often modified over time either for the relative weight of goods in
the basket or in the way in which goods and services from the present are compared withgoods and services from the past Over time adjustments are made to the type of goodsand services selected in order to reflect changes in the sorts of goods and services purchased by typical consumers New products may be introduced older productsdisappear the quality of existing products may change and consumer preferences canshift Both the sorts of goods and services which are included in the basket and theweighted price used in inflation measures will be changed over time in order to keep pacewith the changing marketplace
Inflation numbers are often seasonally adjusted in order to differentiate expected cyclicalcost shifts For example home heating costs are expected to rise in colder months and
seasonal adjustments are often used when measuring for inflation to compensate for cyclical spikes in energy or fuel demand Inflation numbers may be averaged or otherwise subjected to statistical techniques in order to remove statistical noise andvolatility of individual prices
When looking at inflation economic institutions may focus only on certain kinds of prices or special indices such as the core inflation index which is used by central banksto formulate monetary policy Most inflation indices are calculated from weighted
842019 Impact of Inflation on Purchasing Power
httpslidepdfcomreaderfullimpact-of-inflation-on-purchasing-power 1234
averages of selected price changes This necessarily introduces distortion and can lead tolegitimate disputes about what the true inflation rate is This problem can be overcome byincluding all available price changes in the calculation and then choosing the median value
7 most harmful effects of Inflation on different aspects of a developing country like India
Why should we be concerned with the problem of inflation The answer lies in two facts
I Left to itself inflation would move from its initial beneficiary stage to that of a harmfulone For this reason it is necessary to prevent inflation from gaining strength
II A stronger inflation is more difficult to control than a mild one And there is no way to
control a hyperinflation
The beneficial effects of inflation are limited to only its initial phase when the price riseis sufficiently mild During that period there is a favorable impact upon both output andemployment The increase in prices and distributive inequalities are more thancounterbalanced by gains in output and employment
However once inflationary process gathers some strength its ill effects come todominate the scene These have been discussed above and would be only brieflyenumerated here
1 Right from the beginning inflation adds to inequalities of income and wealthHowever in its last phase it is not longer able to do so because money ceases to beanacceptable store of value It is a generally agreed statement that inequalities reduceaggregate social welfare and should be avoided provided in the process productionactivity does not suffer
2 Every economy needs a continuous addition to its productive capacity for which itshould encourage capital formation In a money economy capital formation takes placewhen a part of money income is saved and transferred to the investors who in turn use itfor investment and capital formation However inflation by its very nature discouragessaving activity It makes consumption more attractive than saving
The adverse impact on saving and capital formation is more serious for-anunderdeveloped country because it needs a higher rate of capital accumulation
3 Inflation leads to a shift in the asset preference of wealth holders Their preference for tangible assets may be counterbalanced in the initial phases of inflation by an increase ininterest rate However in later stages of inflation even an upward movement in interestrate fails to neutralize the shift in asset preference
842019 Impact of Inflation on Purchasing Power
httpslidepdfcomreaderfullimpact-of-inflation-on-purchasing-power 1334
4 Inflation leads to balance of payments problems When domestic prices rise faster than prices in foreign countries exports tend to lag behind imports The rate of exchange alsotends to depreciate both on account of falling purchasing power of currency within thecountry and adverse balance of payments In some cases there may also be an outflow of capital A developed country may be able to handle the problem of adverse balance of
payments through structural adjustment but a developing country is not able to do soeasily because they suffer from large institutional and other rigidities
5 Inflation distorts the financial system of the country In its initial stages the system isable to withstand its adverse effect because the financial institutions by their very naturetend to ignore the purchasing power of money and operate with reference to interest ratesand maturity of financial instruments However when inflation gathers strength thefinancial system cannot withstand it and collapses
6 Once inflation crosses its earlier phases strain on the financial system speculationexpectations of further price rise and similar other forces lead to an increase in
unemployment and a fall in output Eventually in the final phase of inflation the outputand employment levels fall to abysmally low levels
7 First Inflation is a hidden tax as it leads to fall in purchasing power of money Ithappens particularly when authorities resort to deficit spending when their tax receiptslag behind and their expenditure does not decrease The taxpayers therefore lose onaccount of reduced purchasing power of their money incomes In other words theauthorities are able to collect resources from the taxpayers without specifically levyingadditional taxes on them Secondly when prices rise the fixed income earners find thatthe purchasing power of their money incomes is falling while the real income of the profit earners is increasing When inflation becomes still stronger the holders of financial
wealth also lose This way inflation is a hidden tax by entrepreneurs on consumers andon recipients of contractual incomes
842019 Impact of Inflation on Purchasing Power
httpslidepdfcomreaderfullimpact-of-inflation-on-purchasing-power 1434
Review of Literature
Figure 1 Consumer price indexes of representative economies from 2000 to 2008
(source ref 3 to16)
650
842019 Impact of Inflation on Purchasing Power
httpslidepdfcomreaderfullimpact-of-inflation-on-purchasing-power 1534
CPI 2000 2001 2002 2003 2004 2005 2006 2007 2008 (May)
United States 1740 1767 1809 1843 1903 1968 2018 2100 2166United Kingdom 937 947 963 973 987 1008 1036 1057 NAEuropean Union 908 926 948 966 989 1011 1031 1062 1082
Brazil 1000 1077 1202 1295 1371 1428 1459 1504 1560
Japan 1022 1015 1006 1003 1003 1000 1003 1003 1017
India 4410 4580 4770 4960 5140 5360 5630 6000 6360China 1004 1011 1003 1015 1055 1074 1090 1167 NA
Canada 970 977 1015 1036 1058 1080 1098 1124 1139
Australia 1313 1354 1395 1428 1465 1506 1555 1601 1622Mexico 932 974 1029 1070 1126 1163 1210 1256 1281
Russia 1000 1214 1406 1598 1773 1997 2190 2388 2709
South Africa 1000 1057 1154 1221 1238 1280 1340 1435 1515Saudi Arabia 989 978 980 986 989 996 1018 1060 1150
Figure 2 Relative purchasing power parity of representative economies from 2000 to
2008
23
842019 Impact of Inflation on Purchasing Power
httpslidepdfcomreaderfullimpact-of-inflation-on-purchasing-power 1634
Rel PPP exchange 2000 2001 2002 2003 2004 2005 2006 2007 2008
United States 1000 1000 1000 1000 1000 1000 1000 1000 1000
United Kingdom 1000 0995 0989 0980 0963 0951 0953 0935 NA
European Union 1000 1005 1004 1005 0996 0985 0979 0969 0958
Brazil 1000 1060 1156 1223 1254 1262 1258 1246 1253
Japan 1000 0978 0947 0927 0897 0865 0846 0813 0799
India 1000 1023 1040 1062 1066 1075 1101 1127 1158
China 1000 0992 0961 0954 0960 0945 0936 0963 NACanada 1000 0992 1006 1008 0997 0984 0976 0960 0943
Australia 1000 1015 1022 1027 1020 1014 1021 1010 0992
Mexico 1000 1028 1061 1083 1104 1103 1119 1116 1104
Russia 1000 1195 1352 1509 1621 1766 1888 1978 2176
South Africa 1000 1041 1110 1153 1132 1132 1155 1189 1217
Saudi Arabia 1000 0974 0953 0941 0914 0890 0888 0888 0934
Figure 3 PPP exchange rate published by the International Monetary Fund (IMF ref 2)
842019 Impact of Inflation on Purchasing Power
httpslidepdfcomreaderfullimpact-of-inflation-on-purchasing-power 1734
16
18
r
Note x100 for Japanese currency
Country 2000 2001 2002 2003 2004 2005 2006 2007
United States 1000 1000 1000 1000 1000 1000 1000 1000
United Kingdom 0645 0645 0654 0662 0663 0659 0661 0669
Germany 0934 0923 0919 0912 0893 0876 0866 0864
Brazil 0867 0909 0985 1111 1172 1211 1231 1270
Japan 1498 1448 1407 1364 1310 1266 1237 1233
India 8473 8570 8630 8803 9006 9235 9593 9989
China 1828 1822 1801 1813 1891 1917 1895 1929
Canada 1218 1203 1193 1207 1215 1221 1206 1211
Australia 1362 1380 1393 1406 1421 1451 1460 1477
Mexico 6195 6411 6737 7171 7501 7696 7792 7964
Russia 6833 7773 8833 9870 11507 13512 15326 16692
South Africa 2110 2219 2413 2476 2569 2633 2707 2808
Saudi Arabia 2678 2526 2554 2649 2864 3250 3534 3698
842019 Impact of Inflation on Purchasing Power
httpslidepdfcomreaderfullimpact-of-inflation-on-purchasing-power 1834
Figure 4 Changes of nominal exchange rate from 2000 to 2008
190
x c h a n g e R a t e
Change (E) Dec-00 Dec-01 Dec-02 Dec-03 Dec-04 Dec-05 Dec-06 Dec-07 Jun-08
US Dollar 10000 10000 10000 10000 10000 10000 10000 10000 10000Pound 10000 10299 9254 8292 7774 8627 7654 7576 7500Euro 10000 10463 8889 7349 6859 7781 7068 6342 5860Real 10000 11897 18205 14821 13641 11795 10974 9128 8205
Yen 10000 11491 10439 9386 9035 10351 10439 9747 9332
Rupee 10000 10310 10267 9733 9283 9626 9507 8388 9176
Yuan 10000 10000 10000 10000 10000 9783 9510 8816 8285
Can $ 10000 10600 10533 8600 8000 7800 7800 6600 6803
Aus $ 10000 10889 9889 7389 7167 7556 7056 6333 5787
Peso 10000 9542 10864 11696 11602 11061 11249 11363 10708
Rouble 10000 10780 11312 10390 9858 10213 9326 8723 8333
Rand 10000 15789 11316 8684 7500 8355 9276 9013 10263
Riyal 10000 10000 10000 10000 10000 10000 10000 10000 10000
842019 Impact of Inflation on Purchasing Power
httpslidepdfcomreaderfullimpact-of-inflation-on-purchasing-power 1934
Figure 5 Changes of real (CPI) exchange rate from 2000 to 2008
170
a n g e R a t e Change (e) Dec-00 Dec-01 Dec-02 Dec-03 Dec-04 Dec-05 Dec-06 Dec-07 Jun-08
United States 10000 10000 10000 10000 10000 10000 10000 10000 10000
United Kingdom 10000 10348 9361 8458 8071 9071 8029 8107 NA
European Union 10000 10412 8854 7313 6885 7902 7221 6543 6120
Brazil 10000 11221 15746 12122 10882 9343 8722 7327 6550
Japan 10000 11750 11025 10130 10069 11965 12336 11988 11675
India 10000 10082 9869 9166 8711 8957 8637 7442 7922China 10000 10085 10408 10477 10412 10348 10162 9155 NA
Canada 10000 10687 10466 8529 8022 7924 7992 6875 7213
Australia 10000 10723 9677 7196 7025 7450 6909 6270 5832
Mexico 10000 9282 10235 10797 10513 10031 10053 10186 9703
Russia 10000 9018 8365 6887 6081 5784 4939 4410 3830
South Africa 10000 15170 10195 7533 6626 7383 8029 7582 8434
Saudi Arabia 10000 10269 10492 10624 10937 11231 11267 11263 10707
842019 Impact of Inflation on Purchasing Power
httpslidepdfcomreaderfullimpact-of-inflation-on-purchasing-power 2034
Figure 6 Wage increase in different countries from 2000 to 2008 (source ref 1 3 to 14)
670
s e
Wage Increase 2000 2001 2002 2003 2004 2005 2006 2007 2008
United States 000 359 479 684 1060 1265 1658 1966 2291
United Kingdom 000 342 724 1125 1624 2055 2554 3033 3209European Union 000 267 531 750 955 1159 1405 1617 NA
Brazil 000 826 1551 1163 1050 1276 1839 5068 5720
Japan 000 -096 -385 -395 -472 -375 -279 -308 -1992
India 000 253 580 967 1379 2387 2929 3688 4123
China 000 1608 3257 4967 7058 9501 12347 NA NA
Canada 000 142 356 497 718 1063 1393 1758 2044
Australia 000 330 692 1087 1422 2021 2577 3073 3158
Mexico 000 1258 2010 2875 3480 4232 5140 -3118 NA
Russia 000 4575 9613 14737 20319 28484 37836 51147 66631
South Africa 000 956 2134 2613 3802 3988 5251 NA NA
842019 Impact of Inflation on Purchasing Power
httpslidepdfcomreaderfullimpact-of-inflation-on-purchasing-power 2134
Figure 7 Relative purchasing power parity from 2000 to 2008 after adjusting for wage
increase
12
13
e
s
Rel PPP adj for
wage 2000 2001 2002 2003 2004 2005 2006 2007 2008
United States 1000 1000 1000 1000 1000 1000 1000 1000 1000
United Kingdom 1000 0997 0966 0941 0916 0889 0885 0858 0000
European Union 1000 1014 0998 0997 1002 0989 0993 0988 NA
Brazil 1000 1014 1049 1170 1255 1261 1239 0989 0979
Japan 1000 1023 1032 1031 1042 1013 1015 1004 1227
India 1000 1033 1030 1034 1036 0977 0993 0985 1008
China 1000 0885 0759 0681 0623 0546 0488 0448 NA
Canada 1000 1013 1018 1026 1029 1002 0999 0977 0962
Australia 1000 1018 1002 0989 0988 0950 0947 0925 0927
Mexico 1000 0946 0926 0899 0905 0873 0862 1940 NA
Russia 1000 0850 0723 0652 0591 0517 0460 0387 0349
South Africa 1000 0984 0959 0976 0907 0911 0883 NA NA
842019 Impact of Inflation on Purchasing Power
httpslidepdfcomreaderfullimpact-of-inflation-on-purchasing-power 2234
Figure 8 Real exchange rate from 2000 to 2008 after adjusting for wage increase
1600
g e s Change e adj for
Wage 2000 2001 2002 2003 2004 2005 2006 2007
United States 10 000 10000 10000 100 00 10 000 1000 0 100 00 10000
United Kingdom 10000 10364 9147 8122 7679 8476 7456 7443
European Union 10000 10505 8804 7255 6929 7938 7327 6673Brazil 10000 10737 14285 11602 10891 9334 8588 5818Japan 10000 12290 12015 11267 11687 14004 14794 14800India 10000 10186 9774 8929 8467 8146 7787 6506China 10000 8999 8226 7479 6751 5978 5302 4260
Canada 10000 10916 10589 8681 8278 8068 8177 6997Australia 10000 10753 9484 6934 6802 6982 6405 5739Mexico 10000 8540 8929 8959 8626 7940 7741 NARussia 10000 6409 4469 2974 2218 1693 1204 863
South Africa 10000 14343 8804 6381 5309 5946 6137 NA
842019 Impact of Inflation on Purchasing Power
httpslidepdfcomreaderfullimpact-of-inflation-on-purchasing-power 2334
Table 1 Market exchange rate from 2000 to 2008
Nominal Exchange Rate (E) Dec-00 Dec-01 Dec-02 Dec-03 Dec-04 Dec-05 Dec-06 Dec-07 Jun-08US Dollar 10 10 10 10 10 10 10 10 10
British Pound 07 07 06 06 05 06 05 05 05Euro 11 11 10 08 07 08 08 07 06
Brazilian Real 20 23 36 29 27 23 21 18 16
Japanese Yen 1140 1310 1190 1070 1030 1180 1190 1111 1064Indian Rupee 468 482 480 455 434 450 444 392 429
Chinese Yuan 83 83 83 83 83 81 79 73 69
Canadian Dollar 15 16 16 13 12 12 12 10 10Australian Dollar 18 20 18 13 13 14 13 11 10
Mexico Peso 96 92 104 112 112 106 108 109 103
Russian Rouble 282 304 319 293 278 288 263 246 235South African Rand 76 120 86 66 57 64 71 69 78
Saudi Arabian Riyal 38 38 38 38 38 38 38 38 38
Table 2 Weekly Wages from 2000 to 2008
Weekly Wage (in US$) 2000 2001 2002 2003 2004 2005 2006 2007 2008United States 5850 6060 6130 6250 6470 6590 6820 7000 7190
United Kingdom 5286 5309 6126 7093 7905 7386 8670 9094 9310
European Union 3635 3567 4310 5327 5825 5239 5909 6725 00
Brazil 983 894 624 740 796 939 1060 1622 1883
Japan 6636 5719 6112 6791 6998 6170 6180 6599 5694
India 144 143 148 162 176 185 196 235 221
China 217 252 287 324 370 432 509 632 00
Canada 4370 4182 4297 5334 5855 6199 6384 7786 7738
Australia 3737 3545 4040 5608 5956 5946 6661 7714 8497
Mexico 771 910 853 849 896 993 1038
Russia 197 266 342 469 606 743 1011 1381 1812
South Africa 1641 1139 1760 2384 3021 2748 2699
Note The EU wage is an average of Germany France Italy and Spain
842019 Impact of Inflation on Purchasing Power
httpslidepdfcomreaderfullimpact-of-inflation-on-purchasing-power 2434
PURCHASING POWER PARITY
The purchasing power parity (PPP) theory uses the long-term equilibrium exchange
rate of two currencies to equalize their purchasing power Developed by Gustav Cassel in1920 it is based on the law of one price the theory states that in ideally efficientmarkets identical goods should have only one price
This purchasing power SEM rate equalizes the purchasing power of different currenciesin their home countries for a given basket of goods Using a PPP basis is arguably moreuseful when comparing differences in living standards on the whole between nations because PPP takes into account the relative cost of living and the inflation rates of different countries rather than just a nominal gross domestic product (GDP) comparisonThe best-known and most-used purchasing power parity exchange rate is the Geary-Khakis dollar (the international dollar)
PPP exchange rates (the real exchange rate) fluctuations are mostly due to marketexchange rates movements Aside from this volatility consistent deviations of the marketand PPP exchange rates are observed for example (market exchange rate) prices of non-traded goods and services are usually lower where incomes are lower (A US dollar exchanged and spent in India will buy more haircuts than a dollar spent in the UnitedStates) PPP takes into account this lower cost of living and adjusts for it as though allincome was spent locally In other words PPP is the amount of a certain basket of basicgoods which can be bought in the given country with the money it produces
There can be marked differences between PPP and market exchange rates [1] For
example the World Banks World Development Indicators 2005 estimated that in 2003one United States dollar was equivalent to about 18 Chinese Yuan by purchasing power parity [2] - considerably different from the nominal exchange rate that put one dollar equalto 76 Yuan This discrepancy has large implications for instance GDP per capita in thePeoples Republic of China is about US$1800 while on a PPP basis it is about US$7204This is frequently used to assert that China is the worlds second-largest economy butsuch a calculation would only be valid under the PPP theory At the other extremeJapans nominal GDP per capita is around US$37600 but its PPP figure is onlyUS$30615
842019 Impact of Inflation on Purchasing Power
httpslidepdfcomreaderfullimpact-of-inflation-on-purchasing-power 2534
First letrsquos look at the situation of domestic buying Gustav Cassel developed the purchasing power parity (PPP) theory in 1920 to compare the purchasing power of different currencies in their home countries based on the assumption that identical goodsshould have the same price (law of one price) PPP exchange rate is defined in Equation1
For
Dom
P
P PPP = (Eq 1)
Where PDom is domestic price and PFor is foreign price
The relative purchasing power parity relates the inflation rate (change of prices) in eachcountry to the change in the market exchange rate and is given in Equation 2
Dom
t
Dom
t
For t
For t
rel
P P
P P PPP
1
1
minus
minus
= (Eq 2)
Where Pt is the price level in period t To calculate the relative purchasing power parityof all of the goods and services consumed in a country we can substitute P t with theconsumer price index (CPI) of that country which leads to Equation 3
Dom
t
Dom
t
For
t
For
t
rel
CPI CPI
CPI CPI PPP
1
1
minus
minus
= (Eq 3)
Figure 1 shows the consumer price indexes of thirteen relatively large countries or economies The inflation rate is higher in the emerging economies than in the developedcountries because of the higher rate of economic growth
Figure 2 shows the changes in relative purchasing power parity of the above economiescalculated by Equation 3 By this calculation one may conclude that the US dollar hasappreciated against the Mexican Indian South African Brazilian and Russian currencies
by 10 to 217 while depreciated against the Australian European Canadian BritishChinese and Saudi Arabian currencies by 1 to 10 from 2000 to 2008 if theconsumptions are domestic This can be attributed to the difference in inflation rate of these countries Japanrsquos disinflation condition between 2000 and 2008 caused the USdollar to weaken approximately 20 over the same time period
842019 Impact of Inflation on Purchasing Power
httpslidepdfcomreaderfullimpact-of-inflation-on-purchasing-power 2634
The International Monetary Fund (IMF) has conducted similar calculation that includesmore factors such as gross domestic product (GDP) The PPP exchange rates published by the IMF are displayed in the following Figure 3 The data shown in Figure 2 areconsistent with the IMF data
It was recognized by many economists that the PPP exchange rate calculation is not perfect because of the difficulties in finding the same baskets of goods to compare acrosscountries The weighing of goods and services in the CPI index is not identical amongdifferent countries Often times the quality of goods and service purchased variesconsiderably for example Americans probably drive better cars and drink cleaner water than many people in developing countries Moreover many social benefits offered bythe welfare countries may not be included in the CPI calculations and this makes directcomparison of purchasing power difficult Nevertheless this methodology gives us arough idea how consumers are doing in different economies
REAL EXCHANGE RATE IN INTERNATIONAL TRADE
When consumers or businesses purchase goods and services from foreign countries theywill need to exchange the available domestic currency to foreign currencies in order tofulfill the trade The price of one currency in terms of another currency is called theexchange rate and it is determined by the currency market and in some cases by
individual governments The exchange rates of twelve foreign currencies to the USdollar from 2000 to 2008 are shown in Table 1 The US dollar depreciated against mostcurrencies in terms of market exchange rate after 2002 except for the Mexican Peso andBrazilian Real (until 2006)
Many people misunderstand the real prices if only the nominal (market) exchange rate isconsidered for the trade For example a three-bedroom apartment in China costs about1500000 Yuan while a similar apartment in the US cost about 400000 Dollar A post-doctorate position in Oxford University in England is paid about 40000 Pound per year
while a similar position in Massachusetts Institute of Technology in the US is paid60000 Dollar per year The market exchange rates do not reflect the real difference of the prices Therefore the real exchange rate which considers both the nominal exchangerate and prices should be used for international trade The real exchange rate is definedin Equation 4
For
Dom
P
P E Rate Exchangeal min Noe Rate Exchangeal Re times= )()( (Eq 4)
842019 Impact of Inflation on Purchasing Power
httpslidepdfcomreaderfullimpact-of-inflation-on-purchasing-power 2734
where PDom is domestic price and PFor is foreign price Using the above two examplesthe real exchange rates would be 18 Chinese apartment = 1 American apartment and075 Oxford salary = 1 MIT salary in 2008
If we substitute prices with CPI indexes in the above equation the real exchange for allthe goods and services can be estimated by Equation 5
For
Dom
CPI
CPI E e times= (Eq 5)
Figure 4 and Figure 5 show the percent changes of nominal exchange rate and real (CPI)exchange rate from 2000 to 2008 and the values are not the same When inflation (price
change) rates are taken into account the dollar actually strengthens against the JapaneseYen and Saudi Arabian Riyal while the advantage over the Peso and the Real (until 2005)diminished The magnitude of depreciation of the US dollar against the British Poundthe Euro the Canadian Dollar and the Chinese Yuan is 2-5 better in the real rate thanin the nominal rate On the other hand the dollar depreciated more against the IndianRupee the South African Rand (after 2002) and the Russian Ruble in the real rate than inthe nominal rate The real rate and the nominal rate for the Australian dollar are verysimilar This analysis indicates that one would make different decisions in buyingforeign goods and services when using the real exchange rate versus the nominalexchange rate
In addition if we compare the data in Figure 2 and Figure 5 it is obvious that the PPPexchange rate fluctuates less dramatically than the foreign exchange rate (except theRussian Ruble) In other words foreign exchange rates affect international trade morethan domestic consumption
WAGE FACTOR
Most consumers except the unemployed and retirees earn wages to make a livingEmployers usually give employees a small wages increase every year to offset inflationFigure 6 shows the percentage of wage increase in different countries The wage increasein the US EU and India is a few percent less than inflation over eight years while thewages in Canada Brazil and Australia outpaced inflation by a few percents in the same period The wage increase in UK Mexico South Africa China and Russia is even faster
842019 Impact of Inflation on Purchasing Power
httpslidepdfcomreaderfullimpact-of-inflation-on-purchasing-power 2834
double to triple digits gain over inflation is observed in these nations Japanrsquos wage isstagnant (or dropping slightly) from 2000 to 2008 It is unclear what exactly causes thesedifferences one may speculate that it may relate to the fiscal condition and account balance of the nations as well as how the governments want to regulate their economyFor example commodity producing countries is benefited from the recent purge of
commodity prices China has a large trade surplus the Japanese prices may have comedown from a very high level from decays ago It will be interested to see how the fastwage increase in some nations would impact their inflation situation in the future
The difference in wage changes certainly would have an impact to consumerrsquos purchasing power If we modify Equation 3 and Equation 5 for calculating relative PPPand real (CPI) exchange rate by a wage factor the following equations will results
For
t
For
t
Dom
t
Dom
t
Dom
t
Dom
t
For
t
For
t
rel
W W
W W
CPI CPI
CPI CPI PPP
1
1
1
1
minus
minus
minus
minus
times= (Eq 6)
For
Dom
For
Dom
W
W
CPI
CPI E e timestimes= (Eq 7)
where W denotes wages Using this modified calculation both domestic and foreign purchasing power will change Figure 7 and Figure 8 shows the relative PPP and realexchange rate after adjusting for wage increase After adjusting for wages the relativePPP become almost the same for the US EU Canada Japan (until 2007) India andBrazil (after 2006) Australia UK South Africa Mexico become the out performerswhich is not the case without adjusting for wages China and Russia demonstrate the bestimprovement in relative PPP because of the large increase of their wages
After adjusting for wages the buying power of Americans in international marketsweakens further relative to most foreign consumers except the Japanese Meanwhile thedepreciation of the US dollar against the Euro is about 5 less than before adjustment(using the 2008 figure) because of the wage advantage for Americans As pointed outearlier there are pitfalls for direct cross-comparison using the CPI index Additionallyother factors such as taxation may complicate the purchasing power calculation For example American income taxes are less than many industrialized countries while poorer nations probably donrsquot tax on income as much
842019 Impact of Inflation on Purchasing Power
httpslidepdfcomreaderfullimpact-of-inflation-on-purchasing-power 2934
Based on the above analysis the emerging economies have made big progress inenhancing the international purchasing power of their citizens thanks to increases of international trade employment and work force productivity Having said that the gap
of incomes between citizens of developed and developing countries are still quite large asshown in the Table 2 Additionally the consequences of environmental damages andincreased energy consumptions in developing countries due to rapid industrialization may be debatable issues
842019 Impact of Inflation on Purchasing Power
httpslidepdfcomreaderfullimpact-of-inflation-on-purchasing-power 3034
Conclusion
Exchange rate pricesinflation and wage level influence the purchasing power of consumers in domestic and international markets The domestic purchasing power ismainly affected by the inflation rate of individual countries and it is relatively equitableacross mature economies The international purchasing power is more volatile and isaffected by both exchange rate and prices Wage changes can further compensate or deprive purchasing power of consumers Analysis of current exchange rates prices andwages leads to the belief that foreign shoppers can get better bargains in Japan and theUS at the present time Consumers in emerging economies especially China and Russiahave experienced significant improvement in purchasing power recently when compared
to themselves They may catch up with the living standard of rich countries in the futureif this growth rate sustains Finally it will be interesting to research the fundamentaleconomic forces which influence the gauges that are measured in the articleWhen prices are rising you can buy less with a given amount of money When hotdogsare expensive a given amount of money will buy a small number of hotdogs But whenhotdogs are inexpensive that is the price is low your given hot dog allowance will purchase a lot more satisfaction There is a relationship between prices and purchasing power that is a reciprocal relationship and thatrsquos the relationship that wersquore going to bestudying in this lesson When prices are going from low prices to high prices that iswhen there is inflation in the economy the value of the dollar is shrinking that is your Purchasing power is going from being able to buy a lot to being able to buy a little Inthis lesson Irsquom going to begin by giving a simple numerical example and then wersquoll talk about how you can use the GDP deflator to show the relationship between the inflationrate and purchasing power
Letrsquos start by assuming that we are in a period of inflation and letrsquos let hotdogs be arepresentative good that is the price of all goods and services across the economy isincreasing at some general rate and wersquore going to look at the price of hotdogs in order toinfer what is happening to purchasing power as prices are rising Wersquore going to befocusing now on the reciprocal relationship between the price level and the purchasing power of the dollar that is what a dollar will buy as the price level is changing And Irsquovewritten out here as clearly as I can the formula that shows this reciprocal relationship thatis one over the price level equals the purchasing power of a dollar Let me make thisvery clear Letrsquos suppose that the price of a hotdog is five cents Well whatrsquos the purchasing power of your dollar Five cents is the same thing as one twentieth of adollar Therefore the reciprocal of one twentieth is twenty Your dollar will buy twentyhotdogs Thatrsquos its purchasing power
842019 Impact of Inflation on Purchasing Power
httpslidepdfcomreaderfullimpact-of-inflation-on-purchasing-power 3134
Now suppose wersquore in a period of inflation so that prices are rising and the price of ahotdog goes up to two dollars Whatrsquos happened to your purchasing power Well your dollar will no longer buy even a whole hotdog Two dollars or 2 has a reciprocal of onehalf that is you can now only afford half a hotdog Your purchasing power has shrunk from twenty hotdogs at a price of five cents a piece to one half a hotdog whenever the
price is two dollars per hotdog This simple example makes clear that the price level andthe purchasing power of the dollar are reciprocals
Now letrsquos look at some examples using the GDP deflator Suppose that wersquore in the year 2000 which is our base year for calculating the GDP deflator and we calculate the priceof a market basket of goods and services- that is a little bit of Housing and a little bit of transportation a little bit of medical care a little bit of clothingetc And wersquore going to call the price level in the year 2000 one hundred because itrsquos our base year
We look at those prices again in 2002 and we find that the price of the goods and
services as a ratio of the same prices in 2000 is equal to 104 That is prices haveincreased by about 4 percent between the year 2000 and 2002 So if we write the GDPdeflator not in the form we usually write it that is multiplied by 100 to get 104 but letrsquoswrite it now as in hundredths 104 to show the 4 percent increase in prices between theyear 2000 and 2002 Well whatrsquos happened to the purchasing power of a dollar betweenthe year 2000 and 2002 That is how much can we afford to buy in 2002 with a dollar if we measure it in the prices of the year 2000 Prices are higher in 2002 therefore thedollar wonrsquot buy as much Well if you takethe reciprocal of the GDP deflator 104 you get 096 Whatrsquos that saying Itrsquos saying thatwhat you could have bought for 96 cents back in the year 2000 now it costs you a dollar to buy in 2002 That is a dollar in 2002 is only worth what 96 cents was worth back inthe year 2000 You can afford to buy less Your purchasing power has shrunk by about 4 percent Your purchasing power shrinks at the same rate that the price level increases because the price level and your purchasing power are reciprocals of each other
Well letrsquos take another example during a period of deflation If we look at the years between 1929 and 1933 wersquoll see falling prices If we choose 1929 as the base year andif we call the price level in that 200000 or 100 if we look at prices in 1933 during thegreat depression we see that the price level has fallen by about 24 percent That is wersquovegone from 100 down to 076 So we now have lower prices in 1933 than we had in 1929
Now what does that mean What is going to happen to the purchasing power of your dollar when prices are lower Itrsquos clearly going to increase Yoursquore going to go from asmall purchasing power to a bigger purchasing power And if you takethe reciprocal of 76 percent you get 132 That is the purchasing power of the dollar hasincreased by about 32 percent in this example Now the reason the numbers donrsquot add upexactly the reason I canrsquot say a 24 percent decrease in prices is equal to a 24 percentincrease in purchasing power is because once your percentages start getting large yourun into this problem that a fifty percent increase is sorry that a 100 percent increase isthe reciprocal of a 50 percent decrease you wind up with this problem that wersquove
842019 Impact of Inflation on Purchasing Power
httpslidepdfcomreaderfullimpact-of-inflation-on-purchasing-power 3234
discussed earlier about the calculation of percentage changes but you can still use thisformula any time it always works One over the price level gives you the purchasing power of the dollar and when the price level is only 76 percent what it was before your purchasing power is going to be 132 percent of what it was before Falling prices give us an increase in the purchasing power of the dollar
842019 Impact of Inflation on Purchasing Power
httpslidepdfcomreaderfullimpact-of-inflation-on-purchasing-power 3334
REFERENCES
1 httpwwwworldsalariesorg
2 International Monetary Fund World Economic Outlook Database September
2006
3 Website of Australian Bureau of Statistics
4 Website of Blanco de Mexico
5 Website of Bank of England
6 Website of Central Bank of Brazil
7 Website of European Central bank
8 Website of International Organization of Labor
9 Website of the Labor Department of India
10 Website of the Ministry of Economics and Planning of Saudi Arabia
11 Website of the Ministry of Finance of the Russian Federation
12 Website of National Bureau of Statistics of China
13 Website of Statistics Bureau of Japan
14 Website of Statistics Canada
15 Website of Statistics South Africa
16 Website of the United States Labor Department
17 Website of Wikipedia on purchasing power parity and consumer price index
842019 Impact of Inflation on Purchasing Power
httpslidepdfcomreaderfullimpact-of-inflation-on-purchasing-power 3434
842019 Impact of Inflation on Purchasing Power
httpslidepdfcomreaderfullimpact-of-inflation-on-purchasing-power 434
Introduction of purchasing power
How Does Inflation Affect the Purchasing Power of Money
Inflation and Purchasing Products
Inflation and DebtDeflation and Purchasing ProductsDeflation and Debt
What is Inflation
Measures of inflation are
Producer Price IndicesCommodity price indicesGDP deflator Regional inflationAspect price inflationIssue in measuring7 most harmful effects of inflation
Review of literature
Consumer price indexes of representative economies from 2000 to 2008Relative purchasing power parity of representative economies from 2000 to 2008PPP exchange rate published by the International Monetary Fund (IMF ref 2)Changes of nominal exchange rate from 2000 to 2008Changes of real (CPI) exchange rate from 2000 to 2008Increase in different countries from 2000 to 2008 (source ref 1 3 to 14)Relative purchasing power parity from 2000 to 2008 after adjusting for wageReal exchange rate from 2000 to 2008 after adjusting for wage increaseMarket exchange rate from 2000 to 2008Weekly Wages from 2000 to 2008
Research MethodologyWhat is purchasing power parityUse of purchasing power parity
842019 Impact of Inflation on Purchasing Power
httpslidepdfcomreaderfullimpact-of-inflation-on-purchasing-power 534
Conclusion or Summery
References
842019 Impact of Inflation on Purchasing Power
httpslidepdfcomreaderfullimpact-of-inflation-on-purchasing-power 634
INTRODUCTION
The purchasing power of a consumer depends upon wealth and the prices of the goodsand services The customer can purchase domestically or from aboard if there is a freetrade condition If the purchase occurs in the international market exchange rate will play a role in calculating affordability Furthermore a consumer who is employed earnsincome while spending Hisher buying power also depends on the changes in wagesrelative to inflation This article discusses the factors such as exchange rate prices andwage level affecting the purchasing power of consumers who reside in various countriesin the world from 2000 to 2008
Inflation can be felt at gas pumps and grocery stores The official government consumer price inflation rate was 27 percent higher as of March compared to one year ago It had been zero for all of 2009 and 16 percent for all of 2010 which was the reason providedas to why social security checks did not require a cost-of-living-adjustment this year
However consumer price inflation is building and could easily rise to 4 to 5 percent bythe yearrsquos end and possibly even higher if there is no retreat in gas and food pricesProducer price inflation is already near 6 percent Incredibly however US government bond yields are implying low future inflation The US Treasury can borrow today at alow 34 percent rate for 10 years despite the very high budget deficit and plenty of money printing
Savers lose if there is unexpected inflation because of the loss in purchasing power of themoney saved Conversely borrowers win from unexpected inflation
How does this work The table below shows past returns for people who saved money
with a 10-year US Treasury For example someone who saved $100 via US Treasuryin 1950 would have accumulated $121 in at the end of the 10-year term assuming allannual interest payments have been saved However there was some inflation over thatdecade so their purchasing power was eroded to the point that the original $100investment would have provided only $102 in purchasing power after 10 years Other periods are shown below People who saved money at the start of 1970 actually came outwith much less purchasing power after 10 years
842019 Impact of Inflation on Purchasing Power
httpslidepdfcomreaderfullimpact-of-inflation-on-purchasing-power 734
What about going forward over the next 10 years If you invest $100 in the 10-year US
Treasury bond today you will have $131 in ten years based on todayrsquos 34 percent yieldIt is unlikely that we will experience the same kind of inflation seen in the 1970sHowever if such a high rate of inflation were to occur then the $131 cumulative savingsafter 10 years would translate into only $64 in purchasing power On the other hand if there is low inflation like in the 1950s then the saver would have $104 in purchasing power
Purchasing power
Purchasing power is the number of goodsservices that can be purchased with a unit of currency For example if you had taken one dollar to a store in the 1950s you would
have been able to buy a greater number of items than you would today indicating thatyou would have had a greater purchasing power in the 1950s Currency can be either acommodity money like gold or silver or fiat currency or free-floating market-valuedcurrency like US dollars As Adam Smith noted having money gives one the ability tocommand others labor so purchasing power to some extent is power over other peopleto the extent that they are willing to trade their labor or goods for money or currency
If ones monetary income stays the same but the price level increases the purchasing power of that income falls Inflation does not always imply falling purchasing power of ones money income since it may rise faster than the price level A higher real income means a higher purchasing power since real income refers to the income adjusted for
inflation
For a price index its value in the base year is usually normalized to a value of 100 The purchasing power of a unit of currency say a dollar in a given year expressed in dollarsof the base year is 100 P where P is the price index in that year So by definition the purchasing power of a dollar decreases as the price level rises The purchasing power intodays money of an amount C of money t years into the future can be computed withthe formula for the present value
842019 Impact of Inflation on Purchasing Power
httpslidepdfcomreaderfullimpact-of-inflation-on-purchasing-power 834
Where in this case i is an assumed future annual inflation rate
How Does Inflation Affect The Purchasing Power of Money
Inflation affects how people can spend money Inflation is an economic phenomenon thathas an increasing change in the price of goods and services A closely linked phenomenon to inflation is deflation sometimes called negative inflation Deflationoccurs when there is a decreasing change in the price of goods and services Inflation anddeflation affect how a consumer can buy goods and the value of debt Inflation can occur in wages or prices
Measuring Inflation
Price inflation is typically measured using the consumer price index (CPI) The UnitedStates Bureau of Labor Statistics keeps track of the CPI The CPI takes a constant basketof goods and sees how the price changes from year to year If the price of the basket of goods increases then there is price inflation If the price of the basket of goods decreasesthen there is deflation People measure wage inflation using the employment cost indexThe employment cost index shows how the cost of labor increases or decreases over a period of time
Inflation and Purchasing ProductsPrice inflation decreases peoples ability to pay for goods The concept at a basic levelsays if an employees wages remain steady but the cost of goods increases then theemployee can afford fewer goods As wage inflation occurs people will be able to buymore products A general misconception is that when wages rise prices also rise andaccording to the Federal Reserve Bank of Cleveland there is little support that wageinflations cause price inflation
Inflation and Debt
Price inflation is a debtors best friend and a creditors worst enemy As the pricesincrease the amount borrowed will deteriorate in value so the debtor is paying back lessmoney and the creditor is receiving less money For example a student borrows $100000in 2005 and then inflation occurs over the next couple years Inflation then makes that$100000 comparatively worth only $80000 due to the increase in prices When wagesinflate both the borrowers and the creditors win The borrowers can repay their loansquicker due to higher income The borrowers then should receive loan payments quicker if the borrowers pay back their loans with the increased wages
842019 Impact of Inflation on Purchasing Power
httpslidepdfcomreaderfullimpact-of-inflation-on-purchasing-power 934
Deflation and Purchasing Products
Deflation has the opposite affect of inflation in that consumers will be able to buy more productsas the price for the product decreases Deflation however is not good for the overall economyand can be worse than inflation If a company has costs sunk into production before deflationthese costs will not readjust to the deflation Since the costs remain high to the price of moneythe company will receive less revenue when the product sells at a deflated price As wagesdeflate consumers can buy less with their money because their disposable income is decreased
Deflation and Debt
Deflation and debt has the opposite affect as inflation Debtors will pay back more money than theycomparatively took out and creditors will receive more money As wages deflate people may have a harder time paying off debt which will increase the number of defaults by borrowers
INFLATION
In economics inflation is a rise in the general level of prices of goods and services in aneconomy over a period of time When the general price level rises each unit of currency buys fewer goods and services Consequently inflation also reflects erosion in the purchasing power of money ndash a loss of real value in the internal medium of exchange andunit of account in the economy A chief measure of price inflation is the inflation rate theannualized percentage change in a general price index (normally the Consumer Price Index) over time
Measures of inflation are
Inflation is usually estimated by calculating the inflation rate of a price index usually theConsumer Price Index] The Consumer Price Index measures prices of a selection of goods and services purchased by a typical consumer The inflation rate is the percentage rate of change of a price index over time
For instance in January 2007 the US Consumer Price Index was 202416 and inJanuary 2008 it was 211080 The formula for calculating the annual percentage rateinflation in the CPI over the course of 2007 is
The resulting inflation rate for the CPI in this one year period is 428 meaning thegeneral level of prices for typical US consumers rose by approximately four percentin 2007
Other widely used price indices for calculating price inflation include the following
842019 Impact of Inflation on Purchasing Power
httpslidepdfcomreaderfullimpact-of-inflation-on-purchasing-power 1034
bull Producer price indices (PPIs) which measures average changes in pricesreceived by domestic producers for their output This differs from the CPI in that price subsidization profits and taxes may cause the amount received by the producer to differ from what the consumer paid There is also typically a delay between an increase in the PPI and any eventual increase in the CPI Producer
price index measures the pressure being put on producers by the costs of their raw materials This could be passed on to consumers or it could be absorbed by profits or offset by increasing productivity In India and the United States anearlier version of the PPI was called the Wholesale Price Indexbull Commodity price indices which measure the price of a selection of commodities In the present commodity price indices are weighted by the relativeimportance of the components to the all in cost of an employeebull Core price indices because food and oil prices can change quickly due tochanges in supply and demand conditions in the food and oil markets it can bedifficult to detect the long run trend in price levels when those prices areincluded Therefore most statistical agencies also report a measure of core
inflation which removes the most volatile components (such as food and oil)from a broad price index like the CPI Because core inflation is less affected byshort run supply and demand conditions in specific markets central banks rely onit to better measure the inflationary impact of current monetary policy
Other common measures of inflation are
bull GDP deflator is a measure of the price of all the goods and servicesincluded in gross domestic product (GDP) The US Commerce Department publishes a deflator series for US GDP defined as its nominal GDP measuredivided by its real GDP measurebull
Regional inflation The Bureau of Labor Statistics breaks down CPI-Ucalculations down to different regions of the USbull Historical inflation Before collecting consistent econometric data becamestandard for governments and for the purpose of comparing absolute rather thanrelative standards of living various economists have calculated imputed inflationfigures Most inflation data before the early 20th century is imputed based on theknown costs of goods rather than compiled at the time It is also used to adjustfor the differences in real standard of living for the presence of technologybull Asset price inflation is an undue increase in the prices of real or financialassets such as stock (equity) and real estate While there is no widely acceptedindex of this type some central bankers have suggested that it would be better toaim at stabilizing a wider general price level inflation measure that includes someasset prices instead of stabilizing CPI or core inflation only The reason is that byraising interest rates when stock prices or real estate prices rise and loweringthem when these asset prices fall central banks might be more successful inavoiding bubbles and crashes in asset prices
842019 Impact of Inflation on Purchasing Power
httpslidepdfcomreaderfullimpact-of-inflation-on-purchasing-power 1134
Issues in measuring
Measuring inflation in an economy requires objective means of differentiating changes in
nominal prices on a common set of goods and services and distinguishing them fromthose price shifts resulting from changes in value such as volume quality or performance For example if the price of a 10 oz can of corn changes from $090 to$100 over the course of a year with no change in quality then this price differencerepresents inflation This single price change would not however represent generalinflation in an overall economy To measure overall inflation the price change of a largebasket of representative goods and services is measured This is the purpose of a price index which is the combined price of a basket of many goods and services Thecombined price is the sum of the weighted average prices of items in the basket Aweighted price is calculated by multiplying the unit price of an item to the number of those items the average consumer purchases Weighted pricing is a necessary means to
measuring the impact of individual unit price changes on the economys overall inflationThe Consumer Price Index for example uses data collected by surveying households todetermine what proportion of the typical consumers overall spending is spent on specificgoods and services and weights the average prices of those items accordingly Thoseweighted average prices are combined to calculate the overall price To better relate pricechanges over time indexes typically choose a base year price and assign it a value of 100 Index prices in subsequent years are then expressed in relation to the base year priceWhile comparing inflation measures for various periods one has to take intoconsideration the Base effect (inflation) as well
Inflation measures are often modified over time either for the relative weight of goods in
the basket or in the way in which goods and services from the present are compared withgoods and services from the past Over time adjustments are made to the type of goodsand services selected in order to reflect changes in the sorts of goods and services purchased by typical consumers New products may be introduced older productsdisappear the quality of existing products may change and consumer preferences canshift Both the sorts of goods and services which are included in the basket and theweighted price used in inflation measures will be changed over time in order to keep pacewith the changing marketplace
Inflation numbers are often seasonally adjusted in order to differentiate expected cyclicalcost shifts For example home heating costs are expected to rise in colder months and
seasonal adjustments are often used when measuring for inflation to compensate for cyclical spikes in energy or fuel demand Inflation numbers may be averaged or otherwise subjected to statistical techniques in order to remove statistical noise andvolatility of individual prices
When looking at inflation economic institutions may focus only on certain kinds of prices or special indices such as the core inflation index which is used by central banksto formulate monetary policy Most inflation indices are calculated from weighted
842019 Impact of Inflation on Purchasing Power
httpslidepdfcomreaderfullimpact-of-inflation-on-purchasing-power 1234
averages of selected price changes This necessarily introduces distortion and can lead tolegitimate disputes about what the true inflation rate is This problem can be overcome byincluding all available price changes in the calculation and then choosing the median value
7 most harmful effects of Inflation on different aspects of a developing country like India
Why should we be concerned with the problem of inflation The answer lies in two facts
I Left to itself inflation would move from its initial beneficiary stage to that of a harmfulone For this reason it is necessary to prevent inflation from gaining strength
II A stronger inflation is more difficult to control than a mild one And there is no way to
control a hyperinflation
The beneficial effects of inflation are limited to only its initial phase when the price riseis sufficiently mild During that period there is a favorable impact upon both output andemployment The increase in prices and distributive inequalities are more thancounterbalanced by gains in output and employment
However once inflationary process gathers some strength its ill effects come todominate the scene These have been discussed above and would be only brieflyenumerated here
1 Right from the beginning inflation adds to inequalities of income and wealthHowever in its last phase it is not longer able to do so because money ceases to beanacceptable store of value It is a generally agreed statement that inequalities reduceaggregate social welfare and should be avoided provided in the process productionactivity does not suffer
2 Every economy needs a continuous addition to its productive capacity for which itshould encourage capital formation In a money economy capital formation takes placewhen a part of money income is saved and transferred to the investors who in turn use itfor investment and capital formation However inflation by its very nature discouragessaving activity It makes consumption more attractive than saving
The adverse impact on saving and capital formation is more serious for-anunderdeveloped country because it needs a higher rate of capital accumulation
3 Inflation leads to a shift in the asset preference of wealth holders Their preference for tangible assets may be counterbalanced in the initial phases of inflation by an increase ininterest rate However in later stages of inflation even an upward movement in interestrate fails to neutralize the shift in asset preference
842019 Impact of Inflation on Purchasing Power
httpslidepdfcomreaderfullimpact-of-inflation-on-purchasing-power 1334
4 Inflation leads to balance of payments problems When domestic prices rise faster than prices in foreign countries exports tend to lag behind imports The rate of exchange alsotends to depreciate both on account of falling purchasing power of currency within thecountry and adverse balance of payments In some cases there may also be an outflow of capital A developed country may be able to handle the problem of adverse balance of
payments through structural adjustment but a developing country is not able to do soeasily because they suffer from large institutional and other rigidities
5 Inflation distorts the financial system of the country In its initial stages the system isable to withstand its adverse effect because the financial institutions by their very naturetend to ignore the purchasing power of money and operate with reference to interest ratesand maturity of financial instruments However when inflation gathers strength thefinancial system cannot withstand it and collapses
6 Once inflation crosses its earlier phases strain on the financial system speculationexpectations of further price rise and similar other forces lead to an increase in
unemployment and a fall in output Eventually in the final phase of inflation the outputand employment levels fall to abysmally low levels
7 First Inflation is a hidden tax as it leads to fall in purchasing power of money Ithappens particularly when authorities resort to deficit spending when their tax receiptslag behind and their expenditure does not decrease The taxpayers therefore lose onaccount of reduced purchasing power of their money incomes In other words theauthorities are able to collect resources from the taxpayers without specifically levyingadditional taxes on them Secondly when prices rise the fixed income earners find thatthe purchasing power of their money incomes is falling while the real income of the profit earners is increasing When inflation becomes still stronger the holders of financial
wealth also lose This way inflation is a hidden tax by entrepreneurs on consumers andon recipients of contractual incomes
842019 Impact of Inflation on Purchasing Power
httpslidepdfcomreaderfullimpact-of-inflation-on-purchasing-power 1434
Review of Literature
Figure 1 Consumer price indexes of representative economies from 2000 to 2008
(source ref 3 to16)
650
842019 Impact of Inflation on Purchasing Power
httpslidepdfcomreaderfullimpact-of-inflation-on-purchasing-power 1534
CPI 2000 2001 2002 2003 2004 2005 2006 2007 2008 (May)
United States 1740 1767 1809 1843 1903 1968 2018 2100 2166United Kingdom 937 947 963 973 987 1008 1036 1057 NAEuropean Union 908 926 948 966 989 1011 1031 1062 1082
Brazil 1000 1077 1202 1295 1371 1428 1459 1504 1560
Japan 1022 1015 1006 1003 1003 1000 1003 1003 1017
India 4410 4580 4770 4960 5140 5360 5630 6000 6360China 1004 1011 1003 1015 1055 1074 1090 1167 NA
Canada 970 977 1015 1036 1058 1080 1098 1124 1139
Australia 1313 1354 1395 1428 1465 1506 1555 1601 1622Mexico 932 974 1029 1070 1126 1163 1210 1256 1281
Russia 1000 1214 1406 1598 1773 1997 2190 2388 2709
South Africa 1000 1057 1154 1221 1238 1280 1340 1435 1515Saudi Arabia 989 978 980 986 989 996 1018 1060 1150
Figure 2 Relative purchasing power parity of representative economies from 2000 to
2008
23
842019 Impact of Inflation on Purchasing Power
httpslidepdfcomreaderfullimpact-of-inflation-on-purchasing-power 1634
Rel PPP exchange 2000 2001 2002 2003 2004 2005 2006 2007 2008
United States 1000 1000 1000 1000 1000 1000 1000 1000 1000
United Kingdom 1000 0995 0989 0980 0963 0951 0953 0935 NA
European Union 1000 1005 1004 1005 0996 0985 0979 0969 0958
Brazil 1000 1060 1156 1223 1254 1262 1258 1246 1253
Japan 1000 0978 0947 0927 0897 0865 0846 0813 0799
India 1000 1023 1040 1062 1066 1075 1101 1127 1158
China 1000 0992 0961 0954 0960 0945 0936 0963 NACanada 1000 0992 1006 1008 0997 0984 0976 0960 0943
Australia 1000 1015 1022 1027 1020 1014 1021 1010 0992
Mexico 1000 1028 1061 1083 1104 1103 1119 1116 1104
Russia 1000 1195 1352 1509 1621 1766 1888 1978 2176
South Africa 1000 1041 1110 1153 1132 1132 1155 1189 1217
Saudi Arabia 1000 0974 0953 0941 0914 0890 0888 0888 0934
Figure 3 PPP exchange rate published by the International Monetary Fund (IMF ref 2)
842019 Impact of Inflation on Purchasing Power
httpslidepdfcomreaderfullimpact-of-inflation-on-purchasing-power 1734
16
18
r
Note x100 for Japanese currency
Country 2000 2001 2002 2003 2004 2005 2006 2007
United States 1000 1000 1000 1000 1000 1000 1000 1000
United Kingdom 0645 0645 0654 0662 0663 0659 0661 0669
Germany 0934 0923 0919 0912 0893 0876 0866 0864
Brazil 0867 0909 0985 1111 1172 1211 1231 1270
Japan 1498 1448 1407 1364 1310 1266 1237 1233
India 8473 8570 8630 8803 9006 9235 9593 9989
China 1828 1822 1801 1813 1891 1917 1895 1929
Canada 1218 1203 1193 1207 1215 1221 1206 1211
Australia 1362 1380 1393 1406 1421 1451 1460 1477
Mexico 6195 6411 6737 7171 7501 7696 7792 7964
Russia 6833 7773 8833 9870 11507 13512 15326 16692
South Africa 2110 2219 2413 2476 2569 2633 2707 2808
Saudi Arabia 2678 2526 2554 2649 2864 3250 3534 3698
842019 Impact of Inflation on Purchasing Power
httpslidepdfcomreaderfullimpact-of-inflation-on-purchasing-power 1834
Figure 4 Changes of nominal exchange rate from 2000 to 2008
190
x c h a n g e R a t e
Change (E) Dec-00 Dec-01 Dec-02 Dec-03 Dec-04 Dec-05 Dec-06 Dec-07 Jun-08
US Dollar 10000 10000 10000 10000 10000 10000 10000 10000 10000Pound 10000 10299 9254 8292 7774 8627 7654 7576 7500Euro 10000 10463 8889 7349 6859 7781 7068 6342 5860Real 10000 11897 18205 14821 13641 11795 10974 9128 8205
Yen 10000 11491 10439 9386 9035 10351 10439 9747 9332
Rupee 10000 10310 10267 9733 9283 9626 9507 8388 9176
Yuan 10000 10000 10000 10000 10000 9783 9510 8816 8285
Can $ 10000 10600 10533 8600 8000 7800 7800 6600 6803
Aus $ 10000 10889 9889 7389 7167 7556 7056 6333 5787
Peso 10000 9542 10864 11696 11602 11061 11249 11363 10708
Rouble 10000 10780 11312 10390 9858 10213 9326 8723 8333
Rand 10000 15789 11316 8684 7500 8355 9276 9013 10263
Riyal 10000 10000 10000 10000 10000 10000 10000 10000 10000
842019 Impact of Inflation on Purchasing Power
httpslidepdfcomreaderfullimpact-of-inflation-on-purchasing-power 1934
Figure 5 Changes of real (CPI) exchange rate from 2000 to 2008
170
a n g e R a t e Change (e) Dec-00 Dec-01 Dec-02 Dec-03 Dec-04 Dec-05 Dec-06 Dec-07 Jun-08
United States 10000 10000 10000 10000 10000 10000 10000 10000 10000
United Kingdom 10000 10348 9361 8458 8071 9071 8029 8107 NA
European Union 10000 10412 8854 7313 6885 7902 7221 6543 6120
Brazil 10000 11221 15746 12122 10882 9343 8722 7327 6550
Japan 10000 11750 11025 10130 10069 11965 12336 11988 11675
India 10000 10082 9869 9166 8711 8957 8637 7442 7922China 10000 10085 10408 10477 10412 10348 10162 9155 NA
Canada 10000 10687 10466 8529 8022 7924 7992 6875 7213
Australia 10000 10723 9677 7196 7025 7450 6909 6270 5832
Mexico 10000 9282 10235 10797 10513 10031 10053 10186 9703
Russia 10000 9018 8365 6887 6081 5784 4939 4410 3830
South Africa 10000 15170 10195 7533 6626 7383 8029 7582 8434
Saudi Arabia 10000 10269 10492 10624 10937 11231 11267 11263 10707
842019 Impact of Inflation on Purchasing Power
httpslidepdfcomreaderfullimpact-of-inflation-on-purchasing-power 2034
Figure 6 Wage increase in different countries from 2000 to 2008 (source ref 1 3 to 14)
670
s e
Wage Increase 2000 2001 2002 2003 2004 2005 2006 2007 2008
United States 000 359 479 684 1060 1265 1658 1966 2291
United Kingdom 000 342 724 1125 1624 2055 2554 3033 3209European Union 000 267 531 750 955 1159 1405 1617 NA
Brazil 000 826 1551 1163 1050 1276 1839 5068 5720
Japan 000 -096 -385 -395 -472 -375 -279 -308 -1992
India 000 253 580 967 1379 2387 2929 3688 4123
China 000 1608 3257 4967 7058 9501 12347 NA NA
Canada 000 142 356 497 718 1063 1393 1758 2044
Australia 000 330 692 1087 1422 2021 2577 3073 3158
Mexico 000 1258 2010 2875 3480 4232 5140 -3118 NA
Russia 000 4575 9613 14737 20319 28484 37836 51147 66631
South Africa 000 956 2134 2613 3802 3988 5251 NA NA
842019 Impact of Inflation on Purchasing Power
httpslidepdfcomreaderfullimpact-of-inflation-on-purchasing-power 2134
Figure 7 Relative purchasing power parity from 2000 to 2008 after adjusting for wage
increase
12
13
e
s
Rel PPP adj for
wage 2000 2001 2002 2003 2004 2005 2006 2007 2008
United States 1000 1000 1000 1000 1000 1000 1000 1000 1000
United Kingdom 1000 0997 0966 0941 0916 0889 0885 0858 0000
European Union 1000 1014 0998 0997 1002 0989 0993 0988 NA
Brazil 1000 1014 1049 1170 1255 1261 1239 0989 0979
Japan 1000 1023 1032 1031 1042 1013 1015 1004 1227
India 1000 1033 1030 1034 1036 0977 0993 0985 1008
China 1000 0885 0759 0681 0623 0546 0488 0448 NA
Canada 1000 1013 1018 1026 1029 1002 0999 0977 0962
Australia 1000 1018 1002 0989 0988 0950 0947 0925 0927
Mexico 1000 0946 0926 0899 0905 0873 0862 1940 NA
Russia 1000 0850 0723 0652 0591 0517 0460 0387 0349
South Africa 1000 0984 0959 0976 0907 0911 0883 NA NA
842019 Impact of Inflation on Purchasing Power
httpslidepdfcomreaderfullimpact-of-inflation-on-purchasing-power 2234
Figure 8 Real exchange rate from 2000 to 2008 after adjusting for wage increase
1600
g e s Change e adj for
Wage 2000 2001 2002 2003 2004 2005 2006 2007
United States 10 000 10000 10000 100 00 10 000 1000 0 100 00 10000
United Kingdom 10000 10364 9147 8122 7679 8476 7456 7443
European Union 10000 10505 8804 7255 6929 7938 7327 6673Brazil 10000 10737 14285 11602 10891 9334 8588 5818Japan 10000 12290 12015 11267 11687 14004 14794 14800India 10000 10186 9774 8929 8467 8146 7787 6506China 10000 8999 8226 7479 6751 5978 5302 4260
Canada 10000 10916 10589 8681 8278 8068 8177 6997Australia 10000 10753 9484 6934 6802 6982 6405 5739Mexico 10000 8540 8929 8959 8626 7940 7741 NARussia 10000 6409 4469 2974 2218 1693 1204 863
South Africa 10000 14343 8804 6381 5309 5946 6137 NA
842019 Impact of Inflation on Purchasing Power
httpslidepdfcomreaderfullimpact-of-inflation-on-purchasing-power 2334
Table 1 Market exchange rate from 2000 to 2008
Nominal Exchange Rate (E) Dec-00 Dec-01 Dec-02 Dec-03 Dec-04 Dec-05 Dec-06 Dec-07 Jun-08US Dollar 10 10 10 10 10 10 10 10 10
British Pound 07 07 06 06 05 06 05 05 05Euro 11 11 10 08 07 08 08 07 06
Brazilian Real 20 23 36 29 27 23 21 18 16
Japanese Yen 1140 1310 1190 1070 1030 1180 1190 1111 1064Indian Rupee 468 482 480 455 434 450 444 392 429
Chinese Yuan 83 83 83 83 83 81 79 73 69
Canadian Dollar 15 16 16 13 12 12 12 10 10Australian Dollar 18 20 18 13 13 14 13 11 10
Mexico Peso 96 92 104 112 112 106 108 109 103
Russian Rouble 282 304 319 293 278 288 263 246 235South African Rand 76 120 86 66 57 64 71 69 78
Saudi Arabian Riyal 38 38 38 38 38 38 38 38 38
Table 2 Weekly Wages from 2000 to 2008
Weekly Wage (in US$) 2000 2001 2002 2003 2004 2005 2006 2007 2008United States 5850 6060 6130 6250 6470 6590 6820 7000 7190
United Kingdom 5286 5309 6126 7093 7905 7386 8670 9094 9310
European Union 3635 3567 4310 5327 5825 5239 5909 6725 00
Brazil 983 894 624 740 796 939 1060 1622 1883
Japan 6636 5719 6112 6791 6998 6170 6180 6599 5694
India 144 143 148 162 176 185 196 235 221
China 217 252 287 324 370 432 509 632 00
Canada 4370 4182 4297 5334 5855 6199 6384 7786 7738
Australia 3737 3545 4040 5608 5956 5946 6661 7714 8497
Mexico 771 910 853 849 896 993 1038
Russia 197 266 342 469 606 743 1011 1381 1812
South Africa 1641 1139 1760 2384 3021 2748 2699
Note The EU wage is an average of Germany France Italy and Spain
842019 Impact of Inflation on Purchasing Power
httpslidepdfcomreaderfullimpact-of-inflation-on-purchasing-power 2434
PURCHASING POWER PARITY
The purchasing power parity (PPP) theory uses the long-term equilibrium exchange
rate of two currencies to equalize their purchasing power Developed by Gustav Cassel in1920 it is based on the law of one price the theory states that in ideally efficientmarkets identical goods should have only one price
This purchasing power SEM rate equalizes the purchasing power of different currenciesin their home countries for a given basket of goods Using a PPP basis is arguably moreuseful when comparing differences in living standards on the whole between nations because PPP takes into account the relative cost of living and the inflation rates of different countries rather than just a nominal gross domestic product (GDP) comparisonThe best-known and most-used purchasing power parity exchange rate is the Geary-Khakis dollar (the international dollar)
PPP exchange rates (the real exchange rate) fluctuations are mostly due to marketexchange rates movements Aside from this volatility consistent deviations of the marketand PPP exchange rates are observed for example (market exchange rate) prices of non-traded goods and services are usually lower where incomes are lower (A US dollar exchanged and spent in India will buy more haircuts than a dollar spent in the UnitedStates) PPP takes into account this lower cost of living and adjusts for it as though allincome was spent locally In other words PPP is the amount of a certain basket of basicgoods which can be bought in the given country with the money it produces
There can be marked differences between PPP and market exchange rates [1] For
example the World Banks World Development Indicators 2005 estimated that in 2003one United States dollar was equivalent to about 18 Chinese Yuan by purchasing power parity [2] - considerably different from the nominal exchange rate that put one dollar equalto 76 Yuan This discrepancy has large implications for instance GDP per capita in thePeoples Republic of China is about US$1800 while on a PPP basis it is about US$7204This is frequently used to assert that China is the worlds second-largest economy butsuch a calculation would only be valid under the PPP theory At the other extremeJapans nominal GDP per capita is around US$37600 but its PPP figure is onlyUS$30615
842019 Impact of Inflation on Purchasing Power
httpslidepdfcomreaderfullimpact-of-inflation-on-purchasing-power 2534
First letrsquos look at the situation of domestic buying Gustav Cassel developed the purchasing power parity (PPP) theory in 1920 to compare the purchasing power of different currencies in their home countries based on the assumption that identical goodsshould have the same price (law of one price) PPP exchange rate is defined in Equation1
For
Dom
P
P PPP = (Eq 1)
Where PDom is domestic price and PFor is foreign price
The relative purchasing power parity relates the inflation rate (change of prices) in eachcountry to the change in the market exchange rate and is given in Equation 2
Dom
t
Dom
t
For t
For t
rel
P P
P P PPP
1
1
minus
minus
= (Eq 2)
Where Pt is the price level in period t To calculate the relative purchasing power parityof all of the goods and services consumed in a country we can substitute P t with theconsumer price index (CPI) of that country which leads to Equation 3
Dom
t
Dom
t
For
t
For
t
rel
CPI CPI
CPI CPI PPP
1
1
minus
minus
= (Eq 3)
Figure 1 shows the consumer price indexes of thirteen relatively large countries or economies The inflation rate is higher in the emerging economies than in the developedcountries because of the higher rate of economic growth
Figure 2 shows the changes in relative purchasing power parity of the above economiescalculated by Equation 3 By this calculation one may conclude that the US dollar hasappreciated against the Mexican Indian South African Brazilian and Russian currencies
by 10 to 217 while depreciated against the Australian European Canadian BritishChinese and Saudi Arabian currencies by 1 to 10 from 2000 to 2008 if theconsumptions are domestic This can be attributed to the difference in inflation rate of these countries Japanrsquos disinflation condition between 2000 and 2008 caused the USdollar to weaken approximately 20 over the same time period
842019 Impact of Inflation on Purchasing Power
httpslidepdfcomreaderfullimpact-of-inflation-on-purchasing-power 2634
The International Monetary Fund (IMF) has conducted similar calculation that includesmore factors such as gross domestic product (GDP) The PPP exchange rates published by the IMF are displayed in the following Figure 3 The data shown in Figure 2 areconsistent with the IMF data
It was recognized by many economists that the PPP exchange rate calculation is not perfect because of the difficulties in finding the same baskets of goods to compare acrosscountries The weighing of goods and services in the CPI index is not identical amongdifferent countries Often times the quality of goods and service purchased variesconsiderably for example Americans probably drive better cars and drink cleaner water than many people in developing countries Moreover many social benefits offered bythe welfare countries may not be included in the CPI calculations and this makes directcomparison of purchasing power difficult Nevertheless this methodology gives us arough idea how consumers are doing in different economies
REAL EXCHANGE RATE IN INTERNATIONAL TRADE
When consumers or businesses purchase goods and services from foreign countries theywill need to exchange the available domestic currency to foreign currencies in order tofulfill the trade The price of one currency in terms of another currency is called theexchange rate and it is determined by the currency market and in some cases by
individual governments The exchange rates of twelve foreign currencies to the USdollar from 2000 to 2008 are shown in Table 1 The US dollar depreciated against mostcurrencies in terms of market exchange rate after 2002 except for the Mexican Peso andBrazilian Real (until 2006)
Many people misunderstand the real prices if only the nominal (market) exchange rate isconsidered for the trade For example a three-bedroom apartment in China costs about1500000 Yuan while a similar apartment in the US cost about 400000 Dollar A post-doctorate position in Oxford University in England is paid about 40000 Pound per year
while a similar position in Massachusetts Institute of Technology in the US is paid60000 Dollar per year The market exchange rates do not reflect the real difference of the prices Therefore the real exchange rate which considers both the nominal exchangerate and prices should be used for international trade The real exchange rate is definedin Equation 4
For
Dom
P
P E Rate Exchangeal min Noe Rate Exchangeal Re times= )()( (Eq 4)
842019 Impact of Inflation on Purchasing Power
httpslidepdfcomreaderfullimpact-of-inflation-on-purchasing-power 2734
where PDom is domestic price and PFor is foreign price Using the above two examplesthe real exchange rates would be 18 Chinese apartment = 1 American apartment and075 Oxford salary = 1 MIT salary in 2008
If we substitute prices with CPI indexes in the above equation the real exchange for allthe goods and services can be estimated by Equation 5
For
Dom
CPI
CPI E e times= (Eq 5)
Figure 4 and Figure 5 show the percent changes of nominal exchange rate and real (CPI)exchange rate from 2000 to 2008 and the values are not the same When inflation (price
change) rates are taken into account the dollar actually strengthens against the JapaneseYen and Saudi Arabian Riyal while the advantage over the Peso and the Real (until 2005)diminished The magnitude of depreciation of the US dollar against the British Poundthe Euro the Canadian Dollar and the Chinese Yuan is 2-5 better in the real rate thanin the nominal rate On the other hand the dollar depreciated more against the IndianRupee the South African Rand (after 2002) and the Russian Ruble in the real rate than inthe nominal rate The real rate and the nominal rate for the Australian dollar are verysimilar This analysis indicates that one would make different decisions in buyingforeign goods and services when using the real exchange rate versus the nominalexchange rate
In addition if we compare the data in Figure 2 and Figure 5 it is obvious that the PPPexchange rate fluctuates less dramatically than the foreign exchange rate (except theRussian Ruble) In other words foreign exchange rates affect international trade morethan domestic consumption
WAGE FACTOR
Most consumers except the unemployed and retirees earn wages to make a livingEmployers usually give employees a small wages increase every year to offset inflationFigure 6 shows the percentage of wage increase in different countries The wage increasein the US EU and India is a few percent less than inflation over eight years while thewages in Canada Brazil and Australia outpaced inflation by a few percents in the same period The wage increase in UK Mexico South Africa China and Russia is even faster
842019 Impact of Inflation on Purchasing Power
httpslidepdfcomreaderfullimpact-of-inflation-on-purchasing-power 2834
double to triple digits gain over inflation is observed in these nations Japanrsquos wage isstagnant (or dropping slightly) from 2000 to 2008 It is unclear what exactly causes thesedifferences one may speculate that it may relate to the fiscal condition and account balance of the nations as well as how the governments want to regulate their economyFor example commodity producing countries is benefited from the recent purge of
commodity prices China has a large trade surplus the Japanese prices may have comedown from a very high level from decays ago It will be interested to see how the fastwage increase in some nations would impact their inflation situation in the future
The difference in wage changes certainly would have an impact to consumerrsquos purchasing power If we modify Equation 3 and Equation 5 for calculating relative PPPand real (CPI) exchange rate by a wage factor the following equations will results
For
t
For
t
Dom
t
Dom
t
Dom
t
Dom
t
For
t
For
t
rel
W W
W W
CPI CPI
CPI CPI PPP
1
1
1
1
minus
minus
minus
minus
times= (Eq 6)
For
Dom
For
Dom
W
W
CPI
CPI E e timestimes= (Eq 7)
where W denotes wages Using this modified calculation both domestic and foreign purchasing power will change Figure 7 and Figure 8 shows the relative PPP and realexchange rate after adjusting for wage increase After adjusting for wages the relativePPP become almost the same for the US EU Canada Japan (until 2007) India andBrazil (after 2006) Australia UK South Africa Mexico become the out performerswhich is not the case without adjusting for wages China and Russia demonstrate the bestimprovement in relative PPP because of the large increase of their wages
After adjusting for wages the buying power of Americans in international marketsweakens further relative to most foreign consumers except the Japanese Meanwhile thedepreciation of the US dollar against the Euro is about 5 less than before adjustment(using the 2008 figure) because of the wage advantage for Americans As pointed outearlier there are pitfalls for direct cross-comparison using the CPI index Additionallyother factors such as taxation may complicate the purchasing power calculation For example American income taxes are less than many industrialized countries while poorer nations probably donrsquot tax on income as much
842019 Impact of Inflation on Purchasing Power
httpslidepdfcomreaderfullimpact-of-inflation-on-purchasing-power 2934
Based on the above analysis the emerging economies have made big progress inenhancing the international purchasing power of their citizens thanks to increases of international trade employment and work force productivity Having said that the gap
of incomes between citizens of developed and developing countries are still quite large asshown in the Table 2 Additionally the consequences of environmental damages andincreased energy consumptions in developing countries due to rapid industrialization may be debatable issues
842019 Impact of Inflation on Purchasing Power
httpslidepdfcomreaderfullimpact-of-inflation-on-purchasing-power 3034
Conclusion
Exchange rate pricesinflation and wage level influence the purchasing power of consumers in domestic and international markets The domestic purchasing power ismainly affected by the inflation rate of individual countries and it is relatively equitableacross mature economies The international purchasing power is more volatile and isaffected by both exchange rate and prices Wage changes can further compensate or deprive purchasing power of consumers Analysis of current exchange rates prices andwages leads to the belief that foreign shoppers can get better bargains in Japan and theUS at the present time Consumers in emerging economies especially China and Russiahave experienced significant improvement in purchasing power recently when compared
to themselves They may catch up with the living standard of rich countries in the futureif this growth rate sustains Finally it will be interesting to research the fundamentaleconomic forces which influence the gauges that are measured in the articleWhen prices are rising you can buy less with a given amount of money When hotdogsare expensive a given amount of money will buy a small number of hotdogs But whenhotdogs are inexpensive that is the price is low your given hot dog allowance will purchase a lot more satisfaction There is a relationship between prices and purchasing power that is a reciprocal relationship and thatrsquos the relationship that wersquore going to bestudying in this lesson When prices are going from low prices to high prices that iswhen there is inflation in the economy the value of the dollar is shrinking that is your Purchasing power is going from being able to buy a lot to being able to buy a little Inthis lesson Irsquom going to begin by giving a simple numerical example and then wersquoll talk about how you can use the GDP deflator to show the relationship between the inflationrate and purchasing power
Letrsquos start by assuming that we are in a period of inflation and letrsquos let hotdogs be arepresentative good that is the price of all goods and services across the economy isincreasing at some general rate and wersquore going to look at the price of hotdogs in order toinfer what is happening to purchasing power as prices are rising Wersquore going to befocusing now on the reciprocal relationship between the price level and the purchasing power of the dollar that is what a dollar will buy as the price level is changing And Irsquovewritten out here as clearly as I can the formula that shows this reciprocal relationship thatis one over the price level equals the purchasing power of a dollar Let me make thisvery clear Letrsquos suppose that the price of a hotdog is five cents Well whatrsquos the purchasing power of your dollar Five cents is the same thing as one twentieth of adollar Therefore the reciprocal of one twentieth is twenty Your dollar will buy twentyhotdogs Thatrsquos its purchasing power
842019 Impact of Inflation on Purchasing Power
httpslidepdfcomreaderfullimpact-of-inflation-on-purchasing-power 3134
Now suppose wersquore in a period of inflation so that prices are rising and the price of ahotdog goes up to two dollars Whatrsquos happened to your purchasing power Well your dollar will no longer buy even a whole hotdog Two dollars or 2 has a reciprocal of onehalf that is you can now only afford half a hotdog Your purchasing power has shrunk from twenty hotdogs at a price of five cents a piece to one half a hotdog whenever the
price is two dollars per hotdog This simple example makes clear that the price level andthe purchasing power of the dollar are reciprocals
Now letrsquos look at some examples using the GDP deflator Suppose that wersquore in the year 2000 which is our base year for calculating the GDP deflator and we calculate the priceof a market basket of goods and services- that is a little bit of Housing and a little bit of transportation a little bit of medical care a little bit of clothingetc And wersquore going to call the price level in the year 2000 one hundred because itrsquos our base year
We look at those prices again in 2002 and we find that the price of the goods and
services as a ratio of the same prices in 2000 is equal to 104 That is prices haveincreased by about 4 percent between the year 2000 and 2002 So if we write the GDPdeflator not in the form we usually write it that is multiplied by 100 to get 104 but letrsquoswrite it now as in hundredths 104 to show the 4 percent increase in prices between theyear 2000 and 2002 Well whatrsquos happened to the purchasing power of a dollar betweenthe year 2000 and 2002 That is how much can we afford to buy in 2002 with a dollar if we measure it in the prices of the year 2000 Prices are higher in 2002 therefore thedollar wonrsquot buy as much Well if you takethe reciprocal of the GDP deflator 104 you get 096 Whatrsquos that saying Itrsquos saying thatwhat you could have bought for 96 cents back in the year 2000 now it costs you a dollar to buy in 2002 That is a dollar in 2002 is only worth what 96 cents was worth back inthe year 2000 You can afford to buy less Your purchasing power has shrunk by about 4 percent Your purchasing power shrinks at the same rate that the price level increases because the price level and your purchasing power are reciprocals of each other
Well letrsquos take another example during a period of deflation If we look at the years between 1929 and 1933 wersquoll see falling prices If we choose 1929 as the base year andif we call the price level in that 200000 or 100 if we look at prices in 1933 during thegreat depression we see that the price level has fallen by about 24 percent That is wersquovegone from 100 down to 076 So we now have lower prices in 1933 than we had in 1929
Now what does that mean What is going to happen to the purchasing power of your dollar when prices are lower Itrsquos clearly going to increase Yoursquore going to go from asmall purchasing power to a bigger purchasing power And if you takethe reciprocal of 76 percent you get 132 That is the purchasing power of the dollar hasincreased by about 32 percent in this example Now the reason the numbers donrsquot add upexactly the reason I canrsquot say a 24 percent decrease in prices is equal to a 24 percentincrease in purchasing power is because once your percentages start getting large yourun into this problem that a fifty percent increase is sorry that a 100 percent increase isthe reciprocal of a 50 percent decrease you wind up with this problem that wersquove
842019 Impact of Inflation on Purchasing Power
httpslidepdfcomreaderfullimpact-of-inflation-on-purchasing-power 3234
discussed earlier about the calculation of percentage changes but you can still use thisformula any time it always works One over the price level gives you the purchasing power of the dollar and when the price level is only 76 percent what it was before your purchasing power is going to be 132 percent of what it was before Falling prices give us an increase in the purchasing power of the dollar
842019 Impact of Inflation on Purchasing Power
httpslidepdfcomreaderfullimpact-of-inflation-on-purchasing-power 3334
REFERENCES
1 httpwwwworldsalariesorg
2 International Monetary Fund World Economic Outlook Database September
2006
3 Website of Australian Bureau of Statistics
4 Website of Blanco de Mexico
5 Website of Bank of England
6 Website of Central Bank of Brazil
7 Website of European Central bank
8 Website of International Organization of Labor
9 Website of the Labor Department of India
10 Website of the Ministry of Economics and Planning of Saudi Arabia
11 Website of the Ministry of Finance of the Russian Federation
12 Website of National Bureau of Statistics of China
13 Website of Statistics Bureau of Japan
14 Website of Statistics Canada
15 Website of Statistics South Africa
16 Website of the United States Labor Department
17 Website of Wikipedia on purchasing power parity and consumer price index
842019 Impact of Inflation on Purchasing Power
httpslidepdfcomreaderfullimpact-of-inflation-on-purchasing-power 3434

842019 Impact of Inflation on Purchasing Power
httpslidepdfcomreaderfullimpact-of-inflation-on-purchasing-power 534
Conclusion or Summery
References
842019 Impact of Inflation on Purchasing Power
httpslidepdfcomreaderfullimpact-of-inflation-on-purchasing-power 634
INTRODUCTION
The purchasing power of a consumer depends upon wealth and the prices of the goodsand services The customer can purchase domestically or from aboard if there is a freetrade condition If the purchase occurs in the international market exchange rate will play a role in calculating affordability Furthermore a consumer who is employed earnsincome while spending Hisher buying power also depends on the changes in wagesrelative to inflation This article discusses the factors such as exchange rate prices andwage level affecting the purchasing power of consumers who reside in various countriesin the world from 2000 to 2008
Inflation can be felt at gas pumps and grocery stores The official government consumer price inflation rate was 27 percent higher as of March compared to one year ago It had been zero for all of 2009 and 16 percent for all of 2010 which was the reason providedas to why social security checks did not require a cost-of-living-adjustment this year
However consumer price inflation is building and could easily rise to 4 to 5 percent bythe yearrsquos end and possibly even higher if there is no retreat in gas and food pricesProducer price inflation is already near 6 percent Incredibly however US government bond yields are implying low future inflation The US Treasury can borrow today at alow 34 percent rate for 10 years despite the very high budget deficit and plenty of money printing
Savers lose if there is unexpected inflation because of the loss in purchasing power of themoney saved Conversely borrowers win from unexpected inflation
How does this work The table below shows past returns for people who saved money
with a 10-year US Treasury For example someone who saved $100 via US Treasuryin 1950 would have accumulated $121 in at the end of the 10-year term assuming allannual interest payments have been saved However there was some inflation over thatdecade so their purchasing power was eroded to the point that the original $100investment would have provided only $102 in purchasing power after 10 years Other periods are shown below People who saved money at the start of 1970 actually came outwith much less purchasing power after 10 years
842019 Impact of Inflation on Purchasing Power
httpslidepdfcomreaderfullimpact-of-inflation-on-purchasing-power 734
What about going forward over the next 10 years If you invest $100 in the 10-year US
Treasury bond today you will have $131 in ten years based on todayrsquos 34 percent yieldIt is unlikely that we will experience the same kind of inflation seen in the 1970sHowever if such a high rate of inflation were to occur then the $131 cumulative savingsafter 10 years would translate into only $64 in purchasing power On the other hand if there is low inflation like in the 1950s then the saver would have $104 in purchasing power
Purchasing power
Purchasing power is the number of goodsservices that can be purchased with a unit of currency For example if you had taken one dollar to a store in the 1950s you would
have been able to buy a greater number of items than you would today indicating thatyou would have had a greater purchasing power in the 1950s Currency can be either acommodity money like gold or silver or fiat currency or free-floating market-valuedcurrency like US dollars As Adam Smith noted having money gives one the ability tocommand others labor so purchasing power to some extent is power over other peopleto the extent that they are willing to trade their labor or goods for money or currency
If ones monetary income stays the same but the price level increases the purchasing power of that income falls Inflation does not always imply falling purchasing power of ones money income since it may rise faster than the price level A higher real income means a higher purchasing power since real income refers to the income adjusted for
inflation
For a price index its value in the base year is usually normalized to a value of 100 The purchasing power of a unit of currency say a dollar in a given year expressed in dollarsof the base year is 100 P where P is the price index in that year So by definition the purchasing power of a dollar decreases as the price level rises The purchasing power intodays money of an amount C of money t years into the future can be computed withthe formula for the present value
842019 Impact of Inflation on Purchasing Power
httpslidepdfcomreaderfullimpact-of-inflation-on-purchasing-power 834
Where in this case i is an assumed future annual inflation rate
How Does Inflation Affect The Purchasing Power of Money
Inflation affects how people can spend money Inflation is an economic phenomenon thathas an increasing change in the price of goods and services A closely linked phenomenon to inflation is deflation sometimes called negative inflation Deflationoccurs when there is a decreasing change in the price of goods and services Inflation anddeflation affect how a consumer can buy goods and the value of debt Inflation can occur in wages or prices
Measuring Inflation
Price inflation is typically measured using the consumer price index (CPI) The UnitedStates Bureau of Labor Statistics keeps track of the CPI The CPI takes a constant basketof goods and sees how the price changes from year to year If the price of the basket of goods increases then there is price inflation If the price of the basket of goods decreasesthen there is deflation People measure wage inflation using the employment cost indexThe employment cost index shows how the cost of labor increases or decreases over a period of time
Inflation and Purchasing ProductsPrice inflation decreases peoples ability to pay for goods The concept at a basic levelsays if an employees wages remain steady but the cost of goods increases then theemployee can afford fewer goods As wage inflation occurs people will be able to buymore products A general misconception is that when wages rise prices also rise andaccording to the Federal Reserve Bank of Cleveland there is little support that wageinflations cause price inflation
Inflation and Debt
Price inflation is a debtors best friend and a creditors worst enemy As the pricesincrease the amount borrowed will deteriorate in value so the debtor is paying back lessmoney and the creditor is receiving less money For example a student borrows $100000in 2005 and then inflation occurs over the next couple years Inflation then makes that$100000 comparatively worth only $80000 due to the increase in prices When wagesinflate both the borrowers and the creditors win The borrowers can repay their loansquicker due to higher income The borrowers then should receive loan payments quicker if the borrowers pay back their loans with the increased wages
842019 Impact of Inflation on Purchasing Power
httpslidepdfcomreaderfullimpact-of-inflation-on-purchasing-power 934
Deflation and Purchasing Products
Deflation has the opposite affect of inflation in that consumers will be able to buy more productsas the price for the product decreases Deflation however is not good for the overall economyand can be worse than inflation If a company has costs sunk into production before deflationthese costs will not readjust to the deflation Since the costs remain high to the price of moneythe company will receive less revenue when the product sells at a deflated price As wagesdeflate consumers can buy less with their money because their disposable income is decreased
Deflation and Debt
Deflation and debt has the opposite affect as inflation Debtors will pay back more money than theycomparatively took out and creditors will receive more money As wages deflate people may have a harder time paying off debt which will increase the number of defaults by borrowers
INFLATION
In economics inflation is a rise in the general level of prices of goods and services in aneconomy over a period of time When the general price level rises each unit of currency buys fewer goods and services Consequently inflation also reflects erosion in the purchasing power of money ndash a loss of real value in the internal medium of exchange andunit of account in the economy A chief measure of price inflation is the inflation rate theannualized percentage change in a general price index (normally the Consumer Price Index) over time
Measures of inflation are
Inflation is usually estimated by calculating the inflation rate of a price index usually theConsumer Price Index] The Consumer Price Index measures prices of a selection of goods and services purchased by a typical consumer The inflation rate is the percentage rate of change of a price index over time
For instance in January 2007 the US Consumer Price Index was 202416 and inJanuary 2008 it was 211080 The formula for calculating the annual percentage rateinflation in the CPI over the course of 2007 is
The resulting inflation rate for the CPI in this one year period is 428 meaning thegeneral level of prices for typical US consumers rose by approximately four percentin 2007
Other widely used price indices for calculating price inflation include the following
842019 Impact of Inflation on Purchasing Power
httpslidepdfcomreaderfullimpact-of-inflation-on-purchasing-power 1034
bull Producer price indices (PPIs) which measures average changes in pricesreceived by domestic producers for their output This differs from the CPI in that price subsidization profits and taxes may cause the amount received by the producer to differ from what the consumer paid There is also typically a delay between an increase in the PPI and any eventual increase in the CPI Producer
price index measures the pressure being put on producers by the costs of their raw materials This could be passed on to consumers or it could be absorbed by profits or offset by increasing productivity In India and the United States anearlier version of the PPI was called the Wholesale Price Indexbull Commodity price indices which measure the price of a selection of commodities In the present commodity price indices are weighted by the relativeimportance of the components to the all in cost of an employeebull Core price indices because food and oil prices can change quickly due tochanges in supply and demand conditions in the food and oil markets it can bedifficult to detect the long run trend in price levels when those prices areincluded Therefore most statistical agencies also report a measure of core
inflation which removes the most volatile components (such as food and oil)from a broad price index like the CPI Because core inflation is less affected byshort run supply and demand conditions in specific markets central banks rely onit to better measure the inflationary impact of current monetary policy
Other common measures of inflation are
bull GDP deflator is a measure of the price of all the goods and servicesincluded in gross domestic product (GDP) The US Commerce Department publishes a deflator series for US GDP defined as its nominal GDP measuredivided by its real GDP measurebull
Regional inflation The Bureau of Labor Statistics breaks down CPI-Ucalculations down to different regions of the USbull Historical inflation Before collecting consistent econometric data becamestandard for governments and for the purpose of comparing absolute rather thanrelative standards of living various economists have calculated imputed inflationfigures Most inflation data before the early 20th century is imputed based on theknown costs of goods rather than compiled at the time It is also used to adjustfor the differences in real standard of living for the presence of technologybull Asset price inflation is an undue increase in the prices of real or financialassets such as stock (equity) and real estate While there is no widely acceptedindex of this type some central bankers have suggested that it would be better toaim at stabilizing a wider general price level inflation measure that includes someasset prices instead of stabilizing CPI or core inflation only The reason is that byraising interest rates when stock prices or real estate prices rise and loweringthem when these asset prices fall central banks might be more successful inavoiding bubbles and crashes in asset prices
842019 Impact of Inflation on Purchasing Power
httpslidepdfcomreaderfullimpact-of-inflation-on-purchasing-power 1134
Issues in measuring
Measuring inflation in an economy requires objective means of differentiating changes in
nominal prices on a common set of goods and services and distinguishing them fromthose price shifts resulting from changes in value such as volume quality or performance For example if the price of a 10 oz can of corn changes from $090 to$100 over the course of a year with no change in quality then this price differencerepresents inflation This single price change would not however represent generalinflation in an overall economy To measure overall inflation the price change of a largebasket of representative goods and services is measured This is the purpose of a price index which is the combined price of a basket of many goods and services Thecombined price is the sum of the weighted average prices of items in the basket Aweighted price is calculated by multiplying the unit price of an item to the number of those items the average consumer purchases Weighted pricing is a necessary means to
measuring the impact of individual unit price changes on the economys overall inflationThe Consumer Price Index for example uses data collected by surveying households todetermine what proportion of the typical consumers overall spending is spent on specificgoods and services and weights the average prices of those items accordingly Thoseweighted average prices are combined to calculate the overall price To better relate pricechanges over time indexes typically choose a base year price and assign it a value of 100 Index prices in subsequent years are then expressed in relation to the base year priceWhile comparing inflation measures for various periods one has to take intoconsideration the Base effect (inflation) as well
Inflation measures are often modified over time either for the relative weight of goods in
the basket or in the way in which goods and services from the present are compared withgoods and services from the past Over time adjustments are made to the type of goodsand services selected in order to reflect changes in the sorts of goods and services purchased by typical consumers New products may be introduced older productsdisappear the quality of existing products may change and consumer preferences canshift Both the sorts of goods and services which are included in the basket and theweighted price used in inflation measures will be changed over time in order to keep pacewith the changing marketplace
Inflation numbers are often seasonally adjusted in order to differentiate expected cyclicalcost shifts For example home heating costs are expected to rise in colder months and
seasonal adjustments are often used when measuring for inflation to compensate for cyclical spikes in energy or fuel demand Inflation numbers may be averaged or otherwise subjected to statistical techniques in order to remove statistical noise andvolatility of individual prices
When looking at inflation economic institutions may focus only on certain kinds of prices or special indices such as the core inflation index which is used by central banksto formulate monetary policy Most inflation indices are calculated from weighted
842019 Impact of Inflation on Purchasing Power
httpslidepdfcomreaderfullimpact-of-inflation-on-purchasing-power 1234
averages of selected price changes This necessarily introduces distortion and can lead tolegitimate disputes about what the true inflation rate is This problem can be overcome byincluding all available price changes in the calculation and then choosing the median value
7 most harmful effects of Inflation on different aspects of a developing country like India
Why should we be concerned with the problem of inflation The answer lies in two facts
I Left to itself inflation would move from its initial beneficiary stage to that of a harmfulone For this reason it is necessary to prevent inflation from gaining strength
II A stronger inflation is more difficult to control than a mild one And there is no way to
control a hyperinflation
The beneficial effects of inflation are limited to only its initial phase when the price riseis sufficiently mild During that period there is a favorable impact upon both output andemployment The increase in prices and distributive inequalities are more thancounterbalanced by gains in output and employment
However once inflationary process gathers some strength its ill effects come todominate the scene These have been discussed above and would be only brieflyenumerated here
1 Right from the beginning inflation adds to inequalities of income and wealthHowever in its last phase it is not longer able to do so because money ceases to beanacceptable store of value It is a generally agreed statement that inequalities reduceaggregate social welfare and should be avoided provided in the process productionactivity does not suffer
2 Every economy needs a continuous addition to its productive capacity for which itshould encourage capital formation In a money economy capital formation takes placewhen a part of money income is saved and transferred to the investors who in turn use itfor investment and capital formation However inflation by its very nature discouragessaving activity It makes consumption more attractive than saving
The adverse impact on saving and capital formation is more serious for-anunderdeveloped country because it needs a higher rate of capital accumulation
3 Inflation leads to a shift in the asset preference of wealth holders Their preference for tangible assets may be counterbalanced in the initial phases of inflation by an increase ininterest rate However in later stages of inflation even an upward movement in interestrate fails to neutralize the shift in asset preference
842019 Impact of Inflation on Purchasing Power
httpslidepdfcomreaderfullimpact-of-inflation-on-purchasing-power 1334
4 Inflation leads to balance of payments problems When domestic prices rise faster than prices in foreign countries exports tend to lag behind imports The rate of exchange alsotends to depreciate both on account of falling purchasing power of currency within thecountry and adverse balance of payments In some cases there may also be an outflow of capital A developed country may be able to handle the problem of adverse balance of
payments through structural adjustment but a developing country is not able to do soeasily because they suffer from large institutional and other rigidities
5 Inflation distorts the financial system of the country In its initial stages the system isable to withstand its adverse effect because the financial institutions by their very naturetend to ignore the purchasing power of money and operate with reference to interest ratesand maturity of financial instruments However when inflation gathers strength thefinancial system cannot withstand it and collapses
6 Once inflation crosses its earlier phases strain on the financial system speculationexpectations of further price rise and similar other forces lead to an increase in
unemployment and a fall in output Eventually in the final phase of inflation the outputand employment levels fall to abysmally low levels
7 First Inflation is a hidden tax as it leads to fall in purchasing power of money Ithappens particularly when authorities resort to deficit spending when their tax receiptslag behind and their expenditure does not decrease The taxpayers therefore lose onaccount of reduced purchasing power of their money incomes In other words theauthorities are able to collect resources from the taxpayers without specifically levyingadditional taxes on them Secondly when prices rise the fixed income earners find thatthe purchasing power of their money incomes is falling while the real income of the profit earners is increasing When inflation becomes still stronger the holders of financial
wealth also lose This way inflation is a hidden tax by entrepreneurs on consumers andon recipients of contractual incomes
842019 Impact of Inflation on Purchasing Power
httpslidepdfcomreaderfullimpact-of-inflation-on-purchasing-power 1434
Review of Literature
Figure 1 Consumer price indexes of representative economies from 2000 to 2008
(source ref 3 to16)
650
842019 Impact of Inflation on Purchasing Power
httpslidepdfcomreaderfullimpact-of-inflation-on-purchasing-power 1534
CPI 2000 2001 2002 2003 2004 2005 2006 2007 2008 (May)
United States 1740 1767 1809 1843 1903 1968 2018 2100 2166United Kingdom 937 947 963 973 987 1008 1036 1057 NAEuropean Union 908 926 948 966 989 1011 1031 1062 1082
Brazil 1000 1077 1202 1295 1371 1428 1459 1504 1560
Japan 1022 1015 1006 1003 1003 1000 1003 1003 1017
India 4410 4580 4770 4960 5140 5360 5630 6000 6360China 1004 1011 1003 1015 1055 1074 1090 1167 NA
Canada 970 977 1015 1036 1058 1080 1098 1124 1139
Australia 1313 1354 1395 1428 1465 1506 1555 1601 1622Mexico 932 974 1029 1070 1126 1163 1210 1256 1281
Russia 1000 1214 1406 1598 1773 1997 2190 2388 2709
South Africa 1000 1057 1154 1221 1238 1280 1340 1435 1515Saudi Arabia 989 978 980 986 989 996 1018 1060 1150
Figure 2 Relative purchasing power parity of representative economies from 2000 to
2008
23
842019 Impact of Inflation on Purchasing Power
httpslidepdfcomreaderfullimpact-of-inflation-on-purchasing-power 1634
Rel PPP exchange 2000 2001 2002 2003 2004 2005 2006 2007 2008
United States 1000 1000 1000 1000 1000 1000 1000 1000 1000
United Kingdom 1000 0995 0989 0980 0963 0951 0953 0935 NA
European Union 1000 1005 1004 1005 0996 0985 0979 0969 0958
Brazil 1000 1060 1156 1223 1254 1262 1258 1246 1253
Japan 1000 0978 0947 0927 0897 0865 0846 0813 0799
India 1000 1023 1040 1062 1066 1075 1101 1127 1158
China 1000 0992 0961 0954 0960 0945 0936 0963 NACanada 1000 0992 1006 1008 0997 0984 0976 0960 0943
Australia 1000 1015 1022 1027 1020 1014 1021 1010 0992
Mexico 1000 1028 1061 1083 1104 1103 1119 1116 1104
Russia 1000 1195 1352 1509 1621 1766 1888 1978 2176
South Africa 1000 1041 1110 1153 1132 1132 1155 1189 1217
Saudi Arabia 1000 0974 0953 0941 0914 0890 0888 0888 0934
Figure 3 PPP exchange rate published by the International Monetary Fund (IMF ref 2)
842019 Impact of Inflation on Purchasing Power
httpslidepdfcomreaderfullimpact-of-inflation-on-purchasing-power 1734
16
18
r
Note x100 for Japanese currency
Country 2000 2001 2002 2003 2004 2005 2006 2007
United States 1000 1000 1000 1000 1000 1000 1000 1000
United Kingdom 0645 0645 0654 0662 0663 0659 0661 0669
Germany 0934 0923 0919 0912 0893 0876 0866 0864
Brazil 0867 0909 0985 1111 1172 1211 1231 1270
Japan 1498 1448 1407 1364 1310 1266 1237 1233
India 8473 8570 8630 8803 9006 9235 9593 9989
China 1828 1822 1801 1813 1891 1917 1895 1929
Canada 1218 1203 1193 1207 1215 1221 1206 1211
Australia 1362 1380 1393 1406 1421 1451 1460 1477
Mexico 6195 6411 6737 7171 7501 7696 7792 7964
Russia 6833 7773 8833 9870 11507 13512 15326 16692
South Africa 2110 2219 2413 2476 2569 2633 2707 2808
Saudi Arabia 2678 2526 2554 2649 2864 3250 3534 3698
842019 Impact of Inflation on Purchasing Power
httpslidepdfcomreaderfullimpact-of-inflation-on-purchasing-power 1834
Figure 4 Changes of nominal exchange rate from 2000 to 2008
190
x c h a n g e R a t e
Change (E) Dec-00 Dec-01 Dec-02 Dec-03 Dec-04 Dec-05 Dec-06 Dec-07 Jun-08
US Dollar 10000 10000 10000 10000 10000 10000 10000 10000 10000Pound 10000 10299 9254 8292 7774 8627 7654 7576 7500Euro 10000 10463 8889 7349 6859 7781 7068 6342 5860Real 10000 11897 18205 14821 13641 11795 10974 9128 8205
Yen 10000 11491 10439 9386 9035 10351 10439 9747 9332
Rupee 10000 10310 10267 9733 9283 9626 9507 8388 9176
Yuan 10000 10000 10000 10000 10000 9783 9510 8816 8285
Can $ 10000 10600 10533 8600 8000 7800 7800 6600 6803
Aus $ 10000 10889 9889 7389 7167 7556 7056 6333 5787
Peso 10000 9542 10864 11696 11602 11061 11249 11363 10708
Rouble 10000 10780 11312 10390 9858 10213 9326 8723 8333
Rand 10000 15789 11316 8684 7500 8355 9276 9013 10263
Riyal 10000 10000 10000 10000 10000 10000 10000 10000 10000
842019 Impact of Inflation on Purchasing Power
httpslidepdfcomreaderfullimpact-of-inflation-on-purchasing-power 1934
Figure 5 Changes of real (CPI) exchange rate from 2000 to 2008
170
a n g e R a t e Change (e) Dec-00 Dec-01 Dec-02 Dec-03 Dec-04 Dec-05 Dec-06 Dec-07 Jun-08
United States 10000 10000 10000 10000 10000 10000 10000 10000 10000
United Kingdom 10000 10348 9361 8458 8071 9071 8029 8107 NA
European Union 10000 10412 8854 7313 6885 7902 7221 6543 6120
Brazil 10000 11221 15746 12122 10882 9343 8722 7327 6550
Japan 10000 11750 11025 10130 10069 11965 12336 11988 11675
India 10000 10082 9869 9166 8711 8957 8637 7442 7922China 10000 10085 10408 10477 10412 10348 10162 9155 NA
Canada 10000 10687 10466 8529 8022 7924 7992 6875 7213
Australia 10000 10723 9677 7196 7025 7450 6909 6270 5832
Mexico 10000 9282 10235 10797 10513 10031 10053 10186 9703
Russia 10000 9018 8365 6887 6081 5784 4939 4410 3830
South Africa 10000 15170 10195 7533 6626 7383 8029 7582 8434
Saudi Arabia 10000 10269 10492 10624 10937 11231 11267 11263 10707
842019 Impact of Inflation on Purchasing Power
httpslidepdfcomreaderfullimpact-of-inflation-on-purchasing-power 2034
Figure 6 Wage increase in different countries from 2000 to 2008 (source ref 1 3 to 14)
670
s e
Wage Increase 2000 2001 2002 2003 2004 2005 2006 2007 2008
United States 000 359 479 684 1060 1265 1658 1966 2291
United Kingdom 000 342 724 1125 1624 2055 2554 3033 3209European Union 000 267 531 750 955 1159 1405 1617 NA
Brazil 000 826 1551 1163 1050 1276 1839 5068 5720
Japan 000 -096 -385 -395 -472 -375 -279 -308 -1992
India 000 253 580 967 1379 2387 2929 3688 4123
China 000 1608 3257 4967 7058 9501 12347 NA NA
Canada 000 142 356 497 718 1063 1393 1758 2044
Australia 000 330 692 1087 1422 2021 2577 3073 3158
Mexico 000 1258 2010 2875 3480 4232 5140 -3118 NA
Russia 000 4575 9613 14737 20319 28484 37836 51147 66631
South Africa 000 956 2134 2613 3802 3988 5251 NA NA
842019 Impact of Inflation on Purchasing Power
httpslidepdfcomreaderfullimpact-of-inflation-on-purchasing-power 2134
Figure 7 Relative purchasing power parity from 2000 to 2008 after adjusting for wage
increase
12
13
e
s
Rel PPP adj for
wage 2000 2001 2002 2003 2004 2005 2006 2007 2008
United States 1000 1000 1000 1000 1000 1000 1000 1000 1000
United Kingdom 1000 0997 0966 0941 0916 0889 0885 0858 0000
European Union 1000 1014 0998 0997 1002 0989 0993 0988 NA
Brazil 1000 1014 1049 1170 1255 1261 1239 0989 0979
Japan 1000 1023 1032 1031 1042 1013 1015 1004 1227
India 1000 1033 1030 1034 1036 0977 0993 0985 1008
China 1000 0885 0759 0681 0623 0546 0488 0448 NA
Canada 1000 1013 1018 1026 1029 1002 0999 0977 0962
Australia 1000 1018 1002 0989 0988 0950 0947 0925 0927
Mexico 1000 0946 0926 0899 0905 0873 0862 1940 NA
Russia 1000 0850 0723 0652 0591 0517 0460 0387 0349
South Africa 1000 0984 0959 0976 0907 0911 0883 NA NA
842019 Impact of Inflation on Purchasing Power
httpslidepdfcomreaderfullimpact-of-inflation-on-purchasing-power 2234
Figure 8 Real exchange rate from 2000 to 2008 after adjusting for wage increase
1600
g e s Change e adj for
Wage 2000 2001 2002 2003 2004 2005 2006 2007
United States 10 000 10000 10000 100 00 10 000 1000 0 100 00 10000
United Kingdom 10000 10364 9147 8122 7679 8476 7456 7443
European Union 10000 10505 8804 7255 6929 7938 7327 6673Brazil 10000 10737 14285 11602 10891 9334 8588 5818Japan 10000 12290 12015 11267 11687 14004 14794 14800India 10000 10186 9774 8929 8467 8146 7787 6506China 10000 8999 8226 7479 6751 5978 5302 4260
Canada 10000 10916 10589 8681 8278 8068 8177 6997Australia 10000 10753 9484 6934 6802 6982 6405 5739Mexico 10000 8540 8929 8959 8626 7940 7741 NARussia 10000 6409 4469 2974 2218 1693 1204 863
South Africa 10000 14343 8804 6381 5309 5946 6137 NA
842019 Impact of Inflation on Purchasing Power
httpslidepdfcomreaderfullimpact-of-inflation-on-purchasing-power 2334
Table 1 Market exchange rate from 2000 to 2008
Nominal Exchange Rate (E) Dec-00 Dec-01 Dec-02 Dec-03 Dec-04 Dec-05 Dec-06 Dec-07 Jun-08US Dollar 10 10 10 10 10 10 10 10 10
British Pound 07 07 06 06 05 06 05 05 05Euro 11 11 10 08 07 08 08 07 06
Brazilian Real 20 23 36 29 27 23 21 18 16
Japanese Yen 1140 1310 1190 1070 1030 1180 1190 1111 1064Indian Rupee 468 482 480 455 434 450 444 392 429
Chinese Yuan 83 83 83 83 83 81 79 73 69
Canadian Dollar 15 16 16 13 12 12 12 10 10Australian Dollar 18 20 18 13 13 14 13 11 10
Mexico Peso 96 92 104 112 112 106 108 109 103
Russian Rouble 282 304 319 293 278 288 263 246 235South African Rand 76 120 86 66 57 64 71 69 78
Saudi Arabian Riyal 38 38 38 38 38 38 38 38 38
Table 2 Weekly Wages from 2000 to 2008
Weekly Wage (in US$) 2000 2001 2002 2003 2004 2005 2006 2007 2008United States 5850 6060 6130 6250 6470 6590 6820 7000 7190
United Kingdom 5286 5309 6126 7093 7905 7386 8670 9094 9310
European Union 3635 3567 4310 5327 5825 5239 5909 6725 00
Brazil 983 894 624 740 796 939 1060 1622 1883
Japan 6636 5719 6112 6791 6998 6170 6180 6599 5694
India 144 143 148 162 176 185 196 235 221
China 217 252 287 324 370 432 509 632 00
Canada 4370 4182 4297 5334 5855 6199 6384 7786 7738
Australia 3737 3545 4040 5608 5956 5946 6661 7714 8497
Mexico 771 910 853 849 896 993 1038
Russia 197 266 342 469 606 743 1011 1381 1812
South Africa 1641 1139 1760 2384 3021 2748 2699
Note The EU wage is an average of Germany France Italy and Spain
842019 Impact of Inflation on Purchasing Power
httpslidepdfcomreaderfullimpact-of-inflation-on-purchasing-power 2434
PURCHASING POWER PARITY
The purchasing power parity (PPP) theory uses the long-term equilibrium exchange
rate of two currencies to equalize their purchasing power Developed by Gustav Cassel in1920 it is based on the law of one price the theory states that in ideally efficientmarkets identical goods should have only one price
This purchasing power SEM rate equalizes the purchasing power of different currenciesin their home countries for a given basket of goods Using a PPP basis is arguably moreuseful when comparing differences in living standards on the whole between nations because PPP takes into account the relative cost of living and the inflation rates of different countries rather than just a nominal gross domestic product (GDP) comparisonThe best-known and most-used purchasing power parity exchange rate is the Geary-Khakis dollar (the international dollar)
PPP exchange rates (the real exchange rate) fluctuations are mostly due to marketexchange rates movements Aside from this volatility consistent deviations of the marketand PPP exchange rates are observed for example (market exchange rate) prices of non-traded goods and services are usually lower where incomes are lower (A US dollar exchanged and spent in India will buy more haircuts than a dollar spent in the UnitedStates) PPP takes into account this lower cost of living and adjusts for it as though allincome was spent locally In other words PPP is the amount of a certain basket of basicgoods which can be bought in the given country with the money it produces
There can be marked differences between PPP and market exchange rates [1] For
example the World Banks World Development Indicators 2005 estimated that in 2003one United States dollar was equivalent to about 18 Chinese Yuan by purchasing power parity [2] - considerably different from the nominal exchange rate that put one dollar equalto 76 Yuan This discrepancy has large implications for instance GDP per capita in thePeoples Republic of China is about US$1800 while on a PPP basis it is about US$7204This is frequently used to assert that China is the worlds second-largest economy butsuch a calculation would only be valid under the PPP theory At the other extremeJapans nominal GDP per capita is around US$37600 but its PPP figure is onlyUS$30615
842019 Impact of Inflation on Purchasing Power
httpslidepdfcomreaderfullimpact-of-inflation-on-purchasing-power 2534
First letrsquos look at the situation of domestic buying Gustav Cassel developed the purchasing power parity (PPP) theory in 1920 to compare the purchasing power of different currencies in their home countries based on the assumption that identical goodsshould have the same price (law of one price) PPP exchange rate is defined in Equation1
For
Dom
P
P PPP = (Eq 1)
Where PDom is domestic price and PFor is foreign price
The relative purchasing power parity relates the inflation rate (change of prices) in eachcountry to the change in the market exchange rate and is given in Equation 2
Dom
t
Dom
t
For t
For t
rel
P P
P P PPP
1
1
minus
minus
= (Eq 2)
Where Pt is the price level in period t To calculate the relative purchasing power parityof all of the goods and services consumed in a country we can substitute P t with theconsumer price index (CPI) of that country which leads to Equation 3
Dom
t
Dom
t
For
t
For
t
rel
CPI CPI
CPI CPI PPP
1
1
minus
minus
= (Eq 3)
Figure 1 shows the consumer price indexes of thirteen relatively large countries or economies The inflation rate is higher in the emerging economies than in the developedcountries because of the higher rate of economic growth
Figure 2 shows the changes in relative purchasing power parity of the above economiescalculated by Equation 3 By this calculation one may conclude that the US dollar hasappreciated against the Mexican Indian South African Brazilian and Russian currencies
by 10 to 217 while depreciated against the Australian European Canadian BritishChinese and Saudi Arabian currencies by 1 to 10 from 2000 to 2008 if theconsumptions are domestic This can be attributed to the difference in inflation rate of these countries Japanrsquos disinflation condition between 2000 and 2008 caused the USdollar to weaken approximately 20 over the same time period
842019 Impact of Inflation on Purchasing Power
httpslidepdfcomreaderfullimpact-of-inflation-on-purchasing-power 2634
The International Monetary Fund (IMF) has conducted similar calculation that includesmore factors such as gross domestic product (GDP) The PPP exchange rates published by the IMF are displayed in the following Figure 3 The data shown in Figure 2 areconsistent with the IMF data
It was recognized by many economists that the PPP exchange rate calculation is not perfect because of the difficulties in finding the same baskets of goods to compare acrosscountries The weighing of goods and services in the CPI index is not identical amongdifferent countries Often times the quality of goods and service purchased variesconsiderably for example Americans probably drive better cars and drink cleaner water than many people in developing countries Moreover many social benefits offered bythe welfare countries may not be included in the CPI calculations and this makes directcomparison of purchasing power difficult Nevertheless this methodology gives us arough idea how consumers are doing in different economies
REAL EXCHANGE RATE IN INTERNATIONAL TRADE
When consumers or businesses purchase goods and services from foreign countries theywill need to exchange the available domestic currency to foreign currencies in order tofulfill the trade The price of one currency in terms of another currency is called theexchange rate and it is determined by the currency market and in some cases by
individual governments The exchange rates of twelve foreign currencies to the USdollar from 2000 to 2008 are shown in Table 1 The US dollar depreciated against mostcurrencies in terms of market exchange rate after 2002 except for the Mexican Peso andBrazilian Real (until 2006)
Many people misunderstand the real prices if only the nominal (market) exchange rate isconsidered for the trade For example a three-bedroom apartment in China costs about1500000 Yuan while a similar apartment in the US cost about 400000 Dollar A post-doctorate position in Oxford University in England is paid about 40000 Pound per year
while a similar position in Massachusetts Institute of Technology in the US is paid60000 Dollar per year The market exchange rates do not reflect the real difference of the prices Therefore the real exchange rate which considers both the nominal exchangerate and prices should be used for international trade The real exchange rate is definedin Equation 4
For
Dom
P
P E Rate Exchangeal min Noe Rate Exchangeal Re times= )()( (Eq 4)
842019 Impact of Inflation on Purchasing Power
httpslidepdfcomreaderfullimpact-of-inflation-on-purchasing-power 2734
where PDom is domestic price and PFor is foreign price Using the above two examplesthe real exchange rates would be 18 Chinese apartment = 1 American apartment and075 Oxford salary = 1 MIT salary in 2008
If we substitute prices with CPI indexes in the above equation the real exchange for allthe goods and services can be estimated by Equation 5
For
Dom
CPI
CPI E e times= (Eq 5)
Figure 4 and Figure 5 show the percent changes of nominal exchange rate and real (CPI)exchange rate from 2000 to 2008 and the values are not the same When inflation (price
change) rates are taken into account the dollar actually strengthens against the JapaneseYen and Saudi Arabian Riyal while the advantage over the Peso and the Real (until 2005)diminished The magnitude of depreciation of the US dollar against the British Poundthe Euro the Canadian Dollar and the Chinese Yuan is 2-5 better in the real rate thanin the nominal rate On the other hand the dollar depreciated more against the IndianRupee the South African Rand (after 2002) and the Russian Ruble in the real rate than inthe nominal rate The real rate and the nominal rate for the Australian dollar are verysimilar This analysis indicates that one would make different decisions in buyingforeign goods and services when using the real exchange rate versus the nominalexchange rate
In addition if we compare the data in Figure 2 and Figure 5 it is obvious that the PPPexchange rate fluctuates less dramatically than the foreign exchange rate (except theRussian Ruble) In other words foreign exchange rates affect international trade morethan domestic consumption
WAGE FACTOR
Most consumers except the unemployed and retirees earn wages to make a livingEmployers usually give employees a small wages increase every year to offset inflationFigure 6 shows the percentage of wage increase in different countries The wage increasein the US EU and India is a few percent less than inflation over eight years while thewages in Canada Brazil and Australia outpaced inflation by a few percents in the same period The wage increase in UK Mexico South Africa China and Russia is even faster
842019 Impact of Inflation on Purchasing Power
httpslidepdfcomreaderfullimpact-of-inflation-on-purchasing-power 2834
double to triple digits gain over inflation is observed in these nations Japanrsquos wage isstagnant (or dropping slightly) from 2000 to 2008 It is unclear what exactly causes thesedifferences one may speculate that it may relate to the fiscal condition and account balance of the nations as well as how the governments want to regulate their economyFor example commodity producing countries is benefited from the recent purge of
commodity prices China has a large trade surplus the Japanese prices may have comedown from a very high level from decays ago It will be interested to see how the fastwage increase in some nations would impact their inflation situation in the future
The difference in wage changes certainly would have an impact to consumerrsquos purchasing power If we modify Equation 3 and Equation 5 for calculating relative PPPand real (CPI) exchange rate by a wage factor the following equations will results
For
t
For
t
Dom
t
Dom
t
Dom
t
Dom
t
For
t
For
t
rel
W W
W W
CPI CPI
CPI CPI PPP
1
1
1
1
minus
minus
minus
minus
times= (Eq 6)
For
Dom
For
Dom
W
W
CPI
CPI E e timestimes= (Eq 7)
where W denotes wages Using this modified calculation both domestic and foreign purchasing power will change Figure 7 and Figure 8 shows the relative PPP and realexchange rate after adjusting for wage increase After adjusting for wages the relativePPP become almost the same for the US EU Canada Japan (until 2007) India andBrazil (after 2006) Australia UK South Africa Mexico become the out performerswhich is not the case without adjusting for wages China and Russia demonstrate the bestimprovement in relative PPP because of the large increase of their wages
After adjusting for wages the buying power of Americans in international marketsweakens further relative to most foreign consumers except the Japanese Meanwhile thedepreciation of the US dollar against the Euro is about 5 less than before adjustment(using the 2008 figure) because of the wage advantage for Americans As pointed outearlier there are pitfalls for direct cross-comparison using the CPI index Additionallyother factors such as taxation may complicate the purchasing power calculation For example American income taxes are less than many industrialized countries while poorer nations probably donrsquot tax on income as much
842019 Impact of Inflation on Purchasing Power
httpslidepdfcomreaderfullimpact-of-inflation-on-purchasing-power 2934
Based on the above analysis the emerging economies have made big progress inenhancing the international purchasing power of their citizens thanks to increases of international trade employment and work force productivity Having said that the gap
of incomes between citizens of developed and developing countries are still quite large asshown in the Table 2 Additionally the consequences of environmental damages andincreased energy consumptions in developing countries due to rapid industrialization may be debatable issues
842019 Impact of Inflation on Purchasing Power
httpslidepdfcomreaderfullimpact-of-inflation-on-purchasing-power 3034
Conclusion
Exchange rate pricesinflation and wage level influence the purchasing power of consumers in domestic and international markets The domestic purchasing power ismainly affected by the inflation rate of individual countries and it is relatively equitableacross mature economies The international purchasing power is more volatile and isaffected by both exchange rate and prices Wage changes can further compensate or deprive purchasing power of consumers Analysis of current exchange rates prices andwages leads to the belief that foreign shoppers can get better bargains in Japan and theUS at the present time Consumers in emerging economies especially China and Russiahave experienced significant improvement in purchasing power recently when compared
to themselves They may catch up with the living standard of rich countries in the futureif this growth rate sustains Finally it will be interesting to research the fundamentaleconomic forces which influence the gauges that are measured in the articleWhen prices are rising you can buy less with a given amount of money When hotdogsare expensive a given amount of money will buy a small number of hotdogs But whenhotdogs are inexpensive that is the price is low your given hot dog allowance will purchase a lot more satisfaction There is a relationship between prices and purchasing power that is a reciprocal relationship and thatrsquos the relationship that wersquore going to bestudying in this lesson When prices are going from low prices to high prices that iswhen there is inflation in the economy the value of the dollar is shrinking that is your Purchasing power is going from being able to buy a lot to being able to buy a little Inthis lesson Irsquom going to begin by giving a simple numerical example and then wersquoll talk about how you can use the GDP deflator to show the relationship between the inflationrate and purchasing power
Letrsquos start by assuming that we are in a period of inflation and letrsquos let hotdogs be arepresentative good that is the price of all goods and services across the economy isincreasing at some general rate and wersquore going to look at the price of hotdogs in order toinfer what is happening to purchasing power as prices are rising Wersquore going to befocusing now on the reciprocal relationship between the price level and the purchasing power of the dollar that is what a dollar will buy as the price level is changing And Irsquovewritten out here as clearly as I can the formula that shows this reciprocal relationship thatis one over the price level equals the purchasing power of a dollar Let me make thisvery clear Letrsquos suppose that the price of a hotdog is five cents Well whatrsquos the purchasing power of your dollar Five cents is the same thing as one twentieth of adollar Therefore the reciprocal of one twentieth is twenty Your dollar will buy twentyhotdogs Thatrsquos its purchasing power
842019 Impact of Inflation on Purchasing Power
httpslidepdfcomreaderfullimpact-of-inflation-on-purchasing-power 3134
Now suppose wersquore in a period of inflation so that prices are rising and the price of ahotdog goes up to two dollars Whatrsquos happened to your purchasing power Well your dollar will no longer buy even a whole hotdog Two dollars or 2 has a reciprocal of onehalf that is you can now only afford half a hotdog Your purchasing power has shrunk from twenty hotdogs at a price of five cents a piece to one half a hotdog whenever the
price is two dollars per hotdog This simple example makes clear that the price level andthe purchasing power of the dollar are reciprocals
Now letrsquos look at some examples using the GDP deflator Suppose that wersquore in the year 2000 which is our base year for calculating the GDP deflator and we calculate the priceof a market basket of goods and services- that is a little bit of Housing and a little bit of transportation a little bit of medical care a little bit of clothingetc And wersquore going to call the price level in the year 2000 one hundred because itrsquos our base year
We look at those prices again in 2002 and we find that the price of the goods and
services as a ratio of the same prices in 2000 is equal to 104 That is prices haveincreased by about 4 percent between the year 2000 and 2002 So if we write the GDPdeflator not in the form we usually write it that is multiplied by 100 to get 104 but letrsquoswrite it now as in hundredths 104 to show the 4 percent increase in prices between theyear 2000 and 2002 Well whatrsquos happened to the purchasing power of a dollar betweenthe year 2000 and 2002 That is how much can we afford to buy in 2002 with a dollar if we measure it in the prices of the year 2000 Prices are higher in 2002 therefore thedollar wonrsquot buy as much Well if you takethe reciprocal of the GDP deflator 104 you get 096 Whatrsquos that saying Itrsquos saying thatwhat you could have bought for 96 cents back in the year 2000 now it costs you a dollar to buy in 2002 That is a dollar in 2002 is only worth what 96 cents was worth back inthe year 2000 You can afford to buy less Your purchasing power has shrunk by about 4 percent Your purchasing power shrinks at the same rate that the price level increases because the price level and your purchasing power are reciprocals of each other
Well letrsquos take another example during a period of deflation If we look at the years between 1929 and 1933 wersquoll see falling prices If we choose 1929 as the base year andif we call the price level in that 200000 or 100 if we look at prices in 1933 during thegreat depression we see that the price level has fallen by about 24 percent That is wersquovegone from 100 down to 076 So we now have lower prices in 1933 than we had in 1929
Now what does that mean What is going to happen to the purchasing power of your dollar when prices are lower Itrsquos clearly going to increase Yoursquore going to go from asmall purchasing power to a bigger purchasing power And if you takethe reciprocal of 76 percent you get 132 That is the purchasing power of the dollar hasincreased by about 32 percent in this example Now the reason the numbers donrsquot add upexactly the reason I canrsquot say a 24 percent decrease in prices is equal to a 24 percentincrease in purchasing power is because once your percentages start getting large yourun into this problem that a fifty percent increase is sorry that a 100 percent increase isthe reciprocal of a 50 percent decrease you wind up with this problem that wersquove
842019 Impact of Inflation on Purchasing Power
httpslidepdfcomreaderfullimpact-of-inflation-on-purchasing-power 3234
discussed earlier about the calculation of percentage changes but you can still use thisformula any time it always works One over the price level gives you the purchasing power of the dollar and when the price level is only 76 percent what it was before your purchasing power is going to be 132 percent of what it was before Falling prices give us an increase in the purchasing power of the dollar
842019 Impact of Inflation on Purchasing Power
httpslidepdfcomreaderfullimpact-of-inflation-on-purchasing-power 3334
REFERENCES
1 httpwwwworldsalariesorg
2 International Monetary Fund World Economic Outlook Database September
2006
3 Website of Australian Bureau of Statistics
4 Website of Blanco de Mexico
5 Website of Bank of England
6 Website of Central Bank of Brazil
7 Website of European Central bank
8 Website of International Organization of Labor
9 Website of the Labor Department of India
10 Website of the Ministry of Economics and Planning of Saudi Arabia
11 Website of the Ministry of Finance of the Russian Federation
12 Website of National Bureau of Statistics of China
13 Website of Statistics Bureau of Japan
14 Website of Statistics Canada
15 Website of Statistics South Africa
16 Website of the United States Labor Department
17 Website of Wikipedia on purchasing power parity and consumer price index
842019 Impact of Inflation on Purchasing Power
httpslidepdfcomreaderfullimpact-of-inflation-on-purchasing-power 3434
842019 Impact of Inflation on Purchasing Power
httpslidepdfcomreaderfullimpact-of-inflation-on-purchasing-power 634
INTRODUCTION
The purchasing power of a consumer depends upon wealth and the prices of the goodsand services The customer can purchase domestically or from aboard if there is a freetrade condition If the purchase occurs in the international market exchange rate will play a role in calculating affordability Furthermore a consumer who is employed earnsincome while spending Hisher buying power also depends on the changes in wagesrelative to inflation This article discusses the factors such as exchange rate prices andwage level affecting the purchasing power of consumers who reside in various countriesin the world from 2000 to 2008
Inflation can be felt at gas pumps and grocery stores The official government consumer price inflation rate was 27 percent higher as of March compared to one year ago It had been zero for all of 2009 and 16 percent for all of 2010 which was the reason providedas to why social security checks did not require a cost-of-living-adjustment this year
However consumer price inflation is building and could easily rise to 4 to 5 percent bythe yearrsquos end and possibly even higher if there is no retreat in gas and food pricesProducer price inflation is already near 6 percent Incredibly however US government bond yields are implying low future inflation The US Treasury can borrow today at alow 34 percent rate for 10 years despite the very high budget deficit and plenty of money printing
Savers lose if there is unexpected inflation because of the loss in purchasing power of themoney saved Conversely borrowers win from unexpected inflation
How does this work The table below shows past returns for people who saved money
with a 10-year US Treasury For example someone who saved $100 via US Treasuryin 1950 would have accumulated $121 in at the end of the 10-year term assuming allannual interest payments have been saved However there was some inflation over thatdecade so their purchasing power was eroded to the point that the original $100investment would have provided only $102 in purchasing power after 10 years Other periods are shown below People who saved money at the start of 1970 actually came outwith much less purchasing power after 10 years
842019 Impact of Inflation on Purchasing Power
httpslidepdfcomreaderfullimpact-of-inflation-on-purchasing-power 734
What about going forward over the next 10 years If you invest $100 in the 10-year US
Treasury bond today you will have $131 in ten years based on todayrsquos 34 percent yieldIt is unlikely that we will experience the same kind of inflation seen in the 1970sHowever if such a high rate of inflation were to occur then the $131 cumulative savingsafter 10 years would translate into only $64 in purchasing power On the other hand if there is low inflation like in the 1950s then the saver would have $104 in purchasing power
Purchasing power
Purchasing power is the number of goodsservices that can be purchased with a unit of currency For example if you had taken one dollar to a store in the 1950s you would
have been able to buy a greater number of items than you would today indicating thatyou would have had a greater purchasing power in the 1950s Currency can be either acommodity money like gold or silver or fiat currency or free-floating market-valuedcurrency like US dollars As Adam Smith noted having money gives one the ability tocommand others labor so purchasing power to some extent is power over other peopleto the extent that they are willing to trade their labor or goods for money or currency
If ones monetary income stays the same but the price level increases the purchasing power of that income falls Inflation does not always imply falling purchasing power of ones money income since it may rise faster than the price level A higher real income means a higher purchasing power since real income refers to the income adjusted for
inflation
For a price index its value in the base year is usually normalized to a value of 100 The purchasing power of a unit of currency say a dollar in a given year expressed in dollarsof the base year is 100 P where P is the price index in that year So by definition the purchasing power of a dollar decreases as the price level rises The purchasing power intodays money of an amount C of money t years into the future can be computed withthe formula for the present value
842019 Impact of Inflation on Purchasing Power
httpslidepdfcomreaderfullimpact-of-inflation-on-purchasing-power 834
Where in this case i is an assumed future annual inflation rate
How Does Inflation Affect The Purchasing Power of Money
Inflation affects how people can spend money Inflation is an economic phenomenon thathas an increasing change in the price of goods and services A closely linked phenomenon to inflation is deflation sometimes called negative inflation Deflationoccurs when there is a decreasing change in the price of goods and services Inflation anddeflation affect how a consumer can buy goods and the value of debt Inflation can occur in wages or prices
Measuring Inflation
Price inflation is typically measured using the consumer price index (CPI) The UnitedStates Bureau of Labor Statistics keeps track of the CPI The CPI takes a constant basketof goods and sees how the price changes from year to year If the price of the basket of goods increases then there is price inflation If the price of the basket of goods decreasesthen there is deflation People measure wage inflation using the employment cost indexThe employment cost index shows how the cost of labor increases or decreases over a period of time
Inflation and Purchasing ProductsPrice inflation decreases peoples ability to pay for goods The concept at a basic levelsays if an employees wages remain steady but the cost of goods increases then theemployee can afford fewer goods As wage inflation occurs people will be able to buymore products A general misconception is that when wages rise prices also rise andaccording to the Federal Reserve Bank of Cleveland there is little support that wageinflations cause price inflation
Inflation and Debt
Price inflation is a debtors best friend and a creditors worst enemy As the pricesincrease the amount borrowed will deteriorate in value so the debtor is paying back lessmoney and the creditor is receiving less money For example a student borrows $100000in 2005 and then inflation occurs over the next couple years Inflation then makes that$100000 comparatively worth only $80000 due to the increase in prices When wagesinflate both the borrowers and the creditors win The borrowers can repay their loansquicker due to higher income The borrowers then should receive loan payments quicker if the borrowers pay back their loans with the increased wages
842019 Impact of Inflation on Purchasing Power
httpslidepdfcomreaderfullimpact-of-inflation-on-purchasing-power 934
Deflation and Purchasing Products
Deflation has the opposite affect of inflation in that consumers will be able to buy more productsas the price for the product decreases Deflation however is not good for the overall economyand can be worse than inflation If a company has costs sunk into production before deflationthese costs will not readjust to the deflation Since the costs remain high to the price of moneythe company will receive less revenue when the product sells at a deflated price As wagesdeflate consumers can buy less with their money because their disposable income is decreased
Deflation and Debt
Deflation and debt has the opposite affect as inflation Debtors will pay back more money than theycomparatively took out and creditors will receive more money As wages deflate people may have a harder time paying off debt which will increase the number of defaults by borrowers
INFLATION
In economics inflation is a rise in the general level of prices of goods and services in aneconomy over a period of time When the general price level rises each unit of currency buys fewer goods and services Consequently inflation also reflects erosion in the purchasing power of money ndash a loss of real value in the internal medium of exchange andunit of account in the economy A chief measure of price inflation is the inflation rate theannualized percentage change in a general price index (normally the Consumer Price Index) over time
Measures of inflation are
Inflation is usually estimated by calculating the inflation rate of a price index usually theConsumer Price Index] The Consumer Price Index measures prices of a selection of goods and services purchased by a typical consumer The inflation rate is the percentage rate of change of a price index over time
For instance in January 2007 the US Consumer Price Index was 202416 and inJanuary 2008 it was 211080 The formula for calculating the annual percentage rateinflation in the CPI over the course of 2007 is
The resulting inflation rate for the CPI in this one year period is 428 meaning thegeneral level of prices for typical US consumers rose by approximately four percentin 2007
Other widely used price indices for calculating price inflation include the following
842019 Impact of Inflation on Purchasing Power
httpslidepdfcomreaderfullimpact-of-inflation-on-purchasing-power 1034
bull Producer price indices (PPIs) which measures average changes in pricesreceived by domestic producers for their output This differs from the CPI in that price subsidization profits and taxes may cause the amount received by the producer to differ from what the consumer paid There is also typically a delay between an increase in the PPI and any eventual increase in the CPI Producer
price index measures the pressure being put on producers by the costs of their raw materials This could be passed on to consumers or it could be absorbed by profits or offset by increasing productivity In India and the United States anearlier version of the PPI was called the Wholesale Price Indexbull Commodity price indices which measure the price of a selection of commodities In the present commodity price indices are weighted by the relativeimportance of the components to the all in cost of an employeebull Core price indices because food and oil prices can change quickly due tochanges in supply and demand conditions in the food and oil markets it can bedifficult to detect the long run trend in price levels when those prices areincluded Therefore most statistical agencies also report a measure of core
inflation which removes the most volatile components (such as food and oil)from a broad price index like the CPI Because core inflation is less affected byshort run supply and demand conditions in specific markets central banks rely onit to better measure the inflationary impact of current monetary policy
Other common measures of inflation are
bull GDP deflator is a measure of the price of all the goods and servicesincluded in gross domestic product (GDP) The US Commerce Department publishes a deflator series for US GDP defined as its nominal GDP measuredivided by its real GDP measurebull
Regional inflation The Bureau of Labor Statistics breaks down CPI-Ucalculations down to different regions of the USbull Historical inflation Before collecting consistent econometric data becamestandard for governments and for the purpose of comparing absolute rather thanrelative standards of living various economists have calculated imputed inflationfigures Most inflation data before the early 20th century is imputed based on theknown costs of goods rather than compiled at the time It is also used to adjustfor the differences in real standard of living for the presence of technologybull Asset price inflation is an undue increase in the prices of real or financialassets such as stock (equity) and real estate While there is no widely acceptedindex of this type some central bankers have suggested that it would be better toaim at stabilizing a wider general price level inflation measure that includes someasset prices instead of stabilizing CPI or core inflation only The reason is that byraising interest rates when stock prices or real estate prices rise and loweringthem when these asset prices fall central banks might be more successful inavoiding bubbles and crashes in asset prices
842019 Impact of Inflation on Purchasing Power
httpslidepdfcomreaderfullimpact-of-inflation-on-purchasing-power 1134
Issues in measuring
Measuring inflation in an economy requires objective means of differentiating changes in
nominal prices on a common set of goods and services and distinguishing them fromthose price shifts resulting from changes in value such as volume quality or performance For example if the price of a 10 oz can of corn changes from $090 to$100 over the course of a year with no change in quality then this price differencerepresents inflation This single price change would not however represent generalinflation in an overall economy To measure overall inflation the price change of a largebasket of representative goods and services is measured This is the purpose of a price index which is the combined price of a basket of many goods and services Thecombined price is the sum of the weighted average prices of items in the basket Aweighted price is calculated by multiplying the unit price of an item to the number of those items the average consumer purchases Weighted pricing is a necessary means to
measuring the impact of individual unit price changes on the economys overall inflationThe Consumer Price Index for example uses data collected by surveying households todetermine what proportion of the typical consumers overall spending is spent on specificgoods and services and weights the average prices of those items accordingly Thoseweighted average prices are combined to calculate the overall price To better relate pricechanges over time indexes typically choose a base year price and assign it a value of 100 Index prices in subsequent years are then expressed in relation to the base year priceWhile comparing inflation measures for various periods one has to take intoconsideration the Base effect (inflation) as well
Inflation measures are often modified over time either for the relative weight of goods in
the basket or in the way in which goods and services from the present are compared withgoods and services from the past Over time adjustments are made to the type of goodsand services selected in order to reflect changes in the sorts of goods and services purchased by typical consumers New products may be introduced older productsdisappear the quality of existing products may change and consumer preferences canshift Both the sorts of goods and services which are included in the basket and theweighted price used in inflation measures will be changed over time in order to keep pacewith the changing marketplace
Inflation numbers are often seasonally adjusted in order to differentiate expected cyclicalcost shifts For example home heating costs are expected to rise in colder months and
seasonal adjustments are often used when measuring for inflation to compensate for cyclical spikes in energy or fuel demand Inflation numbers may be averaged or otherwise subjected to statistical techniques in order to remove statistical noise andvolatility of individual prices
When looking at inflation economic institutions may focus only on certain kinds of prices or special indices such as the core inflation index which is used by central banksto formulate monetary policy Most inflation indices are calculated from weighted
842019 Impact of Inflation on Purchasing Power
httpslidepdfcomreaderfullimpact-of-inflation-on-purchasing-power 1234
averages of selected price changes This necessarily introduces distortion and can lead tolegitimate disputes about what the true inflation rate is This problem can be overcome byincluding all available price changes in the calculation and then choosing the median value
7 most harmful effects of Inflation on different aspects of a developing country like India
Why should we be concerned with the problem of inflation The answer lies in two facts
I Left to itself inflation would move from its initial beneficiary stage to that of a harmfulone For this reason it is necessary to prevent inflation from gaining strength
II A stronger inflation is more difficult to control than a mild one And there is no way to
control a hyperinflation
The beneficial effects of inflation are limited to only its initial phase when the price riseis sufficiently mild During that period there is a favorable impact upon both output andemployment The increase in prices and distributive inequalities are more thancounterbalanced by gains in output and employment
However once inflationary process gathers some strength its ill effects come todominate the scene These have been discussed above and would be only brieflyenumerated here
1 Right from the beginning inflation adds to inequalities of income and wealthHowever in its last phase it is not longer able to do so because money ceases to beanacceptable store of value It is a generally agreed statement that inequalities reduceaggregate social welfare and should be avoided provided in the process productionactivity does not suffer
2 Every economy needs a continuous addition to its productive capacity for which itshould encourage capital formation In a money economy capital formation takes placewhen a part of money income is saved and transferred to the investors who in turn use itfor investment and capital formation However inflation by its very nature discouragessaving activity It makes consumption more attractive than saving
The adverse impact on saving and capital formation is more serious for-anunderdeveloped country because it needs a higher rate of capital accumulation
3 Inflation leads to a shift in the asset preference of wealth holders Their preference for tangible assets may be counterbalanced in the initial phases of inflation by an increase ininterest rate However in later stages of inflation even an upward movement in interestrate fails to neutralize the shift in asset preference
842019 Impact of Inflation on Purchasing Power
httpslidepdfcomreaderfullimpact-of-inflation-on-purchasing-power 1334
4 Inflation leads to balance of payments problems When domestic prices rise faster than prices in foreign countries exports tend to lag behind imports The rate of exchange alsotends to depreciate both on account of falling purchasing power of currency within thecountry and adverse balance of payments In some cases there may also be an outflow of capital A developed country may be able to handle the problem of adverse balance of
payments through structural adjustment but a developing country is not able to do soeasily because they suffer from large institutional and other rigidities
5 Inflation distorts the financial system of the country In its initial stages the system isable to withstand its adverse effect because the financial institutions by their very naturetend to ignore the purchasing power of money and operate with reference to interest ratesand maturity of financial instruments However when inflation gathers strength thefinancial system cannot withstand it and collapses
6 Once inflation crosses its earlier phases strain on the financial system speculationexpectations of further price rise and similar other forces lead to an increase in
unemployment and a fall in output Eventually in the final phase of inflation the outputand employment levels fall to abysmally low levels
7 First Inflation is a hidden tax as it leads to fall in purchasing power of money Ithappens particularly when authorities resort to deficit spending when their tax receiptslag behind and their expenditure does not decrease The taxpayers therefore lose onaccount of reduced purchasing power of their money incomes In other words theauthorities are able to collect resources from the taxpayers without specifically levyingadditional taxes on them Secondly when prices rise the fixed income earners find thatthe purchasing power of their money incomes is falling while the real income of the profit earners is increasing When inflation becomes still stronger the holders of financial
wealth also lose This way inflation is a hidden tax by entrepreneurs on consumers andon recipients of contractual incomes
842019 Impact of Inflation on Purchasing Power
httpslidepdfcomreaderfullimpact-of-inflation-on-purchasing-power 1434
Review of Literature
Figure 1 Consumer price indexes of representative economies from 2000 to 2008
(source ref 3 to16)
650
842019 Impact of Inflation on Purchasing Power
httpslidepdfcomreaderfullimpact-of-inflation-on-purchasing-power 1534
CPI 2000 2001 2002 2003 2004 2005 2006 2007 2008 (May)
United States 1740 1767 1809 1843 1903 1968 2018 2100 2166United Kingdom 937 947 963 973 987 1008 1036 1057 NAEuropean Union 908 926 948 966 989 1011 1031 1062 1082
Brazil 1000 1077 1202 1295 1371 1428 1459 1504 1560
Japan 1022 1015 1006 1003 1003 1000 1003 1003 1017
India 4410 4580 4770 4960 5140 5360 5630 6000 6360China 1004 1011 1003 1015 1055 1074 1090 1167 NA
Canada 970 977 1015 1036 1058 1080 1098 1124 1139
Australia 1313 1354 1395 1428 1465 1506 1555 1601 1622Mexico 932 974 1029 1070 1126 1163 1210 1256 1281
Russia 1000 1214 1406 1598 1773 1997 2190 2388 2709
South Africa 1000 1057 1154 1221 1238 1280 1340 1435 1515Saudi Arabia 989 978 980 986 989 996 1018 1060 1150
Figure 2 Relative purchasing power parity of representative economies from 2000 to
2008
23
842019 Impact of Inflation on Purchasing Power
httpslidepdfcomreaderfullimpact-of-inflation-on-purchasing-power 1634
Rel PPP exchange 2000 2001 2002 2003 2004 2005 2006 2007 2008
United States 1000 1000 1000 1000 1000 1000 1000 1000 1000
United Kingdom 1000 0995 0989 0980 0963 0951 0953 0935 NA
European Union 1000 1005 1004 1005 0996 0985 0979 0969 0958
Brazil 1000 1060 1156 1223 1254 1262 1258 1246 1253
Japan 1000 0978 0947 0927 0897 0865 0846 0813 0799
India 1000 1023 1040 1062 1066 1075 1101 1127 1158
China 1000 0992 0961 0954 0960 0945 0936 0963 NACanada 1000 0992 1006 1008 0997 0984 0976 0960 0943
Australia 1000 1015 1022 1027 1020 1014 1021 1010 0992
Mexico 1000 1028 1061 1083 1104 1103 1119 1116 1104
Russia 1000 1195 1352 1509 1621 1766 1888 1978 2176
South Africa 1000 1041 1110 1153 1132 1132 1155 1189 1217
Saudi Arabia 1000 0974 0953 0941 0914 0890 0888 0888 0934
Figure 3 PPP exchange rate published by the International Monetary Fund (IMF ref 2)
842019 Impact of Inflation on Purchasing Power
httpslidepdfcomreaderfullimpact-of-inflation-on-purchasing-power 1734
16
18
r
Note x100 for Japanese currency
Country 2000 2001 2002 2003 2004 2005 2006 2007
United States 1000 1000 1000 1000 1000 1000 1000 1000
United Kingdom 0645 0645 0654 0662 0663 0659 0661 0669
Germany 0934 0923 0919 0912 0893 0876 0866 0864
Brazil 0867 0909 0985 1111 1172 1211 1231 1270
Japan 1498 1448 1407 1364 1310 1266 1237 1233
India 8473 8570 8630 8803 9006 9235 9593 9989
China 1828 1822 1801 1813 1891 1917 1895 1929
Canada 1218 1203 1193 1207 1215 1221 1206 1211
Australia 1362 1380 1393 1406 1421 1451 1460 1477
Mexico 6195 6411 6737 7171 7501 7696 7792 7964
Russia 6833 7773 8833 9870 11507 13512 15326 16692
South Africa 2110 2219 2413 2476 2569 2633 2707 2808
Saudi Arabia 2678 2526 2554 2649 2864 3250 3534 3698
842019 Impact of Inflation on Purchasing Power
httpslidepdfcomreaderfullimpact-of-inflation-on-purchasing-power 1834
Figure 4 Changes of nominal exchange rate from 2000 to 2008
190
x c h a n g e R a t e
Change (E) Dec-00 Dec-01 Dec-02 Dec-03 Dec-04 Dec-05 Dec-06 Dec-07 Jun-08
US Dollar 10000 10000 10000 10000 10000 10000 10000 10000 10000Pound 10000 10299 9254 8292 7774 8627 7654 7576 7500Euro 10000 10463 8889 7349 6859 7781 7068 6342 5860Real 10000 11897 18205 14821 13641 11795 10974 9128 8205
Yen 10000 11491 10439 9386 9035 10351 10439 9747 9332
Rupee 10000 10310 10267 9733 9283 9626 9507 8388 9176
Yuan 10000 10000 10000 10000 10000 9783 9510 8816 8285
Can $ 10000 10600 10533 8600 8000 7800 7800 6600 6803
Aus $ 10000 10889 9889 7389 7167 7556 7056 6333 5787
Peso 10000 9542 10864 11696 11602 11061 11249 11363 10708
Rouble 10000 10780 11312 10390 9858 10213 9326 8723 8333
Rand 10000 15789 11316 8684 7500 8355 9276 9013 10263
Riyal 10000 10000 10000 10000 10000 10000 10000 10000 10000
842019 Impact of Inflation on Purchasing Power
httpslidepdfcomreaderfullimpact-of-inflation-on-purchasing-power 1934
Figure 5 Changes of real (CPI) exchange rate from 2000 to 2008
170
a n g e R a t e Change (e) Dec-00 Dec-01 Dec-02 Dec-03 Dec-04 Dec-05 Dec-06 Dec-07 Jun-08
United States 10000 10000 10000 10000 10000 10000 10000 10000 10000
United Kingdom 10000 10348 9361 8458 8071 9071 8029 8107 NA
European Union 10000 10412 8854 7313 6885 7902 7221 6543 6120
Brazil 10000 11221 15746 12122 10882 9343 8722 7327 6550
Japan 10000 11750 11025 10130 10069 11965 12336 11988 11675
India 10000 10082 9869 9166 8711 8957 8637 7442 7922China 10000 10085 10408 10477 10412 10348 10162 9155 NA
Canada 10000 10687 10466 8529 8022 7924 7992 6875 7213
Australia 10000 10723 9677 7196 7025 7450 6909 6270 5832
Mexico 10000 9282 10235 10797 10513 10031 10053 10186 9703
Russia 10000 9018 8365 6887 6081 5784 4939 4410 3830
South Africa 10000 15170 10195 7533 6626 7383 8029 7582 8434
Saudi Arabia 10000 10269 10492 10624 10937 11231 11267 11263 10707
842019 Impact of Inflation on Purchasing Power
httpslidepdfcomreaderfullimpact-of-inflation-on-purchasing-power 2034
Figure 6 Wage increase in different countries from 2000 to 2008 (source ref 1 3 to 14)
670
s e
Wage Increase 2000 2001 2002 2003 2004 2005 2006 2007 2008
United States 000 359 479 684 1060 1265 1658 1966 2291
United Kingdom 000 342 724 1125 1624 2055 2554 3033 3209European Union 000 267 531 750 955 1159 1405 1617 NA
Brazil 000 826 1551 1163 1050 1276 1839 5068 5720
Japan 000 -096 -385 -395 -472 -375 -279 -308 -1992
India 000 253 580 967 1379 2387 2929 3688 4123
China 000 1608 3257 4967 7058 9501 12347 NA NA
Canada 000 142 356 497 718 1063 1393 1758 2044
Australia 000 330 692 1087 1422 2021 2577 3073 3158
Mexico 000 1258 2010 2875 3480 4232 5140 -3118 NA
Russia 000 4575 9613 14737 20319 28484 37836 51147 66631
South Africa 000 956 2134 2613 3802 3988 5251 NA NA
842019 Impact of Inflation on Purchasing Power
httpslidepdfcomreaderfullimpact-of-inflation-on-purchasing-power 2134
Figure 7 Relative purchasing power parity from 2000 to 2008 after adjusting for wage
increase
12
13
e
s
Rel PPP adj for
wage 2000 2001 2002 2003 2004 2005 2006 2007 2008
United States 1000 1000 1000 1000 1000 1000 1000 1000 1000
United Kingdom 1000 0997 0966 0941 0916 0889 0885 0858 0000
European Union 1000 1014 0998 0997 1002 0989 0993 0988 NA
Brazil 1000 1014 1049 1170 1255 1261 1239 0989 0979
Japan 1000 1023 1032 1031 1042 1013 1015 1004 1227
India 1000 1033 1030 1034 1036 0977 0993 0985 1008
China 1000 0885 0759 0681 0623 0546 0488 0448 NA
Canada 1000 1013 1018 1026 1029 1002 0999 0977 0962
Australia 1000 1018 1002 0989 0988 0950 0947 0925 0927
Mexico 1000 0946 0926 0899 0905 0873 0862 1940 NA
Russia 1000 0850 0723 0652 0591 0517 0460 0387 0349
South Africa 1000 0984 0959 0976 0907 0911 0883 NA NA
842019 Impact of Inflation on Purchasing Power
httpslidepdfcomreaderfullimpact-of-inflation-on-purchasing-power 2234
Figure 8 Real exchange rate from 2000 to 2008 after adjusting for wage increase
1600
g e s Change e adj for
Wage 2000 2001 2002 2003 2004 2005 2006 2007
United States 10 000 10000 10000 100 00 10 000 1000 0 100 00 10000
United Kingdom 10000 10364 9147 8122 7679 8476 7456 7443
European Union 10000 10505 8804 7255 6929 7938 7327 6673Brazil 10000 10737 14285 11602 10891 9334 8588 5818Japan 10000 12290 12015 11267 11687 14004 14794 14800India 10000 10186 9774 8929 8467 8146 7787 6506China 10000 8999 8226 7479 6751 5978 5302 4260
Canada 10000 10916 10589 8681 8278 8068 8177 6997Australia 10000 10753 9484 6934 6802 6982 6405 5739Mexico 10000 8540 8929 8959 8626 7940 7741 NARussia 10000 6409 4469 2974 2218 1693 1204 863
South Africa 10000 14343 8804 6381 5309 5946 6137 NA
842019 Impact of Inflation on Purchasing Power
httpslidepdfcomreaderfullimpact-of-inflation-on-purchasing-power 2334
Table 1 Market exchange rate from 2000 to 2008
Nominal Exchange Rate (E) Dec-00 Dec-01 Dec-02 Dec-03 Dec-04 Dec-05 Dec-06 Dec-07 Jun-08US Dollar 10 10 10 10 10 10 10 10 10
British Pound 07 07 06 06 05 06 05 05 05Euro 11 11 10 08 07 08 08 07 06
Brazilian Real 20 23 36 29 27 23 21 18 16
Japanese Yen 1140 1310 1190 1070 1030 1180 1190 1111 1064Indian Rupee 468 482 480 455 434 450 444 392 429
Chinese Yuan 83 83 83 83 83 81 79 73 69
Canadian Dollar 15 16 16 13 12 12 12 10 10Australian Dollar 18 20 18 13 13 14 13 11 10
Mexico Peso 96 92 104 112 112 106 108 109 103
Russian Rouble 282 304 319 293 278 288 263 246 235South African Rand 76 120 86 66 57 64 71 69 78
Saudi Arabian Riyal 38 38 38 38 38 38 38 38 38
Table 2 Weekly Wages from 2000 to 2008
Weekly Wage (in US$) 2000 2001 2002 2003 2004 2005 2006 2007 2008United States 5850 6060 6130 6250 6470 6590 6820 7000 7190
United Kingdom 5286 5309 6126 7093 7905 7386 8670 9094 9310
European Union 3635 3567 4310 5327 5825 5239 5909 6725 00
Brazil 983 894 624 740 796 939 1060 1622 1883
Japan 6636 5719 6112 6791 6998 6170 6180 6599 5694
India 144 143 148 162 176 185 196 235 221
China 217 252 287 324 370 432 509 632 00
Canada 4370 4182 4297 5334 5855 6199 6384 7786 7738
Australia 3737 3545 4040 5608 5956 5946 6661 7714 8497
Mexico 771 910 853 849 896 993 1038
Russia 197 266 342 469 606 743 1011 1381 1812
South Africa 1641 1139 1760 2384 3021 2748 2699
Note The EU wage is an average of Germany France Italy and Spain
842019 Impact of Inflation on Purchasing Power
httpslidepdfcomreaderfullimpact-of-inflation-on-purchasing-power 2434
PURCHASING POWER PARITY
The purchasing power parity (PPP) theory uses the long-term equilibrium exchange
rate of two currencies to equalize their purchasing power Developed by Gustav Cassel in1920 it is based on the law of one price the theory states that in ideally efficientmarkets identical goods should have only one price
This purchasing power SEM rate equalizes the purchasing power of different currenciesin their home countries for a given basket of goods Using a PPP basis is arguably moreuseful when comparing differences in living standards on the whole between nations because PPP takes into account the relative cost of living and the inflation rates of different countries rather than just a nominal gross domestic product (GDP) comparisonThe best-known and most-used purchasing power parity exchange rate is the Geary-Khakis dollar (the international dollar)
PPP exchange rates (the real exchange rate) fluctuations are mostly due to marketexchange rates movements Aside from this volatility consistent deviations of the marketand PPP exchange rates are observed for example (market exchange rate) prices of non-traded goods and services are usually lower where incomes are lower (A US dollar exchanged and spent in India will buy more haircuts than a dollar spent in the UnitedStates) PPP takes into account this lower cost of living and adjusts for it as though allincome was spent locally In other words PPP is the amount of a certain basket of basicgoods which can be bought in the given country with the money it produces
There can be marked differences between PPP and market exchange rates [1] For
example the World Banks World Development Indicators 2005 estimated that in 2003one United States dollar was equivalent to about 18 Chinese Yuan by purchasing power parity [2] - considerably different from the nominal exchange rate that put one dollar equalto 76 Yuan This discrepancy has large implications for instance GDP per capita in thePeoples Republic of China is about US$1800 while on a PPP basis it is about US$7204This is frequently used to assert that China is the worlds second-largest economy butsuch a calculation would only be valid under the PPP theory At the other extremeJapans nominal GDP per capita is around US$37600 but its PPP figure is onlyUS$30615
842019 Impact of Inflation on Purchasing Power
httpslidepdfcomreaderfullimpact-of-inflation-on-purchasing-power 2534
First letrsquos look at the situation of domestic buying Gustav Cassel developed the purchasing power parity (PPP) theory in 1920 to compare the purchasing power of different currencies in their home countries based on the assumption that identical goodsshould have the same price (law of one price) PPP exchange rate is defined in Equation1
For
Dom
P
P PPP = (Eq 1)
Where PDom is domestic price and PFor is foreign price
The relative purchasing power parity relates the inflation rate (change of prices) in eachcountry to the change in the market exchange rate and is given in Equation 2
Dom
t
Dom
t
For t
For t
rel
P P
P P PPP
1
1
minus
minus
= (Eq 2)
Where Pt is the price level in period t To calculate the relative purchasing power parityof all of the goods and services consumed in a country we can substitute P t with theconsumer price index (CPI) of that country which leads to Equation 3
Dom
t
Dom
t
For
t
For
t
rel
CPI CPI
CPI CPI PPP
1
1
minus
minus
= (Eq 3)
Figure 1 shows the consumer price indexes of thirteen relatively large countries or economies The inflation rate is higher in the emerging economies than in the developedcountries because of the higher rate of economic growth
Figure 2 shows the changes in relative purchasing power parity of the above economiescalculated by Equation 3 By this calculation one may conclude that the US dollar hasappreciated against the Mexican Indian South African Brazilian and Russian currencies
by 10 to 217 while depreciated against the Australian European Canadian BritishChinese and Saudi Arabian currencies by 1 to 10 from 2000 to 2008 if theconsumptions are domestic This can be attributed to the difference in inflation rate of these countries Japanrsquos disinflation condition between 2000 and 2008 caused the USdollar to weaken approximately 20 over the same time period
842019 Impact of Inflation on Purchasing Power
httpslidepdfcomreaderfullimpact-of-inflation-on-purchasing-power 2634
The International Monetary Fund (IMF) has conducted similar calculation that includesmore factors such as gross domestic product (GDP) The PPP exchange rates published by the IMF are displayed in the following Figure 3 The data shown in Figure 2 areconsistent with the IMF data
It was recognized by many economists that the PPP exchange rate calculation is not perfect because of the difficulties in finding the same baskets of goods to compare acrosscountries The weighing of goods and services in the CPI index is not identical amongdifferent countries Often times the quality of goods and service purchased variesconsiderably for example Americans probably drive better cars and drink cleaner water than many people in developing countries Moreover many social benefits offered bythe welfare countries may not be included in the CPI calculations and this makes directcomparison of purchasing power difficult Nevertheless this methodology gives us arough idea how consumers are doing in different economies
REAL EXCHANGE RATE IN INTERNATIONAL TRADE
When consumers or businesses purchase goods and services from foreign countries theywill need to exchange the available domestic currency to foreign currencies in order tofulfill the trade The price of one currency in terms of another currency is called theexchange rate and it is determined by the currency market and in some cases by
individual governments The exchange rates of twelve foreign currencies to the USdollar from 2000 to 2008 are shown in Table 1 The US dollar depreciated against mostcurrencies in terms of market exchange rate after 2002 except for the Mexican Peso andBrazilian Real (until 2006)
Many people misunderstand the real prices if only the nominal (market) exchange rate isconsidered for the trade For example a three-bedroom apartment in China costs about1500000 Yuan while a similar apartment in the US cost about 400000 Dollar A post-doctorate position in Oxford University in England is paid about 40000 Pound per year
while a similar position in Massachusetts Institute of Technology in the US is paid60000 Dollar per year The market exchange rates do not reflect the real difference of the prices Therefore the real exchange rate which considers both the nominal exchangerate and prices should be used for international trade The real exchange rate is definedin Equation 4
For
Dom
P
P E Rate Exchangeal min Noe Rate Exchangeal Re times= )()( (Eq 4)
842019 Impact of Inflation on Purchasing Power
httpslidepdfcomreaderfullimpact-of-inflation-on-purchasing-power 2734
where PDom is domestic price and PFor is foreign price Using the above two examplesthe real exchange rates would be 18 Chinese apartment = 1 American apartment and075 Oxford salary = 1 MIT salary in 2008
If we substitute prices with CPI indexes in the above equation the real exchange for allthe goods and services can be estimated by Equation 5
For
Dom
CPI
CPI E e times= (Eq 5)
Figure 4 and Figure 5 show the percent changes of nominal exchange rate and real (CPI)exchange rate from 2000 to 2008 and the values are not the same When inflation (price
change) rates are taken into account the dollar actually strengthens against the JapaneseYen and Saudi Arabian Riyal while the advantage over the Peso and the Real (until 2005)diminished The magnitude of depreciation of the US dollar against the British Poundthe Euro the Canadian Dollar and the Chinese Yuan is 2-5 better in the real rate thanin the nominal rate On the other hand the dollar depreciated more against the IndianRupee the South African Rand (after 2002) and the Russian Ruble in the real rate than inthe nominal rate The real rate and the nominal rate for the Australian dollar are verysimilar This analysis indicates that one would make different decisions in buyingforeign goods and services when using the real exchange rate versus the nominalexchange rate
In addition if we compare the data in Figure 2 and Figure 5 it is obvious that the PPPexchange rate fluctuates less dramatically than the foreign exchange rate (except theRussian Ruble) In other words foreign exchange rates affect international trade morethan domestic consumption
WAGE FACTOR
Most consumers except the unemployed and retirees earn wages to make a livingEmployers usually give employees a small wages increase every year to offset inflationFigure 6 shows the percentage of wage increase in different countries The wage increasein the US EU and India is a few percent less than inflation over eight years while thewages in Canada Brazil and Australia outpaced inflation by a few percents in the same period The wage increase in UK Mexico South Africa China and Russia is even faster
842019 Impact of Inflation on Purchasing Power
httpslidepdfcomreaderfullimpact-of-inflation-on-purchasing-power 2834
double to triple digits gain over inflation is observed in these nations Japanrsquos wage isstagnant (or dropping slightly) from 2000 to 2008 It is unclear what exactly causes thesedifferences one may speculate that it may relate to the fiscal condition and account balance of the nations as well as how the governments want to regulate their economyFor example commodity producing countries is benefited from the recent purge of
commodity prices China has a large trade surplus the Japanese prices may have comedown from a very high level from decays ago It will be interested to see how the fastwage increase in some nations would impact their inflation situation in the future
The difference in wage changes certainly would have an impact to consumerrsquos purchasing power If we modify Equation 3 and Equation 5 for calculating relative PPPand real (CPI) exchange rate by a wage factor the following equations will results
For
t
For
t
Dom
t
Dom
t
Dom
t
Dom
t
For
t
For
t
rel
W W
W W
CPI CPI
CPI CPI PPP
1
1
1
1
minus
minus
minus
minus
times= (Eq 6)
For
Dom
For
Dom
W
W
CPI
CPI E e timestimes= (Eq 7)
where W denotes wages Using this modified calculation both domestic and foreign purchasing power will change Figure 7 and Figure 8 shows the relative PPP and realexchange rate after adjusting for wage increase After adjusting for wages the relativePPP become almost the same for the US EU Canada Japan (until 2007) India andBrazil (after 2006) Australia UK South Africa Mexico become the out performerswhich is not the case without adjusting for wages China and Russia demonstrate the bestimprovement in relative PPP because of the large increase of their wages
After adjusting for wages the buying power of Americans in international marketsweakens further relative to most foreign consumers except the Japanese Meanwhile thedepreciation of the US dollar against the Euro is about 5 less than before adjustment(using the 2008 figure) because of the wage advantage for Americans As pointed outearlier there are pitfalls for direct cross-comparison using the CPI index Additionallyother factors such as taxation may complicate the purchasing power calculation For example American income taxes are less than many industrialized countries while poorer nations probably donrsquot tax on income as much
842019 Impact of Inflation on Purchasing Power
httpslidepdfcomreaderfullimpact-of-inflation-on-purchasing-power 2934
Based on the above analysis the emerging economies have made big progress inenhancing the international purchasing power of their citizens thanks to increases of international trade employment and work force productivity Having said that the gap
of incomes between citizens of developed and developing countries are still quite large asshown in the Table 2 Additionally the consequences of environmental damages andincreased energy consumptions in developing countries due to rapid industrialization may be debatable issues
842019 Impact of Inflation on Purchasing Power
httpslidepdfcomreaderfullimpact-of-inflation-on-purchasing-power 3034
Conclusion
Exchange rate pricesinflation and wage level influence the purchasing power of consumers in domestic and international markets The domestic purchasing power ismainly affected by the inflation rate of individual countries and it is relatively equitableacross mature economies The international purchasing power is more volatile and isaffected by both exchange rate and prices Wage changes can further compensate or deprive purchasing power of consumers Analysis of current exchange rates prices andwages leads to the belief that foreign shoppers can get better bargains in Japan and theUS at the present time Consumers in emerging economies especially China and Russiahave experienced significant improvement in purchasing power recently when compared
to themselves They may catch up with the living standard of rich countries in the futureif this growth rate sustains Finally it will be interesting to research the fundamentaleconomic forces which influence the gauges that are measured in the articleWhen prices are rising you can buy less with a given amount of money When hotdogsare expensive a given amount of money will buy a small number of hotdogs But whenhotdogs are inexpensive that is the price is low your given hot dog allowance will purchase a lot more satisfaction There is a relationship between prices and purchasing power that is a reciprocal relationship and thatrsquos the relationship that wersquore going to bestudying in this lesson When prices are going from low prices to high prices that iswhen there is inflation in the economy the value of the dollar is shrinking that is your Purchasing power is going from being able to buy a lot to being able to buy a little Inthis lesson Irsquom going to begin by giving a simple numerical example and then wersquoll talk about how you can use the GDP deflator to show the relationship between the inflationrate and purchasing power
Letrsquos start by assuming that we are in a period of inflation and letrsquos let hotdogs be arepresentative good that is the price of all goods and services across the economy isincreasing at some general rate and wersquore going to look at the price of hotdogs in order toinfer what is happening to purchasing power as prices are rising Wersquore going to befocusing now on the reciprocal relationship between the price level and the purchasing power of the dollar that is what a dollar will buy as the price level is changing And Irsquovewritten out here as clearly as I can the formula that shows this reciprocal relationship thatis one over the price level equals the purchasing power of a dollar Let me make thisvery clear Letrsquos suppose that the price of a hotdog is five cents Well whatrsquos the purchasing power of your dollar Five cents is the same thing as one twentieth of adollar Therefore the reciprocal of one twentieth is twenty Your dollar will buy twentyhotdogs Thatrsquos its purchasing power
842019 Impact of Inflation on Purchasing Power
httpslidepdfcomreaderfullimpact-of-inflation-on-purchasing-power 3134
Now suppose wersquore in a period of inflation so that prices are rising and the price of ahotdog goes up to two dollars Whatrsquos happened to your purchasing power Well your dollar will no longer buy even a whole hotdog Two dollars or 2 has a reciprocal of onehalf that is you can now only afford half a hotdog Your purchasing power has shrunk from twenty hotdogs at a price of five cents a piece to one half a hotdog whenever the
price is two dollars per hotdog This simple example makes clear that the price level andthe purchasing power of the dollar are reciprocals
Now letrsquos look at some examples using the GDP deflator Suppose that wersquore in the year 2000 which is our base year for calculating the GDP deflator and we calculate the priceof a market basket of goods and services- that is a little bit of Housing and a little bit of transportation a little bit of medical care a little bit of clothingetc And wersquore going to call the price level in the year 2000 one hundred because itrsquos our base year
We look at those prices again in 2002 and we find that the price of the goods and
services as a ratio of the same prices in 2000 is equal to 104 That is prices haveincreased by about 4 percent between the year 2000 and 2002 So if we write the GDPdeflator not in the form we usually write it that is multiplied by 100 to get 104 but letrsquoswrite it now as in hundredths 104 to show the 4 percent increase in prices between theyear 2000 and 2002 Well whatrsquos happened to the purchasing power of a dollar betweenthe year 2000 and 2002 That is how much can we afford to buy in 2002 with a dollar if we measure it in the prices of the year 2000 Prices are higher in 2002 therefore thedollar wonrsquot buy as much Well if you takethe reciprocal of the GDP deflator 104 you get 096 Whatrsquos that saying Itrsquos saying thatwhat you could have bought for 96 cents back in the year 2000 now it costs you a dollar to buy in 2002 That is a dollar in 2002 is only worth what 96 cents was worth back inthe year 2000 You can afford to buy less Your purchasing power has shrunk by about 4 percent Your purchasing power shrinks at the same rate that the price level increases because the price level and your purchasing power are reciprocals of each other
Well letrsquos take another example during a period of deflation If we look at the years between 1929 and 1933 wersquoll see falling prices If we choose 1929 as the base year andif we call the price level in that 200000 or 100 if we look at prices in 1933 during thegreat depression we see that the price level has fallen by about 24 percent That is wersquovegone from 100 down to 076 So we now have lower prices in 1933 than we had in 1929
Now what does that mean What is going to happen to the purchasing power of your dollar when prices are lower Itrsquos clearly going to increase Yoursquore going to go from asmall purchasing power to a bigger purchasing power And if you takethe reciprocal of 76 percent you get 132 That is the purchasing power of the dollar hasincreased by about 32 percent in this example Now the reason the numbers donrsquot add upexactly the reason I canrsquot say a 24 percent decrease in prices is equal to a 24 percentincrease in purchasing power is because once your percentages start getting large yourun into this problem that a fifty percent increase is sorry that a 100 percent increase isthe reciprocal of a 50 percent decrease you wind up with this problem that wersquove
842019 Impact of Inflation on Purchasing Power
httpslidepdfcomreaderfullimpact-of-inflation-on-purchasing-power 3234
discussed earlier about the calculation of percentage changes but you can still use thisformula any time it always works One over the price level gives you the purchasing power of the dollar and when the price level is only 76 percent what it was before your purchasing power is going to be 132 percent of what it was before Falling prices give us an increase in the purchasing power of the dollar
842019 Impact of Inflation on Purchasing Power
httpslidepdfcomreaderfullimpact-of-inflation-on-purchasing-power 3334
REFERENCES
1 httpwwwworldsalariesorg
2 International Monetary Fund World Economic Outlook Database September
2006
3 Website of Australian Bureau of Statistics
4 Website of Blanco de Mexico
5 Website of Bank of England
6 Website of Central Bank of Brazil
7 Website of European Central bank
8 Website of International Organization of Labor
9 Website of the Labor Department of India
10 Website of the Ministry of Economics and Planning of Saudi Arabia
11 Website of the Ministry of Finance of the Russian Federation
12 Website of National Bureau of Statistics of China
13 Website of Statistics Bureau of Japan
14 Website of Statistics Canada
15 Website of Statistics South Africa
16 Website of the United States Labor Department
17 Website of Wikipedia on purchasing power parity and consumer price index
842019 Impact of Inflation on Purchasing Power
httpslidepdfcomreaderfullimpact-of-inflation-on-purchasing-power 3434
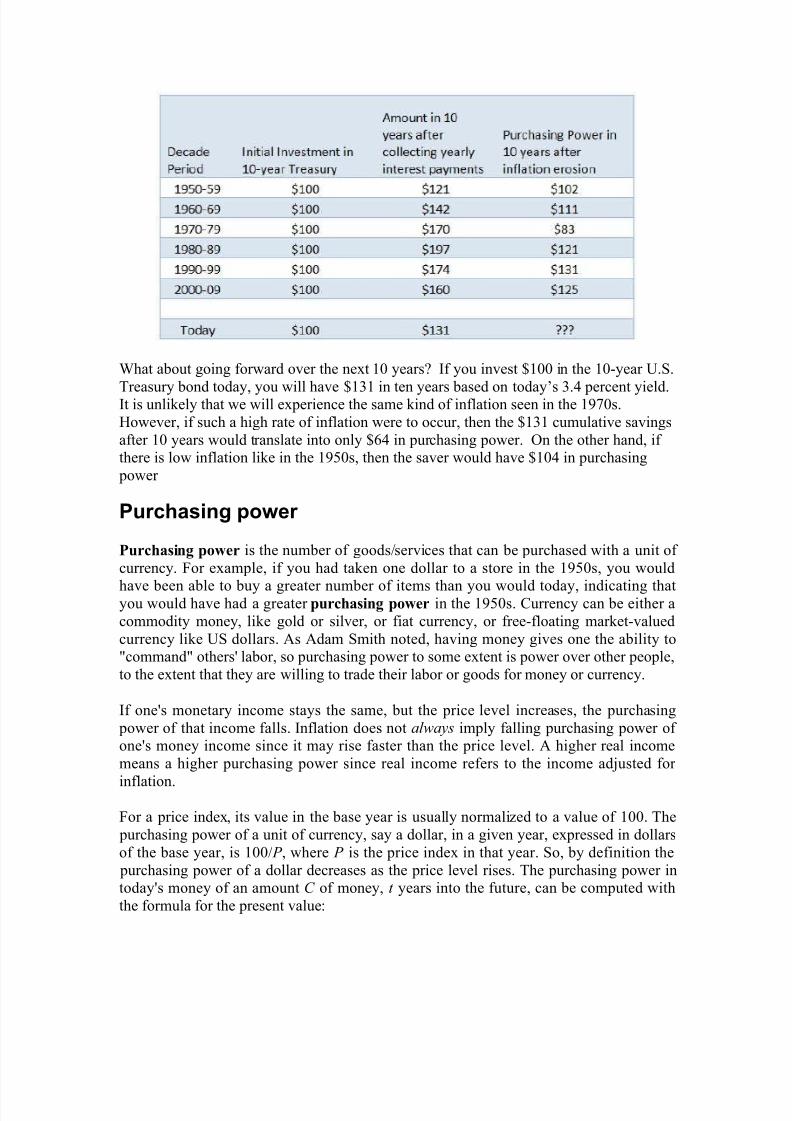
842019 Impact of Inflation on Purchasing Power
httpslidepdfcomreaderfullimpact-of-inflation-on-purchasing-power 734
What about going forward over the next 10 years If you invest $100 in the 10-year US
Treasury bond today you will have $131 in ten years based on todayrsquos 34 percent yieldIt is unlikely that we will experience the same kind of inflation seen in the 1970sHowever if such a high rate of inflation were to occur then the $131 cumulative savingsafter 10 years would translate into only $64 in purchasing power On the other hand if there is low inflation like in the 1950s then the saver would have $104 in purchasing power
Purchasing power
Purchasing power is the number of goodsservices that can be purchased with a unit of currency For example if you had taken one dollar to a store in the 1950s you would
have been able to buy a greater number of items than you would today indicating thatyou would have had a greater purchasing power in the 1950s Currency can be either acommodity money like gold or silver or fiat currency or free-floating market-valuedcurrency like US dollars As Adam Smith noted having money gives one the ability tocommand others labor so purchasing power to some extent is power over other peopleto the extent that they are willing to trade their labor or goods for money or currency
If ones monetary income stays the same but the price level increases the purchasing power of that income falls Inflation does not always imply falling purchasing power of ones money income since it may rise faster than the price level A higher real income means a higher purchasing power since real income refers to the income adjusted for
inflation
For a price index its value in the base year is usually normalized to a value of 100 The purchasing power of a unit of currency say a dollar in a given year expressed in dollarsof the base year is 100 P where P is the price index in that year So by definition the purchasing power of a dollar decreases as the price level rises The purchasing power intodays money of an amount C of money t years into the future can be computed withthe formula for the present value
842019 Impact of Inflation on Purchasing Power
httpslidepdfcomreaderfullimpact-of-inflation-on-purchasing-power 834
Where in this case i is an assumed future annual inflation rate
How Does Inflation Affect The Purchasing Power of Money
Inflation affects how people can spend money Inflation is an economic phenomenon thathas an increasing change in the price of goods and services A closely linked phenomenon to inflation is deflation sometimes called negative inflation Deflationoccurs when there is a decreasing change in the price of goods and services Inflation anddeflation affect how a consumer can buy goods and the value of debt Inflation can occur in wages or prices
Measuring Inflation
Price inflation is typically measured using the consumer price index (CPI) The UnitedStates Bureau of Labor Statistics keeps track of the CPI The CPI takes a constant basketof goods and sees how the price changes from year to year If the price of the basket of goods increases then there is price inflation If the price of the basket of goods decreasesthen there is deflation People measure wage inflation using the employment cost indexThe employment cost index shows how the cost of labor increases or decreases over a period of time
Inflation and Purchasing ProductsPrice inflation decreases peoples ability to pay for goods The concept at a basic levelsays if an employees wages remain steady but the cost of goods increases then theemployee can afford fewer goods As wage inflation occurs people will be able to buymore products A general misconception is that when wages rise prices also rise andaccording to the Federal Reserve Bank of Cleveland there is little support that wageinflations cause price inflation
Inflation and Debt
Price inflation is a debtors best friend and a creditors worst enemy As the pricesincrease the amount borrowed will deteriorate in value so the debtor is paying back lessmoney and the creditor is receiving less money For example a student borrows $100000in 2005 and then inflation occurs over the next couple years Inflation then makes that$100000 comparatively worth only $80000 due to the increase in prices When wagesinflate both the borrowers and the creditors win The borrowers can repay their loansquicker due to higher income The borrowers then should receive loan payments quicker if the borrowers pay back their loans with the increased wages
842019 Impact of Inflation on Purchasing Power
httpslidepdfcomreaderfullimpact-of-inflation-on-purchasing-power 934
Deflation and Purchasing Products
Deflation has the opposite affect of inflation in that consumers will be able to buy more productsas the price for the product decreases Deflation however is not good for the overall economyand can be worse than inflation If a company has costs sunk into production before deflationthese costs will not readjust to the deflation Since the costs remain high to the price of moneythe company will receive less revenue when the product sells at a deflated price As wagesdeflate consumers can buy less with their money because their disposable income is decreased
Deflation and Debt
Deflation and debt has the opposite affect as inflation Debtors will pay back more money than theycomparatively took out and creditors will receive more money As wages deflate people may have a harder time paying off debt which will increase the number of defaults by borrowers
INFLATION
In economics inflation is a rise in the general level of prices of goods and services in aneconomy over a period of time When the general price level rises each unit of currency buys fewer goods and services Consequently inflation also reflects erosion in the purchasing power of money ndash a loss of real value in the internal medium of exchange andunit of account in the economy A chief measure of price inflation is the inflation rate theannualized percentage change in a general price index (normally the Consumer Price Index) over time
Measures of inflation are
Inflation is usually estimated by calculating the inflation rate of a price index usually theConsumer Price Index] The Consumer Price Index measures prices of a selection of goods and services purchased by a typical consumer The inflation rate is the percentage rate of change of a price index over time
For instance in January 2007 the US Consumer Price Index was 202416 and inJanuary 2008 it was 211080 The formula for calculating the annual percentage rateinflation in the CPI over the course of 2007 is
The resulting inflation rate for the CPI in this one year period is 428 meaning thegeneral level of prices for typical US consumers rose by approximately four percentin 2007
Other widely used price indices for calculating price inflation include the following
842019 Impact of Inflation on Purchasing Power
httpslidepdfcomreaderfullimpact-of-inflation-on-purchasing-power 1034
bull Producer price indices (PPIs) which measures average changes in pricesreceived by domestic producers for their output This differs from the CPI in that price subsidization profits and taxes may cause the amount received by the producer to differ from what the consumer paid There is also typically a delay between an increase in the PPI and any eventual increase in the CPI Producer
price index measures the pressure being put on producers by the costs of their raw materials This could be passed on to consumers or it could be absorbed by profits or offset by increasing productivity In India and the United States anearlier version of the PPI was called the Wholesale Price Indexbull Commodity price indices which measure the price of a selection of commodities In the present commodity price indices are weighted by the relativeimportance of the components to the all in cost of an employeebull Core price indices because food and oil prices can change quickly due tochanges in supply and demand conditions in the food and oil markets it can bedifficult to detect the long run trend in price levels when those prices areincluded Therefore most statistical agencies also report a measure of core
inflation which removes the most volatile components (such as food and oil)from a broad price index like the CPI Because core inflation is less affected byshort run supply and demand conditions in specific markets central banks rely onit to better measure the inflationary impact of current monetary policy
Other common measures of inflation are
bull GDP deflator is a measure of the price of all the goods and servicesincluded in gross domestic product (GDP) The US Commerce Department publishes a deflator series for US GDP defined as its nominal GDP measuredivided by its real GDP measurebull
Regional inflation The Bureau of Labor Statistics breaks down CPI-Ucalculations down to different regions of the USbull Historical inflation Before collecting consistent econometric data becamestandard for governments and for the purpose of comparing absolute rather thanrelative standards of living various economists have calculated imputed inflationfigures Most inflation data before the early 20th century is imputed based on theknown costs of goods rather than compiled at the time It is also used to adjustfor the differences in real standard of living for the presence of technologybull Asset price inflation is an undue increase in the prices of real or financialassets such as stock (equity) and real estate While there is no widely acceptedindex of this type some central bankers have suggested that it would be better toaim at stabilizing a wider general price level inflation measure that includes someasset prices instead of stabilizing CPI or core inflation only The reason is that byraising interest rates when stock prices or real estate prices rise and loweringthem when these asset prices fall central banks might be more successful inavoiding bubbles and crashes in asset prices
842019 Impact of Inflation on Purchasing Power
httpslidepdfcomreaderfullimpact-of-inflation-on-purchasing-power 1134
Issues in measuring
Measuring inflation in an economy requires objective means of differentiating changes in
nominal prices on a common set of goods and services and distinguishing them fromthose price shifts resulting from changes in value such as volume quality or performance For example if the price of a 10 oz can of corn changes from $090 to$100 over the course of a year with no change in quality then this price differencerepresents inflation This single price change would not however represent generalinflation in an overall economy To measure overall inflation the price change of a largebasket of representative goods and services is measured This is the purpose of a price index which is the combined price of a basket of many goods and services Thecombined price is the sum of the weighted average prices of items in the basket Aweighted price is calculated by multiplying the unit price of an item to the number of those items the average consumer purchases Weighted pricing is a necessary means to
measuring the impact of individual unit price changes on the economys overall inflationThe Consumer Price Index for example uses data collected by surveying households todetermine what proportion of the typical consumers overall spending is spent on specificgoods and services and weights the average prices of those items accordingly Thoseweighted average prices are combined to calculate the overall price To better relate pricechanges over time indexes typically choose a base year price and assign it a value of 100 Index prices in subsequent years are then expressed in relation to the base year priceWhile comparing inflation measures for various periods one has to take intoconsideration the Base effect (inflation) as well
Inflation measures are often modified over time either for the relative weight of goods in
the basket or in the way in which goods and services from the present are compared withgoods and services from the past Over time adjustments are made to the type of goodsand services selected in order to reflect changes in the sorts of goods and services purchased by typical consumers New products may be introduced older productsdisappear the quality of existing products may change and consumer preferences canshift Both the sorts of goods and services which are included in the basket and theweighted price used in inflation measures will be changed over time in order to keep pacewith the changing marketplace
Inflation numbers are often seasonally adjusted in order to differentiate expected cyclicalcost shifts For example home heating costs are expected to rise in colder months and
seasonal adjustments are often used when measuring for inflation to compensate for cyclical spikes in energy or fuel demand Inflation numbers may be averaged or otherwise subjected to statistical techniques in order to remove statistical noise andvolatility of individual prices
When looking at inflation economic institutions may focus only on certain kinds of prices or special indices such as the core inflation index which is used by central banksto formulate monetary policy Most inflation indices are calculated from weighted
842019 Impact of Inflation on Purchasing Power
httpslidepdfcomreaderfullimpact-of-inflation-on-purchasing-power 1234
averages of selected price changes This necessarily introduces distortion and can lead tolegitimate disputes about what the true inflation rate is This problem can be overcome byincluding all available price changes in the calculation and then choosing the median value
7 most harmful effects of Inflation on different aspects of a developing country like India
Why should we be concerned with the problem of inflation The answer lies in two facts
I Left to itself inflation would move from its initial beneficiary stage to that of a harmfulone For this reason it is necessary to prevent inflation from gaining strength
II A stronger inflation is more difficult to control than a mild one And there is no way to
control a hyperinflation
The beneficial effects of inflation are limited to only its initial phase when the price riseis sufficiently mild During that period there is a favorable impact upon both output andemployment The increase in prices and distributive inequalities are more thancounterbalanced by gains in output and employment
However once inflationary process gathers some strength its ill effects come todominate the scene These have been discussed above and would be only brieflyenumerated here
1 Right from the beginning inflation adds to inequalities of income and wealthHowever in its last phase it is not longer able to do so because money ceases to beanacceptable store of value It is a generally agreed statement that inequalities reduceaggregate social welfare and should be avoided provided in the process productionactivity does not suffer
2 Every economy needs a continuous addition to its productive capacity for which itshould encourage capital formation In a money economy capital formation takes placewhen a part of money income is saved and transferred to the investors who in turn use itfor investment and capital formation However inflation by its very nature discouragessaving activity It makes consumption more attractive than saving
The adverse impact on saving and capital formation is more serious for-anunderdeveloped country because it needs a higher rate of capital accumulation
3 Inflation leads to a shift in the asset preference of wealth holders Their preference for tangible assets may be counterbalanced in the initial phases of inflation by an increase ininterest rate However in later stages of inflation even an upward movement in interestrate fails to neutralize the shift in asset preference
842019 Impact of Inflation on Purchasing Power
httpslidepdfcomreaderfullimpact-of-inflation-on-purchasing-power 1334
4 Inflation leads to balance of payments problems When domestic prices rise faster than prices in foreign countries exports tend to lag behind imports The rate of exchange alsotends to depreciate both on account of falling purchasing power of currency within thecountry and adverse balance of payments In some cases there may also be an outflow of capital A developed country may be able to handle the problem of adverse balance of
payments through structural adjustment but a developing country is not able to do soeasily because they suffer from large institutional and other rigidities
5 Inflation distorts the financial system of the country In its initial stages the system isable to withstand its adverse effect because the financial institutions by their very naturetend to ignore the purchasing power of money and operate with reference to interest ratesand maturity of financial instruments However when inflation gathers strength thefinancial system cannot withstand it and collapses
6 Once inflation crosses its earlier phases strain on the financial system speculationexpectations of further price rise and similar other forces lead to an increase in
unemployment and a fall in output Eventually in the final phase of inflation the outputand employment levels fall to abysmally low levels
7 First Inflation is a hidden tax as it leads to fall in purchasing power of money Ithappens particularly when authorities resort to deficit spending when their tax receiptslag behind and their expenditure does not decrease The taxpayers therefore lose onaccount of reduced purchasing power of their money incomes In other words theauthorities are able to collect resources from the taxpayers without specifically levyingadditional taxes on them Secondly when prices rise the fixed income earners find thatthe purchasing power of their money incomes is falling while the real income of the profit earners is increasing When inflation becomes still stronger the holders of financial
wealth also lose This way inflation is a hidden tax by entrepreneurs on consumers andon recipients of contractual incomes
842019 Impact of Inflation on Purchasing Power
httpslidepdfcomreaderfullimpact-of-inflation-on-purchasing-power 1434
Review of Literature
Figure 1 Consumer price indexes of representative economies from 2000 to 2008
(source ref 3 to16)
650
842019 Impact of Inflation on Purchasing Power
httpslidepdfcomreaderfullimpact-of-inflation-on-purchasing-power 1534
CPI 2000 2001 2002 2003 2004 2005 2006 2007 2008 (May)
United States 1740 1767 1809 1843 1903 1968 2018 2100 2166United Kingdom 937 947 963 973 987 1008 1036 1057 NAEuropean Union 908 926 948 966 989 1011 1031 1062 1082
Brazil 1000 1077 1202 1295 1371 1428 1459 1504 1560
Japan 1022 1015 1006 1003 1003 1000 1003 1003 1017
India 4410 4580 4770 4960 5140 5360 5630 6000 6360China 1004 1011 1003 1015 1055 1074 1090 1167 NA
Canada 970 977 1015 1036 1058 1080 1098 1124 1139
Australia 1313 1354 1395 1428 1465 1506 1555 1601 1622Mexico 932 974 1029 1070 1126 1163 1210 1256 1281
Russia 1000 1214 1406 1598 1773 1997 2190 2388 2709
South Africa 1000 1057 1154 1221 1238 1280 1340 1435 1515Saudi Arabia 989 978 980 986 989 996 1018 1060 1150
Figure 2 Relative purchasing power parity of representative economies from 2000 to
2008
23
842019 Impact of Inflation on Purchasing Power
httpslidepdfcomreaderfullimpact-of-inflation-on-purchasing-power 1634
Rel PPP exchange 2000 2001 2002 2003 2004 2005 2006 2007 2008
United States 1000 1000 1000 1000 1000 1000 1000 1000 1000
United Kingdom 1000 0995 0989 0980 0963 0951 0953 0935 NA
European Union 1000 1005 1004 1005 0996 0985 0979 0969 0958
Brazil 1000 1060 1156 1223 1254 1262 1258 1246 1253
Japan 1000 0978 0947 0927 0897 0865 0846 0813 0799
India 1000 1023 1040 1062 1066 1075 1101 1127 1158
China 1000 0992 0961 0954 0960 0945 0936 0963 NACanada 1000 0992 1006 1008 0997 0984 0976 0960 0943
Australia 1000 1015 1022 1027 1020 1014 1021 1010 0992
Mexico 1000 1028 1061 1083 1104 1103 1119 1116 1104
Russia 1000 1195 1352 1509 1621 1766 1888 1978 2176
South Africa 1000 1041 1110 1153 1132 1132 1155 1189 1217
Saudi Arabia 1000 0974 0953 0941 0914 0890 0888 0888 0934
Figure 3 PPP exchange rate published by the International Monetary Fund (IMF ref 2)
842019 Impact of Inflation on Purchasing Power
httpslidepdfcomreaderfullimpact-of-inflation-on-purchasing-power 1734
16
18
r
Note x100 for Japanese currency
Country 2000 2001 2002 2003 2004 2005 2006 2007
United States 1000 1000 1000 1000 1000 1000 1000 1000
United Kingdom 0645 0645 0654 0662 0663 0659 0661 0669
Germany 0934 0923 0919 0912 0893 0876 0866 0864
Brazil 0867 0909 0985 1111 1172 1211 1231 1270
Japan 1498 1448 1407 1364 1310 1266 1237 1233
India 8473 8570 8630 8803 9006 9235 9593 9989
China 1828 1822 1801 1813 1891 1917 1895 1929
Canada 1218 1203 1193 1207 1215 1221 1206 1211
Australia 1362 1380 1393 1406 1421 1451 1460 1477
Mexico 6195 6411 6737 7171 7501 7696 7792 7964
Russia 6833 7773 8833 9870 11507 13512 15326 16692
South Africa 2110 2219 2413 2476 2569 2633 2707 2808
Saudi Arabia 2678 2526 2554 2649 2864 3250 3534 3698
842019 Impact of Inflation on Purchasing Power
httpslidepdfcomreaderfullimpact-of-inflation-on-purchasing-power 1834
Figure 4 Changes of nominal exchange rate from 2000 to 2008
190
x c h a n g e R a t e
Change (E) Dec-00 Dec-01 Dec-02 Dec-03 Dec-04 Dec-05 Dec-06 Dec-07 Jun-08
US Dollar 10000 10000 10000 10000 10000 10000 10000 10000 10000Pound 10000 10299 9254 8292 7774 8627 7654 7576 7500Euro 10000 10463 8889 7349 6859 7781 7068 6342 5860Real 10000 11897 18205 14821 13641 11795 10974 9128 8205
Yen 10000 11491 10439 9386 9035 10351 10439 9747 9332
Rupee 10000 10310 10267 9733 9283 9626 9507 8388 9176
Yuan 10000 10000 10000 10000 10000 9783 9510 8816 8285
Can $ 10000 10600 10533 8600 8000 7800 7800 6600 6803
Aus $ 10000 10889 9889 7389 7167 7556 7056 6333 5787
Peso 10000 9542 10864 11696 11602 11061 11249 11363 10708
Rouble 10000 10780 11312 10390 9858 10213 9326 8723 8333
Rand 10000 15789 11316 8684 7500 8355 9276 9013 10263
Riyal 10000 10000 10000 10000 10000 10000 10000 10000 10000
842019 Impact of Inflation on Purchasing Power
httpslidepdfcomreaderfullimpact-of-inflation-on-purchasing-power 1934
Figure 5 Changes of real (CPI) exchange rate from 2000 to 2008
170
a n g e R a t e Change (e) Dec-00 Dec-01 Dec-02 Dec-03 Dec-04 Dec-05 Dec-06 Dec-07 Jun-08
United States 10000 10000 10000 10000 10000 10000 10000 10000 10000
United Kingdom 10000 10348 9361 8458 8071 9071 8029 8107 NA
European Union 10000 10412 8854 7313 6885 7902 7221 6543 6120
Brazil 10000 11221 15746 12122 10882 9343 8722 7327 6550
Japan 10000 11750 11025 10130 10069 11965 12336 11988 11675
India 10000 10082 9869 9166 8711 8957 8637 7442 7922China 10000 10085 10408 10477 10412 10348 10162 9155 NA
Canada 10000 10687 10466 8529 8022 7924 7992 6875 7213
Australia 10000 10723 9677 7196 7025 7450 6909 6270 5832
Mexico 10000 9282 10235 10797 10513 10031 10053 10186 9703
Russia 10000 9018 8365 6887 6081 5784 4939 4410 3830
South Africa 10000 15170 10195 7533 6626 7383 8029 7582 8434
Saudi Arabia 10000 10269 10492 10624 10937 11231 11267 11263 10707
842019 Impact of Inflation on Purchasing Power
httpslidepdfcomreaderfullimpact-of-inflation-on-purchasing-power 2034
Figure 6 Wage increase in different countries from 2000 to 2008 (source ref 1 3 to 14)
670
s e
Wage Increase 2000 2001 2002 2003 2004 2005 2006 2007 2008
United States 000 359 479 684 1060 1265 1658 1966 2291
United Kingdom 000 342 724 1125 1624 2055 2554 3033 3209European Union 000 267 531 750 955 1159 1405 1617 NA
Brazil 000 826 1551 1163 1050 1276 1839 5068 5720
Japan 000 -096 -385 -395 -472 -375 -279 -308 -1992
India 000 253 580 967 1379 2387 2929 3688 4123
China 000 1608 3257 4967 7058 9501 12347 NA NA
Canada 000 142 356 497 718 1063 1393 1758 2044
Australia 000 330 692 1087 1422 2021 2577 3073 3158
Mexico 000 1258 2010 2875 3480 4232 5140 -3118 NA
Russia 000 4575 9613 14737 20319 28484 37836 51147 66631
South Africa 000 956 2134 2613 3802 3988 5251 NA NA
842019 Impact of Inflation on Purchasing Power
httpslidepdfcomreaderfullimpact-of-inflation-on-purchasing-power 2134
Figure 7 Relative purchasing power parity from 2000 to 2008 after adjusting for wage
increase
12
13
e
s
Rel PPP adj for
wage 2000 2001 2002 2003 2004 2005 2006 2007 2008
United States 1000 1000 1000 1000 1000 1000 1000 1000 1000
United Kingdom 1000 0997 0966 0941 0916 0889 0885 0858 0000
European Union 1000 1014 0998 0997 1002 0989 0993 0988 NA
Brazil 1000 1014 1049 1170 1255 1261 1239 0989 0979
Japan 1000 1023 1032 1031 1042 1013 1015 1004 1227
India 1000 1033 1030 1034 1036 0977 0993 0985 1008
China 1000 0885 0759 0681 0623 0546 0488 0448 NA
Canada 1000 1013 1018 1026 1029 1002 0999 0977 0962
Australia 1000 1018 1002 0989 0988 0950 0947 0925 0927
Mexico 1000 0946 0926 0899 0905 0873 0862 1940 NA
Russia 1000 0850 0723 0652 0591 0517 0460 0387 0349
South Africa 1000 0984 0959 0976 0907 0911 0883 NA NA
842019 Impact of Inflation on Purchasing Power
httpslidepdfcomreaderfullimpact-of-inflation-on-purchasing-power 2234
Figure 8 Real exchange rate from 2000 to 2008 after adjusting for wage increase
1600
g e s Change e adj for
Wage 2000 2001 2002 2003 2004 2005 2006 2007
United States 10 000 10000 10000 100 00 10 000 1000 0 100 00 10000
United Kingdom 10000 10364 9147 8122 7679 8476 7456 7443
European Union 10000 10505 8804 7255 6929 7938 7327 6673Brazil 10000 10737 14285 11602 10891 9334 8588 5818Japan 10000 12290 12015 11267 11687 14004 14794 14800India 10000 10186 9774 8929 8467 8146 7787 6506China 10000 8999 8226 7479 6751 5978 5302 4260
Canada 10000 10916 10589 8681 8278 8068 8177 6997Australia 10000 10753 9484 6934 6802 6982 6405 5739Mexico 10000 8540 8929 8959 8626 7940 7741 NARussia 10000 6409 4469 2974 2218 1693 1204 863
South Africa 10000 14343 8804 6381 5309 5946 6137 NA
842019 Impact of Inflation on Purchasing Power
httpslidepdfcomreaderfullimpact-of-inflation-on-purchasing-power 2334
Table 1 Market exchange rate from 2000 to 2008
Nominal Exchange Rate (E) Dec-00 Dec-01 Dec-02 Dec-03 Dec-04 Dec-05 Dec-06 Dec-07 Jun-08US Dollar 10 10 10 10 10 10 10 10 10
British Pound 07 07 06 06 05 06 05 05 05Euro 11 11 10 08 07 08 08 07 06
Brazilian Real 20 23 36 29 27 23 21 18 16
Japanese Yen 1140 1310 1190 1070 1030 1180 1190 1111 1064Indian Rupee 468 482 480 455 434 450 444 392 429
Chinese Yuan 83 83 83 83 83 81 79 73 69
Canadian Dollar 15 16 16 13 12 12 12 10 10Australian Dollar 18 20 18 13 13 14 13 11 10
Mexico Peso 96 92 104 112 112 106 108 109 103
Russian Rouble 282 304 319 293 278 288 263 246 235South African Rand 76 120 86 66 57 64 71 69 78
Saudi Arabian Riyal 38 38 38 38 38 38 38 38 38
Table 2 Weekly Wages from 2000 to 2008
Weekly Wage (in US$) 2000 2001 2002 2003 2004 2005 2006 2007 2008United States 5850 6060 6130 6250 6470 6590 6820 7000 7190
United Kingdom 5286 5309 6126 7093 7905 7386 8670 9094 9310
European Union 3635 3567 4310 5327 5825 5239 5909 6725 00
Brazil 983 894 624 740 796 939 1060 1622 1883
Japan 6636 5719 6112 6791 6998 6170 6180 6599 5694
India 144 143 148 162 176 185 196 235 221
China 217 252 287 324 370 432 509 632 00
Canada 4370 4182 4297 5334 5855 6199 6384 7786 7738
Australia 3737 3545 4040 5608 5956 5946 6661 7714 8497
Mexico 771 910 853 849 896 993 1038
Russia 197 266 342 469 606 743 1011 1381 1812
South Africa 1641 1139 1760 2384 3021 2748 2699
Note The EU wage is an average of Germany France Italy and Spain
842019 Impact of Inflation on Purchasing Power
httpslidepdfcomreaderfullimpact-of-inflation-on-purchasing-power 2434
PURCHASING POWER PARITY
The purchasing power parity (PPP) theory uses the long-term equilibrium exchange
rate of two currencies to equalize their purchasing power Developed by Gustav Cassel in1920 it is based on the law of one price the theory states that in ideally efficientmarkets identical goods should have only one price
This purchasing power SEM rate equalizes the purchasing power of different currenciesin their home countries for a given basket of goods Using a PPP basis is arguably moreuseful when comparing differences in living standards on the whole between nations because PPP takes into account the relative cost of living and the inflation rates of different countries rather than just a nominal gross domestic product (GDP) comparisonThe best-known and most-used purchasing power parity exchange rate is the Geary-Khakis dollar (the international dollar)
PPP exchange rates (the real exchange rate) fluctuations are mostly due to marketexchange rates movements Aside from this volatility consistent deviations of the marketand PPP exchange rates are observed for example (market exchange rate) prices of non-traded goods and services are usually lower where incomes are lower (A US dollar exchanged and spent in India will buy more haircuts than a dollar spent in the UnitedStates) PPP takes into account this lower cost of living and adjusts for it as though allincome was spent locally In other words PPP is the amount of a certain basket of basicgoods which can be bought in the given country with the money it produces
There can be marked differences between PPP and market exchange rates [1] For
example the World Banks World Development Indicators 2005 estimated that in 2003one United States dollar was equivalent to about 18 Chinese Yuan by purchasing power parity [2] - considerably different from the nominal exchange rate that put one dollar equalto 76 Yuan This discrepancy has large implications for instance GDP per capita in thePeoples Republic of China is about US$1800 while on a PPP basis it is about US$7204This is frequently used to assert that China is the worlds second-largest economy butsuch a calculation would only be valid under the PPP theory At the other extremeJapans nominal GDP per capita is around US$37600 but its PPP figure is onlyUS$30615
842019 Impact of Inflation on Purchasing Power
httpslidepdfcomreaderfullimpact-of-inflation-on-purchasing-power 2534
First letrsquos look at the situation of domestic buying Gustav Cassel developed the purchasing power parity (PPP) theory in 1920 to compare the purchasing power of different currencies in their home countries based on the assumption that identical goodsshould have the same price (law of one price) PPP exchange rate is defined in Equation1
For
Dom
P
P PPP = (Eq 1)
Where PDom is domestic price and PFor is foreign price
The relative purchasing power parity relates the inflation rate (change of prices) in eachcountry to the change in the market exchange rate and is given in Equation 2
Dom
t
Dom
t
For t
For t
rel
P P
P P PPP
1
1
minus
minus
= (Eq 2)
Where Pt is the price level in period t To calculate the relative purchasing power parityof all of the goods and services consumed in a country we can substitute P t with theconsumer price index (CPI) of that country which leads to Equation 3
Dom
t
Dom
t
For
t
For
t
rel
CPI CPI
CPI CPI PPP
1
1
minus
minus
= (Eq 3)
Figure 1 shows the consumer price indexes of thirteen relatively large countries or economies The inflation rate is higher in the emerging economies than in the developedcountries because of the higher rate of economic growth
Figure 2 shows the changes in relative purchasing power parity of the above economiescalculated by Equation 3 By this calculation one may conclude that the US dollar hasappreciated against the Mexican Indian South African Brazilian and Russian currencies
by 10 to 217 while depreciated against the Australian European Canadian BritishChinese and Saudi Arabian currencies by 1 to 10 from 2000 to 2008 if theconsumptions are domestic This can be attributed to the difference in inflation rate of these countries Japanrsquos disinflation condition between 2000 and 2008 caused the USdollar to weaken approximately 20 over the same time period
842019 Impact of Inflation on Purchasing Power
httpslidepdfcomreaderfullimpact-of-inflation-on-purchasing-power 2634
The International Monetary Fund (IMF) has conducted similar calculation that includesmore factors such as gross domestic product (GDP) The PPP exchange rates published by the IMF are displayed in the following Figure 3 The data shown in Figure 2 areconsistent with the IMF data
It was recognized by many economists that the PPP exchange rate calculation is not perfect because of the difficulties in finding the same baskets of goods to compare acrosscountries The weighing of goods and services in the CPI index is not identical amongdifferent countries Often times the quality of goods and service purchased variesconsiderably for example Americans probably drive better cars and drink cleaner water than many people in developing countries Moreover many social benefits offered bythe welfare countries may not be included in the CPI calculations and this makes directcomparison of purchasing power difficult Nevertheless this methodology gives us arough idea how consumers are doing in different economies
REAL EXCHANGE RATE IN INTERNATIONAL TRADE
When consumers or businesses purchase goods and services from foreign countries theywill need to exchange the available domestic currency to foreign currencies in order tofulfill the trade The price of one currency in terms of another currency is called theexchange rate and it is determined by the currency market and in some cases by
individual governments The exchange rates of twelve foreign currencies to the USdollar from 2000 to 2008 are shown in Table 1 The US dollar depreciated against mostcurrencies in terms of market exchange rate after 2002 except for the Mexican Peso andBrazilian Real (until 2006)
Many people misunderstand the real prices if only the nominal (market) exchange rate isconsidered for the trade For example a three-bedroom apartment in China costs about1500000 Yuan while a similar apartment in the US cost about 400000 Dollar A post-doctorate position in Oxford University in England is paid about 40000 Pound per year
while a similar position in Massachusetts Institute of Technology in the US is paid60000 Dollar per year The market exchange rates do not reflect the real difference of the prices Therefore the real exchange rate which considers both the nominal exchangerate and prices should be used for international trade The real exchange rate is definedin Equation 4
For
Dom
P
P E Rate Exchangeal min Noe Rate Exchangeal Re times= )()( (Eq 4)
842019 Impact of Inflation on Purchasing Power
httpslidepdfcomreaderfullimpact-of-inflation-on-purchasing-power 2734
where PDom is domestic price and PFor is foreign price Using the above two examplesthe real exchange rates would be 18 Chinese apartment = 1 American apartment and075 Oxford salary = 1 MIT salary in 2008
If we substitute prices with CPI indexes in the above equation the real exchange for allthe goods and services can be estimated by Equation 5
For
Dom
CPI
CPI E e times= (Eq 5)
Figure 4 and Figure 5 show the percent changes of nominal exchange rate and real (CPI)exchange rate from 2000 to 2008 and the values are not the same When inflation (price
change) rates are taken into account the dollar actually strengthens against the JapaneseYen and Saudi Arabian Riyal while the advantage over the Peso and the Real (until 2005)diminished The magnitude of depreciation of the US dollar against the British Poundthe Euro the Canadian Dollar and the Chinese Yuan is 2-5 better in the real rate thanin the nominal rate On the other hand the dollar depreciated more against the IndianRupee the South African Rand (after 2002) and the Russian Ruble in the real rate than inthe nominal rate The real rate and the nominal rate for the Australian dollar are verysimilar This analysis indicates that one would make different decisions in buyingforeign goods and services when using the real exchange rate versus the nominalexchange rate
In addition if we compare the data in Figure 2 and Figure 5 it is obvious that the PPPexchange rate fluctuates less dramatically than the foreign exchange rate (except theRussian Ruble) In other words foreign exchange rates affect international trade morethan domestic consumption
WAGE FACTOR
Most consumers except the unemployed and retirees earn wages to make a livingEmployers usually give employees a small wages increase every year to offset inflationFigure 6 shows the percentage of wage increase in different countries The wage increasein the US EU and India is a few percent less than inflation over eight years while thewages in Canada Brazil and Australia outpaced inflation by a few percents in the same period The wage increase in UK Mexico South Africa China and Russia is even faster
842019 Impact of Inflation on Purchasing Power
httpslidepdfcomreaderfullimpact-of-inflation-on-purchasing-power 2834
double to triple digits gain over inflation is observed in these nations Japanrsquos wage isstagnant (or dropping slightly) from 2000 to 2008 It is unclear what exactly causes thesedifferences one may speculate that it may relate to the fiscal condition and account balance of the nations as well as how the governments want to regulate their economyFor example commodity producing countries is benefited from the recent purge of
commodity prices China has a large trade surplus the Japanese prices may have comedown from a very high level from decays ago It will be interested to see how the fastwage increase in some nations would impact their inflation situation in the future
The difference in wage changes certainly would have an impact to consumerrsquos purchasing power If we modify Equation 3 and Equation 5 for calculating relative PPPand real (CPI) exchange rate by a wage factor the following equations will results
For
t
For
t
Dom
t
Dom
t
Dom
t
Dom
t
For
t
For
t
rel
W W
W W
CPI CPI
CPI CPI PPP
1
1
1
1
minus
minus
minus
minus
times= (Eq 6)
For
Dom
For
Dom
W
W
CPI
CPI E e timestimes= (Eq 7)
where W denotes wages Using this modified calculation both domestic and foreign purchasing power will change Figure 7 and Figure 8 shows the relative PPP and realexchange rate after adjusting for wage increase After adjusting for wages the relativePPP become almost the same for the US EU Canada Japan (until 2007) India andBrazil (after 2006) Australia UK South Africa Mexico become the out performerswhich is not the case without adjusting for wages China and Russia demonstrate the bestimprovement in relative PPP because of the large increase of their wages
After adjusting for wages the buying power of Americans in international marketsweakens further relative to most foreign consumers except the Japanese Meanwhile thedepreciation of the US dollar against the Euro is about 5 less than before adjustment(using the 2008 figure) because of the wage advantage for Americans As pointed outearlier there are pitfalls for direct cross-comparison using the CPI index Additionallyother factors such as taxation may complicate the purchasing power calculation For example American income taxes are less than many industrialized countries while poorer nations probably donrsquot tax on income as much
842019 Impact of Inflation on Purchasing Power
httpslidepdfcomreaderfullimpact-of-inflation-on-purchasing-power 2934
Based on the above analysis the emerging economies have made big progress inenhancing the international purchasing power of their citizens thanks to increases of international trade employment and work force productivity Having said that the gap
of incomes between citizens of developed and developing countries are still quite large asshown in the Table 2 Additionally the consequences of environmental damages andincreased energy consumptions in developing countries due to rapid industrialization may be debatable issues
842019 Impact of Inflation on Purchasing Power
httpslidepdfcomreaderfullimpact-of-inflation-on-purchasing-power 3034
Conclusion
Exchange rate pricesinflation and wage level influence the purchasing power of consumers in domestic and international markets The domestic purchasing power ismainly affected by the inflation rate of individual countries and it is relatively equitableacross mature economies The international purchasing power is more volatile and isaffected by both exchange rate and prices Wage changes can further compensate or deprive purchasing power of consumers Analysis of current exchange rates prices andwages leads to the belief that foreign shoppers can get better bargains in Japan and theUS at the present time Consumers in emerging economies especially China and Russiahave experienced significant improvement in purchasing power recently when compared
to themselves They may catch up with the living standard of rich countries in the futureif this growth rate sustains Finally it will be interesting to research the fundamentaleconomic forces which influence the gauges that are measured in the articleWhen prices are rising you can buy less with a given amount of money When hotdogsare expensive a given amount of money will buy a small number of hotdogs But whenhotdogs are inexpensive that is the price is low your given hot dog allowance will purchase a lot more satisfaction There is a relationship between prices and purchasing power that is a reciprocal relationship and thatrsquos the relationship that wersquore going to bestudying in this lesson When prices are going from low prices to high prices that iswhen there is inflation in the economy the value of the dollar is shrinking that is your Purchasing power is going from being able to buy a lot to being able to buy a little Inthis lesson Irsquom going to begin by giving a simple numerical example and then wersquoll talk about how you can use the GDP deflator to show the relationship between the inflationrate and purchasing power
Letrsquos start by assuming that we are in a period of inflation and letrsquos let hotdogs be arepresentative good that is the price of all goods and services across the economy isincreasing at some general rate and wersquore going to look at the price of hotdogs in order toinfer what is happening to purchasing power as prices are rising Wersquore going to befocusing now on the reciprocal relationship between the price level and the purchasing power of the dollar that is what a dollar will buy as the price level is changing And Irsquovewritten out here as clearly as I can the formula that shows this reciprocal relationship thatis one over the price level equals the purchasing power of a dollar Let me make thisvery clear Letrsquos suppose that the price of a hotdog is five cents Well whatrsquos the purchasing power of your dollar Five cents is the same thing as one twentieth of adollar Therefore the reciprocal of one twentieth is twenty Your dollar will buy twentyhotdogs Thatrsquos its purchasing power
842019 Impact of Inflation on Purchasing Power
httpslidepdfcomreaderfullimpact-of-inflation-on-purchasing-power 3134
Now suppose wersquore in a period of inflation so that prices are rising and the price of ahotdog goes up to two dollars Whatrsquos happened to your purchasing power Well your dollar will no longer buy even a whole hotdog Two dollars or 2 has a reciprocal of onehalf that is you can now only afford half a hotdog Your purchasing power has shrunk from twenty hotdogs at a price of five cents a piece to one half a hotdog whenever the
price is two dollars per hotdog This simple example makes clear that the price level andthe purchasing power of the dollar are reciprocals
Now letrsquos look at some examples using the GDP deflator Suppose that wersquore in the year 2000 which is our base year for calculating the GDP deflator and we calculate the priceof a market basket of goods and services- that is a little bit of Housing and a little bit of transportation a little bit of medical care a little bit of clothingetc And wersquore going to call the price level in the year 2000 one hundred because itrsquos our base year
We look at those prices again in 2002 and we find that the price of the goods and
services as a ratio of the same prices in 2000 is equal to 104 That is prices haveincreased by about 4 percent between the year 2000 and 2002 So if we write the GDPdeflator not in the form we usually write it that is multiplied by 100 to get 104 but letrsquoswrite it now as in hundredths 104 to show the 4 percent increase in prices between theyear 2000 and 2002 Well whatrsquos happened to the purchasing power of a dollar betweenthe year 2000 and 2002 That is how much can we afford to buy in 2002 with a dollar if we measure it in the prices of the year 2000 Prices are higher in 2002 therefore thedollar wonrsquot buy as much Well if you takethe reciprocal of the GDP deflator 104 you get 096 Whatrsquos that saying Itrsquos saying thatwhat you could have bought for 96 cents back in the year 2000 now it costs you a dollar to buy in 2002 That is a dollar in 2002 is only worth what 96 cents was worth back inthe year 2000 You can afford to buy less Your purchasing power has shrunk by about 4 percent Your purchasing power shrinks at the same rate that the price level increases because the price level and your purchasing power are reciprocals of each other
Well letrsquos take another example during a period of deflation If we look at the years between 1929 and 1933 wersquoll see falling prices If we choose 1929 as the base year andif we call the price level in that 200000 or 100 if we look at prices in 1933 during thegreat depression we see that the price level has fallen by about 24 percent That is wersquovegone from 100 down to 076 So we now have lower prices in 1933 than we had in 1929
Now what does that mean What is going to happen to the purchasing power of your dollar when prices are lower Itrsquos clearly going to increase Yoursquore going to go from asmall purchasing power to a bigger purchasing power And if you takethe reciprocal of 76 percent you get 132 That is the purchasing power of the dollar hasincreased by about 32 percent in this example Now the reason the numbers donrsquot add upexactly the reason I canrsquot say a 24 percent decrease in prices is equal to a 24 percentincrease in purchasing power is because once your percentages start getting large yourun into this problem that a fifty percent increase is sorry that a 100 percent increase isthe reciprocal of a 50 percent decrease you wind up with this problem that wersquove
842019 Impact of Inflation on Purchasing Power
httpslidepdfcomreaderfullimpact-of-inflation-on-purchasing-power 3234
discussed earlier about the calculation of percentage changes but you can still use thisformula any time it always works One over the price level gives you the purchasing power of the dollar and when the price level is only 76 percent what it was before your purchasing power is going to be 132 percent of what it was before Falling prices give us an increase in the purchasing power of the dollar
842019 Impact of Inflation on Purchasing Power
httpslidepdfcomreaderfullimpact-of-inflation-on-purchasing-power 3334
REFERENCES
1 httpwwwworldsalariesorg
2 International Monetary Fund World Economic Outlook Database September
2006
3 Website of Australian Bureau of Statistics
4 Website of Blanco de Mexico
5 Website of Bank of England
6 Website of Central Bank of Brazil
7 Website of European Central bank
8 Website of International Organization of Labor
9 Website of the Labor Department of India
10 Website of the Ministry of Economics and Planning of Saudi Arabia
11 Website of the Ministry of Finance of the Russian Federation
12 Website of National Bureau of Statistics of China
13 Website of Statistics Bureau of Japan
14 Website of Statistics Canada
15 Website of Statistics South Africa
16 Website of the United States Labor Department
17 Website of Wikipedia on purchasing power parity and consumer price index
842019 Impact of Inflation on Purchasing Power
httpslidepdfcomreaderfullimpact-of-inflation-on-purchasing-power 3434
842019 Impact of Inflation on Purchasing Power
httpslidepdfcomreaderfullimpact-of-inflation-on-purchasing-power 1534
CPI 2000 2001 2002 2003 2004 2005 2006 2007 2008 (May)
United States 1740 1767 1809 1843 1903 1968 2018 2100 2166United Kingdom 937 947 963 973 987 1008 1036 1057 NAEuropean Union 908 926 948 966 989 1011 1031 1062 1082
Brazil 1000 1077 1202 1295 1371 1428 1459 1504 1560
Japan 1022 1015 1006 1003 1003 1000 1003 1003 1017
India 4410 4580 4770 4960 5140 5360 5630 6000 6360China 1004 1011 1003 1015 1055 1074 1090 1167 NA
Canada 970 977 1015 1036 1058 1080 1098 1124 1139
Australia 1313 1354 1395 1428 1465 1506 1555 1601 1622Mexico 932 974 1029 1070 1126 1163 1210 1256 1281
Russia 1000 1214 1406 1598 1773 1997 2190 2388 2709
South Africa 1000 1057 1154 1221 1238 1280 1340 1435 1515Saudi Arabia 989 978 980 986 989 996 1018 1060 1150
Figure 2 Relative purchasing power parity of representative economies from 2000 to
2008
23
842019 Impact of Inflation on Purchasing Power
httpslidepdfcomreaderfullimpact-of-inflation-on-purchasing-power 1634
Rel PPP exchange 2000 2001 2002 2003 2004 2005 2006 2007 2008
United States 1000 1000 1000 1000 1000 1000 1000 1000 1000
United Kingdom 1000 0995 0989 0980 0963 0951 0953 0935 NA
European Union 1000 1005 1004 1005 0996 0985 0979 0969 0958
Brazil 1000 1060 1156 1223 1254 1262 1258 1246 1253
Japan 1000 0978 0947 0927 0897 0865 0846 0813 0799
India 1000 1023 1040 1062 1066 1075 1101 1127 1158
China 1000 0992 0961 0954 0960 0945 0936 0963 NACanada 1000 0992 1006 1008 0997 0984 0976 0960 0943
Australia 1000 1015 1022 1027 1020 1014 1021 1010 0992
Mexico 1000 1028 1061 1083 1104 1103 1119 1116 1104
Russia 1000 1195 1352 1509 1621 1766 1888 1978 2176
South Africa 1000 1041 1110 1153 1132 1132 1155 1189 1217
Saudi Arabia 1000 0974 0953 0941 0914 0890 0888 0888 0934
Figure 3 PPP exchange rate published by the International Monetary Fund (IMF ref 2)
842019 Impact of Inflation on Purchasing Power
httpslidepdfcomreaderfullimpact-of-inflation-on-purchasing-power 1734
16
18
r
Note x100 for Japanese currency
Country 2000 2001 2002 2003 2004 2005 2006 2007
United States 1000 1000 1000 1000 1000 1000 1000 1000
United Kingdom 0645 0645 0654 0662 0663 0659 0661 0669
Germany 0934 0923 0919 0912 0893 0876 0866 0864
Brazil 0867 0909 0985 1111 1172 1211 1231 1270
Japan 1498 1448 1407 1364 1310 1266 1237 1233
India 8473 8570 8630 8803 9006 9235 9593 9989
China 1828 1822 1801 1813 1891 1917 1895 1929
Canada 1218 1203 1193 1207 1215 1221 1206 1211
Australia 1362 1380 1393 1406 1421 1451 1460 1477
Mexico 6195 6411 6737 7171 7501 7696 7792 7964
Russia 6833 7773 8833 9870 11507 13512 15326 16692
South Africa 2110 2219 2413 2476 2569 2633 2707 2808
Saudi Arabia 2678 2526 2554 2649 2864 3250 3534 3698
842019 Impact of Inflation on Purchasing Power
httpslidepdfcomreaderfullimpact-of-inflation-on-purchasing-power 1834
Figure 4 Changes of nominal exchange rate from 2000 to 2008
190
x c h a n g e R a t e
Change (E) Dec-00 Dec-01 Dec-02 Dec-03 Dec-04 Dec-05 Dec-06 Dec-07 Jun-08
US Dollar 10000 10000 10000 10000 10000 10000 10000 10000 10000Pound 10000 10299 9254 8292 7774 8627 7654 7576 7500Euro 10000 10463 8889 7349 6859 7781 7068 6342 5860Real 10000 11897 18205 14821 13641 11795 10974 9128 8205
Yen 10000 11491 10439 9386 9035 10351 10439 9747 9332
Rupee 10000 10310 10267 9733 9283 9626 9507 8388 9176
Yuan 10000 10000 10000 10000 10000 9783 9510 8816 8285
Can $ 10000 10600 10533 8600 8000 7800 7800 6600 6803
Aus $ 10000 10889 9889 7389 7167 7556 7056 6333 5787
Peso 10000 9542 10864 11696 11602 11061 11249 11363 10708
Rouble 10000 10780 11312 10390 9858 10213 9326 8723 8333
Rand 10000 15789 11316 8684 7500 8355 9276 9013 10263
Riyal 10000 10000 10000 10000 10000 10000 10000 10000 10000
842019 Impact of Inflation on Purchasing Power
httpslidepdfcomreaderfullimpact-of-inflation-on-purchasing-power 1934
Figure 5 Changes of real (CPI) exchange rate from 2000 to 2008
170
a n g e R a t e Change (e) Dec-00 Dec-01 Dec-02 Dec-03 Dec-04 Dec-05 Dec-06 Dec-07 Jun-08
United States 10000 10000 10000 10000 10000 10000 10000 10000 10000
United Kingdom 10000 10348 9361 8458 8071 9071 8029 8107 NA
European Union 10000 10412 8854 7313 6885 7902 7221 6543 6120
Brazil 10000 11221 15746 12122 10882 9343 8722 7327 6550
Japan 10000 11750 11025 10130 10069 11965 12336 11988 11675
India 10000 10082 9869 9166 8711 8957 8637 7442 7922China 10000 10085 10408 10477 10412 10348 10162 9155 NA
Canada 10000 10687 10466 8529 8022 7924 7992 6875 7213
Australia 10000 10723 9677 7196 7025 7450 6909 6270 5832
Mexico 10000 9282 10235 10797 10513 10031 10053 10186 9703
Russia 10000 9018 8365 6887 6081 5784 4939 4410 3830
South Africa 10000 15170 10195 7533 6626 7383 8029 7582 8434
Saudi Arabia 10000 10269 10492 10624 10937 11231 11267 11263 10707
842019 Impact of Inflation on Purchasing Power
httpslidepdfcomreaderfullimpact-of-inflation-on-purchasing-power 2034
Figure 6 Wage increase in different countries from 2000 to 2008 (source ref 1 3 to 14)
670
s e
Wage Increase 2000 2001 2002 2003 2004 2005 2006 2007 2008
United States 000 359 479 684 1060 1265 1658 1966 2291
United Kingdom 000 342 724 1125 1624 2055 2554 3033 3209European Union 000 267 531 750 955 1159 1405 1617 NA
Brazil 000 826 1551 1163 1050 1276 1839 5068 5720
Japan 000 -096 -385 -395 -472 -375 -279 -308 -1992
India 000 253 580 967 1379 2387 2929 3688 4123
China 000 1608 3257 4967 7058 9501 12347 NA NA
Canada 000 142 356 497 718 1063 1393 1758 2044
Australia 000 330 692 1087 1422 2021 2577 3073 3158
Mexico 000 1258 2010 2875 3480 4232 5140 -3118 NA
Russia 000 4575 9613 14737 20319 28484 37836 51147 66631
South Africa 000 956 2134 2613 3802 3988 5251 NA NA
842019 Impact of Inflation on Purchasing Power
httpslidepdfcomreaderfullimpact-of-inflation-on-purchasing-power 2134
Figure 7 Relative purchasing power parity from 2000 to 2008 after adjusting for wage
increase
12
13
e
s
Rel PPP adj for
wage 2000 2001 2002 2003 2004 2005 2006 2007 2008
United States 1000 1000 1000 1000 1000 1000 1000 1000 1000
United Kingdom 1000 0997 0966 0941 0916 0889 0885 0858 0000
European Union 1000 1014 0998 0997 1002 0989 0993 0988 NA
Brazil 1000 1014 1049 1170 1255 1261 1239 0989 0979
Japan 1000 1023 1032 1031 1042 1013 1015 1004 1227
India 1000 1033 1030 1034 1036 0977 0993 0985 1008
China 1000 0885 0759 0681 0623 0546 0488 0448 NA
Canada 1000 1013 1018 1026 1029 1002 0999 0977 0962
Australia 1000 1018 1002 0989 0988 0950 0947 0925 0927
Mexico 1000 0946 0926 0899 0905 0873 0862 1940 NA
Russia 1000 0850 0723 0652 0591 0517 0460 0387 0349
South Africa 1000 0984 0959 0976 0907 0911 0883 NA NA
842019 Impact of Inflation on Purchasing Power
httpslidepdfcomreaderfullimpact-of-inflation-on-purchasing-power 2234
Figure 8 Real exchange rate from 2000 to 2008 after adjusting for wage increase
1600
g e s Change e adj for
Wage 2000 2001 2002 2003 2004 2005 2006 2007
United States 10 000 10000 10000 100 00 10 000 1000 0 100 00 10000
United Kingdom 10000 10364 9147 8122 7679 8476 7456 7443
European Union 10000 10505 8804 7255 6929 7938 7327 6673Brazil 10000 10737 14285 11602 10891 9334 8588 5818Japan 10000 12290 12015 11267 11687 14004 14794 14800India 10000 10186 9774 8929 8467 8146 7787 6506China 10000 8999 8226 7479 6751 5978 5302 4260
Canada 10000 10916 10589 8681 8278 8068 8177 6997Australia 10000 10753 9484 6934 6802 6982 6405 5739Mexico 10000 8540 8929 8959 8626 7940 7741 NARussia 10000 6409 4469 2974 2218 1693 1204 863
South Africa 10000 14343 8804 6381 5309 5946 6137 NA
842019 Impact of Inflation on Purchasing Power
httpslidepdfcomreaderfullimpact-of-inflation-on-purchasing-power 2334
Table 1 Market exchange rate from 2000 to 2008
Nominal Exchange Rate (E) Dec-00 Dec-01 Dec-02 Dec-03 Dec-04 Dec-05 Dec-06 Dec-07 Jun-08US Dollar 10 10 10 10 10 10 10 10 10
British Pound 07 07 06 06 05 06 05 05 05Euro 11 11 10 08 07 08 08 07 06
Brazilian Real 20 23 36 29 27 23 21 18 16
Japanese Yen 1140 1310 1190 1070 1030 1180 1190 1111 1064Indian Rupee 468 482 480 455 434 450 444 392 429
Chinese Yuan 83 83 83 83 83 81 79 73 69
Canadian Dollar 15 16 16 13 12 12 12 10 10Australian Dollar 18 20 18 13 13 14 13 11 10
Mexico Peso 96 92 104 112 112 106 108 109 103
Russian Rouble 282 304 319 293 278 288 263 246 235South African Rand 76 120 86 66 57 64 71 69 78
Saudi Arabian Riyal 38 38 38 38 38 38 38 38 38
Table 2 Weekly Wages from 2000 to 2008
Weekly Wage (in US$) 2000 2001 2002 2003 2004 2005 2006 2007 2008United States 5850 6060 6130 6250 6470 6590 6820 7000 7190
United Kingdom 5286 5309 6126 7093 7905 7386 8670 9094 9310
European Union 3635 3567 4310 5327 5825 5239 5909 6725 00
Brazil 983 894 624 740 796 939 1060 1622 1883
Japan 6636 5719 6112 6791 6998 6170 6180 6599 5694
India 144 143 148 162 176 185 196 235 221
China 217 252 287 324 370 432 509 632 00
Canada 4370 4182 4297 5334 5855 6199 6384 7786 7738
Australia 3737 3545 4040 5608 5956 5946 6661 7714 8497
Mexico 771 910 853 849 896 993 1038
Russia 197 266 342 469 606 743 1011 1381 1812
South Africa 1641 1139 1760 2384 3021 2748 2699
Note The EU wage is an average of Germany France Italy and Spain
842019 Impact of Inflation on Purchasing Power
httpslidepdfcomreaderfullimpact-of-inflation-on-purchasing-power 2434
PURCHASING POWER PARITY
The purchasing power parity (PPP) theory uses the long-term equilibrium exchange
rate of two currencies to equalize their purchasing power Developed by Gustav Cassel in1920 it is based on the law of one price the theory states that in ideally efficientmarkets identical goods should have only one price
This purchasing power SEM rate equalizes the purchasing power of different currenciesin their home countries for a given basket of goods Using a PPP basis is arguably moreuseful when comparing differences in living standards on the whole between nations because PPP takes into account the relative cost of living and the inflation rates of different countries rather than just a nominal gross domestic product (GDP) comparisonThe best-known and most-used purchasing power parity exchange rate is the Geary-Khakis dollar (the international dollar)
PPP exchange rates (the real exchange rate) fluctuations are mostly due to marketexchange rates movements Aside from this volatility consistent deviations of the marketand PPP exchange rates are observed for example (market exchange rate) prices of non-traded goods and services are usually lower where incomes are lower (A US dollar exchanged and spent in India will buy more haircuts than a dollar spent in the UnitedStates) PPP takes into account this lower cost of living and adjusts for it as though allincome was spent locally In other words PPP is the amount of a certain basket of basicgoods which can be bought in the given country with the money it produces
There can be marked differences between PPP and market exchange rates [1] For
example the World Banks World Development Indicators 2005 estimated that in 2003one United States dollar was equivalent to about 18 Chinese Yuan by purchasing power parity [2] - considerably different from the nominal exchange rate that put one dollar equalto 76 Yuan This discrepancy has large implications for instance GDP per capita in thePeoples Republic of China is about US$1800 while on a PPP basis it is about US$7204This is frequently used to assert that China is the worlds second-largest economy butsuch a calculation would only be valid under the PPP theory At the other extremeJapans nominal GDP per capita is around US$37600 but its PPP figure is onlyUS$30615
842019 Impact of Inflation on Purchasing Power
httpslidepdfcomreaderfullimpact-of-inflation-on-purchasing-power 2534
First letrsquos look at the situation of domestic buying Gustav Cassel developed the purchasing power parity (PPP) theory in 1920 to compare the purchasing power of different currencies in their home countries based on the assumption that identical goodsshould have the same price (law of one price) PPP exchange rate is defined in Equation1
For
Dom
P
P PPP = (Eq 1)
Where PDom is domestic price and PFor is foreign price
The relative purchasing power parity relates the inflation rate (change of prices) in eachcountry to the change in the market exchange rate and is given in Equation 2
Dom
t
Dom
t
For t
For t
rel
P P
P P PPP
1
1
minus
minus
= (Eq 2)
Where Pt is the price level in period t To calculate the relative purchasing power parityof all of the goods and services consumed in a country we can substitute P t with theconsumer price index (CPI) of that country which leads to Equation 3
Dom
t
Dom
t
For
t
For
t
rel
CPI CPI
CPI CPI PPP
1
1
minus
minus
= (Eq 3)
Figure 1 shows the consumer price indexes of thirteen relatively large countries or economies The inflation rate is higher in the emerging economies than in the developedcountries because of the higher rate of economic growth
Figure 2 shows the changes in relative purchasing power parity of the above economiescalculated by Equation 3 By this calculation one may conclude that the US dollar hasappreciated against the Mexican Indian South African Brazilian and Russian currencies
by 10 to 217 while depreciated against the Australian European Canadian BritishChinese and Saudi Arabian currencies by 1 to 10 from 2000 to 2008 if theconsumptions are domestic This can be attributed to the difference in inflation rate of these countries Japanrsquos disinflation condition between 2000 and 2008 caused the USdollar to weaken approximately 20 over the same time period
842019 Impact of Inflation on Purchasing Power
httpslidepdfcomreaderfullimpact-of-inflation-on-purchasing-power 2634
The International Monetary Fund (IMF) has conducted similar calculation that includesmore factors such as gross domestic product (GDP) The PPP exchange rates published by the IMF are displayed in the following Figure 3 The data shown in Figure 2 areconsistent with the IMF data
It was recognized by many economists that the PPP exchange rate calculation is not perfect because of the difficulties in finding the same baskets of goods to compare acrosscountries The weighing of goods and services in the CPI index is not identical amongdifferent countries Often times the quality of goods and service purchased variesconsiderably for example Americans probably drive better cars and drink cleaner water than many people in developing countries Moreover many social benefits offered bythe welfare countries may not be included in the CPI calculations and this makes directcomparison of purchasing power difficult Nevertheless this methodology gives us arough idea how consumers are doing in different economies
REAL EXCHANGE RATE IN INTERNATIONAL TRADE
When consumers or businesses purchase goods and services from foreign countries theywill need to exchange the available domestic currency to foreign currencies in order tofulfill the trade The price of one currency in terms of another currency is called theexchange rate and it is determined by the currency market and in some cases by
individual governments The exchange rates of twelve foreign currencies to the USdollar from 2000 to 2008 are shown in Table 1 The US dollar depreciated against mostcurrencies in terms of market exchange rate after 2002 except for the Mexican Peso andBrazilian Real (until 2006)
Many people misunderstand the real prices if only the nominal (market) exchange rate isconsidered for the trade For example a three-bedroom apartment in China costs about1500000 Yuan while a similar apartment in the US cost about 400000 Dollar A post-doctorate position in Oxford University in England is paid about 40000 Pound per year
while a similar position in Massachusetts Institute of Technology in the US is paid60000 Dollar per year The market exchange rates do not reflect the real difference of the prices Therefore the real exchange rate which considers both the nominal exchangerate and prices should be used for international trade The real exchange rate is definedin Equation 4
For
Dom
P
P E Rate Exchangeal min Noe Rate Exchangeal Re times= )()( (Eq 4)
842019 Impact of Inflation on Purchasing Power
httpslidepdfcomreaderfullimpact-of-inflation-on-purchasing-power 2734
where PDom is domestic price and PFor is foreign price Using the above two examplesthe real exchange rates would be 18 Chinese apartment = 1 American apartment and075 Oxford salary = 1 MIT salary in 2008
If we substitute prices with CPI indexes in the above equation the real exchange for allthe goods and services can be estimated by Equation 5
For
Dom
CPI
CPI E e times= (Eq 5)
Figure 4 and Figure 5 show the percent changes of nominal exchange rate and real (CPI)exchange rate from 2000 to 2008 and the values are not the same When inflation (price
change) rates are taken into account the dollar actually strengthens against the JapaneseYen and Saudi Arabian Riyal while the advantage over the Peso and the Real (until 2005)diminished The magnitude of depreciation of the US dollar against the British Poundthe Euro the Canadian Dollar and the Chinese Yuan is 2-5 better in the real rate thanin the nominal rate On the other hand the dollar depreciated more against the IndianRupee the South African Rand (after 2002) and the Russian Ruble in the real rate than inthe nominal rate The real rate and the nominal rate for the Australian dollar are verysimilar This analysis indicates that one would make different decisions in buyingforeign goods and services when using the real exchange rate versus the nominalexchange rate
In addition if we compare the data in Figure 2 and Figure 5 it is obvious that the PPPexchange rate fluctuates less dramatically than the foreign exchange rate (except theRussian Ruble) In other words foreign exchange rates affect international trade morethan domestic consumption
WAGE FACTOR
Most consumers except the unemployed and retirees earn wages to make a livingEmployers usually give employees a small wages increase every year to offset inflationFigure 6 shows the percentage of wage increase in different countries The wage increasein the US EU and India is a few percent less than inflation over eight years while thewages in Canada Brazil and Australia outpaced inflation by a few percents in the same period The wage increase in UK Mexico South Africa China and Russia is even faster
842019 Impact of Inflation on Purchasing Power
httpslidepdfcomreaderfullimpact-of-inflation-on-purchasing-power 2834
double to triple digits gain over inflation is observed in these nations Japanrsquos wage isstagnant (or dropping slightly) from 2000 to 2008 It is unclear what exactly causes thesedifferences one may speculate that it may relate to the fiscal condition and account balance of the nations as well as how the governments want to regulate their economyFor example commodity producing countries is benefited from the recent purge of
commodity prices China has a large trade surplus the Japanese prices may have comedown from a very high level from decays ago It will be interested to see how the fastwage increase in some nations would impact their inflation situation in the future
The difference in wage changes certainly would have an impact to consumerrsquos purchasing power If we modify Equation 3 and Equation 5 for calculating relative PPPand real (CPI) exchange rate by a wage factor the following equations will results
For
t
For
t
Dom
t
Dom
t
Dom
t
Dom
t
For
t
For
t
rel
W W
W W
CPI CPI
CPI CPI PPP
1
1
1
1
minus
minus
minus
minus
times= (Eq 6)
For
Dom
For
Dom
W
W
CPI
CPI E e timestimes= (Eq 7)
where W denotes wages Using this modified calculation both domestic and foreign purchasing power will change Figure 7 and Figure 8 shows the relative PPP and realexchange rate after adjusting for wage increase After adjusting for wages the relativePPP become almost the same for the US EU Canada Japan (until 2007) India andBrazil (after 2006) Australia UK South Africa Mexico become the out performerswhich is not the case without adjusting for wages China and Russia demonstrate the bestimprovement in relative PPP because of the large increase of their wages
After adjusting for wages the buying power of Americans in international marketsweakens further relative to most foreign consumers except the Japanese Meanwhile thedepreciation of the US dollar against the Euro is about 5 less than before adjustment(using the 2008 figure) because of the wage advantage for Americans As pointed outearlier there are pitfalls for direct cross-comparison using the CPI index Additionallyother factors such as taxation may complicate the purchasing power calculation For example American income taxes are less than many industrialized countries while poorer nations probably donrsquot tax on income as much
842019 Impact of Inflation on Purchasing Power
httpslidepdfcomreaderfullimpact-of-inflation-on-purchasing-power 2934
Based on the above analysis the emerging economies have made big progress inenhancing the international purchasing power of their citizens thanks to increases of international trade employment and work force productivity Having said that the gap
of incomes between citizens of developed and developing countries are still quite large asshown in the Table 2 Additionally the consequences of environmental damages andincreased energy consumptions in developing countries due to rapid industrialization may be debatable issues
842019 Impact of Inflation on Purchasing Power
httpslidepdfcomreaderfullimpact-of-inflation-on-purchasing-power 3034
Conclusion
Exchange rate pricesinflation and wage level influence the purchasing power of consumers in domestic and international markets The domestic purchasing power ismainly affected by the inflation rate of individual countries and it is relatively equitableacross mature economies The international purchasing power is more volatile and isaffected by both exchange rate and prices Wage changes can further compensate or deprive purchasing power of consumers Analysis of current exchange rates prices andwages leads to the belief that foreign shoppers can get better bargains in Japan and theUS at the present time Consumers in emerging economies especially China and Russiahave experienced significant improvement in purchasing power recently when compared
to themselves They may catch up with the living standard of rich countries in the futureif this growth rate sustains Finally it will be interesting to research the fundamentaleconomic forces which influence the gauges that are measured in the articleWhen prices are rising you can buy less with a given amount of money When hotdogsare expensive a given amount of money will buy a small number of hotdogs But whenhotdogs are inexpensive that is the price is low your given hot dog allowance will purchase a lot more satisfaction There is a relationship between prices and purchasing power that is a reciprocal relationship and thatrsquos the relationship that wersquore going to bestudying in this lesson When prices are going from low prices to high prices that iswhen there is inflation in the economy the value of the dollar is shrinking that is your Purchasing power is going from being able to buy a lot to being able to buy a little Inthis lesson Irsquom going to begin by giving a simple numerical example and then wersquoll talk about how you can use the GDP deflator to show the relationship between the inflationrate and purchasing power
Letrsquos start by assuming that we are in a period of inflation and letrsquos let hotdogs be arepresentative good that is the price of all goods and services across the economy isincreasing at some general rate and wersquore going to look at the price of hotdogs in order toinfer what is happening to purchasing power as prices are rising Wersquore going to befocusing now on the reciprocal relationship between the price level and the purchasing power of the dollar that is what a dollar will buy as the price level is changing And Irsquovewritten out here as clearly as I can the formula that shows this reciprocal relationship thatis one over the price level equals the purchasing power of a dollar Let me make thisvery clear Letrsquos suppose that the price of a hotdog is five cents Well whatrsquos the purchasing power of your dollar Five cents is the same thing as one twentieth of adollar Therefore the reciprocal of one twentieth is twenty Your dollar will buy twentyhotdogs Thatrsquos its purchasing power
842019 Impact of Inflation on Purchasing Power
httpslidepdfcomreaderfullimpact-of-inflation-on-purchasing-power 3134
Now suppose wersquore in a period of inflation so that prices are rising and the price of ahotdog goes up to two dollars Whatrsquos happened to your purchasing power Well your dollar will no longer buy even a whole hotdog Two dollars or 2 has a reciprocal of onehalf that is you can now only afford half a hotdog Your purchasing power has shrunk from twenty hotdogs at a price of five cents a piece to one half a hotdog whenever the
price is two dollars per hotdog This simple example makes clear that the price level andthe purchasing power of the dollar are reciprocals
Now letrsquos look at some examples using the GDP deflator Suppose that wersquore in the year 2000 which is our base year for calculating the GDP deflator and we calculate the priceof a market basket of goods and services- that is a little bit of Housing and a little bit of transportation a little bit of medical care a little bit of clothingetc And wersquore going to call the price level in the year 2000 one hundred because itrsquos our base year
We look at those prices again in 2002 and we find that the price of the goods and
services as a ratio of the same prices in 2000 is equal to 104 That is prices haveincreased by about 4 percent between the year 2000 and 2002 So if we write the GDPdeflator not in the form we usually write it that is multiplied by 100 to get 104 but letrsquoswrite it now as in hundredths 104 to show the 4 percent increase in prices between theyear 2000 and 2002 Well whatrsquos happened to the purchasing power of a dollar betweenthe year 2000 and 2002 That is how much can we afford to buy in 2002 with a dollar if we measure it in the prices of the year 2000 Prices are higher in 2002 therefore thedollar wonrsquot buy as much Well if you takethe reciprocal of the GDP deflator 104 you get 096 Whatrsquos that saying Itrsquos saying thatwhat you could have bought for 96 cents back in the year 2000 now it costs you a dollar to buy in 2002 That is a dollar in 2002 is only worth what 96 cents was worth back inthe year 2000 You can afford to buy less Your purchasing power has shrunk by about 4 percent Your purchasing power shrinks at the same rate that the price level increases because the price level and your purchasing power are reciprocals of each other
Well letrsquos take another example during a period of deflation If we look at the years between 1929 and 1933 wersquoll see falling prices If we choose 1929 as the base year andif we call the price level in that 200000 or 100 if we look at prices in 1933 during thegreat depression we see that the price level has fallen by about 24 percent That is wersquovegone from 100 down to 076 So we now have lower prices in 1933 than we had in 1929
Now what does that mean What is going to happen to the purchasing power of your dollar when prices are lower Itrsquos clearly going to increase Yoursquore going to go from asmall purchasing power to a bigger purchasing power And if you takethe reciprocal of 76 percent you get 132 That is the purchasing power of the dollar hasincreased by about 32 percent in this example Now the reason the numbers donrsquot add upexactly the reason I canrsquot say a 24 percent decrease in prices is equal to a 24 percentincrease in purchasing power is because once your percentages start getting large yourun into this problem that a fifty percent increase is sorry that a 100 percent increase isthe reciprocal of a 50 percent decrease you wind up with this problem that wersquove
842019 Impact of Inflation on Purchasing Power
httpslidepdfcomreaderfullimpact-of-inflation-on-purchasing-power 3234
discussed earlier about the calculation of percentage changes but you can still use thisformula any time it always works One over the price level gives you the purchasing power of the dollar and when the price level is only 76 percent what it was before your purchasing power is going to be 132 percent of what it was before Falling prices give us an increase in the purchasing power of the dollar
842019 Impact of Inflation on Purchasing Power
httpslidepdfcomreaderfullimpact-of-inflation-on-purchasing-power 3334
REFERENCES
1 httpwwwworldsalariesorg
2 International Monetary Fund World Economic Outlook Database September
2006
3 Website of Australian Bureau of Statistics
4 Website of Blanco de Mexico
5 Website of Bank of England
6 Website of Central Bank of Brazil
7 Website of European Central bank
8 Website of International Organization of Labor
9 Website of the Labor Department of India
10 Website of the Ministry of Economics and Planning of Saudi Arabia
11 Website of the Ministry of Finance of the Russian Federation
12 Website of National Bureau of Statistics of China
13 Website of Statistics Bureau of Japan
14 Website of Statistics Canada
15 Website of Statistics South Africa
16 Website of the United States Labor Department
17 Website of Wikipedia on purchasing power parity and consumer price index
842019 Impact of Inflation on Purchasing Power
httpslidepdfcomreaderfullimpact-of-inflation-on-purchasing-power 3434
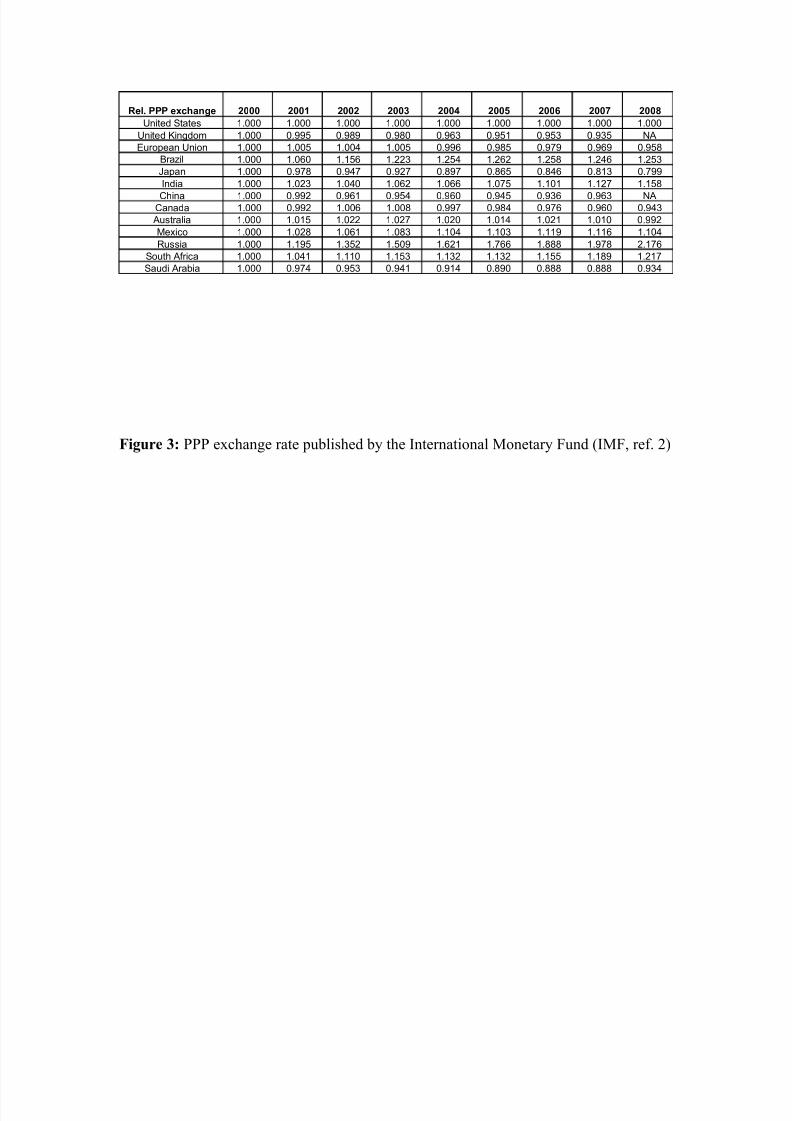
842019 Impact of Inflation on Purchasing Power
httpslidepdfcomreaderfullimpact-of-inflation-on-purchasing-power 1634
Rel PPP exchange 2000 2001 2002 2003 2004 2005 2006 2007 2008
United States 1000 1000 1000 1000 1000 1000 1000 1000 1000
United Kingdom 1000 0995 0989 0980 0963 0951 0953 0935 NA
European Union 1000 1005 1004 1005 0996 0985 0979 0969 0958
Brazil 1000 1060 1156 1223 1254 1262 1258 1246 1253
Japan 1000 0978 0947 0927 0897 0865 0846 0813 0799
India 1000 1023 1040 1062 1066 1075 1101 1127 1158
China 1000 0992 0961 0954 0960 0945 0936 0963 NACanada 1000 0992 1006 1008 0997 0984 0976 0960 0943
Australia 1000 1015 1022 1027 1020 1014 1021 1010 0992
Mexico 1000 1028 1061 1083 1104 1103 1119 1116 1104
Russia 1000 1195 1352 1509 1621 1766 1888 1978 2176
South Africa 1000 1041 1110 1153 1132 1132 1155 1189 1217
Saudi Arabia 1000 0974 0953 0941 0914 0890 0888 0888 0934
Figure 3 PPP exchange rate published by the International Monetary Fund (IMF ref 2)
842019 Impact of Inflation on Purchasing Power
httpslidepdfcomreaderfullimpact-of-inflation-on-purchasing-power 1734
16
18
r
Note x100 for Japanese currency
Country 2000 2001 2002 2003 2004 2005 2006 2007
United States 1000 1000 1000 1000 1000 1000 1000 1000
United Kingdom 0645 0645 0654 0662 0663 0659 0661 0669
Germany 0934 0923 0919 0912 0893 0876 0866 0864
Brazil 0867 0909 0985 1111 1172 1211 1231 1270
Japan 1498 1448 1407 1364 1310 1266 1237 1233
India 8473 8570 8630 8803 9006 9235 9593 9989
China 1828 1822 1801 1813 1891 1917 1895 1929
Canada 1218 1203 1193 1207 1215 1221 1206 1211
Australia 1362 1380 1393 1406 1421 1451 1460 1477
Mexico 6195 6411 6737 7171 7501 7696 7792 7964
Russia 6833 7773 8833 9870 11507 13512 15326 16692
South Africa 2110 2219 2413 2476 2569 2633 2707 2808
Saudi Arabia 2678 2526 2554 2649 2864 3250 3534 3698
842019 Impact of Inflation on Purchasing Power
httpslidepdfcomreaderfullimpact-of-inflation-on-purchasing-power 1834
Figure 4 Changes of nominal exchange rate from 2000 to 2008
190
x c h a n g e R a t e
Change (E) Dec-00 Dec-01 Dec-02 Dec-03 Dec-04 Dec-05 Dec-06 Dec-07 Jun-08
US Dollar 10000 10000 10000 10000 10000 10000 10000 10000 10000Pound 10000 10299 9254 8292 7774 8627 7654 7576 7500Euro 10000 10463 8889 7349 6859 7781 7068 6342 5860Real 10000 11897 18205 14821 13641 11795 10974 9128 8205
Yen 10000 11491 10439 9386 9035 10351 10439 9747 9332
Rupee 10000 10310 10267 9733 9283 9626 9507 8388 9176
Yuan 10000 10000 10000 10000 10000 9783 9510 8816 8285
Can $ 10000 10600 10533 8600 8000 7800 7800 6600 6803
Aus $ 10000 10889 9889 7389 7167 7556 7056 6333 5787
Peso 10000 9542 10864 11696 11602 11061 11249 11363 10708
Rouble 10000 10780 11312 10390 9858 10213 9326 8723 8333
Rand 10000 15789 11316 8684 7500 8355 9276 9013 10263
Riyal 10000 10000 10000 10000 10000 10000 10000 10000 10000
842019 Impact of Inflation on Purchasing Power
httpslidepdfcomreaderfullimpact-of-inflation-on-purchasing-power 1934
Figure 5 Changes of real (CPI) exchange rate from 2000 to 2008
170
a n g e R a t e Change (e) Dec-00 Dec-01 Dec-02 Dec-03 Dec-04 Dec-05 Dec-06 Dec-07 Jun-08
United States 10000 10000 10000 10000 10000 10000 10000 10000 10000
United Kingdom 10000 10348 9361 8458 8071 9071 8029 8107 NA
European Union 10000 10412 8854 7313 6885 7902 7221 6543 6120
Brazil 10000 11221 15746 12122 10882 9343 8722 7327 6550
Japan 10000 11750 11025 10130 10069 11965 12336 11988 11675
India 10000 10082 9869 9166 8711 8957 8637 7442 7922China 10000 10085 10408 10477 10412 10348 10162 9155 NA
Canada 10000 10687 10466 8529 8022 7924 7992 6875 7213
Australia 10000 10723 9677 7196 7025 7450 6909 6270 5832
Mexico 10000 9282 10235 10797 10513 10031 10053 10186 9703
Russia 10000 9018 8365 6887 6081 5784 4939 4410 3830
South Africa 10000 15170 10195 7533 6626 7383 8029 7582 8434
Saudi Arabia 10000 10269 10492 10624 10937 11231 11267 11263 10707
842019 Impact of Inflation on Purchasing Power
httpslidepdfcomreaderfullimpact-of-inflation-on-purchasing-power 2034
Figure 6 Wage increase in different countries from 2000 to 2008 (source ref 1 3 to 14)
670
s e
Wage Increase 2000 2001 2002 2003 2004 2005 2006 2007 2008
United States 000 359 479 684 1060 1265 1658 1966 2291
United Kingdom 000 342 724 1125 1624 2055 2554 3033 3209European Union 000 267 531 750 955 1159 1405 1617 NA
Brazil 000 826 1551 1163 1050 1276 1839 5068 5720
Japan 000 -096 -385 -395 -472 -375 -279 -308 -1992
India 000 253 580 967 1379 2387 2929 3688 4123
China 000 1608 3257 4967 7058 9501 12347 NA NA
Canada 000 142 356 497 718 1063 1393 1758 2044
Australia 000 330 692 1087 1422 2021 2577 3073 3158
Mexico 000 1258 2010 2875 3480 4232 5140 -3118 NA
Russia 000 4575 9613 14737 20319 28484 37836 51147 66631
South Africa 000 956 2134 2613 3802 3988 5251 NA NA
842019 Impact of Inflation on Purchasing Power
httpslidepdfcomreaderfullimpact-of-inflation-on-purchasing-power 2134
Figure 7 Relative purchasing power parity from 2000 to 2008 after adjusting for wage
increase
12
13
e
s
Rel PPP adj for
wage 2000 2001 2002 2003 2004 2005 2006 2007 2008
United States 1000 1000 1000 1000 1000 1000 1000 1000 1000
United Kingdom 1000 0997 0966 0941 0916 0889 0885 0858 0000
European Union 1000 1014 0998 0997 1002 0989 0993 0988 NA
Brazil 1000 1014 1049 1170 1255 1261 1239 0989 0979
Japan 1000 1023 1032 1031 1042 1013 1015 1004 1227
India 1000 1033 1030 1034 1036 0977 0993 0985 1008
China 1000 0885 0759 0681 0623 0546 0488 0448 NA
Canada 1000 1013 1018 1026 1029 1002 0999 0977 0962
Australia 1000 1018 1002 0989 0988 0950 0947 0925 0927
Mexico 1000 0946 0926 0899 0905 0873 0862 1940 NA
Russia 1000 0850 0723 0652 0591 0517 0460 0387 0349
South Africa 1000 0984 0959 0976 0907 0911 0883 NA NA
842019 Impact of Inflation on Purchasing Power
httpslidepdfcomreaderfullimpact-of-inflation-on-purchasing-power 2234
Figure 8 Real exchange rate from 2000 to 2008 after adjusting for wage increase
1600
g e s Change e adj for
Wage 2000 2001 2002 2003 2004 2005 2006 2007
United States 10 000 10000 10000 100 00 10 000 1000 0 100 00 10000
United Kingdom 10000 10364 9147 8122 7679 8476 7456 7443
European Union 10000 10505 8804 7255 6929 7938 7327 6673Brazil 10000 10737 14285 11602 10891 9334 8588 5818Japan 10000 12290 12015 11267 11687 14004 14794 14800India 10000 10186 9774 8929 8467 8146 7787 6506China 10000 8999 8226 7479 6751 5978 5302 4260
Canada 10000 10916 10589 8681 8278 8068 8177 6997Australia 10000 10753 9484 6934 6802 6982 6405 5739Mexico 10000 8540 8929 8959 8626 7940 7741 NARussia 10000 6409 4469 2974 2218 1693 1204 863
South Africa 10000 14343 8804 6381 5309 5946 6137 NA
842019 Impact of Inflation on Purchasing Power
httpslidepdfcomreaderfullimpact-of-inflation-on-purchasing-power 2334
Table 1 Market exchange rate from 2000 to 2008
Nominal Exchange Rate (E) Dec-00 Dec-01 Dec-02 Dec-03 Dec-04 Dec-05 Dec-06 Dec-07 Jun-08US Dollar 10 10 10 10 10 10 10 10 10
British Pound 07 07 06 06 05 06 05 05 05Euro 11 11 10 08 07 08 08 07 06
Brazilian Real 20 23 36 29 27 23 21 18 16
Japanese Yen 1140 1310 1190 1070 1030 1180 1190 1111 1064Indian Rupee 468 482 480 455 434 450 444 392 429
Chinese Yuan 83 83 83 83 83 81 79 73 69
Canadian Dollar 15 16 16 13 12 12 12 10 10Australian Dollar 18 20 18 13 13 14 13 11 10
Mexico Peso 96 92 104 112 112 106 108 109 103
Russian Rouble 282 304 319 293 278 288 263 246 235South African Rand 76 120 86 66 57 64 71 69 78
Saudi Arabian Riyal 38 38 38 38 38 38 38 38 38
Table 2 Weekly Wages from 2000 to 2008
Weekly Wage (in US$) 2000 2001 2002 2003 2004 2005 2006 2007 2008United States 5850 6060 6130 6250 6470 6590 6820 7000 7190
United Kingdom 5286 5309 6126 7093 7905 7386 8670 9094 9310
European Union 3635 3567 4310 5327 5825 5239 5909 6725 00
Brazil 983 894 624 740 796 939 1060 1622 1883
Japan 6636 5719 6112 6791 6998 6170 6180 6599 5694
India 144 143 148 162 176 185 196 235 221
China 217 252 287 324 370 432 509 632 00
Canada 4370 4182 4297 5334 5855 6199 6384 7786 7738
Australia 3737 3545 4040 5608 5956 5946 6661 7714 8497
Mexico 771 910 853 849 896 993 1038
Russia 197 266 342 469 606 743 1011 1381 1812
South Africa 1641 1139 1760 2384 3021 2748 2699
Note The EU wage is an average of Germany France Italy and Spain
842019 Impact of Inflation on Purchasing Power
httpslidepdfcomreaderfullimpact-of-inflation-on-purchasing-power 2434
PURCHASING POWER PARITY
The purchasing power parity (PPP) theory uses the long-term equilibrium exchange
rate of two currencies to equalize their purchasing power Developed by Gustav Cassel in1920 it is based on the law of one price the theory states that in ideally efficientmarkets identical goods should have only one price
This purchasing power SEM rate equalizes the purchasing power of different currenciesin their home countries for a given basket of goods Using a PPP basis is arguably moreuseful when comparing differences in living standards on the whole between nations because PPP takes into account the relative cost of living and the inflation rates of different countries rather than just a nominal gross domestic product (GDP) comparisonThe best-known and most-used purchasing power parity exchange rate is the Geary-Khakis dollar (the international dollar)
PPP exchange rates (the real exchange rate) fluctuations are mostly due to marketexchange rates movements Aside from this volatility consistent deviations of the marketand PPP exchange rates are observed for example (market exchange rate) prices of non-traded goods and services are usually lower where incomes are lower (A US dollar exchanged and spent in India will buy more haircuts than a dollar spent in the UnitedStates) PPP takes into account this lower cost of living and adjusts for it as though allincome was spent locally In other words PPP is the amount of a certain basket of basicgoods which can be bought in the given country with the money it produces
There can be marked differences between PPP and market exchange rates [1] For
example the World Banks World Development Indicators 2005 estimated that in 2003one United States dollar was equivalent to about 18 Chinese Yuan by purchasing power parity [2] - considerably different from the nominal exchange rate that put one dollar equalto 76 Yuan This discrepancy has large implications for instance GDP per capita in thePeoples Republic of China is about US$1800 while on a PPP basis it is about US$7204This is frequently used to assert that China is the worlds second-largest economy butsuch a calculation would only be valid under the PPP theory At the other extremeJapans nominal GDP per capita is around US$37600 but its PPP figure is onlyUS$30615
842019 Impact of Inflation on Purchasing Power
httpslidepdfcomreaderfullimpact-of-inflation-on-purchasing-power 2534
First letrsquos look at the situation of domestic buying Gustav Cassel developed the purchasing power parity (PPP) theory in 1920 to compare the purchasing power of different currencies in their home countries based on the assumption that identical goodsshould have the same price (law of one price) PPP exchange rate is defined in Equation1
For
Dom
P
P PPP = (Eq 1)
Where PDom is domestic price and PFor is foreign price
The relative purchasing power parity relates the inflation rate (change of prices) in eachcountry to the change in the market exchange rate and is given in Equation 2
Dom
t
Dom
t
For t
For t
rel
P P
P P PPP
1
1
minus
minus
= (Eq 2)
Where Pt is the price level in period t To calculate the relative purchasing power parityof all of the goods and services consumed in a country we can substitute P t with theconsumer price index (CPI) of that country which leads to Equation 3
Dom
t
Dom
t
For
t
For
t
rel
CPI CPI
CPI CPI PPP
1
1
minus
minus
= (Eq 3)
Figure 1 shows the consumer price indexes of thirteen relatively large countries or economies The inflation rate is higher in the emerging economies than in the developedcountries because of the higher rate of economic growth
Figure 2 shows the changes in relative purchasing power parity of the above economiescalculated by Equation 3 By this calculation one may conclude that the US dollar hasappreciated against the Mexican Indian South African Brazilian and Russian currencies
by 10 to 217 while depreciated against the Australian European Canadian BritishChinese and Saudi Arabian currencies by 1 to 10 from 2000 to 2008 if theconsumptions are domestic This can be attributed to the difference in inflation rate of these countries Japanrsquos disinflation condition between 2000 and 2008 caused the USdollar to weaken approximately 20 over the same time period
842019 Impact of Inflation on Purchasing Power
httpslidepdfcomreaderfullimpact-of-inflation-on-purchasing-power 2634
The International Monetary Fund (IMF) has conducted similar calculation that includesmore factors such as gross domestic product (GDP) The PPP exchange rates published by the IMF are displayed in the following Figure 3 The data shown in Figure 2 areconsistent with the IMF data
It was recognized by many economists that the PPP exchange rate calculation is not perfect because of the difficulties in finding the same baskets of goods to compare acrosscountries The weighing of goods and services in the CPI index is not identical amongdifferent countries Often times the quality of goods and service purchased variesconsiderably for example Americans probably drive better cars and drink cleaner water than many people in developing countries Moreover many social benefits offered bythe welfare countries may not be included in the CPI calculations and this makes directcomparison of purchasing power difficult Nevertheless this methodology gives us arough idea how consumers are doing in different economies
REAL EXCHANGE RATE IN INTERNATIONAL TRADE
When consumers or businesses purchase goods and services from foreign countries theywill need to exchange the available domestic currency to foreign currencies in order tofulfill the trade The price of one currency in terms of another currency is called theexchange rate and it is determined by the currency market and in some cases by
individual governments The exchange rates of twelve foreign currencies to the USdollar from 2000 to 2008 are shown in Table 1 The US dollar depreciated against mostcurrencies in terms of market exchange rate after 2002 except for the Mexican Peso andBrazilian Real (until 2006)
Many people misunderstand the real prices if only the nominal (market) exchange rate isconsidered for the trade For example a three-bedroom apartment in China costs about1500000 Yuan while a similar apartment in the US cost about 400000 Dollar A post-doctorate position in Oxford University in England is paid about 40000 Pound per year
while a similar position in Massachusetts Institute of Technology in the US is paid60000 Dollar per year The market exchange rates do not reflect the real difference of the prices Therefore the real exchange rate which considers both the nominal exchangerate and prices should be used for international trade The real exchange rate is definedin Equation 4
For
Dom
P
P E Rate Exchangeal min Noe Rate Exchangeal Re times= )()( (Eq 4)
842019 Impact of Inflation on Purchasing Power
httpslidepdfcomreaderfullimpact-of-inflation-on-purchasing-power 2734
where PDom is domestic price and PFor is foreign price Using the above two examplesthe real exchange rates would be 18 Chinese apartment = 1 American apartment and075 Oxford salary = 1 MIT salary in 2008
If we substitute prices with CPI indexes in the above equation the real exchange for allthe goods and services can be estimated by Equation 5
For
Dom
CPI
CPI E e times= (Eq 5)
Figure 4 and Figure 5 show the percent changes of nominal exchange rate and real (CPI)exchange rate from 2000 to 2008 and the values are not the same When inflation (price
change) rates are taken into account the dollar actually strengthens against the JapaneseYen and Saudi Arabian Riyal while the advantage over the Peso and the Real (until 2005)diminished The magnitude of depreciation of the US dollar against the British Poundthe Euro the Canadian Dollar and the Chinese Yuan is 2-5 better in the real rate thanin the nominal rate On the other hand the dollar depreciated more against the IndianRupee the South African Rand (after 2002) and the Russian Ruble in the real rate than inthe nominal rate The real rate and the nominal rate for the Australian dollar are verysimilar This analysis indicates that one would make different decisions in buyingforeign goods and services when using the real exchange rate versus the nominalexchange rate
In addition if we compare the data in Figure 2 and Figure 5 it is obvious that the PPPexchange rate fluctuates less dramatically than the foreign exchange rate (except theRussian Ruble) In other words foreign exchange rates affect international trade morethan domestic consumption
WAGE FACTOR
Most consumers except the unemployed and retirees earn wages to make a livingEmployers usually give employees a small wages increase every year to offset inflationFigure 6 shows the percentage of wage increase in different countries The wage increasein the US EU and India is a few percent less than inflation over eight years while thewages in Canada Brazil and Australia outpaced inflation by a few percents in the same period The wage increase in UK Mexico South Africa China and Russia is even faster
842019 Impact of Inflation on Purchasing Power
httpslidepdfcomreaderfullimpact-of-inflation-on-purchasing-power 2834
double to triple digits gain over inflation is observed in these nations Japanrsquos wage isstagnant (or dropping slightly) from 2000 to 2008 It is unclear what exactly causes thesedifferences one may speculate that it may relate to the fiscal condition and account balance of the nations as well as how the governments want to regulate their economyFor example commodity producing countries is benefited from the recent purge of
commodity prices China has a large trade surplus the Japanese prices may have comedown from a very high level from decays ago It will be interested to see how the fastwage increase in some nations would impact their inflation situation in the future
The difference in wage changes certainly would have an impact to consumerrsquos purchasing power If we modify Equation 3 and Equation 5 for calculating relative PPPand real (CPI) exchange rate by a wage factor the following equations will results
For
t
For
t
Dom
t
Dom
t
Dom
t
Dom
t
For
t
For
t
rel
W W
W W
CPI CPI
CPI CPI PPP
1
1
1
1
minus
minus
minus
minus
times= (Eq 6)
For
Dom
For
Dom
W
W
CPI
CPI E e timestimes= (Eq 7)
where W denotes wages Using this modified calculation both domestic and foreign purchasing power will change Figure 7 and Figure 8 shows the relative PPP and realexchange rate after adjusting for wage increase After adjusting for wages the relativePPP become almost the same for the US EU Canada Japan (until 2007) India andBrazil (after 2006) Australia UK South Africa Mexico become the out performerswhich is not the case without adjusting for wages China and Russia demonstrate the bestimprovement in relative PPP because of the large increase of their wages
After adjusting for wages the buying power of Americans in international marketsweakens further relative to most foreign consumers except the Japanese Meanwhile thedepreciation of the US dollar against the Euro is about 5 less than before adjustment(using the 2008 figure) because of the wage advantage for Americans As pointed outearlier there are pitfalls for direct cross-comparison using the CPI index Additionallyother factors such as taxation may complicate the purchasing power calculation For example American income taxes are less than many industrialized countries while poorer nations probably donrsquot tax on income as much
842019 Impact of Inflation on Purchasing Power
httpslidepdfcomreaderfullimpact-of-inflation-on-purchasing-power 2934
Based on the above analysis the emerging economies have made big progress inenhancing the international purchasing power of their citizens thanks to increases of international trade employment and work force productivity Having said that the gap
of incomes between citizens of developed and developing countries are still quite large asshown in the Table 2 Additionally the consequences of environmental damages andincreased energy consumptions in developing countries due to rapid industrialization may be debatable issues
842019 Impact of Inflation on Purchasing Power
httpslidepdfcomreaderfullimpact-of-inflation-on-purchasing-power 3034
Conclusion
Exchange rate pricesinflation and wage level influence the purchasing power of consumers in domestic and international markets The domestic purchasing power ismainly affected by the inflation rate of individual countries and it is relatively equitableacross mature economies The international purchasing power is more volatile and isaffected by both exchange rate and prices Wage changes can further compensate or deprive purchasing power of consumers Analysis of current exchange rates prices andwages leads to the belief that foreign shoppers can get better bargains in Japan and theUS at the present time Consumers in emerging economies especially China and Russiahave experienced significant improvement in purchasing power recently when compared
to themselves They may catch up with the living standard of rich countries in the futureif this growth rate sustains Finally it will be interesting to research the fundamentaleconomic forces which influence the gauges that are measured in the articleWhen prices are rising you can buy less with a given amount of money When hotdogsare expensive a given amount of money will buy a small number of hotdogs But whenhotdogs are inexpensive that is the price is low your given hot dog allowance will purchase a lot more satisfaction There is a relationship between prices and purchasing power that is a reciprocal relationship and thatrsquos the relationship that wersquore going to bestudying in this lesson When prices are going from low prices to high prices that iswhen there is inflation in the economy the value of the dollar is shrinking that is your Purchasing power is going from being able to buy a lot to being able to buy a little Inthis lesson Irsquom going to begin by giving a simple numerical example and then wersquoll talk about how you can use the GDP deflator to show the relationship between the inflationrate and purchasing power
Letrsquos start by assuming that we are in a period of inflation and letrsquos let hotdogs be arepresentative good that is the price of all goods and services across the economy isincreasing at some general rate and wersquore going to look at the price of hotdogs in order toinfer what is happening to purchasing power as prices are rising Wersquore going to befocusing now on the reciprocal relationship between the price level and the purchasing power of the dollar that is what a dollar will buy as the price level is changing And Irsquovewritten out here as clearly as I can the formula that shows this reciprocal relationship thatis one over the price level equals the purchasing power of a dollar Let me make thisvery clear Letrsquos suppose that the price of a hotdog is five cents Well whatrsquos the purchasing power of your dollar Five cents is the same thing as one twentieth of adollar Therefore the reciprocal of one twentieth is twenty Your dollar will buy twentyhotdogs Thatrsquos its purchasing power
842019 Impact of Inflation on Purchasing Power
httpslidepdfcomreaderfullimpact-of-inflation-on-purchasing-power 3134
Now suppose wersquore in a period of inflation so that prices are rising and the price of ahotdog goes up to two dollars Whatrsquos happened to your purchasing power Well your dollar will no longer buy even a whole hotdog Two dollars or 2 has a reciprocal of onehalf that is you can now only afford half a hotdog Your purchasing power has shrunk from twenty hotdogs at a price of five cents a piece to one half a hotdog whenever the
price is two dollars per hotdog This simple example makes clear that the price level andthe purchasing power of the dollar are reciprocals
Now letrsquos look at some examples using the GDP deflator Suppose that wersquore in the year 2000 which is our base year for calculating the GDP deflator and we calculate the priceof a market basket of goods and services- that is a little bit of Housing and a little bit of transportation a little bit of medical care a little bit of clothingetc And wersquore going to call the price level in the year 2000 one hundred because itrsquos our base year
We look at those prices again in 2002 and we find that the price of the goods and
services as a ratio of the same prices in 2000 is equal to 104 That is prices haveincreased by about 4 percent between the year 2000 and 2002 So if we write the GDPdeflator not in the form we usually write it that is multiplied by 100 to get 104 but letrsquoswrite it now as in hundredths 104 to show the 4 percent increase in prices between theyear 2000 and 2002 Well whatrsquos happened to the purchasing power of a dollar betweenthe year 2000 and 2002 That is how much can we afford to buy in 2002 with a dollar if we measure it in the prices of the year 2000 Prices are higher in 2002 therefore thedollar wonrsquot buy as much Well if you takethe reciprocal of the GDP deflator 104 you get 096 Whatrsquos that saying Itrsquos saying thatwhat you could have bought for 96 cents back in the year 2000 now it costs you a dollar to buy in 2002 That is a dollar in 2002 is only worth what 96 cents was worth back inthe year 2000 You can afford to buy less Your purchasing power has shrunk by about 4 percent Your purchasing power shrinks at the same rate that the price level increases because the price level and your purchasing power are reciprocals of each other
Well letrsquos take another example during a period of deflation If we look at the years between 1929 and 1933 wersquoll see falling prices If we choose 1929 as the base year andif we call the price level in that 200000 or 100 if we look at prices in 1933 during thegreat depression we see that the price level has fallen by about 24 percent That is wersquovegone from 100 down to 076 So we now have lower prices in 1933 than we had in 1929
Now what does that mean What is going to happen to the purchasing power of your dollar when prices are lower Itrsquos clearly going to increase Yoursquore going to go from asmall purchasing power to a bigger purchasing power And if you takethe reciprocal of 76 percent you get 132 That is the purchasing power of the dollar hasincreased by about 32 percent in this example Now the reason the numbers donrsquot add upexactly the reason I canrsquot say a 24 percent decrease in prices is equal to a 24 percentincrease in purchasing power is because once your percentages start getting large yourun into this problem that a fifty percent increase is sorry that a 100 percent increase isthe reciprocal of a 50 percent decrease you wind up with this problem that wersquove
842019 Impact of Inflation on Purchasing Power
httpslidepdfcomreaderfullimpact-of-inflation-on-purchasing-power 3234
discussed earlier about the calculation of percentage changes but you can still use thisformula any time it always works One over the price level gives you the purchasing power of the dollar and when the price level is only 76 percent what it was before your purchasing power is going to be 132 percent of what it was before Falling prices give us an increase in the purchasing power of the dollar
842019 Impact of Inflation on Purchasing Power
httpslidepdfcomreaderfullimpact-of-inflation-on-purchasing-power 3334
REFERENCES
1 httpwwwworldsalariesorg
2 International Monetary Fund World Economic Outlook Database September
2006
3 Website of Australian Bureau of Statistics
4 Website of Blanco de Mexico
5 Website of Bank of England
6 Website of Central Bank of Brazil
7 Website of European Central bank
8 Website of International Organization of Labor
9 Website of the Labor Department of India
10 Website of the Ministry of Economics and Planning of Saudi Arabia
11 Website of the Ministry of Finance of the Russian Federation
12 Website of National Bureau of Statistics of China
13 Website of Statistics Bureau of Japan
14 Website of Statistics Canada
15 Website of Statistics South Africa
16 Website of the United States Labor Department
17 Website of Wikipedia on purchasing power parity and consumer price index
842019 Impact of Inflation on Purchasing Power
httpslidepdfcomreaderfullimpact-of-inflation-on-purchasing-power 3434
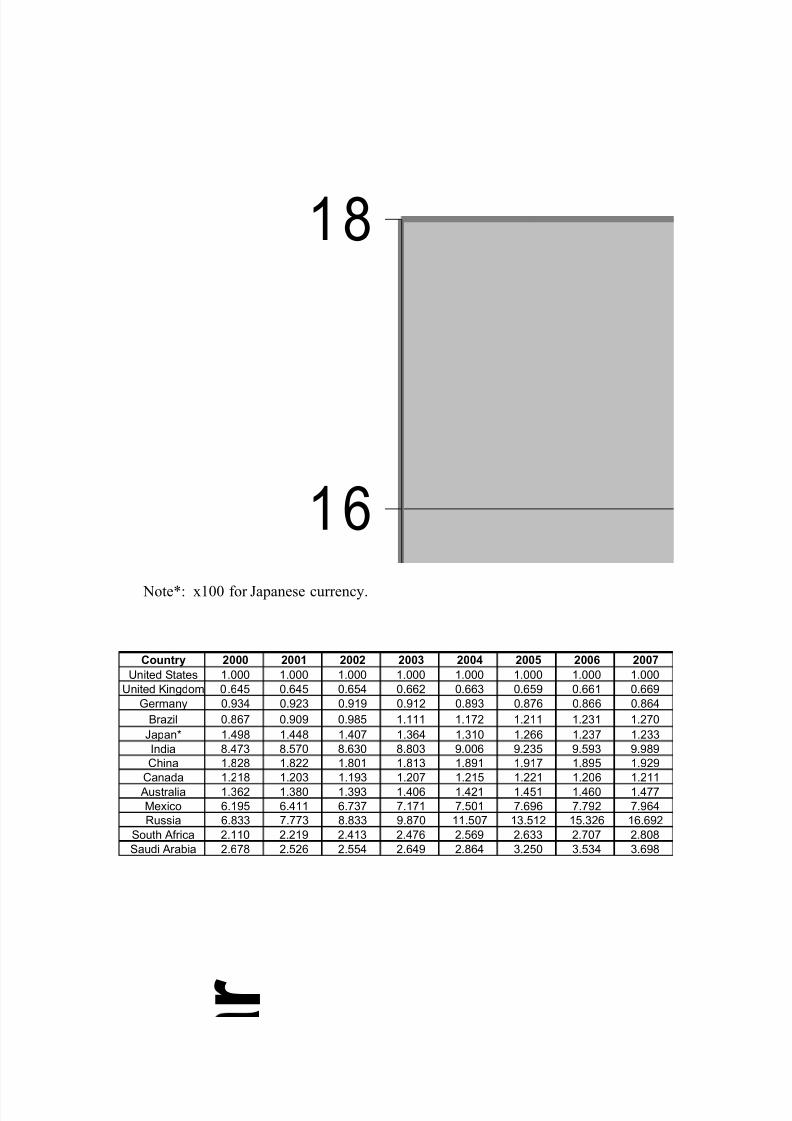
842019 Impact of Inflation on Purchasing Power
httpslidepdfcomreaderfullimpact-of-inflation-on-purchasing-power 1734
16
18
r
Note x100 for Japanese currency
Country 2000 2001 2002 2003 2004 2005 2006 2007
United States 1000 1000 1000 1000 1000 1000 1000 1000
United Kingdom 0645 0645 0654 0662 0663 0659 0661 0669
Germany 0934 0923 0919 0912 0893 0876 0866 0864
Brazil 0867 0909 0985 1111 1172 1211 1231 1270
Japan 1498 1448 1407 1364 1310 1266 1237 1233
India 8473 8570 8630 8803 9006 9235 9593 9989
China 1828 1822 1801 1813 1891 1917 1895 1929
Canada 1218 1203 1193 1207 1215 1221 1206 1211
Australia 1362 1380 1393 1406 1421 1451 1460 1477
Mexico 6195 6411 6737 7171 7501 7696 7792 7964
Russia 6833 7773 8833 9870 11507 13512 15326 16692
South Africa 2110 2219 2413 2476 2569 2633 2707 2808
Saudi Arabia 2678 2526 2554 2649 2864 3250 3534 3698
842019 Impact of Inflation on Purchasing Power
httpslidepdfcomreaderfullimpact-of-inflation-on-purchasing-power 1834
Figure 4 Changes of nominal exchange rate from 2000 to 2008
190
x c h a n g e R a t e
Change (E) Dec-00 Dec-01 Dec-02 Dec-03 Dec-04 Dec-05 Dec-06 Dec-07 Jun-08
US Dollar 10000 10000 10000 10000 10000 10000 10000 10000 10000Pound 10000 10299 9254 8292 7774 8627 7654 7576 7500Euro 10000 10463 8889 7349 6859 7781 7068 6342 5860Real 10000 11897 18205 14821 13641 11795 10974 9128 8205
Yen 10000 11491 10439 9386 9035 10351 10439 9747 9332
Rupee 10000 10310 10267 9733 9283 9626 9507 8388 9176
Yuan 10000 10000 10000 10000 10000 9783 9510 8816 8285
Can $ 10000 10600 10533 8600 8000 7800 7800 6600 6803
Aus $ 10000 10889 9889 7389 7167 7556 7056 6333 5787
Peso 10000 9542 10864 11696 11602 11061 11249 11363 10708
Rouble 10000 10780 11312 10390 9858 10213 9326 8723 8333
Rand 10000 15789 11316 8684 7500 8355 9276 9013 10263
Riyal 10000 10000 10000 10000 10000 10000 10000 10000 10000
842019 Impact of Inflation on Purchasing Power
httpslidepdfcomreaderfullimpact-of-inflation-on-purchasing-power 1934
Figure 5 Changes of real (CPI) exchange rate from 2000 to 2008
170
a n g e R a t e Change (e) Dec-00 Dec-01 Dec-02 Dec-03 Dec-04 Dec-05 Dec-06 Dec-07 Jun-08
United States 10000 10000 10000 10000 10000 10000 10000 10000 10000
United Kingdom 10000 10348 9361 8458 8071 9071 8029 8107 NA
European Union 10000 10412 8854 7313 6885 7902 7221 6543 6120
Brazil 10000 11221 15746 12122 10882 9343 8722 7327 6550
Japan 10000 11750 11025 10130 10069 11965 12336 11988 11675
India 10000 10082 9869 9166 8711 8957 8637 7442 7922China 10000 10085 10408 10477 10412 10348 10162 9155 NA
Canada 10000 10687 10466 8529 8022 7924 7992 6875 7213
Australia 10000 10723 9677 7196 7025 7450 6909 6270 5832
Mexico 10000 9282 10235 10797 10513 10031 10053 10186 9703
Russia 10000 9018 8365 6887 6081 5784 4939 4410 3830
South Africa 10000 15170 10195 7533 6626 7383 8029 7582 8434
Saudi Arabia 10000 10269 10492 10624 10937 11231 11267 11263 10707
842019 Impact of Inflation on Purchasing Power
httpslidepdfcomreaderfullimpact-of-inflation-on-purchasing-power 2034
Figure 6 Wage increase in different countries from 2000 to 2008 (source ref 1 3 to 14)
670
s e
Wage Increase 2000 2001 2002 2003 2004 2005 2006 2007 2008
United States 000 359 479 684 1060 1265 1658 1966 2291
United Kingdom 000 342 724 1125 1624 2055 2554 3033 3209European Union 000 267 531 750 955 1159 1405 1617 NA
Brazil 000 826 1551 1163 1050 1276 1839 5068 5720
Japan 000 -096 -385 -395 -472 -375 -279 -308 -1992
India 000 253 580 967 1379 2387 2929 3688 4123
China 000 1608 3257 4967 7058 9501 12347 NA NA
Canada 000 142 356 497 718 1063 1393 1758 2044
Australia 000 330 692 1087 1422 2021 2577 3073 3158
Mexico 000 1258 2010 2875 3480 4232 5140 -3118 NA
Russia 000 4575 9613 14737 20319 28484 37836 51147 66631
South Africa 000 956 2134 2613 3802 3988 5251 NA NA
842019 Impact of Inflation on Purchasing Power
httpslidepdfcomreaderfullimpact-of-inflation-on-purchasing-power 2134
Figure 7 Relative purchasing power parity from 2000 to 2008 after adjusting for wage
increase
12
13
e
s
Rel PPP adj for
wage 2000 2001 2002 2003 2004 2005 2006 2007 2008
United States 1000 1000 1000 1000 1000 1000 1000 1000 1000
United Kingdom 1000 0997 0966 0941 0916 0889 0885 0858 0000
European Union 1000 1014 0998 0997 1002 0989 0993 0988 NA
Brazil 1000 1014 1049 1170 1255 1261 1239 0989 0979
Japan 1000 1023 1032 1031 1042 1013 1015 1004 1227
India 1000 1033 1030 1034 1036 0977 0993 0985 1008
China 1000 0885 0759 0681 0623 0546 0488 0448 NA
Canada 1000 1013 1018 1026 1029 1002 0999 0977 0962
Australia 1000 1018 1002 0989 0988 0950 0947 0925 0927
Mexico 1000 0946 0926 0899 0905 0873 0862 1940 NA
Russia 1000 0850 0723 0652 0591 0517 0460 0387 0349
South Africa 1000 0984 0959 0976 0907 0911 0883 NA NA
842019 Impact of Inflation on Purchasing Power
httpslidepdfcomreaderfullimpact-of-inflation-on-purchasing-power 2234
Figure 8 Real exchange rate from 2000 to 2008 after adjusting for wage increase
1600
g e s Change e adj for
Wage 2000 2001 2002 2003 2004 2005 2006 2007
United States 10 000 10000 10000 100 00 10 000 1000 0 100 00 10000
United Kingdom 10000 10364 9147 8122 7679 8476 7456 7443
European Union 10000 10505 8804 7255 6929 7938 7327 6673Brazil 10000 10737 14285 11602 10891 9334 8588 5818Japan 10000 12290 12015 11267 11687 14004 14794 14800India 10000 10186 9774 8929 8467 8146 7787 6506China 10000 8999 8226 7479 6751 5978 5302 4260
Canada 10000 10916 10589 8681 8278 8068 8177 6997Australia 10000 10753 9484 6934 6802 6982 6405 5739Mexico 10000 8540 8929 8959 8626 7940 7741 NARussia 10000 6409 4469 2974 2218 1693 1204 863
South Africa 10000 14343 8804 6381 5309 5946 6137 NA
842019 Impact of Inflation on Purchasing Power
httpslidepdfcomreaderfullimpact-of-inflation-on-purchasing-power 2334
Table 1 Market exchange rate from 2000 to 2008
Nominal Exchange Rate (E) Dec-00 Dec-01 Dec-02 Dec-03 Dec-04 Dec-05 Dec-06 Dec-07 Jun-08US Dollar 10 10 10 10 10 10 10 10 10
British Pound 07 07 06 06 05 06 05 05 05Euro 11 11 10 08 07 08 08 07 06
Brazilian Real 20 23 36 29 27 23 21 18 16
Japanese Yen 1140 1310 1190 1070 1030 1180 1190 1111 1064Indian Rupee 468 482 480 455 434 450 444 392 429
Chinese Yuan 83 83 83 83 83 81 79 73 69
Canadian Dollar 15 16 16 13 12 12 12 10 10Australian Dollar 18 20 18 13 13 14 13 11 10
Mexico Peso 96 92 104 112 112 106 108 109 103
Russian Rouble 282 304 319 293 278 288 263 246 235South African Rand 76 120 86 66 57 64 71 69 78
Saudi Arabian Riyal 38 38 38 38 38 38 38 38 38
Table 2 Weekly Wages from 2000 to 2008
Weekly Wage (in US$) 2000 2001 2002 2003 2004 2005 2006 2007 2008United States 5850 6060 6130 6250 6470 6590 6820 7000 7190
United Kingdom 5286 5309 6126 7093 7905 7386 8670 9094 9310
European Union 3635 3567 4310 5327 5825 5239 5909 6725 00
Brazil 983 894 624 740 796 939 1060 1622 1883
Japan 6636 5719 6112 6791 6998 6170 6180 6599 5694
India 144 143 148 162 176 185 196 235 221
China 217 252 287 324 370 432 509 632 00
Canada 4370 4182 4297 5334 5855 6199 6384 7786 7738
Australia 3737 3545 4040 5608 5956 5946 6661 7714 8497
Mexico 771 910 853 849 896 993 1038
Russia 197 266 342 469 606 743 1011 1381 1812
South Africa 1641 1139 1760 2384 3021 2748 2699
Note The EU wage is an average of Germany France Italy and Spain
842019 Impact of Inflation on Purchasing Power
httpslidepdfcomreaderfullimpact-of-inflation-on-purchasing-power 2434
PURCHASING POWER PARITY
The purchasing power parity (PPP) theory uses the long-term equilibrium exchange
rate of two currencies to equalize their purchasing power Developed by Gustav Cassel in1920 it is based on the law of one price the theory states that in ideally efficientmarkets identical goods should have only one price
This purchasing power SEM rate equalizes the purchasing power of different currenciesin their home countries for a given basket of goods Using a PPP basis is arguably moreuseful when comparing differences in living standards on the whole between nations because PPP takes into account the relative cost of living and the inflation rates of different countries rather than just a nominal gross domestic product (GDP) comparisonThe best-known and most-used purchasing power parity exchange rate is the Geary-Khakis dollar (the international dollar)
PPP exchange rates (the real exchange rate) fluctuations are mostly due to marketexchange rates movements Aside from this volatility consistent deviations of the marketand PPP exchange rates are observed for example (market exchange rate) prices of non-traded goods and services are usually lower where incomes are lower (A US dollar exchanged and spent in India will buy more haircuts than a dollar spent in the UnitedStates) PPP takes into account this lower cost of living and adjusts for it as though allincome was spent locally In other words PPP is the amount of a certain basket of basicgoods which can be bought in the given country with the money it produces
There can be marked differences between PPP and market exchange rates [1] For
example the World Banks World Development Indicators 2005 estimated that in 2003one United States dollar was equivalent to about 18 Chinese Yuan by purchasing power parity [2] - considerably different from the nominal exchange rate that put one dollar equalto 76 Yuan This discrepancy has large implications for instance GDP per capita in thePeoples Republic of China is about US$1800 while on a PPP basis it is about US$7204This is frequently used to assert that China is the worlds second-largest economy butsuch a calculation would only be valid under the PPP theory At the other extremeJapans nominal GDP per capita is around US$37600 but its PPP figure is onlyUS$30615
842019 Impact of Inflation on Purchasing Power
httpslidepdfcomreaderfullimpact-of-inflation-on-purchasing-power 2534
First letrsquos look at the situation of domestic buying Gustav Cassel developed the purchasing power parity (PPP) theory in 1920 to compare the purchasing power of different currencies in their home countries based on the assumption that identical goodsshould have the same price (law of one price) PPP exchange rate is defined in Equation1
For
Dom
P
P PPP = (Eq 1)
Where PDom is domestic price and PFor is foreign price
The relative purchasing power parity relates the inflation rate (change of prices) in eachcountry to the change in the market exchange rate and is given in Equation 2
Dom
t
Dom
t
For t
For t
rel
P P
P P PPP
1
1
minus
minus
= (Eq 2)
Where Pt is the price level in period t To calculate the relative purchasing power parityof all of the goods and services consumed in a country we can substitute P t with theconsumer price index (CPI) of that country which leads to Equation 3
Dom
t
Dom
t
For
t
For
t
rel
CPI CPI
CPI CPI PPP
1
1
minus
minus
= (Eq 3)
Figure 1 shows the consumer price indexes of thirteen relatively large countries or economies The inflation rate is higher in the emerging economies than in the developedcountries because of the higher rate of economic growth
Figure 2 shows the changes in relative purchasing power parity of the above economiescalculated by Equation 3 By this calculation one may conclude that the US dollar hasappreciated against the Mexican Indian South African Brazilian and Russian currencies
by 10 to 217 while depreciated against the Australian European Canadian BritishChinese and Saudi Arabian currencies by 1 to 10 from 2000 to 2008 if theconsumptions are domestic This can be attributed to the difference in inflation rate of these countries Japanrsquos disinflation condition between 2000 and 2008 caused the USdollar to weaken approximately 20 over the same time period
842019 Impact of Inflation on Purchasing Power
httpslidepdfcomreaderfullimpact-of-inflation-on-purchasing-power 2634
The International Monetary Fund (IMF) has conducted similar calculation that includesmore factors such as gross domestic product (GDP) The PPP exchange rates published by the IMF are displayed in the following Figure 3 The data shown in Figure 2 areconsistent with the IMF data
It was recognized by many economists that the PPP exchange rate calculation is not perfect because of the difficulties in finding the same baskets of goods to compare acrosscountries The weighing of goods and services in the CPI index is not identical amongdifferent countries Often times the quality of goods and service purchased variesconsiderably for example Americans probably drive better cars and drink cleaner water than many people in developing countries Moreover many social benefits offered bythe welfare countries may not be included in the CPI calculations and this makes directcomparison of purchasing power difficult Nevertheless this methodology gives us arough idea how consumers are doing in different economies
REAL EXCHANGE RATE IN INTERNATIONAL TRADE
When consumers or businesses purchase goods and services from foreign countries theywill need to exchange the available domestic currency to foreign currencies in order tofulfill the trade The price of one currency in terms of another currency is called theexchange rate and it is determined by the currency market and in some cases by
individual governments The exchange rates of twelve foreign currencies to the USdollar from 2000 to 2008 are shown in Table 1 The US dollar depreciated against mostcurrencies in terms of market exchange rate after 2002 except for the Mexican Peso andBrazilian Real (until 2006)
Many people misunderstand the real prices if only the nominal (market) exchange rate isconsidered for the trade For example a three-bedroom apartment in China costs about1500000 Yuan while a similar apartment in the US cost about 400000 Dollar A post-doctorate position in Oxford University in England is paid about 40000 Pound per year
while a similar position in Massachusetts Institute of Technology in the US is paid60000 Dollar per year The market exchange rates do not reflect the real difference of the prices Therefore the real exchange rate which considers both the nominal exchangerate and prices should be used for international trade The real exchange rate is definedin Equation 4
For
Dom
P
P E Rate Exchangeal min Noe Rate Exchangeal Re times= )()( (Eq 4)
842019 Impact of Inflation on Purchasing Power
httpslidepdfcomreaderfullimpact-of-inflation-on-purchasing-power 2734
where PDom is domestic price and PFor is foreign price Using the above two examplesthe real exchange rates would be 18 Chinese apartment = 1 American apartment and075 Oxford salary = 1 MIT salary in 2008
If we substitute prices with CPI indexes in the above equation the real exchange for allthe goods and services can be estimated by Equation 5
For
Dom
CPI
CPI E e times= (Eq 5)
Figure 4 and Figure 5 show the percent changes of nominal exchange rate and real (CPI)exchange rate from 2000 to 2008 and the values are not the same When inflation (price
change) rates are taken into account the dollar actually strengthens against the JapaneseYen and Saudi Arabian Riyal while the advantage over the Peso and the Real (until 2005)diminished The magnitude of depreciation of the US dollar against the British Poundthe Euro the Canadian Dollar and the Chinese Yuan is 2-5 better in the real rate thanin the nominal rate On the other hand the dollar depreciated more against the IndianRupee the South African Rand (after 2002) and the Russian Ruble in the real rate than inthe nominal rate The real rate and the nominal rate for the Australian dollar are verysimilar This analysis indicates that one would make different decisions in buyingforeign goods and services when using the real exchange rate versus the nominalexchange rate
In addition if we compare the data in Figure 2 and Figure 5 it is obvious that the PPPexchange rate fluctuates less dramatically than the foreign exchange rate (except theRussian Ruble) In other words foreign exchange rates affect international trade morethan domestic consumption
WAGE FACTOR
Most consumers except the unemployed and retirees earn wages to make a livingEmployers usually give employees a small wages increase every year to offset inflationFigure 6 shows the percentage of wage increase in different countries The wage increasein the US EU and India is a few percent less than inflation over eight years while thewages in Canada Brazil and Australia outpaced inflation by a few percents in the same period The wage increase in UK Mexico South Africa China and Russia is even faster
842019 Impact of Inflation on Purchasing Power
httpslidepdfcomreaderfullimpact-of-inflation-on-purchasing-power 2834
double to triple digits gain over inflation is observed in these nations Japanrsquos wage isstagnant (or dropping slightly) from 2000 to 2008 It is unclear what exactly causes thesedifferences one may speculate that it may relate to the fiscal condition and account balance of the nations as well as how the governments want to regulate their economyFor example commodity producing countries is benefited from the recent purge of
commodity prices China has a large trade surplus the Japanese prices may have comedown from a very high level from decays ago It will be interested to see how the fastwage increase in some nations would impact their inflation situation in the future
The difference in wage changes certainly would have an impact to consumerrsquos purchasing power If we modify Equation 3 and Equation 5 for calculating relative PPPand real (CPI) exchange rate by a wage factor the following equations will results
For
t
For
t
Dom
t
Dom
t
Dom
t
Dom
t
For
t
For
t
rel
W W
W W
CPI CPI
CPI CPI PPP
1
1
1
1
minus
minus
minus
minus
times= (Eq 6)
For
Dom
For
Dom
W
W
CPI
CPI E e timestimes= (Eq 7)
where W denotes wages Using this modified calculation both domestic and foreign purchasing power will change Figure 7 and Figure 8 shows the relative PPP and realexchange rate after adjusting for wage increase After adjusting for wages the relativePPP become almost the same for the US EU Canada Japan (until 2007) India andBrazil (after 2006) Australia UK South Africa Mexico become the out performerswhich is not the case without adjusting for wages China and Russia demonstrate the bestimprovement in relative PPP because of the large increase of their wages
After adjusting for wages the buying power of Americans in international marketsweakens further relative to most foreign consumers except the Japanese Meanwhile thedepreciation of the US dollar against the Euro is about 5 less than before adjustment(using the 2008 figure) because of the wage advantage for Americans As pointed outearlier there are pitfalls for direct cross-comparison using the CPI index Additionallyother factors such as taxation may complicate the purchasing power calculation For example American income taxes are less than many industrialized countries while poorer nations probably donrsquot tax on income as much
842019 Impact of Inflation on Purchasing Power
httpslidepdfcomreaderfullimpact-of-inflation-on-purchasing-power 2934
Based on the above analysis the emerging economies have made big progress inenhancing the international purchasing power of their citizens thanks to increases of international trade employment and work force productivity Having said that the gap
of incomes between citizens of developed and developing countries are still quite large asshown in the Table 2 Additionally the consequences of environmental damages andincreased energy consumptions in developing countries due to rapid industrialization may be debatable issues
842019 Impact of Inflation on Purchasing Power
httpslidepdfcomreaderfullimpact-of-inflation-on-purchasing-power 3034
Conclusion
Exchange rate pricesinflation and wage level influence the purchasing power of consumers in domestic and international markets The domestic purchasing power ismainly affected by the inflation rate of individual countries and it is relatively equitableacross mature economies The international purchasing power is more volatile and isaffected by both exchange rate and prices Wage changes can further compensate or deprive purchasing power of consumers Analysis of current exchange rates prices andwages leads to the belief that foreign shoppers can get better bargains in Japan and theUS at the present time Consumers in emerging economies especially China and Russiahave experienced significant improvement in purchasing power recently when compared
to themselves They may catch up with the living standard of rich countries in the futureif this growth rate sustains Finally it will be interesting to research the fundamentaleconomic forces which influence the gauges that are measured in the articleWhen prices are rising you can buy less with a given amount of money When hotdogsare expensive a given amount of money will buy a small number of hotdogs But whenhotdogs are inexpensive that is the price is low your given hot dog allowance will purchase a lot more satisfaction There is a relationship between prices and purchasing power that is a reciprocal relationship and thatrsquos the relationship that wersquore going to bestudying in this lesson When prices are going from low prices to high prices that iswhen there is inflation in the economy the value of the dollar is shrinking that is your Purchasing power is going from being able to buy a lot to being able to buy a little Inthis lesson Irsquom going to begin by giving a simple numerical example and then wersquoll talk about how you can use the GDP deflator to show the relationship between the inflationrate and purchasing power
Letrsquos start by assuming that we are in a period of inflation and letrsquos let hotdogs be arepresentative good that is the price of all goods and services across the economy isincreasing at some general rate and wersquore going to look at the price of hotdogs in order toinfer what is happening to purchasing power as prices are rising Wersquore going to befocusing now on the reciprocal relationship between the price level and the purchasing power of the dollar that is what a dollar will buy as the price level is changing And Irsquovewritten out here as clearly as I can the formula that shows this reciprocal relationship thatis one over the price level equals the purchasing power of a dollar Let me make thisvery clear Letrsquos suppose that the price of a hotdog is five cents Well whatrsquos the purchasing power of your dollar Five cents is the same thing as one twentieth of adollar Therefore the reciprocal of one twentieth is twenty Your dollar will buy twentyhotdogs Thatrsquos its purchasing power
842019 Impact of Inflation on Purchasing Power
httpslidepdfcomreaderfullimpact-of-inflation-on-purchasing-power 3134
Now suppose wersquore in a period of inflation so that prices are rising and the price of ahotdog goes up to two dollars Whatrsquos happened to your purchasing power Well your dollar will no longer buy even a whole hotdog Two dollars or 2 has a reciprocal of onehalf that is you can now only afford half a hotdog Your purchasing power has shrunk from twenty hotdogs at a price of five cents a piece to one half a hotdog whenever the
price is two dollars per hotdog This simple example makes clear that the price level andthe purchasing power of the dollar are reciprocals
Now letrsquos look at some examples using the GDP deflator Suppose that wersquore in the year 2000 which is our base year for calculating the GDP deflator and we calculate the priceof a market basket of goods and services- that is a little bit of Housing and a little bit of transportation a little bit of medical care a little bit of clothingetc And wersquore going to call the price level in the year 2000 one hundred because itrsquos our base year
We look at those prices again in 2002 and we find that the price of the goods and
services as a ratio of the same prices in 2000 is equal to 104 That is prices haveincreased by about 4 percent between the year 2000 and 2002 So if we write the GDPdeflator not in the form we usually write it that is multiplied by 100 to get 104 but letrsquoswrite it now as in hundredths 104 to show the 4 percent increase in prices between theyear 2000 and 2002 Well whatrsquos happened to the purchasing power of a dollar betweenthe year 2000 and 2002 That is how much can we afford to buy in 2002 with a dollar if we measure it in the prices of the year 2000 Prices are higher in 2002 therefore thedollar wonrsquot buy as much Well if you takethe reciprocal of the GDP deflator 104 you get 096 Whatrsquos that saying Itrsquos saying thatwhat you could have bought for 96 cents back in the year 2000 now it costs you a dollar to buy in 2002 That is a dollar in 2002 is only worth what 96 cents was worth back inthe year 2000 You can afford to buy less Your purchasing power has shrunk by about 4 percent Your purchasing power shrinks at the same rate that the price level increases because the price level and your purchasing power are reciprocals of each other
Well letrsquos take another example during a period of deflation If we look at the years between 1929 and 1933 wersquoll see falling prices If we choose 1929 as the base year andif we call the price level in that 200000 or 100 if we look at prices in 1933 during thegreat depression we see that the price level has fallen by about 24 percent That is wersquovegone from 100 down to 076 So we now have lower prices in 1933 than we had in 1929
Now what does that mean What is going to happen to the purchasing power of your dollar when prices are lower Itrsquos clearly going to increase Yoursquore going to go from asmall purchasing power to a bigger purchasing power And if you takethe reciprocal of 76 percent you get 132 That is the purchasing power of the dollar hasincreased by about 32 percent in this example Now the reason the numbers donrsquot add upexactly the reason I canrsquot say a 24 percent decrease in prices is equal to a 24 percentincrease in purchasing power is because once your percentages start getting large yourun into this problem that a fifty percent increase is sorry that a 100 percent increase isthe reciprocal of a 50 percent decrease you wind up with this problem that wersquove
842019 Impact of Inflation on Purchasing Power
httpslidepdfcomreaderfullimpact-of-inflation-on-purchasing-power 3234
discussed earlier about the calculation of percentage changes but you can still use thisformula any time it always works One over the price level gives you the purchasing power of the dollar and when the price level is only 76 percent what it was before your purchasing power is going to be 132 percent of what it was before Falling prices give us an increase in the purchasing power of the dollar
842019 Impact of Inflation on Purchasing Power
httpslidepdfcomreaderfullimpact-of-inflation-on-purchasing-power 3334
REFERENCES
1 httpwwwworldsalariesorg
2 International Monetary Fund World Economic Outlook Database September
2006
3 Website of Australian Bureau of Statistics
4 Website of Blanco de Mexico
5 Website of Bank of England
6 Website of Central Bank of Brazil
7 Website of European Central bank
8 Website of International Organization of Labor
9 Website of the Labor Department of India
10 Website of the Ministry of Economics and Planning of Saudi Arabia
11 Website of the Ministry of Finance of the Russian Federation
12 Website of National Bureau of Statistics of China
13 Website of Statistics Bureau of Japan
14 Website of Statistics Canada
15 Website of Statistics South Africa
16 Website of the United States Labor Department
17 Website of Wikipedia on purchasing power parity and consumer price index
842019 Impact of Inflation on Purchasing Power
httpslidepdfcomreaderfullimpact-of-inflation-on-purchasing-power 3434
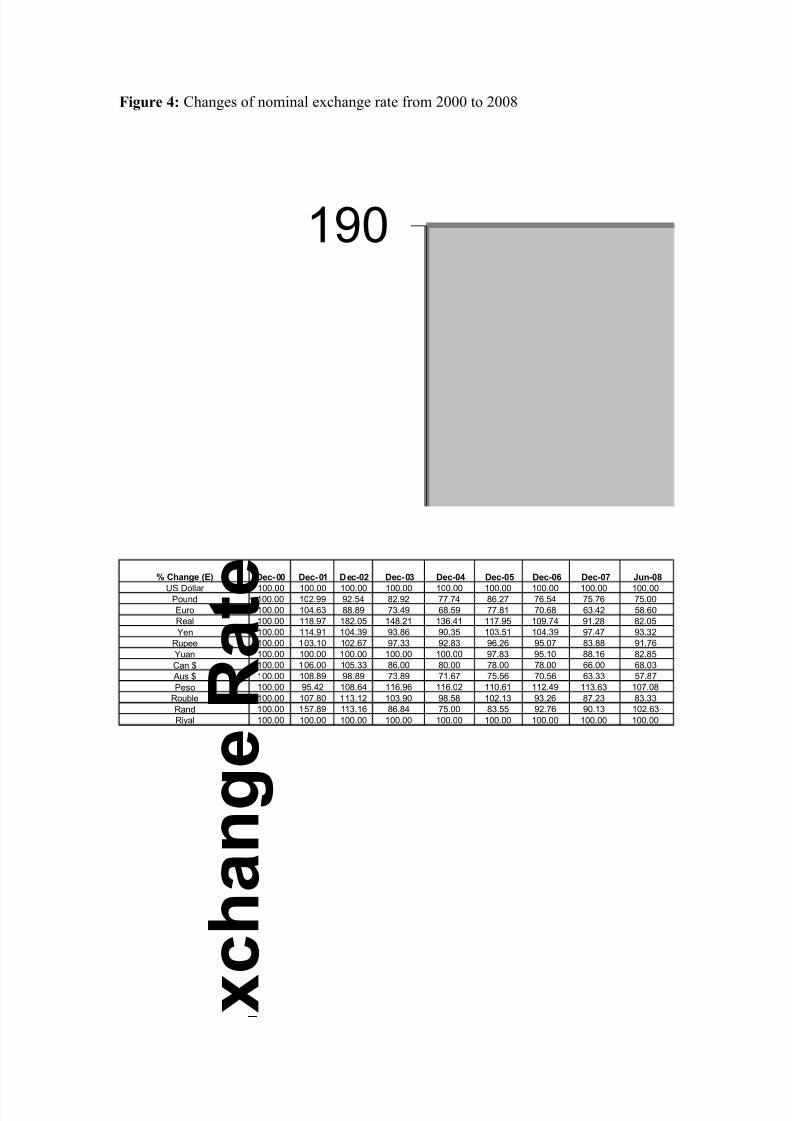
842019 Impact of Inflation on Purchasing Power
httpslidepdfcomreaderfullimpact-of-inflation-on-purchasing-power 1834
Figure 4 Changes of nominal exchange rate from 2000 to 2008
190
x c h a n g e R a t e
Change (E) Dec-00 Dec-01 Dec-02 Dec-03 Dec-04 Dec-05 Dec-06 Dec-07 Jun-08
US Dollar 10000 10000 10000 10000 10000 10000 10000 10000 10000Pound 10000 10299 9254 8292 7774 8627 7654 7576 7500Euro 10000 10463 8889 7349 6859 7781 7068 6342 5860Real 10000 11897 18205 14821 13641 11795 10974 9128 8205
Yen 10000 11491 10439 9386 9035 10351 10439 9747 9332
Rupee 10000 10310 10267 9733 9283 9626 9507 8388 9176
Yuan 10000 10000 10000 10000 10000 9783 9510 8816 8285
Can $ 10000 10600 10533 8600 8000 7800 7800 6600 6803
Aus $ 10000 10889 9889 7389 7167 7556 7056 6333 5787
Peso 10000 9542 10864 11696 11602 11061 11249 11363 10708
Rouble 10000 10780 11312 10390 9858 10213 9326 8723 8333
Rand 10000 15789 11316 8684 7500 8355 9276 9013 10263
Riyal 10000 10000 10000 10000 10000 10000 10000 10000 10000
842019 Impact of Inflation on Purchasing Power
httpslidepdfcomreaderfullimpact-of-inflation-on-purchasing-power 1934
Figure 5 Changes of real (CPI) exchange rate from 2000 to 2008
170
a n g e R a t e Change (e) Dec-00 Dec-01 Dec-02 Dec-03 Dec-04 Dec-05 Dec-06 Dec-07 Jun-08
United States 10000 10000 10000 10000 10000 10000 10000 10000 10000
United Kingdom 10000 10348 9361 8458 8071 9071 8029 8107 NA
European Union 10000 10412 8854 7313 6885 7902 7221 6543 6120
Brazil 10000 11221 15746 12122 10882 9343 8722 7327 6550
Japan 10000 11750 11025 10130 10069 11965 12336 11988 11675
India 10000 10082 9869 9166 8711 8957 8637 7442 7922China 10000 10085 10408 10477 10412 10348 10162 9155 NA
Canada 10000 10687 10466 8529 8022 7924 7992 6875 7213
Australia 10000 10723 9677 7196 7025 7450 6909 6270 5832
Mexico 10000 9282 10235 10797 10513 10031 10053 10186 9703
Russia 10000 9018 8365 6887 6081 5784 4939 4410 3830
South Africa 10000 15170 10195 7533 6626 7383 8029 7582 8434
Saudi Arabia 10000 10269 10492 10624 10937 11231 11267 11263 10707
842019 Impact of Inflation on Purchasing Power
httpslidepdfcomreaderfullimpact-of-inflation-on-purchasing-power 2034
Figure 6 Wage increase in different countries from 2000 to 2008 (source ref 1 3 to 14)
670
s e
Wage Increase 2000 2001 2002 2003 2004 2005 2006 2007 2008
United States 000 359 479 684 1060 1265 1658 1966 2291
United Kingdom 000 342 724 1125 1624 2055 2554 3033 3209European Union 000 267 531 750 955 1159 1405 1617 NA
Brazil 000 826 1551 1163 1050 1276 1839 5068 5720
Japan 000 -096 -385 -395 -472 -375 -279 -308 -1992
India 000 253 580 967 1379 2387 2929 3688 4123
China 000 1608 3257 4967 7058 9501 12347 NA NA
Canada 000 142 356 497 718 1063 1393 1758 2044
Australia 000 330 692 1087 1422 2021 2577 3073 3158
Mexico 000 1258 2010 2875 3480 4232 5140 -3118 NA
Russia 000 4575 9613 14737 20319 28484 37836 51147 66631
South Africa 000 956 2134 2613 3802 3988 5251 NA NA
842019 Impact of Inflation on Purchasing Power
httpslidepdfcomreaderfullimpact-of-inflation-on-purchasing-power 2134
Figure 7 Relative purchasing power parity from 2000 to 2008 after adjusting for wage
increase
12
13
e
s
Rel PPP adj for
wage 2000 2001 2002 2003 2004 2005 2006 2007 2008
United States 1000 1000 1000 1000 1000 1000 1000 1000 1000
United Kingdom 1000 0997 0966 0941 0916 0889 0885 0858 0000
European Union 1000 1014 0998 0997 1002 0989 0993 0988 NA
Brazil 1000 1014 1049 1170 1255 1261 1239 0989 0979
Japan 1000 1023 1032 1031 1042 1013 1015 1004 1227
India 1000 1033 1030 1034 1036 0977 0993 0985 1008
China 1000 0885 0759 0681 0623 0546 0488 0448 NA
Canada 1000 1013 1018 1026 1029 1002 0999 0977 0962
Australia 1000 1018 1002 0989 0988 0950 0947 0925 0927
Mexico 1000 0946 0926 0899 0905 0873 0862 1940 NA
Russia 1000 0850 0723 0652 0591 0517 0460 0387 0349
South Africa 1000 0984 0959 0976 0907 0911 0883 NA NA
842019 Impact of Inflation on Purchasing Power
httpslidepdfcomreaderfullimpact-of-inflation-on-purchasing-power 2234
Figure 8 Real exchange rate from 2000 to 2008 after adjusting for wage increase
1600
g e s Change e adj for
Wage 2000 2001 2002 2003 2004 2005 2006 2007
United States 10 000 10000 10000 100 00 10 000 1000 0 100 00 10000
United Kingdom 10000 10364 9147 8122 7679 8476 7456 7443
European Union 10000 10505 8804 7255 6929 7938 7327 6673Brazil 10000 10737 14285 11602 10891 9334 8588 5818Japan 10000 12290 12015 11267 11687 14004 14794 14800India 10000 10186 9774 8929 8467 8146 7787 6506China 10000 8999 8226 7479 6751 5978 5302 4260
Canada 10000 10916 10589 8681 8278 8068 8177 6997Australia 10000 10753 9484 6934 6802 6982 6405 5739Mexico 10000 8540 8929 8959 8626 7940 7741 NARussia 10000 6409 4469 2974 2218 1693 1204 863
South Africa 10000 14343 8804 6381 5309 5946 6137 NA
842019 Impact of Inflation on Purchasing Power
httpslidepdfcomreaderfullimpact-of-inflation-on-purchasing-power 2334
Table 1 Market exchange rate from 2000 to 2008
Nominal Exchange Rate (E) Dec-00 Dec-01 Dec-02 Dec-03 Dec-04 Dec-05 Dec-06 Dec-07 Jun-08US Dollar 10 10 10 10 10 10 10 10 10
British Pound 07 07 06 06 05 06 05 05 05Euro 11 11 10 08 07 08 08 07 06
Brazilian Real 20 23 36 29 27 23 21 18 16
Japanese Yen 1140 1310 1190 1070 1030 1180 1190 1111 1064Indian Rupee 468 482 480 455 434 450 444 392 429
Chinese Yuan 83 83 83 83 83 81 79 73 69
Canadian Dollar 15 16 16 13 12 12 12 10 10Australian Dollar 18 20 18 13 13 14 13 11 10
Mexico Peso 96 92 104 112 112 106 108 109 103
Russian Rouble 282 304 319 293 278 288 263 246 235South African Rand 76 120 86 66 57 64 71 69 78
Saudi Arabian Riyal 38 38 38 38 38 38 38 38 38
Table 2 Weekly Wages from 2000 to 2008
Weekly Wage (in US$) 2000 2001 2002 2003 2004 2005 2006 2007 2008United States 5850 6060 6130 6250 6470 6590 6820 7000 7190
United Kingdom 5286 5309 6126 7093 7905 7386 8670 9094 9310
European Union 3635 3567 4310 5327 5825 5239 5909 6725 00
Brazil 983 894 624 740 796 939 1060 1622 1883
Japan 6636 5719 6112 6791 6998 6170 6180 6599 5694
India 144 143 148 162 176 185 196 235 221
China 217 252 287 324 370 432 509 632 00
Canada 4370 4182 4297 5334 5855 6199 6384 7786 7738
Australia 3737 3545 4040 5608 5956 5946 6661 7714 8497
Mexico 771 910 853 849 896 993 1038
Russia 197 266 342 469 606 743 1011 1381 1812
South Africa 1641 1139 1760 2384 3021 2748 2699
Note The EU wage is an average of Germany France Italy and Spain
842019 Impact of Inflation on Purchasing Power
httpslidepdfcomreaderfullimpact-of-inflation-on-purchasing-power 2434
PURCHASING POWER PARITY
The purchasing power parity (PPP) theory uses the long-term equilibrium exchange
rate of two currencies to equalize their purchasing power Developed by Gustav Cassel in1920 it is based on the law of one price the theory states that in ideally efficientmarkets identical goods should have only one price
This purchasing power SEM rate equalizes the purchasing power of different currenciesin their home countries for a given basket of goods Using a PPP basis is arguably moreuseful when comparing differences in living standards on the whole between nations because PPP takes into account the relative cost of living and the inflation rates of different countries rather than just a nominal gross domestic product (GDP) comparisonThe best-known and most-used purchasing power parity exchange rate is the Geary-Khakis dollar (the international dollar)
PPP exchange rates (the real exchange rate) fluctuations are mostly due to marketexchange rates movements Aside from this volatility consistent deviations of the marketand PPP exchange rates are observed for example (market exchange rate) prices of non-traded goods and services are usually lower where incomes are lower (A US dollar exchanged and spent in India will buy more haircuts than a dollar spent in the UnitedStates) PPP takes into account this lower cost of living and adjusts for it as though allincome was spent locally In other words PPP is the amount of a certain basket of basicgoods which can be bought in the given country with the money it produces
There can be marked differences between PPP and market exchange rates [1] For
example the World Banks World Development Indicators 2005 estimated that in 2003one United States dollar was equivalent to about 18 Chinese Yuan by purchasing power parity [2] - considerably different from the nominal exchange rate that put one dollar equalto 76 Yuan This discrepancy has large implications for instance GDP per capita in thePeoples Republic of China is about US$1800 while on a PPP basis it is about US$7204This is frequently used to assert that China is the worlds second-largest economy butsuch a calculation would only be valid under the PPP theory At the other extremeJapans nominal GDP per capita is around US$37600 but its PPP figure is onlyUS$30615
842019 Impact of Inflation on Purchasing Power
httpslidepdfcomreaderfullimpact-of-inflation-on-purchasing-power 2534
First letrsquos look at the situation of domestic buying Gustav Cassel developed the purchasing power parity (PPP) theory in 1920 to compare the purchasing power of different currencies in their home countries based on the assumption that identical goodsshould have the same price (law of one price) PPP exchange rate is defined in Equation1
For
Dom
P
P PPP = (Eq 1)
Where PDom is domestic price and PFor is foreign price
The relative purchasing power parity relates the inflation rate (change of prices) in eachcountry to the change in the market exchange rate and is given in Equation 2
Dom
t
Dom
t
For t
For t
rel
P P
P P PPP
1
1
minus
minus
= (Eq 2)
Where Pt is the price level in period t To calculate the relative purchasing power parityof all of the goods and services consumed in a country we can substitute P t with theconsumer price index (CPI) of that country which leads to Equation 3
Dom
t
Dom
t
For
t
For
t
rel
CPI CPI
CPI CPI PPP
1
1
minus
minus
= (Eq 3)
Figure 1 shows the consumer price indexes of thirteen relatively large countries or economies The inflation rate is higher in the emerging economies than in the developedcountries because of the higher rate of economic growth
Figure 2 shows the changes in relative purchasing power parity of the above economiescalculated by Equation 3 By this calculation one may conclude that the US dollar hasappreciated against the Mexican Indian South African Brazilian and Russian currencies
by 10 to 217 while depreciated against the Australian European Canadian BritishChinese and Saudi Arabian currencies by 1 to 10 from 2000 to 2008 if theconsumptions are domestic This can be attributed to the difference in inflation rate of these countries Japanrsquos disinflation condition between 2000 and 2008 caused the USdollar to weaken approximately 20 over the same time period
842019 Impact of Inflation on Purchasing Power
httpslidepdfcomreaderfullimpact-of-inflation-on-purchasing-power 2634
The International Monetary Fund (IMF) has conducted similar calculation that includesmore factors such as gross domestic product (GDP) The PPP exchange rates published by the IMF are displayed in the following Figure 3 The data shown in Figure 2 areconsistent with the IMF data
It was recognized by many economists that the PPP exchange rate calculation is not perfect because of the difficulties in finding the same baskets of goods to compare acrosscountries The weighing of goods and services in the CPI index is not identical amongdifferent countries Often times the quality of goods and service purchased variesconsiderably for example Americans probably drive better cars and drink cleaner water than many people in developing countries Moreover many social benefits offered bythe welfare countries may not be included in the CPI calculations and this makes directcomparison of purchasing power difficult Nevertheless this methodology gives us arough idea how consumers are doing in different economies
REAL EXCHANGE RATE IN INTERNATIONAL TRADE
When consumers or businesses purchase goods and services from foreign countries theywill need to exchange the available domestic currency to foreign currencies in order tofulfill the trade The price of one currency in terms of another currency is called theexchange rate and it is determined by the currency market and in some cases by
individual governments The exchange rates of twelve foreign currencies to the USdollar from 2000 to 2008 are shown in Table 1 The US dollar depreciated against mostcurrencies in terms of market exchange rate after 2002 except for the Mexican Peso andBrazilian Real (until 2006)
Many people misunderstand the real prices if only the nominal (market) exchange rate isconsidered for the trade For example a three-bedroom apartment in China costs about1500000 Yuan while a similar apartment in the US cost about 400000 Dollar A post-doctorate position in Oxford University in England is paid about 40000 Pound per year
while a similar position in Massachusetts Institute of Technology in the US is paid60000 Dollar per year The market exchange rates do not reflect the real difference of the prices Therefore the real exchange rate which considers both the nominal exchangerate and prices should be used for international trade The real exchange rate is definedin Equation 4
For
Dom
P
P E Rate Exchangeal min Noe Rate Exchangeal Re times= )()( (Eq 4)
842019 Impact of Inflation on Purchasing Power
httpslidepdfcomreaderfullimpact-of-inflation-on-purchasing-power 2734
where PDom is domestic price and PFor is foreign price Using the above two examplesthe real exchange rates would be 18 Chinese apartment = 1 American apartment and075 Oxford salary = 1 MIT salary in 2008
If we substitute prices with CPI indexes in the above equation the real exchange for allthe goods and services can be estimated by Equation 5
For
Dom
CPI
CPI E e times= (Eq 5)
Figure 4 and Figure 5 show the percent changes of nominal exchange rate and real (CPI)exchange rate from 2000 to 2008 and the values are not the same When inflation (price
change) rates are taken into account the dollar actually strengthens against the JapaneseYen and Saudi Arabian Riyal while the advantage over the Peso and the Real (until 2005)diminished The magnitude of depreciation of the US dollar against the British Poundthe Euro the Canadian Dollar and the Chinese Yuan is 2-5 better in the real rate thanin the nominal rate On the other hand the dollar depreciated more against the IndianRupee the South African Rand (after 2002) and the Russian Ruble in the real rate than inthe nominal rate The real rate and the nominal rate for the Australian dollar are verysimilar This analysis indicates that one would make different decisions in buyingforeign goods and services when using the real exchange rate versus the nominalexchange rate
In addition if we compare the data in Figure 2 and Figure 5 it is obvious that the PPPexchange rate fluctuates less dramatically than the foreign exchange rate (except theRussian Ruble) In other words foreign exchange rates affect international trade morethan domestic consumption
WAGE FACTOR
Most consumers except the unemployed and retirees earn wages to make a livingEmployers usually give employees a small wages increase every year to offset inflationFigure 6 shows the percentage of wage increase in different countries The wage increasein the US EU and India is a few percent less than inflation over eight years while thewages in Canada Brazil and Australia outpaced inflation by a few percents in the same period The wage increase in UK Mexico South Africa China and Russia is even faster
842019 Impact of Inflation on Purchasing Power
httpslidepdfcomreaderfullimpact-of-inflation-on-purchasing-power 2834
double to triple digits gain over inflation is observed in these nations Japanrsquos wage isstagnant (or dropping slightly) from 2000 to 2008 It is unclear what exactly causes thesedifferences one may speculate that it may relate to the fiscal condition and account balance of the nations as well as how the governments want to regulate their economyFor example commodity producing countries is benefited from the recent purge of
commodity prices China has a large trade surplus the Japanese prices may have comedown from a very high level from decays ago It will be interested to see how the fastwage increase in some nations would impact their inflation situation in the future
The difference in wage changes certainly would have an impact to consumerrsquos purchasing power If we modify Equation 3 and Equation 5 for calculating relative PPPand real (CPI) exchange rate by a wage factor the following equations will results
For
t
For
t
Dom
t
Dom
t
Dom
t
Dom
t
For
t
For
t
rel
W W
W W
CPI CPI
CPI CPI PPP
1
1
1
1
minus
minus
minus
minus
times= (Eq 6)
For
Dom
For
Dom
W
W
CPI
CPI E e timestimes= (Eq 7)
where W denotes wages Using this modified calculation both domestic and foreign purchasing power will change Figure 7 and Figure 8 shows the relative PPP and realexchange rate after adjusting for wage increase After adjusting for wages the relativePPP become almost the same for the US EU Canada Japan (until 2007) India andBrazil (after 2006) Australia UK South Africa Mexico become the out performerswhich is not the case without adjusting for wages China and Russia demonstrate the bestimprovement in relative PPP because of the large increase of their wages
After adjusting for wages the buying power of Americans in international marketsweakens further relative to most foreign consumers except the Japanese Meanwhile thedepreciation of the US dollar against the Euro is about 5 less than before adjustment(using the 2008 figure) because of the wage advantage for Americans As pointed outearlier there are pitfalls for direct cross-comparison using the CPI index Additionallyother factors such as taxation may complicate the purchasing power calculation For example American income taxes are less than many industrialized countries while poorer nations probably donrsquot tax on income as much
842019 Impact of Inflation on Purchasing Power
httpslidepdfcomreaderfullimpact-of-inflation-on-purchasing-power 2934
Based on the above analysis the emerging economies have made big progress inenhancing the international purchasing power of their citizens thanks to increases of international trade employment and work force productivity Having said that the gap
of incomes between citizens of developed and developing countries are still quite large asshown in the Table 2 Additionally the consequences of environmental damages andincreased energy consumptions in developing countries due to rapid industrialization may be debatable issues
842019 Impact of Inflation on Purchasing Power
httpslidepdfcomreaderfullimpact-of-inflation-on-purchasing-power 3034
Conclusion
Exchange rate pricesinflation and wage level influence the purchasing power of consumers in domestic and international markets The domestic purchasing power ismainly affected by the inflation rate of individual countries and it is relatively equitableacross mature economies The international purchasing power is more volatile and isaffected by both exchange rate and prices Wage changes can further compensate or deprive purchasing power of consumers Analysis of current exchange rates prices andwages leads to the belief that foreign shoppers can get better bargains in Japan and theUS at the present time Consumers in emerging economies especially China and Russiahave experienced significant improvement in purchasing power recently when compared
to themselves They may catch up with the living standard of rich countries in the futureif this growth rate sustains Finally it will be interesting to research the fundamentaleconomic forces which influence the gauges that are measured in the articleWhen prices are rising you can buy less with a given amount of money When hotdogsare expensive a given amount of money will buy a small number of hotdogs But whenhotdogs are inexpensive that is the price is low your given hot dog allowance will purchase a lot more satisfaction There is a relationship between prices and purchasing power that is a reciprocal relationship and thatrsquos the relationship that wersquore going to bestudying in this lesson When prices are going from low prices to high prices that iswhen there is inflation in the economy the value of the dollar is shrinking that is your Purchasing power is going from being able to buy a lot to being able to buy a little Inthis lesson Irsquom going to begin by giving a simple numerical example and then wersquoll talk about how you can use the GDP deflator to show the relationship between the inflationrate and purchasing power
Letrsquos start by assuming that we are in a period of inflation and letrsquos let hotdogs be arepresentative good that is the price of all goods and services across the economy isincreasing at some general rate and wersquore going to look at the price of hotdogs in order toinfer what is happening to purchasing power as prices are rising Wersquore going to befocusing now on the reciprocal relationship between the price level and the purchasing power of the dollar that is what a dollar will buy as the price level is changing And Irsquovewritten out here as clearly as I can the formula that shows this reciprocal relationship thatis one over the price level equals the purchasing power of a dollar Let me make thisvery clear Letrsquos suppose that the price of a hotdog is five cents Well whatrsquos the purchasing power of your dollar Five cents is the same thing as one twentieth of adollar Therefore the reciprocal of one twentieth is twenty Your dollar will buy twentyhotdogs Thatrsquos its purchasing power
842019 Impact of Inflation on Purchasing Power
httpslidepdfcomreaderfullimpact-of-inflation-on-purchasing-power 3134
Now suppose wersquore in a period of inflation so that prices are rising and the price of ahotdog goes up to two dollars Whatrsquos happened to your purchasing power Well your dollar will no longer buy even a whole hotdog Two dollars or 2 has a reciprocal of onehalf that is you can now only afford half a hotdog Your purchasing power has shrunk from twenty hotdogs at a price of five cents a piece to one half a hotdog whenever the
price is two dollars per hotdog This simple example makes clear that the price level andthe purchasing power of the dollar are reciprocals
Now letrsquos look at some examples using the GDP deflator Suppose that wersquore in the year 2000 which is our base year for calculating the GDP deflator and we calculate the priceof a market basket of goods and services- that is a little bit of Housing and a little bit of transportation a little bit of medical care a little bit of clothingetc And wersquore going to call the price level in the year 2000 one hundred because itrsquos our base year
We look at those prices again in 2002 and we find that the price of the goods and
services as a ratio of the same prices in 2000 is equal to 104 That is prices haveincreased by about 4 percent between the year 2000 and 2002 So if we write the GDPdeflator not in the form we usually write it that is multiplied by 100 to get 104 but letrsquoswrite it now as in hundredths 104 to show the 4 percent increase in prices between theyear 2000 and 2002 Well whatrsquos happened to the purchasing power of a dollar betweenthe year 2000 and 2002 That is how much can we afford to buy in 2002 with a dollar if we measure it in the prices of the year 2000 Prices are higher in 2002 therefore thedollar wonrsquot buy as much Well if you takethe reciprocal of the GDP deflator 104 you get 096 Whatrsquos that saying Itrsquos saying thatwhat you could have bought for 96 cents back in the year 2000 now it costs you a dollar to buy in 2002 That is a dollar in 2002 is only worth what 96 cents was worth back inthe year 2000 You can afford to buy less Your purchasing power has shrunk by about 4 percent Your purchasing power shrinks at the same rate that the price level increases because the price level and your purchasing power are reciprocals of each other
Well letrsquos take another example during a period of deflation If we look at the years between 1929 and 1933 wersquoll see falling prices If we choose 1929 as the base year andif we call the price level in that 200000 or 100 if we look at prices in 1933 during thegreat depression we see that the price level has fallen by about 24 percent That is wersquovegone from 100 down to 076 So we now have lower prices in 1933 than we had in 1929
Now what does that mean What is going to happen to the purchasing power of your dollar when prices are lower Itrsquos clearly going to increase Yoursquore going to go from asmall purchasing power to a bigger purchasing power And if you takethe reciprocal of 76 percent you get 132 That is the purchasing power of the dollar hasincreased by about 32 percent in this example Now the reason the numbers donrsquot add upexactly the reason I canrsquot say a 24 percent decrease in prices is equal to a 24 percentincrease in purchasing power is because once your percentages start getting large yourun into this problem that a fifty percent increase is sorry that a 100 percent increase isthe reciprocal of a 50 percent decrease you wind up with this problem that wersquove
842019 Impact of Inflation on Purchasing Power
httpslidepdfcomreaderfullimpact-of-inflation-on-purchasing-power 3234
discussed earlier about the calculation of percentage changes but you can still use thisformula any time it always works One over the price level gives you the purchasing power of the dollar and when the price level is only 76 percent what it was before your purchasing power is going to be 132 percent of what it was before Falling prices give us an increase in the purchasing power of the dollar
842019 Impact of Inflation on Purchasing Power
httpslidepdfcomreaderfullimpact-of-inflation-on-purchasing-power 3334
REFERENCES
1 httpwwwworldsalariesorg
2 International Monetary Fund World Economic Outlook Database September
2006
3 Website of Australian Bureau of Statistics
4 Website of Blanco de Mexico
5 Website of Bank of England
6 Website of Central Bank of Brazil
7 Website of European Central bank
8 Website of International Organization of Labor
9 Website of the Labor Department of India
10 Website of the Ministry of Economics and Planning of Saudi Arabia
11 Website of the Ministry of Finance of the Russian Federation
12 Website of National Bureau of Statistics of China
13 Website of Statistics Bureau of Japan
14 Website of Statistics Canada
15 Website of Statistics South Africa
16 Website of the United States Labor Department
17 Website of Wikipedia on purchasing power parity and consumer price index
842019 Impact of Inflation on Purchasing Power
httpslidepdfcomreaderfullimpact-of-inflation-on-purchasing-power 3434
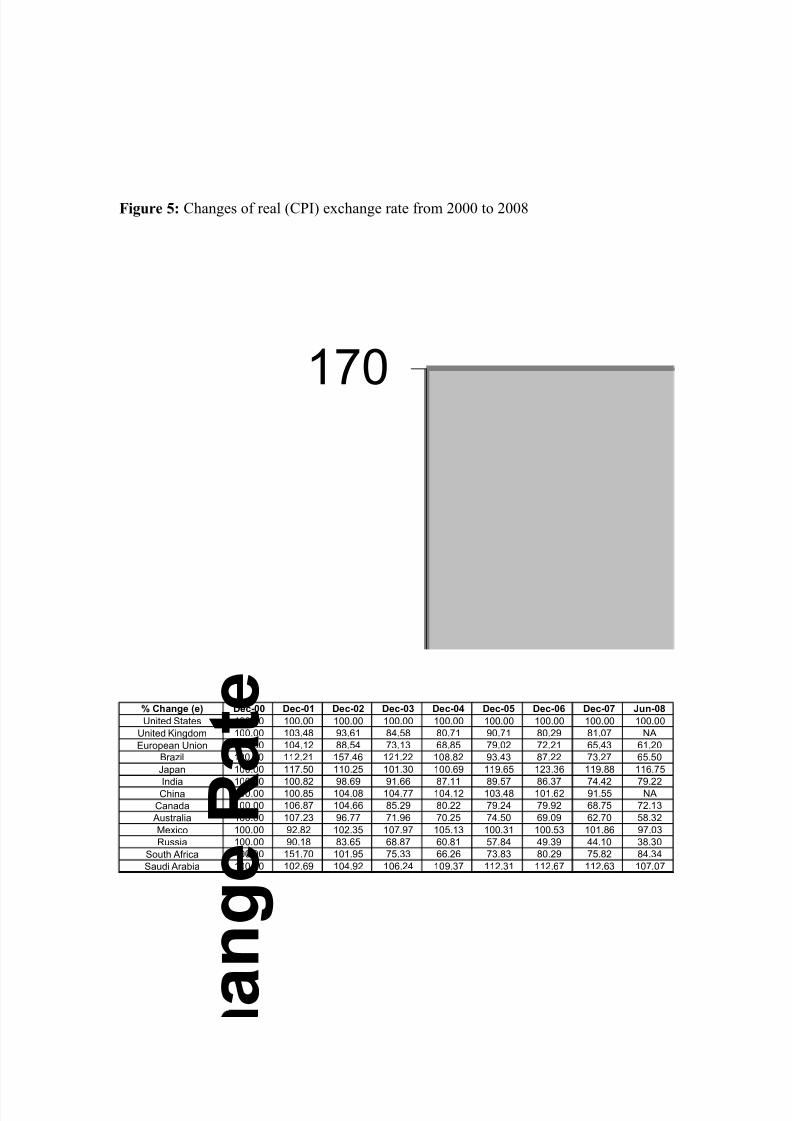
842019 Impact of Inflation on Purchasing Power
httpslidepdfcomreaderfullimpact-of-inflation-on-purchasing-power 1934
Figure 5 Changes of real (CPI) exchange rate from 2000 to 2008
170
a n g e R a t e Change (e) Dec-00 Dec-01 Dec-02 Dec-03 Dec-04 Dec-05 Dec-06 Dec-07 Jun-08
United States 10000 10000 10000 10000 10000 10000 10000 10000 10000
United Kingdom 10000 10348 9361 8458 8071 9071 8029 8107 NA
European Union 10000 10412 8854 7313 6885 7902 7221 6543 6120
Brazil 10000 11221 15746 12122 10882 9343 8722 7327 6550
Japan 10000 11750 11025 10130 10069 11965 12336 11988 11675
India 10000 10082 9869 9166 8711 8957 8637 7442 7922China 10000 10085 10408 10477 10412 10348 10162 9155 NA
Canada 10000 10687 10466 8529 8022 7924 7992 6875 7213
Australia 10000 10723 9677 7196 7025 7450 6909 6270 5832
Mexico 10000 9282 10235 10797 10513 10031 10053 10186 9703
Russia 10000 9018 8365 6887 6081 5784 4939 4410 3830
South Africa 10000 15170 10195 7533 6626 7383 8029 7582 8434
Saudi Arabia 10000 10269 10492 10624 10937 11231 11267 11263 10707
842019 Impact of Inflation on Purchasing Power
httpslidepdfcomreaderfullimpact-of-inflation-on-purchasing-power 2034
Figure 6 Wage increase in different countries from 2000 to 2008 (source ref 1 3 to 14)
670
s e
Wage Increase 2000 2001 2002 2003 2004 2005 2006 2007 2008
United States 000 359 479 684 1060 1265 1658 1966 2291
United Kingdom 000 342 724 1125 1624 2055 2554 3033 3209European Union 000 267 531 750 955 1159 1405 1617 NA
Brazil 000 826 1551 1163 1050 1276 1839 5068 5720
Japan 000 -096 -385 -395 -472 -375 -279 -308 -1992
India 000 253 580 967 1379 2387 2929 3688 4123
China 000 1608 3257 4967 7058 9501 12347 NA NA
Canada 000 142 356 497 718 1063 1393 1758 2044
Australia 000 330 692 1087 1422 2021 2577 3073 3158
Mexico 000 1258 2010 2875 3480 4232 5140 -3118 NA
Russia 000 4575 9613 14737 20319 28484 37836 51147 66631
South Africa 000 956 2134 2613 3802 3988 5251 NA NA
842019 Impact of Inflation on Purchasing Power
httpslidepdfcomreaderfullimpact-of-inflation-on-purchasing-power 2134
Figure 7 Relative purchasing power parity from 2000 to 2008 after adjusting for wage
increase
12
13
e
s
Rel PPP adj for
wage 2000 2001 2002 2003 2004 2005 2006 2007 2008
United States 1000 1000 1000 1000 1000 1000 1000 1000 1000
United Kingdom 1000 0997 0966 0941 0916 0889 0885 0858 0000
European Union 1000 1014 0998 0997 1002 0989 0993 0988 NA
Brazil 1000 1014 1049 1170 1255 1261 1239 0989 0979
Japan 1000 1023 1032 1031 1042 1013 1015 1004 1227
India 1000 1033 1030 1034 1036 0977 0993 0985 1008
China 1000 0885 0759 0681 0623 0546 0488 0448 NA
Canada 1000 1013 1018 1026 1029 1002 0999 0977 0962
Australia 1000 1018 1002 0989 0988 0950 0947 0925 0927
Mexico 1000 0946 0926 0899 0905 0873 0862 1940 NA
Russia 1000 0850 0723 0652 0591 0517 0460 0387 0349
South Africa 1000 0984 0959 0976 0907 0911 0883 NA NA
842019 Impact of Inflation on Purchasing Power
httpslidepdfcomreaderfullimpact-of-inflation-on-purchasing-power 2234
Figure 8 Real exchange rate from 2000 to 2008 after adjusting for wage increase
1600
g e s Change e adj for
Wage 2000 2001 2002 2003 2004 2005 2006 2007
United States 10 000 10000 10000 100 00 10 000 1000 0 100 00 10000
United Kingdom 10000 10364 9147 8122 7679 8476 7456 7443
European Union 10000 10505 8804 7255 6929 7938 7327 6673Brazil 10000 10737 14285 11602 10891 9334 8588 5818Japan 10000 12290 12015 11267 11687 14004 14794 14800India 10000 10186 9774 8929 8467 8146 7787 6506China 10000 8999 8226 7479 6751 5978 5302 4260
Canada 10000 10916 10589 8681 8278 8068 8177 6997Australia 10000 10753 9484 6934 6802 6982 6405 5739Mexico 10000 8540 8929 8959 8626 7940 7741 NARussia 10000 6409 4469 2974 2218 1693 1204 863
South Africa 10000 14343 8804 6381 5309 5946 6137 NA
842019 Impact of Inflation on Purchasing Power
httpslidepdfcomreaderfullimpact-of-inflation-on-purchasing-power 2334
Table 1 Market exchange rate from 2000 to 2008
Nominal Exchange Rate (E) Dec-00 Dec-01 Dec-02 Dec-03 Dec-04 Dec-05 Dec-06 Dec-07 Jun-08US Dollar 10 10 10 10 10 10 10 10 10
British Pound 07 07 06 06 05 06 05 05 05Euro 11 11 10 08 07 08 08 07 06
Brazilian Real 20 23 36 29 27 23 21 18 16
Japanese Yen 1140 1310 1190 1070 1030 1180 1190 1111 1064Indian Rupee 468 482 480 455 434 450 444 392 429
Chinese Yuan 83 83 83 83 83 81 79 73 69
Canadian Dollar 15 16 16 13 12 12 12 10 10Australian Dollar 18 20 18 13 13 14 13 11 10
Mexico Peso 96 92 104 112 112 106 108 109 103
Russian Rouble 282 304 319 293 278 288 263 246 235South African Rand 76 120 86 66 57 64 71 69 78
Saudi Arabian Riyal 38 38 38 38 38 38 38 38 38
Table 2 Weekly Wages from 2000 to 2008
Weekly Wage (in US$) 2000 2001 2002 2003 2004 2005 2006 2007 2008United States 5850 6060 6130 6250 6470 6590 6820 7000 7190
United Kingdom 5286 5309 6126 7093 7905 7386 8670 9094 9310
European Union 3635 3567 4310 5327 5825 5239 5909 6725 00
Brazil 983 894 624 740 796 939 1060 1622 1883
Japan 6636 5719 6112 6791 6998 6170 6180 6599 5694
India 144 143 148 162 176 185 196 235 221
China 217 252 287 324 370 432 509 632 00
Canada 4370 4182 4297 5334 5855 6199 6384 7786 7738
Australia 3737 3545 4040 5608 5956 5946 6661 7714 8497
Mexico 771 910 853 849 896 993 1038
Russia 197 266 342 469 606 743 1011 1381 1812
South Africa 1641 1139 1760 2384 3021 2748 2699
Note The EU wage is an average of Germany France Italy and Spain
842019 Impact of Inflation on Purchasing Power
httpslidepdfcomreaderfullimpact-of-inflation-on-purchasing-power 2434
PURCHASING POWER PARITY
The purchasing power parity (PPP) theory uses the long-term equilibrium exchange
rate of two currencies to equalize their purchasing power Developed by Gustav Cassel in1920 it is based on the law of one price the theory states that in ideally efficientmarkets identical goods should have only one price
This purchasing power SEM rate equalizes the purchasing power of different currenciesin their home countries for a given basket of goods Using a PPP basis is arguably moreuseful when comparing differences in living standards on the whole between nations because PPP takes into account the relative cost of living and the inflation rates of different countries rather than just a nominal gross domestic product (GDP) comparisonThe best-known and most-used purchasing power parity exchange rate is the Geary-Khakis dollar (the international dollar)
PPP exchange rates (the real exchange rate) fluctuations are mostly due to marketexchange rates movements Aside from this volatility consistent deviations of the marketand PPP exchange rates are observed for example (market exchange rate) prices of non-traded goods and services are usually lower where incomes are lower (A US dollar exchanged and spent in India will buy more haircuts than a dollar spent in the UnitedStates) PPP takes into account this lower cost of living and adjusts for it as though allincome was spent locally In other words PPP is the amount of a certain basket of basicgoods which can be bought in the given country with the money it produces
There can be marked differences between PPP and market exchange rates [1] For
example the World Banks World Development Indicators 2005 estimated that in 2003one United States dollar was equivalent to about 18 Chinese Yuan by purchasing power parity [2] - considerably different from the nominal exchange rate that put one dollar equalto 76 Yuan This discrepancy has large implications for instance GDP per capita in thePeoples Republic of China is about US$1800 while on a PPP basis it is about US$7204This is frequently used to assert that China is the worlds second-largest economy butsuch a calculation would only be valid under the PPP theory At the other extremeJapans nominal GDP per capita is around US$37600 but its PPP figure is onlyUS$30615
842019 Impact of Inflation on Purchasing Power
httpslidepdfcomreaderfullimpact-of-inflation-on-purchasing-power 2534
First letrsquos look at the situation of domestic buying Gustav Cassel developed the purchasing power parity (PPP) theory in 1920 to compare the purchasing power of different currencies in their home countries based on the assumption that identical goodsshould have the same price (law of one price) PPP exchange rate is defined in Equation1
For
Dom
P
P PPP = (Eq 1)
Where PDom is domestic price and PFor is foreign price
The relative purchasing power parity relates the inflation rate (change of prices) in eachcountry to the change in the market exchange rate and is given in Equation 2
Dom
t
Dom
t
For t
For t
rel
P P
P P PPP
1
1
minus
minus
= (Eq 2)
Where Pt is the price level in period t To calculate the relative purchasing power parityof all of the goods and services consumed in a country we can substitute P t with theconsumer price index (CPI) of that country which leads to Equation 3
Dom
t
Dom
t
For
t
For
t
rel
CPI CPI
CPI CPI PPP
1
1
minus
minus
= (Eq 3)
Figure 1 shows the consumer price indexes of thirteen relatively large countries or economies The inflation rate is higher in the emerging economies than in the developedcountries because of the higher rate of economic growth
Figure 2 shows the changes in relative purchasing power parity of the above economiescalculated by Equation 3 By this calculation one may conclude that the US dollar hasappreciated against the Mexican Indian South African Brazilian and Russian currencies
by 10 to 217 while depreciated against the Australian European Canadian BritishChinese and Saudi Arabian currencies by 1 to 10 from 2000 to 2008 if theconsumptions are domestic This can be attributed to the difference in inflation rate of these countries Japanrsquos disinflation condition between 2000 and 2008 caused the USdollar to weaken approximately 20 over the same time period
842019 Impact of Inflation on Purchasing Power
httpslidepdfcomreaderfullimpact-of-inflation-on-purchasing-power 2634
The International Monetary Fund (IMF) has conducted similar calculation that includesmore factors such as gross domestic product (GDP) The PPP exchange rates published by the IMF are displayed in the following Figure 3 The data shown in Figure 2 areconsistent with the IMF data
It was recognized by many economists that the PPP exchange rate calculation is not perfect because of the difficulties in finding the same baskets of goods to compare acrosscountries The weighing of goods and services in the CPI index is not identical amongdifferent countries Often times the quality of goods and service purchased variesconsiderably for example Americans probably drive better cars and drink cleaner water than many people in developing countries Moreover many social benefits offered bythe welfare countries may not be included in the CPI calculations and this makes directcomparison of purchasing power difficult Nevertheless this methodology gives us arough idea how consumers are doing in different economies
REAL EXCHANGE RATE IN INTERNATIONAL TRADE
When consumers or businesses purchase goods and services from foreign countries theywill need to exchange the available domestic currency to foreign currencies in order tofulfill the trade The price of one currency in terms of another currency is called theexchange rate and it is determined by the currency market and in some cases by
individual governments The exchange rates of twelve foreign currencies to the USdollar from 2000 to 2008 are shown in Table 1 The US dollar depreciated against mostcurrencies in terms of market exchange rate after 2002 except for the Mexican Peso andBrazilian Real (until 2006)
Many people misunderstand the real prices if only the nominal (market) exchange rate isconsidered for the trade For example a three-bedroom apartment in China costs about1500000 Yuan while a similar apartment in the US cost about 400000 Dollar A post-doctorate position in Oxford University in England is paid about 40000 Pound per year
while a similar position in Massachusetts Institute of Technology in the US is paid60000 Dollar per year The market exchange rates do not reflect the real difference of the prices Therefore the real exchange rate which considers both the nominal exchangerate and prices should be used for international trade The real exchange rate is definedin Equation 4
For
Dom
P
P E Rate Exchangeal min Noe Rate Exchangeal Re times= )()( (Eq 4)
842019 Impact of Inflation on Purchasing Power
httpslidepdfcomreaderfullimpact-of-inflation-on-purchasing-power 2734
where PDom is domestic price and PFor is foreign price Using the above two examplesthe real exchange rates would be 18 Chinese apartment = 1 American apartment and075 Oxford salary = 1 MIT salary in 2008
If we substitute prices with CPI indexes in the above equation the real exchange for allthe goods and services can be estimated by Equation 5
For
Dom
CPI
CPI E e times= (Eq 5)
Figure 4 and Figure 5 show the percent changes of nominal exchange rate and real (CPI)exchange rate from 2000 to 2008 and the values are not the same When inflation (price
change) rates are taken into account the dollar actually strengthens against the JapaneseYen and Saudi Arabian Riyal while the advantage over the Peso and the Real (until 2005)diminished The magnitude of depreciation of the US dollar against the British Poundthe Euro the Canadian Dollar and the Chinese Yuan is 2-5 better in the real rate thanin the nominal rate On the other hand the dollar depreciated more against the IndianRupee the South African Rand (after 2002) and the Russian Ruble in the real rate than inthe nominal rate The real rate and the nominal rate for the Australian dollar are verysimilar This analysis indicates that one would make different decisions in buyingforeign goods and services when using the real exchange rate versus the nominalexchange rate
In addition if we compare the data in Figure 2 and Figure 5 it is obvious that the PPPexchange rate fluctuates less dramatically than the foreign exchange rate (except theRussian Ruble) In other words foreign exchange rates affect international trade morethan domestic consumption
WAGE FACTOR
Most consumers except the unemployed and retirees earn wages to make a livingEmployers usually give employees a small wages increase every year to offset inflationFigure 6 shows the percentage of wage increase in different countries The wage increasein the US EU and India is a few percent less than inflation over eight years while thewages in Canada Brazil and Australia outpaced inflation by a few percents in the same period The wage increase in UK Mexico South Africa China and Russia is even faster
842019 Impact of Inflation on Purchasing Power
httpslidepdfcomreaderfullimpact-of-inflation-on-purchasing-power 2834
double to triple digits gain over inflation is observed in these nations Japanrsquos wage isstagnant (or dropping slightly) from 2000 to 2008 It is unclear what exactly causes thesedifferences one may speculate that it may relate to the fiscal condition and account balance of the nations as well as how the governments want to regulate their economyFor example commodity producing countries is benefited from the recent purge of
commodity prices China has a large trade surplus the Japanese prices may have comedown from a very high level from decays ago It will be interested to see how the fastwage increase in some nations would impact their inflation situation in the future
The difference in wage changes certainly would have an impact to consumerrsquos purchasing power If we modify Equation 3 and Equation 5 for calculating relative PPPand real (CPI) exchange rate by a wage factor the following equations will results
For
t
For
t
Dom
t
Dom
t
Dom
t
Dom
t
For
t
For
t
rel
W W
W W
CPI CPI
CPI CPI PPP
1
1
1
1
minus
minus
minus
minus
times= (Eq 6)
For
Dom
For
Dom
W
W
CPI
CPI E e timestimes= (Eq 7)
where W denotes wages Using this modified calculation both domestic and foreign purchasing power will change Figure 7 and Figure 8 shows the relative PPP and realexchange rate after adjusting for wage increase After adjusting for wages the relativePPP become almost the same for the US EU Canada Japan (until 2007) India andBrazil (after 2006) Australia UK South Africa Mexico become the out performerswhich is not the case without adjusting for wages China and Russia demonstrate the bestimprovement in relative PPP because of the large increase of their wages
After adjusting for wages the buying power of Americans in international marketsweakens further relative to most foreign consumers except the Japanese Meanwhile thedepreciation of the US dollar against the Euro is about 5 less than before adjustment(using the 2008 figure) because of the wage advantage for Americans As pointed outearlier there are pitfalls for direct cross-comparison using the CPI index Additionallyother factors such as taxation may complicate the purchasing power calculation For example American income taxes are less than many industrialized countries while poorer nations probably donrsquot tax on income as much
842019 Impact of Inflation on Purchasing Power
httpslidepdfcomreaderfullimpact-of-inflation-on-purchasing-power 2934
Based on the above analysis the emerging economies have made big progress inenhancing the international purchasing power of their citizens thanks to increases of international trade employment and work force productivity Having said that the gap
of incomes between citizens of developed and developing countries are still quite large asshown in the Table 2 Additionally the consequences of environmental damages andincreased energy consumptions in developing countries due to rapid industrialization may be debatable issues
842019 Impact of Inflation on Purchasing Power
httpslidepdfcomreaderfullimpact-of-inflation-on-purchasing-power 3034
Conclusion
Exchange rate pricesinflation and wage level influence the purchasing power of consumers in domestic and international markets The domestic purchasing power ismainly affected by the inflation rate of individual countries and it is relatively equitableacross mature economies The international purchasing power is more volatile and isaffected by both exchange rate and prices Wage changes can further compensate or deprive purchasing power of consumers Analysis of current exchange rates prices andwages leads to the belief that foreign shoppers can get better bargains in Japan and theUS at the present time Consumers in emerging economies especially China and Russiahave experienced significant improvement in purchasing power recently when compared
to themselves They may catch up with the living standard of rich countries in the futureif this growth rate sustains Finally it will be interesting to research the fundamentaleconomic forces which influence the gauges that are measured in the articleWhen prices are rising you can buy less with a given amount of money When hotdogsare expensive a given amount of money will buy a small number of hotdogs But whenhotdogs are inexpensive that is the price is low your given hot dog allowance will purchase a lot more satisfaction There is a relationship between prices and purchasing power that is a reciprocal relationship and thatrsquos the relationship that wersquore going to bestudying in this lesson When prices are going from low prices to high prices that iswhen there is inflation in the economy the value of the dollar is shrinking that is your Purchasing power is going from being able to buy a lot to being able to buy a little Inthis lesson Irsquom going to begin by giving a simple numerical example and then wersquoll talk about how you can use the GDP deflator to show the relationship between the inflationrate and purchasing power
Letrsquos start by assuming that we are in a period of inflation and letrsquos let hotdogs be arepresentative good that is the price of all goods and services across the economy isincreasing at some general rate and wersquore going to look at the price of hotdogs in order toinfer what is happening to purchasing power as prices are rising Wersquore going to befocusing now on the reciprocal relationship between the price level and the purchasing power of the dollar that is what a dollar will buy as the price level is changing And Irsquovewritten out here as clearly as I can the formula that shows this reciprocal relationship thatis one over the price level equals the purchasing power of a dollar Let me make thisvery clear Letrsquos suppose that the price of a hotdog is five cents Well whatrsquos the purchasing power of your dollar Five cents is the same thing as one twentieth of adollar Therefore the reciprocal of one twentieth is twenty Your dollar will buy twentyhotdogs Thatrsquos its purchasing power
842019 Impact of Inflation on Purchasing Power
httpslidepdfcomreaderfullimpact-of-inflation-on-purchasing-power 3134
Now suppose wersquore in a period of inflation so that prices are rising and the price of ahotdog goes up to two dollars Whatrsquos happened to your purchasing power Well your dollar will no longer buy even a whole hotdog Two dollars or 2 has a reciprocal of onehalf that is you can now only afford half a hotdog Your purchasing power has shrunk from twenty hotdogs at a price of five cents a piece to one half a hotdog whenever the
price is two dollars per hotdog This simple example makes clear that the price level andthe purchasing power of the dollar are reciprocals
Now letrsquos look at some examples using the GDP deflator Suppose that wersquore in the year 2000 which is our base year for calculating the GDP deflator and we calculate the priceof a market basket of goods and services- that is a little bit of Housing and a little bit of transportation a little bit of medical care a little bit of clothingetc And wersquore going to call the price level in the year 2000 one hundred because itrsquos our base year
We look at those prices again in 2002 and we find that the price of the goods and
services as a ratio of the same prices in 2000 is equal to 104 That is prices haveincreased by about 4 percent between the year 2000 and 2002 So if we write the GDPdeflator not in the form we usually write it that is multiplied by 100 to get 104 but letrsquoswrite it now as in hundredths 104 to show the 4 percent increase in prices between theyear 2000 and 2002 Well whatrsquos happened to the purchasing power of a dollar betweenthe year 2000 and 2002 That is how much can we afford to buy in 2002 with a dollar if we measure it in the prices of the year 2000 Prices are higher in 2002 therefore thedollar wonrsquot buy as much Well if you takethe reciprocal of the GDP deflator 104 you get 096 Whatrsquos that saying Itrsquos saying thatwhat you could have bought for 96 cents back in the year 2000 now it costs you a dollar to buy in 2002 That is a dollar in 2002 is only worth what 96 cents was worth back inthe year 2000 You can afford to buy less Your purchasing power has shrunk by about 4 percent Your purchasing power shrinks at the same rate that the price level increases because the price level and your purchasing power are reciprocals of each other
Well letrsquos take another example during a period of deflation If we look at the years between 1929 and 1933 wersquoll see falling prices If we choose 1929 as the base year andif we call the price level in that 200000 or 100 if we look at prices in 1933 during thegreat depression we see that the price level has fallen by about 24 percent That is wersquovegone from 100 down to 076 So we now have lower prices in 1933 than we had in 1929
Now what does that mean What is going to happen to the purchasing power of your dollar when prices are lower Itrsquos clearly going to increase Yoursquore going to go from asmall purchasing power to a bigger purchasing power And if you takethe reciprocal of 76 percent you get 132 That is the purchasing power of the dollar hasincreased by about 32 percent in this example Now the reason the numbers donrsquot add upexactly the reason I canrsquot say a 24 percent decrease in prices is equal to a 24 percentincrease in purchasing power is because once your percentages start getting large yourun into this problem that a fifty percent increase is sorry that a 100 percent increase isthe reciprocal of a 50 percent decrease you wind up with this problem that wersquove
842019 Impact of Inflation on Purchasing Power
httpslidepdfcomreaderfullimpact-of-inflation-on-purchasing-power 3234
discussed earlier about the calculation of percentage changes but you can still use thisformula any time it always works One over the price level gives you the purchasing power of the dollar and when the price level is only 76 percent what it was before your purchasing power is going to be 132 percent of what it was before Falling prices give us an increase in the purchasing power of the dollar
842019 Impact of Inflation on Purchasing Power
httpslidepdfcomreaderfullimpact-of-inflation-on-purchasing-power 3334
REFERENCES
1 httpwwwworldsalariesorg
2 International Monetary Fund World Economic Outlook Database September
2006
3 Website of Australian Bureau of Statistics
4 Website of Blanco de Mexico
5 Website of Bank of England
6 Website of Central Bank of Brazil
7 Website of European Central bank
8 Website of International Organization of Labor
9 Website of the Labor Department of India
10 Website of the Ministry of Economics and Planning of Saudi Arabia
11 Website of the Ministry of Finance of the Russian Federation
12 Website of National Bureau of Statistics of China
13 Website of Statistics Bureau of Japan
14 Website of Statistics Canada
15 Website of Statistics South Africa
16 Website of the United States Labor Department
17 Website of Wikipedia on purchasing power parity and consumer price index
842019 Impact of Inflation on Purchasing Power
httpslidepdfcomreaderfullimpact-of-inflation-on-purchasing-power 3434
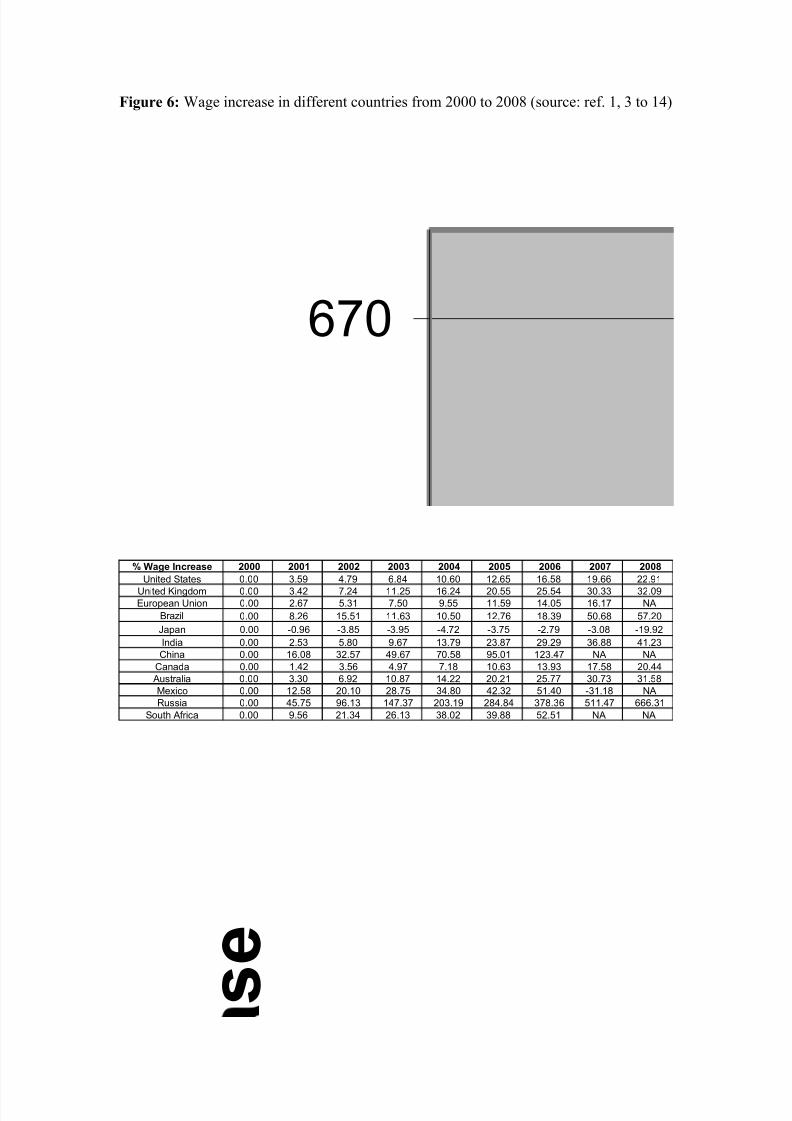
842019 Impact of Inflation on Purchasing Power
httpslidepdfcomreaderfullimpact-of-inflation-on-purchasing-power 2034
Figure 6 Wage increase in different countries from 2000 to 2008 (source ref 1 3 to 14)
670
s e
Wage Increase 2000 2001 2002 2003 2004 2005 2006 2007 2008
United States 000 359 479 684 1060 1265 1658 1966 2291
United Kingdom 000 342 724 1125 1624 2055 2554 3033 3209European Union 000 267 531 750 955 1159 1405 1617 NA
Brazil 000 826 1551 1163 1050 1276 1839 5068 5720
Japan 000 -096 -385 -395 -472 -375 -279 -308 -1992
India 000 253 580 967 1379 2387 2929 3688 4123
China 000 1608 3257 4967 7058 9501 12347 NA NA
Canada 000 142 356 497 718 1063 1393 1758 2044
Australia 000 330 692 1087 1422 2021 2577 3073 3158
Mexico 000 1258 2010 2875 3480 4232 5140 -3118 NA
Russia 000 4575 9613 14737 20319 28484 37836 51147 66631
South Africa 000 956 2134 2613 3802 3988 5251 NA NA
842019 Impact of Inflation on Purchasing Power
httpslidepdfcomreaderfullimpact-of-inflation-on-purchasing-power 2134
Figure 7 Relative purchasing power parity from 2000 to 2008 after adjusting for wage
increase
12
13
e
s
Rel PPP adj for
wage 2000 2001 2002 2003 2004 2005 2006 2007 2008
United States 1000 1000 1000 1000 1000 1000 1000 1000 1000
United Kingdom 1000 0997 0966 0941 0916 0889 0885 0858 0000
European Union 1000 1014 0998 0997 1002 0989 0993 0988 NA
Brazil 1000 1014 1049 1170 1255 1261 1239 0989 0979
Japan 1000 1023 1032 1031 1042 1013 1015 1004 1227
India 1000 1033 1030 1034 1036 0977 0993 0985 1008
China 1000 0885 0759 0681 0623 0546 0488 0448 NA
Canada 1000 1013 1018 1026 1029 1002 0999 0977 0962
Australia 1000 1018 1002 0989 0988 0950 0947 0925 0927
Mexico 1000 0946 0926 0899 0905 0873 0862 1940 NA
Russia 1000 0850 0723 0652 0591 0517 0460 0387 0349
South Africa 1000 0984 0959 0976 0907 0911 0883 NA NA
842019 Impact of Inflation on Purchasing Power
httpslidepdfcomreaderfullimpact-of-inflation-on-purchasing-power 2234
Figure 8 Real exchange rate from 2000 to 2008 after adjusting for wage increase
1600
g e s Change e adj for
Wage 2000 2001 2002 2003 2004 2005 2006 2007
United States 10 000 10000 10000 100 00 10 000 1000 0 100 00 10000
United Kingdom 10000 10364 9147 8122 7679 8476 7456 7443
European Union 10000 10505 8804 7255 6929 7938 7327 6673Brazil 10000 10737 14285 11602 10891 9334 8588 5818Japan 10000 12290 12015 11267 11687 14004 14794 14800India 10000 10186 9774 8929 8467 8146 7787 6506China 10000 8999 8226 7479 6751 5978 5302 4260
Canada 10000 10916 10589 8681 8278 8068 8177 6997Australia 10000 10753 9484 6934 6802 6982 6405 5739Mexico 10000 8540 8929 8959 8626 7940 7741 NARussia 10000 6409 4469 2974 2218 1693 1204 863
South Africa 10000 14343 8804 6381 5309 5946 6137 NA
842019 Impact of Inflation on Purchasing Power
httpslidepdfcomreaderfullimpact-of-inflation-on-purchasing-power 2334
Table 1 Market exchange rate from 2000 to 2008
Nominal Exchange Rate (E) Dec-00 Dec-01 Dec-02 Dec-03 Dec-04 Dec-05 Dec-06 Dec-07 Jun-08US Dollar 10 10 10 10 10 10 10 10 10
British Pound 07 07 06 06 05 06 05 05 05Euro 11 11 10 08 07 08 08 07 06
Brazilian Real 20 23 36 29 27 23 21 18 16
Japanese Yen 1140 1310 1190 1070 1030 1180 1190 1111 1064Indian Rupee 468 482 480 455 434 450 444 392 429
Chinese Yuan 83 83 83 83 83 81 79 73 69
Canadian Dollar 15 16 16 13 12 12 12 10 10Australian Dollar 18 20 18 13 13 14 13 11 10
Mexico Peso 96 92 104 112 112 106 108 109 103
Russian Rouble 282 304 319 293 278 288 263 246 235South African Rand 76 120 86 66 57 64 71 69 78
Saudi Arabian Riyal 38 38 38 38 38 38 38 38 38
Table 2 Weekly Wages from 2000 to 2008
Weekly Wage (in US$) 2000 2001 2002 2003 2004 2005 2006 2007 2008United States 5850 6060 6130 6250 6470 6590 6820 7000 7190
United Kingdom 5286 5309 6126 7093 7905 7386 8670 9094 9310
European Union 3635 3567 4310 5327 5825 5239 5909 6725 00
Brazil 983 894 624 740 796 939 1060 1622 1883
Japan 6636 5719 6112 6791 6998 6170 6180 6599 5694
India 144 143 148 162 176 185 196 235 221
China 217 252 287 324 370 432 509 632 00
Canada 4370 4182 4297 5334 5855 6199 6384 7786 7738
Australia 3737 3545 4040 5608 5956 5946 6661 7714 8497
Mexico 771 910 853 849 896 993 1038
Russia 197 266 342 469 606 743 1011 1381 1812
South Africa 1641 1139 1760 2384 3021 2748 2699
Note The EU wage is an average of Germany France Italy and Spain
842019 Impact of Inflation on Purchasing Power
httpslidepdfcomreaderfullimpact-of-inflation-on-purchasing-power 2434
PURCHASING POWER PARITY
The purchasing power parity (PPP) theory uses the long-term equilibrium exchange
rate of two currencies to equalize their purchasing power Developed by Gustav Cassel in1920 it is based on the law of one price the theory states that in ideally efficientmarkets identical goods should have only one price
This purchasing power SEM rate equalizes the purchasing power of different currenciesin their home countries for a given basket of goods Using a PPP basis is arguably moreuseful when comparing differences in living standards on the whole between nations because PPP takes into account the relative cost of living and the inflation rates of different countries rather than just a nominal gross domestic product (GDP) comparisonThe best-known and most-used purchasing power parity exchange rate is the Geary-Khakis dollar (the international dollar)
PPP exchange rates (the real exchange rate) fluctuations are mostly due to marketexchange rates movements Aside from this volatility consistent deviations of the marketand PPP exchange rates are observed for example (market exchange rate) prices of non-traded goods and services are usually lower where incomes are lower (A US dollar exchanged and spent in India will buy more haircuts than a dollar spent in the UnitedStates) PPP takes into account this lower cost of living and adjusts for it as though allincome was spent locally In other words PPP is the amount of a certain basket of basicgoods which can be bought in the given country with the money it produces
There can be marked differences between PPP and market exchange rates [1] For
example the World Banks World Development Indicators 2005 estimated that in 2003one United States dollar was equivalent to about 18 Chinese Yuan by purchasing power parity [2] - considerably different from the nominal exchange rate that put one dollar equalto 76 Yuan This discrepancy has large implications for instance GDP per capita in thePeoples Republic of China is about US$1800 while on a PPP basis it is about US$7204This is frequently used to assert that China is the worlds second-largest economy butsuch a calculation would only be valid under the PPP theory At the other extremeJapans nominal GDP per capita is around US$37600 but its PPP figure is onlyUS$30615
842019 Impact of Inflation on Purchasing Power
httpslidepdfcomreaderfullimpact-of-inflation-on-purchasing-power 2534
First letrsquos look at the situation of domestic buying Gustav Cassel developed the purchasing power parity (PPP) theory in 1920 to compare the purchasing power of different currencies in their home countries based on the assumption that identical goodsshould have the same price (law of one price) PPP exchange rate is defined in Equation1
For
Dom
P
P PPP = (Eq 1)
Where PDom is domestic price and PFor is foreign price
The relative purchasing power parity relates the inflation rate (change of prices) in eachcountry to the change in the market exchange rate and is given in Equation 2
Dom
t
Dom
t
For t
For t
rel
P P
P P PPP
1
1
minus
minus
= (Eq 2)
Where Pt is the price level in period t To calculate the relative purchasing power parityof all of the goods and services consumed in a country we can substitute P t with theconsumer price index (CPI) of that country which leads to Equation 3
Dom
t
Dom
t
For
t
For
t
rel
CPI CPI
CPI CPI PPP
1
1
minus
minus
= (Eq 3)
Figure 1 shows the consumer price indexes of thirteen relatively large countries or economies The inflation rate is higher in the emerging economies than in the developedcountries because of the higher rate of economic growth
Figure 2 shows the changes in relative purchasing power parity of the above economiescalculated by Equation 3 By this calculation one may conclude that the US dollar hasappreciated against the Mexican Indian South African Brazilian and Russian currencies
by 10 to 217 while depreciated against the Australian European Canadian BritishChinese and Saudi Arabian currencies by 1 to 10 from 2000 to 2008 if theconsumptions are domestic This can be attributed to the difference in inflation rate of these countries Japanrsquos disinflation condition between 2000 and 2008 caused the USdollar to weaken approximately 20 over the same time period
842019 Impact of Inflation on Purchasing Power
httpslidepdfcomreaderfullimpact-of-inflation-on-purchasing-power 2634
The International Monetary Fund (IMF) has conducted similar calculation that includesmore factors such as gross domestic product (GDP) The PPP exchange rates published by the IMF are displayed in the following Figure 3 The data shown in Figure 2 areconsistent with the IMF data
It was recognized by many economists that the PPP exchange rate calculation is not perfect because of the difficulties in finding the same baskets of goods to compare acrosscountries The weighing of goods and services in the CPI index is not identical amongdifferent countries Often times the quality of goods and service purchased variesconsiderably for example Americans probably drive better cars and drink cleaner water than many people in developing countries Moreover many social benefits offered bythe welfare countries may not be included in the CPI calculations and this makes directcomparison of purchasing power difficult Nevertheless this methodology gives us arough idea how consumers are doing in different economies
REAL EXCHANGE RATE IN INTERNATIONAL TRADE
When consumers or businesses purchase goods and services from foreign countries theywill need to exchange the available domestic currency to foreign currencies in order tofulfill the trade The price of one currency in terms of another currency is called theexchange rate and it is determined by the currency market and in some cases by
individual governments The exchange rates of twelve foreign currencies to the USdollar from 2000 to 2008 are shown in Table 1 The US dollar depreciated against mostcurrencies in terms of market exchange rate after 2002 except for the Mexican Peso andBrazilian Real (until 2006)
Many people misunderstand the real prices if only the nominal (market) exchange rate isconsidered for the trade For example a three-bedroom apartment in China costs about1500000 Yuan while a similar apartment in the US cost about 400000 Dollar A post-doctorate position in Oxford University in England is paid about 40000 Pound per year
while a similar position in Massachusetts Institute of Technology in the US is paid60000 Dollar per year The market exchange rates do not reflect the real difference of the prices Therefore the real exchange rate which considers both the nominal exchangerate and prices should be used for international trade The real exchange rate is definedin Equation 4
For
Dom
P
P E Rate Exchangeal min Noe Rate Exchangeal Re times= )()( (Eq 4)
842019 Impact of Inflation on Purchasing Power
httpslidepdfcomreaderfullimpact-of-inflation-on-purchasing-power 2734
where PDom is domestic price and PFor is foreign price Using the above two examplesthe real exchange rates would be 18 Chinese apartment = 1 American apartment and075 Oxford salary = 1 MIT salary in 2008
If we substitute prices with CPI indexes in the above equation the real exchange for allthe goods and services can be estimated by Equation 5
For
Dom
CPI
CPI E e times= (Eq 5)
Figure 4 and Figure 5 show the percent changes of nominal exchange rate and real (CPI)exchange rate from 2000 to 2008 and the values are not the same When inflation (price
change) rates are taken into account the dollar actually strengthens against the JapaneseYen and Saudi Arabian Riyal while the advantage over the Peso and the Real (until 2005)diminished The magnitude of depreciation of the US dollar against the British Poundthe Euro the Canadian Dollar and the Chinese Yuan is 2-5 better in the real rate thanin the nominal rate On the other hand the dollar depreciated more against the IndianRupee the South African Rand (after 2002) and the Russian Ruble in the real rate than inthe nominal rate The real rate and the nominal rate for the Australian dollar are verysimilar This analysis indicates that one would make different decisions in buyingforeign goods and services when using the real exchange rate versus the nominalexchange rate
In addition if we compare the data in Figure 2 and Figure 5 it is obvious that the PPPexchange rate fluctuates less dramatically than the foreign exchange rate (except theRussian Ruble) In other words foreign exchange rates affect international trade morethan domestic consumption
WAGE FACTOR
Most consumers except the unemployed and retirees earn wages to make a livingEmployers usually give employees a small wages increase every year to offset inflationFigure 6 shows the percentage of wage increase in different countries The wage increasein the US EU and India is a few percent less than inflation over eight years while thewages in Canada Brazil and Australia outpaced inflation by a few percents in the same period The wage increase in UK Mexico South Africa China and Russia is even faster
842019 Impact of Inflation on Purchasing Power
httpslidepdfcomreaderfullimpact-of-inflation-on-purchasing-power 2834
double to triple digits gain over inflation is observed in these nations Japanrsquos wage isstagnant (or dropping slightly) from 2000 to 2008 It is unclear what exactly causes thesedifferences one may speculate that it may relate to the fiscal condition and account balance of the nations as well as how the governments want to regulate their economyFor example commodity producing countries is benefited from the recent purge of
commodity prices China has a large trade surplus the Japanese prices may have comedown from a very high level from decays ago It will be interested to see how the fastwage increase in some nations would impact their inflation situation in the future
The difference in wage changes certainly would have an impact to consumerrsquos purchasing power If we modify Equation 3 and Equation 5 for calculating relative PPPand real (CPI) exchange rate by a wage factor the following equations will results
For
t
For
t
Dom
t
Dom
t
Dom
t
Dom
t
For
t
For
t
rel
W W
W W
CPI CPI
CPI CPI PPP
1
1
1
1
minus
minus
minus
minus
times= (Eq 6)
For
Dom
For
Dom
W
W
CPI
CPI E e timestimes= (Eq 7)
where W denotes wages Using this modified calculation both domestic and foreign purchasing power will change Figure 7 and Figure 8 shows the relative PPP and realexchange rate after adjusting for wage increase After adjusting for wages the relativePPP become almost the same for the US EU Canada Japan (until 2007) India andBrazil (after 2006) Australia UK South Africa Mexico become the out performerswhich is not the case without adjusting for wages China and Russia demonstrate the bestimprovement in relative PPP because of the large increase of their wages
After adjusting for wages the buying power of Americans in international marketsweakens further relative to most foreign consumers except the Japanese Meanwhile thedepreciation of the US dollar against the Euro is about 5 less than before adjustment(using the 2008 figure) because of the wage advantage for Americans As pointed outearlier there are pitfalls for direct cross-comparison using the CPI index Additionallyother factors such as taxation may complicate the purchasing power calculation For example American income taxes are less than many industrialized countries while poorer nations probably donrsquot tax on income as much
842019 Impact of Inflation on Purchasing Power
httpslidepdfcomreaderfullimpact-of-inflation-on-purchasing-power 2934
Based on the above analysis the emerging economies have made big progress inenhancing the international purchasing power of their citizens thanks to increases of international trade employment and work force productivity Having said that the gap
of incomes between citizens of developed and developing countries are still quite large asshown in the Table 2 Additionally the consequences of environmental damages andincreased energy consumptions in developing countries due to rapid industrialization may be debatable issues
842019 Impact of Inflation on Purchasing Power
httpslidepdfcomreaderfullimpact-of-inflation-on-purchasing-power 3034
Conclusion
Exchange rate pricesinflation and wage level influence the purchasing power of consumers in domestic and international markets The domestic purchasing power ismainly affected by the inflation rate of individual countries and it is relatively equitableacross mature economies The international purchasing power is more volatile and isaffected by both exchange rate and prices Wage changes can further compensate or deprive purchasing power of consumers Analysis of current exchange rates prices andwages leads to the belief that foreign shoppers can get better bargains in Japan and theUS at the present time Consumers in emerging economies especially China and Russiahave experienced significant improvement in purchasing power recently when compared
to themselves They may catch up with the living standard of rich countries in the futureif this growth rate sustains Finally it will be interesting to research the fundamentaleconomic forces which influence the gauges that are measured in the articleWhen prices are rising you can buy less with a given amount of money When hotdogsare expensive a given amount of money will buy a small number of hotdogs But whenhotdogs are inexpensive that is the price is low your given hot dog allowance will purchase a lot more satisfaction There is a relationship between prices and purchasing power that is a reciprocal relationship and thatrsquos the relationship that wersquore going to bestudying in this lesson When prices are going from low prices to high prices that iswhen there is inflation in the economy the value of the dollar is shrinking that is your Purchasing power is going from being able to buy a lot to being able to buy a little Inthis lesson Irsquom going to begin by giving a simple numerical example and then wersquoll talk about how you can use the GDP deflator to show the relationship between the inflationrate and purchasing power
Letrsquos start by assuming that we are in a period of inflation and letrsquos let hotdogs be arepresentative good that is the price of all goods and services across the economy isincreasing at some general rate and wersquore going to look at the price of hotdogs in order toinfer what is happening to purchasing power as prices are rising Wersquore going to befocusing now on the reciprocal relationship between the price level and the purchasing power of the dollar that is what a dollar will buy as the price level is changing And Irsquovewritten out here as clearly as I can the formula that shows this reciprocal relationship thatis one over the price level equals the purchasing power of a dollar Let me make thisvery clear Letrsquos suppose that the price of a hotdog is five cents Well whatrsquos the purchasing power of your dollar Five cents is the same thing as one twentieth of adollar Therefore the reciprocal of one twentieth is twenty Your dollar will buy twentyhotdogs Thatrsquos its purchasing power
842019 Impact of Inflation on Purchasing Power
httpslidepdfcomreaderfullimpact-of-inflation-on-purchasing-power 3134
Now suppose wersquore in a period of inflation so that prices are rising and the price of ahotdog goes up to two dollars Whatrsquos happened to your purchasing power Well your dollar will no longer buy even a whole hotdog Two dollars or 2 has a reciprocal of onehalf that is you can now only afford half a hotdog Your purchasing power has shrunk from twenty hotdogs at a price of five cents a piece to one half a hotdog whenever the
price is two dollars per hotdog This simple example makes clear that the price level andthe purchasing power of the dollar are reciprocals
Now letrsquos look at some examples using the GDP deflator Suppose that wersquore in the year 2000 which is our base year for calculating the GDP deflator and we calculate the priceof a market basket of goods and services- that is a little bit of Housing and a little bit of transportation a little bit of medical care a little bit of clothingetc And wersquore going to call the price level in the year 2000 one hundred because itrsquos our base year
We look at those prices again in 2002 and we find that the price of the goods and
services as a ratio of the same prices in 2000 is equal to 104 That is prices haveincreased by about 4 percent between the year 2000 and 2002 So if we write the GDPdeflator not in the form we usually write it that is multiplied by 100 to get 104 but letrsquoswrite it now as in hundredths 104 to show the 4 percent increase in prices between theyear 2000 and 2002 Well whatrsquos happened to the purchasing power of a dollar betweenthe year 2000 and 2002 That is how much can we afford to buy in 2002 with a dollar if we measure it in the prices of the year 2000 Prices are higher in 2002 therefore thedollar wonrsquot buy as much Well if you takethe reciprocal of the GDP deflator 104 you get 096 Whatrsquos that saying Itrsquos saying thatwhat you could have bought for 96 cents back in the year 2000 now it costs you a dollar to buy in 2002 That is a dollar in 2002 is only worth what 96 cents was worth back inthe year 2000 You can afford to buy less Your purchasing power has shrunk by about 4 percent Your purchasing power shrinks at the same rate that the price level increases because the price level and your purchasing power are reciprocals of each other
Well letrsquos take another example during a period of deflation If we look at the years between 1929 and 1933 wersquoll see falling prices If we choose 1929 as the base year andif we call the price level in that 200000 or 100 if we look at prices in 1933 during thegreat depression we see that the price level has fallen by about 24 percent That is wersquovegone from 100 down to 076 So we now have lower prices in 1933 than we had in 1929
Now what does that mean What is going to happen to the purchasing power of your dollar when prices are lower Itrsquos clearly going to increase Yoursquore going to go from asmall purchasing power to a bigger purchasing power And if you takethe reciprocal of 76 percent you get 132 That is the purchasing power of the dollar hasincreased by about 32 percent in this example Now the reason the numbers donrsquot add upexactly the reason I canrsquot say a 24 percent decrease in prices is equal to a 24 percentincrease in purchasing power is because once your percentages start getting large yourun into this problem that a fifty percent increase is sorry that a 100 percent increase isthe reciprocal of a 50 percent decrease you wind up with this problem that wersquove
842019 Impact of Inflation on Purchasing Power
httpslidepdfcomreaderfullimpact-of-inflation-on-purchasing-power 3234
discussed earlier about the calculation of percentage changes but you can still use thisformula any time it always works One over the price level gives you the purchasing power of the dollar and when the price level is only 76 percent what it was before your purchasing power is going to be 132 percent of what it was before Falling prices give us an increase in the purchasing power of the dollar
842019 Impact of Inflation on Purchasing Power
httpslidepdfcomreaderfullimpact-of-inflation-on-purchasing-power 3334
REFERENCES
1 httpwwwworldsalariesorg
2 International Monetary Fund World Economic Outlook Database September
2006
3 Website of Australian Bureau of Statistics
4 Website of Blanco de Mexico
5 Website of Bank of England
6 Website of Central Bank of Brazil
7 Website of European Central bank
8 Website of International Organization of Labor
9 Website of the Labor Department of India
10 Website of the Ministry of Economics and Planning of Saudi Arabia
11 Website of the Ministry of Finance of the Russian Federation
12 Website of National Bureau of Statistics of China
13 Website of Statistics Bureau of Japan
14 Website of Statistics Canada
15 Website of Statistics South Africa
16 Website of the United States Labor Department
17 Website of Wikipedia on purchasing power parity and consumer price index
842019 Impact of Inflation on Purchasing Power
httpslidepdfcomreaderfullimpact-of-inflation-on-purchasing-power 3434
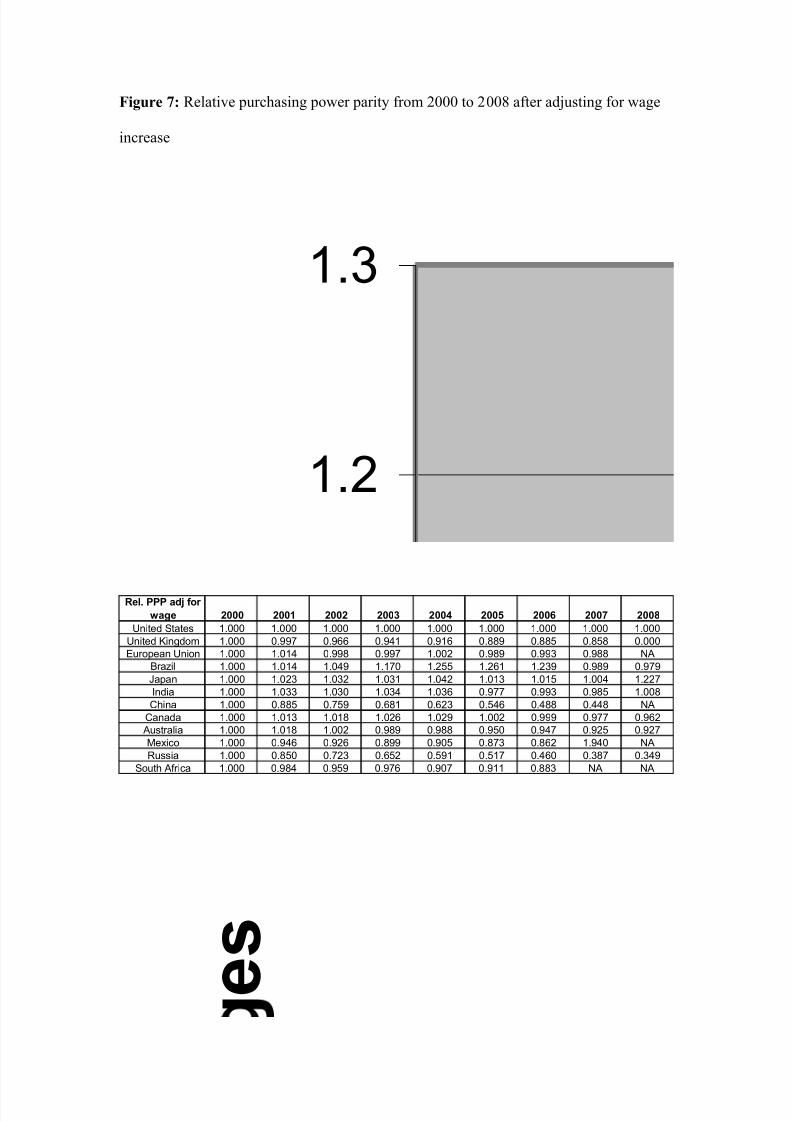
842019 Impact of Inflation on Purchasing Power
httpslidepdfcomreaderfullimpact-of-inflation-on-purchasing-power 2134
Figure 7 Relative purchasing power parity from 2000 to 2008 after adjusting for wage
increase
12
13
e
s
Rel PPP adj for
wage 2000 2001 2002 2003 2004 2005 2006 2007 2008
United States 1000 1000 1000 1000 1000 1000 1000 1000 1000
United Kingdom 1000 0997 0966 0941 0916 0889 0885 0858 0000
European Union 1000 1014 0998 0997 1002 0989 0993 0988 NA
Brazil 1000 1014 1049 1170 1255 1261 1239 0989 0979
Japan 1000 1023 1032 1031 1042 1013 1015 1004 1227
India 1000 1033 1030 1034 1036 0977 0993 0985 1008
China 1000 0885 0759 0681 0623 0546 0488 0448 NA
Canada 1000 1013 1018 1026 1029 1002 0999 0977 0962
Australia 1000 1018 1002 0989 0988 0950 0947 0925 0927
Mexico 1000 0946 0926 0899 0905 0873 0862 1940 NA
Russia 1000 0850 0723 0652 0591 0517 0460 0387 0349
South Africa 1000 0984 0959 0976 0907 0911 0883 NA NA
842019 Impact of Inflation on Purchasing Power
httpslidepdfcomreaderfullimpact-of-inflation-on-purchasing-power 2234
Figure 8 Real exchange rate from 2000 to 2008 after adjusting for wage increase
1600
g e s Change e adj for
Wage 2000 2001 2002 2003 2004 2005 2006 2007
United States 10 000 10000 10000 100 00 10 000 1000 0 100 00 10000
United Kingdom 10000 10364 9147 8122 7679 8476 7456 7443
European Union 10000 10505 8804 7255 6929 7938 7327 6673Brazil 10000 10737 14285 11602 10891 9334 8588 5818Japan 10000 12290 12015 11267 11687 14004 14794 14800India 10000 10186 9774 8929 8467 8146 7787 6506China 10000 8999 8226 7479 6751 5978 5302 4260
Canada 10000 10916 10589 8681 8278 8068 8177 6997Australia 10000 10753 9484 6934 6802 6982 6405 5739Mexico 10000 8540 8929 8959 8626 7940 7741 NARussia 10000 6409 4469 2974 2218 1693 1204 863
South Africa 10000 14343 8804 6381 5309 5946 6137 NA
842019 Impact of Inflation on Purchasing Power
httpslidepdfcomreaderfullimpact-of-inflation-on-purchasing-power 2334
Table 1 Market exchange rate from 2000 to 2008
Nominal Exchange Rate (E) Dec-00 Dec-01 Dec-02 Dec-03 Dec-04 Dec-05 Dec-06 Dec-07 Jun-08US Dollar 10 10 10 10 10 10 10 10 10
British Pound 07 07 06 06 05 06 05 05 05Euro 11 11 10 08 07 08 08 07 06
Brazilian Real 20 23 36 29 27 23 21 18 16
Japanese Yen 1140 1310 1190 1070 1030 1180 1190 1111 1064Indian Rupee 468 482 480 455 434 450 444 392 429
Chinese Yuan 83 83 83 83 83 81 79 73 69
Canadian Dollar 15 16 16 13 12 12 12 10 10Australian Dollar 18 20 18 13 13 14 13 11 10
Mexico Peso 96 92 104 112 112 106 108 109 103
Russian Rouble 282 304 319 293 278 288 263 246 235South African Rand 76 120 86 66 57 64 71 69 78
Saudi Arabian Riyal 38 38 38 38 38 38 38 38 38
Table 2 Weekly Wages from 2000 to 2008
Weekly Wage (in US$) 2000 2001 2002 2003 2004 2005 2006 2007 2008United States 5850 6060 6130 6250 6470 6590 6820 7000 7190
United Kingdom 5286 5309 6126 7093 7905 7386 8670 9094 9310
European Union 3635 3567 4310 5327 5825 5239 5909 6725 00
Brazil 983 894 624 740 796 939 1060 1622 1883
Japan 6636 5719 6112 6791 6998 6170 6180 6599 5694
India 144 143 148 162 176 185 196 235 221
China 217 252 287 324 370 432 509 632 00
Canada 4370 4182 4297 5334 5855 6199 6384 7786 7738
Australia 3737 3545 4040 5608 5956 5946 6661 7714 8497
Mexico 771 910 853 849 896 993 1038
Russia 197 266 342 469 606 743 1011 1381 1812
South Africa 1641 1139 1760 2384 3021 2748 2699
Note The EU wage is an average of Germany France Italy and Spain
842019 Impact of Inflation on Purchasing Power
httpslidepdfcomreaderfullimpact-of-inflation-on-purchasing-power 2434
PURCHASING POWER PARITY
The purchasing power parity (PPP) theory uses the long-term equilibrium exchange
rate of two currencies to equalize their purchasing power Developed by Gustav Cassel in1920 it is based on the law of one price the theory states that in ideally efficientmarkets identical goods should have only one price
This purchasing power SEM rate equalizes the purchasing power of different currenciesin their home countries for a given basket of goods Using a PPP basis is arguably moreuseful when comparing differences in living standards on the whole between nations because PPP takes into account the relative cost of living and the inflation rates of different countries rather than just a nominal gross domestic product (GDP) comparisonThe best-known and most-used purchasing power parity exchange rate is the Geary-Khakis dollar (the international dollar)
PPP exchange rates (the real exchange rate) fluctuations are mostly due to marketexchange rates movements Aside from this volatility consistent deviations of the marketand PPP exchange rates are observed for example (market exchange rate) prices of non-traded goods and services are usually lower where incomes are lower (A US dollar exchanged and spent in India will buy more haircuts than a dollar spent in the UnitedStates) PPP takes into account this lower cost of living and adjusts for it as though allincome was spent locally In other words PPP is the amount of a certain basket of basicgoods which can be bought in the given country with the money it produces
There can be marked differences between PPP and market exchange rates [1] For
example the World Banks World Development Indicators 2005 estimated that in 2003one United States dollar was equivalent to about 18 Chinese Yuan by purchasing power parity [2] - considerably different from the nominal exchange rate that put one dollar equalto 76 Yuan This discrepancy has large implications for instance GDP per capita in thePeoples Republic of China is about US$1800 while on a PPP basis it is about US$7204This is frequently used to assert that China is the worlds second-largest economy butsuch a calculation would only be valid under the PPP theory At the other extremeJapans nominal GDP per capita is around US$37600 but its PPP figure is onlyUS$30615
842019 Impact of Inflation on Purchasing Power
httpslidepdfcomreaderfullimpact-of-inflation-on-purchasing-power 2534
First letrsquos look at the situation of domestic buying Gustav Cassel developed the purchasing power parity (PPP) theory in 1920 to compare the purchasing power of different currencies in their home countries based on the assumption that identical goodsshould have the same price (law of one price) PPP exchange rate is defined in Equation1
For
Dom
P
P PPP = (Eq 1)
Where PDom is domestic price and PFor is foreign price
The relative purchasing power parity relates the inflation rate (change of prices) in eachcountry to the change in the market exchange rate and is given in Equation 2
Dom
t
Dom
t
For t
For t
rel
P P
P P PPP
1
1
minus
minus
= (Eq 2)
Where Pt is the price level in period t To calculate the relative purchasing power parityof all of the goods and services consumed in a country we can substitute P t with theconsumer price index (CPI) of that country which leads to Equation 3
Dom
t
Dom
t
For
t
For
t
rel
CPI CPI
CPI CPI PPP
1
1
minus
minus
= (Eq 3)
Figure 1 shows the consumer price indexes of thirteen relatively large countries or economies The inflation rate is higher in the emerging economies than in the developedcountries because of the higher rate of economic growth
Figure 2 shows the changes in relative purchasing power parity of the above economiescalculated by Equation 3 By this calculation one may conclude that the US dollar hasappreciated against the Mexican Indian South African Brazilian and Russian currencies
by 10 to 217 while depreciated against the Australian European Canadian BritishChinese and Saudi Arabian currencies by 1 to 10 from 2000 to 2008 if theconsumptions are domestic This can be attributed to the difference in inflation rate of these countries Japanrsquos disinflation condition between 2000 and 2008 caused the USdollar to weaken approximately 20 over the same time period
842019 Impact of Inflation on Purchasing Power
httpslidepdfcomreaderfullimpact-of-inflation-on-purchasing-power 2634
The International Monetary Fund (IMF) has conducted similar calculation that includesmore factors such as gross domestic product (GDP) The PPP exchange rates published by the IMF are displayed in the following Figure 3 The data shown in Figure 2 areconsistent with the IMF data
It was recognized by many economists that the PPP exchange rate calculation is not perfect because of the difficulties in finding the same baskets of goods to compare acrosscountries The weighing of goods and services in the CPI index is not identical amongdifferent countries Often times the quality of goods and service purchased variesconsiderably for example Americans probably drive better cars and drink cleaner water than many people in developing countries Moreover many social benefits offered bythe welfare countries may not be included in the CPI calculations and this makes directcomparison of purchasing power difficult Nevertheless this methodology gives us arough idea how consumers are doing in different economies
REAL EXCHANGE RATE IN INTERNATIONAL TRADE
When consumers or businesses purchase goods and services from foreign countries theywill need to exchange the available domestic currency to foreign currencies in order tofulfill the trade The price of one currency in terms of another currency is called theexchange rate and it is determined by the currency market and in some cases by
individual governments The exchange rates of twelve foreign currencies to the USdollar from 2000 to 2008 are shown in Table 1 The US dollar depreciated against mostcurrencies in terms of market exchange rate after 2002 except for the Mexican Peso andBrazilian Real (until 2006)
Many people misunderstand the real prices if only the nominal (market) exchange rate isconsidered for the trade For example a three-bedroom apartment in China costs about1500000 Yuan while a similar apartment in the US cost about 400000 Dollar A post-doctorate position in Oxford University in England is paid about 40000 Pound per year
while a similar position in Massachusetts Institute of Technology in the US is paid60000 Dollar per year The market exchange rates do not reflect the real difference of the prices Therefore the real exchange rate which considers both the nominal exchangerate and prices should be used for international trade The real exchange rate is definedin Equation 4
For
Dom
P
P E Rate Exchangeal min Noe Rate Exchangeal Re times= )()( (Eq 4)
842019 Impact of Inflation on Purchasing Power
httpslidepdfcomreaderfullimpact-of-inflation-on-purchasing-power 2734
where PDom is domestic price and PFor is foreign price Using the above two examplesthe real exchange rates would be 18 Chinese apartment = 1 American apartment and075 Oxford salary = 1 MIT salary in 2008
If we substitute prices with CPI indexes in the above equation the real exchange for allthe goods and services can be estimated by Equation 5
For
Dom
CPI
CPI E e times= (Eq 5)
Figure 4 and Figure 5 show the percent changes of nominal exchange rate and real (CPI)exchange rate from 2000 to 2008 and the values are not the same When inflation (price
change) rates are taken into account the dollar actually strengthens against the JapaneseYen and Saudi Arabian Riyal while the advantage over the Peso and the Real (until 2005)diminished The magnitude of depreciation of the US dollar against the British Poundthe Euro the Canadian Dollar and the Chinese Yuan is 2-5 better in the real rate thanin the nominal rate On the other hand the dollar depreciated more against the IndianRupee the South African Rand (after 2002) and the Russian Ruble in the real rate than inthe nominal rate The real rate and the nominal rate for the Australian dollar are verysimilar This analysis indicates that one would make different decisions in buyingforeign goods and services when using the real exchange rate versus the nominalexchange rate
In addition if we compare the data in Figure 2 and Figure 5 it is obvious that the PPPexchange rate fluctuates less dramatically than the foreign exchange rate (except theRussian Ruble) In other words foreign exchange rates affect international trade morethan domestic consumption
WAGE FACTOR
Most consumers except the unemployed and retirees earn wages to make a livingEmployers usually give employees a small wages increase every year to offset inflationFigure 6 shows the percentage of wage increase in different countries The wage increasein the US EU and India is a few percent less than inflation over eight years while thewages in Canada Brazil and Australia outpaced inflation by a few percents in the same period The wage increase in UK Mexico South Africa China and Russia is even faster
842019 Impact of Inflation on Purchasing Power
httpslidepdfcomreaderfullimpact-of-inflation-on-purchasing-power 2834
double to triple digits gain over inflation is observed in these nations Japanrsquos wage isstagnant (or dropping slightly) from 2000 to 2008 It is unclear what exactly causes thesedifferences one may speculate that it may relate to the fiscal condition and account balance of the nations as well as how the governments want to regulate their economyFor example commodity producing countries is benefited from the recent purge of
commodity prices China has a large trade surplus the Japanese prices may have comedown from a very high level from decays ago It will be interested to see how the fastwage increase in some nations would impact their inflation situation in the future
The difference in wage changes certainly would have an impact to consumerrsquos purchasing power If we modify Equation 3 and Equation 5 for calculating relative PPPand real (CPI) exchange rate by a wage factor the following equations will results
For
t
For
t
Dom
t
Dom
t
Dom
t
Dom
t
For
t
For
t
rel
W W
W W
CPI CPI
CPI CPI PPP
1
1
1
1
minus
minus
minus
minus
times= (Eq 6)
For
Dom
For
Dom
W
W
CPI
CPI E e timestimes= (Eq 7)
where W denotes wages Using this modified calculation both domestic and foreign purchasing power will change Figure 7 and Figure 8 shows the relative PPP and realexchange rate after adjusting for wage increase After adjusting for wages the relativePPP become almost the same for the US EU Canada Japan (until 2007) India andBrazil (after 2006) Australia UK South Africa Mexico become the out performerswhich is not the case without adjusting for wages China and Russia demonstrate the bestimprovement in relative PPP because of the large increase of their wages
After adjusting for wages the buying power of Americans in international marketsweakens further relative to most foreign consumers except the Japanese Meanwhile thedepreciation of the US dollar against the Euro is about 5 less than before adjustment(using the 2008 figure) because of the wage advantage for Americans As pointed outearlier there are pitfalls for direct cross-comparison using the CPI index Additionallyother factors such as taxation may complicate the purchasing power calculation For example American income taxes are less than many industrialized countries while poorer nations probably donrsquot tax on income as much
842019 Impact of Inflation on Purchasing Power
httpslidepdfcomreaderfullimpact-of-inflation-on-purchasing-power 2934
Based on the above analysis the emerging economies have made big progress inenhancing the international purchasing power of their citizens thanks to increases of international trade employment and work force productivity Having said that the gap
of incomes between citizens of developed and developing countries are still quite large asshown in the Table 2 Additionally the consequences of environmental damages andincreased energy consumptions in developing countries due to rapid industrialization may be debatable issues
842019 Impact of Inflation on Purchasing Power
httpslidepdfcomreaderfullimpact-of-inflation-on-purchasing-power 3034
Conclusion
Exchange rate pricesinflation and wage level influence the purchasing power of consumers in domestic and international markets The domestic purchasing power ismainly affected by the inflation rate of individual countries and it is relatively equitableacross mature economies The international purchasing power is more volatile and isaffected by both exchange rate and prices Wage changes can further compensate or deprive purchasing power of consumers Analysis of current exchange rates prices andwages leads to the belief that foreign shoppers can get better bargains in Japan and theUS at the present time Consumers in emerging economies especially China and Russiahave experienced significant improvement in purchasing power recently when compared
to themselves They may catch up with the living standard of rich countries in the futureif this growth rate sustains Finally it will be interesting to research the fundamentaleconomic forces which influence the gauges that are measured in the articleWhen prices are rising you can buy less with a given amount of money When hotdogsare expensive a given amount of money will buy a small number of hotdogs But whenhotdogs are inexpensive that is the price is low your given hot dog allowance will purchase a lot more satisfaction There is a relationship between prices and purchasing power that is a reciprocal relationship and thatrsquos the relationship that wersquore going to bestudying in this lesson When prices are going from low prices to high prices that iswhen there is inflation in the economy the value of the dollar is shrinking that is your Purchasing power is going from being able to buy a lot to being able to buy a little Inthis lesson Irsquom going to begin by giving a simple numerical example and then wersquoll talk about how you can use the GDP deflator to show the relationship between the inflationrate and purchasing power
Letrsquos start by assuming that we are in a period of inflation and letrsquos let hotdogs be arepresentative good that is the price of all goods and services across the economy isincreasing at some general rate and wersquore going to look at the price of hotdogs in order toinfer what is happening to purchasing power as prices are rising Wersquore going to befocusing now on the reciprocal relationship between the price level and the purchasing power of the dollar that is what a dollar will buy as the price level is changing And Irsquovewritten out here as clearly as I can the formula that shows this reciprocal relationship thatis one over the price level equals the purchasing power of a dollar Let me make thisvery clear Letrsquos suppose that the price of a hotdog is five cents Well whatrsquos the purchasing power of your dollar Five cents is the same thing as one twentieth of adollar Therefore the reciprocal of one twentieth is twenty Your dollar will buy twentyhotdogs Thatrsquos its purchasing power
842019 Impact of Inflation on Purchasing Power
httpslidepdfcomreaderfullimpact-of-inflation-on-purchasing-power 3134
Now suppose wersquore in a period of inflation so that prices are rising and the price of ahotdog goes up to two dollars Whatrsquos happened to your purchasing power Well your dollar will no longer buy even a whole hotdog Two dollars or 2 has a reciprocal of onehalf that is you can now only afford half a hotdog Your purchasing power has shrunk from twenty hotdogs at a price of five cents a piece to one half a hotdog whenever the
price is two dollars per hotdog This simple example makes clear that the price level andthe purchasing power of the dollar are reciprocals
Now letrsquos look at some examples using the GDP deflator Suppose that wersquore in the year 2000 which is our base year for calculating the GDP deflator and we calculate the priceof a market basket of goods and services- that is a little bit of Housing and a little bit of transportation a little bit of medical care a little bit of clothingetc And wersquore going to call the price level in the year 2000 one hundred because itrsquos our base year
We look at those prices again in 2002 and we find that the price of the goods and
services as a ratio of the same prices in 2000 is equal to 104 That is prices haveincreased by about 4 percent between the year 2000 and 2002 So if we write the GDPdeflator not in the form we usually write it that is multiplied by 100 to get 104 but letrsquoswrite it now as in hundredths 104 to show the 4 percent increase in prices between theyear 2000 and 2002 Well whatrsquos happened to the purchasing power of a dollar betweenthe year 2000 and 2002 That is how much can we afford to buy in 2002 with a dollar if we measure it in the prices of the year 2000 Prices are higher in 2002 therefore thedollar wonrsquot buy as much Well if you takethe reciprocal of the GDP deflator 104 you get 096 Whatrsquos that saying Itrsquos saying thatwhat you could have bought for 96 cents back in the year 2000 now it costs you a dollar to buy in 2002 That is a dollar in 2002 is only worth what 96 cents was worth back inthe year 2000 You can afford to buy less Your purchasing power has shrunk by about 4 percent Your purchasing power shrinks at the same rate that the price level increases because the price level and your purchasing power are reciprocals of each other
Well letrsquos take another example during a period of deflation If we look at the years between 1929 and 1933 wersquoll see falling prices If we choose 1929 as the base year andif we call the price level in that 200000 or 100 if we look at prices in 1933 during thegreat depression we see that the price level has fallen by about 24 percent That is wersquovegone from 100 down to 076 So we now have lower prices in 1933 than we had in 1929
Now what does that mean What is going to happen to the purchasing power of your dollar when prices are lower Itrsquos clearly going to increase Yoursquore going to go from asmall purchasing power to a bigger purchasing power And if you takethe reciprocal of 76 percent you get 132 That is the purchasing power of the dollar hasincreased by about 32 percent in this example Now the reason the numbers donrsquot add upexactly the reason I canrsquot say a 24 percent decrease in prices is equal to a 24 percentincrease in purchasing power is because once your percentages start getting large yourun into this problem that a fifty percent increase is sorry that a 100 percent increase isthe reciprocal of a 50 percent decrease you wind up with this problem that wersquove
842019 Impact of Inflation on Purchasing Power
httpslidepdfcomreaderfullimpact-of-inflation-on-purchasing-power 3234
discussed earlier about the calculation of percentage changes but you can still use thisformula any time it always works One over the price level gives you the purchasing power of the dollar and when the price level is only 76 percent what it was before your purchasing power is going to be 132 percent of what it was before Falling prices give us an increase in the purchasing power of the dollar
842019 Impact of Inflation on Purchasing Power
httpslidepdfcomreaderfullimpact-of-inflation-on-purchasing-power 3334
REFERENCES
1 httpwwwworldsalariesorg
2 International Monetary Fund World Economic Outlook Database September
2006
3 Website of Australian Bureau of Statistics
4 Website of Blanco de Mexico
5 Website of Bank of England
6 Website of Central Bank of Brazil
7 Website of European Central bank
8 Website of International Organization of Labor
9 Website of the Labor Department of India
10 Website of the Ministry of Economics and Planning of Saudi Arabia
11 Website of the Ministry of Finance of the Russian Federation
12 Website of National Bureau of Statistics of China
13 Website of Statistics Bureau of Japan
14 Website of Statistics Canada
15 Website of Statistics South Africa
16 Website of the United States Labor Department
17 Website of Wikipedia on purchasing power parity and consumer price index
842019 Impact of Inflation on Purchasing Power
httpslidepdfcomreaderfullimpact-of-inflation-on-purchasing-power 3434
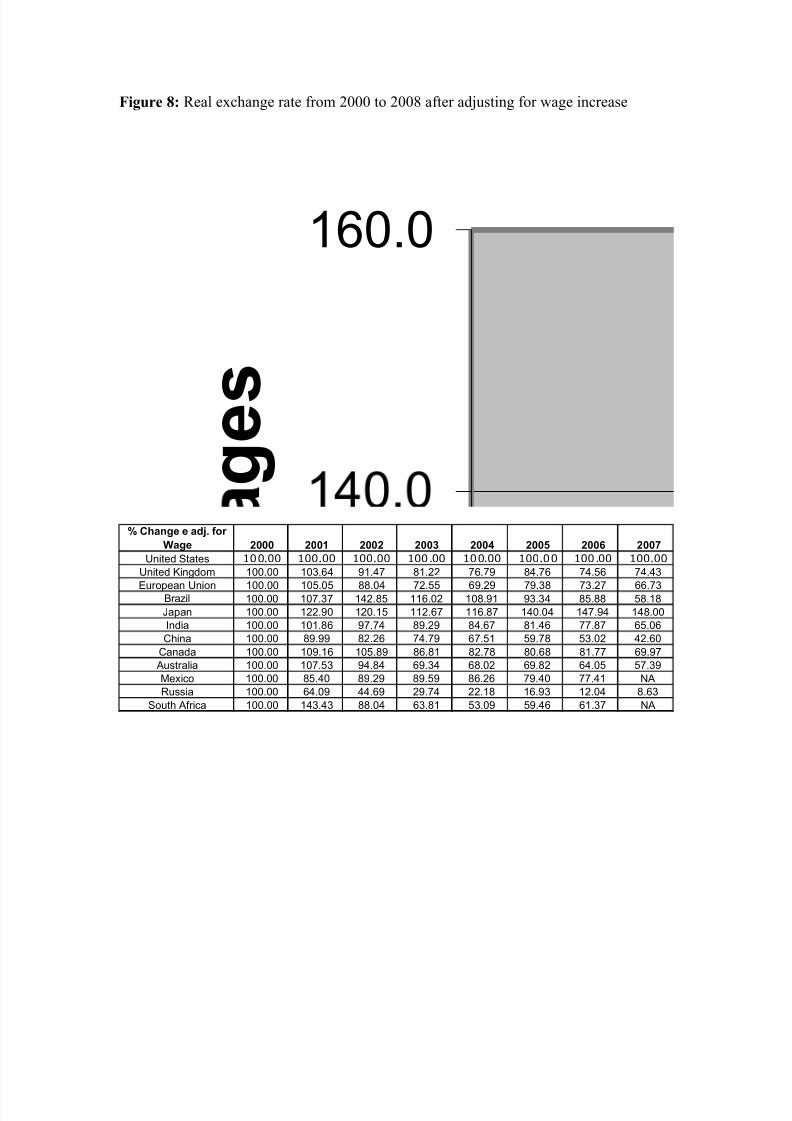
842019 Impact of Inflation on Purchasing Power
httpslidepdfcomreaderfullimpact-of-inflation-on-purchasing-power 2234
Figure 8 Real exchange rate from 2000 to 2008 after adjusting for wage increase
1600
g e s Change e adj for
Wage 2000 2001 2002 2003 2004 2005 2006 2007
United States 10 000 10000 10000 100 00 10 000 1000 0 100 00 10000
United Kingdom 10000 10364 9147 8122 7679 8476 7456 7443
European Union 10000 10505 8804 7255 6929 7938 7327 6673Brazil 10000 10737 14285 11602 10891 9334 8588 5818Japan 10000 12290 12015 11267 11687 14004 14794 14800India 10000 10186 9774 8929 8467 8146 7787 6506China 10000 8999 8226 7479 6751 5978 5302 4260
Canada 10000 10916 10589 8681 8278 8068 8177 6997Australia 10000 10753 9484 6934 6802 6982 6405 5739Mexico 10000 8540 8929 8959 8626 7940 7741 NARussia 10000 6409 4469 2974 2218 1693 1204 863
South Africa 10000 14343 8804 6381 5309 5946 6137 NA
842019 Impact of Inflation on Purchasing Power
httpslidepdfcomreaderfullimpact-of-inflation-on-purchasing-power 2334
Table 1 Market exchange rate from 2000 to 2008
Nominal Exchange Rate (E) Dec-00 Dec-01 Dec-02 Dec-03 Dec-04 Dec-05 Dec-06 Dec-07 Jun-08US Dollar 10 10 10 10 10 10 10 10 10
British Pound 07 07 06 06 05 06 05 05 05Euro 11 11 10 08 07 08 08 07 06
Brazilian Real 20 23 36 29 27 23 21 18 16
Japanese Yen 1140 1310 1190 1070 1030 1180 1190 1111 1064Indian Rupee 468 482 480 455 434 450 444 392 429
Chinese Yuan 83 83 83 83 83 81 79 73 69
Canadian Dollar 15 16 16 13 12 12 12 10 10Australian Dollar 18 20 18 13 13 14 13 11 10
Mexico Peso 96 92 104 112 112 106 108 109 103
Russian Rouble 282 304 319 293 278 288 263 246 235South African Rand 76 120 86 66 57 64 71 69 78
Saudi Arabian Riyal 38 38 38 38 38 38 38 38 38
Table 2 Weekly Wages from 2000 to 2008
Weekly Wage (in US$) 2000 2001 2002 2003 2004 2005 2006 2007 2008United States 5850 6060 6130 6250 6470 6590 6820 7000 7190
United Kingdom 5286 5309 6126 7093 7905 7386 8670 9094 9310
European Union 3635 3567 4310 5327 5825 5239 5909 6725 00
Brazil 983 894 624 740 796 939 1060 1622 1883
Japan 6636 5719 6112 6791 6998 6170 6180 6599 5694
India 144 143 148 162 176 185 196 235 221
China 217 252 287 324 370 432 509 632 00
Canada 4370 4182 4297 5334 5855 6199 6384 7786 7738
Australia 3737 3545 4040 5608 5956 5946 6661 7714 8497
Mexico 771 910 853 849 896 993 1038
Russia 197 266 342 469 606 743 1011 1381 1812
South Africa 1641 1139 1760 2384 3021 2748 2699
Note The EU wage is an average of Germany France Italy and Spain
842019 Impact of Inflation on Purchasing Power
httpslidepdfcomreaderfullimpact-of-inflation-on-purchasing-power 2434
PURCHASING POWER PARITY
The purchasing power parity (PPP) theory uses the long-term equilibrium exchange
rate of two currencies to equalize their purchasing power Developed by Gustav Cassel in1920 it is based on the law of one price the theory states that in ideally efficientmarkets identical goods should have only one price
This purchasing power SEM rate equalizes the purchasing power of different currenciesin their home countries for a given basket of goods Using a PPP basis is arguably moreuseful when comparing differences in living standards on the whole between nations because PPP takes into account the relative cost of living and the inflation rates of different countries rather than just a nominal gross domestic product (GDP) comparisonThe best-known and most-used purchasing power parity exchange rate is the Geary-Khakis dollar (the international dollar)
PPP exchange rates (the real exchange rate) fluctuations are mostly due to marketexchange rates movements Aside from this volatility consistent deviations of the marketand PPP exchange rates are observed for example (market exchange rate) prices of non-traded goods and services are usually lower where incomes are lower (A US dollar exchanged and spent in India will buy more haircuts than a dollar spent in the UnitedStates) PPP takes into account this lower cost of living and adjusts for it as though allincome was spent locally In other words PPP is the amount of a certain basket of basicgoods which can be bought in the given country with the money it produces
There can be marked differences between PPP and market exchange rates [1] For
example the World Banks World Development Indicators 2005 estimated that in 2003one United States dollar was equivalent to about 18 Chinese Yuan by purchasing power parity [2] - considerably different from the nominal exchange rate that put one dollar equalto 76 Yuan This discrepancy has large implications for instance GDP per capita in thePeoples Republic of China is about US$1800 while on a PPP basis it is about US$7204This is frequently used to assert that China is the worlds second-largest economy butsuch a calculation would only be valid under the PPP theory At the other extremeJapans nominal GDP per capita is around US$37600 but its PPP figure is onlyUS$30615
842019 Impact of Inflation on Purchasing Power
httpslidepdfcomreaderfullimpact-of-inflation-on-purchasing-power 2534
First letrsquos look at the situation of domestic buying Gustav Cassel developed the purchasing power parity (PPP) theory in 1920 to compare the purchasing power of different currencies in their home countries based on the assumption that identical goodsshould have the same price (law of one price) PPP exchange rate is defined in Equation1
For
Dom
P
P PPP = (Eq 1)
Where PDom is domestic price and PFor is foreign price
The relative purchasing power parity relates the inflation rate (change of prices) in eachcountry to the change in the market exchange rate and is given in Equation 2
Dom
t
Dom
t
For t
For t
rel
P P
P P PPP
1
1
minus
minus
= (Eq 2)
Where Pt is the price level in period t To calculate the relative purchasing power parityof all of the goods and services consumed in a country we can substitute P t with theconsumer price index (CPI) of that country which leads to Equation 3
Dom
t
Dom
t
For
t
For
t
rel
CPI CPI
CPI CPI PPP
1
1
minus
minus
= (Eq 3)
Figure 1 shows the consumer price indexes of thirteen relatively large countries or economies The inflation rate is higher in the emerging economies than in the developedcountries because of the higher rate of economic growth
Figure 2 shows the changes in relative purchasing power parity of the above economiescalculated by Equation 3 By this calculation one may conclude that the US dollar hasappreciated against the Mexican Indian South African Brazilian and Russian currencies
by 10 to 217 while depreciated against the Australian European Canadian BritishChinese and Saudi Arabian currencies by 1 to 10 from 2000 to 2008 if theconsumptions are domestic This can be attributed to the difference in inflation rate of these countries Japanrsquos disinflation condition between 2000 and 2008 caused the USdollar to weaken approximately 20 over the same time period
842019 Impact of Inflation on Purchasing Power
httpslidepdfcomreaderfullimpact-of-inflation-on-purchasing-power 2634
The International Monetary Fund (IMF) has conducted similar calculation that includesmore factors such as gross domestic product (GDP) The PPP exchange rates published by the IMF are displayed in the following Figure 3 The data shown in Figure 2 areconsistent with the IMF data
It was recognized by many economists that the PPP exchange rate calculation is not perfect because of the difficulties in finding the same baskets of goods to compare acrosscountries The weighing of goods and services in the CPI index is not identical amongdifferent countries Often times the quality of goods and service purchased variesconsiderably for example Americans probably drive better cars and drink cleaner water than many people in developing countries Moreover many social benefits offered bythe welfare countries may not be included in the CPI calculations and this makes directcomparison of purchasing power difficult Nevertheless this methodology gives us arough idea how consumers are doing in different economies
REAL EXCHANGE RATE IN INTERNATIONAL TRADE
When consumers or businesses purchase goods and services from foreign countries theywill need to exchange the available domestic currency to foreign currencies in order tofulfill the trade The price of one currency in terms of another currency is called theexchange rate and it is determined by the currency market and in some cases by
individual governments The exchange rates of twelve foreign currencies to the USdollar from 2000 to 2008 are shown in Table 1 The US dollar depreciated against mostcurrencies in terms of market exchange rate after 2002 except for the Mexican Peso andBrazilian Real (until 2006)
Many people misunderstand the real prices if only the nominal (market) exchange rate isconsidered for the trade For example a three-bedroom apartment in China costs about1500000 Yuan while a similar apartment in the US cost about 400000 Dollar A post-doctorate position in Oxford University in England is paid about 40000 Pound per year
while a similar position in Massachusetts Institute of Technology in the US is paid60000 Dollar per year The market exchange rates do not reflect the real difference of the prices Therefore the real exchange rate which considers both the nominal exchangerate and prices should be used for international trade The real exchange rate is definedin Equation 4
For
Dom
P
P E Rate Exchangeal min Noe Rate Exchangeal Re times= )()( (Eq 4)
842019 Impact of Inflation on Purchasing Power
httpslidepdfcomreaderfullimpact-of-inflation-on-purchasing-power 2734
where PDom is domestic price and PFor is foreign price Using the above two examplesthe real exchange rates would be 18 Chinese apartment = 1 American apartment and075 Oxford salary = 1 MIT salary in 2008
If we substitute prices with CPI indexes in the above equation the real exchange for allthe goods and services can be estimated by Equation 5
For
Dom
CPI
CPI E e times= (Eq 5)
Figure 4 and Figure 5 show the percent changes of nominal exchange rate and real (CPI)exchange rate from 2000 to 2008 and the values are not the same When inflation (price
change) rates are taken into account the dollar actually strengthens against the JapaneseYen and Saudi Arabian Riyal while the advantage over the Peso and the Real (until 2005)diminished The magnitude of depreciation of the US dollar against the British Poundthe Euro the Canadian Dollar and the Chinese Yuan is 2-5 better in the real rate thanin the nominal rate On the other hand the dollar depreciated more against the IndianRupee the South African Rand (after 2002) and the Russian Ruble in the real rate than inthe nominal rate The real rate and the nominal rate for the Australian dollar are verysimilar This analysis indicates that one would make different decisions in buyingforeign goods and services when using the real exchange rate versus the nominalexchange rate
In addition if we compare the data in Figure 2 and Figure 5 it is obvious that the PPPexchange rate fluctuates less dramatically than the foreign exchange rate (except theRussian Ruble) In other words foreign exchange rates affect international trade morethan domestic consumption
WAGE FACTOR
Most consumers except the unemployed and retirees earn wages to make a livingEmployers usually give employees a small wages increase every year to offset inflationFigure 6 shows the percentage of wage increase in different countries The wage increasein the US EU and India is a few percent less than inflation over eight years while thewages in Canada Brazil and Australia outpaced inflation by a few percents in the same period The wage increase in UK Mexico South Africa China and Russia is even faster
842019 Impact of Inflation on Purchasing Power
httpslidepdfcomreaderfullimpact-of-inflation-on-purchasing-power 2834
double to triple digits gain over inflation is observed in these nations Japanrsquos wage isstagnant (or dropping slightly) from 2000 to 2008 It is unclear what exactly causes thesedifferences one may speculate that it may relate to the fiscal condition and account balance of the nations as well as how the governments want to regulate their economyFor example commodity producing countries is benefited from the recent purge of
commodity prices China has a large trade surplus the Japanese prices may have comedown from a very high level from decays ago It will be interested to see how the fastwage increase in some nations would impact their inflation situation in the future
The difference in wage changes certainly would have an impact to consumerrsquos purchasing power If we modify Equation 3 and Equation 5 for calculating relative PPPand real (CPI) exchange rate by a wage factor the following equations will results
For
t
For
t
Dom
t
Dom
t
Dom
t
Dom
t
For
t
For
t
rel
W W
W W
CPI CPI
CPI CPI PPP
1
1
1
1
minus
minus
minus
minus
times= (Eq 6)
For
Dom
For
Dom
W
W
CPI
CPI E e timestimes= (Eq 7)
where W denotes wages Using this modified calculation both domestic and foreign purchasing power will change Figure 7 and Figure 8 shows the relative PPP and realexchange rate after adjusting for wage increase After adjusting for wages the relativePPP become almost the same for the US EU Canada Japan (until 2007) India andBrazil (after 2006) Australia UK South Africa Mexico become the out performerswhich is not the case without adjusting for wages China and Russia demonstrate the bestimprovement in relative PPP because of the large increase of their wages
After adjusting for wages the buying power of Americans in international marketsweakens further relative to most foreign consumers except the Japanese Meanwhile thedepreciation of the US dollar against the Euro is about 5 less than before adjustment(using the 2008 figure) because of the wage advantage for Americans As pointed outearlier there are pitfalls for direct cross-comparison using the CPI index Additionallyother factors such as taxation may complicate the purchasing power calculation For example American income taxes are less than many industrialized countries while poorer nations probably donrsquot tax on income as much
842019 Impact of Inflation on Purchasing Power
httpslidepdfcomreaderfullimpact-of-inflation-on-purchasing-power 2934
Based on the above analysis the emerging economies have made big progress inenhancing the international purchasing power of their citizens thanks to increases of international trade employment and work force productivity Having said that the gap
of incomes between citizens of developed and developing countries are still quite large asshown in the Table 2 Additionally the consequences of environmental damages andincreased energy consumptions in developing countries due to rapid industrialization may be debatable issues
842019 Impact of Inflation on Purchasing Power
httpslidepdfcomreaderfullimpact-of-inflation-on-purchasing-power 3034
Conclusion
Exchange rate pricesinflation and wage level influence the purchasing power of consumers in domestic and international markets The domestic purchasing power ismainly affected by the inflation rate of individual countries and it is relatively equitableacross mature economies The international purchasing power is more volatile and isaffected by both exchange rate and prices Wage changes can further compensate or deprive purchasing power of consumers Analysis of current exchange rates prices andwages leads to the belief that foreign shoppers can get better bargains in Japan and theUS at the present time Consumers in emerging economies especially China and Russiahave experienced significant improvement in purchasing power recently when compared
to themselves They may catch up with the living standard of rich countries in the futureif this growth rate sustains Finally it will be interesting to research the fundamentaleconomic forces which influence the gauges that are measured in the articleWhen prices are rising you can buy less with a given amount of money When hotdogsare expensive a given amount of money will buy a small number of hotdogs But whenhotdogs are inexpensive that is the price is low your given hot dog allowance will purchase a lot more satisfaction There is a relationship between prices and purchasing power that is a reciprocal relationship and thatrsquos the relationship that wersquore going to bestudying in this lesson When prices are going from low prices to high prices that iswhen there is inflation in the economy the value of the dollar is shrinking that is your Purchasing power is going from being able to buy a lot to being able to buy a little Inthis lesson Irsquom going to begin by giving a simple numerical example and then wersquoll talk about how you can use the GDP deflator to show the relationship between the inflationrate and purchasing power
Letrsquos start by assuming that we are in a period of inflation and letrsquos let hotdogs be arepresentative good that is the price of all goods and services across the economy isincreasing at some general rate and wersquore going to look at the price of hotdogs in order toinfer what is happening to purchasing power as prices are rising Wersquore going to befocusing now on the reciprocal relationship between the price level and the purchasing power of the dollar that is what a dollar will buy as the price level is changing And Irsquovewritten out here as clearly as I can the formula that shows this reciprocal relationship thatis one over the price level equals the purchasing power of a dollar Let me make thisvery clear Letrsquos suppose that the price of a hotdog is five cents Well whatrsquos the purchasing power of your dollar Five cents is the same thing as one twentieth of adollar Therefore the reciprocal of one twentieth is twenty Your dollar will buy twentyhotdogs Thatrsquos its purchasing power
842019 Impact of Inflation on Purchasing Power
httpslidepdfcomreaderfullimpact-of-inflation-on-purchasing-power 3134
Now suppose wersquore in a period of inflation so that prices are rising and the price of ahotdog goes up to two dollars Whatrsquos happened to your purchasing power Well your dollar will no longer buy even a whole hotdog Two dollars or 2 has a reciprocal of onehalf that is you can now only afford half a hotdog Your purchasing power has shrunk from twenty hotdogs at a price of five cents a piece to one half a hotdog whenever the
price is two dollars per hotdog This simple example makes clear that the price level andthe purchasing power of the dollar are reciprocals
Now letrsquos look at some examples using the GDP deflator Suppose that wersquore in the year 2000 which is our base year for calculating the GDP deflator and we calculate the priceof a market basket of goods and services- that is a little bit of Housing and a little bit of transportation a little bit of medical care a little bit of clothingetc And wersquore going to call the price level in the year 2000 one hundred because itrsquos our base year
We look at those prices again in 2002 and we find that the price of the goods and
services as a ratio of the same prices in 2000 is equal to 104 That is prices haveincreased by about 4 percent between the year 2000 and 2002 So if we write the GDPdeflator not in the form we usually write it that is multiplied by 100 to get 104 but letrsquoswrite it now as in hundredths 104 to show the 4 percent increase in prices between theyear 2000 and 2002 Well whatrsquos happened to the purchasing power of a dollar betweenthe year 2000 and 2002 That is how much can we afford to buy in 2002 with a dollar if we measure it in the prices of the year 2000 Prices are higher in 2002 therefore thedollar wonrsquot buy as much Well if you takethe reciprocal of the GDP deflator 104 you get 096 Whatrsquos that saying Itrsquos saying thatwhat you could have bought for 96 cents back in the year 2000 now it costs you a dollar to buy in 2002 That is a dollar in 2002 is only worth what 96 cents was worth back inthe year 2000 You can afford to buy less Your purchasing power has shrunk by about 4 percent Your purchasing power shrinks at the same rate that the price level increases because the price level and your purchasing power are reciprocals of each other
Well letrsquos take another example during a period of deflation If we look at the years between 1929 and 1933 wersquoll see falling prices If we choose 1929 as the base year andif we call the price level in that 200000 or 100 if we look at prices in 1933 during thegreat depression we see that the price level has fallen by about 24 percent That is wersquovegone from 100 down to 076 So we now have lower prices in 1933 than we had in 1929
Now what does that mean What is going to happen to the purchasing power of your dollar when prices are lower Itrsquos clearly going to increase Yoursquore going to go from asmall purchasing power to a bigger purchasing power And if you takethe reciprocal of 76 percent you get 132 That is the purchasing power of the dollar hasincreased by about 32 percent in this example Now the reason the numbers donrsquot add upexactly the reason I canrsquot say a 24 percent decrease in prices is equal to a 24 percentincrease in purchasing power is because once your percentages start getting large yourun into this problem that a fifty percent increase is sorry that a 100 percent increase isthe reciprocal of a 50 percent decrease you wind up with this problem that wersquove
842019 Impact of Inflation on Purchasing Power
httpslidepdfcomreaderfullimpact-of-inflation-on-purchasing-power 3234
discussed earlier about the calculation of percentage changes but you can still use thisformula any time it always works One over the price level gives you the purchasing power of the dollar and when the price level is only 76 percent what it was before your purchasing power is going to be 132 percent of what it was before Falling prices give us an increase in the purchasing power of the dollar
842019 Impact of Inflation on Purchasing Power
httpslidepdfcomreaderfullimpact-of-inflation-on-purchasing-power 3334
REFERENCES
1 httpwwwworldsalariesorg
2 International Monetary Fund World Economic Outlook Database September
2006
3 Website of Australian Bureau of Statistics
4 Website of Blanco de Mexico
5 Website of Bank of England
6 Website of Central Bank of Brazil
7 Website of European Central bank
8 Website of International Organization of Labor
9 Website of the Labor Department of India
10 Website of the Ministry of Economics and Planning of Saudi Arabia
11 Website of the Ministry of Finance of the Russian Federation
12 Website of National Bureau of Statistics of China
13 Website of Statistics Bureau of Japan
14 Website of Statistics Canada
15 Website of Statistics South Africa
16 Website of the United States Labor Department
17 Website of Wikipedia on purchasing power parity and consumer price index
842019 Impact of Inflation on Purchasing Power
httpslidepdfcomreaderfullimpact-of-inflation-on-purchasing-power 3434
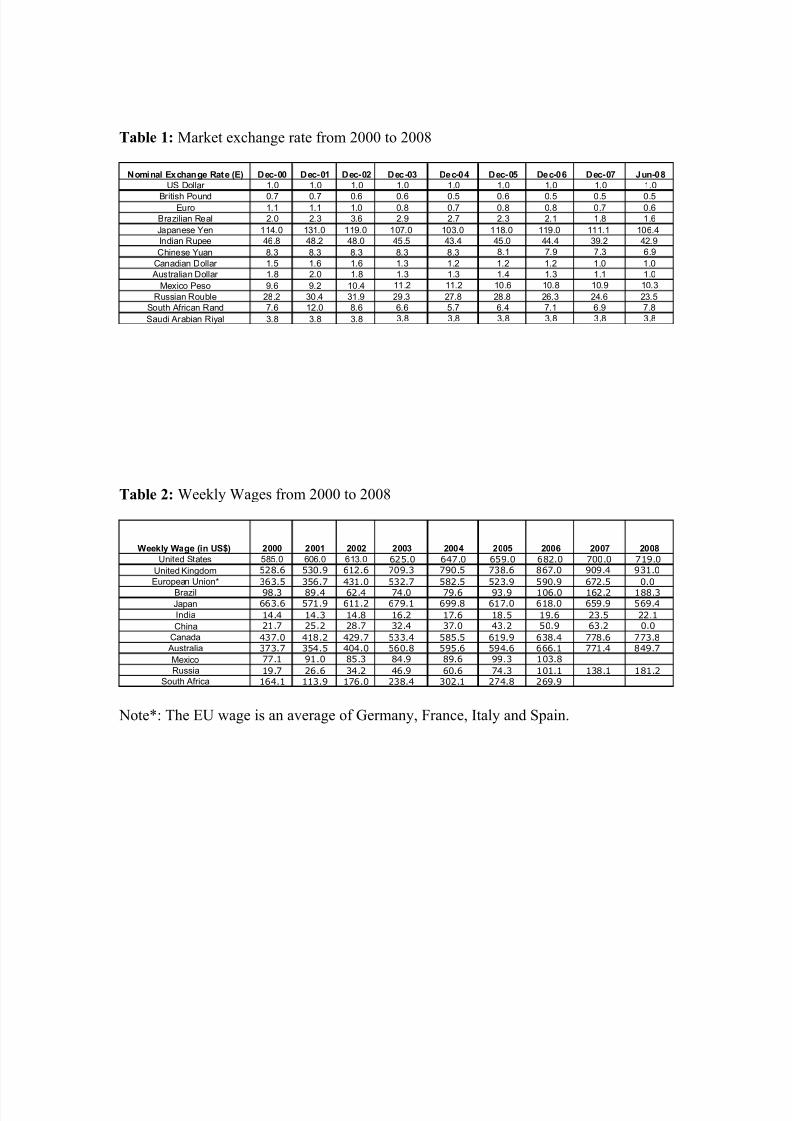
842019 Impact of Inflation on Purchasing Power
httpslidepdfcomreaderfullimpact-of-inflation-on-purchasing-power 2334
Table 1 Market exchange rate from 2000 to 2008
Nominal Exchange Rate (E) Dec-00 Dec-01 Dec-02 Dec-03 Dec-04 Dec-05 Dec-06 Dec-07 Jun-08US Dollar 10 10 10 10 10 10 10 10 10
British Pound 07 07 06 06 05 06 05 05 05Euro 11 11 10 08 07 08 08 07 06
Brazilian Real 20 23 36 29 27 23 21 18 16
Japanese Yen 1140 1310 1190 1070 1030 1180 1190 1111 1064Indian Rupee 468 482 480 455 434 450 444 392 429
Chinese Yuan 83 83 83 83 83 81 79 73 69
Canadian Dollar 15 16 16 13 12 12 12 10 10Australian Dollar 18 20 18 13 13 14 13 11 10
Mexico Peso 96 92 104 112 112 106 108 109 103
Russian Rouble 282 304 319 293 278 288 263 246 235South African Rand 76 120 86 66 57 64 71 69 78
Saudi Arabian Riyal 38 38 38 38 38 38 38 38 38
Table 2 Weekly Wages from 2000 to 2008
Weekly Wage (in US$) 2000 2001 2002 2003 2004 2005 2006 2007 2008United States 5850 6060 6130 6250 6470 6590 6820 7000 7190
United Kingdom 5286 5309 6126 7093 7905 7386 8670 9094 9310
European Union 3635 3567 4310 5327 5825 5239 5909 6725 00
Brazil 983 894 624 740 796 939 1060 1622 1883
Japan 6636 5719 6112 6791 6998 6170 6180 6599 5694
India 144 143 148 162 176 185 196 235 221
China 217 252 287 324 370 432 509 632 00
Canada 4370 4182 4297 5334 5855 6199 6384 7786 7738
Australia 3737 3545 4040 5608 5956 5946 6661 7714 8497
Mexico 771 910 853 849 896 993 1038
Russia 197 266 342 469 606 743 1011 1381 1812
South Africa 1641 1139 1760 2384 3021 2748 2699
Note The EU wage is an average of Germany France Italy and Spain
842019 Impact of Inflation on Purchasing Power
httpslidepdfcomreaderfullimpact-of-inflation-on-purchasing-power 2434
PURCHASING POWER PARITY
The purchasing power parity (PPP) theory uses the long-term equilibrium exchange
rate of two currencies to equalize their purchasing power Developed by Gustav Cassel in1920 it is based on the law of one price the theory states that in ideally efficientmarkets identical goods should have only one price
This purchasing power SEM rate equalizes the purchasing power of different currenciesin their home countries for a given basket of goods Using a PPP basis is arguably moreuseful when comparing differences in living standards on the whole between nations because PPP takes into account the relative cost of living and the inflation rates of different countries rather than just a nominal gross domestic product (GDP) comparisonThe best-known and most-used purchasing power parity exchange rate is the Geary-Khakis dollar (the international dollar)
PPP exchange rates (the real exchange rate) fluctuations are mostly due to marketexchange rates movements Aside from this volatility consistent deviations of the marketand PPP exchange rates are observed for example (market exchange rate) prices of non-traded goods and services are usually lower where incomes are lower (A US dollar exchanged and spent in India will buy more haircuts than a dollar spent in the UnitedStates) PPP takes into account this lower cost of living and adjusts for it as though allincome was spent locally In other words PPP is the amount of a certain basket of basicgoods which can be bought in the given country with the money it produces
There can be marked differences between PPP and market exchange rates [1] For
example the World Banks World Development Indicators 2005 estimated that in 2003one United States dollar was equivalent to about 18 Chinese Yuan by purchasing power parity [2] - considerably different from the nominal exchange rate that put one dollar equalto 76 Yuan This discrepancy has large implications for instance GDP per capita in thePeoples Republic of China is about US$1800 while on a PPP basis it is about US$7204This is frequently used to assert that China is the worlds second-largest economy butsuch a calculation would only be valid under the PPP theory At the other extremeJapans nominal GDP per capita is around US$37600 but its PPP figure is onlyUS$30615
842019 Impact of Inflation on Purchasing Power
httpslidepdfcomreaderfullimpact-of-inflation-on-purchasing-power 2534
First letrsquos look at the situation of domestic buying Gustav Cassel developed the purchasing power parity (PPP) theory in 1920 to compare the purchasing power of different currencies in their home countries based on the assumption that identical goodsshould have the same price (law of one price) PPP exchange rate is defined in Equation1
For
Dom
P
P PPP = (Eq 1)
Where PDom is domestic price and PFor is foreign price
The relative purchasing power parity relates the inflation rate (change of prices) in eachcountry to the change in the market exchange rate and is given in Equation 2
Dom
t
Dom
t
For t
For t
rel
P P
P P PPP
1
1
minus
minus
= (Eq 2)
Where Pt is the price level in period t To calculate the relative purchasing power parityof all of the goods and services consumed in a country we can substitute P t with theconsumer price index (CPI) of that country which leads to Equation 3
Dom
t
Dom
t
For
t
For
t
rel
CPI CPI
CPI CPI PPP
1
1
minus
minus
= (Eq 3)
Figure 1 shows the consumer price indexes of thirteen relatively large countries or economies The inflation rate is higher in the emerging economies than in the developedcountries because of the higher rate of economic growth
Figure 2 shows the changes in relative purchasing power parity of the above economiescalculated by Equation 3 By this calculation one may conclude that the US dollar hasappreciated against the Mexican Indian South African Brazilian and Russian currencies
by 10 to 217 while depreciated against the Australian European Canadian BritishChinese and Saudi Arabian currencies by 1 to 10 from 2000 to 2008 if theconsumptions are domestic This can be attributed to the difference in inflation rate of these countries Japanrsquos disinflation condition between 2000 and 2008 caused the USdollar to weaken approximately 20 over the same time period
842019 Impact of Inflation on Purchasing Power
httpslidepdfcomreaderfullimpact-of-inflation-on-purchasing-power 2634
The International Monetary Fund (IMF) has conducted similar calculation that includesmore factors such as gross domestic product (GDP) The PPP exchange rates published by the IMF are displayed in the following Figure 3 The data shown in Figure 2 areconsistent with the IMF data
It was recognized by many economists that the PPP exchange rate calculation is not perfect because of the difficulties in finding the same baskets of goods to compare acrosscountries The weighing of goods and services in the CPI index is not identical amongdifferent countries Often times the quality of goods and service purchased variesconsiderably for example Americans probably drive better cars and drink cleaner water than many people in developing countries Moreover many social benefits offered bythe welfare countries may not be included in the CPI calculations and this makes directcomparison of purchasing power difficult Nevertheless this methodology gives us arough idea how consumers are doing in different economies
REAL EXCHANGE RATE IN INTERNATIONAL TRADE
When consumers or businesses purchase goods and services from foreign countries theywill need to exchange the available domestic currency to foreign currencies in order tofulfill the trade The price of one currency in terms of another currency is called theexchange rate and it is determined by the currency market and in some cases by
individual governments The exchange rates of twelve foreign currencies to the USdollar from 2000 to 2008 are shown in Table 1 The US dollar depreciated against mostcurrencies in terms of market exchange rate after 2002 except for the Mexican Peso andBrazilian Real (until 2006)
Many people misunderstand the real prices if only the nominal (market) exchange rate isconsidered for the trade For example a three-bedroom apartment in China costs about1500000 Yuan while a similar apartment in the US cost about 400000 Dollar A post-doctorate position in Oxford University in England is paid about 40000 Pound per year
while a similar position in Massachusetts Institute of Technology in the US is paid60000 Dollar per year The market exchange rates do not reflect the real difference of the prices Therefore the real exchange rate which considers both the nominal exchangerate and prices should be used for international trade The real exchange rate is definedin Equation 4
For
Dom
P
P E Rate Exchangeal min Noe Rate Exchangeal Re times= )()( (Eq 4)
842019 Impact of Inflation on Purchasing Power
httpslidepdfcomreaderfullimpact-of-inflation-on-purchasing-power 2734
where PDom is domestic price and PFor is foreign price Using the above two examplesthe real exchange rates would be 18 Chinese apartment = 1 American apartment and075 Oxford salary = 1 MIT salary in 2008
If we substitute prices with CPI indexes in the above equation the real exchange for allthe goods and services can be estimated by Equation 5
For
Dom
CPI
CPI E e times= (Eq 5)
Figure 4 and Figure 5 show the percent changes of nominal exchange rate and real (CPI)exchange rate from 2000 to 2008 and the values are not the same When inflation (price
change) rates are taken into account the dollar actually strengthens against the JapaneseYen and Saudi Arabian Riyal while the advantage over the Peso and the Real (until 2005)diminished The magnitude of depreciation of the US dollar against the British Poundthe Euro the Canadian Dollar and the Chinese Yuan is 2-5 better in the real rate thanin the nominal rate On the other hand the dollar depreciated more against the IndianRupee the South African Rand (after 2002) and the Russian Ruble in the real rate than inthe nominal rate The real rate and the nominal rate for the Australian dollar are verysimilar This analysis indicates that one would make different decisions in buyingforeign goods and services when using the real exchange rate versus the nominalexchange rate
In addition if we compare the data in Figure 2 and Figure 5 it is obvious that the PPPexchange rate fluctuates less dramatically than the foreign exchange rate (except theRussian Ruble) In other words foreign exchange rates affect international trade morethan domestic consumption
WAGE FACTOR
Most consumers except the unemployed and retirees earn wages to make a livingEmployers usually give employees a small wages increase every year to offset inflationFigure 6 shows the percentage of wage increase in different countries The wage increasein the US EU and India is a few percent less than inflation over eight years while thewages in Canada Brazil and Australia outpaced inflation by a few percents in the same period The wage increase in UK Mexico South Africa China and Russia is even faster
842019 Impact of Inflation on Purchasing Power
httpslidepdfcomreaderfullimpact-of-inflation-on-purchasing-power 2834
double to triple digits gain over inflation is observed in these nations Japanrsquos wage isstagnant (or dropping slightly) from 2000 to 2008 It is unclear what exactly causes thesedifferences one may speculate that it may relate to the fiscal condition and account balance of the nations as well as how the governments want to regulate their economyFor example commodity producing countries is benefited from the recent purge of
commodity prices China has a large trade surplus the Japanese prices may have comedown from a very high level from decays ago It will be interested to see how the fastwage increase in some nations would impact their inflation situation in the future
The difference in wage changes certainly would have an impact to consumerrsquos purchasing power If we modify Equation 3 and Equation 5 for calculating relative PPPand real (CPI) exchange rate by a wage factor the following equations will results
For
t
For
t
Dom
t
Dom
t
Dom
t
Dom
t
For
t
For
t
rel
W W
W W
CPI CPI
CPI CPI PPP
1
1
1
1
minus
minus
minus
minus
times= (Eq 6)
For
Dom
For
Dom
W
W
CPI
CPI E e timestimes= (Eq 7)
where W denotes wages Using this modified calculation both domestic and foreign purchasing power will change Figure 7 and Figure 8 shows the relative PPP and realexchange rate after adjusting for wage increase After adjusting for wages the relativePPP become almost the same for the US EU Canada Japan (until 2007) India andBrazil (after 2006) Australia UK South Africa Mexico become the out performerswhich is not the case without adjusting for wages China and Russia demonstrate the bestimprovement in relative PPP because of the large increase of their wages
After adjusting for wages the buying power of Americans in international marketsweakens further relative to most foreign consumers except the Japanese Meanwhile thedepreciation of the US dollar against the Euro is about 5 less than before adjustment(using the 2008 figure) because of the wage advantage for Americans As pointed outearlier there are pitfalls for direct cross-comparison using the CPI index Additionallyother factors such as taxation may complicate the purchasing power calculation For example American income taxes are less than many industrialized countries while poorer nations probably donrsquot tax on income as much
842019 Impact of Inflation on Purchasing Power
httpslidepdfcomreaderfullimpact-of-inflation-on-purchasing-power 2934
Based on the above analysis the emerging economies have made big progress inenhancing the international purchasing power of their citizens thanks to increases of international trade employment and work force productivity Having said that the gap
of incomes between citizens of developed and developing countries are still quite large asshown in the Table 2 Additionally the consequences of environmental damages andincreased energy consumptions in developing countries due to rapid industrialization may be debatable issues
842019 Impact of Inflation on Purchasing Power
httpslidepdfcomreaderfullimpact-of-inflation-on-purchasing-power 3034
Conclusion
Exchange rate pricesinflation and wage level influence the purchasing power of consumers in domestic and international markets The domestic purchasing power ismainly affected by the inflation rate of individual countries and it is relatively equitableacross mature economies The international purchasing power is more volatile and isaffected by both exchange rate and prices Wage changes can further compensate or deprive purchasing power of consumers Analysis of current exchange rates prices andwages leads to the belief that foreign shoppers can get better bargains in Japan and theUS at the present time Consumers in emerging economies especially China and Russiahave experienced significant improvement in purchasing power recently when compared
to themselves They may catch up with the living standard of rich countries in the futureif this growth rate sustains Finally it will be interesting to research the fundamentaleconomic forces which influence the gauges that are measured in the articleWhen prices are rising you can buy less with a given amount of money When hotdogsare expensive a given amount of money will buy a small number of hotdogs But whenhotdogs are inexpensive that is the price is low your given hot dog allowance will purchase a lot more satisfaction There is a relationship between prices and purchasing power that is a reciprocal relationship and thatrsquos the relationship that wersquore going to bestudying in this lesson When prices are going from low prices to high prices that iswhen there is inflation in the economy the value of the dollar is shrinking that is your Purchasing power is going from being able to buy a lot to being able to buy a little Inthis lesson Irsquom going to begin by giving a simple numerical example and then wersquoll talk about how you can use the GDP deflator to show the relationship between the inflationrate and purchasing power
Letrsquos start by assuming that we are in a period of inflation and letrsquos let hotdogs be arepresentative good that is the price of all goods and services across the economy isincreasing at some general rate and wersquore going to look at the price of hotdogs in order toinfer what is happening to purchasing power as prices are rising Wersquore going to befocusing now on the reciprocal relationship between the price level and the purchasing power of the dollar that is what a dollar will buy as the price level is changing And Irsquovewritten out here as clearly as I can the formula that shows this reciprocal relationship thatis one over the price level equals the purchasing power of a dollar Let me make thisvery clear Letrsquos suppose that the price of a hotdog is five cents Well whatrsquos the purchasing power of your dollar Five cents is the same thing as one twentieth of adollar Therefore the reciprocal of one twentieth is twenty Your dollar will buy twentyhotdogs Thatrsquos its purchasing power
842019 Impact of Inflation on Purchasing Power
httpslidepdfcomreaderfullimpact-of-inflation-on-purchasing-power 3134
Now suppose wersquore in a period of inflation so that prices are rising and the price of ahotdog goes up to two dollars Whatrsquos happened to your purchasing power Well your dollar will no longer buy even a whole hotdog Two dollars or 2 has a reciprocal of onehalf that is you can now only afford half a hotdog Your purchasing power has shrunk from twenty hotdogs at a price of five cents a piece to one half a hotdog whenever the
price is two dollars per hotdog This simple example makes clear that the price level andthe purchasing power of the dollar are reciprocals
Now letrsquos look at some examples using the GDP deflator Suppose that wersquore in the year 2000 which is our base year for calculating the GDP deflator and we calculate the priceof a market basket of goods and services- that is a little bit of Housing and a little bit of transportation a little bit of medical care a little bit of clothingetc And wersquore going to call the price level in the year 2000 one hundred because itrsquos our base year
We look at those prices again in 2002 and we find that the price of the goods and
services as a ratio of the same prices in 2000 is equal to 104 That is prices haveincreased by about 4 percent between the year 2000 and 2002 So if we write the GDPdeflator not in the form we usually write it that is multiplied by 100 to get 104 but letrsquoswrite it now as in hundredths 104 to show the 4 percent increase in prices between theyear 2000 and 2002 Well whatrsquos happened to the purchasing power of a dollar betweenthe year 2000 and 2002 That is how much can we afford to buy in 2002 with a dollar if we measure it in the prices of the year 2000 Prices are higher in 2002 therefore thedollar wonrsquot buy as much Well if you takethe reciprocal of the GDP deflator 104 you get 096 Whatrsquos that saying Itrsquos saying thatwhat you could have bought for 96 cents back in the year 2000 now it costs you a dollar to buy in 2002 That is a dollar in 2002 is only worth what 96 cents was worth back inthe year 2000 You can afford to buy less Your purchasing power has shrunk by about 4 percent Your purchasing power shrinks at the same rate that the price level increases because the price level and your purchasing power are reciprocals of each other
Well letrsquos take another example during a period of deflation If we look at the years between 1929 and 1933 wersquoll see falling prices If we choose 1929 as the base year andif we call the price level in that 200000 or 100 if we look at prices in 1933 during thegreat depression we see that the price level has fallen by about 24 percent That is wersquovegone from 100 down to 076 So we now have lower prices in 1933 than we had in 1929
Now what does that mean What is going to happen to the purchasing power of your dollar when prices are lower Itrsquos clearly going to increase Yoursquore going to go from asmall purchasing power to a bigger purchasing power And if you takethe reciprocal of 76 percent you get 132 That is the purchasing power of the dollar hasincreased by about 32 percent in this example Now the reason the numbers donrsquot add upexactly the reason I canrsquot say a 24 percent decrease in prices is equal to a 24 percentincrease in purchasing power is because once your percentages start getting large yourun into this problem that a fifty percent increase is sorry that a 100 percent increase isthe reciprocal of a 50 percent decrease you wind up with this problem that wersquove
842019 Impact of Inflation on Purchasing Power
httpslidepdfcomreaderfullimpact-of-inflation-on-purchasing-power 3234
discussed earlier about the calculation of percentage changes but you can still use thisformula any time it always works One over the price level gives you the purchasing power of the dollar and when the price level is only 76 percent what it was before your purchasing power is going to be 132 percent of what it was before Falling prices give us an increase in the purchasing power of the dollar
842019 Impact of Inflation on Purchasing Power
httpslidepdfcomreaderfullimpact-of-inflation-on-purchasing-power 3334
REFERENCES
1 httpwwwworldsalariesorg
2 International Monetary Fund World Economic Outlook Database September
2006
3 Website of Australian Bureau of Statistics
4 Website of Blanco de Mexico
5 Website of Bank of England
6 Website of Central Bank of Brazil
7 Website of European Central bank
8 Website of International Organization of Labor
9 Website of the Labor Department of India
10 Website of the Ministry of Economics and Planning of Saudi Arabia
11 Website of the Ministry of Finance of the Russian Federation
12 Website of National Bureau of Statistics of China
13 Website of Statistics Bureau of Japan
14 Website of Statistics Canada
15 Website of Statistics South Africa
16 Website of the United States Labor Department
17 Website of Wikipedia on purchasing power parity and consumer price index
842019 Impact of Inflation on Purchasing Power
httpslidepdfcomreaderfullimpact-of-inflation-on-purchasing-power 3434
842019 Impact of Inflation on Purchasing Power
httpslidepdfcomreaderfullimpact-of-inflation-on-purchasing-power 2434
PURCHASING POWER PARITY
The purchasing power parity (PPP) theory uses the long-term equilibrium exchange
rate of two currencies to equalize their purchasing power Developed by Gustav Cassel in1920 it is based on the law of one price the theory states that in ideally efficientmarkets identical goods should have only one price
This purchasing power SEM rate equalizes the purchasing power of different currenciesin their home countries for a given basket of goods Using a PPP basis is arguably moreuseful when comparing differences in living standards on the whole between nations because PPP takes into account the relative cost of living and the inflation rates of different countries rather than just a nominal gross domestic product (GDP) comparisonThe best-known and most-used purchasing power parity exchange rate is the Geary-Khakis dollar (the international dollar)
PPP exchange rates (the real exchange rate) fluctuations are mostly due to marketexchange rates movements Aside from this volatility consistent deviations of the marketand PPP exchange rates are observed for example (market exchange rate) prices of non-traded goods and services are usually lower where incomes are lower (A US dollar exchanged and spent in India will buy more haircuts than a dollar spent in the UnitedStates) PPP takes into account this lower cost of living and adjusts for it as though allincome was spent locally In other words PPP is the amount of a certain basket of basicgoods which can be bought in the given country with the money it produces
There can be marked differences between PPP and market exchange rates [1] For
example the World Banks World Development Indicators 2005 estimated that in 2003one United States dollar was equivalent to about 18 Chinese Yuan by purchasing power parity [2] - considerably different from the nominal exchange rate that put one dollar equalto 76 Yuan This discrepancy has large implications for instance GDP per capita in thePeoples Republic of China is about US$1800 while on a PPP basis it is about US$7204This is frequently used to assert that China is the worlds second-largest economy butsuch a calculation would only be valid under the PPP theory At the other extremeJapans nominal GDP per capita is around US$37600 but its PPP figure is onlyUS$30615
842019 Impact of Inflation on Purchasing Power
httpslidepdfcomreaderfullimpact-of-inflation-on-purchasing-power 2534
First letrsquos look at the situation of domestic buying Gustav Cassel developed the purchasing power parity (PPP) theory in 1920 to compare the purchasing power of different currencies in their home countries based on the assumption that identical goodsshould have the same price (law of one price) PPP exchange rate is defined in Equation1
For
Dom
P
P PPP = (Eq 1)
Where PDom is domestic price and PFor is foreign price
The relative purchasing power parity relates the inflation rate (change of prices) in eachcountry to the change in the market exchange rate and is given in Equation 2
Dom
t
Dom
t
For t
For t
rel
P P
P P PPP
1
1
minus
minus
= (Eq 2)
Where Pt is the price level in period t To calculate the relative purchasing power parityof all of the goods and services consumed in a country we can substitute P t with theconsumer price index (CPI) of that country which leads to Equation 3
Dom
t
Dom
t
For
t
For
t
rel
CPI CPI
CPI CPI PPP
1
1
minus
minus
= (Eq 3)
Figure 1 shows the consumer price indexes of thirteen relatively large countries or economies The inflation rate is higher in the emerging economies than in the developedcountries because of the higher rate of economic growth
Figure 2 shows the changes in relative purchasing power parity of the above economiescalculated by Equation 3 By this calculation one may conclude that the US dollar hasappreciated against the Mexican Indian South African Brazilian and Russian currencies
by 10 to 217 while depreciated against the Australian European Canadian BritishChinese and Saudi Arabian currencies by 1 to 10 from 2000 to 2008 if theconsumptions are domestic This can be attributed to the difference in inflation rate of these countries Japanrsquos disinflation condition between 2000 and 2008 caused the USdollar to weaken approximately 20 over the same time period
842019 Impact of Inflation on Purchasing Power
httpslidepdfcomreaderfullimpact-of-inflation-on-purchasing-power 2634
The International Monetary Fund (IMF) has conducted similar calculation that includesmore factors such as gross domestic product (GDP) The PPP exchange rates published by the IMF are displayed in the following Figure 3 The data shown in Figure 2 areconsistent with the IMF data
It was recognized by many economists that the PPP exchange rate calculation is not perfect because of the difficulties in finding the same baskets of goods to compare acrosscountries The weighing of goods and services in the CPI index is not identical amongdifferent countries Often times the quality of goods and service purchased variesconsiderably for example Americans probably drive better cars and drink cleaner water than many people in developing countries Moreover many social benefits offered bythe welfare countries may not be included in the CPI calculations and this makes directcomparison of purchasing power difficult Nevertheless this methodology gives us arough idea how consumers are doing in different economies
REAL EXCHANGE RATE IN INTERNATIONAL TRADE
When consumers or businesses purchase goods and services from foreign countries theywill need to exchange the available domestic currency to foreign currencies in order tofulfill the trade The price of one currency in terms of another currency is called theexchange rate and it is determined by the currency market and in some cases by
individual governments The exchange rates of twelve foreign currencies to the USdollar from 2000 to 2008 are shown in Table 1 The US dollar depreciated against mostcurrencies in terms of market exchange rate after 2002 except for the Mexican Peso andBrazilian Real (until 2006)
Many people misunderstand the real prices if only the nominal (market) exchange rate isconsidered for the trade For example a three-bedroom apartment in China costs about1500000 Yuan while a similar apartment in the US cost about 400000 Dollar A post-doctorate position in Oxford University in England is paid about 40000 Pound per year
while a similar position in Massachusetts Institute of Technology in the US is paid60000 Dollar per year The market exchange rates do not reflect the real difference of the prices Therefore the real exchange rate which considers both the nominal exchangerate and prices should be used for international trade The real exchange rate is definedin Equation 4
For
Dom
P
P E Rate Exchangeal min Noe Rate Exchangeal Re times= )()( (Eq 4)
842019 Impact of Inflation on Purchasing Power
httpslidepdfcomreaderfullimpact-of-inflation-on-purchasing-power 2734
where PDom is domestic price and PFor is foreign price Using the above two examplesthe real exchange rates would be 18 Chinese apartment = 1 American apartment and075 Oxford salary = 1 MIT salary in 2008
If we substitute prices with CPI indexes in the above equation the real exchange for allthe goods and services can be estimated by Equation 5
For
Dom
CPI
CPI E e times= (Eq 5)
Figure 4 and Figure 5 show the percent changes of nominal exchange rate and real (CPI)exchange rate from 2000 to 2008 and the values are not the same When inflation (price
change) rates are taken into account the dollar actually strengthens against the JapaneseYen and Saudi Arabian Riyal while the advantage over the Peso and the Real (until 2005)diminished The magnitude of depreciation of the US dollar against the British Poundthe Euro the Canadian Dollar and the Chinese Yuan is 2-5 better in the real rate thanin the nominal rate On the other hand the dollar depreciated more against the IndianRupee the South African Rand (after 2002) and the Russian Ruble in the real rate than inthe nominal rate The real rate and the nominal rate for the Australian dollar are verysimilar This analysis indicates that one would make different decisions in buyingforeign goods and services when using the real exchange rate versus the nominalexchange rate
In addition if we compare the data in Figure 2 and Figure 5 it is obvious that the PPPexchange rate fluctuates less dramatically than the foreign exchange rate (except theRussian Ruble) In other words foreign exchange rates affect international trade morethan domestic consumption
WAGE FACTOR
Most consumers except the unemployed and retirees earn wages to make a livingEmployers usually give employees a small wages increase every year to offset inflationFigure 6 shows the percentage of wage increase in different countries The wage increasein the US EU and India is a few percent less than inflation over eight years while thewages in Canada Brazil and Australia outpaced inflation by a few percents in the same period The wage increase in UK Mexico South Africa China and Russia is even faster
842019 Impact of Inflation on Purchasing Power
httpslidepdfcomreaderfullimpact-of-inflation-on-purchasing-power 2834
double to triple digits gain over inflation is observed in these nations Japanrsquos wage isstagnant (or dropping slightly) from 2000 to 2008 It is unclear what exactly causes thesedifferences one may speculate that it may relate to the fiscal condition and account balance of the nations as well as how the governments want to regulate their economyFor example commodity producing countries is benefited from the recent purge of
commodity prices China has a large trade surplus the Japanese prices may have comedown from a very high level from decays ago It will be interested to see how the fastwage increase in some nations would impact their inflation situation in the future
The difference in wage changes certainly would have an impact to consumerrsquos purchasing power If we modify Equation 3 and Equation 5 for calculating relative PPPand real (CPI) exchange rate by a wage factor the following equations will results
For
t
For
t
Dom
t
Dom
t
Dom
t
Dom
t
For
t
For
t
rel
W W
W W
CPI CPI
CPI CPI PPP
1
1
1
1
minus
minus
minus
minus
times= (Eq 6)
For
Dom
For
Dom
W
W
CPI
CPI E e timestimes= (Eq 7)
where W denotes wages Using this modified calculation both domestic and foreign purchasing power will change Figure 7 and Figure 8 shows the relative PPP and realexchange rate after adjusting for wage increase After adjusting for wages the relativePPP become almost the same for the US EU Canada Japan (until 2007) India andBrazil (after 2006) Australia UK South Africa Mexico become the out performerswhich is not the case without adjusting for wages China and Russia demonstrate the bestimprovement in relative PPP because of the large increase of their wages
After adjusting for wages the buying power of Americans in international marketsweakens further relative to most foreign consumers except the Japanese Meanwhile thedepreciation of the US dollar against the Euro is about 5 less than before adjustment(using the 2008 figure) because of the wage advantage for Americans As pointed outearlier there are pitfalls for direct cross-comparison using the CPI index Additionallyother factors such as taxation may complicate the purchasing power calculation For example American income taxes are less than many industrialized countries while poorer nations probably donrsquot tax on income as much
842019 Impact of Inflation on Purchasing Power
httpslidepdfcomreaderfullimpact-of-inflation-on-purchasing-power 2934
Based on the above analysis the emerging economies have made big progress inenhancing the international purchasing power of their citizens thanks to increases of international trade employment and work force productivity Having said that the gap
of incomes between citizens of developed and developing countries are still quite large asshown in the Table 2 Additionally the consequences of environmental damages andincreased energy consumptions in developing countries due to rapid industrialization may be debatable issues
842019 Impact of Inflation on Purchasing Power
httpslidepdfcomreaderfullimpact-of-inflation-on-purchasing-power 3034
Conclusion
Exchange rate pricesinflation and wage level influence the purchasing power of consumers in domestic and international markets The domestic purchasing power ismainly affected by the inflation rate of individual countries and it is relatively equitableacross mature economies The international purchasing power is more volatile and isaffected by both exchange rate and prices Wage changes can further compensate or deprive purchasing power of consumers Analysis of current exchange rates prices andwages leads to the belief that foreign shoppers can get better bargains in Japan and theUS at the present time Consumers in emerging economies especially China and Russiahave experienced significant improvement in purchasing power recently when compared
to themselves They may catch up with the living standard of rich countries in the futureif this growth rate sustains Finally it will be interesting to research the fundamentaleconomic forces which influence the gauges that are measured in the articleWhen prices are rising you can buy less with a given amount of money When hotdogsare expensive a given amount of money will buy a small number of hotdogs But whenhotdogs are inexpensive that is the price is low your given hot dog allowance will purchase a lot more satisfaction There is a relationship between prices and purchasing power that is a reciprocal relationship and thatrsquos the relationship that wersquore going to bestudying in this lesson When prices are going from low prices to high prices that iswhen there is inflation in the economy the value of the dollar is shrinking that is your Purchasing power is going from being able to buy a lot to being able to buy a little Inthis lesson Irsquom going to begin by giving a simple numerical example and then wersquoll talk about how you can use the GDP deflator to show the relationship between the inflationrate and purchasing power
Letrsquos start by assuming that we are in a period of inflation and letrsquos let hotdogs be arepresentative good that is the price of all goods and services across the economy isincreasing at some general rate and wersquore going to look at the price of hotdogs in order toinfer what is happening to purchasing power as prices are rising Wersquore going to befocusing now on the reciprocal relationship between the price level and the purchasing power of the dollar that is what a dollar will buy as the price level is changing And Irsquovewritten out here as clearly as I can the formula that shows this reciprocal relationship thatis one over the price level equals the purchasing power of a dollar Let me make thisvery clear Letrsquos suppose that the price of a hotdog is five cents Well whatrsquos the purchasing power of your dollar Five cents is the same thing as one twentieth of adollar Therefore the reciprocal of one twentieth is twenty Your dollar will buy twentyhotdogs Thatrsquos its purchasing power
842019 Impact of Inflation on Purchasing Power
httpslidepdfcomreaderfullimpact-of-inflation-on-purchasing-power 3134
Now suppose wersquore in a period of inflation so that prices are rising and the price of ahotdog goes up to two dollars Whatrsquos happened to your purchasing power Well your dollar will no longer buy even a whole hotdog Two dollars or 2 has a reciprocal of onehalf that is you can now only afford half a hotdog Your purchasing power has shrunk from twenty hotdogs at a price of five cents a piece to one half a hotdog whenever the
price is two dollars per hotdog This simple example makes clear that the price level andthe purchasing power of the dollar are reciprocals
Now letrsquos look at some examples using the GDP deflator Suppose that wersquore in the year 2000 which is our base year for calculating the GDP deflator and we calculate the priceof a market basket of goods and services- that is a little bit of Housing and a little bit of transportation a little bit of medical care a little bit of clothingetc And wersquore going to call the price level in the year 2000 one hundred because itrsquos our base year
We look at those prices again in 2002 and we find that the price of the goods and
services as a ratio of the same prices in 2000 is equal to 104 That is prices haveincreased by about 4 percent between the year 2000 and 2002 So if we write the GDPdeflator not in the form we usually write it that is multiplied by 100 to get 104 but letrsquoswrite it now as in hundredths 104 to show the 4 percent increase in prices between theyear 2000 and 2002 Well whatrsquos happened to the purchasing power of a dollar betweenthe year 2000 and 2002 That is how much can we afford to buy in 2002 with a dollar if we measure it in the prices of the year 2000 Prices are higher in 2002 therefore thedollar wonrsquot buy as much Well if you takethe reciprocal of the GDP deflator 104 you get 096 Whatrsquos that saying Itrsquos saying thatwhat you could have bought for 96 cents back in the year 2000 now it costs you a dollar to buy in 2002 That is a dollar in 2002 is only worth what 96 cents was worth back inthe year 2000 You can afford to buy less Your purchasing power has shrunk by about 4 percent Your purchasing power shrinks at the same rate that the price level increases because the price level and your purchasing power are reciprocals of each other
Well letrsquos take another example during a period of deflation If we look at the years between 1929 and 1933 wersquoll see falling prices If we choose 1929 as the base year andif we call the price level in that 200000 or 100 if we look at prices in 1933 during thegreat depression we see that the price level has fallen by about 24 percent That is wersquovegone from 100 down to 076 So we now have lower prices in 1933 than we had in 1929
Now what does that mean What is going to happen to the purchasing power of your dollar when prices are lower Itrsquos clearly going to increase Yoursquore going to go from asmall purchasing power to a bigger purchasing power And if you takethe reciprocal of 76 percent you get 132 That is the purchasing power of the dollar hasincreased by about 32 percent in this example Now the reason the numbers donrsquot add upexactly the reason I canrsquot say a 24 percent decrease in prices is equal to a 24 percentincrease in purchasing power is because once your percentages start getting large yourun into this problem that a fifty percent increase is sorry that a 100 percent increase isthe reciprocal of a 50 percent decrease you wind up with this problem that wersquove
842019 Impact of Inflation on Purchasing Power
httpslidepdfcomreaderfullimpact-of-inflation-on-purchasing-power 3234
discussed earlier about the calculation of percentage changes but you can still use thisformula any time it always works One over the price level gives you the purchasing power of the dollar and when the price level is only 76 percent what it was before your purchasing power is going to be 132 percent of what it was before Falling prices give us an increase in the purchasing power of the dollar
842019 Impact of Inflation on Purchasing Power
httpslidepdfcomreaderfullimpact-of-inflation-on-purchasing-power 3334
REFERENCES
1 httpwwwworldsalariesorg
2 International Monetary Fund World Economic Outlook Database September
2006
3 Website of Australian Bureau of Statistics
4 Website of Blanco de Mexico
5 Website of Bank of England
6 Website of Central Bank of Brazil
7 Website of European Central bank
8 Website of International Organization of Labor
9 Website of the Labor Department of India
10 Website of the Ministry of Economics and Planning of Saudi Arabia
11 Website of the Ministry of Finance of the Russian Federation
12 Website of National Bureau of Statistics of China
13 Website of Statistics Bureau of Japan
14 Website of Statistics Canada
15 Website of Statistics South Africa
16 Website of the United States Labor Department
17 Website of Wikipedia on purchasing power parity and consumer price index
842019 Impact of Inflation on Purchasing Power
httpslidepdfcomreaderfullimpact-of-inflation-on-purchasing-power 3434
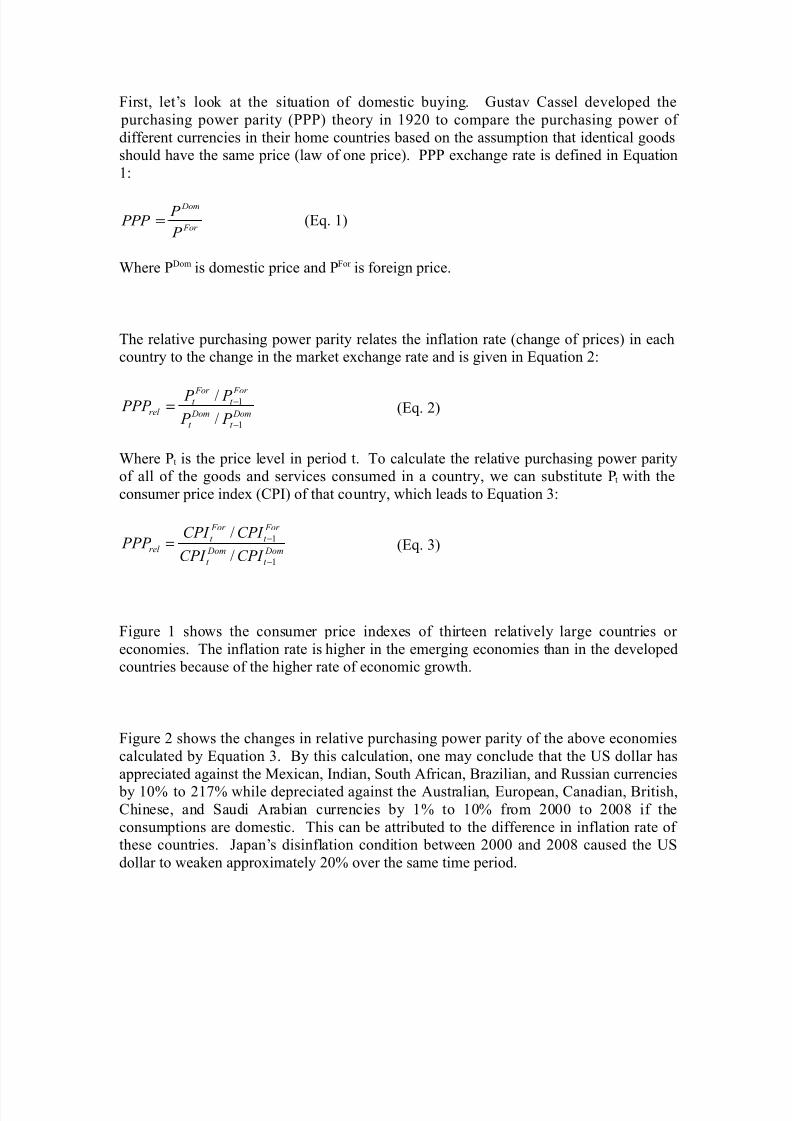
842019 Impact of Inflation on Purchasing Power
httpslidepdfcomreaderfullimpact-of-inflation-on-purchasing-power 2534
First letrsquos look at the situation of domestic buying Gustav Cassel developed the purchasing power parity (PPP) theory in 1920 to compare the purchasing power of different currencies in their home countries based on the assumption that identical goodsshould have the same price (law of one price) PPP exchange rate is defined in Equation1
For
Dom
P
P PPP = (Eq 1)
Where PDom is domestic price and PFor is foreign price
The relative purchasing power parity relates the inflation rate (change of prices) in eachcountry to the change in the market exchange rate and is given in Equation 2
Dom
t
Dom
t
For t
For t
rel
P P
P P PPP
1
1
minus
minus
= (Eq 2)
Where Pt is the price level in period t To calculate the relative purchasing power parityof all of the goods and services consumed in a country we can substitute P t with theconsumer price index (CPI) of that country which leads to Equation 3
Dom
t
Dom
t
For
t
For
t
rel
CPI CPI
CPI CPI PPP
1
1
minus
minus
= (Eq 3)
Figure 1 shows the consumer price indexes of thirteen relatively large countries or economies The inflation rate is higher in the emerging economies than in the developedcountries because of the higher rate of economic growth
Figure 2 shows the changes in relative purchasing power parity of the above economiescalculated by Equation 3 By this calculation one may conclude that the US dollar hasappreciated against the Mexican Indian South African Brazilian and Russian currencies
by 10 to 217 while depreciated against the Australian European Canadian BritishChinese and Saudi Arabian currencies by 1 to 10 from 2000 to 2008 if theconsumptions are domestic This can be attributed to the difference in inflation rate of these countries Japanrsquos disinflation condition between 2000 and 2008 caused the USdollar to weaken approximately 20 over the same time period
842019 Impact of Inflation on Purchasing Power
httpslidepdfcomreaderfullimpact-of-inflation-on-purchasing-power 2634
The International Monetary Fund (IMF) has conducted similar calculation that includesmore factors such as gross domestic product (GDP) The PPP exchange rates published by the IMF are displayed in the following Figure 3 The data shown in Figure 2 areconsistent with the IMF data
It was recognized by many economists that the PPP exchange rate calculation is not perfect because of the difficulties in finding the same baskets of goods to compare acrosscountries The weighing of goods and services in the CPI index is not identical amongdifferent countries Often times the quality of goods and service purchased variesconsiderably for example Americans probably drive better cars and drink cleaner water than many people in developing countries Moreover many social benefits offered bythe welfare countries may not be included in the CPI calculations and this makes directcomparison of purchasing power difficult Nevertheless this methodology gives us arough idea how consumers are doing in different economies
REAL EXCHANGE RATE IN INTERNATIONAL TRADE
When consumers or businesses purchase goods and services from foreign countries theywill need to exchange the available domestic currency to foreign currencies in order tofulfill the trade The price of one currency in terms of another currency is called theexchange rate and it is determined by the currency market and in some cases by
individual governments The exchange rates of twelve foreign currencies to the USdollar from 2000 to 2008 are shown in Table 1 The US dollar depreciated against mostcurrencies in terms of market exchange rate after 2002 except for the Mexican Peso andBrazilian Real (until 2006)
Many people misunderstand the real prices if only the nominal (market) exchange rate isconsidered for the trade For example a three-bedroom apartment in China costs about1500000 Yuan while a similar apartment in the US cost about 400000 Dollar A post-doctorate position in Oxford University in England is paid about 40000 Pound per year
while a similar position in Massachusetts Institute of Technology in the US is paid60000 Dollar per year The market exchange rates do not reflect the real difference of the prices Therefore the real exchange rate which considers both the nominal exchangerate and prices should be used for international trade The real exchange rate is definedin Equation 4
For
Dom
P
P E Rate Exchangeal min Noe Rate Exchangeal Re times= )()( (Eq 4)
842019 Impact of Inflation on Purchasing Power
httpslidepdfcomreaderfullimpact-of-inflation-on-purchasing-power 2734
where PDom is domestic price and PFor is foreign price Using the above two examplesthe real exchange rates would be 18 Chinese apartment = 1 American apartment and075 Oxford salary = 1 MIT salary in 2008
If we substitute prices with CPI indexes in the above equation the real exchange for allthe goods and services can be estimated by Equation 5
For
Dom
CPI
CPI E e times= (Eq 5)
Figure 4 and Figure 5 show the percent changes of nominal exchange rate and real (CPI)exchange rate from 2000 to 2008 and the values are not the same When inflation (price
change) rates are taken into account the dollar actually strengthens against the JapaneseYen and Saudi Arabian Riyal while the advantage over the Peso and the Real (until 2005)diminished The magnitude of depreciation of the US dollar against the British Poundthe Euro the Canadian Dollar and the Chinese Yuan is 2-5 better in the real rate thanin the nominal rate On the other hand the dollar depreciated more against the IndianRupee the South African Rand (after 2002) and the Russian Ruble in the real rate than inthe nominal rate The real rate and the nominal rate for the Australian dollar are verysimilar This analysis indicates that one would make different decisions in buyingforeign goods and services when using the real exchange rate versus the nominalexchange rate
In addition if we compare the data in Figure 2 and Figure 5 it is obvious that the PPPexchange rate fluctuates less dramatically than the foreign exchange rate (except theRussian Ruble) In other words foreign exchange rates affect international trade morethan domestic consumption
WAGE FACTOR
Most consumers except the unemployed and retirees earn wages to make a livingEmployers usually give employees a small wages increase every year to offset inflationFigure 6 shows the percentage of wage increase in different countries The wage increasein the US EU and India is a few percent less than inflation over eight years while thewages in Canada Brazil and Australia outpaced inflation by a few percents in the same period The wage increase in UK Mexico South Africa China and Russia is even faster
842019 Impact of Inflation on Purchasing Power
httpslidepdfcomreaderfullimpact-of-inflation-on-purchasing-power 2834
double to triple digits gain over inflation is observed in these nations Japanrsquos wage isstagnant (or dropping slightly) from 2000 to 2008 It is unclear what exactly causes thesedifferences one may speculate that it may relate to the fiscal condition and account balance of the nations as well as how the governments want to regulate their economyFor example commodity producing countries is benefited from the recent purge of
commodity prices China has a large trade surplus the Japanese prices may have comedown from a very high level from decays ago It will be interested to see how the fastwage increase in some nations would impact their inflation situation in the future
The difference in wage changes certainly would have an impact to consumerrsquos purchasing power If we modify Equation 3 and Equation 5 for calculating relative PPPand real (CPI) exchange rate by a wage factor the following equations will results
For
t
For
t
Dom
t
Dom
t
Dom
t
Dom
t
For
t
For
t
rel
W W
W W
CPI CPI
CPI CPI PPP
1
1
1
1
minus
minus
minus
minus
times= (Eq 6)
For
Dom
For
Dom
W
W
CPI
CPI E e timestimes= (Eq 7)
where W denotes wages Using this modified calculation both domestic and foreign purchasing power will change Figure 7 and Figure 8 shows the relative PPP and realexchange rate after adjusting for wage increase After adjusting for wages the relativePPP become almost the same for the US EU Canada Japan (until 2007) India andBrazil (after 2006) Australia UK South Africa Mexico become the out performerswhich is not the case without adjusting for wages China and Russia demonstrate the bestimprovement in relative PPP because of the large increase of their wages
After adjusting for wages the buying power of Americans in international marketsweakens further relative to most foreign consumers except the Japanese Meanwhile thedepreciation of the US dollar against the Euro is about 5 less than before adjustment(using the 2008 figure) because of the wage advantage for Americans As pointed outearlier there are pitfalls for direct cross-comparison using the CPI index Additionallyother factors such as taxation may complicate the purchasing power calculation For example American income taxes are less than many industrialized countries while poorer nations probably donrsquot tax on income as much
842019 Impact of Inflation on Purchasing Power
httpslidepdfcomreaderfullimpact-of-inflation-on-purchasing-power 2934
Based on the above analysis the emerging economies have made big progress inenhancing the international purchasing power of their citizens thanks to increases of international trade employment and work force productivity Having said that the gap
of incomes between citizens of developed and developing countries are still quite large asshown in the Table 2 Additionally the consequences of environmental damages andincreased energy consumptions in developing countries due to rapid industrialization may be debatable issues
842019 Impact of Inflation on Purchasing Power
httpslidepdfcomreaderfullimpact-of-inflation-on-purchasing-power 3034
Conclusion
Exchange rate pricesinflation and wage level influence the purchasing power of consumers in domestic and international markets The domestic purchasing power ismainly affected by the inflation rate of individual countries and it is relatively equitableacross mature economies The international purchasing power is more volatile and isaffected by both exchange rate and prices Wage changes can further compensate or deprive purchasing power of consumers Analysis of current exchange rates prices andwages leads to the belief that foreign shoppers can get better bargains in Japan and theUS at the present time Consumers in emerging economies especially China and Russiahave experienced significant improvement in purchasing power recently when compared
to themselves They may catch up with the living standard of rich countries in the futureif this growth rate sustains Finally it will be interesting to research the fundamentaleconomic forces which influence the gauges that are measured in the articleWhen prices are rising you can buy less with a given amount of money When hotdogsare expensive a given amount of money will buy a small number of hotdogs But whenhotdogs are inexpensive that is the price is low your given hot dog allowance will purchase a lot more satisfaction There is a relationship between prices and purchasing power that is a reciprocal relationship and thatrsquos the relationship that wersquore going to bestudying in this lesson When prices are going from low prices to high prices that iswhen there is inflation in the economy the value of the dollar is shrinking that is your Purchasing power is going from being able to buy a lot to being able to buy a little Inthis lesson Irsquom going to begin by giving a simple numerical example and then wersquoll talk about how you can use the GDP deflator to show the relationship between the inflationrate and purchasing power
Letrsquos start by assuming that we are in a period of inflation and letrsquos let hotdogs be arepresentative good that is the price of all goods and services across the economy isincreasing at some general rate and wersquore going to look at the price of hotdogs in order toinfer what is happening to purchasing power as prices are rising Wersquore going to befocusing now on the reciprocal relationship between the price level and the purchasing power of the dollar that is what a dollar will buy as the price level is changing And Irsquovewritten out here as clearly as I can the formula that shows this reciprocal relationship thatis one over the price level equals the purchasing power of a dollar Let me make thisvery clear Letrsquos suppose that the price of a hotdog is five cents Well whatrsquos the purchasing power of your dollar Five cents is the same thing as one twentieth of adollar Therefore the reciprocal of one twentieth is twenty Your dollar will buy twentyhotdogs Thatrsquos its purchasing power
842019 Impact of Inflation on Purchasing Power
httpslidepdfcomreaderfullimpact-of-inflation-on-purchasing-power 3134
Now suppose wersquore in a period of inflation so that prices are rising and the price of ahotdog goes up to two dollars Whatrsquos happened to your purchasing power Well your dollar will no longer buy even a whole hotdog Two dollars or 2 has a reciprocal of onehalf that is you can now only afford half a hotdog Your purchasing power has shrunk from twenty hotdogs at a price of five cents a piece to one half a hotdog whenever the
price is two dollars per hotdog This simple example makes clear that the price level andthe purchasing power of the dollar are reciprocals
Now letrsquos look at some examples using the GDP deflator Suppose that wersquore in the year 2000 which is our base year for calculating the GDP deflator and we calculate the priceof a market basket of goods and services- that is a little bit of Housing and a little bit of transportation a little bit of medical care a little bit of clothingetc And wersquore going to call the price level in the year 2000 one hundred because itrsquos our base year
We look at those prices again in 2002 and we find that the price of the goods and
services as a ratio of the same prices in 2000 is equal to 104 That is prices haveincreased by about 4 percent between the year 2000 and 2002 So if we write the GDPdeflator not in the form we usually write it that is multiplied by 100 to get 104 but letrsquoswrite it now as in hundredths 104 to show the 4 percent increase in prices between theyear 2000 and 2002 Well whatrsquos happened to the purchasing power of a dollar betweenthe year 2000 and 2002 That is how much can we afford to buy in 2002 with a dollar if we measure it in the prices of the year 2000 Prices are higher in 2002 therefore thedollar wonrsquot buy as much Well if you takethe reciprocal of the GDP deflator 104 you get 096 Whatrsquos that saying Itrsquos saying thatwhat you could have bought for 96 cents back in the year 2000 now it costs you a dollar to buy in 2002 That is a dollar in 2002 is only worth what 96 cents was worth back inthe year 2000 You can afford to buy less Your purchasing power has shrunk by about 4 percent Your purchasing power shrinks at the same rate that the price level increases because the price level and your purchasing power are reciprocals of each other
Well letrsquos take another example during a period of deflation If we look at the years between 1929 and 1933 wersquoll see falling prices If we choose 1929 as the base year andif we call the price level in that 200000 or 100 if we look at prices in 1933 during thegreat depression we see that the price level has fallen by about 24 percent That is wersquovegone from 100 down to 076 So we now have lower prices in 1933 than we had in 1929
Now what does that mean What is going to happen to the purchasing power of your dollar when prices are lower Itrsquos clearly going to increase Yoursquore going to go from asmall purchasing power to a bigger purchasing power And if you takethe reciprocal of 76 percent you get 132 That is the purchasing power of the dollar hasincreased by about 32 percent in this example Now the reason the numbers donrsquot add upexactly the reason I canrsquot say a 24 percent decrease in prices is equal to a 24 percentincrease in purchasing power is because once your percentages start getting large yourun into this problem that a fifty percent increase is sorry that a 100 percent increase isthe reciprocal of a 50 percent decrease you wind up with this problem that wersquove
842019 Impact of Inflation on Purchasing Power
httpslidepdfcomreaderfullimpact-of-inflation-on-purchasing-power 3234
discussed earlier about the calculation of percentage changes but you can still use thisformula any time it always works One over the price level gives you the purchasing power of the dollar and when the price level is only 76 percent what it was before your purchasing power is going to be 132 percent of what it was before Falling prices give us an increase in the purchasing power of the dollar
842019 Impact of Inflation on Purchasing Power
httpslidepdfcomreaderfullimpact-of-inflation-on-purchasing-power 3334
REFERENCES
1 httpwwwworldsalariesorg
2 International Monetary Fund World Economic Outlook Database September
2006
3 Website of Australian Bureau of Statistics
4 Website of Blanco de Mexico
5 Website of Bank of England
6 Website of Central Bank of Brazil
7 Website of European Central bank
8 Website of International Organization of Labor
9 Website of the Labor Department of India
10 Website of the Ministry of Economics and Planning of Saudi Arabia
11 Website of the Ministry of Finance of the Russian Federation
12 Website of National Bureau of Statistics of China
13 Website of Statistics Bureau of Japan
14 Website of Statistics Canada
15 Website of Statistics South Africa
16 Website of the United States Labor Department
17 Website of Wikipedia on purchasing power parity and consumer price index
842019 Impact of Inflation on Purchasing Power
httpslidepdfcomreaderfullimpact-of-inflation-on-purchasing-power 3434
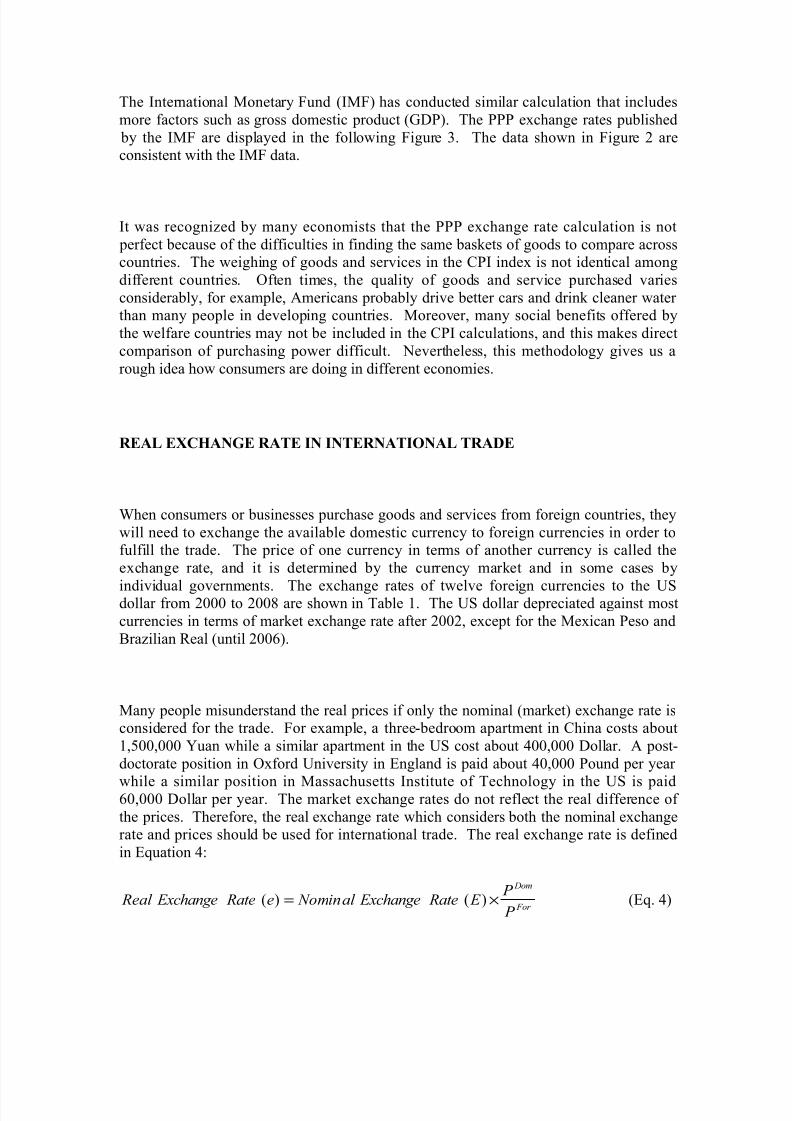
842019 Impact of Inflation on Purchasing Power
httpslidepdfcomreaderfullimpact-of-inflation-on-purchasing-power 2634
The International Monetary Fund (IMF) has conducted similar calculation that includesmore factors such as gross domestic product (GDP) The PPP exchange rates published by the IMF are displayed in the following Figure 3 The data shown in Figure 2 areconsistent with the IMF data
It was recognized by many economists that the PPP exchange rate calculation is not perfect because of the difficulties in finding the same baskets of goods to compare acrosscountries The weighing of goods and services in the CPI index is not identical amongdifferent countries Often times the quality of goods and service purchased variesconsiderably for example Americans probably drive better cars and drink cleaner water than many people in developing countries Moreover many social benefits offered bythe welfare countries may not be included in the CPI calculations and this makes directcomparison of purchasing power difficult Nevertheless this methodology gives us arough idea how consumers are doing in different economies
REAL EXCHANGE RATE IN INTERNATIONAL TRADE
When consumers or businesses purchase goods and services from foreign countries theywill need to exchange the available domestic currency to foreign currencies in order tofulfill the trade The price of one currency in terms of another currency is called theexchange rate and it is determined by the currency market and in some cases by
individual governments The exchange rates of twelve foreign currencies to the USdollar from 2000 to 2008 are shown in Table 1 The US dollar depreciated against mostcurrencies in terms of market exchange rate after 2002 except for the Mexican Peso andBrazilian Real (until 2006)
Many people misunderstand the real prices if only the nominal (market) exchange rate isconsidered for the trade For example a three-bedroom apartment in China costs about1500000 Yuan while a similar apartment in the US cost about 400000 Dollar A post-doctorate position in Oxford University in England is paid about 40000 Pound per year
while a similar position in Massachusetts Institute of Technology in the US is paid60000 Dollar per year The market exchange rates do not reflect the real difference of the prices Therefore the real exchange rate which considers both the nominal exchangerate and prices should be used for international trade The real exchange rate is definedin Equation 4
For
Dom
P
P E Rate Exchangeal min Noe Rate Exchangeal Re times= )()( (Eq 4)
842019 Impact of Inflation on Purchasing Power
httpslidepdfcomreaderfullimpact-of-inflation-on-purchasing-power 2734
where PDom is domestic price and PFor is foreign price Using the above two examplesthe real exchange rates would be 18 Chinese apartment = 1 American apartment and075 Oxford salary = 1 MIT salary in 2008
If we substitute prices with CPI indexes in the above equation the real exchange for allthe goods and services can be estimated by Equation 5
For
Dom
CPI
CPI E e times= (Eq 5)
Figure 4 and Figure 5 show the percent changes of nominal exchange rate and real (CPI)exchange rate from 2000 to 2008 and the values are not the same When inflation (price
change) rates are taken into account the dollar actually strengthens against the JapaneseYen and Saudi Arabian Riyal while the advantage over the Peso and the Real (until 2005)diminished The magnitude of depreciation of the US dollar against the British Poundthe Euro the Canadian Dollar and the Chinese Yuan is 2-5 better in the real rate thanin the nominal rate On the other hand the dollar depreciated more against the IndianRupee the South African Rand (after 2002) and the Russian Ruble in the real rate than inthe nominal rate The real rate and the nominal rate for the Australian dollar are verysimilar This analysis indicates that one would make different decisions in buyingforeign goods and services when using the real exchange rate versus the nominalexchange rate
In addition if we compare the data in Figure 2 and Figure 5 it is obvious that the PPPexchange rate fluctuates less dramatically than the foreign exchange rate (except theRussian Ruble) In other words foreign exchange rates affect international trade morethan domestic consumption
WAGE FACTOR
Most consumers except the unemployed and retirees earn wages to make a livingEmployers usually give employees a small wages increase every year to offset inflationFigure 6 shows the percentage of wage increase in different countries The wage increasein the US EU and India is a few percent less than inflation over eight years while thewages in Canada Brazil and Australia outpaced inflation by a few percents in the same period The wage increase in UK Mexico South Africa China and Russia is even faster
842019 Impact of Inflation on Purchasing Power
httpslidepdfcomreaderfullimpact-of-inflation-on-purchasing-power 2834
double to triple digits gain over inflation is observed in these nations Japanrsquos wage isstagnant (or dropping slightly) from 2000 to 2008 It is unclear what exactly causes thesedifferences one may speculate that it may relate to the fiscal condition and account balance of the nations as well as how the governments want to regulate their economyFor example commodity producing countries is benefited from the recent purge of
commodity prices China has a large trade surplus the Japanese prices may have comedown from a very high level from decays ago It will be interested to see how the fastwage increase in some nations would impact their inflation situation in the future
The difference in wage changes certainly would have an impact to consumerrsquos purchasing power If we modify Equation 3 and Equation 5 for calculating relative PPPand real (CPI) exchange rate by a wage factor the following equations will results
For
t
For
t
Dom
t
Dom
t
Dom
t
Dom
t
For
t
For
t
rel
W W
W W
CPI CPI
CPI CPI PPP
1
1
1
1
minus
minus
minus
minus
times= (Eq 6)
For
Dom
For
Dom
W
W
CPI
CPI E e timestimes= (Eq 7)
where W denotes wages Using this modified calculation both domestic and foreign purchasing power will change Figure 7 and Figure 8 shows the relative PPP and realexchange rate after adjusting for wage increase After adjusting for wages the relativePPP become almost the same for the US EU Canada Japan (until 2007) India andBrazil (after 2006) Australia UK South Africa Mexico become the out performerswhich is not the case without adjusting for wages China and Russia demonstrate the bestimprovement in relative PPP because of the large increase of their wages
After adjusting for wages the buying power of Americans in international marketsweakens further relative to most foreign consumers except the Japanese Meanwhile thedepreciation of the US dollar against the Euro is about 5 less than before adjustment(using the 2008 figure) because of the wage advantage for Americans As pointed outearlier there are pitfalls for direct cross-comparison using the CPI index Additionallyother factors such as taxation may complicate the purchasing power calculation For example American income taxes are less than many industrialized countries while poorer nations probably donrsquot tax on income as much
842019 Impact of Inflation on Purchasing Power
httpslidepdfcomreaderfullimpact-of-inflation-on-purchasing-power 2934
Based on the above analysis the emerging economies have made big progress inenhancing the international purchasing power of their citizens thanks to increases of international trade employment and work force productivity Having said that the gap
of incomes between citizens of developed and developing countries are still quite large asshown in the Table 2 Additionally the consequences of environmental damages andincreased energy consumptions in developing countries due to rapid industrialization may be debatable issues
842019 Impact of Inflation on Purchasing Power
httpslidepdfcomreaderfullimpact-of-inflation-on-purchasing-power 3034
Conclusion
Exchange rate pricesinflation and wage level influence the purchasing power of consumers in domestic and international markets The domestic purchasing power ismainly affected by the inflation rate of individual countries and it is relatively equitableacross mature economies The international purchasing power is more volatile and isaffected by both exchange rate and prices Wage changes can further compensate or deprive purchasing power of consumers Analysis of current exchange rates prices andwages leads to the belief that foreign shoppers can get better bargains in Japan and theUS at the present time Consumers in emerging economies especially China and Russiahave experienced significant improvement in purchasing power recently when compared
to themselves They may catch up with the living standard of rich countries in the futureif this growth rate sustains Finally it will be interesting to research the fundamentaleconomic forces which influence the gauges that are measured in the articleWhen prices are rising you can buy less with a given amount of money When hotdogsare expensive a given amount of money will buy a small number of hotdogs But whenhotdogs are inexpensive that is the price is low your given hot dog allowance will purchase a lot more satisfaction There is a relationship between prices and purchasing power that is a reciprocal relationship and thatrsquos the relationship that wersquore going to bestudying in this lesson When prices are going from low prices to high prices that iswhen there is inflation in the economy the value of the dollar is shrinking that is your Purchasing power is going from being able to buy a lot to being able to buy a little Inthis lesson Irsquom going to begin by giving a simple numerical example and then wersquoll talk about how you can use the GDP deflator to show the relationship between the inflationrate and purchasing power
Letrsquos start by assuming that we are in a period of inflation and letrsquos let hotdogs be arepresentative good that is the price of all goods and services across the economy isincreasing at some general rate and wersquore going to look at the price of hotdogs in order toinfer what is happening to purchasing power as prices are rising Wersquore going to befocusing now on the reciprocal relationship between the price level and the purchasing power of the dollar that is what a dollar will buy as the price level is changing And Irsquovewritten out here as clearly as I can the formula that shows this reciprocal relationship thatis one over the price level equals the purchasing power of a dollar Let me make thisvery clear Letrsquos suppose that the price of a hotdog is five cents Well whatrsquos the purchasing power of your dollar Five cents is the same thing as one twentieth of adollar Therefore the reciprocal of one twentieth is twenty Your dollar will buy twentyhotdogs Thatrsquos its purchasing power
842019 Impact of Inflation on Purchasing Power
httpslidepdfcomreaderfullimpact-of-inflation-on-purchasing-power 3134
Now suppose wersquore in a period of inflation so that prices are rising and the price of ahotdog goes up to two dollars Whatrsquos happened to your purchasing power Well your dollar will no longer buy even a whole hotdog Two dollars or 2 has a reciprocal of onehalf that is you can now only afford half a hotdog Your purchasing power has shrunk from twenty hotdogs at a price of five cents a piece to one half a hotdog whenever the
price is two dollars per hotdog This simple example makes clear that the price level andthe purchasing power of the dollar are reciprocals
Now letrsquos look at some examples using the GDP deflator Suppose that wersquore in the year 2000 which is our base year for calculating the GDP deflator and we calculate the priceof a market basket of goods and services- that is a little bit of Housing and a little bit of transportation a little bit of medical care a little bit of clothingetc And wersquore going to call the price level in the year 2000 one hundred because itrsquos our base year
We look at those prices again in 2002 and we find that the price of the goods and
services as a ratio of the same prices in 2000 is equal to 104 That is prices haveincreased by about 4 percent between the year 2000 and 2002 So if we write the GDPdeflator not in the form we usually write it that is multiplied by 100 to get 104 but letrsquoswrite it now as in hundredths 104 to show the 4 percent increase in prices between theyear 2000 and 2002 Well whatrsquos happened to the purchasing power of a dollar betweenthe year 2000 and 2002 That is how much can we afford to buy in 2002 with a dollar if we measure it in the prices of the year 2000 Prices are higher in 2002 therefore thedollar wonrsquot buy as much Well if you takethe reciprocal of the GDP deflator 104 you get 096 Whatrsquos that saying Itrsquos saying thatwhat you could have bought for 96 cents back in the year 2000 now it costs you a dollar to buy in 2002 That is a dollar in 2002 is only worth what 96 cents was worth back inthe year 2000 You can afford to buy less Your purchasing power has shrunk by about 4 percent Your purchasing power shrinks at the same rate that the price level increases because the price level and your purchasing power are reciprocals of each other
Well letrsquos take another example during a period of deflation If we look at the years between 1929 and 1933 wersquoll see falling prices If we choose 1929 as the base year andif we call the price level in that 200000 or 100 if we look at prices in 1933 during thegreat depression we see that the price level has fallen by about 24 percent That is wersquovegone from 100 down to 076 So we now have lower prices in 1933 than we had in 1929
Now what does that mean What is going to happen to the purchasing power of your dollar when prices are lower Itrsquos clearly going to increase Yoursquore going to go from asmall purchasing power to a bigger purchasing power And if you takethe reciprocal of 76 percent you get 132 That is the purchasing power of the dollar hasincreased by about 32 percent in this example Now the reason the numbers donrsquot add upexactly the reason I canrsquot say a 24 percent decrease in prices is equal to a 24 percentincrease in purchasing power is because once your percentages start getting large yourun into this problem that a fifty percent increase is sorry that a 100 percent increase isthe reciprocal of a 50 percent decrease you wind up with this problem that wersquove
842019 Impact of Inflation on Purchasing Power
httpslidepdfcomreaderfullimpact-of-inflation-on-purchasing-power 3234
discussed earlier about the calculation of percentage changes but you can still use thisformula any time it always works One over the price level gives you the purchasing power of the dollar and when the price level is only 76 percent what it was before your purchasing power is going to be 132 percent of what it was before Falling prices give us an increase in the purchasing power of the dollar
842019 Impact of Inflation on Purchasing Power
httpslidepdfcomreaderfullimpact-of-inflation-on-purchasing-power 3334
REFERENCES
1 httpwwwworldsalariesorg
2 International Monetary Fund World Economic Outlook Database September
2006
3 Website of Australian Bureau of Statistics
4 Website of Blanco de Mexico
5 Website of Bank of England
6 Website of Central Bank of Brazil
7 Website of European Central bank
8 Website of International Organization of Labor
9 Website of the Labor Department of India
10 Website of the Ministry of Economics and Planning of Saudi Arabia
11 Website of the Ministry of Finance of the Russian Federation
12 Website of National Bureau of Statistics of China
13 Website of Statistics Bureau of Japan
14 Website of Statistics Canada
15 Website of Statistics South Africa
16 Website of the United States Labor Department
17 Website of Wikipedia on purchasing power parity and consumer price index
842019 Impact of Inflation on Purchasing Power
httpslidepdfcomreaderfullimpact-of-inflation-on-purchasing-power 3434
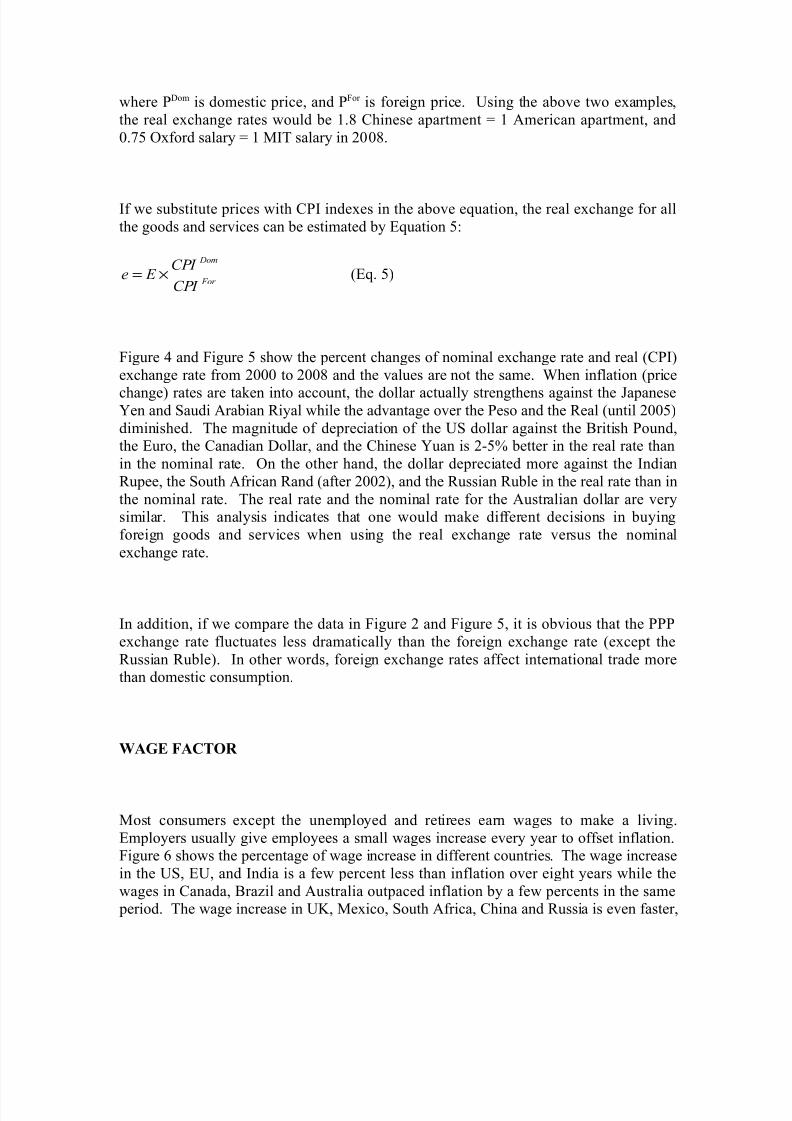
842019 Impact of Inflation on Purchasing Power
httpslidepdfcomreaderfullimpact-of-inflation-on-purchasing-power 2734
where PDom is domestic price and PFor is foreign price Using the above two examplesthe real exchange rates would be 18 Chinese apartment = 1 American apartment and075 Oxford salary = 1 MIT salary in 2008
If we substitute prices with CPI indexes in the above equation the real exchange for allthe goods and services can be estimated by Equation 5
For
Dom
CPI
CPI E e times= (Eq 5)
Figure 4 and Figure 5 show the percent changes of nominal exchange rate and real (CPI)exchange rate from 2000 to 2008 and the values are not the same When inflation (price
change) rates are taken into account the dollar actually strengthens against the JapaneseYen and Saudi Arabian Riyal while the advantage over the Peso and the Real (until 2005)diminished The magnitude of depreciation of the US dollar against the British Poundthe Euro the Canadian Dollar and the Chinese Yuan is 2-5 better in the real rate thanin the nominal rate On the other hand the dollar depreciated more against the IndianRupee the South African Rand (after 2002) and the Russian Ruble in the real rate than inthe nominal rate The real rate and the nominal rate for the Australian dollar are verysimilar This analysis indicates that one would make different decisions in buyingforeign goods and services when using the real exchange rate versus the nominalexchange rate
In addition if we compare the data in Figure 2 and Figure 5 it is obvious that the PPPexchange rate fluctuates less dramatically than the foreign exchange rate (except theRussian Ruble) In other words foreign exchange rates affect international trade morethan domestic consumption
WAGE FACTOR
Most consumers except the unemployed and retirees earn wages to make a livingEmployers usually give employees a small wages increase every year to offset inflationFigure 6 shows the percentage of wage increase in different countries The wage increasein the US EU and India is a few percent less than inflation over eight years while thewages in Canada Brazil and Australia outpaced inflation by a few percents in the same period The wage increase in UK Mexico South Africa China and Russia is even faster
842019 Impact of Inflation on Purchasing Power
httpslidepdfcomreaderfullimpact-of-inflation-on-purchasing-power 2834
double to triple digits gain over inflation is observed in these nations Japanrsquos wage isstagnant (or dropping slightly) from 2000 to 2008 It is unclear what exactly causes thesedifferences one may speculate that it may relate to the fiscal condition and account balance of the nations as well as how the governments want to regulate their economyFor example commodity producing countries is benefited from the recent purge of
commodity prices China has a large trade surplus the Japanese prices may have comedown from a very high level from decays ago It will be interested to see how the fastwage increase in some nations would impact their inflation situation in the future
The difference in wage changes certainly would have an impact to consumerrsquos purchasing power If we modify Equation 3 and Equation 5 for calculating relative PPPand real (CPI) exchange rate by a wage factor the following equations will results
For
t
For
t
Dom
t
Dom
t
Dom
t
Dom
t
For
t
For
t
rel
W W
W W
CPI CPI
CPI CPI PPP
1
1
1
1
minus
minus
minus
minus
times= (Eq 6)
For
Dom
For
Dom
W
W
CPI
CPI E e timestimes= (Eq 7)
where W denotes wages Using this modified calculation both domestic and foreign purchasing power will change Figure 7 and Figure 8 shows the relative PPP and realexchange rate after adjusting for wage increase After adjusting for wages the relativePPP become almost the same for the US EU Canada Japan (until 2007) India andBrazil (after 2006) Australia UK South Africa Mexico become the out performerswhich is not the case without adjusting for wages China and Russia demonstrate the bestimprovement in relative PPP because of the large increase of their wages
After adjusting for wages the buying power of Americans in international marketsweakens further relative to most foreign consumers except the Japanese Meanwhile thedepreciation of the US dollar against the Euro is about 5 less than before adjustment(using the 2008 figure) because of the wage advantage for Americans As pointed outearlier there are pitfalls for direct cross-comparison using the CPI index Additionallyother factors such as taxation may complicate the purchasing power calculation For example American income taxes are less than many industrialized countries while poorer nations probably donrsquot tax on income as much
842019 Impact of Inflation on Purchasing Power
httpslidepdfcomreaderfullimpact-of-inflation-on-purchasing-power 2934
Based on the above analysis the emerging economies have made big progress inenhancing the international purchasing power of their citizens thanks to increases of international trade employment and work force productivity Having said that the gap
of incomes between citizens of developed and developing countries are still quite large asshown in the Table 2 Additionally the consequences of environmental damages andincreased energy consumptions in developing countries due to rapid industrialization may be debatable issues
842019 Impact of Inflation on Purchasing Power
httpslidepdfcomreaderfullimpact-of-inflation-on-purchasing-power 3034
Conclusion
Exchange rate pricesinflation and wage level influence the purchasing power of consumers in domestic and international markets The domestic purchasing power ismainly affected by the inflation rate of individual countries and it is relatively equitableacross mature economies The international purchasing power is more volatile and isaffected by both exchange rate and prices Wage changes can further compensate or deprive purchasing power of consumers Analysis of current exchange rates prices andwages leads to the belief that foreign shoppers can get better bargains in Japan and theUS at the present time Consumers in emerging economies especially China and Russiahave experienced significant improvement in purchasing power recently when compared
to themselves They may catch up with the living standard of rich countries in the futureif this growth rate sustains Finally it will be interesting to research the fundamentaleconomic forces which influence the gauges that are measured in the articleWhen prices are rising you can buy less with a given amount of money When hotdogsare expensive a given amount of money will buy a small number of hotdogs But whenhotdogs are inexpensive that is the price is low your given hot dog allowance will purchase a lot more satisfaction There is a relationship between prices and purchasing power that is a reciprocal relationship and thatrsquos the relationship that wersquore going to bestudying in this lesson When prices are going from low prices to high prices that iswhen there is inflation in the economy the value of the dollar is shrinking that is your Purchasing power is going from being able to buy a lot to being able to buy a little Inthis lesson Irsquom going to begin by giving a simple numerical example and then wersquoll talk about how you can use the GDP deflator to show the relationship between the inflationrate and purchasing power
Letrsquos start by assuming that we are in a period of inflation and letrsquos let hotdogs be arepresentative good that is the price of all goods and services across the economy isincreasing at some general rate and wersquore going to look at the price of hotdogs in order toinfer what is happening to purchasing power as prices are rising Wersquore going to befocusing now on the reciprocal relationship between the price level and the purchasing power of the dollar that is what a dollar will buy as the price level is changing And Irsquovewritten out here as clearly as I can the formula that shows this reciprocal relationship thatis one over the price level equals the purchasing power of a dollar Let me make thisvery clear Letrsquos suppose that the price of a hotdog is five cents Well whatrsquos the purchasing power of your dollar Five cents is the same thing as one twentieth of adollar Therefore the reciprocal of one twentieth is twenty Your dollar will buy twentyhotdogs Thatrsquos its purchasing power
842019 Impact of Inflation on Purchasing Power
httpslidepdfcomreaderfullimpact-of-inflation-on-purchasing-power 3134
Now suppose wersquore in a period of inflation so that prices are rising and the price of ahotdog goes up to two dollars Whatrsquos happened to your purchasing power Well your dollar will no longer buy even a whole hotdog Two dollars or 2 has a reciprocal of onehalf that is you can now only afford half a hotdog Your purchasing power has shrunk from twenty hotdogs at a price of five cents a piece to one half a hotdog whenever the
price is two dollars per hotdog This simple example makes clear that the price level andthe purchasing power of the dollar are reciprocals
Now letrsquos look at some examples using the GDP deflator Suppose that wersquore in the year 2000 which is our base year for calculating the GDP deflator and we calculate the priceof a market basket of goods and services- that is a little bit of Housing and a little bit of transportation a little bit of medical care a little bit of clothingetc And wersquore going to call the price level in the year 2000 one hundred because itrsquos our base year
We look at those prices again in 2002 and we find that the price of the goods and
services as a ratio of the same prices in 2000 is equal to 104 That is prices haveincreased by about 4 percent between the year 2000 and 2002 So if we write the GDPdeflator not in the form we usually write it that is multiplied by 100 to get 104 but letrsquoswrite it now as in hundredths 104 to show the 4 percent increase in prices between theyear 2000 and 2002 Well whatrsquos happened to the purchasing power of a dollar betweenthe year 2000 and 2002 That is how much can we afford to buy in 2002 with a dollar if we measure it in the prices of the year 2000 Prices are higher in 2002 therefore thedollar wonrsquot buy as much Well if you takethe reciprocal of the GDP deflator 104 you get 096 Whatrsquos that saying Itrsquos saying thatwhat you could have bought for 96 cents back in the year 2000 now it costs you a dollar to buy in 2002 That is a dollar in 2002 is only worth what 96 cents was worth back inthe year 2000 You can afford to buy less Your purchasing power has shrunk by about 4 percent Your purchasing power shrinks at the same rate that the price level increases because the price level and your purchasing power are reciprocals of each other
Well letrsquos take another example during a period of deflation If we look at the years between 1929 and 1933 wersquoll see falling prices If we choose 1929 as the base year andif we call the price level in that 200000 or 100 if we look at prices in 1933 during thegreat depression we see that the price level has fallen by about 24 percent That is wersquovegone from 100 down to 076 So we now have lower prices in 1933 than we had in 1929
Now what does that mean What is going to happen to the purchasing power of your dollar when prices are lower Itrsquos clearly going to increase Yoursquore going to go from asmall purchasing power to a bigger purchasing power And if you takethe reciprocal of 76 percent you get 132 That is the purchasing power of the dollar hasincreased by about 32 percent in this example Now the reason the numbers donrsquot add upexactly the reason I canrsquot say a 24 percent decrease in prices is equal to a 24 percentincrease in purchasing power is because once your percentages start getting large yourun into this problem that a fifty percent increase is sorry that a 100 percent increase isthe reciprocal of a 50 percent decrease you wind up with this problem that wersquove
842019 Impact of Inflation on Purchasing Power
httpslidepdfcomreaderfullimpact-of-inflation-on-purchasing-power 3234
discussed earlier about the calculation of percentage changes but you can still use thisformula any time it always works One over the price level gives you the purchasing power of the dollar and when the price level is only 76 percent what it was before your purchasing power is going to be 132 percent of what it was before Falling prices give us an increase in the purchasing power of the dollar
842019 Impact of Inflation on Purchasing Power
httpslidepdfcomreaderfullimpact-of-inflation-on-purchasing-power 3334
REFERENCES
1 httpwwwworldsalariesorg
2 International Monetary Fund World Economic Outlook Database September
2006
3 Website of Australian Bureau of Statistics
4 Website of Blanco de Mexico
5 Website of Bank of England
6 Website of Central Bank of Brazil
7 Website of European Central bank
8 Website of International Organization of Labor
9 Website of the Labor Department of India
10 Website of the Ministry of Economics and Planning of Saudi Arabia
11 Website of the Ministry of Finance of the Russian Federation
12 Website of National Bureau of Statistics of China
13 Website of Statistics Bureau of Japan
14 Website of Statistics Canada
15 Website of Statistics South Africa
16 Website of the United States Labor Department
17 Website of Wikipedia on purchasing power parity and consumer price index
842019 Impact of Inflation on Purchasing Power
httpslidepdfcomreaderfullimpact-of-inflation-on-purchasing-power 3434
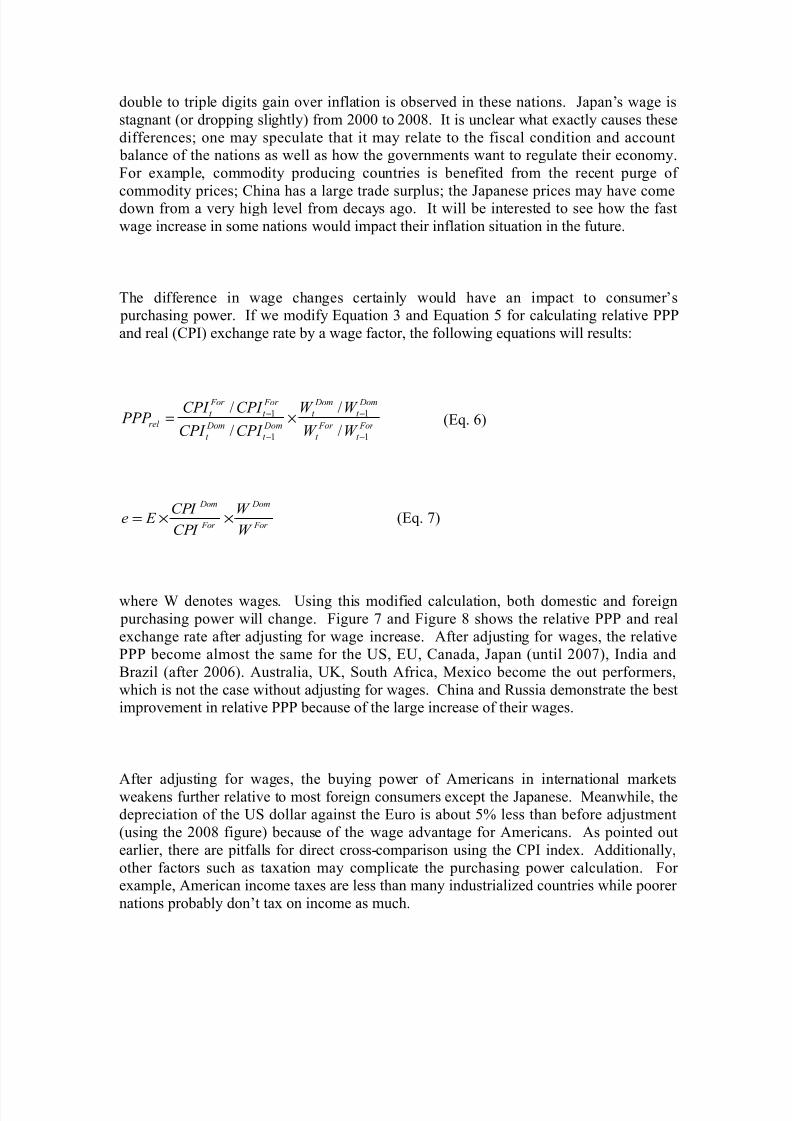
842019 Impact of Inflation on Purchasing Power
httpslidepdfcomreaderfullimpact-of-inflation-on-purchasing-power 2934
Based on the above analysis the emerging economies have made big progress inenhancing the international purchasing power of their citizens thanks to increases of international trade employment and work force productivity Having said that the gap
of incomes between citizens of developed and developing countries are still quite large asshown in the Table 2 Additionally the consequences of environmental damages andincreased energy consumptions in developing countries due to rapid industrialization may be debatable issues
842019 Impact of Inflation on Purchasing Power
httpslidepdfcomreaderfullimpact-of-inflation-on-purchasing-power 3034
Conclusion
Exchange rate pricesinflation and wage level influence the purchasing power of consumers in domestic and international markets The domestic purchasing power ismainly affected by the inflation rate of individual countries and it is relatively equitableacross mature economies The international purchasing power is more volatile and isaffected by both exchange rate and prices Wage changes can further compensate or deprive purchasing power of consumers Analysis of current exchange rates prices andwages leads to the belief that foreign shoppers can get better bargains in Japan and theUS at the present time Consumers in emerging economies especially China and Russiahave experienced significant improvement in purchasing power recently when compared
to themselves They may catch up with the living standard of rich countries in the futureif this growth rate sustains Finally it will be interesting to research the fundamentaleconomic forces which influence the gauges that are measured in the articleWhen prices are rising you can buy less with a given amount of money When hotdogsare expensive a given amount of money will buy a small number of hotdogs But whenhotdogs are inexpensive that is the price is low your given hot dog allowance will purchase a lot more satisfaction There is a relationship between prices and purchasing power that is a reciprocal relationship and thatrsquos the relationship that wersquore going to bestudying in this lesson When prices are going from low prices to high prices that iswhen there is inflation in the economy the value of the dollar is shrinking that is your Purchasing power is going from being able to buy a lot to being able to buy a little Inthis lesson Irsquom going to begin by giving a simple numerical example and then wersquoll talk about how you can use the GDP deflator to show the relationship between the inflationrate and purchasing power
Letrsquos start by assuming that we are in a period of inflation and letrsquos let hotdogs be arepresentative good that is the price of all goods and services across the economy isincreasing at some general rate and wersquore going to look at the price of hotdogs in order toinfer what is happening to purchasing power as prices are rising Wersquore going to befocusing now on the reciprocal relationship between the price level and the purchasing power of the dollar that is what a dollar will buy as the price level is changing And Irsquovewritten out here as clearly as I can the formula that shows this reciprocal relationship thatis one over the price level equals the purchasing power of a dollar Let me make thisvery clear Letrsquos suppose that the price of a hotdog is five cents Well whatrsquos the purchasing power of your dollar Five cents is the same thing as one twentieth of adollar Therefore the reciprocal of one twentieth is twenty Your dollar will buy twentyhotdogs Thatrsquos its purchasing power
842019 Impact of Inflation on Purchasing Power
httpslidepdfcomreaderfullimpact-of-inflation-on-purchasing-power 3134
Now suppose wersquore in a period of inflation so that prices are rising and the price of ahotdog goes up to two dollars Whatrsquos happened to your purchasing power Well your dollar will no longer buy even a whole hotdog Two dollars or 2 has a reciprocal of onehalf that is you can now only afford half a hotdog Your purchasing power has shrunk from twenty hotdogs at a price of five cents a piece to one half a hotdog whenever the
price is two dollars per hotdog This simple example makes clear that the price level andthe purchasing power of the dollar are reciprocals
Now letrsquos look at some examples using the GDP deflator Suppose that wersquore in the year 2000 which is our base year for calculating the GDP deflator and we calculate the priceof a market basket of goods and services- that is a little bit of Housing and a little bit of transportation a little bit of medical care a little bit of clothingetc And wersquore going to call the price level in the year 2000 one hundred because itrsquos our base year
We look at those prices again in 2002 and we find that the price of the goods and
services as a ratio of the same prices in 2000 is equal to 104 That is prices haveincreased by about 4 percent between the year 2000 and 2002 So if we write the GDPdeflator not in the form we usually write it that is multiplied by 100 to get 104 but letrsquoswrite it now as in hundredths 104 to show the 4 percent increase in prices between theyear 2000 and 2002 Well whatrsquos happened to the purchasing power of a dollar betweenthe year 2000 and 2002 That is how much can we afford to buy in 2002 with a dollar if we measure it in the prices of the year 2000 Prices are higher in 2002 therefore thedollar wonrsquot buy as much Well if you takethe reciprocal of the GDP deflator 104 you get 096 Whatrsquos that saying Itrsquos saying thatwhat you could have bought for 96 cents back in the year 2000 now it costs you a dollar to buy in 2002 That is a dollar in 2002 is only worth what 96 cents was worth back inthe year 2000 You can afford to buy less Your purchasing power has shrunk by about 4 percent Your purchasing power shrinks at the same rate that the price level increases because the price level and your purchasing power are reciprocals of each other
Well letrsquos take another example during a period of deflation If we look at the years between 1929 and 1933 wersquoll see falling prices If we choose 1929 as the base year andif we call the price level in that 200000 or 100 if we look at prices in 1933 during thegreat depression we see that the price level has fallen by about 24 percent That is wersquovegone from 100 down to 076 So we now have lower prices in 1933 than we had in 1929
Now what does that mean What is going to happen to the purchasing power of your dollar when prices are lower Itrsquos clearly going to increase Yoursquore going to go from asmall purchasing power to a bigger purchasing power And if you takethe reciprocal of 76 percent you get 132 That is the purchasing power of the dollar hasincreased by about 32 percent in this example Now the reason the numbers donrsquot add upexactly the reason I canrsquot say a 24 percent decrease in prices is equal to a 24 percentincrease in purchasing power is because once your percentages start getting large yourun into this problem that a fifty percent increase is sorry that a 100 percent increase isthe reciprocal of a 50 percent decrease you wind up with this problem that wersquove
842019 Impact of Inflation on Purchasing Power
httpslidepdfcomreaderfullimpact-of-inflation-on-purchasing-power 3234
discussed earlier about the calculation of percentage changes but you can still use thisformula any time it always works One over the price level gives you the purchasing power of the dollar and when the price level is only 76 percent what it was before your purchasing power is going to be 132 percent of what it was before Falling prices give us an increase in the purchasing power of the dollar
842019 Impact of Inflation on Purchasing Power
httpslidepdfcomreaderfullimpact-of-inflation-on-purchasing-power 3334
REFERENCES
1 httpwwwworldsalariesorg
2 International Monetary Fund World Economic Outlook Database September
2006
3 Website of Australian Bureau of Statistics
4 Website of Blanco de Mexico
5 Website of Bank of England
6 Website of Central Bank of Brazil
7 Website of European Central bank
8 Website of International Organization of Labor
9 Website of the Labor Department of India
10 Website of the Ministry of Economics and Planning of Saudi Arabia
11 Website of the Ministry of Finance of the Russian Federation
12 Website of National Bureau of Statistics of China
13 Website of Statistics Bureau of Japan
14 Website of Statistics Canada
15 Website of Statistics South Africa
16 Website of the United States Labor Department
17 Website of Wikipedia on purchasing power parity and consumer price index
842019 Impact of Inflation on Purchasing Power
httpslidepdfcomreaderfullimpact-of-inflation-on-purchasing-power 3434
842019 Impact of Inflation on Purchasing Power
httpslidepdfcomreaderfullimpact-of-inflation-on-purchasing-power 3134
Now suppose wersquore in a period of inflation so that prices are rising and the price of ahotdog goes up to two dollars Whatrsquos happened to your purchasing power Well your dollar will no longer buy even a whole hotdog Two dollars or 2 has a reciprocal of onehalf that is you can now only afford half a hotdog Your purchasing power has shrunk from twenty hotdogs at a price of five cents a piece to one half a hotdog whenever the
price is two dollars per hotdog This simple example makes clear that the price level andthe purchasing power of the dollar are reciprocals
Now letrsquos look at some examples using the GDP deflator Suppose that wersquore in the year 2000 which is our base year for calculating the GDP deflator and we calculate the priceof a market basket of goods and services- that is a little bit of Housing and a little bit of transportation a little bit of medical care a little bit of clothingetc And wersquore going to call the price level in the year 2000 one hundred because itrsquos our base year
We look at those prices again in 2002 and we find that the price of the goods and
services as a ratio of the same prices in 2000 is equal to 104 That is prices haveincreased by about 4 percent between the year 2000 and 2002 So if we write the GDPdeflator not in the form we usually write it that is multiplied by 100 to get 104 but letrsquoswrite it now as in hundredths 104 to show the 4 percent increase in prices between theyear 2000 and 2002 Well whatrsquos happened to the purchasing power of a dollar betweenthe year 2000 and 2002 That is how much can we afford to buy in 2002 with a dollar if we measure it in the prices of the year 2000 Prices are higher in 2002 therefore thedollar wonrsquot buy as much Well if you takethe reciprocal of the GDP deflator 104 you get 096 Whatrsquos that saying Itrsquos saying thatwhat you could have bought for 96 cents back in the year 2000 now it costs you a dollar to buy in 2002 That is a dollar in 2002 is only worth what 96 cents was worth back inthe year 2000 You can afford to buy less Your purchasing power has shrunk by about 4 percent Your purchasing power shrinks at the same rate that the price level increases because the price level and your purchasing power are reciprocals of each other
Well letrsquos take another example during a period of deflation If we look at the years between 1929 and 1933 wersquoll see falling prices If we choose 1929 as the base year andif we call the price level in that 200000 or 100 if we look at prices in 1933 during thegreat depression we see that the price level has fallen by about 24 percent That is wersquovegone from 100 down to 076 So we now have lower prices in 1933 than we had in 1929
Now what does that mean What is going to happen to the purchasing power of your dollar when prices are lower Itrsquos clearly going to increase Yoursquore going to go from asmall purchasing power to a bigger purchasing power And if you takethe reciprocal of 76 percent you get 132 That is the purchasing power of the dollar hasincreased by about 32 percent in this example Now the reason the numbers donrsquot add upexactly the reason I canrsquot say a 24 percent decrease in prices is equal to a 24 percentincrease in purchasing power is because once your percentages start getting large yourun into this problem that a fifty percent increase is sorry that a 100 percent increase isthe reciprocal of a 50 percent decrease you wind up with this problem that wersquove
842019 Impact of Inflation on Purchasing Power
httpslidepdfcomreaderfullimpact-of-inflation-on-purchasing-power 3234
discussed earlier about the calculation of percentage changes but you can still use thisformula any time it always works One over the price level gives you the purchasing power of the dollar and when the price level is only 76 percent what it was before your purchasing power is going to be 132 percent of what it was before Falling prices give us an increase in the purchasing power of the dollar
842019 Impact of Inflation on Purchasing Power
httpslidepdfcomreaderfullimpact-of-inflation-on-purchasing-power 3334
REFERENCES
1 httpwwwworldsalariesorg
2 International Monetary Fund World Economic Outlook Database September
2006
3 Website of Australian Bureau of Statistics
4 Website of Blanco de Mexico
5 Website of Bank of England
6 Website of Central Bank of Brazil
7 Website of European Central bank
8 Website of International Organization of Labor
9 Website of the Labor Department of India
10 Website of the Ministry of Economics and Planning of Saudi Arabia
11 Website of the Ministry of Finance of the Russian Federation
12 Website of National Bureau of Statistics of China
13 Website of Statistics Bureau of Japan
14 Website of Statistics Canada
15 Website of Statistics South Africa
16 Website of the United States Labor Department
17 Website of Wikipedia on purchasing power parity and consumer price index
842019 Impact of Inflation on Purchasing Power
httpslidepdfcomreaderfullimpact-of-inflation-on-purchasing-power 3434

842019 Impact of Inflation on Purchasing Power
httpslidepdfcomreaderfullimpact-of-inflation-on-purchasing-power 3234
discussed earlier about the calculation of percentage changes but you can still use thisformula any time it always works One over the price level gives you the purchasing power of the dollar and when the price level is only 76 percent what it was before your purchasing power is going to be 132 percent of what it was before Falling prices give us an increase in the purchasing power of the dollar
842019 Impact of Inflation on Purchasing Power
httpslidepdfcomreaderfullimpact-of-inflation-on-purchasing-power 3334
REFERENCES
1 httpwwwworldsalariesorg
2 International Monetary Fund World Economic Outlook Database September
2006
3 Website of Australian Bureau of Statistics
4 Website of Blanco de Mexico
5 Website of Bank of England
6 Website of Central Bank of Brazil
7 Website of European Central bank
8 Website of International Organization of Labor
9 Website of the Labor Department of India
10 Website of the Ministry of Economics and Planning of Saudi Arabia
11 Website of the Ministry of Finance of the Russian Federation
12 Website of National Bureau of Statistics of China
13 Website of Statistics Bureau of Japan
14 Website of Statistics Canada
15 Website of Statistics South Africa
16 Website of the United States Labor Department
17 Website of Wikipedia on purchasing power parity and consumer price index
842019 Impact of Inflation on Purchasing Power
httpslidepdfcomreaderfullimpact-of-inflation-on-purchasing-power 3434
842019 Impact of Inflation on Purchasing Power
httpslidepdfcomreaderfullimpact-of-inflation-on-purchasing-power 3334
REFERENCES
1 httpwwwworldsalariesorg
2 International Monetary Fund World Economic Outlook Database September
2006
3 Website of Australian Bureau of Statistics
4 Website of Blanco de Mexico
5 Website of Bank of England
6 Website of Central Bank of Brazil
7 Website of European Central bank
8 Website of International Organization of Labor
9 Website of the Labor Department of India
10 Website of the Ministry of Economics and Planning of Saudi Arabia
11 Website of the Ministry of Finance of the Russian Federation
12 Website of National Bureau of Statistics of China
13 Website of Statistics Bureau of Japan
14 Website of Statistics Canada
15 Website of Statistics South Africa
16 Website of the United States Labor Department
17 Website of Wikipedia on purchasing power parity and consumer price index
842019 Impact of Inflation on Purchasing Power
httpslidepdfcomreaderfullimpact-of-inflation-on-purchasing-power 3434

842019 Impact of Inflation on Purchasing Power
httpslidepdfcomreaderfullimpact-of-inflation-on-purchasing-power 3434