Embed Size (px)
Citation preview

Espoo, November, 14th-16th 2012
Impact of a mandatory Time-of-Use tariff on the residential customers in Italy
Walter Grattieri, Simone Maggiore
Espoo, November, 14th-16th 2012
Impact of a mandatory Time-of-Use tariff on the residential customers in Italy
Walter Grattieri, Simone Maggiore
2

RSE History and Mission - Established at the end of 2005 as a separate company, substantially handled by MSE (Ministry of Economic Development);
- The mission is to take over funded research programs and contract research at national and international level.
Research focus - Oriented to benefit national electrical system users and industrial operators;
- Wide-spread dissemination of public domain research results and technology transfer.
3
Power System Development Department
- Impact of market regulation, technical and environmental constraints on development scenarios;
- Energy demand modelling and forecasting;
- New technologies for network control and power system security;
- Vulnerability and security of critical infrastructures;
- System integration of distributed energy resources;
- Demand side management systems;
4
participation in the S3C (smart consumers, smart customers, smart citizen) European project
Summary
5
1. Analysis of monthly data
2. Analysis of the load curves
3. Analysis of consumers’ habits
4. Conclusions
Summary
6
1. Analysis of monthly data
2. Analysis of the load curves
3. Analysis of consumers’ habits
4. Conclusions
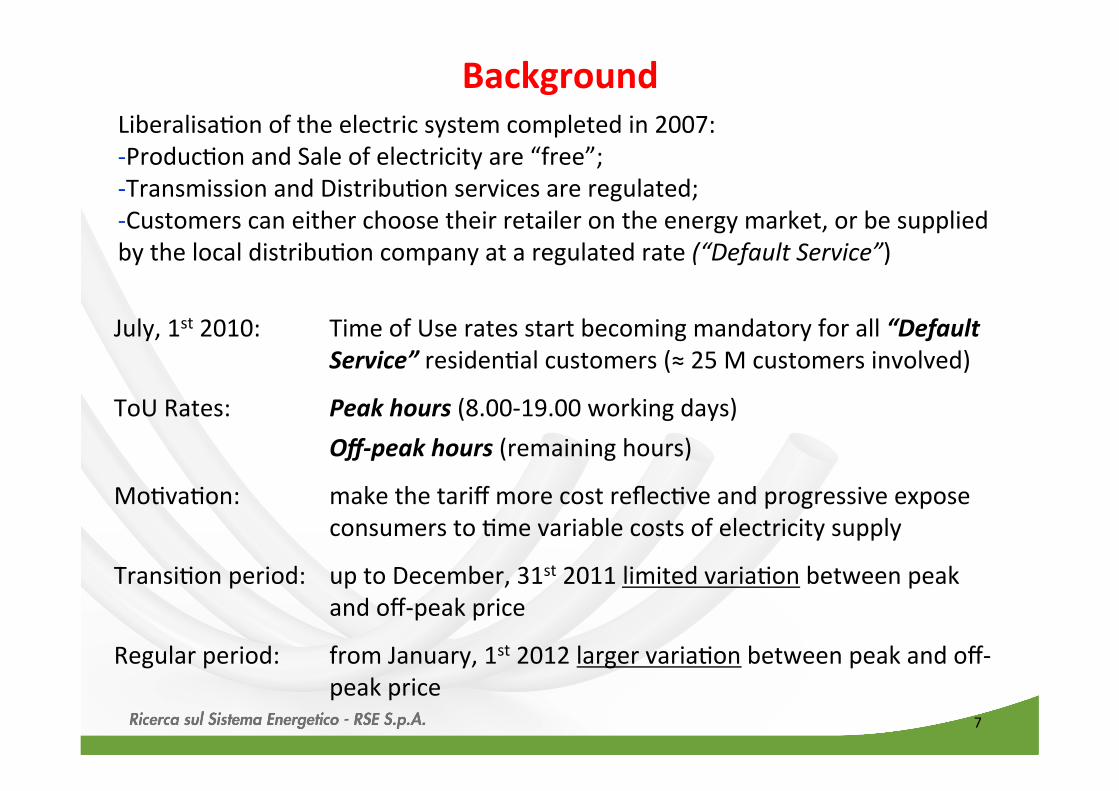
Background
July, 1st 2010: Time of Use rates start becoming mandatory for all “Default Service” residenDal customers (≈ 25 M customers involved)
ToU Rates: Peak hours (8.00-‐19.00 working days) Off-‐peak hours (remaining hours)
MoDvaDon: make the tariff more cost reflecDve and progressive expose consumers to Dme variable costs of electricity supply
TransiDon period: up to December, 31st 2011 limited variaDon between peak and off-‐peak price
Regular period: from January, 1st 2012 larger variaDon between peak and off-‐peak price
LiberalisaDon of the electric system completed in 2007: -‐ ProducDon and Sale of electricity are “free”; -‐ Transmission and DistribuDon services are regulated; -‐ Customers can either choose their retailer on the energy market, or be supplied by the local distribuDon company at a regulated rate (“Default Service”)
7
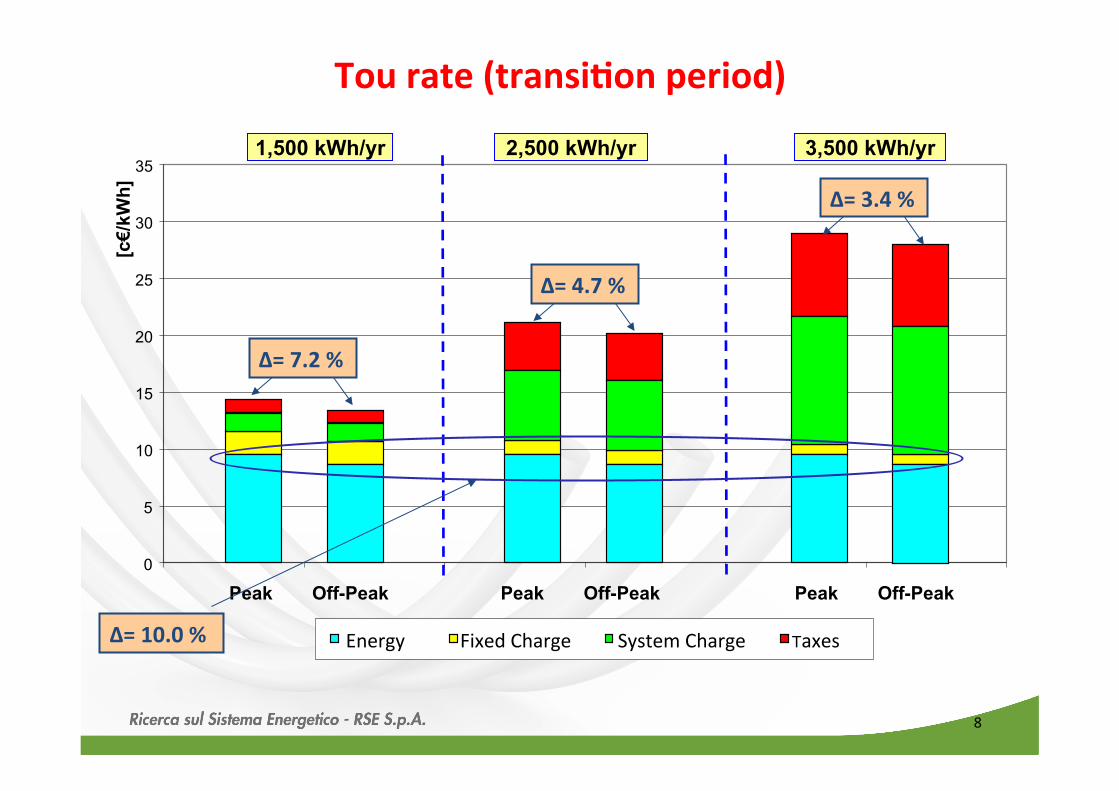
Tou rate (transi;on period)
0
5
10
15
20
25
30
35 1,500 kWh/yr
Peak
[c€/
kWh]
Energy Fixed Charge System Charge Taxes
2,500 kWh/yr 3,500 kWh/yr
Off-Peak Peak Off-Peak Peak Off-Peak
Δ= 7.2 %
Δ= 4.7 %
Δ= 3.4 %
Δ= 10.0 %
8
Main ac;vi;es
Analysis of monthly consumpDon for a “Customer panel” composed of nearly 28,000 families:
• Random selecDon from populaDon (1 every 1,000); • Time series starts in July 2009.
Scope
To invesDgate if and how much a Dme variable electricity price can significantly affect consumers’ behaviour and change level and profile of consumpDon
Research project
9
• A group of significant customers has been extracted from the Customer panel in order to remove the customers who do not saDsfy given condiDons of persistence and coherence during the periods of interest;
• Therefore, a consistent group (made of 8,427 customers) has been built and the various analysis have been performed upon it;
→ This group has been named “Restricted customer panel”. • Some of the filtering condiDons are reported below:
– user always being in the “Default Service”; – user with no acDve power generaDon; – user undergoing no meter rese`ng; – user undergoing no variaDon of the contractual value of the available power; – user undergoing no transfer; – ……..
Sample filtering: Restricted customer panel
10
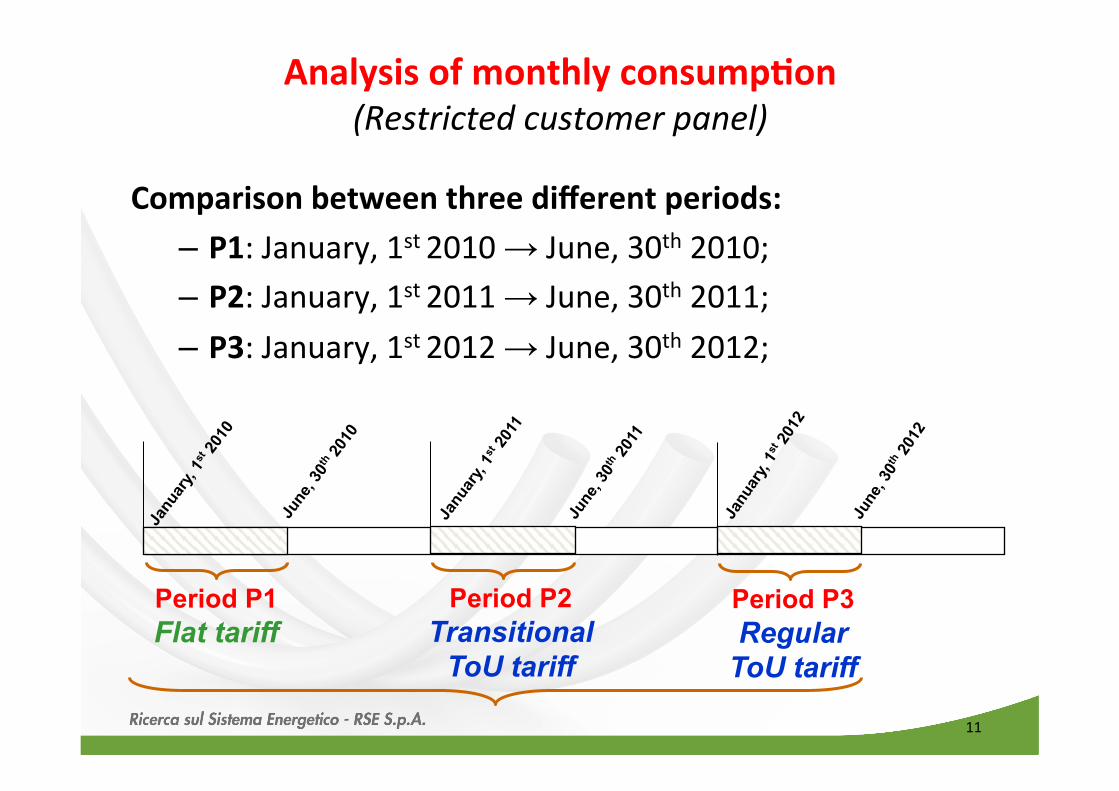
Period P1 Flat tariff
Period P2 Transitional
ToU tariff
11
Comparison between three different periods: – P1: January, 1st 2010 → June, 30th 2010;
– P2: January, 1st 2011 → June, 30th 2011; – P3: January, 1st 2012 → June, 30th 2012;
Analysis of monthly consump;on (Restricted customer panel)
Period P3 Regular
ToU tariff
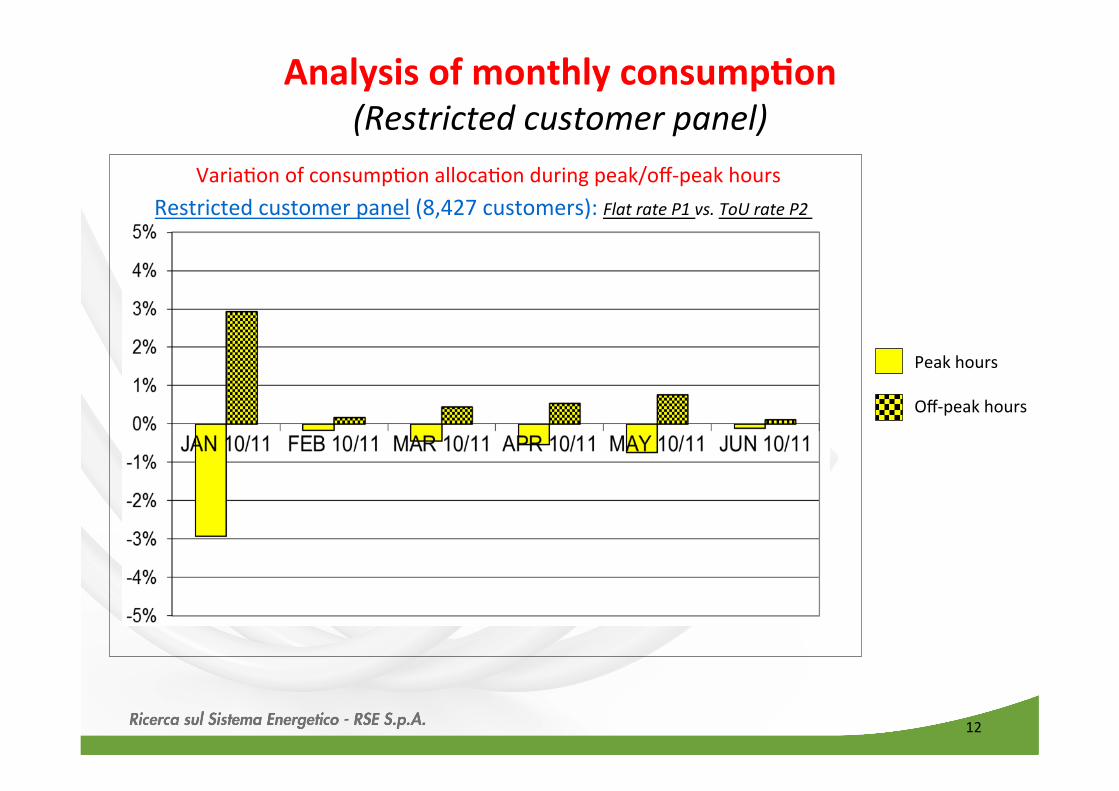
Analysis of monthly consump;on (Restricted customer panel)
Peak hours
Off-‐peak hours
VariaDon of consumpDon allocaDon during peak/off-‐peak hours Restricted customer panel (8,427 customers): Flat rate P1 vs. ToU rate P2
12
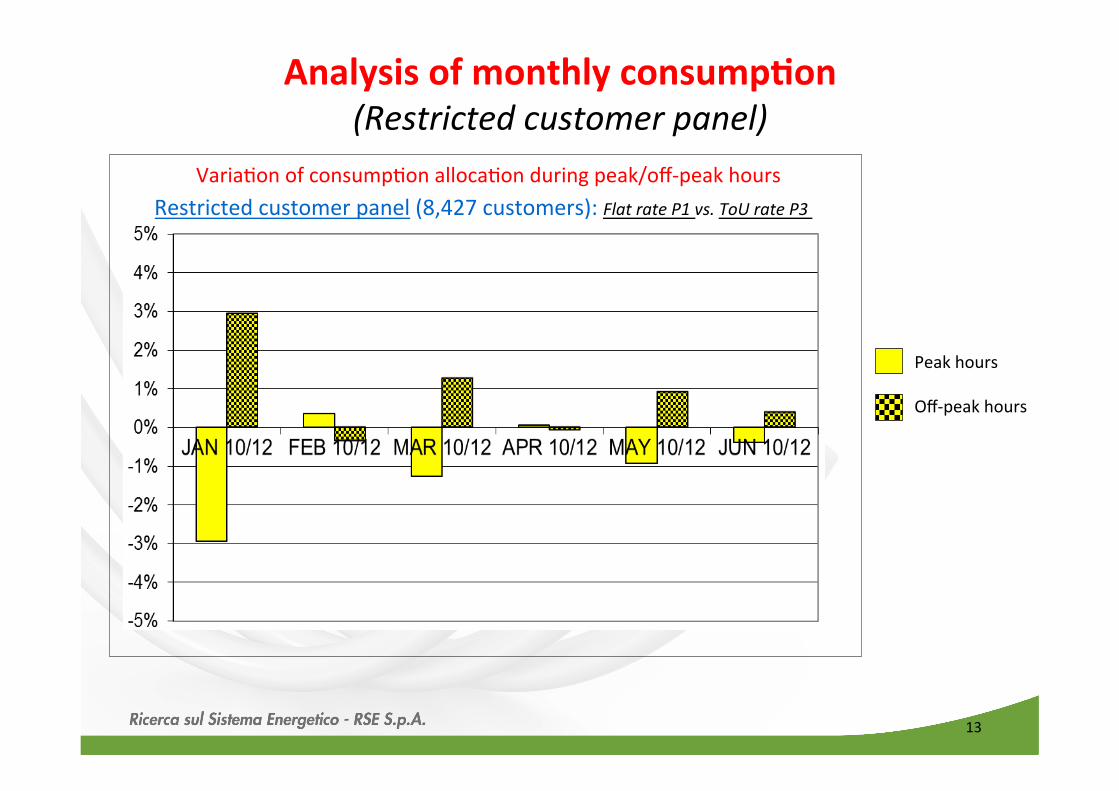
Analysis of monthly consump;on (Restricted customer panel)
13
Peak hours
Off-‐peak hours
VariaDon of consumpDon allocaDon during peak/off-‐peak hours Restricted customer panel (8,427 customers): Flat rate P1 vs. ToU rate P3
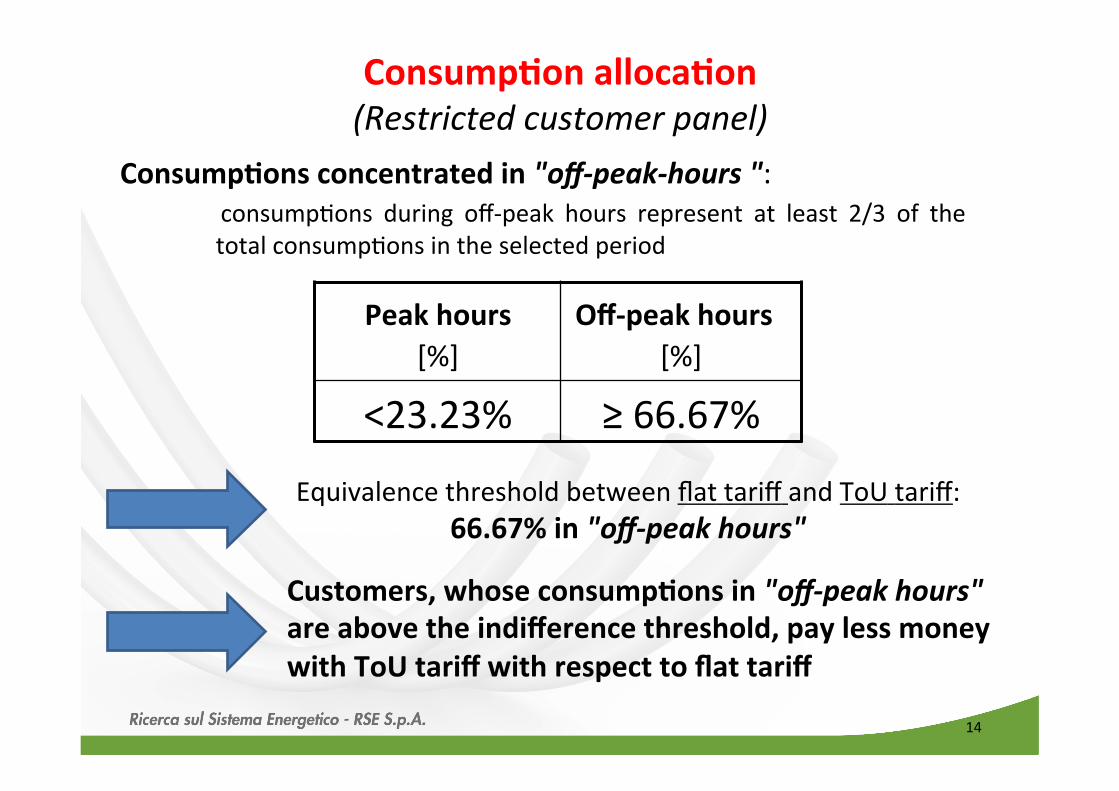
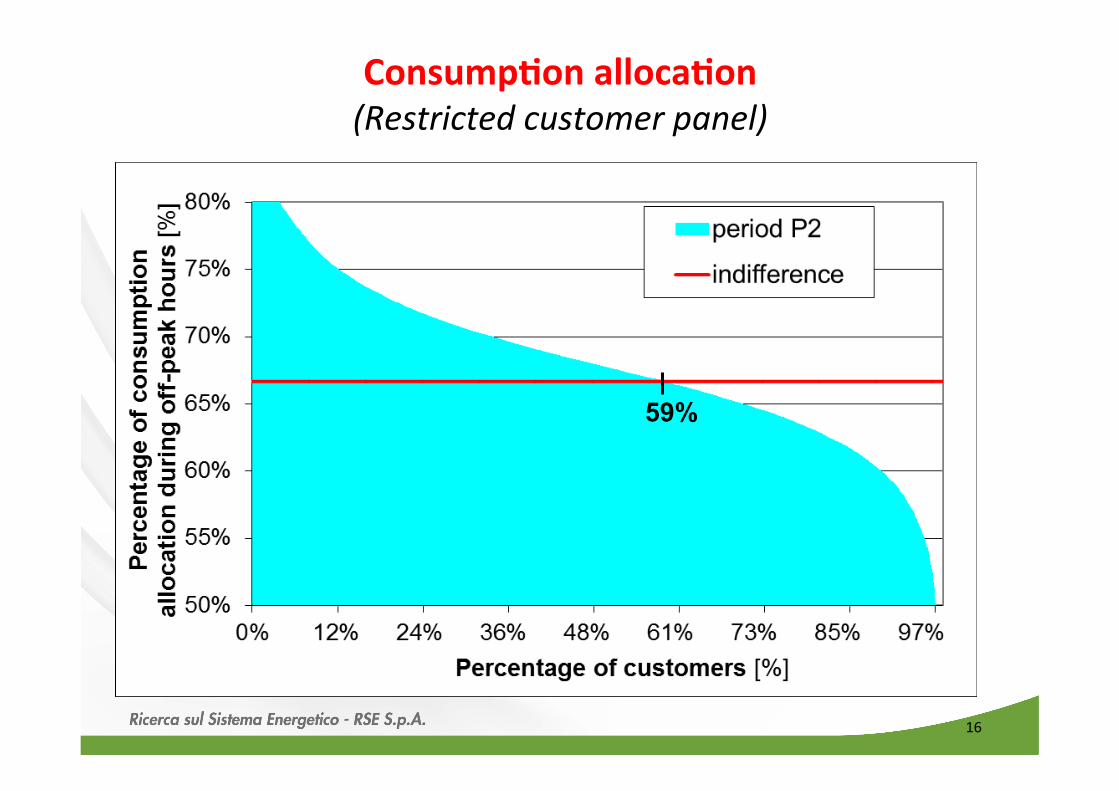
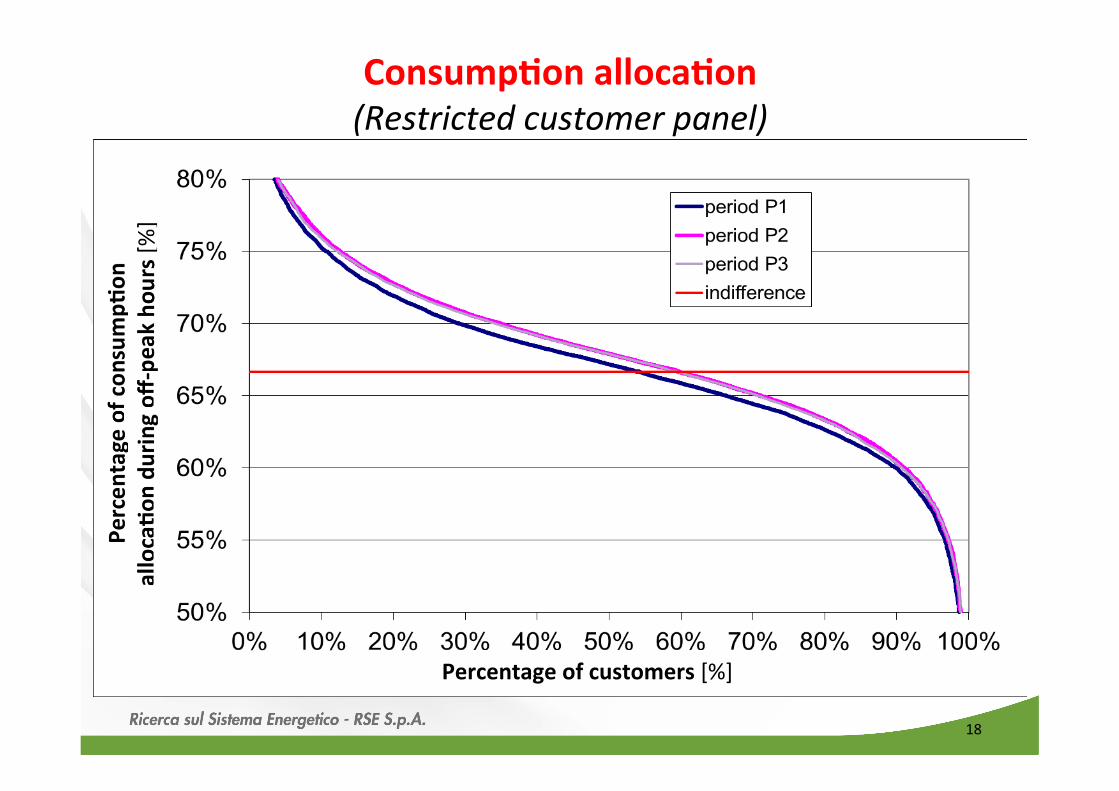
Consump;ons concentrated in "off-‐peak-‐hours ": consumpDons during off-‐peak hours represent at least 2/3 of the total consumpDons in the selected period
Peak hours [%]
Off-‐peak hours [%]
<23.23% ≥ 66.67%
Consump;on alloca;on (Restricted customer panel)
Equivalence threshold between flat tariff and ToU tariff: 66.67% in "off-‐peak hours"
Customers, whose consump;ons in "off-‐peak hours" are above the indifference threshold, pay less money with ToU tariff with respect to flat tariff
14
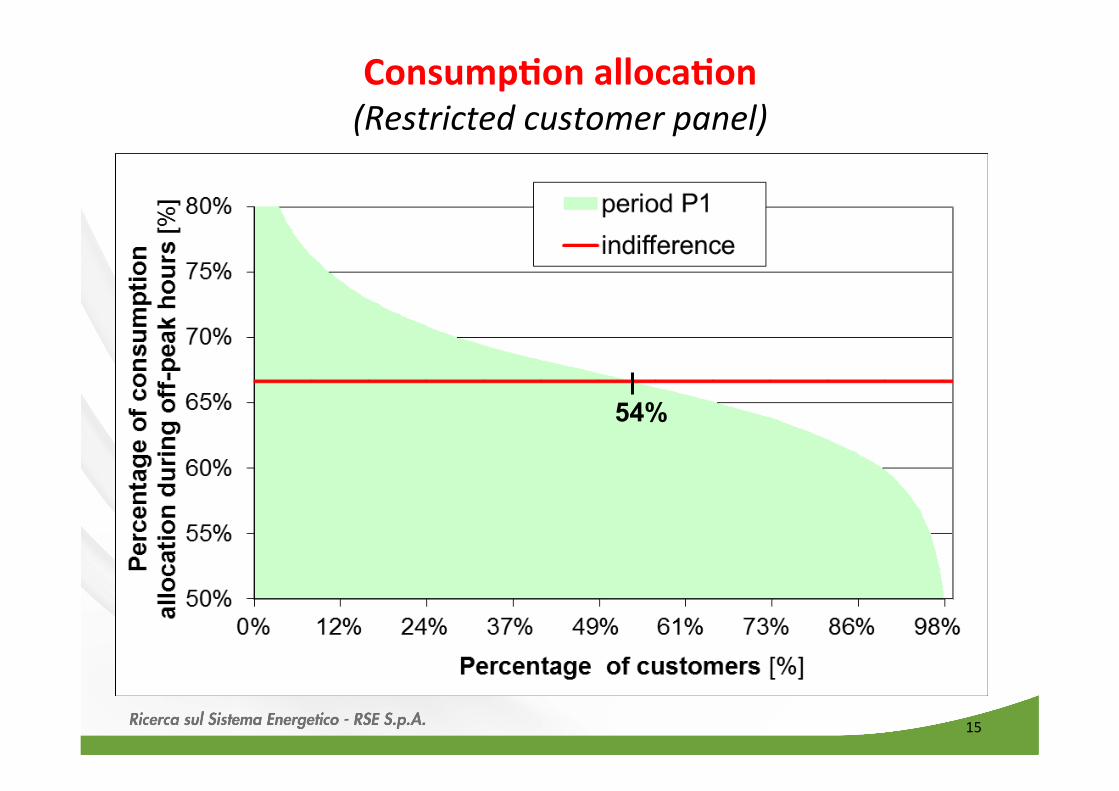
54%
15
Consump;on alloca;on (Restricted customer panel)
16
Consump;on alloca;on (Restricted customer panel)
59%

17
Consump;on alloca;on (Restricted customer panel)
59%
18
Consump;on alloca;on (Restricted customer panel)
Percentage of customers [%]
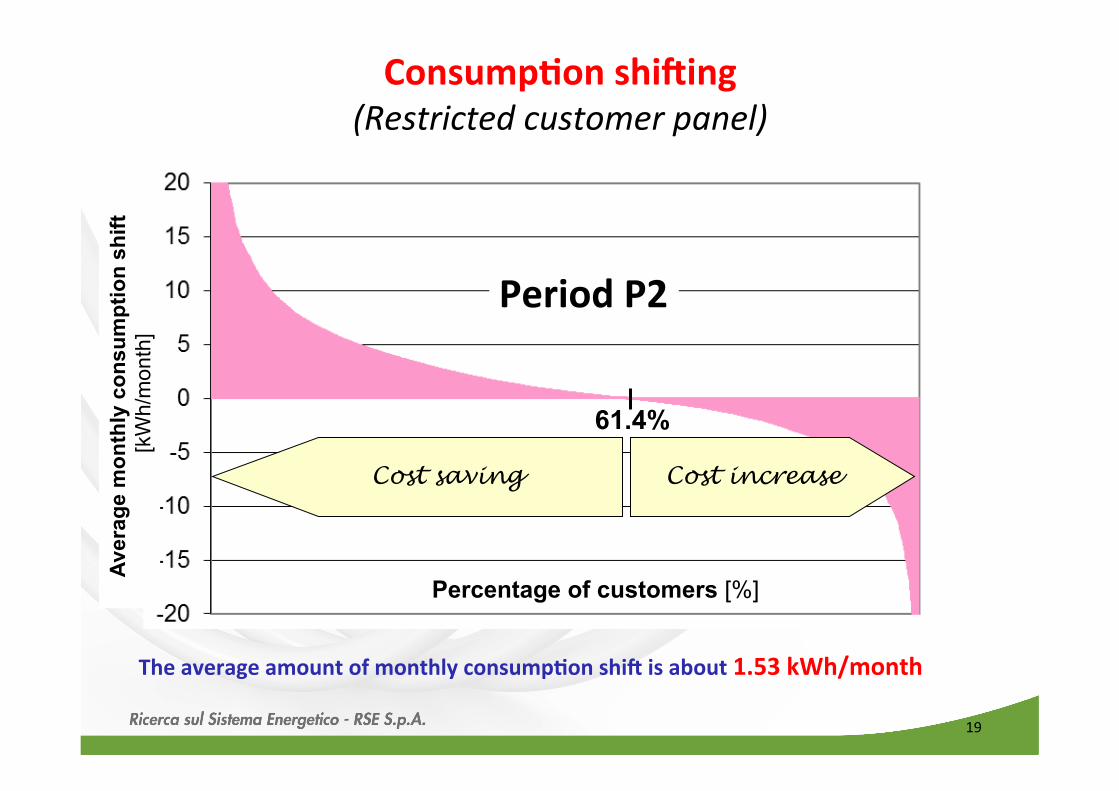
61.4%
Cost increase Cost saving
Aver
age
mon
thly
con
sum
ptio
n sh
ift
[kW
h/m
onth
]
Percentage of customers [%]
Consump;on shi\ing (Restricted customer panel)
The average amount of monthly consump;on shi\ is about 1.53 kWh/month
19
Period P2

60.1%
Cost increase Cost saving
Aver
age
mon
thly
con
sum
ptio
n sh
ift
[kW
h/m
onth
]
Percentage of customers [%]
Consump;on shi\ing (Restricted customer panel)
The average amount of monthly consump;on shi\ is about 1.53 kWh/month
20
Period P3
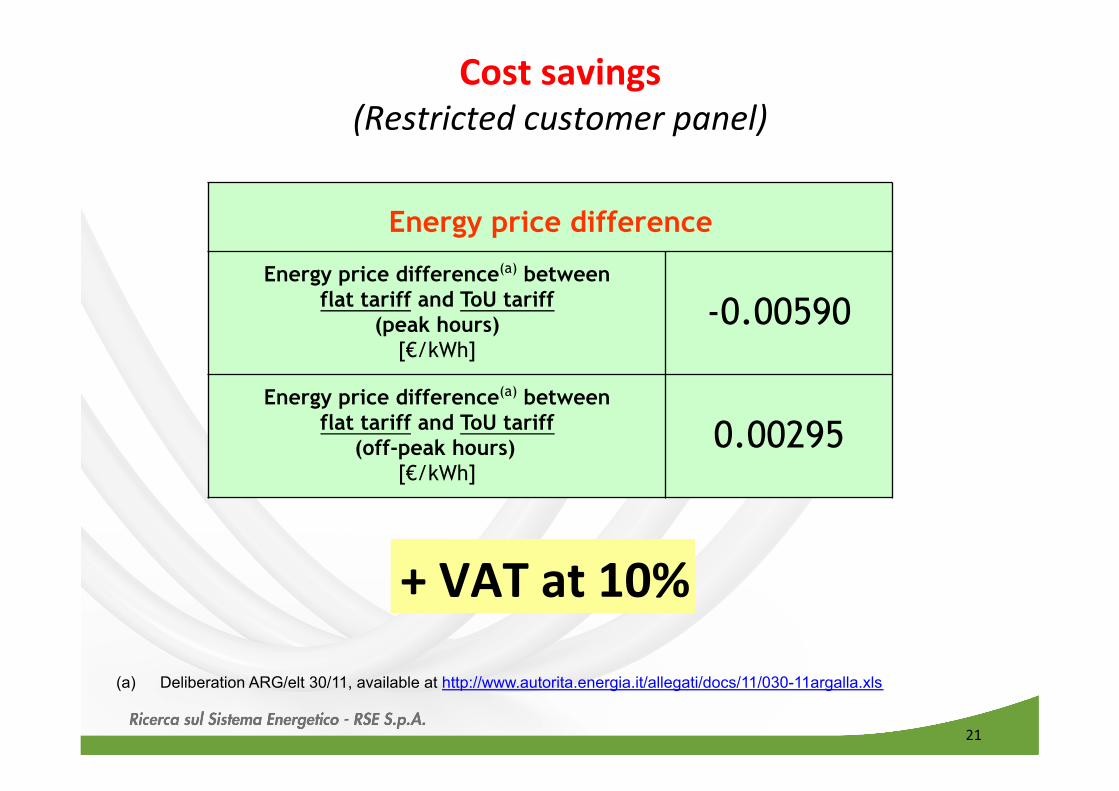
Energy price difference
Energy price difference(a) between flat tariff and ToU tariff
(peak hours)
[€/kWh]
-0.00590
Energy price difference(a) between flat tariff and ToU tariff
(off-peak hours)
[€/kWh]
0.00295
+ VAT at 10%
(a) Deliberation ARG/elt 30/11, available at http://www.autorita.energia.it/allegati/docs/11/030-11argalla.xls
21
Cost savings (Restricted customer panel)
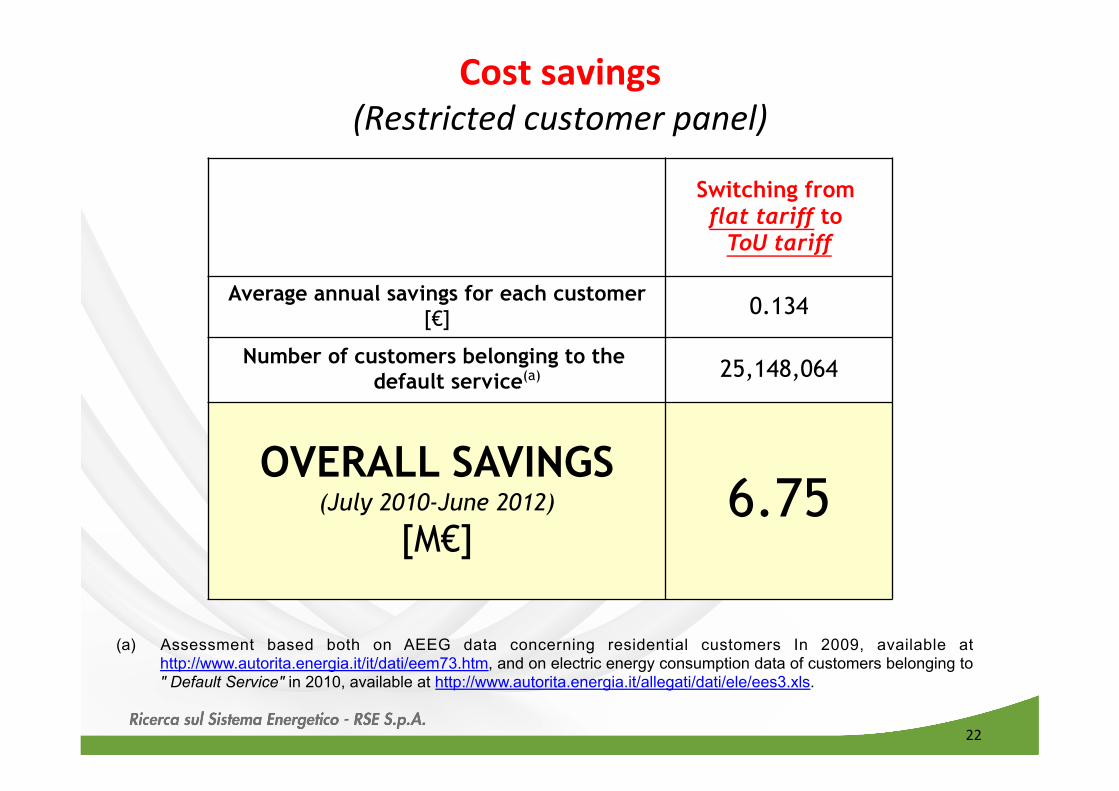
Switching from flat tariff to
ToU tariff
Average annual savings for each customer [€] 0.134
Number of customers belonging to the default service(a) 25,148,064
OVERALL SAVINGS (July 2010-June 2012)
[M€] 6.75
(a) Assessment based both on AEEG data concerning residential customers In 2009, available at http://www.autorita.energia.it/it/dati/eem73.htm, and on electric energy consumption data of customers belonging to " Default Service" in 2010, available at http://www.autorita.energia.it/allegati/dati/ele/ees3.xls.
22
Cost savings (Restricted customer panel)
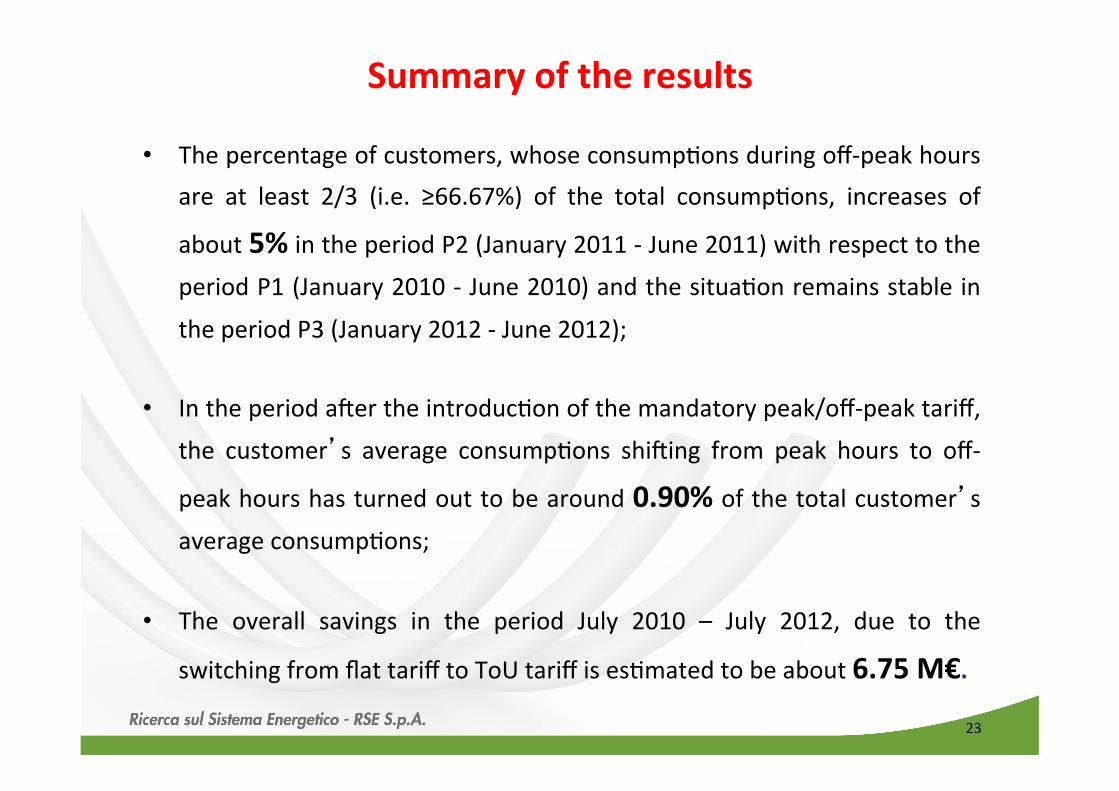
Summary of the results
• The percentage of customers, whose consumpDons during off-‐peak hours are at least 2/3 (i.e. ≥66.67%) of the total consumpDons, increases of
about 5% in the period P2 (January 2011 -‐ June 2011) with respect to the
period P1 (January 2010 -‐ June 2010) and the situaDon remains stable in
the period P3 (January 2012 -‐ June 2012);
• In the period aler the introducDon of the mandatory peak/off-‐peak tariff,
the customer’s average consumpDons shiling from peak hours to off-‐
peak hours has turned out to be around 0.90% of the total customer’s
average consumpDons;
• The overall savings in the period July 2010 – July 2012, due to the
switching from flat tariff to ToU tariff is esDmated to be about 6.75 M€.
23
Summary
24
1. Analysis of monthly data
2. Analysis of the load curves
3. Analysis of consumers’ habits
4. Conclusions
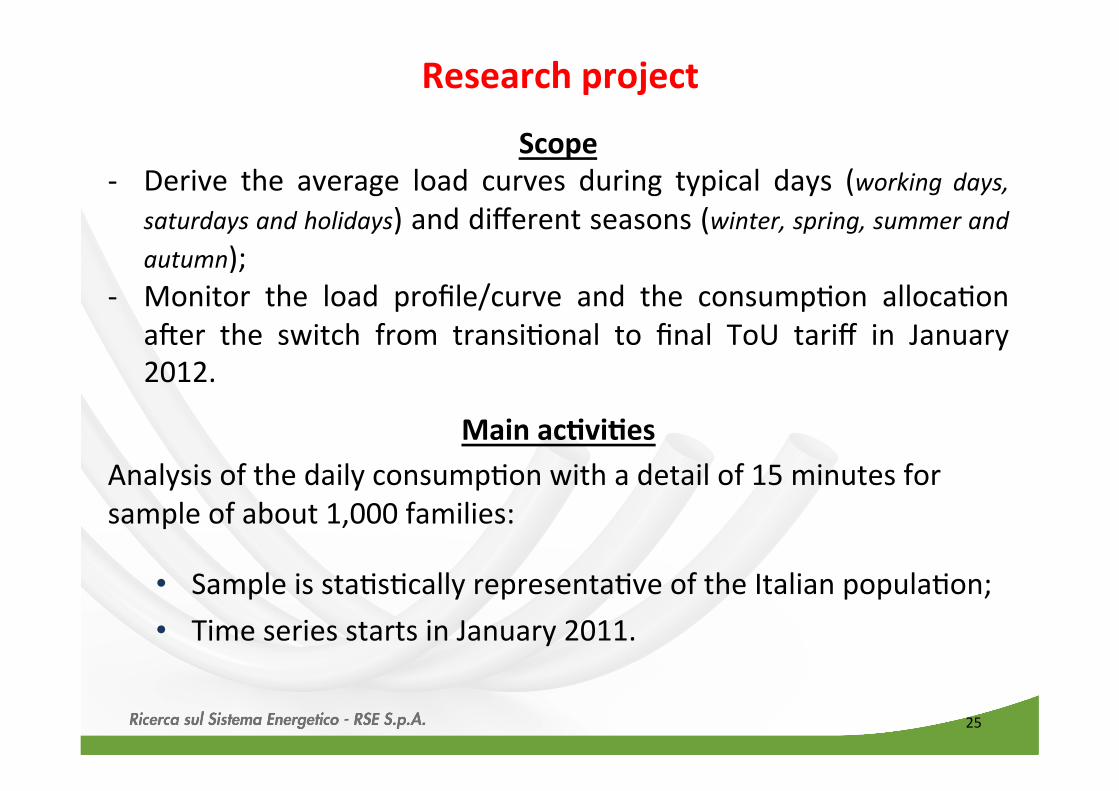
Main ac;vi;es Analysis of the daily consumpDon with a detail of 15 minutes for sample of about 1,000 families:
• Sample is staDsDcally representaDve of the Italian populaDon; • Time series starts in January 2011.
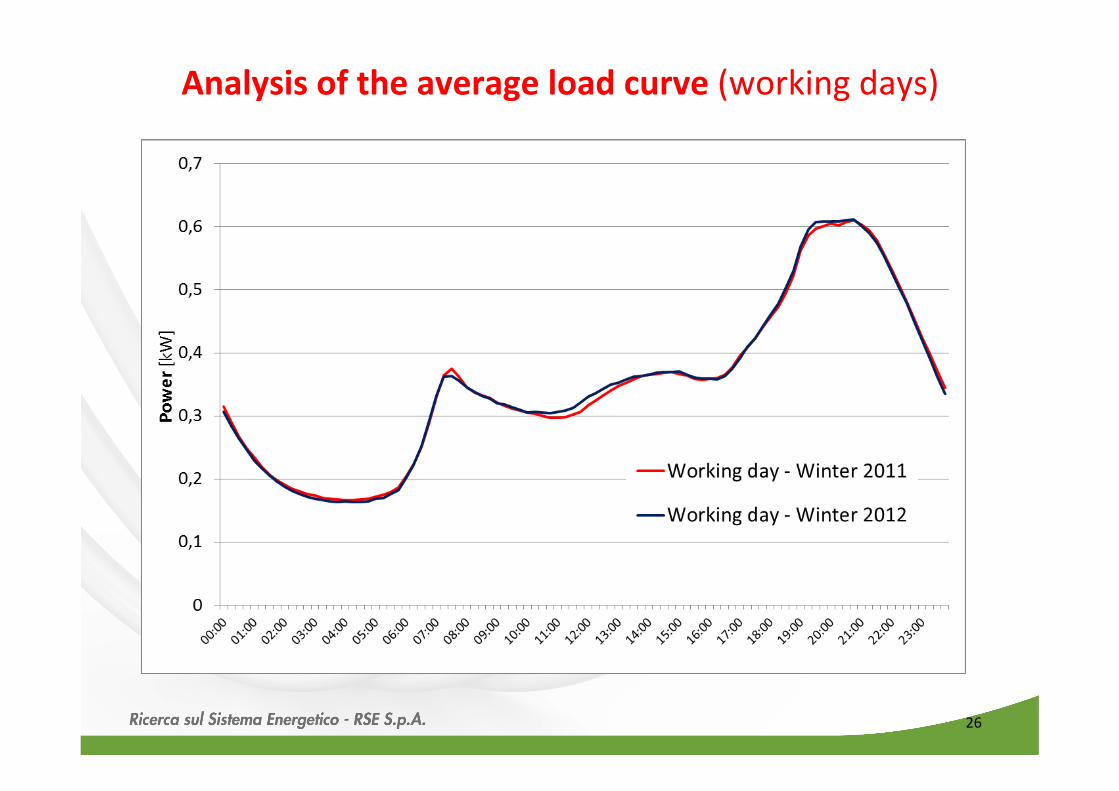
Scope -‐ Derive the average load curves during typical days (working days,
saturdays and holidays) and different seasons (winter, spring, summer and autumn);
-‐ Monitor the load profile/curve and the consumpDon allocaDon aler the switch from transiDonal to final ToU tariff in January 2012.
Research project
25
26
Analysis of the average load curve (working days)
27
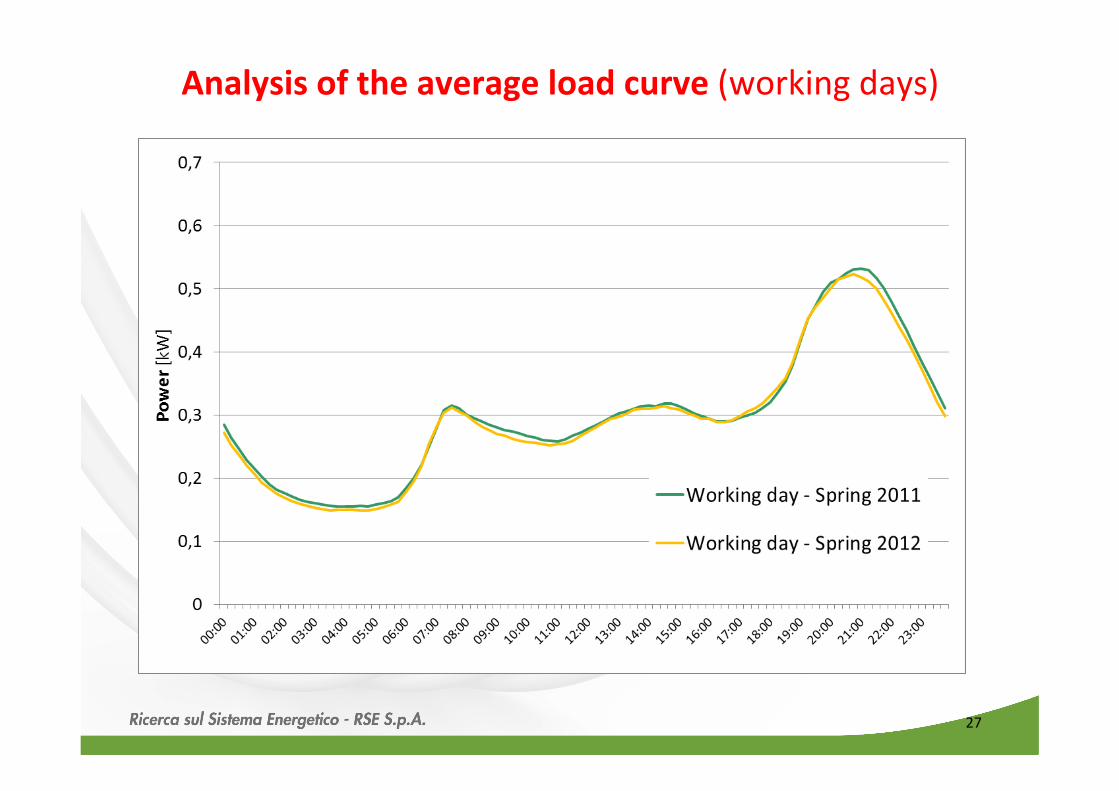
Analysis of the average load curve (working days)
28
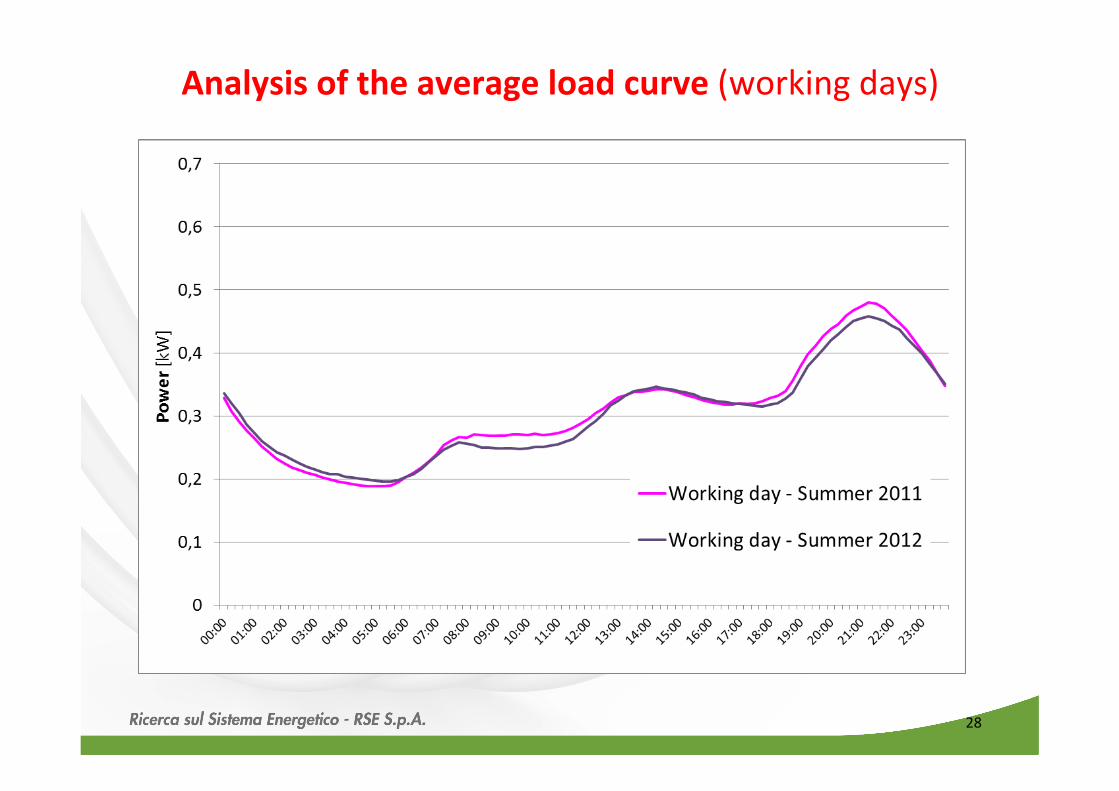
Analysis of the average load curve (working days)
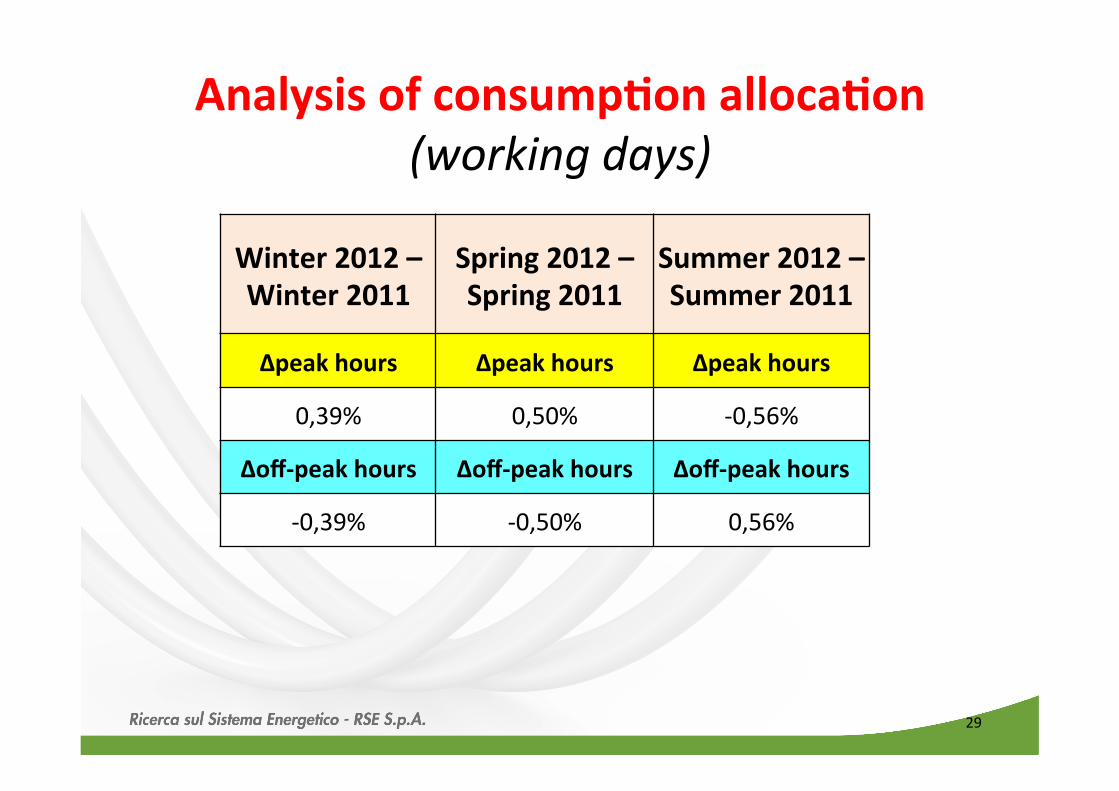
Analysis of consump;on alloca;on (working days)
29
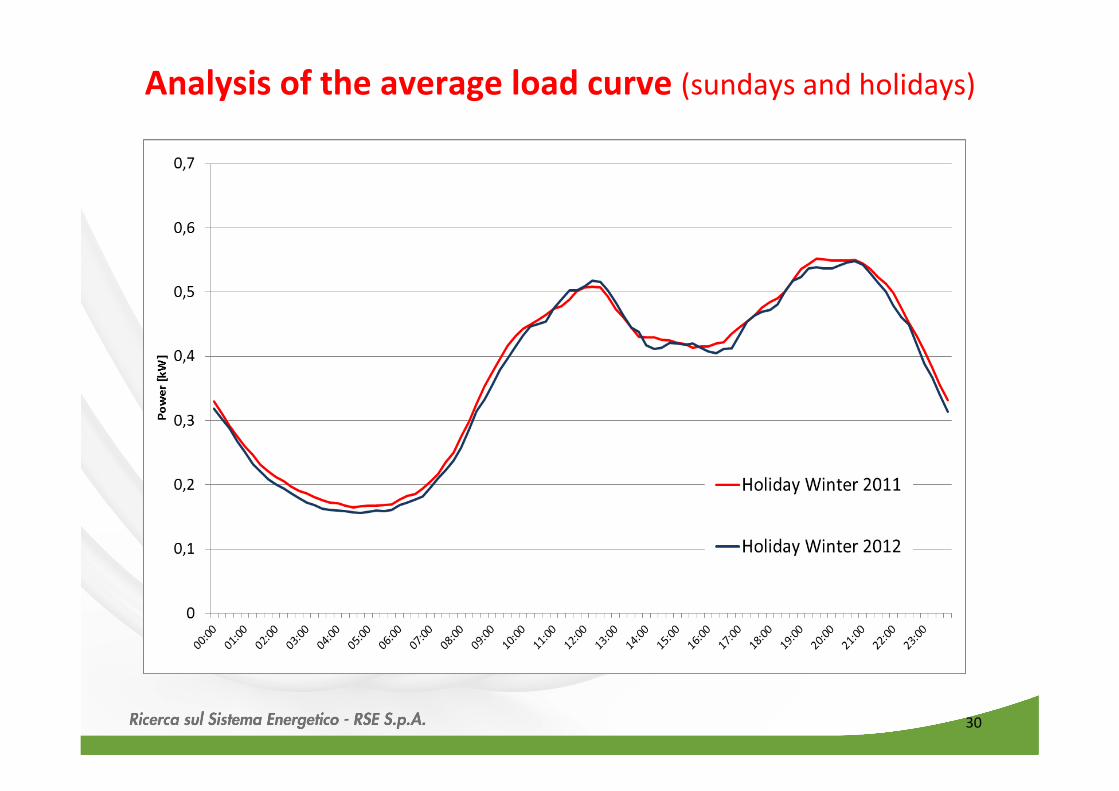
Winter 2012 – Winter 2011
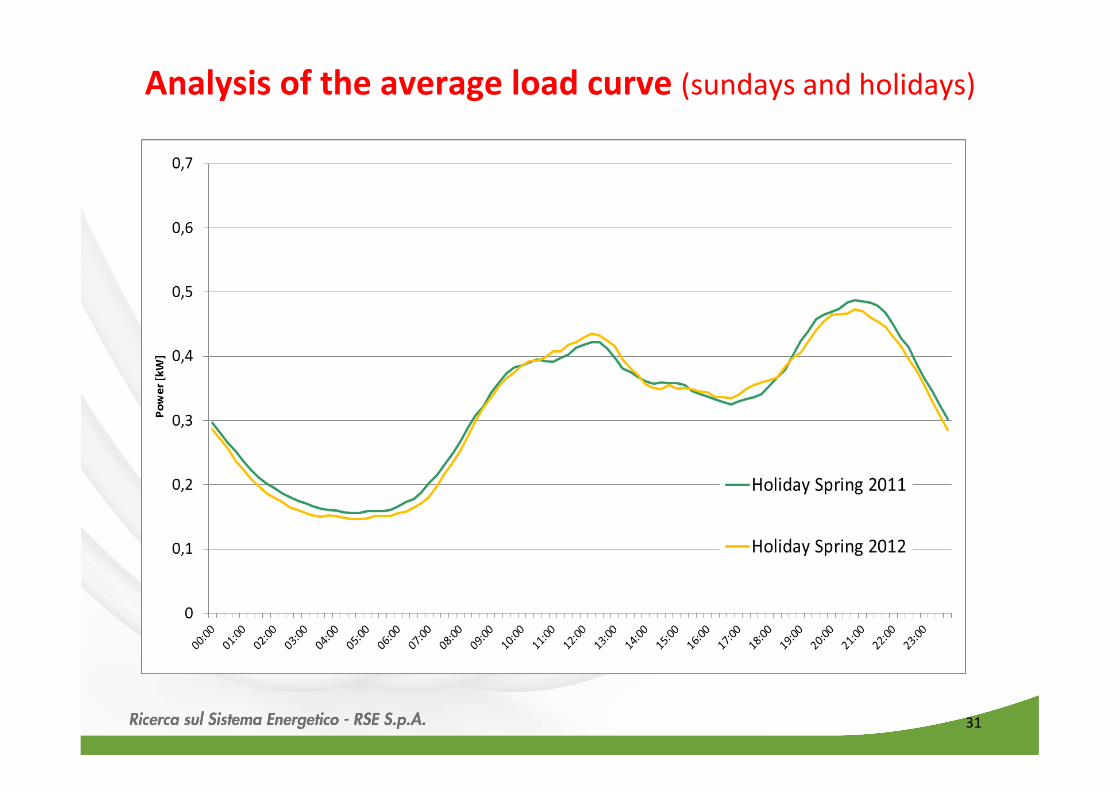
Spring 2012 – Spring 2011
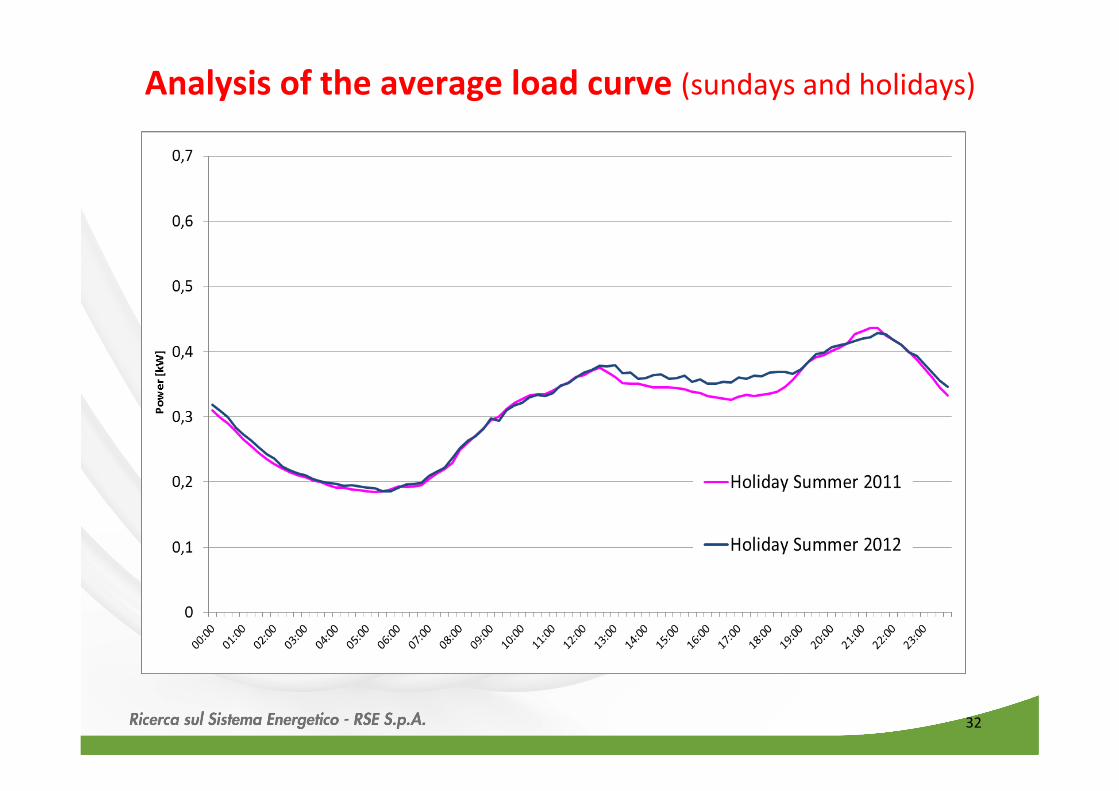
Summer 2012 – Summer 2011
Δpeak hours Δpeak hours Δpeak hours
0,39% 0,50% -‐0,56%
Δoff-‐peak hours Δoff-‐peak hours Δoff-‐peak hours
-‐0,39% -‐0,50% 0,56%
30
Analysis of the average load curve (sundays and holidays)
31
Analysis of the average load curve (sundays and holidays)
32
Analysis of the average load curve (sundays and holidays)
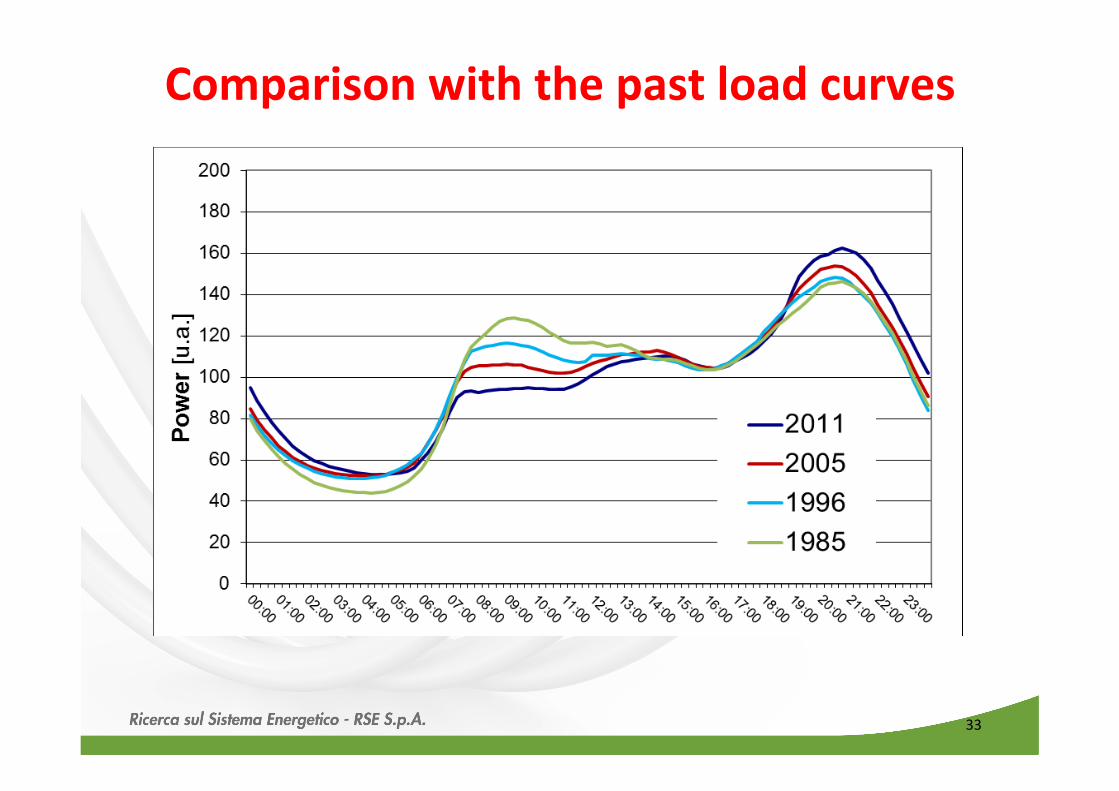
Comparison with the past load curves
33
Summary
34
1. Analysis of monthly data
2. Analysis of the load curves
3. Analysis of consumers’ habits
4. Conclusions
35
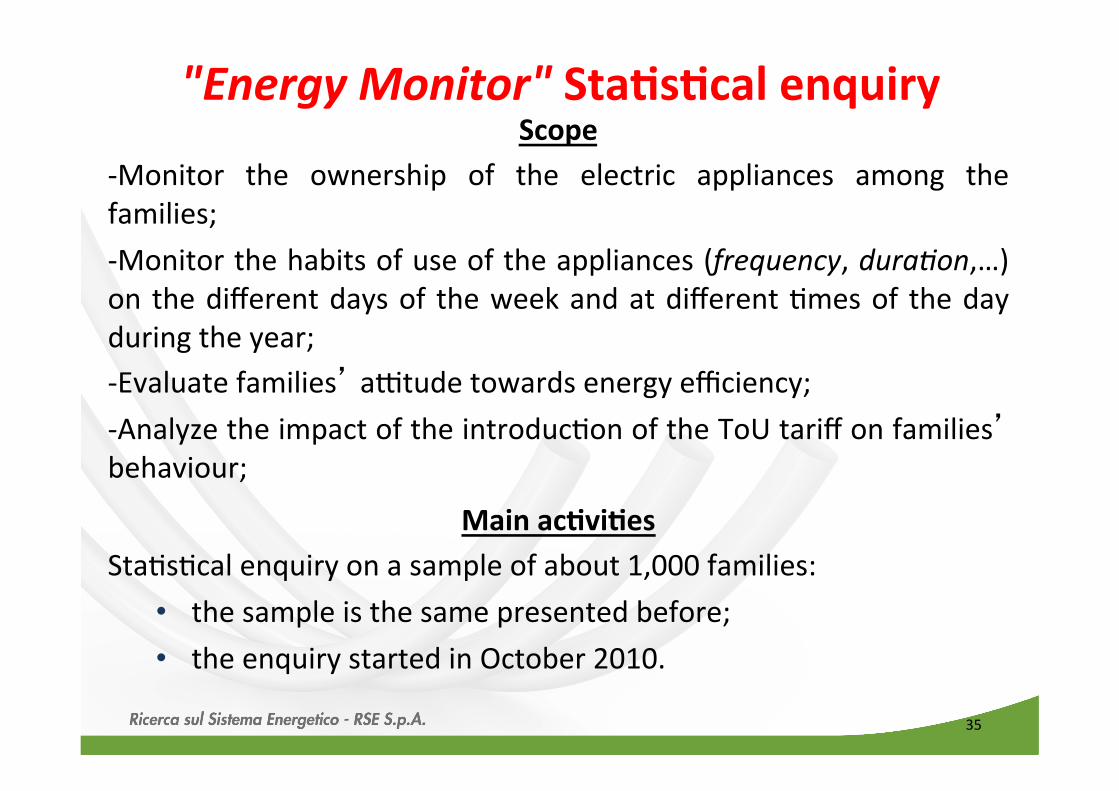
"Energy Monitor" Sta;s;cal enquiry Scope
-‐ Monitor the ownership of the electric appliances among the families; -‐ Monitor the habits of use of the appliances (frequency, duraIon,…) on the different days of the week and at different Dmes of the day during the year; -‐ Evaluate families’ a`tude towards energy efficiency; -‐ Analyze the impact of the introducDon of the ToU tariff on families’ behaviour;
Main ac;vi;es StaDsDcal enquiry on a sample of about 1,000 families:
• the sample is the same presented before; • the enquiry started in October 2010.
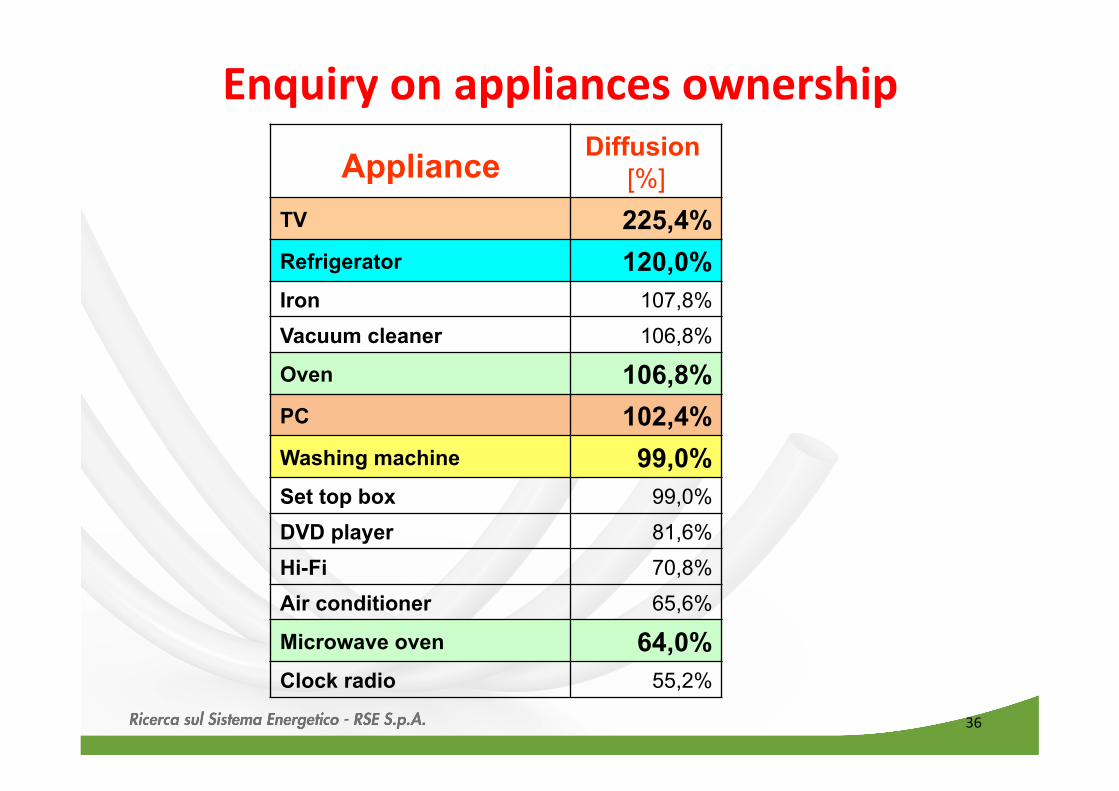
Appliance Diffusion [%]
TV 225,4% Refrigerator 120,0% Iron 107,8%
Vacuum cleaner 106,8%
Oven 106,8% PC 102,4% Washing machine 99,0% Set top box 99,0%
DVD player 81,6%
Hi-Fi 70,8%
Air conditioner 65,6%
Microwave oven 64,0% Clock radio 55,2%
36
Enquiry on appliances ownership
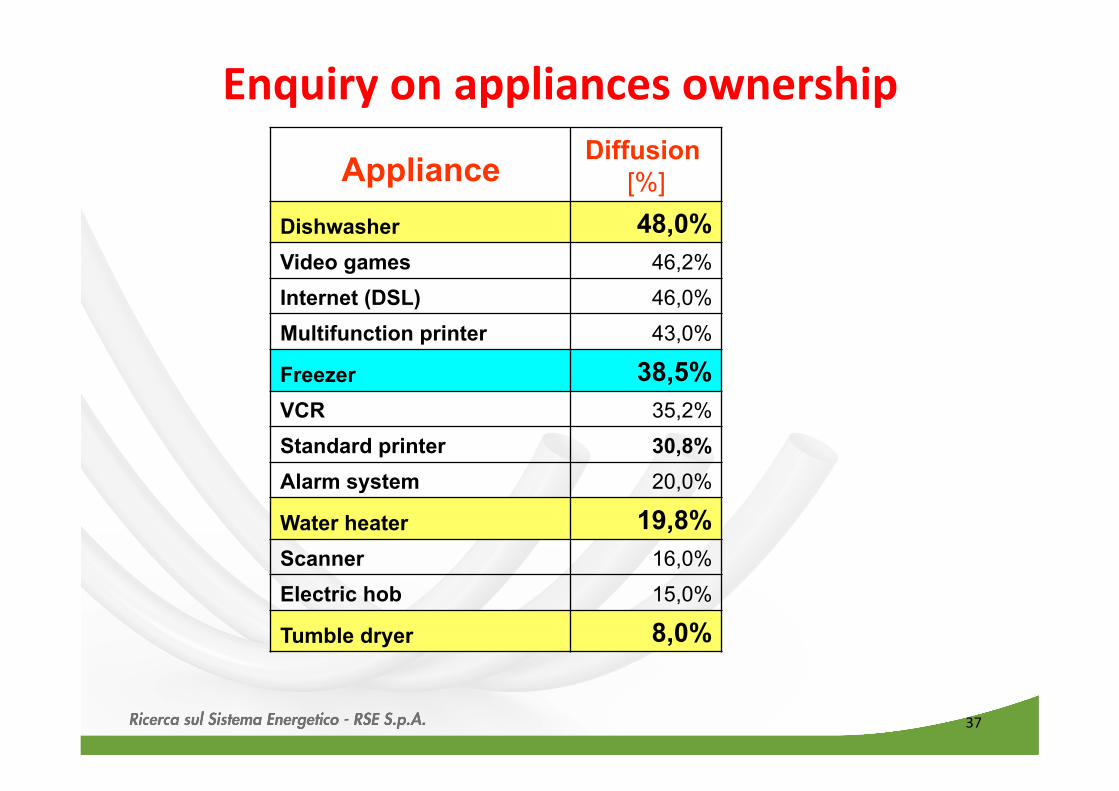
Enquiry on appliances ownership
37
Appliance Diffusion [%]
Dishwasher 48,0% Video games 46,2%
Internet (DSL) 46,0%
Multifunction printer 43,0%
Freezer 38,5% VCR 35,2%
Standard printer 30,8% Alarm system 20,0%
Water heater 19,8% Scanner 16,0%
Electric hob 15,0%
Tumble dryer 8,0%
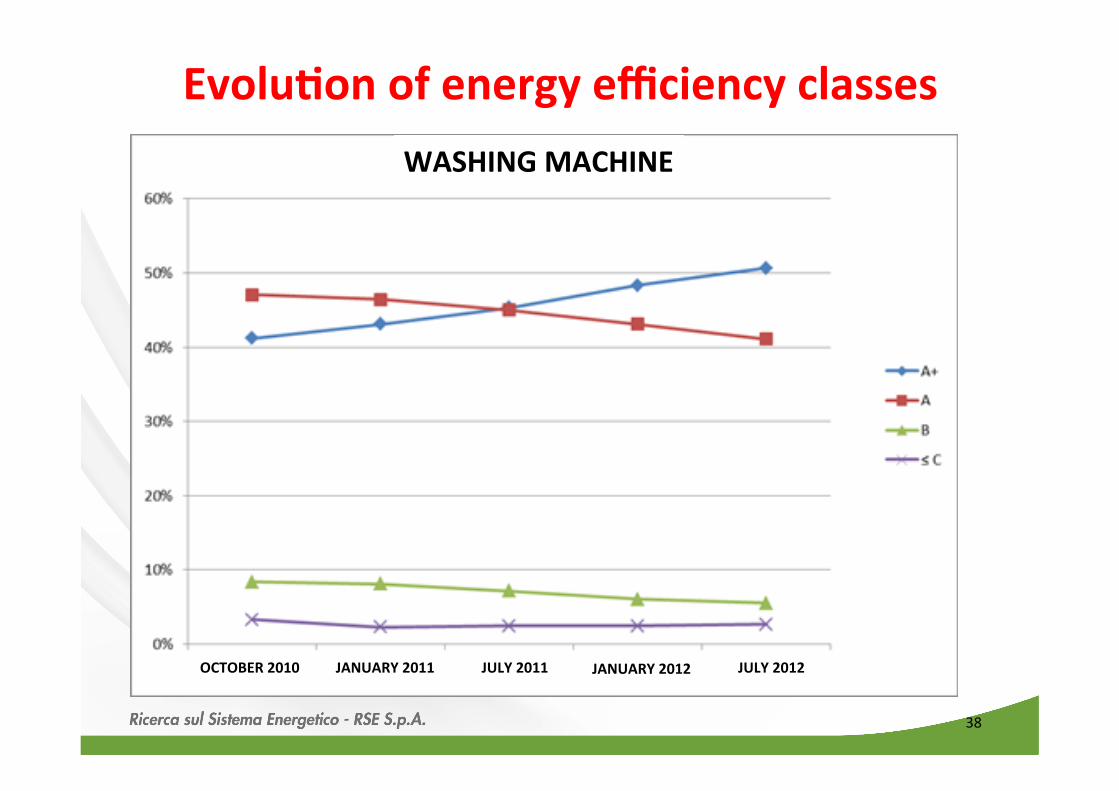
38
Evolu;on of energy efficiency classes WASHING MACHINE
OCTOBER 2010 JANUARY 2011 JULY 2011 JANUARY 2012 JULY 2012
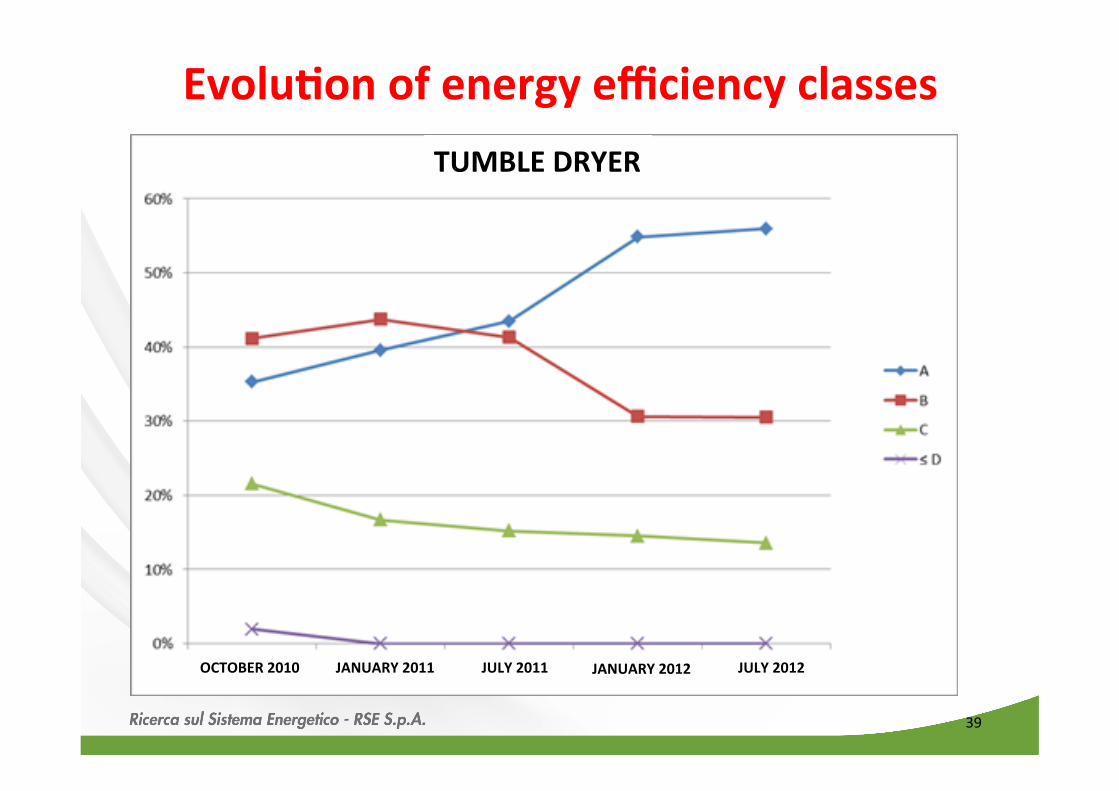
39
Evolu;on of energy efficiency classes TUMBLE DRYER
OCTOBER 2010 JANUARY 2011 JULY 2011 JANUARY 2012 JULY 2012
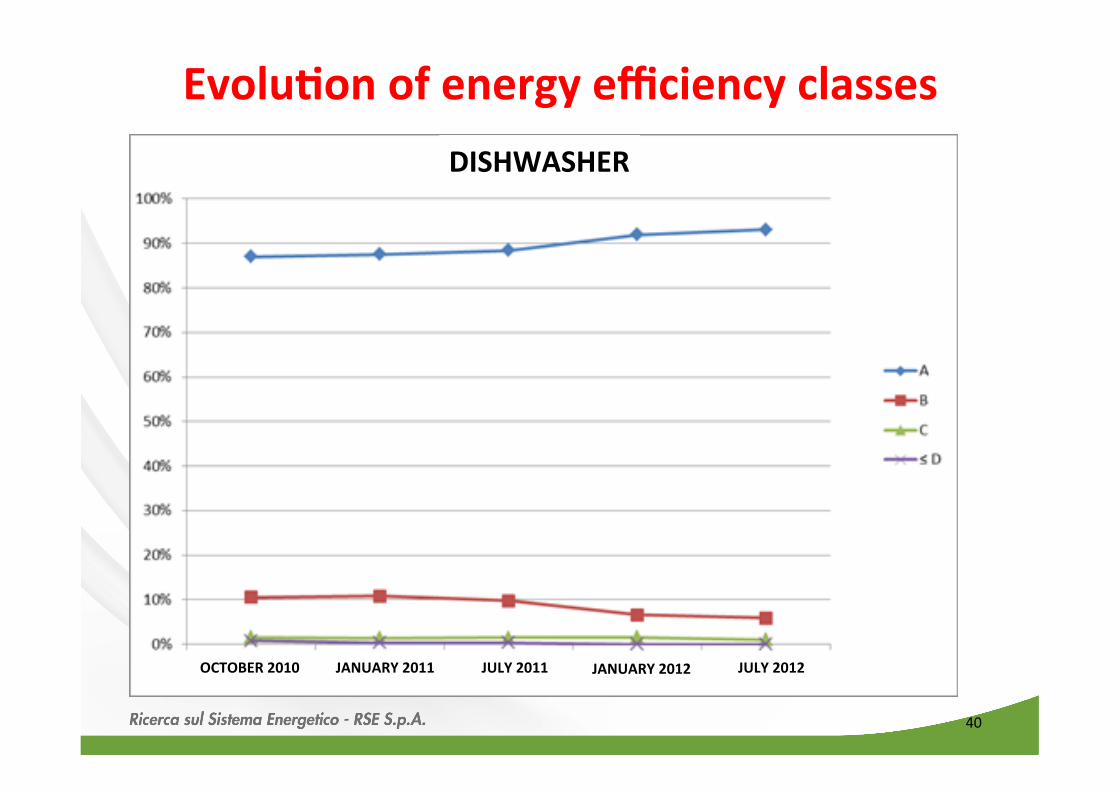
40
Evolu;on of energy efficiency classes DISHWASHER
OCTOBER 2010 JANUARY 2011 JULY 2011 JANUARY 2012 JULY 2012
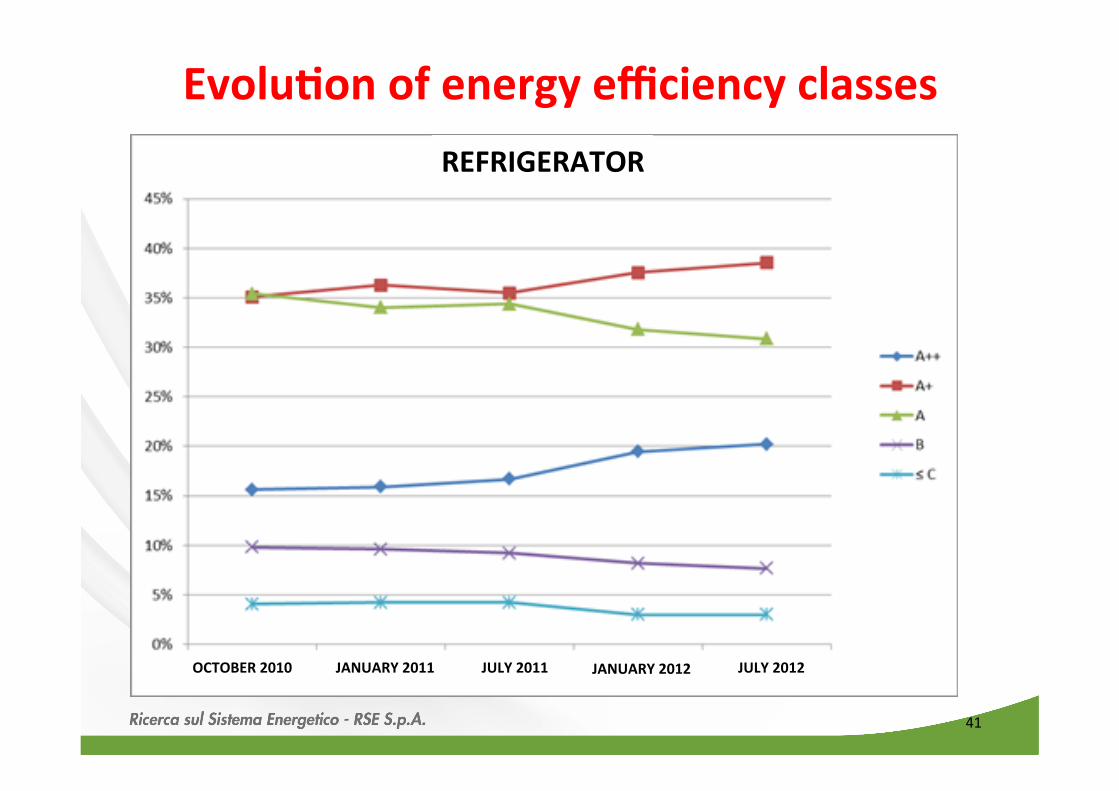
41
Evolu;on of energy efficiency classes REFRIGERATOR
OCTOBER 2010 JANUARY 2011 JULY 2011 JANUARY 2012 JULY 2012
42
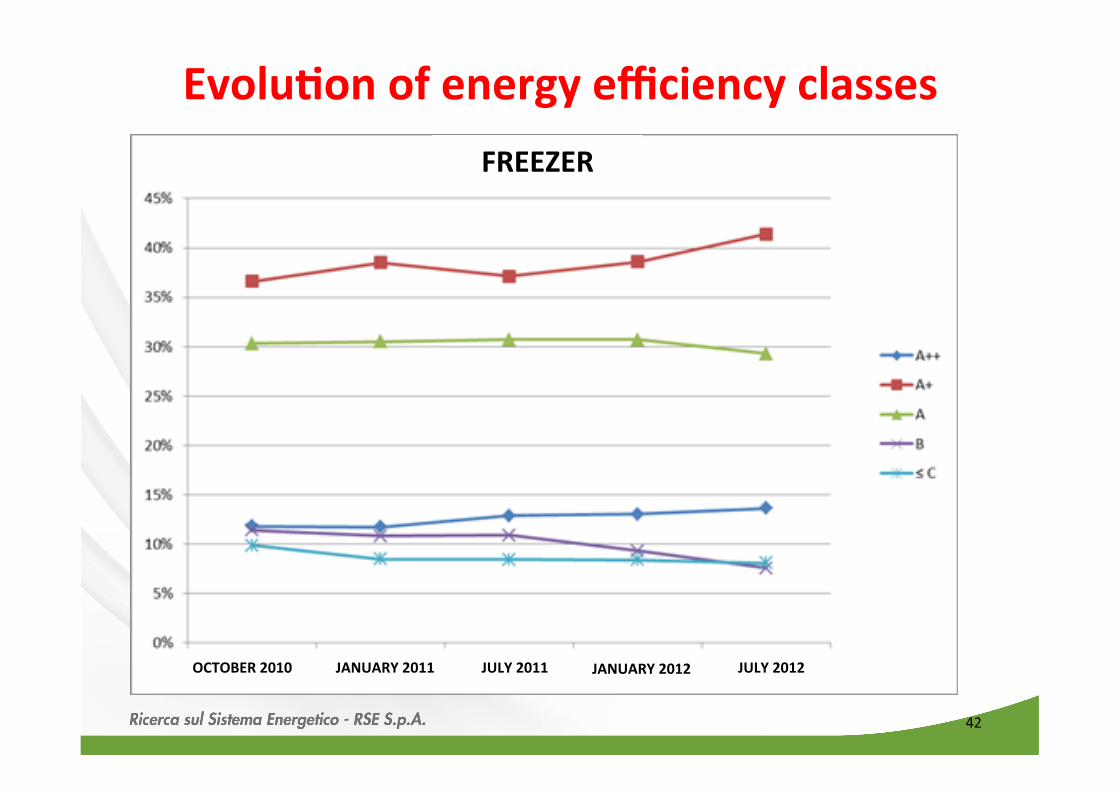
Evolu;on of energy efficiency classes FREEZER
OCTOBER 2010 JANUARY 2011 JULY 2011 JANUARY 2012 JULY 2012
43
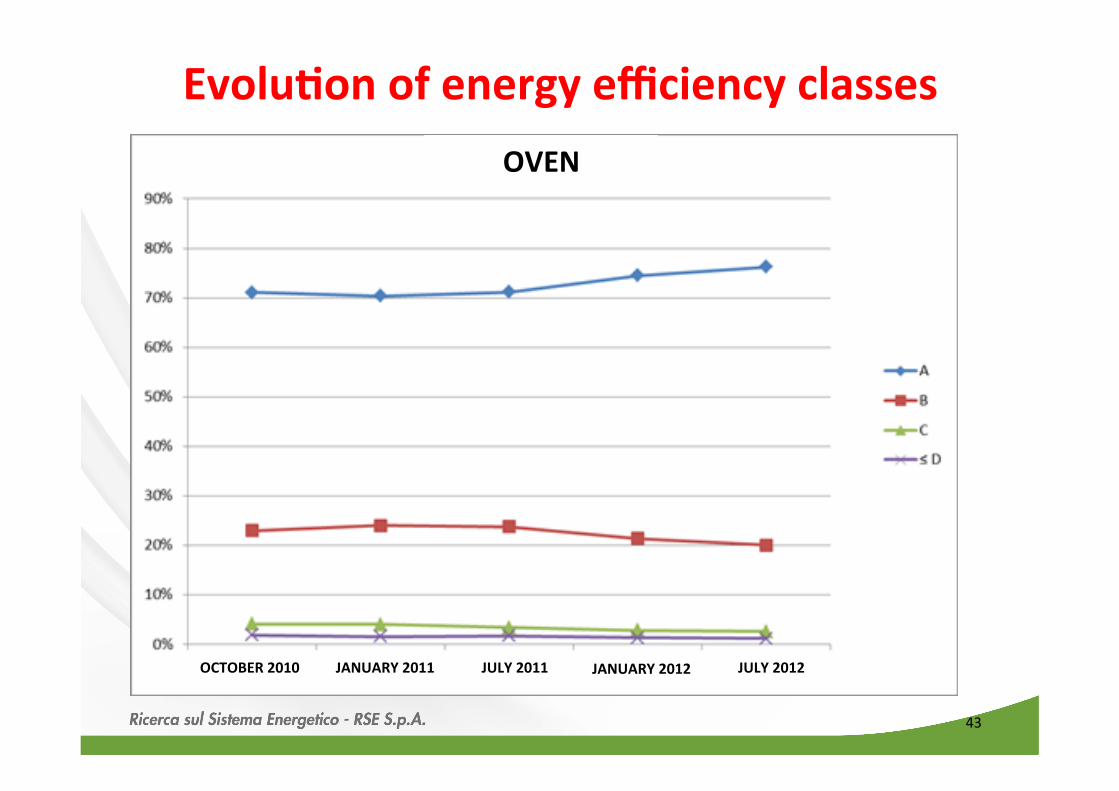
Evolu;on of energy efficiency classes OVEN
OCTOBER 2010 JANUARY 2011 JULY 2011 JANUARY 2012 JULY 2012
44
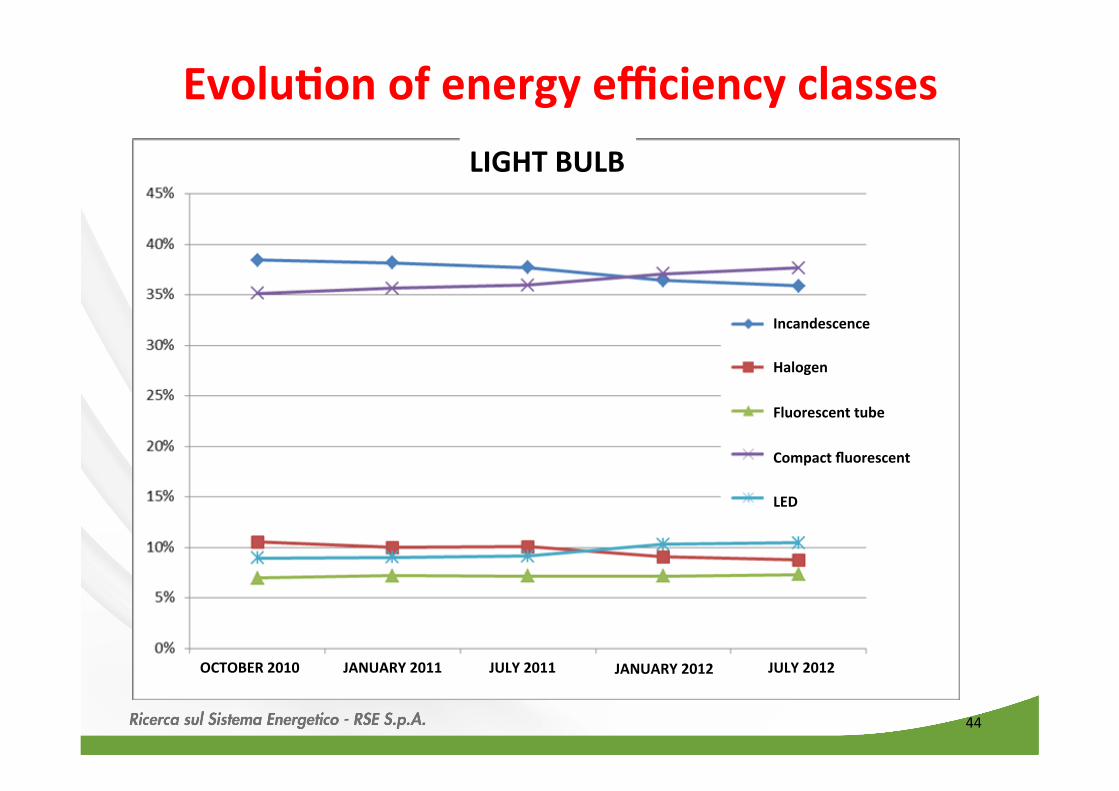
Evolu;on of energy efficiency classes LIGHT BULB
OCTOBER 2010 JANUARY 2011 JULY 2011 JANUARY 2012 JULY 2012
Incandescence
Halogen
Fluorescent tube
LED
Compact fluorescent
45
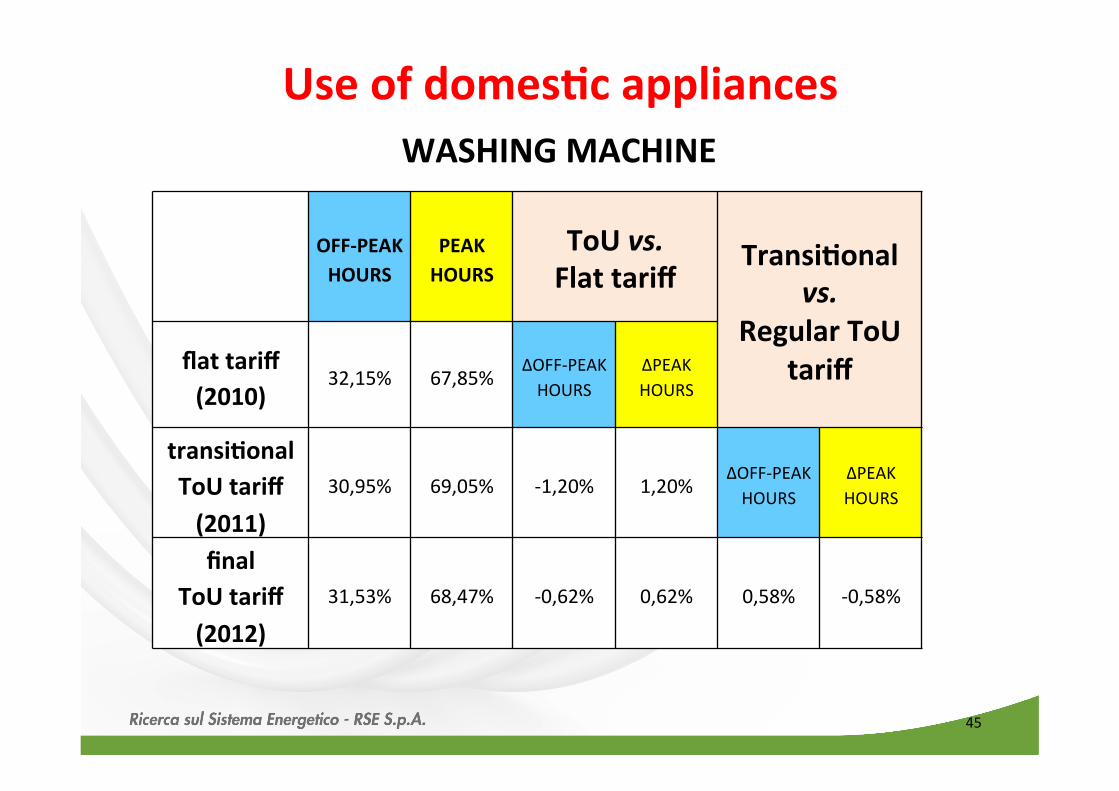
Use of domes;c appliances
OFF-‐PEAK HOURS
PEAK HOURS
ToU vs. Flat tariff
Transi;onal vs.
Regular ToU tariff flat tariff
(2010) 32,15% 67,85% ΔOFF-‐PEAK HOURS
ΔPEAK HOURS
transi;onal ToU tariff (2011)
30,95% 69,05% -‐1,20% 1,20% ΔOFF-‐PEAK HOURS
ΔPEAK HOURS
final ToU tariff (2012)
31,53% 68,47% -‐0,62% 0,62% 0,58% -‐0,58%
WASHING MACHINE

46
OFF-‐PEAK HOURS
PEAK HOURS
ToU vs. Flat tariff
Transi;onal vs.
Regular ToU tariff flat tariff
(2010) 33,83% 66,17% ΔOFF-‐PEAK HOURS
ΔPEAK HOURS
transi;onal ToU tariff (2011)
28,47% 71,53% -‐5,35% 5,35% ΔOFF-‐PEAK HOURS
ΔPEAK HOURS
final ToU tariff (2012)
26,72% 73,28% -‐7,11% 7,11% -‐1,76% 1,76%
TUMBLE DRYER
Use of domes;c appliances
47
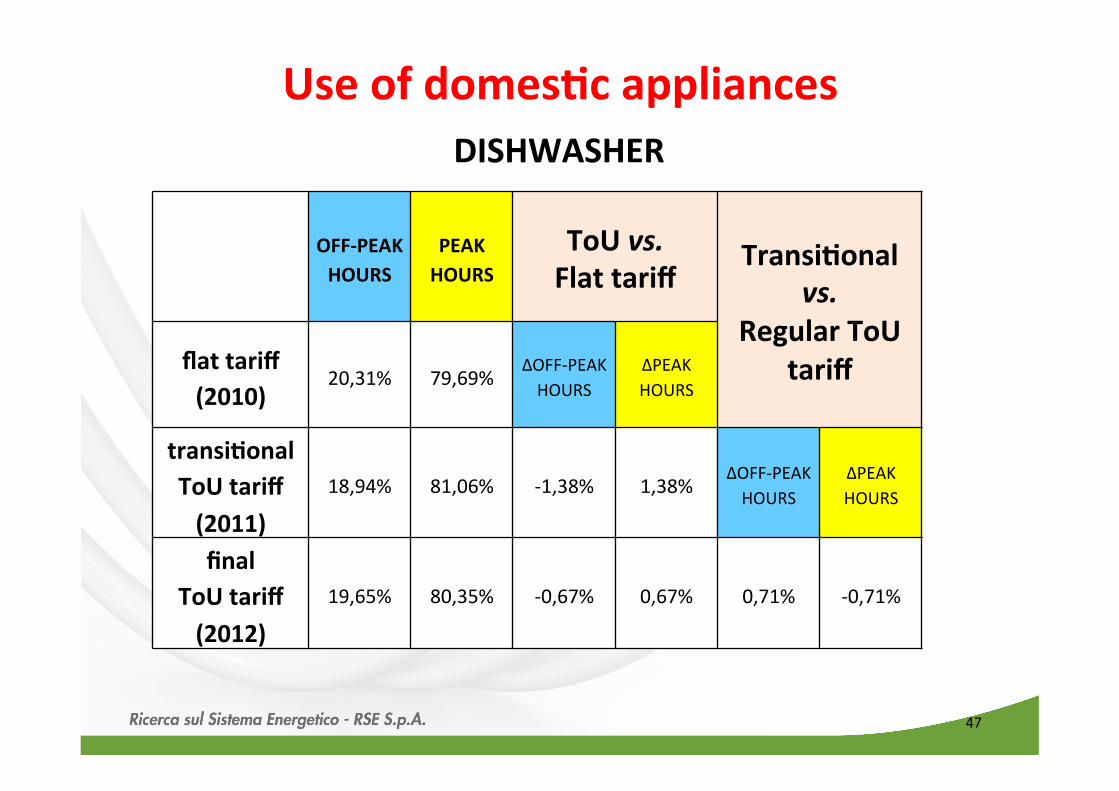
OFF-‐PEAK HOURS
PEAK HOURS
ToU vs. Flat tariff
Transi;onal vs.
Regular ToU tariff flat tariff
(2010) 20,31% 79,69% ΔOFF-‐PEAK HOURS
ΔPEAK HOURS
transi;onal ToU tariff (2011)
18,94% 81,06% -‐1,38% 1,38% ΔOFF-‐PEAK HOURS
ΔPEAK HOURS
final ToU tariff (2012)
19,65% 80,35% -‐0,67% 0,67% 0,71% -‐0,71%
DISHWASHER
Use of domes;c appliances
Summary
48
1. Analysis of monthly data
2. Analysis of the load curves
3. Analysis of consumers’ habits
4. Conclusions
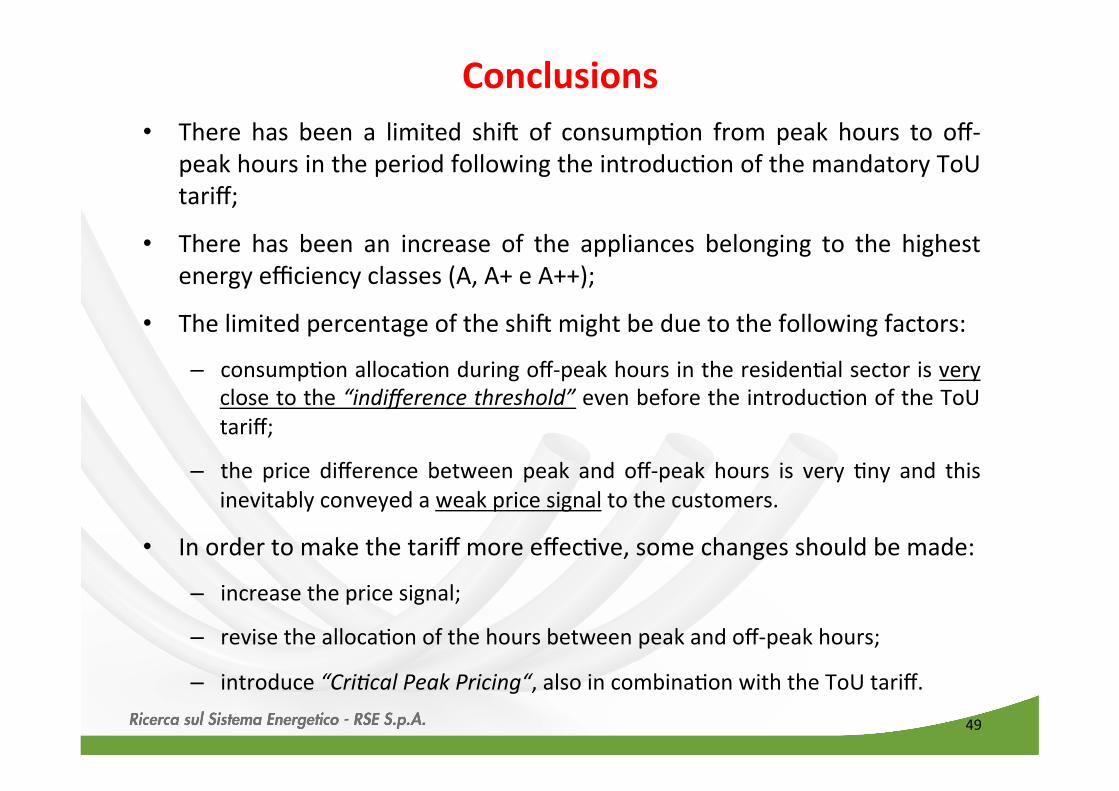
Conclusions • There has been a limited shil of consumpDon from peak hours to off-‐
peak hours in the period following the introducDon of the mandatory ToU tariff;
• There has been an increase of the appliances belonging to the highest energy efficiency classes (A, A+ e A++);
• The limited percentage of the shil might be due to the following factors:
– consumpDon allocaDon during off-‐peak hours in the residenDal sector is very close to the “indifference threshold” even before the introducDon of the ToU tariff;
– the price difference between peak and off-‐peak hours is very Dny and this inevitably conveyed a weak price signal to the customers.
• In order to make the tariff more effecDve, some changes should be made:
– increase the price signal;
– revise the allocaDon of the hours between peak and off-‐peak hours;
– introduce “CriIcal Peak Pricing“, also in combinaDon with the ToU tariff.
49