Embed Size (px)
Citation preview

Impact of MFA Phase-Out onthe World Economy
-- An Intertemporal, Global General Equilibrium Analysis
Xinshen DiaoTrade and Macroeconomic Division
International Food Policy Research Institute
Agapi SomwaruEconomic Research Service
U.S. Department of Agriculture
June 2001

Outline
• Introduction
• Trends in World T&A Trade
• Growth and T&A Trade
• Perspectives of a Post MFA World
Introduction
• MFA quantitatively restrains world T&A trade.
• ATC under the UR will end MFA over a 10-year period until 2005.
• The study evaluates the effects of MFA phase-out on the world economy, with developing countries focus.

Trends in World T&A Trade
• T&A trade grew 50 times, 6 billion $US in 1962 vs. 300 billion $US in 1999.
• Apparel trade grew
100 times; textile
trade 30 times; 2/3
of world T&A trade
is apparel.
Figure 1.World Textile and Apparel Exports
(In Billions US Dollars)
0
50
100
150
200
250
300
350
62 66 70 74 78 82 86 90 94 98
ApparelTextileAll
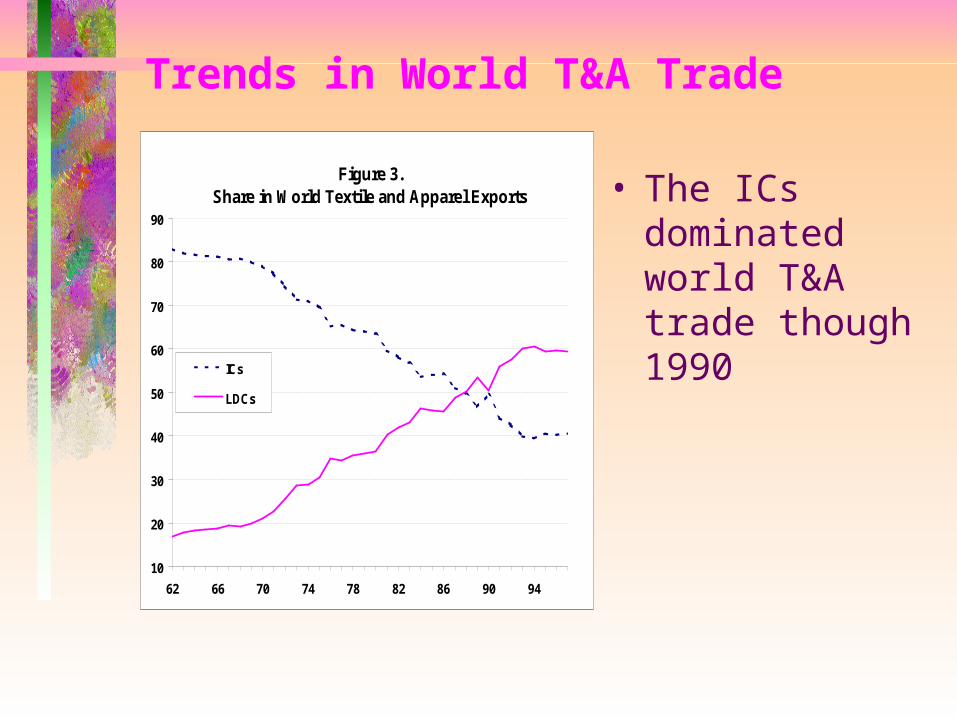
Trends in World T&A Trade
• The ICs dominated world T&A trade though 1990
Figure 3.Share in World Textile and Apparel Exports
10
20
30
40
50
60
70
80
90
62 66 70 74 78 82 86 90 94
ICs
LDCs
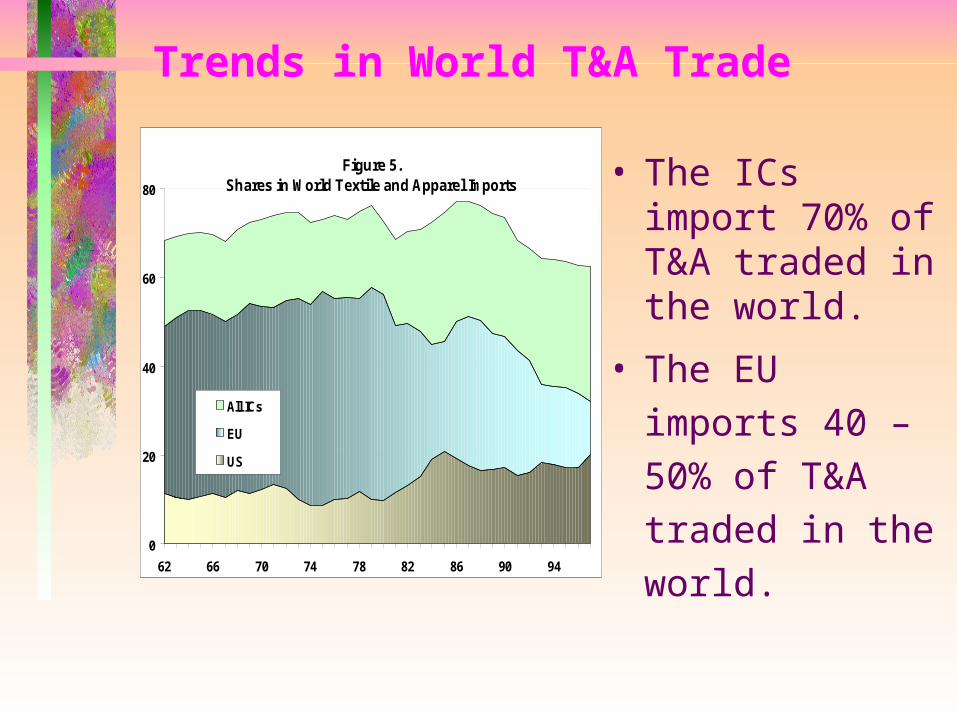
Trends in World T&A Trade
• The ICs import 70% of T&A traded in the world.
• The EU imports 40 – 50% of T&A traded in the world.
Figure 5.Shares in World Textile and Apparel Imports
0
20
40
60
80
62 66 70 74 78 82 86 90 94
All ICs
EU
US
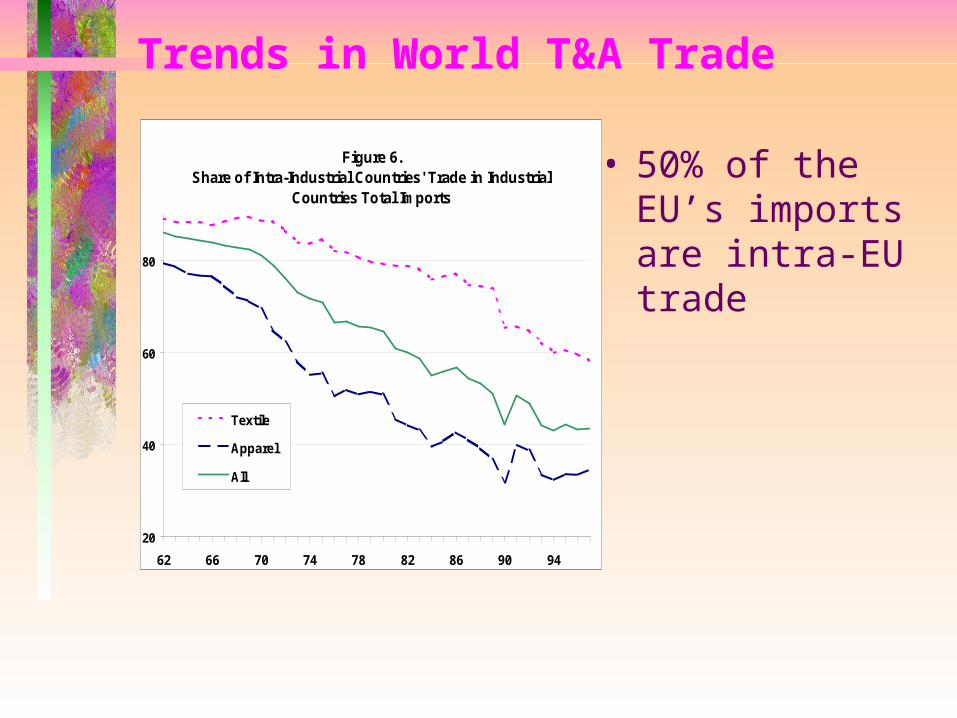
Trends in World T&A Trade
• 50% of the EU’s imports are intra-EU trade
Figure 6.Share of Intra-Industrial Countries' Trade in Industrial
Countries Total Imports
20
40
60
80
62 66 70 74 78 82 86 90 94
Textile
Apparel
All

Growth and T&A Trade
• Data for 91 countries over 37 years• Time-series and cross-section
estimation between trade share and GDP per capita
• Total trade• Total nonagricultural trade• Agricultural trade• Textile and apparel trade

tiittiit TY ln
Table 1. Trade and income
Parameter estimate (standard error in
parentheses)
Variable/Statistic
Totaltrade
Agr. tradeNonagrtrade
Textiletrade
Appareltrade
Textile &Apparel
trade (1) (2) (3) (4) (5) (6)
Intercept 8.957 6.879 9.512 8.325 8.442 8.443
(0.0135) (6.37E-7) (2.14E-7) (1.42E-8) (2.79E-8) (5.664E-8)
Trade share 0.431 -3.531 1.158 2.658 3.570 2.864
(0.009) (1.29E-7) (4.53E-8) (1.703E-7) (8.37E-8) (1.704E-7)
Ln population -0.094 0.013 -0.121 -0.058 -0.066 -0.0658
(0.0007) (3.21E-8) (1.05E-8) (7.71E-10) (1.34E-9) (3.033E-9)
R-squared 0.999 0.990 0.990 0.999 0.999 0.999
Results are all statistically significant at the 1-percent level

What we did in the study?Grouping countries according to the degree of MFA
restrictions
Countries restrained by MFA1. China; 2. India; 3. Region of the other South and Southeast
Asia
4. Region of the Middle-east countries;
5. Region of Former Soviet Union countries;
6. Region of L.A. countries excluding Mexico and Caribbean;
Countries free from MFA quota7. Region of N. African and E. European countries
8. Region of the other African countries
9. Mexico and Caribbean countries
Restraining IC countries10. N. America; 11. The European Union
Other IC countries12. Australia and New Zealand; 13. Japan, Korea, and Taiwan

What we did in the study?
• Increase the efficiency coefficients in the export function
• 30 – 40% tariff reduction in T&A trade
• Incorporate the econometric results • Data: GTAP database 5, pre-release 3
• Sectors1. Cotton2. Other crops3. Livestock4. Processed food5. Textile6. Apparel7. Other manufacturing and services

Summary of Simulation Results
• More T&A trade in the world– LDCs T&A exports increase more– ICs textile exports increase
• LDCs gain market shares– Asian countries gain more; countries free from MFA lose
Results may underestimate changes in world market structure– Intra-regional trade ignored– Effect on growth patterns ignored
• Welfare effect differential among countries– China gains the most– Welfare loss among the countries free from MFA– ICs gain
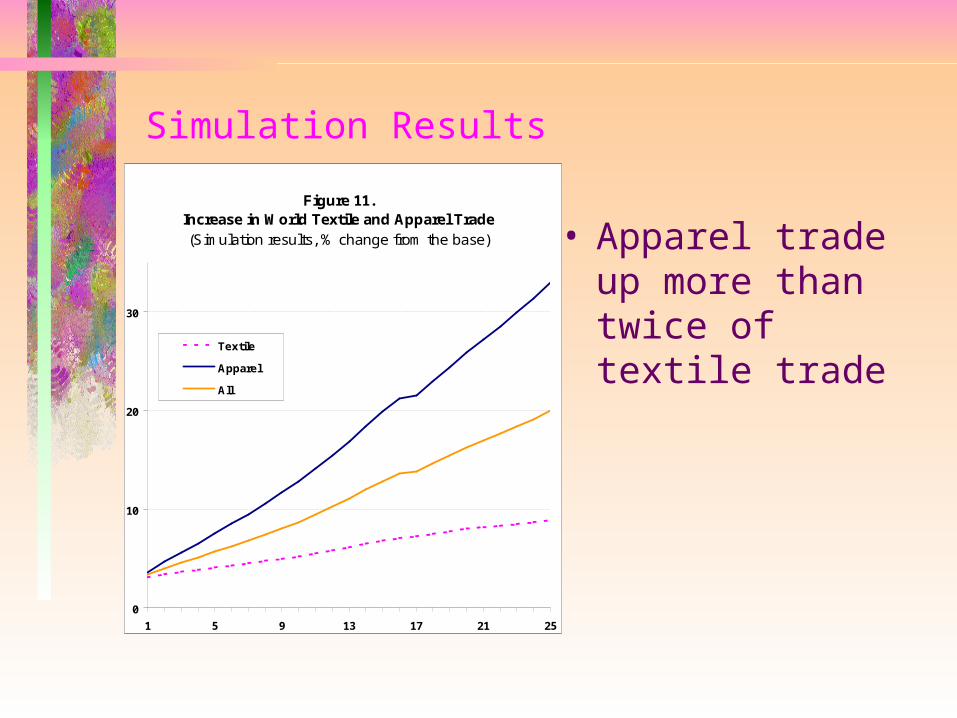
Simulation Results
• Apparel trade up more than twice of textile trade
Figure 11.Increase in World Textile and Apparel Trade(Simulation results, % change from the base)
0
10
20
30
1 5 9 13 17 21 25
Textile
Apparel
All

Simulation Results
• LDCs exports increase more
• ICs textile
exports
increase
Figure 12.Increase in Textile and Apparel Exports
(Simulation results, % change from the base)
0
10
20
30
40
50
1 5 9 13 17 21 25
All- IC
All- LDC
Textile- IC
Apparel- LDC

Table 3. T&A Trade Market Shares for Selected Countries/Regions
------------ Simulation results ------------
Base Year-5 Year-10 Year-15 Year-20
Developing countries 59.57 60.37 61.71 63.41 64.68
(1) China 19.69 20.24 20.85 21.60 22.15
(2) India 4.40 4.45 4.64 4.88 5.07
(3) Other Asia 13.00 13.72 14.51 15.50 16.26
(4) Middle East 5.03 5.31 5.62 6.01 6.30
(7) E. Europe 6.50 6.07 5.76 5.41 5.14
(9) Mexico and Caribbean 6.09 5.69 5.43 5.11 4.87
Industrial countries 40.43 39.63 38.29 36.59 35.32
(10) N. America 6.61 6.33 6.12 5.85 5.64
(11) EU 14.39 13.92 13.46 12.87 12.42

Table 4. Welfare effect in the simulation
Year-5 Year-10 Year-15 Year-20
Billion
$ %Billion
$ %Billion
$ %Billion
$ %
Developing countries
China 9.00 1.74 9.91 1.91 10.59 2.04 11.65 2.25
India 2.97 0.97 3.34 1.10 3.90 1.28 4.90 1.61
Other Asia 5.06 0.90 5.30 0.94 5.76 1.02 6.55 1.16
Middle East 2.66 0.48 2.97 0.53 3.46 0.62 4.32 0.77 Former Soviet Union -2.99 -0.65 -3.16 -0.68 -3.13 -0.68 -2.96 -0.64
Other L.A. -2.28 -0.19 -1.66 -0.14 -1.06 -0.09 -0.03 -0.00
E. Europe -2.18 -0.52 -2.22 -0.53 -2.20 -0.52 -2.18 -0.52
O. Africa -2.37 -0.45 -2.45 -0.46 -2.45 -0.46 -2.54 -0.48 Mexico & Caribbean -1.56 -0.40 -1.53 -0.39 -1.48 -0.38 -1.42 -0.36
Industrial countries
N. America 0.07 0.00 3.42 0.05 7.42 0.10 11.91 0.16
EU 0.06 0.00 3.78 0.05 8.36 0.12 13.23 0.19 Australia, New Zealand 0.09 0.03 0.16 0.05 0.26 0.07 0.40 0.11 Japan, Korea, Taiwan 2.79 0.08 3.47 0.10 4.52 0.13 5.98 0.17

Table 5. Share of textile and apparel in GDP T&A value-added (1) Exports (2)Developing countries China 5.26 5.38 India 3.25 2.64 Other Asia 3.02 3.89 Middle East 1.36 1.68 Former Soviet Union 1.32 0.43 O. Latin America 3.29 0.16 E. Europe 2.86 3.10 O. Africa 2.14 1.08 Mexico and Caribbean 3.29 3.00Industrial countries N. America 1.22 0.18 EU 1.06 0.40 Australia and New Zealand 0.87 0.47 Japan, Korea and Taiwan 1.20 0.86(1) GDP at factor cost(2) GDP at expenditureData source: GTAP database version 5.

Conclusions
• 70% of T&A traded go to ICs; an open and free trade market in ICs is important for LDCs to keep their growth momentum
• 50% of IC markets, especially EU market, not available to
LDCs
• Regression results show a strong linkage between T&A trade
and income growth
• More T&A traded post MFA; LDCs export more
• Asian countries gain market share; countries free from MFA
lose
• Welfare gains in the countries restrained by MFA and ICs
• A compensation policy for the countries free from MFA needed