Embed Size (px)
Citation preview
Applied Nursing Research 26 (2013) 71–75
Contents lists available at SciVerse ScienceDirect
Applied Nursing Research
.e lsev ie r .com/ locate /apnr
Clinical Methods
j ourna l homepage: www
Impact of missing data on analysis of postoperative cognitive decline (POCD)
Susan K. DeCrane PhD, RN a,⁎, Laura P. Sands PhD b, Kristen Marie Young BS c, Glen DePalma MS d,Jacqueline M. Leung MD, MPH e
a School of Nursing, Purdue University, West Lafayette IN 47907b Johnson Hall of Nursing, Purdue University, West Lafayette, IN 47907–2069c Clark Atlanta University, Atlanta, GAd Department of Statistics, Purdue Universitye Department of Anesthesia and Perioperative Care, University of California, San Francisco, San Francisco, CA 94143–0648
⁎ Corresponding author. Tel.: +1 765 494 4028.E-mail addresses: [email protected] (S.K. DeCra
[email protected] (L.P. Sands), [email protected]@gmail.com (G. DePalma).
URL: http://leung.ucsf.edu/ (J.M. Leung).
0897-1897/$ – see front matter © 2013 Elsevier Inc. Alhttp://dx.doi.org/10.1016/j.apnr.2012.11.001
a b s t r a c t
a r t i c l e i n f oArticle history:
Received 21 July 2012Revised 5 November 2012Accepted 7 November 2012Keywords:CognitionMissing dataMethods
Background: There are a variety of techniques to handle missing data, such as removing observations withmissing data from the analyses or estimating the missing values using various imputation algorithms.Dropping subjects from standard regressionmodels and analyzing only completers, however, may bias resultsfrom the true value of reality. Likewise, ‘last-observation-carried-forward’ may not be an appropriatetechnique for studies measuring a particular variable over time.Methods: This dataset was part of a larger prospective cohort study that examined postoperative cognitivedecline (POCD) after surgery in older adults. Data collectors had provided the reasons for data being missingusing adjectives including ‘confused’, ‘incapable’, ‘stuporous’, ‘comatose’, and ‘intubated’. Data having these
qualitative notations were re-coded as ‘incapable’ and trial scores of zero were recorded. This value of ‘0’indicated that the patient was cognitively incapable of performing the neuropsychological test.Results: Missing data varied by cognitive test and postoperative day. Re-coding word list scores from missingto zero when a patient was too cognitively impaired to complete the tests improved sample size by 13.5% ofpostoperative day (POD) 1 and 12.8% on POD 2. Recoding missing data to zero for the digit symbol testresulted in 29.3% larger sample size on POD 1 and 22.7% on POD 2. Verbal fluency gained 15.7% sample sizewith re-coding for POD 1 and 13.7% for POD 2. Re-coding of each cognitive test reduced missing data samplesize to 20–32% in all cognitive tests for each day.Discussion: Our data suggest that using a scoring system that enters a value of ‘0’ when patients are unable toperform cognitive testing did significantly increase the number of patients that met the diagnosis ofpostoperative cognitive decline using the criteria that were determined a priori and may lessen chances oftype II error (failure to detect a difference).© 2013 Elsevier Inc. All rights reserved.
Missing data are a problem in human research, particularly inhealth related studies in which many factors can potentially alterresponse rates. Statistical methods for handling missing data typicallyassume that causes of missing data are ‘independent’ of thedependent variable, termed ‘missing at random’ (DeSouza, Legadza,& Sankoh, 2009). There are a variety of techniques to handle missingdata, such as removing the observations with missing data from theanalyses or estimating the missing values using various imputationalgorithms. Missing data, for example, are often dropped fromstandard regression models, analyzing only ‘completers’ which maybias results from the true value of reality (Wittes, 2009). Likewise,
ne),om (K.M. Young),
l rights reserved.
‘last-observation-carried-forward’ may not be an appropriate tech-nique for studies measuring a particular variable over time.
Most statistical methods for handling missing data assume thatdata are ‘missing at random’, an assumption that is often incorrect inhealth-related research. One of the more popular techniques ismultiple imputation, which generates multiple possible alternativesfor each missing value, analyzes each dataset, and then combines theresults in a way that reflects the variability between models(Abayomi, Gelman, & Levy, 2005). These analytic techniques arebased upon the assumption that data are ‘missing at random’, whichmay increase the risk for bias and lower the reliable interpretation oftrial results (Fleming, 2011). Since missing data in longitudinalhealth-related research are a common occurrence, a call for viablestrategies that improve accuracy of conclusions is needed. Thesestrategies need to include methods that can more adequatelydistinguish between ‘missing’ or ‘dropout’ data versus a true changein the variable of interest (Kenward & Molenberghs, 2009).
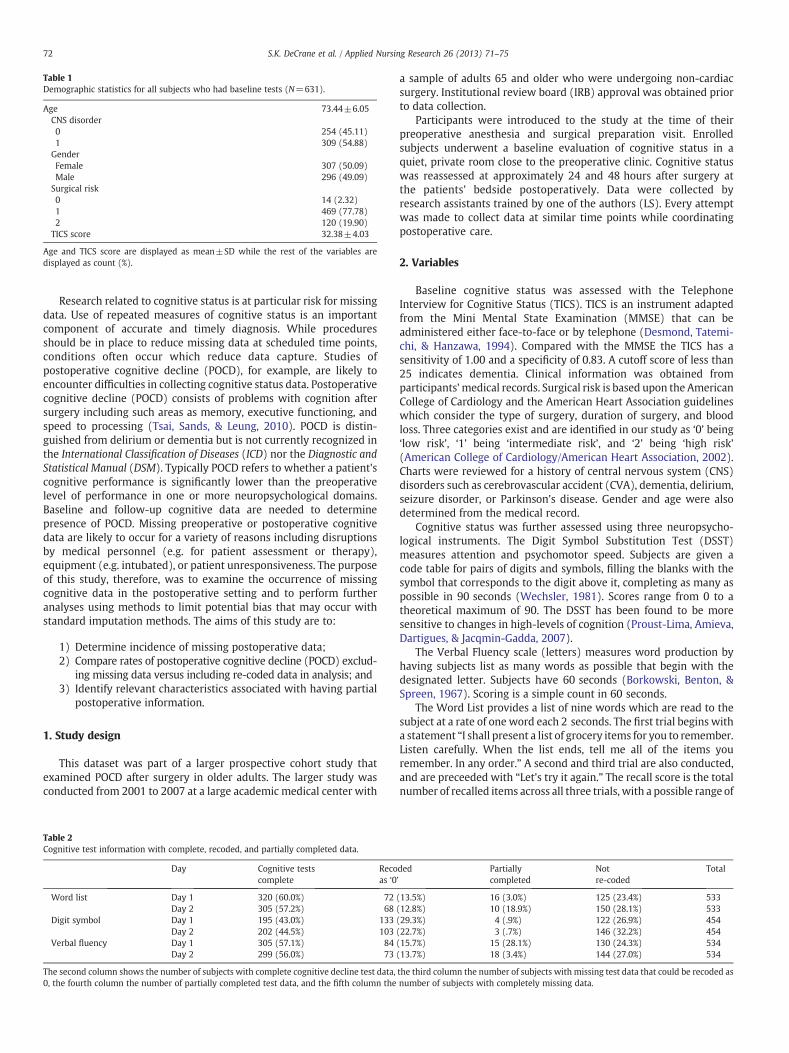
Table 1Demographic statistics for all subjects who had baseline tests (N=631).
Age 73.44±6.05CNS disorder0 254 (45.11)1 309 (54.88)GenderFemale 307 (50.09)Male 296 (49.09)Surgical risk0 14 (2.32)1 469 (77.78)2 120 (19.90)TICS score 32.38±4.03
Age and TICS score are displayed as mean±SD while the rest of the variables aredisplayed as count (%).
72 S.K. DeCrane et al. / Applied Nursing Research 26 (2013) 71–75
Research related to cognitive status is at particular risk for missingdata. Use of repeated measures of cognitive status is an importantcomponent of accurate and timely diagnosis. While proceduresshould be in place to reduce missing data at scheduled time points,conditions often occur which reduce data capture. Studies ofpostoperative cognitive decline (POCD), for example, are likely toencounter difficulties in collecting cognitive status data. Postoperativecognitive decline (POCD) consists of problems with cognition aftersurgery including such areas as memory, executive functioning, andspeed to processing (Tsai, Sands, & Leung, 2010). POCD is distin-guished from delirium or dementia but is not currently recognized inthe International Classification of Diseases (ICD) nor the Diagnostic andStatistical Manual (DSM). Typically POCD refers to whether a patient'scognitive performance is significantly lower than the preoperativelevel of performance in one or more neuropsychological domains.Baseline and follow-up cognitive data are needed to determinepresence of POCD. Missing preoperative or postoperative cognitivedata are likely to occur for a variety of reasons including disruptionsby medical personnel (e.g. for patient assessment or therapy),equipment (e.g. intubated), or patient unresponsiveness. The purposeof this study, therefore, was to examine the occurrence of missingcognitive data in the postoperative setting and to perform furtheranalyses using methods to limit potential bias that may occur withstandard imputation methods. The aims of this study are to:
1) Determine incidence of missing postoperative data;2) Compare rates of postoperative cognitive decline (POCD) exclud-
ing missing data versus including re-coded data in analysis; and3) Identify relevant characteristics associated with having partial
postoperative information.
1. Study design
This dataset was part of a larger prospective cohort study thatexamined POCD after surgery in older adults. The larger study wasconducted from 2001 to 2007 at a large academic medical center with
Table 2Cognitive test information with complete, recoded, and partially completed data.
Day Cognitive testscomplete
Recoas ‘0
Word list Day 1 320 (60.0%) 72Day 2 305 (57.2%) 68
Digit symbol Day 1 195 (43.0%) 133Day 2 202 (44.5%) 103
Verbal fluency Day 1 305 (57.1%) 84Day 2 299 (56.0%) 73
The second column shows the number of subjects with complete cognitive decline test data,0, the fourth column the number of partially completed test data, and the fifth column the
a sample of adults 65 and older who were undergoing non-cardiacsurgery. Institutional review board (IRB) approval was obtained priorto data collection.
Participants were introduced to the study at the time of theirpreoperative anesthesia and surgical preparation visit. Enrolledsubjects underwent a baseline evaluation of cognitive status in aquiet, private room close to the preoperative clinic. Cognitive statuswas reassessed at approximately 24 and 48 hours after surgery atthe patients' bedside postoperatively. Data were collected byresearch assistants trained by one of the authors (LS). Every attemptwas made to collect data at similar time points while coordinatingpostoperative care.
2. Variables
Baseline cognitive status was assessed with the TelephoneInterview for Cognitive Status (TICS). TICS is an instrument adaptedfrom the Mini Mental State Examination (MMSE) that can beadministered either face-to-face or by telephone (Desmond, Tatemi-chi, & Hanzawa, 1994). Compared with the MMSE the TICS has asensitivity of 1.00 and a specificity of 0.83. A cutoff score of less than25 indicates dementia. Clinical information was obtained fromparticipants' medical records. Surgical risk is based upon the AmericanCollege of Cardiology and the American Heart Association guidelineswhich consider the type of surgery, duration of surgery, and bloodloss. Three categories exist and are identified in our study as ‘0’ being‘low risk’, ‘1’ being ‘intermediate risk’, and ‘2’ being ‘high risk’(American College of Cardiology/American Heart Association, 2002).Charts were reviewed for a history of central nervous system (CNS)disorders such as cerebrovascular accident (CVA), dementia, delirium,seizure disorder, or Parkinson's disease. Gender and age were alsodetermined from the medical record.
Cognitive status was further assessed using three neuropsycho-logical instruments. The Digit Symbol Substitution Test (DSST)measures attention and psychomotor speed. Subjects are given acode table for pairs of digits and symbols, filling the blanks with thesymbol that corresponds to the digit above it, completing as many aspossible in 90 seconds (Wechsler, 1981). Scores range from 0 to atheoretical maximum of 90. The DSST has been found to be moresensitive to changes in high-levels of cognition (Proust-Lima, Amieva,Dartigues, & Jacqmin-Gadda, 2007).
The Verbal Fluency scale (letters) measures word production byhaving subjects list as many words as possible that begin with thedesignated letter. Subjects have 60 seconds (Borkowski, Benton, &Spreen, 1967). Scoring is a simple count in 60 seconds.
The Word List provides a list of nine words which are read to thesubject at a rate of one word each 2 seconds. The first trial begins witha statement “I shall present a list of grocery items for you to remember.Listen carefully. When the list ends, tell me all of the items youremember. In any order.” A second and third trial are also conducted,and are preceeded with “Let's try it again.” The recall score is the totalnumber of recalled items across all three trials, with a possible range of
ded’
Partiallycompleted
Notre-coded
Total
(13.5%) 16 (3.0%) 125 (23.4%) 533(12.8%) 10 (18.9%) 150 (28.1%) 533(29.3%) 4 (.9%) 122 (26.9%) 454(22.7%) 3 (.7%) 146 (32.2%) 454(15.7%) 15 (28.1%) 130 (24.3%) 534(13.7%) 18 (3.4%) 144 (27.0%) 534
the third column the number of subjects with missing test data that could be recoded asnumber of subjects with completely missing data.
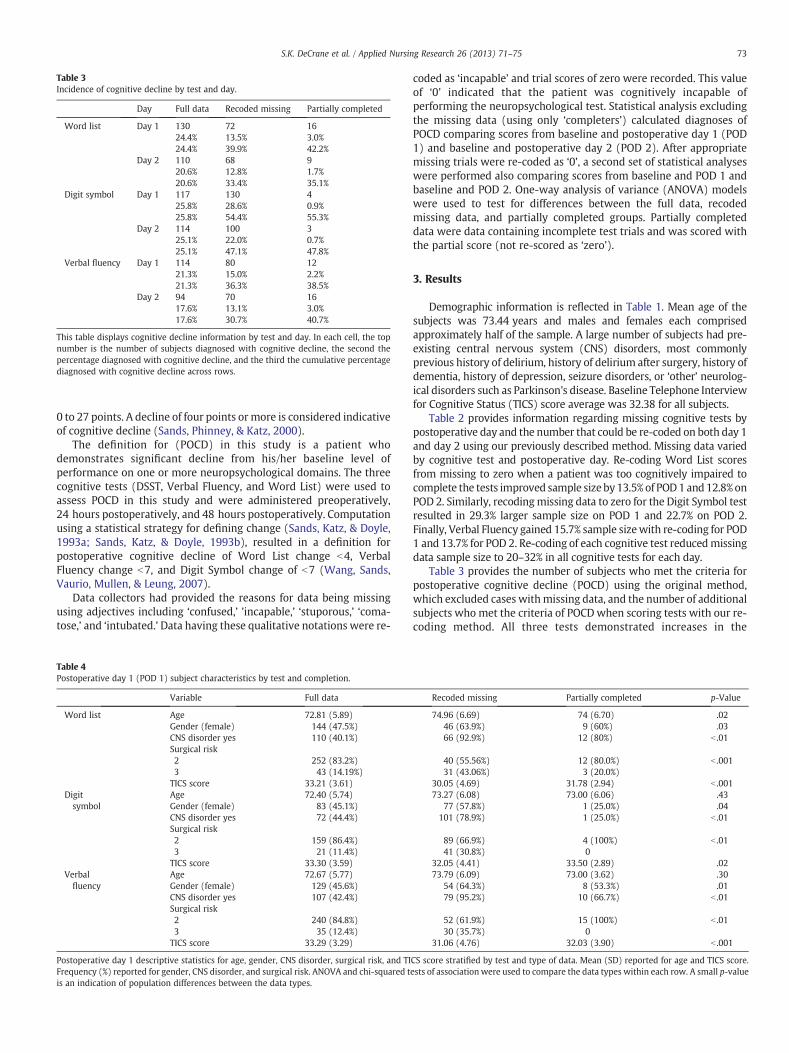
Table 3Incidence of cognitive decline by test and day.
Day Full data Recoded missing Partially completed
Word list Day 1 13024.4%24.4%
7213.5%39.9%
163.0%42.2%
Day 2 11020.6%20.6%
6812.8%33.4%
91.7%35.1%
Digit symbol Day 1 11725.8%25.8%
13028.6%54.4%
40.9%55.3%
Day 2 11425.1%25.1%
10022.0%47.1%
30.7%47.8%
Verbal fluency Day 1 11421.3%21.3%
8015.0%36.3%
122.2%38.5%
Day 2 9417.6%17.6%
7013.1%30.7%
163.0%40.7%
This table displays cognitive decline information by test and day. In each cell, the topnumber is the number of subjects diagnosed with cognitive decline, the second thepercentage diagnosed with cognitive decline, and the third the cumulative percentagediagnosed with cognitive decline across rows.
73S.K. DeCrane et al. / Applied Nursing Research 26 (2013) 71–75
0 to 27 points. A decline of four points or more is considered indicativeof cognitive decline (Sands, Phinney, & Katz, 2000).
The definition for (POCD) in this study is a patient whodemonstrates significant decline from his/her baseline level ofperformance on one or more neuropsychological domains. The threecognitive tests (DSST, Verbal Fluency, and Word List) were used toassess POCD in this study and were administered preoperatively,24 hours postoperatively, and 48 hours postoperatively. Computationusing a statistical strategy for defining change (Sands, Katz, & Doyle,1993a; Sands, Katz, & Doyle, 1993b), resulted in a definition forpostoperative cognitive decline of Word List change b4, VerbalFluency change b7, and Digit Symbol change of b7 (Wang, Sands,Vaurio, Mullen, & Leung, 2007).
Data collectors had provided the reasons for data being missingusing adjectives including ‘confused,’ ’incapable,’ ‘stuporous,’ ‘coma-tose,’ and ‘intubated.’ Data having these qualitative notations were re-
Table 4Postoperative day 1 (POD 1) subject characteristics by test and completion.
Variable Full data
Word list Age 72.81 (5.89)Gender (female) 144 (47.5%)CNS disorder yes 110 (40.1%)Surgical risk2 252 (83.2%)3 43 (14.19%)TICS score 33.21 (3.61)
Digitsymbol
Age 72.40 (5.74)Gender (female) 83 (45.1%)CNS disorder yes 72 (44.4%)Surgical risk2 159 (86.4%)3 21 (11.4%)TICS score 33.30 (3.59)
Verbalfluency
Age 72.67 (5.77)Gender (female) 129 (45.6%)CNS disorder yes 107 (42.4%)Surgical risk2 240 (84.8%)3 35 (12.4%)TICS score 33.29 (3.29)
Postoperative day 1 descriptive statistics for age, gender, CNS disorder, surgical risk, and TIFrequency (%) reported for gender, CNS disorder, and surgical risk. ANOVA and chi-squared tis an indication of population differences between the data types.
coded as ‘incapable’ and trial scores of zero were recorded. This valueof ‘0’ indicated that the patient was cognitively incapable ofperforming the neuropsychological test. Statistical analysis excludingthe missing data (using only ‘completers’) calculated diagnoses ofPOCD comparing scores from baseline and postoperative day 1 (POD1) and baseline and postoperative day 2 (POD 2). After appropriatemissing trials were re-coded as ‘0’, a second set of statistical analyseswere performed also comparing scores from baseline and POD 1 andbaseline and POD 2. One-way analysis of variance (ANOVA) modelswere used to test for differences between the full data, recodedmissing data, and partially completed groups. Partially completeddata were data containing incomplete test trials and was scored withthe partial score (not re-scored as ‘zero’).
3. Results
Demographic information is reflected in Table 1. Mean age of thesubjects was 73.44 years and males and females each comprisedapproximately half of the sample. A large number of subjects had pre-existing central nervous system (CNS) disorders, most commonlyprevious history of delirium, history of delirium after surgery, history ofdementia, history of depression, seizure disorders, or ‘other’ neurolog-ical disorders such as Parkinson's disease. Baseline Telephone Interviewfor Cognitive Status (TICS) score average was 32.38 for all subjects.
Table 2 provides information regarding missing cognitive tests bypostoperative day and the number that could be re-coded on both day 1and day 2 using our previously described method. Missing data variedby cognitive test and postoperative day. Re-coding Word List scoresfrom missing to zero when a patient was too cognitively impaired tocomplete the tests improved sample size by13.5% of POD1and12.8%onPOD 2. Similarly, recodingmissing data to zero for the Digit Symbol testresulted in 29.3% larger sample size on POD 1 and 22.7% on POD 2.Finally, Verbal Fluency gained 15.7% sample sizewith re-coding for POD1 and 13.7% for POD 2. Re-coding of each cognitive test reducedmissingdata sample size to 20–32% in all cognitive tests for each day.
Table 3 provides the number of subjects who met the criteria forpostoperative cognitive decline (POCD) using the original method,which excluded cases withmissing data, and the number of additionalsubjects who met the criteria of POCDwhen scoring tests with our re-coding method. All three tests demonstrated increases in the
Recoded missing Partially completed p-Value
74.96 (6.69) 74 (6.70) .0246 (63.9%) 9 (60%) .0366 (92.9%) 12 (80%) b .01
40 (55.56%) 12 (80.0%) b .00131 (43.06%) 3 (20.0%)
30.05 (4.69) 31.78 (2.94) b .00173.27 (6.08) 73.00 (6.06) .43
77 (57.8%) 1 (25.0%) .04101 (78.9%) 1 (25.0%) b .01
89 (66.9%) 4 (100%) b .0141 (30.8%) 0
32.05 (4.41) 33.50 (2.89) .0273.79 (6.09) 73.00 (3.62) .30
54 (64.3%) 8 (53.3%) .0179 (95.2%) 10 (66.7%) b .01
52 (61.9%) 15 (100%) b .0130 (35.7%) 0
31.06 (4.76) 32.03 (3.90) b .001
CS score stratified by test and type of data. Mean (SD) reported for age and TICS score.ests of association were used to compare the data types within each row. A small p-value
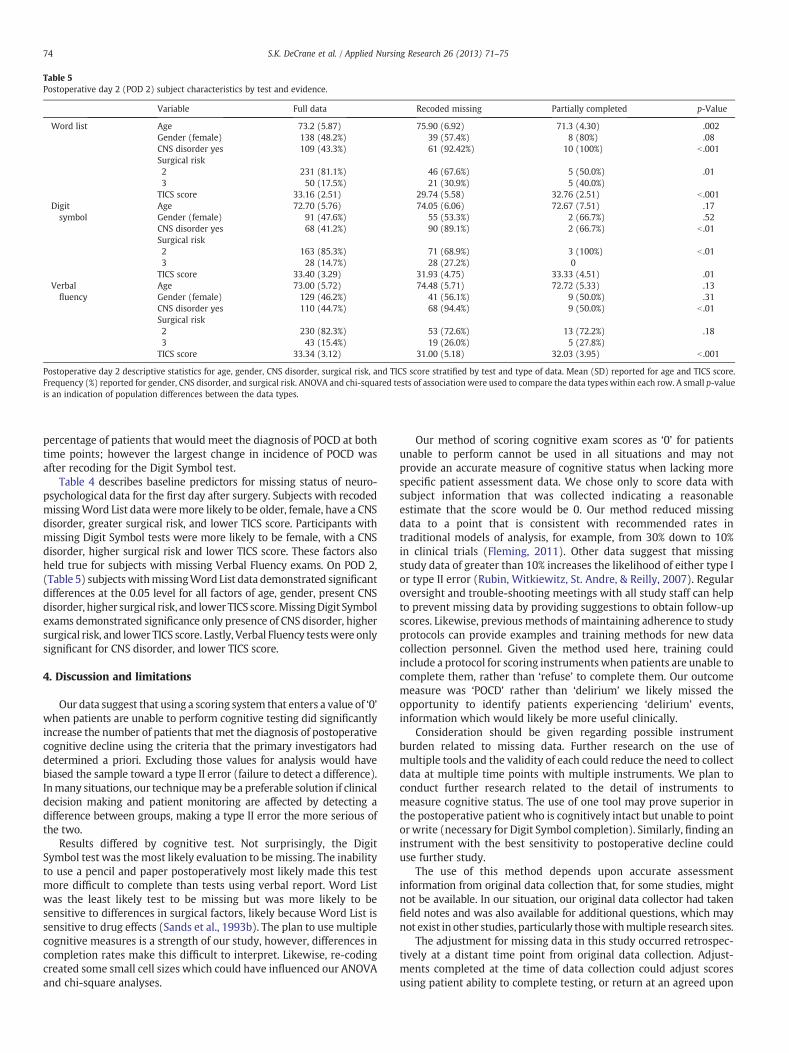
Table 5Postoperative day 2 (POD 2) subject characteristics by test and evidence.
Variable Full data Recoded missing Partially completed p-Value
Word list Age 73.2 (5.87) 75.90 (6.92) 71.3 (4.30) .002Gender (female) 138 (48.2%) 39 (57.4%) 8 (80%) .08CNS disorder yes 109 (43.3%) 61 (92.42%) 10 (100%) b .001Surgical risk2 231 (81.1%) 46 (67.6%) 5 (50.0%) .013 50 (17.5%) 21 (30.9%) 5 (40.0%)TICS score 33.16 (2.51) 29.74 (5.58) 32.76 (2.51) b .001
Digitsymbol
Age 72.70 (5.76) 74.05 (6.06) 72.67 (7.51) .17Gender (female) 91 (47.6%) 55 (53.3%) 2 (66.7%) .52CNS disorder yes 68 (41.2%) 90 (89.1%) 2 (66.7%) b .01Surgical risk2 163 (85.3%) 71 (68.9%) 3 (100%) b .013 28 (14.7%) 28 (27.2%) 0TICS score 33.40 (3.29) 31.93 (4.75) 33.33 (4.51) .01
Verbalfluency
Age 73.00 (5.72) 74.48 (5.71) 72.72 (5.33) .13Gender (female) 129 (46.2%) 41 (56.1%) 9 (50.0%) .31CNS disorder yes 110 (44.7%) 68 (94.4%) 9 (50.0%) b .01Surgical risk2 230 (82.3%) 53 (72.6%) 13 (72.2%) .183 43 (15.4%) 19 (26.0%) 5 (27.8%)TICS score 33.34 (3.12) 31.00 (5.18) 32.03 (3.95) b .001
Postoperative day 2 descriptive statistics for age, gender, CNS disorder, surgical risk, and TICS score stratified by test and type of data. Mean (SD) reported for age and TICS score.Frequency (%) reported for gender, CNS disorder, and surgical risk. ANOVA and chi-squared tests of association were used to compare the data types within each row. A small p-valueis an indication of population differences between the data types.
74 S.K. DeCrane et al. / Applied Nursing Research 26 (2013) 71–75
percentage of patients that would meet the diagnosis of POCD at bothtime points; however the largest change in incidence of POCD wasafter recoding for the Digit Symbol test.
Table 4 describes baseline predictors for missing status of neuro-psychological data for the first day after surgery. Subjects with recodedmissingWord List data weremore likely to be older, female, have a CNSdisorder, greater surgical risk, and lower TICS score. Participants withmissing Digit Symbol tests were more likely to be female, with a CNSdisorder, higher surgical risk and lower TICS score. These factors alsoheld true for subjects with missing Verbal Fluency exams. On POD 2,(Table 5) subjectswithmissingWord List data demonstrated significantdifferences at the 0.05 level for all factors of age, gender, present CNSdisorder, higher surgical risk, and lower TICS score.MissingDigit Symbolexams demonstrated significance only presence of CNS disorder, highersurgical risk, and lower TICS score. Lastly, Verbal Fluency testswere onlysignificant for CNS disorder, and lower TICS score.
4. Discussion and limitations
Our data suggest that using a scoring system that enters a value of ‘0’when patients are unable to perform cognitive testing did significantlyincrease the number of patients thatmet the diagnosis of postoperativecognitive decline using the criteria that the primary investigators haddetermined a priori. Excluding those values for analysis would havebiased the sample toward a type II error (failure to detect a difference).Inmany situations, our techniquemay be a preferable solution if clinicaldecision making and patient monitoring are affected by detecting adifference between groups, making a type II error the more serious ofthe two.
Results differed by cognitive test. Not surprisingly, the DigitSymbol test was the most likely evaluation to be missing. The inabilityto use a pencil and paper postoperatively most likely made this testmore difficult to complete than tests using verbal report. Word Listwas the least likely test to be missing but was more likely to besensitive to differences in surgical factors, likely because Word List issensitive to drug effects (Sands et al., 1993b). The plan to use multiplecognitive measures is a strength of our study, however, differences incompletion rates make this difficult to interpret. Likewise, re-codingcreated some small cell sizes which could have influenced our ANOVAand chi-square analyses.
Our method of scoring cognitive exam scores as ‘0’ for patientsunable to perform cannot be used in all situations and may notprovide an accurate measure of cognitive status when lacking morespecific patient assessment data. We chose only to score data withsubject information that was collected indicating a reasonableestimate that the score would be 0. Our method reduced missingdata to a point that is consistent with recommended rates intraditional models of analysis, for example, from 30% down to 10%in clinical trials (Fleming, 2011). Other data suggest that missingstudy data of greater than 10% increases the likelihood of either type Ior type II error (Rubin, Witkiewitz, St. Andre, & Reilly, 2007). Regularoversight and trouble-shooting meetings with all study staff can helpto prevent missing data by providing suggestions to obtain follow-upscores. Likewise, previous methods of maintaining adherence to studyprotocols can provide examples and training methods for new datacollection personnel. Given the method used here, training couldinclude a protocol for scoring instrumentswhen patients are unable tocomplete them, rather than ‘refuse’ to complete them. Our outcomemeasure was ‘POCD’ rather than ‘delirium’ we likely missed theopportunity to identify patients experiencing ‘delirium’ events,information which would likely be more useful clinically.
Consideration should be given regarding possible instrumentburden related to missing data. Further research on the use ofmultiple tools and the validity of each could reduce the need to collectdata at multiple time points with multiple instruments. We plan toconduct further research related to the detail of instruments tomeasure cognitive status. The use of one tool may prove superior inthe postoperative patient who is cognitively intact but unable to pointor write (necessary for Digit Symbol completion). Similarly, finding aninstrument with the best sensitivity to postoperative decline coulduse further study.
The use of this method depends upon accurate assessmentinformation from original data collection that, for some studies, mightnot be available. In our situation, our original data collector had takenfield notes and was also available for additional questions, which maynot exist in other studies, particularly thosewithmultiple research sites.
The adjustment for missing data in this study occurred retrospec-tively at a distant time point from original data collection. Adjust-ments completed at the time of data collection could adjust scoresusing patient ability to complete testing, or return at an agreed upon
75S.K. DeCrane et al. / Applied Nursing Research 26 (2013) 71–75
time with nursing staff that would allow for necessary postoperativecare to occur along with adequate data collection.
5. Conclusion
Significant missing data can reduce the ability to draw conclusionsand affect the interpretation of results. Previous methods to reducemissing data using imputation or ‘last-measure-carried-forward’mechanisms are imprecise which may result in biased estimates ofreality. In addition, previous models of data imputation depend onassumptions that cannot be verified. Clinical relevance of missing datacan impact the likelihood of conclusions that are inaccurate orcompromise clinical decision-making. Our method provides a prefer-able and meaningful mechanism for increasing the degree of usabledata in longitudinal cognitive trials.
Acknowledgment
We gratefully acknowledge the Perioperative Medicine ResearchGroup at the University of California, San Francisco, for their supportand assistance with this study.
This project was supported by grant NIH 1R01AG031795-02.
References
Abayomi, K., Gelman, A., & Levy, M. (2005). Diagnostics for multivariate imputations.Applied Statistics, 57(3), 273–291.
American College of Cardiology/American Heart Association (2002). Guideline updatefor the perioperative cardiovascular evaluation for noncardiac surgery executivesummary: A report of the American College of Cardiology/American Heart
Association Task Force on Practice Guidelines. Anesthesia and Analgesia, 94,1052–1064.
Borkowski, J. G., Benton, A. L., & Spreen, O. (1967). Word fluency and brain damage.Neuropsychologia, 5, 135–140.
Desmond, D. W., Tatemichi, T. K., & Hanzawa, L. (1994). The telephone interview forcognitive status (TICS): Reliability and validity in a stroke sample. InternationalJournal of Geriatric Psychiatry, 9, 803–807.
DeSouza, C. M., Legadza, A. T., & Sankoh, A. J. (2009). An overview of practicalapproaches for handling missing data in clinical trials. Journal of BiopharmaceuticalStatistics, 19, 1055–1073.
Fleming, T. R. (2011). Addressing missing data in clinical trials. Annals of InternalMedicine, 154(2), 113–117.
Kenward, M. G., & Molenberghs, G. (2009). Last observation carried forward: A crystalball? Journal of Biopharmaceutical Statistics, 19(5), 872–888.
Proust-Lima, C., Amieva, H., Dartigues, J. F., & Jacqmin-Gadda, H. (2007). Sensitivity offour psychometric tests to measure cognitive changes in brain aging-population-based studies. American Journal of Epidemiology, 165(3), 344–350.
Rubin, L. H., Witkiewitz, K., St. Andre, J., & Reilly, S. (2007). Methods for handlingmissing data in the behavioral neurosciences. Journal of Undergraduate Neurosci-ence Education, 5(2), A71–A77.
Sands, L. P., Katz, I. R., & Doyle, S. (1993a). Detecting subclinical change in cognitivefunctioning in older adults: Part I: Explication of the method. The American Journalof Geriatric Psychiatry, 1(3), 185–196.
Sands, L. P., Katz, I. R., & Doyle, S. (1993b). Detecting subclinical change in cognitivefunctioning in older adults: Part II: Initial validation of the method. The AmericanJournal of Geriatric Psychiatry, 1(4), 275–287.
Sands, L. P., Phinney, A., & Katz, I. R. (2000). Monitoring Alzheimer patients for acutechanges in cognitive functioning. The American Journal of Geriatric Psychiatry, 8(1),47–56.
Tsai, T. L., Sands, L. P., & Leung, J. M. (2010). An update on postoperative cognitivedysfunction. Advances in Anesthesia, 28, 269–281.
Wang, Y., Sands, L. P., Vaurio, L., Mullen, E. A., & Leung, J. M. (2007). The effects ofpostoperative pain and its management on postoperative cognitive dysfunction.The American Journal of Geriatric Psychiatry, 15(1), 50–59.
Wechsler, D. (1981). Wechsler adult intelligence scale—revised. New York: HarcourtBrace Jovanovich Publishers.
Wittes, J. (2009). Missing inaction: Preventing missing outcome data in randomizedclinical trials. Journal of Biopharmaceutical Statistics, 19, 957–968.