Embed Size (px)
Citation preview
LUND UNIVERSITY
PO Box 117221 00 Lund+46 46-222 00 00
Impact of obstetric factors on outcome of extremely preterm births in Sweden:prospective population-based observational study (EXPRESS).
Källén, Karin; Serenius, Fredrik; Westgren, Magnus; Marsal, Karel
Published in:Acta Obstetricia et Gynecologica Scandinavica
DOI:10.1111/aogs.12726
Published: 2015-01-01
Link to publication
Citation for published version (APA):Källén, K., Serenius, F., Westgren, M., & Marsal, K. (2015). Impact of obstetric factors on outcome of extremelypreterm births in Sweden: prospective population-based observational study (EXPRESS). Acta Obstetricia etGynecologica Scandinavica, 94(11), 1203-1214. DOI: 10.1111/aogs.12726
General rightsCopyright and moral rights for the publications made accessible in the public portal are retained by the authorsand/or other copyright owners and it is a condition of accessing publications that users recognise and abide by thelegal requirements associated with these rights.
• Users may download and print one copy of any publication from the public portal for the purpose of privatestudy or research. • You may not further distribute the material or use it for any profit-making activity or commercial gain • You may freely distribute the URL identifying the publication in the public portal
Källén et al.
1
Impact of obstetric factors on outcome of extremely preterm
births in Sweden: prospective population-based observational
study (EXPRESS)
Running headline: Obstetric factors in extremely preterm births
Karin Källén1, PhD, Fredrik Serenius2, MD, PhD, Magnus Westgren3, MD, PhD, Karel Maršál4, MD,
PhD, and EXPRESS Group5
From the 1Centre for Reproductive Epidemiology, Lund University, Lund; 2Women’s and Children’s
Health, Section for Pediatrics, Uppsala University, Uppsala and Department of Clinical Sciences,
Pediatrics, Umeå University, Umeå; 3Department of Obstetrics and Gynecology, Karolinska
University Hospital Huddinge, Stockholm; 4Department of Obstetrics and Gynecology, Clinical
Sciences Lund, Lund University, Lund; 5EXPRESS Group members are listed at the end of this
article.
Corresponding author: Karel Maršál, MD, PhD
Department of Obstetrics and Gynecology Lund
Skåne University Hospital Lund
S-221 85 Lund, Sweden
Phone: +46 46 172550
Mobile : +46 708 344717
e-mail : [email protected]

Källén et al.
2
Conflicts of Interest None of the authors has potential conflicts of interest to declare.
Källén et al.
3
Abstract
Introduction. A population-based observational study investigated the contribution of obstetric factors
to the survival and postnatal development of extremely preterm infants.
Material and Methods. Mortality up to one year and neurodevelopment at 2.5 years (Bayley-III test,
cerebral palsy, vision, hearing) were evaluated in infants born <27 gestational weeks in Sweden 2004-
2007 (n=1,011), using logistic regression analyses of risk factors.
Results: Of 844 fetuses alive at admission, 8.4% died in utero before labour, 7.8% died intra partum.
Of 707 live-born infants, 15% died within 24 h, 70% survived ≥365 days, 64% were assessed at 2.5
years. The risk of death within 24h after birth decreased with gestational age (OR 0.3; 95%CI: 0.2-
0.4), antenatal corticosteroids (OR 0.3; 95%CI: 0.1-0.6), and cesarean section (OR 0.4; 95%CI: 0.2-
0.9); it increased with multiple birth (OR 3.0; 95%CI: 1.5-6.0), vaginal breech delivery (OR 2.3;
95%CI: 1.0-5.1), 5-minute Apgar score <4 (OR 50.4; 95%CI: 28.2-90.2), and birth at level II hospital
(OR 2.6; 95%CI: 1.2-5.3). The decreased risk of death between 1 and 365 days remained significant
for gestational age and corticosteroids. The risk of mental developmental delay decreased with
gestational age, birth weight, and fetal growth; it increased with vaginal breech delivery (OR 2.0;
95%CI: 1.2-7.4), male gender, low Apgar score, and high CRIB-score.
Conclusion: Several obstetric factors, including abdominal delivery, influenced the risk of death
within the first day of life, but not later. Antenatal corticosteroids and gestational age decreased the
mortality up to 1 year. Mental developmental delay was related to vaginal breech delivery.
Keywords
Extremely preterm birth; mortality; risk factors; obstetric interventions; neurodevelopmental outcome;
cesarean section; breech delivery

Källén et al.
4
Abbreviations
BW: birth weight
CI: confidence interval
CP: cerebral palsy
CRIB: clinical risk index for babies
EDD: expected date of delivery
EFM: electronic fetal monitoring
EXPRESS: Extremely Preterm Infants in Sweden Study
GA: gestational age
LGA: large-for-gestational age
MDD: mental developmental delay
OR: odds ratio
PPROM: preterm prelabour rupture of membranes
SD: standard deviation
SDS: standard deviation score
SGA: small-for-gestational age

Källén et al.
5
Key Message
The overall survival of extremely preterm infants was related to pro-active obstetric policy with use of
tocolytics, antenatal corticosteroids, and cesarean section. Obstetric factors, except for vaginal breech
delivery, were not associated with neurodevelopmental delay at 2.5 years of age.

Källén et al.
6
Introduction
It is difficult to evaluate to which extent individual obstetric measures contribute to the substatntially
increased survival of extremely preterm born infants that was noted during recent two decades (1,2).
The improved prognosis for these infants is mainly attributed to various improvements in neonatal
care. The obstetric care differs between regions and between countries (3). This reflects the
uncertainty of what is the optimal way of managing extremely preterm fetuses and how the
management is influenced by medical care systems and funding in various societies. Finally,
predominating attitudes among lay public generally favoring maintaining life under all circumstances
may influence the obstetricians’ opinion on these matters (4).
We have previously reported mortality, morbidity, one-year survival and neurodevelopmental
outcome at 2.5 years of age in a population-based prospective observational study on all infants born
before 27 weeks of gestation in Sweden during a three-year period ending 2007 (Extremely Preterm
Infants in Sweden Study; EXPRESS) (2,5,6). The present study is an evaluation of how obstetric
factors and management influenced the survival at various time-points and the neurodevelopmental
outcome at 2.5 years of age.
Källén et al.
7
Material and Methods
We collected perinatal data on all 1,011 infants born before 27 completed gestational weeks from
April 1, 2004 to March 31, 2007 in Sweden. Data on both the live-born and stillborn infants were
registered, from the latter at gestational age 22+0 to 26+6 weeks. The details of the study design and
data collection have been reported previously (2); here only a short account is given.
The prospective collection of data was organized on a regional level (seven Health Care Regions with
seven level III perinatal centers). The perinatal data comprised 220 items regarding the demographic
information, medical and obstetric history, pregnancy course, labor and delivery, neonatal data, and
data on the postnatal course during hospitalization until discharge home. Information on survival at
one year was assessed through linkage with the Swedish Population Register. The gestational age
(GA) was based on ultrasound dating performed before 20 postmenstrual weeks in 95% of
pregnancies and in 16 pregnancies on the date of the last menstrual period. In 28 pregnancies the
dating method was not specified. In 10% of live-born and in 13% of stillborn infants there was a
difference of ≥14 days between the expected date of delivery (EDD) according to ultrasound and
according to the last menstrual period. The birth weights (BW) were evaluated using the national
intrauterine growth standard based on fetal weights (7). The deviation from the expected birth weight
was expressed as a standard deviation score (SDS), small-for-gestational age (SGA) BW being more
than two standard deviations (SD) below the mean.
Preeclampsia was defined as hypertension after 20 weeks of gestation (blood pressure ≥140/90 mmHg
and proteinuria ≥0.03 g/l). Preterm prelabour rupture of membranes (PPROM) was defined as
spontaneous rupture of membranes ≥one hour before the onset of contractions. The diagnosis of
chorioamnionitis was made clinically. The following obstetric interventions were recorded per infant:
antenatal use of tocolytics, antibiotics (any antibiotic drug administered to the mother during
Källén et al.
8
hospitalization that resulted in delivery), and corticosteroids (at least one dose of betamethasone),
electronic fetal heart rate monitoring (EFM), delivery at level III hospital, and delivery by cesarean
section. Spontaneous preterm labour was defined as a labour beginning with spontaneous uterine
contractions or contractions after PPROM. The delivery on maternal and/or fetal indication was
described as iatrogenic vaginal or cesarean delivery, either after induced labor or as a prelabour
cesarean section. The condition of infants at birth was evaluated with Apgar scores at 1 and 5 min and
the neonatal illness severity was estimated using the clinical risk index for babies (CRIB score) (8).
At 2.5 years of corrected age, the children available for the follow-up were subjected to a clinical
examination including vision and hearing. The motor, cognitive and language development of
children was evaluated using the Bayley Scales of Infant and Toddler Development 3rd edition
(Bayley-III) (9). In 41 cases the information about the children was obtained from their medical
charts. Moderate or severe cerebral palsy (CP) and moderate or severe impairment regarding vision
and hearing were characterized as neurosensory impairment. Mental developmental delay (MDD) was
defined as the cognitive or language Bayley III scale <mean-2SD of the term control group, or
moderate or severe developmental delay according to chart review. Moderate or severe
neurodevelopmental disability was present if there was moderate or severe neurosensory impairment,
Bayley III cognitive, language or motor scores <mean-2 SD of the controls or moderate/severe
developmental delay according to chart review. The methodological details of examinations have
been described previously (6).
For analysis of the impact of obstetric factors, the study population (n=1,011) was divided into
subgroups according to the outcome at given time-points: intrauterine death before admission to
hospital (n=167), ante or intra partum death after admission (n=137), live-born infants that died
within 24 h after birth (n=106), and infants that died between 1 and 365 days after birth (n=104),
Källén et al.
9
infants who survived ≥365 days (n=497), and children that were examined at 2.5 years of corrected
age (n=456).
The Regional Research Ethics Board at Lund University approved the study (Registration No.
42/2004).
Statistical methods
Risk factor analyses for stillbirth, postnatal death within 24 hours, death 1-364 days, and outcome at
2.5 years, were performed using logistic regression analyses. The details of each model are specified
in the text and in table headings. For each outcome and evaluated potential risk factor, odds ratios
(OR) with 95% confidence intervals (CI) were calculated: crude, adjusted for GA (entered as a linear
continuous variable, and also as a second grade polynomial), and, for mortality, adjusted for GA
(linear term) and for BW SDS (second grade polynomial). Variables with p-values <0.2 after
adjustments for GA and BW SDS, were entered into the final multiple models. When specifically
studying the impact of BW SDS on survival, a cubic model of BW SDS was used in order to further
improve the fit. The goodness of fit of each model was assessed by the Hosmer-Lemeshow test. For
each model, the number of investigated factors never exceeded 1/10 of the number of cases. No
adjustments were done for multiple comparisons. All statistical analyses were made using Gauss
(Gauss, Aptech Systems Inc., Maple Valley, WA).
Källén et al.
10
Results
Overall, 1,011 infants were born to 887 mothers in 904 deliveries; 304 (30%) infants were stillborn
and 707 (70%) live-born. 54% of all infants were males, 54% and 55% of the stillborns and the live-
borns, respectively. There were 102 multiple births (11.3%); of these 7 were triplet births. In 22% of
540 mothers with available information on the country of origin, the women came from non-Nordic
countries.
Mortality and survival
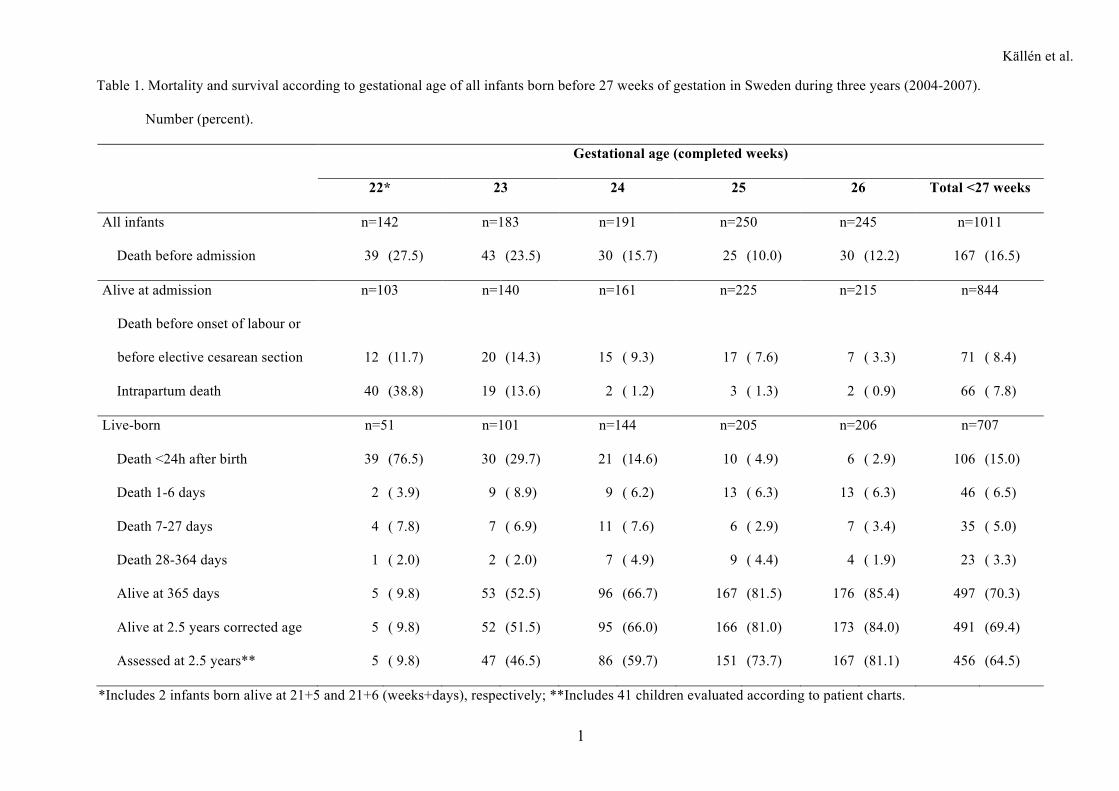
Of the stillborns, 55% died before the admission to hospital (Table 1). Of the 844 fetuses alive at
admission, 8.4% died in utero before the onset of labour or before prelabour cesarean section, 7.8%
died intra partum and 84% were born alive. Of all live-born infants, 70% survived ≥365 days after
birth. Half of the postnatal deaths occurred during the first day of life. Of 497 survivors at one year of
age, 6 children died before 2.5 years of corrected age.
The maternal chronic diseases, and pregnancy and labour complications are presented in Table S1. In
the toal of 1011 cases, frequencies of essential hypertension, preeclampsia and abruption of placenta
including placenta praevia were 4.2%, 10.9% and 12.4%, respectively. The corresponding rates for
PPROM and chorioamnionitis were 14.6% and 15.3%, respectively. Diabetes mellitus is not presented
as it was reported only in 11 cases (1.1%). Abruption of placenta and placenta praevia were most
frequent in pregnancies with live-born infants and at higher GA (25-26 weeks).
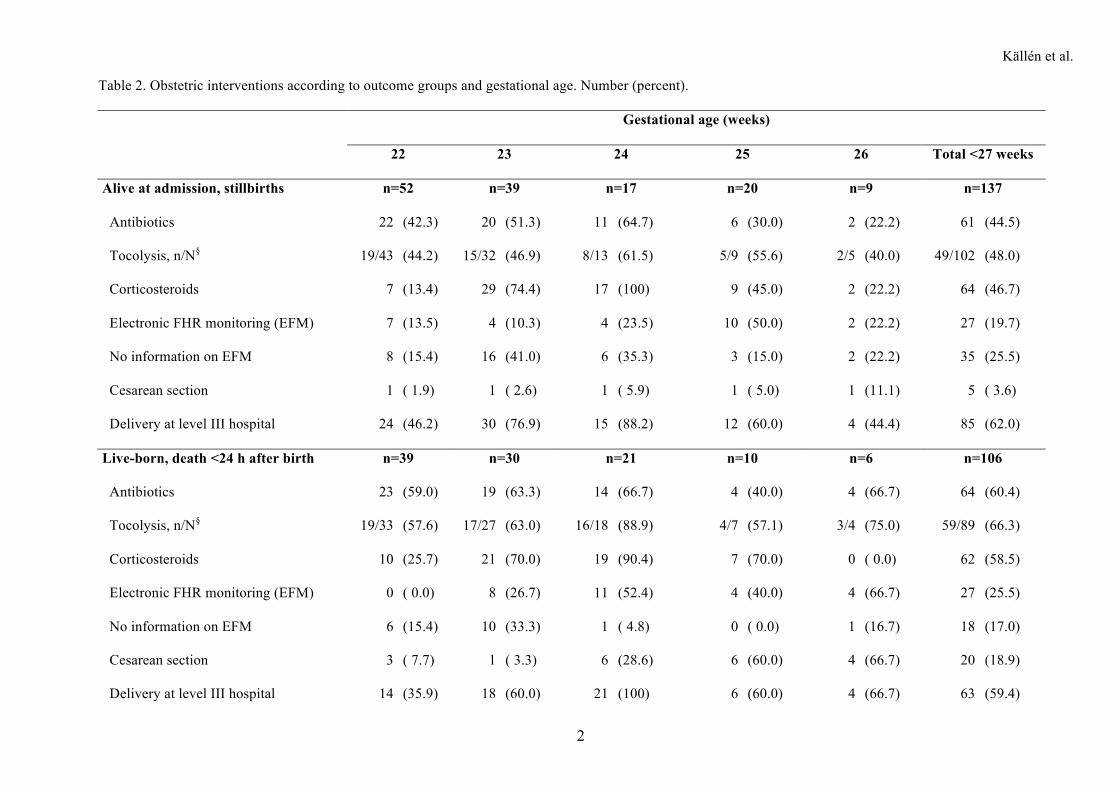
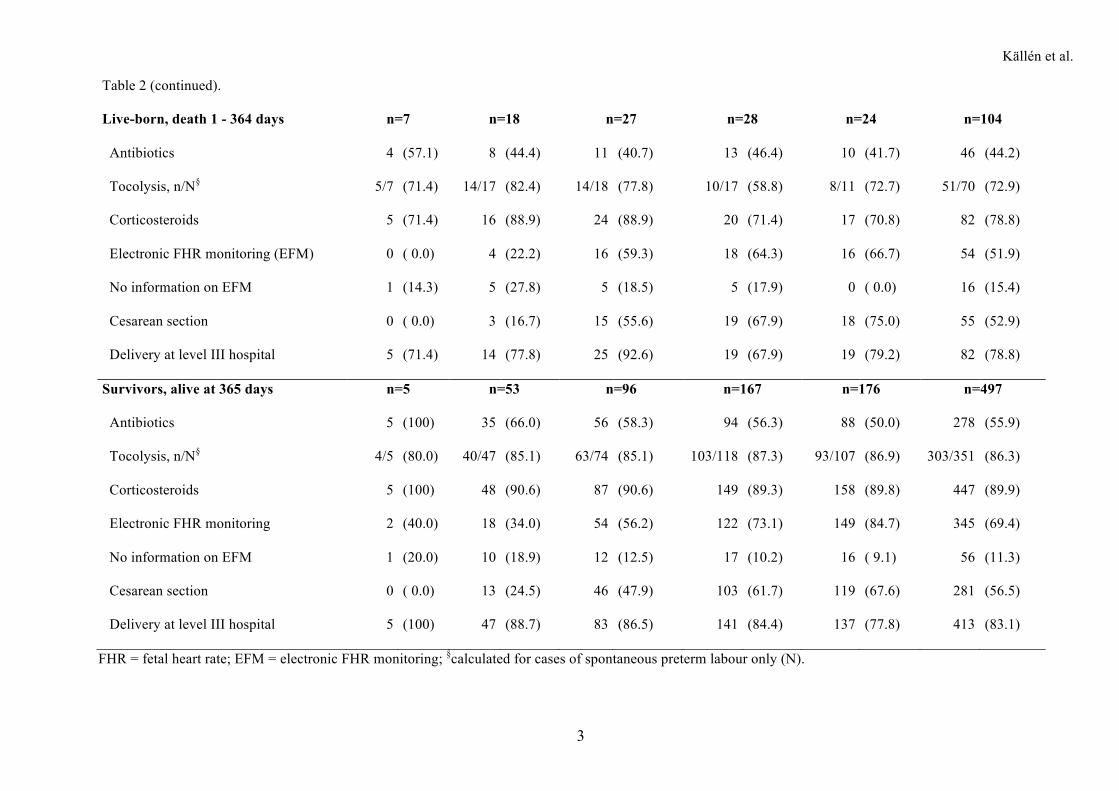
Of all infants, 70% were born at level III hospitals, the corresponding figure for the live-born infants
was 79% (Table 2). Antibiotics were given to mothers of 47% of infants, most often to the mothers of
infants born alive (55%; in 89% of PPROM cases). In 74% of pregnancies with spontaneous preterm
labour, tocolytic treatment was initiated; in 86% in the group of survivors without any differences
Källén et al.
11
between the GA subgroups. Antenatal corticosteroids were given to 65% of all infants, to 84% of
those born alive, and to 90% of survivors. In live-born infants, the use of EFM increased with
increasing GA.
Of the 707 live-born infants, 50% were delivered by cesarean section (at 22-23 weeks 13%, at 24-26
weeks 61%) (Table 2). Cesarean section was performed in nine cases resulting in stillbirth, equally
distributed among the gestational weeks. Of those, six were done on maternal indication (one severe
preeclampsia, three placenta abruptions, two uterine pathology – multiple scars and large myoma,
respectively), and one as a part of maternal resuscitation after cardiac arrest. Two cesarean sections
were performed on fetal indication in twin pregnancies where one fetus had died in utero.
Table S2 presents the infant characteristics at birth according to outcome groups and gestational age.
The BW ranged 100-1130g in the stillborns and 266-1500g in the live-born infants. The median BW
of the 497 survivors was 770g (range 348-1315g). Of the stillborns, 39.5 % were SGA; of the infants
born alive, 16% were SGA. Nine (1.3%) of the live-born infants were LGA (three with congenital
anomalies, one hydrops, five with no concomitant diagnosis). Structural congenital anomalies were
diagnosed in 4.6% of stillborns and in 11% of live-born infants. Apgar score <4 at 5 min was most
common among 106 infants who died within the first day of life (79%), ranging from 92% at 22
weeks to 17% at 26 weeks. Among infants surviving the first 24 h, 7.5% had Apgar score at 5 min <4
with no significant differences between the gestational weeks or between the infants who died within
one year and the survivors ≥365 days. The frequency of CRIB score >10 among infants who died
between 1 and 365 days after birth (22%) was about twice that of the survivors (10%).
Of the children assessed at 2.5 years of corrected age, 34 of 456 (7.5%) had neurosensory impairment,
88 of 440 (20%) had MDD, and 124 of 456 (27.2%) had any moderate or severe disability.
Källén et al.
12
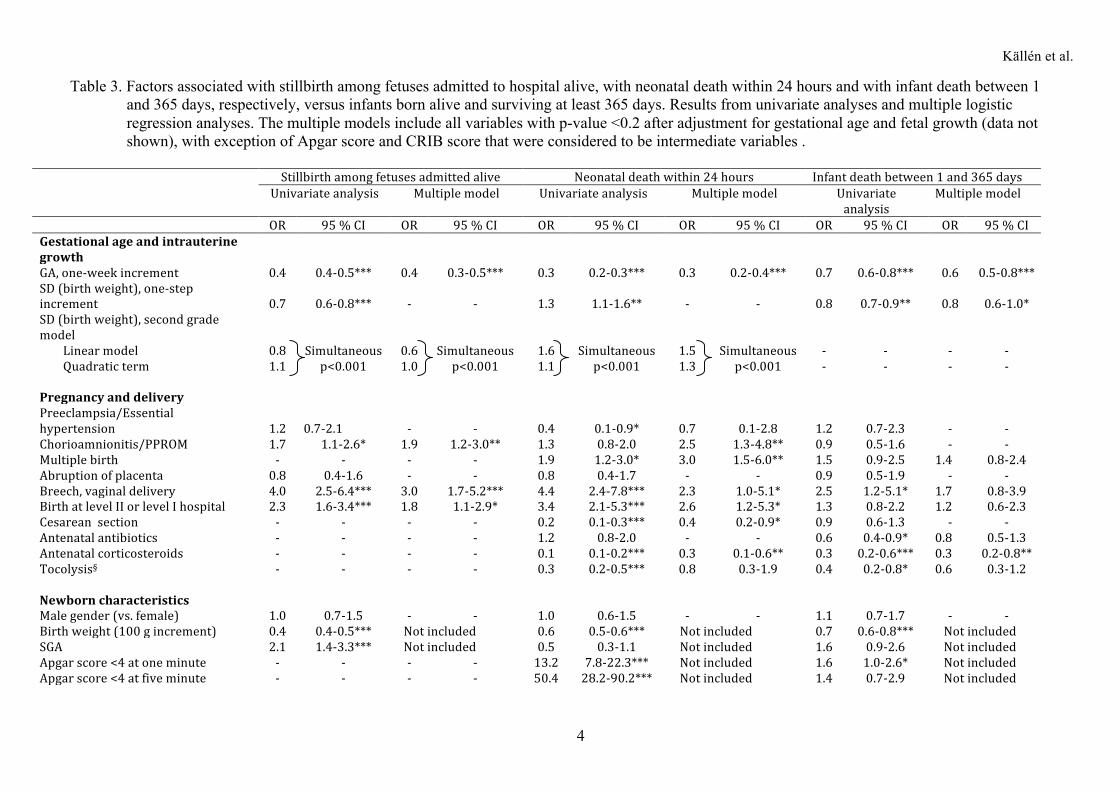
Analyses of obstetric factors
Table 3 shows the associations between obstetric factors and stillbirth among fetuses admitted alive,
neonatal death within 24 hours, and infant death between 1 and 365 days, respectively, as compared to
infants born alive and surviving ≥365 days. The results shown are based on univariate analyses and on
multiple models including the variables with p-values <0.2 after adjustments for GA and BW SDS.
The Supplementary tables S3-S5 present the complete results including the intermediate multiple
models with GA, and GA and BW SDS, respectively.
The risk of stillbirth decreased with advancing GA, higher BW and increasing BW SD, whereas
chorioamnionitis/PPROM, SGA, vaginal breech delivery, and birth at level II or level I hospital were
associated with an increased risk in univariate analyses. In the multiple models, the associations
remained significant.
In univariate analyses, the risk of neonatal death within 24 hours decreased with advancing GA,
higher BW, preeclampsia/essential hypertension, tocolysis, antenatal corticosteroids and cesarean
delivery. Multiple birth, vaginal breech delivery, birth at level II or I hospital, and Apgar score <4
both at 1 and 5 min were adversely associated with outcome. In multiple models the associations
remained significant with exception of preeclampsia and tocolysis. Administration of antenatal
corticosteroids (risk decrease), Apgar score <4 at 5 min and birth at level II or I hospital (risk
increase) were the most significant predictors. Adjusting for all variables led to
chorioamnionitis/PPROM becoming significantly associated with increased risk of death within 24
hours.
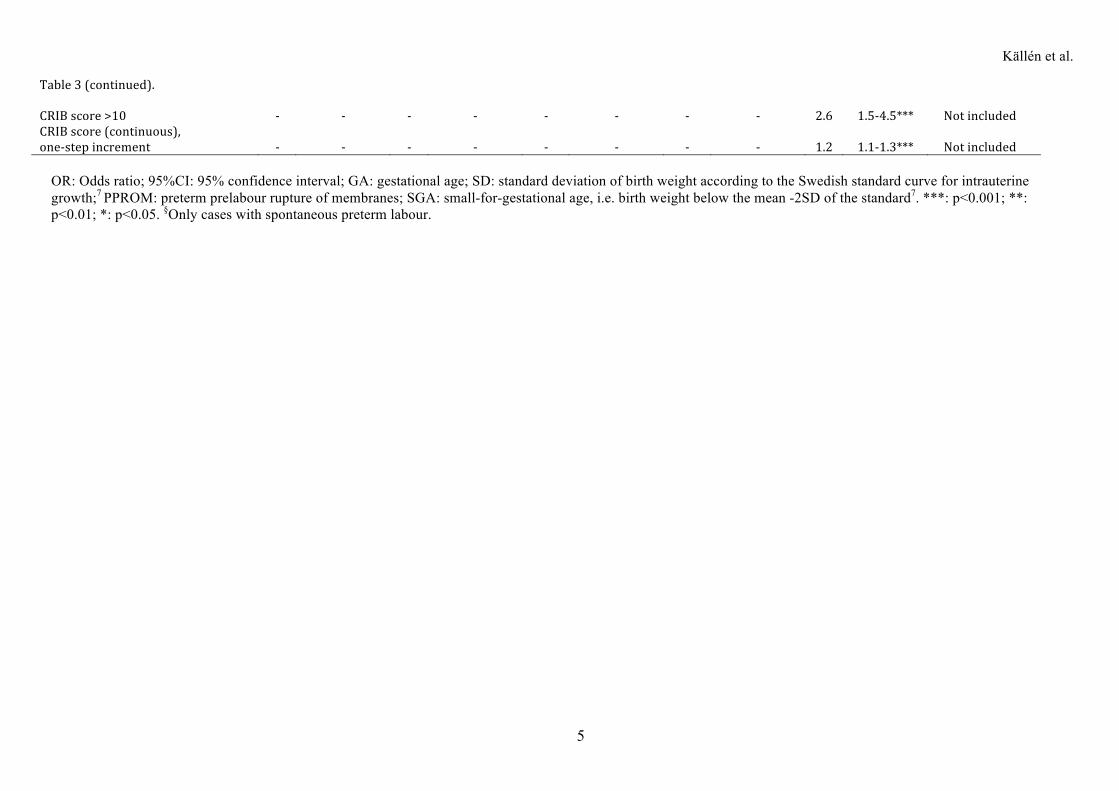
The risk of infant death between 1 and 365 days decreased with advancing GA, higher BW, antenatal
antibiotics, and tocolysis, whereas vaginal breech delivery, Apgar score <4 at 1 min, and high or
increasing CRIB score were associated with an increased risk. The strongest associations between the
Källén et al.
13
risk factors and death between 1 and 365 days of life were found for advancing GA and for antenatal
corticosteroids (risk decrease), and for increasing CRIB score (risk increase). This did not change
after adjusting for all variables in the multiple models.
Maternal demographic factors and fetal gender did not show any significant associations with the
investigated outcomes, i.e., stillbirth, neonatal death within 24 hours, and infant death between 1 and
365 days.
Using a cubic model for BW SDS and a quadratic model for GA, very high goodness of fit for the
logistic regression analyses was achieved (Hosmer and Lemeshow p=0.72 and p=0.29 for stillbirth
and infant death, respectively). The results are presented in Figure 1. While the risk for stillbirth
steadily decreased with increasing BW SDS, a U-shaped relation was found between BW SDS and
infant death.
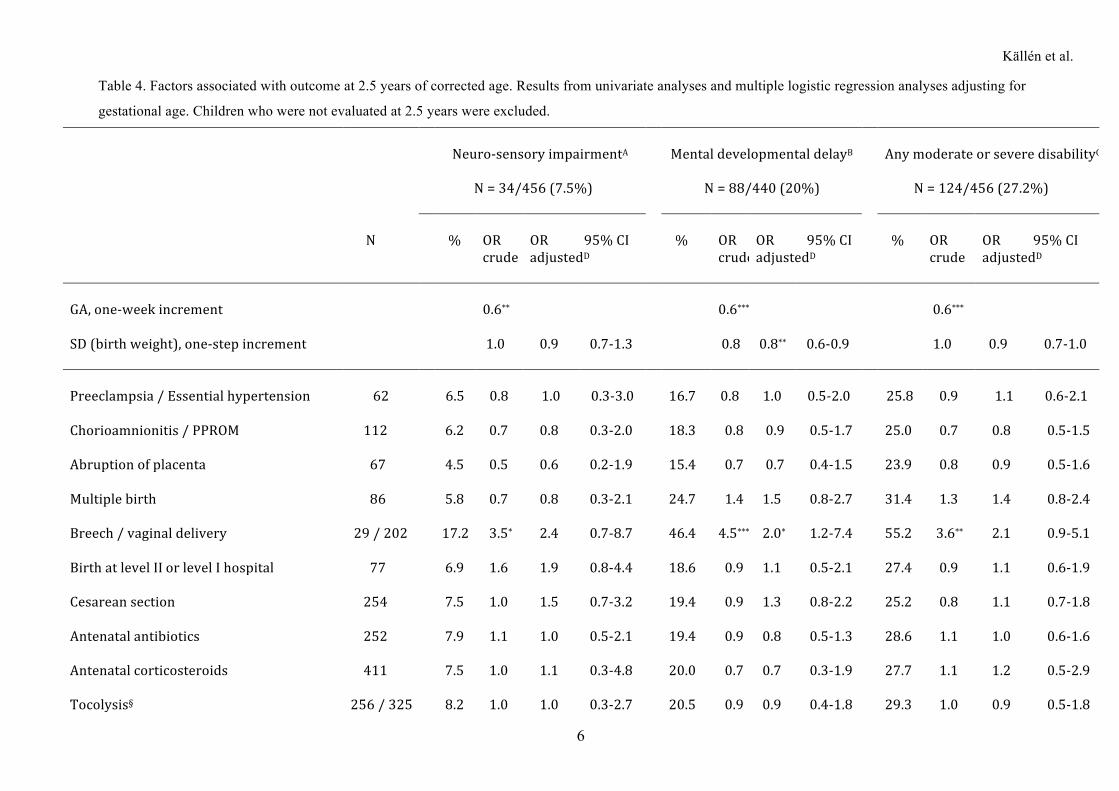
The results of analyses regarding the neurodevelopmental outcome at 2.5 years of corrected age are
presented in Table 4. Of the obstetric factors, vaginal breech delivery was the only one significantly
associated with the three categories of neurodevelopmental impairment. For the MDD, the increased
risk remained significant after adjustment for GA (p<0.05). Male gender increased the risk for MDD
and any moderate or severe disability; the increase remained significant after adjustment for GA
(p<0.01 and p<0.05, respectively). Increase in the BW was associated with a risk decrease in all three
categories of impairment. The strongest association with the neurodevelopmental outcome was found
for neonatal condition, characterized by the Apgar score and CRIB score. Apgar score <4 at one
minute and Apgar score <7 at five minutes were significantly related to an increased risk for MDD
and any moderate or severe disability (p<0.01 in both cases after adjustment for GA). CRIB score >10
was significantly associated with an increase in the risk for all three neurodevelopmental categories
(p<0.001).
Källén et al.
14
Discussion
During 2004-2007, 70% of extremely preterm infants born alive before 27 gestational weeks in
Sweden survived at least one year. Most obstetric interventions, including transport to level III
perinatal centers, tocolysis, and cesarean section, decreased the risk of death within the first day of
life, but not thereafter. Antenatal corticosteroids diminished the mortality risk both during the first 24
hours and up to the age of one year. Vaginal breech delivery was associated with both increased risk
for mortality and for neurodevelopmental delay at 2.5 years of age.
Stillbirths after admission, but before the onset of labour (8.4%) were more common in association
with chorioamnionitis/PPROM and at level II or I hospitals. It can be speculated that the obstetrician
has refrained from actively delivering the mother in many of these cases due to anticipated poor
survival. The number of intra partum deaths was rather low compared to other studies on extremely
preterm deliveries (10,11). Intra partum EFM was applied often if the fetus was judged viable,
however, the present material does not permit any conclusions regarding fetal monitoring during very
preterm labour.
Several classical obstetric complications associated with preterm delivery, e.g. multiple pregnancy,
PPROM, related to infection and inflammation (12), or vaginal breech delivery, were associated with
an increased risk for neonatal deaths within the first 24 hours. It has been claimed that the neonatal
deaths occurring during the first 12 hours after birth do reflect the obstetric management and the
degree of activity at primary resuscitation (13). Later deaths probably reflect more the standard of
neonatal care. Our results show that if the child survived the first 24 hours, continuing survival was
likely.
Källén et al.
15
The cesarean section rate was 50%, comparable to that in the Finnish population-based study (58%)
(14), but much higher than reported from the EPICure study for infants born before 26 gestational
weeks (15.6%) (15). The optimal mode of delivery for extremely preterm infants is not established.
Retrospective register-based studies reported that a liberal use of cesarean section on fetal indication
in very preterm deliveries is associated with increased survival rate also when controlling for birth
weight (16). Data from prospective studies are very limited and inconclusive due to methodological
difficulties (3,17). There are some observational and registry studies (18,19) indicating that cesarean
delivery is preferable for preterm fetuses in breech presentation. For vertex presentation in very
preterm deliveries there are no conclusive data supporting routine use of cesarean section (19). In the
present study, cesarean section was associated with increased survival within the first 24 hours after
birth, but not thereafter.
Delivery at a level II or I hospital was associated with higher rates of stillbirth and death within 24h
after birth. This relationship concurs with the previous observational study in Sweden (20). An
important goal of centralization is to provide the level III units with a higher number of cases, thus
improving the skills and experience of the specialized perinatal teams.
The antenatal treatment with tocolytics and corticosteroids was more frequent than reported in the
literature (10,14,15) and the results indicated a high efficacy with decreased mortality. In contrast to
tocolytics, the significant effect of corticosteroids remained after adjustment for other variables. A
plausible explanation of the beneficial effect of tocolysis might be the time gain enabling
corticosteroid treatment and transport to the level III hospital. Another possibility might be that our
finding just reflects selection of a group of mothers at best health. In agreement with many other
studies the present study confirmed the strong association between antenatal corticosteroids and the
improved neonatal outcome (21). We did not find any difference in the steroid effect when comparing
the estimates for 23 wks with those for 24-26 wks (p=0.75), thus suggesting that the antenatal steroids
Källén et al.
16
are efficient already at that early GA. There were too few cases at 22+0 to 22+6 weeks to allow
corresponding comparison.
At 2.5 years of corrected age, low 1-minute and 5-minute Apgar scores, and high CRIB scores were
strongly associated with neurodevelopmental disability after adjustment for GA. These indicators,
besides acute and chronic fetal conditions, reflect intra partum obstetric management, resuscitation
and initial stabilization after birth. Previously, CRIB score was shown to have little value for
predicting neurodevelopmental outcome (22). In our study CRIB score >10 was a better predictor than
birth weight or gestational age. Although Apgar scores are associated with outcome at group level, it
must be emphasized that individual Apgar scores cannot discriminate between infants who eventually
survive unimpaired or who survive with impairment (23).
In contrast to several studies, male gender was not associated with higher mortality. At follow-up,
however, the neurodevelopmental outcome of boys was poorer than that of girls which is also reported
by others (24). We were not able to show an association between 2.5-year outcome and SGA, which
might be due to the early age at follow-up. However, a recent large study from the National Institute
of Child Health and Human Development reported significantly increased risks for low Bayley-III
cognitive and language scores at 18-24 months in SGA infants born at 23-26 weeks (25). Severe
intrauterine growth restriction has been also associated with greater risk for cognitive impairment at 5-
8 years in boys born at median 26.9 weeks (26).
In this study, among obstetric factors, only vaginal breech delivery was significantly associated with
adverse outcome (MDD) at 2.5 years corrected age – the unadjusted OR for neurosensory impairment
(moderate and severe cerebral palsy, moderate or severe impairment regarding vision and hearing)
was significantly increased. In the EPICure study, breech delivery was associated with increased risk
for cerebral palsy at 30 months of age in infants born at <26 weeks (27) and a recent Norwegian
Källén et al.
17
registry study, reported an increased risk for cerebral palsy at 4 years in preterm children after breech
delivery (28). The fact that term infants with breech presentation exhibit greater risk for cerebral palsy
than those with cephalic presentation regardless of mode of delivery (28) indicates that underlying
conditions causing breech presentation contribute to the outcome. The previously not reported finding
of the association with MDD might reflect a pathophysiology different from that associated with CP.
This merits further exploration in our cohort at later follow-up at 6.5 and 11 years.
Proper counseling of the parents and the obstetric decision making require access to accurate and up-
to-date information not only on mortality, but also on morbidity. Considering the rather high long-
term morbidity of extremely preterm infants (29), it should go without saying that institutions
providing care for these mothers and infants should continuously perform long-term follow-up into
childhood and behind.
In the EXPRESS study the one-year survival was high as compared with other national figures
(10,14,30). When evaluating the impact of obstetric factors and interventions, several possibly
contributing circumstances specific for the Swedish health care system should be considered. A
standardized antenatal and perinatal care is free of charge for all inhabitants. Almost all pregnancies
are dated with ultrasound in the first or early second trimester. Generally, the ultrasound pick-up rate
of severe malformations is high. Hence pregnancies with severe malformations are frequently
terminated which is the most likely explanation for the low rate of severe malformations in the present
material. Teenage pregnancies are very few (<4%) depending on liberal use of contraception and a
rather high rate of terminations of pregnancy among young women. Single embryo transfer is
generally implemented in all in-vitro fertilization programs since 2003, which significantly decreased
the proportion of preterm deliveries due to multiple pregnancies.
Källén et al.
18
To provide evidence for obstetric management of extremely preterm births, randomized controlled
trials would be desirable. Unfortunately, to perform randomized trials in this group of patients is very
difficult. In this perspective, the strength of the prospective observational EXPRESS study is that it is
truly population-based and that it includes antenatal deaths and early delivery room deaths. The
weakness of this type of study is the difficulty or even impossibility to distinguish the effect on
survival of the underlying pathology from the effects of preterm labour and delivery per se.
Furthermore, the ultrasound dating of some of these pregnancies in the second trimester can be
misleading because of early growth restriction and possibility of systematic GA underestimation. The
resulting p-values should be interpreted with caution as some might be due to multiple comparisons.
The found beneficial effect of cesarean section on short-term survival might include a risk of selection
bias – it cannot be excluded that mothers with more favorable prospects for infant survival were those
most often selected for cesarean section.
In conclusion, pro-active obstetric policy with antenatal use of tocolytics and corticosteroids, transport
to level III perinatal centers and liberal use of cesarean section, is associated with improved survival
in extremely preterm infants. Vaginal breech delivery increases risk for mortality and for
neurodevelopmental delay at 2.5 years of age, thus supporting the view that cesarean section in thiese
cases should be the method of choice.
Källén et al.
19
Supporting Information published online
Table S1. Maternal chronic diseases, and pregnancy and labour complications according to outcome
groups and gestational age.
Table S2. Infant characteristics according to outcome groups and gestational age.
Table S3. Factors associated with stillbirth among fetuses admitted to hospital alive versus infants
born alive and surviving at least 365 days.
Table S4. Factors associated with neonatal death within 24 hours after birth compared to infants alive
at one year of age.
Table S5. Factors associated with infant death between 1 and 365 days after birth compared to infants
alive at one year of age.
Källén et al.
20
EXPRESS Group members
Obstetricians: Tomas Fritz, MD, Sahlgrenska University Hospital, Göteborg; Per Åke Holmgren
MD, PhD, Umeå University Hospital, Umeå; Annika Jeppsson, MD, PhD, Sahlgrenska University
Hospital, Göteborg, previously Linköping University Hospital; Karel Maršál, MD, PhD (principal
investigator), Skåne University Hospital, Lund; Solveig Nordén-Lindeberg, MD, PhD, Uppsala
University Hospital, Uppsala; Ingrid Östlund, MD, PhD, Örebro University Hospital, Örebro; Marija
Simic, MD, PhD, Karolinska University Hospital Solna, Stockholm; the late Margareta Wennergren,
MD, PhD, Sahlgrenska University Hospital, Göteborg; Magnus Westgren, MD, PhD, Karolinska
University Hospital Huddinge, Stockholm. Neonatologists: Mats Blennow, MD, PhD, Karolinska
University Hospital Huddinge, Stockholm; Uwe Ewald, MD, PhD, Uppsala University Hospital,
Uppsala; Vineta Fellman, MD, PhD, Skåne University Hospital, Lund; Lena Hellström-Westas, MD,
PhD, Uppsala University Hospital, Uppsala; Hugo Lagercrantz, MD, PhD, Astrid Lindgren Children`s
Hospital, Karolinska Institute, Stockholm; Eva Lindberg, MD, PhD, Örebro University Hospital,
Örebro; Mikael Norman, MD, PhD, Karolinska University Hospital, Stockholm; Elisabeth Olhager,
MD, PhD, Skåne University Hospital, Lund; Fredrik Serenius, MD, PhD, Uppsala University
Hospital, Uppsala, previously Umeå University Hospital, Umeå; Gunnar Sjörs, MD, PhD, Uppsala
University Hospital, Uppsala; Lennart Stigson, MD, Sahlgrenska University Hospital, Göteborg.
Other experts: Maria Hafström, MD, PhD (pediatric neurology), Gerd Holmström, MD, PhD
(ophthalmology), Uppsala University Hospital, Uppsala; Karin Källén, PhD (reproductive
epidemiology), Lund University, Lund; the llate Ricardo Laurini, MD, PhD (pathology), Bodö Central
Hospital, Bodö, Norway; Anita Lundqvist, PhD (data collection coordinator), Lund University, Lund;
Pia Lundqvist, RN, PhD (patient interviews), Lund University, Lund; Tore Nilstun, PhD (medical
ethics), Lund University, Lund; Karin Stjernqvist, PhD (psychology), Lund University, Lund; Bo
Strömberg, MD, PhD (pediatric neurology), Uppsala University Hospital, Uppsala; Brigitte Vollmer,
MD, PhD (pediatric neurology), Astrid Lindgren Children`s Hospital, Karolinska Institute,
Stockholm.

Källén et al.
21

Maršál et al.
22
Acknowledgments
The professional help in the collection of data and follow-up examinations of children by the
following colleagues is gratefully acknowledged: Dr. Dordi Austeng, Dr. Kristina Forsblad, and Dr.
Ulla Lindskog. The technical assistance at data collection by Ms. Grozda Pajic, Lund University, is
greatly appreciated. The authors thank Marius Kublickas, MD, PhD (MedSciNet AB) for the design
and maintenance of study database.
Funding
This study was supported by the Swedish Research Council (grants 2006-3855 and 2009-4250), the
Swedish National Board of Health and Welfare, Grants to Researchers in the Public Health Care
from the Swedish government, the Uppsala-Örebro Regional Research Council grant RFR-10324,
and grants from the Research Council South East Region of Sweden, from the Evy and Gunnar
Sandberg Foundation, and from the Birgit and Håkan Ohlsson Foundations.
Maršál et al.
23
References
1. Saigal S, Doyle LW. An overview of mortality and sequelae of preterm birth from infancy
to adulthood. Lancet. 2008;371:261-9.
2. The EXPRESS Group. One-year survival of extremely preterm infants after active
perinatal care in Sweden. JAMA. 2009;301:2225-33.
3. Kollée LA, Cuttini M, Delmas D, Papiernik E, den Ouden AL, Agostino R et al. Obstetric
interventions for babies born before 28 weeks of gestation in Europe: results of the
MOSAIC study. MOSAIC Research group. BJOG. 2009;116:1481-91.
4. Cuttini M, Nadai M, Kaminski M, Hansen G, de Leeuw R, Lenoir S et al. End-of-life
decisions in neonatal intensive care: physicians' self-reported practices in seven European
countries. EURONIC Study Group. Lancet. 2000;355:2112-8.
5. The EXPRESS Group. Incidence of and risk factors for neonatal morbidity after active
perinatal care: extremely preterm infants study in Sweden (EXPRESS). Acta Paediatr.
2010;99:978-92.
6. Serenius F, Källén K, Blennow M, Ewald U, Fellman V, Holmström G et al. for the
EXPRESS Group. Neurodevelopmental outcome in extremely preterm infants at 2.5 years
after active perinatal care in Sweden. JAMA. 2013;309:1810-20.
7. Marsal K, Persson PH, Larsen T, Lilja H, Selbing A, Sultan B. Intrauterine growth curves
based on ultrasonically estimated foetal weights. Acta Paediatr. 1996;85:843-8.
8. The International Neonatal Network. The CRIB (clinical risk index for babies) score: a
tool for assessing initial neonatal risk and comparing performance of neonatal intensive
care units. Lancet. 1993;342:193-201.
9. Bayley N. Bayley Scales of Infant and Toddler Development. 3rd edn. San Antonio, TX:
Harcourt Assessment Inc, 2006.
10. Vanhaesebrouck P, Allegaert K, Bottu J, Debauche C, Devlieger H, Docx M et al.
Extremely Preterm Infants in Belgium Study Group. The EPIBEL study: outcomes to
Maršál et al.
24
discharge from hospital for extremely preterm infants in Belgium. Pediatrics.
2004;114:663-75.
11. Larroque B, Bréart G, Kaminski M, Dehan M, André M, Burguet A, et al. Survival of
very preterm infants: Epipage, a population based cohort study. Arch Dis Child Fetal
Neonatal Ed. 2004;89:F139-44.
12. Andrews WW, Cliver SP, Biasini F, Peralta-Carcelen AM, Rector R, Alriksson-Schmidt
AI, et al. Early preterm birth: association between in utero exposure to acute
inflammation and severe neurodevelopmental disability at 6 years of age. Am J Obstet
Gynecol 2008;198:466.e1-466.e11.
13. Shankaran S, Fanaroff AA, Wright LL, Stevenson DK, Donovan EF, Ehrenkranz RA et al.
Risk factors for early death among extremely low-birth-weight infants. Am J Obstet
Gynecol. 2002;186:796-802.
14. Tommiska V, Heinonen K, Lehtonen L, Renlund M, Saarela T, Tammela O et al. No
improvement in outcome of nationwide extremely low birth weight infant populations
between 1996-1997 and 1999-2000. Pediatrics. 2007;119:29-36.
15. Costeloe K, Hennessy E, Gibson AT, Marlow N, Wilkinson AR. The EPICure study:
outcomes to discharge from hospital for infants born at the threshold of viability.
Pediatrics. 2000;106.:659-71.
16. Malloy MH. Impact of cesarean section on neonatal mortality rates among very preterm
infants in the United States, 2000-2003. Pediatrics 2008;122.:285-92.
17. Alfirevic Z, Milan SJ, Livio S. Caesarean section versus vaginal delivery for preterm birth
in singletons. Cochrane Database of Systematic Reviews 2013, Issue 9. Art. No.:
CD000078. DOI: 10.1002/14651858.CD000078.pub3.
Maršál et al.
25
18. Ingemarsson I, Svenningsen N, Westgren M. Long-term follow-up of preterm infants in
breech presentation delivered by caesarean section. A prospective study. Lancet.
1978;2:172-5.
19. Herbst A, Källén K. Influence of mode of delivery on neonatal mortality and morbidity in
spontaneous preterm breech delivery. Eur J Obstet Gynecol Reprod Biol. 2007;133:25-9.
20. Finnström O, Olausson PO, Sedin G, Serenius F, Svenningsen N, Thiringer K et al. The
Swedish national prospective study on extremely low birthweight (ELBW) infants.
Incidence, mortality, morbidity and survival in relation to level of care. Acta Paediatr.
1997;86:503-11.
21. Roberts D, Dalziel SR. Antenatal corticosteroids for accelerating fetal lung maturation for
women at risk of preterm birth. Cochrane Database of Systematic Reviews 2006, Issue 3.
Art. No.: CD004454. DOI: 10.1002/14651858.CD004454.pub2.
22. Dorling JS, Field DJ, Manktelow B. Neonatal disease severity scoring systems. Arch Dis
Child Fetal Neonatal Ed. 2005;90:F11-6.
23. Singh J, Fanaroff J, Andrews B, Caldarelli L, Lagatta J, Plesha-Troyke S, et al.
Resuscitation in the "gray zone" of viability: determining physician preferences and
predicting infant outcomes. Pediatrics. 2007;120:519-26.
24. Hintz SR, Kendrick DE, Vohr BR, Kenneth Poole W, Higgins RD; NICHD Neonatal
Research Network. Gender differences in neurodevelopmental outcomes among extremely
preterm, extremely-low-birthweight infants. Acta Paediatr. 2006;95:1239-48.
25. De Jesus LC, Pappas A, Shankaran S, Li L, Das A, Bell EF, et al.; Eunice Kennedy Shriver
National Institute of Health and Human Development Neonatal Research Network.
Outcomes of small for gestational age infants born at <27 weeks' gestation. J Pediatr.
2013;163:55-60.e1-3.
26. Morsing E, Asard M, Ley D, Stjernqvist K, Marsál K. Cognitive function after intrauterine
growth restriction and very preterm birth. Pediatrics. 2011;127(4):e874-82.
Maršál et al.
26
27. Wood NS, Costeloe K, Gibson AT, Hennessy EM, Marlow N, Wilkinson AR; EPICure
Study Group. The EPICure study: associations and antecedents of neurological and
developmental disability at 30 months of age following extremely preterm birth. Arch Dis
Child Fetal Neonatal Ed. 2005;90:F134-40.
28. Andersen GL, Irgens LM, Skranes J, Salvesen KA, Meberg A, Vik T. Is breech
presentation a risk factor for cerebral palsy? A Norwegian birth cohort study. Dev Med
Child Neurol. 2009;51:860-5.
29. Marlow N, Wolke D, Bracewell MA, Samara M; EPICure Study Group. Neurologic and
developmental disability at six years of age after extremely preterm birth. N Engl J Med.
2005;352:9-19.
30. Draper ES, Zeitlin J, Fenton AC, Weber T, Gerrits J, Martens G et al. Investigating the
variations in survival rates for very preterm infants in 10 European regions: the MOSAIC
birth cohort. Arch Dis Child Fetal Neonatal Ed. 2009;94:F158-63.
Maršál et al.
27
Figure legends and Table captions
Figure 1. Risk for stillbirth and infant death in relation to fetal growth. The fetal growth is
expressed as birth weight standard deviation scores according to the Swedish intrauterine
growth standard (7). Only fetuses alive at admission to the delivery unit were included.
Odds ratios (with 95% confidence intervals as vertical bars) were obtained from multiple
logistic regression analyses using a cubic model for birth weight standard deviation
scores and a quadratic model for gestational age.
Table 1. Mortality and survival according to gestational age of all infants born before 27 weeks of
gestation in Sweden during three years (2004-2007). Number (percent).
Table 2. Obstetric interventions according to outcome groups and gestational age. Number
(percent).
Table 3. Factors associated with stillbirth among fetuses admitted to hospital alive, with neonatal
death within 24 hours and with infant death between 1 and 365 days, respectively, versus
infants born alive and surviving at least 365 days. Results from univariate analyses and
multiple logistic regression analyses. The multiple models include all variables with p-
value <0.2 after adjustment for gestational age and fetal growth (data not shown), with
exception of Apgar score and CRIB score that were considered to be intermediate
variables .

Maršál et al.
28
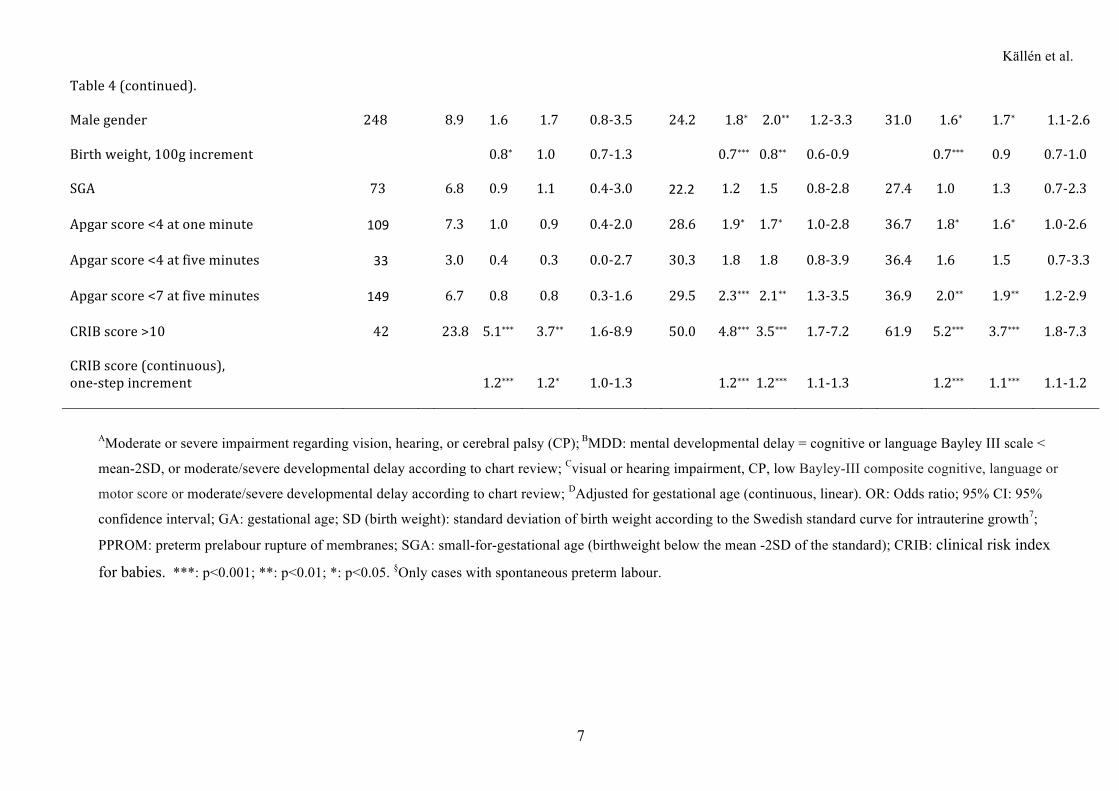
Table 4. Factors associated with outcome at 2.5 years of corrected age. Results from univariate
analyses and multiple logistic regression analyses adjusting for gestational age. Children
who were not evaluated at 2.5 years were excluded.
Maršál et al.
29
Supplementary material
Table S1. Maternal chronic diseases, and pregnancy and labour complications according to
outcome groups and gestational age. Number (percent).
Table S2. Infant characteristics according to outcome groups and gestational age.
Table S3. Factors associated with stillbirth among fetuses admitted to hospital alive versus infants
born alive and surviving at least 365 days. Results from univariate analyses and multiple
logistic regression analyses including gestational age alone or gestational age and fetal
growth expressed as standard deviation of birth weight according to the Swedish standard
curve for intrauterine growth. For each column, the ‘base-adjustment-variable-set’ is
indicated with grey colour; the unmarked variables were added separately one at a time.
The results of grey-marked variables were derived from models in which no other
variables than those grey-marked (gestational age alone or gestational age and SD of
birth weight) were entered.
Table S4. Factors associated with neonatal death within 24 hours after birth compared to infants
alive at one year of age. Results from univariate analyses and multiple logistic regression
analyses including gestational age alone or gestational age and fetal growth expressed as
standard deviation of birth weight according to the Swedish standard curve for
intrauterine growth. For each column, the ‘base-adjustment-variable-set’ is indicated with
grey colour; the unmarked variables were added separately one at a time. The results of
grey-marked variables were derived from models in which no other variables than those
grey-marked (gestational age alone or gestational age and SD of birth weight) were
entered.
Maršál et al.
30
Table S5. Factors associated with infant death between 1 and 364 days after birth compared to
infants alive at one year of age. Results from univariate analyses and multiple logistic
regression analyses including gestational age alone or gestational age and fetal growth
expressed as standard deviation of birth weight according to the Swedish standard curve
for intrauterine growth. For each column, the ‘base-adjustment-variable-set’ is indicated
with grey colour; the unmarked variables were added separately one at a time. The results
of grey-marked variables were derived from models in which no other variables than
those grey-marked (gestational age alone or gestational age and SD of birth weight) were
entered.
Källén et al.
1
Table 1. Mortality and survival according to gestational age of all infants born before 27 weeks of gestation in Sweden during three years (2004-2007).
Number (percent).
Gestational age (completed weeks)
22* 23 24 25 26 Total <27 weeks
All infants n=142 n=183 n=191 n=250 n=245 n=1011
Death before admission 39 (27.5) 43 (23.5) 30 (15.7) 25 (10.0) 30 (12.2) 167 (16.5)
Alive at admission n=103 n=140 n=161 n=225 n=215 n=844
Death before onset of labour or
before elective cesarean section 12 (11.7) 20 (14.3) 15 ( 9.3) 17 ( 7.6) 7 ( 3.3) 71 ( 8.4)
Intrapartum death 40 (38.8) 19 (13.6) 2 ( 1.2) 3 ( 1.3) 2 ( 0.9) 66 ( 7.8)
Live-born n=51 n=101 n=144 n=205 n=206 n=707
Death <24h after birth 39 (76.5) 30 (29.7) 21 (14.6) 10 ( 4.9) 6 ( 2.9) 106 (15.0)
Death 1-6 days 2 ( 3.9) 9 ( 8.9) 9 ( 6.2) 13 ( 6.3) 13 ( 6.3) 46 ( 6.5)
Death 7-27 days 4 ( 7.8) 7 ( 6.9) 11 ( 7.6) 6 ( 2.9) 7 ( 3.4) 35 ( 5.0)
Death 28-364 days 1 ( 2.0) 2 ( 2.0) 7 ( 4.9) 9 ( 4.4) 4 ( 1.9) 23 ( 3.3)
Alive at 365 days 5 ( 9.8) 53 (52.5) 96 (66.7) 167 (81.5) 176 (85.4) 497 (70.3)
Alive at 2.5 years corrected age 5 ( 9.8) 52 (51.5) 95 (66.0) 166 (81.0) 173 (84.0) 491 (69.4)
Assessed at 2.5 years** 5 ( 9.8) 47 (46.5) 86 (59.7) 151 (73.7) 167 (81.1) 456 (64.5)
*Includes 2 infants born alive at 21+5 and 21+6 (weeks+days), respectively; **Includes 41 children evaluated according to patient charts.
Källén et al.
2
Table 2. Obstetric interventions according to outcome groups and gestational age. Number (percent).
Gestational age (weeks)
22 23 24 25 26 Total <27 weeks
Alive at admission, stillbirths n=52 n=39 n=17 n=20 n=9 n=137
Antibiotics 22 (42.3) 20 (51.3) 11 (64.7) 6 (30.0) 2 (22.2) 61 (44.5)
Tocolysis, n/N§ 19/43 (44.2) 15/32 (46.9) 8/13 (61.5) 5/9 (55.6) 2/5 (40.0) 49/102 (48.0)
Corticosteroids 7 (13.4) 29 (74.4) 17 (100) 9 (45.0) 2 (22.2) 64 (46.7)
Electronic FHR monitoring (EFM) 7 (13.5) 4 (10.3) 4 (23.5) 10 (50.0) 2 (22.2) 27 (19.7)
No information on EFM 8 (15.4) 16 (41.0) 6 (35.3) 3 (15.0) 2 (22.2) 35 (25.5)
Cesarean section 1 ( 1.9) 1 ( 2.6) 1 ( 5.9) 1 ( 5.0) 1 (11.1) 5 ( 3.6)
Delivery at level III hospital 24 (46.2) 30 (76.9) 15 (88.2) 12 (60.0) 4 (44.4) 85 (62.0)
Live-born, death <24 h after birth n=39 n=30 n=21 n=10 n=6 n=106
Antibiotics 23 (59.0) 19 (63.3) 14 (66.7) 4 (40.0) 4 (66.7) 64 (60.4)
Tocolysis, n/N§ 19/33 (57.6) 17/27 (63.0) 16/18 (88.9) 4/7 (57.1) 3/4 (75.0) 59/89 (66.3)
Corticosteroids 10 (25.7) 21 (70.0) 19 (90.4) 7 (70.0) 0 ( 0.0) 62 (58.5)
Electronic FHR monitoring (EFM) 0 ( 0.0) 8 (26.7) 11 (52.4) 4 (40.0) 4 (66.7) 27 (25.5)
No information on EFM 6 (15.4) 10 (33.3) 1 ( 4.8) 0 ( 0.0) 1 (16.7) 18 (17.0)
Cesarean section 3 ( 7.7) 1 ( 3.3) 6 (28.6) 6 (60.0) 4 (66.7) 20 (18.9)
Delivery at level III hospital 14 (35.9) 18 (60.0) 21 (100) 6 (60.0) 4 (66.7) 63 (59.4)
Källén et al.
3
Table 2 (continued).
Live-born, death 1 - 364 days n=7 n=18 n=27 n=28 n=24 n=104
Antibiotics 4 (57.1) 8 (44.4) 11 (40.7) 13 (46.4) 10 (41.7) 46 (44.2)
Tocolysis, n/N§ 5/7 (71.4) 14/17 (82.4) 14/18 (77.8) 10/17 (58.8) 8/11 (72.7) 51/70 (72.9)
Corticosteroids 5 (71.4) 16 (88.9) 24 (88.9) 20 (71.4) 17 (70.8) 82 (78.8)
Electronic FHR monitoring (EFM) 0 ( 0.0) 4 (22.2) 16 (59.3) 18 (64.3) 16 (66.7) 54 (51.9)
No information on EFM 1 (14.3) 5 (27.8) 5 (18.5) 5 (17.9) 0 ( 0.0) 16 (15.4)
Cesarean section 0 ( 0.0) 3 (16.7) 15 (55.6) 19 (67.9) 18 (75.0) 55 (52.9)
Delivery at level III hospital 5 (71.4) 14 (77.8) 25 (92.6) 19 (67.9) 19 (79.2) 82 (78.8)
Survivors, alive at 365 days n=5 n=53 n=96 n=167 n=176 n=497
Antibiotics 5 (100) 35 (66.0) 56 (58.3) 94 (56.3) 88 (50.0) 278 (55.9)
Tocolysis, n/N§ 4/5 (80.0) 40/47 (85.1) 63/74 (85.1) 103/118 (87.3) 93/107 (86.9) 303/351 (86.3)
Corticosteroids 5 (100) 48 (90.6) 87 (90.6) 149 (89.3) 158 (89.8) 447 (89.9)
Electronic FHR monitoring 2 (40.0) 18 (34.0) 54 (56.2) 122 (73.1) 149 (84.7) 345 (69.4)
No information on EFM 1 (20.0) 10 (18.9) 12 (12.5) 17 (10.2) 16 ( 9.1) 56 (11.3)
Cesarean section 0 ( 0.0) 13 (24.5) 46 (47.9) 103 (61.7) 119 (67.6) 281 (56.5)
Delivery at level III hospital 5 (100) 47 (88.7) 83 (86.5) 141 (84.4) 137 (77.8) 413 (83.1)
FHR = fetal heart rate; EFM = electronic FHR monitoring; §calculated for cases of spontaneous preterm labour only (N).
Källén et al.
4
Table 3. Factors associated with stillbirth among fetuses admitted to hospital alive, with neonatal death within 24 hours and with infant death between 1 and 365 days, respectively, versus infants born alive and surviving at least 365 days. Results from univariate analyses and multiple logistic regression analyses. The multiple models include all variables with p-value <0.2 after adjustment for gestational age and fetal growth (data not shown), with exception of Apgar score and CRIB score that were considered to be intermediate variables .
Stillbirthamongfetusesadmittedalive Neonataldeathwithin24hours Infantdeathbetween1and365days
Univariateanalysis Multiplemodel Univariateanalysis Multiplemodel Univariateanalysis
Multiplemodel
OR 95%CI OR 95%CI OR 95%CI OR 95%CI OR 95%CI OR 95%CIGestationalageandintrauterinegrowth
GA,one-weekincrement 0.4 0.4-0.5*** 0.4 0.3-0.5*** 0.3 0.2-0.3*** 0.3 0.2-0.4*** 0.7 0.6-0.8*** 0.6 0.5-0.8***SD(birthweight),one-stepincrement
0.7
0.6-0.8***
-
-
1.3
1.1-1.6**
-
- 0.8 0.7-0.9**
0.8
0.6-1.0*
SD(birthweight),secondgrademodel
Linearmodel 0.8 Simultaneous 0.6 Simultaneous 1.6 Simultaneous 1.5 Simultaneous - - - -Quadraticterm 1.1 p<0.001 1.0 p<0.001 1.1 p<0.001 1.3 p<0.001 - - - - Pregnancyanddelivery Preeclampsia/Essentialhypertension 1.2 0.7-2.1
-
- 0.4 0.1-0.9*
0.7
0.1-2.8 1.2 0.7-2.3
-
-
Chorioamnionitis/PPROM 1.7 1.1-2.6* 1.9 1.2-3.0** 1.3 0.8-2.0 2.5 1.3-4.8** 0.9 0.5-1.6 - -Multiplebirth - - - - 1.9 1.2-3.0* 3.0 1.5-6.0** 1.5 0.9-2.5 1.4 0.8-2.4Abruptionofplacenta 0.8 0.4-1.6 - - 0.8 0.4-1.7 - - 0.9 0.5-1.9 - -Breech,vaginaldelivery 4.0 2.5-6.4*** 3.0 1.7-5.2*** 4.4 2.4-7.8*** 2.3 1.0-5.1* 2.5 1.2-5.1* 1.7 0.8-3.9BirthatlevelIIorlevelIhospital 2.3 1.6-3.4*** 1.8 1.1-2.9* 3.4 2.1-5.3*** 2.6 1.2-5.3* 1.3 0.8-2.2 1.2 0.6-2.3Cesareansection - - - - 0.2 0.1-0.3*** 0.4 0.2-0.9* 0.9 0.6-1.3 - -Antenatalantibiotics - - - - 1.2 0.8-2.0 - - 0.6 0.4-0.9* 0.8 0.5-1.3Antenatalcorticosteroids - - - - 0.1 0.1-0.2*** 0.3 0.1-0.6** 0.3 0.2-0.6*** 0.3 0.2-0.8**Tocolysis§ - - - - 0.3 0.2-0.5*** 0.8 0.3-1.9 0.4 0.2-0.8* 0.6 0.3-1.2 Newborncharacteristics Malegender(vs.female) 1.0 0.7-1.5 - - 1.0 0.6-1.5 - - 1.1 0.7-1.7 - -Birthweight(100gincrement) 0.4 0.4-0.5*** Notincluded 0.6 0.5-0.6*** Notincluded 0.7 0.6-0.8*** NotincludedSGA 2.1 1.4-3.3*** Notincluded 0.5 0.3-1.1 Notincluded 1.6 0.9-2.6 NotincludedApgarscore<4atoneminute - - - - 13.2 7.8-22.3*** Notincluded 1.6 1.0-2.6* NotincludedApgarscore<4atfiveminute - - - - 50.4 28.2-90.2*** Notincluded 1.4 0.7-2.9 Notincluded
Källén et al.
5
Table3(continued). CRIBscore>10 - - - - - - - - 2.6 1.5-4.5*** NotincludedCRIBscore(continuous),one-stepincrement
-
-
-
-
-
-
-
- 1.2 1.1-1.3***
Notincluded
OR: Odds ratio; 95%CI: 95% confidence interval; GA: gestational age; SD: standard deviation of birth weight according to the Swedish standard curve for intrauterine growth;7 PPROM: preterm prelabour rupture of membranes; SGA: small-for-gestational age, i.e. birth weight below the mean -2SD of the standard7. ***: p<0.001; **: p<0.01; *: p<0.05. §Only cases with spontaneous preterm labour.
Källén et al.
6
Table 4. Factors associated with outcome at 2.5 years of corrected age. Results from univariate analyses and multiple logistic regression analyses adjusting for
gestational age. Children who were not evaluated at 2.5 years were excluded.
Neuro-sensoryimpairmentA
MentaldevelopmentaldelayB
AnymoderateorseveredisabilityC
N=34/456(7.5%)
N=88/440(20%) N=124/456(27.2%)
N
%
ORcrude
OR95%CIadjustedD
%
ORcrude
OR95%CIadjustedD
%
ORcrude
OR95%CIadjustedD
GA,one-weekincrement
0.6**
0.6***
0.6***
SD(birthweight),one-stepincrement
1.0 0.9 0.7-1.3
0.8 0.8** 0.6-0.9
1.0 0.9 0.7-1.0
Preeclampsia/Essentialhypertension 62
6.5 0.8 1.0 0.3-3.0 16.7 0.8 1.0 0.5-2.0 25.8 0.9 1.1 0.6-2.1
Chorioamnionitis/PPROM 112
6.2 0.7 0.8 0.3-2.0 18.3 0.8 0.9 0.5-1.7 25.0 0.7 0.8 0.5-1.5
Abruptionofplacenta 67
4.5 0.5 0.6 0.2-1.9 15.4 0.7 0.7 0.4-1.5 23.9 0.8 0.9 0.5-1.6
Multiplebirth 86
5.8 0.7 0.8 0.3-2.1 24.7 1.4 1.5 0.8-2.7 31.4 1.3 1.4 0.8-2.4
Breech/vaginaldelivery 29/202
17.2 3.5* 2.4 0.7-8.7 46.4 4.5*** 2.0* 1.2-7.4 55.2 3.6** 2.1 0.9-5.1
BirthatlevelIIorlevelIhospital 77
6.9 1.6 1.9 0.8-4.4 18.6 0.9 1.1 0.5-2.1 27.4 0.9 1.1 0.6-1.9
Cesareansection 254
7.5 1.0 1.5 0.7-3.2 19.4 0.9 1.3 0.8-2.2 25.2 0.8 1.1 0.7-1.8
Antenatalantibiotics 252
7.9 1.1 1.0 0.5-2.1 19.4 0.9 0.8 0.5-1.3 28.6 1.1 1.0 0.6-1.6
Antenatalcorticosteroids 411
7.5 1.0 1.1 0.3-4.8 20.0 0.7 0.7 0.3-1.9 27.7 1.1 1.2 0.5-2.9
Tocolysis§ 256/325
8.2 1.0 1.0 0.3-2.7 20.5 0.9 0.9 0.4-1.8 29.3 1.0 0.9 0.5-1.8
Källén et al.
7
Table4(continued). Malegender 248
8.9 1.6 1.7 0.8-3.5 24.2 1.8* 2.0** 1.2-3.3 31.0 1.6* 1.7* 1.1-2.6
Birthweight,100gincrement
0.8*
1.0
0.7-1.3
0.7***
0.8**
0.6-0.9
0.7***
0.9
0.7-1.0
SGA
73
6.8
0.9
1.1
0.4-3.0
22.2
1.2
1.5
0.8-2.8
27.4
1.0
1.3
0.7-2.3
Apgarscore<4atoneminute
109
7.3
1.0
0.9
0.4-2.0
28.6
1.9*
1.7*
1.0-2.8
36.7
1.8*
1.6*
1.0-2.6
Apgarscore<4atfiveminutes
33
3.0
0.4
0.3
0.0-2.7
30.3
1.8
1.8
0.8-3.9
36.4
1.6
1.5
0.7-3.3
Apgarscore<7atfiveminutes
149
6.7
0.8
0.8
0.3-1.6
29.5
2.3***
2.1**
1.3-3.5
36.9
2.0**
1.9**
1.2-2.9
CRIBscore>10 42
23.8 5.1*** 3.7** 1.6-8.9 50.0 4.8*** 3.5*** 1.7-7.2 61.9 5.2*** 3.7*** 1.8-7.3
CRIBscore(continuous),one-stepincrement
1.2***
1.2*
1.0-1.3
1.2***
1.2***
1.1-1.3
1.2***
1.1***
1.1-1.2
AModerate or severe impairment regarding vision, hearing, or cerebral palsy (CP); BMDD: mental developmental delay = cognitive or language Bayley III scale <
mean-2SD, or moderate/severe developmental delay according to chart review; Cvisual or hearing impairment, CP, low Bayley-III composite cognitive, language or
motor score or moderate/severe developmental delay according to chart review; DAdjusted for gestational age (continuous, linear). OR: Odds ratio; 95% CI: 95%
confidence interval; GA: gestational age; SD (birth weight): standard deviation of birth weight according to the Swedish standard curve for intrauterine growth7;
PPROM: preterm prelabour rupture of membranes; SGA: small-for-gestational age (birthweight below the mean -2SD of the standard); CRIB: clinical risk index
for babies. ***: p<0.001; **: p<0.01; *: p<0.05. §Only cases with spontaneous preterm labour.
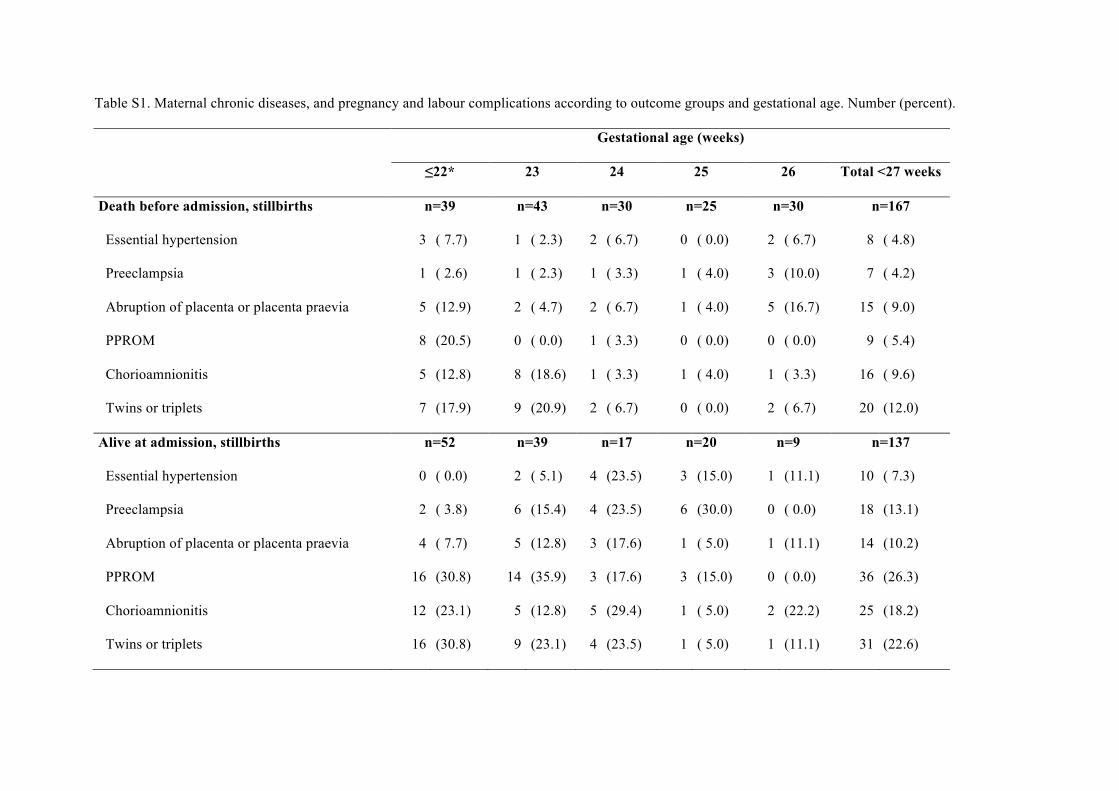
Table S1. Maternal chronic diseases, and pregnancy and labour complications according to outcome groups and gestational age. Number (percent).
Gestational age (weeks)
≤22* 23 24 25 26 Total <27 weeks
Death before admission, stillbirths n=39 n=43 n=30 n=25 n=30 n=167
Essential hypertension 3 ( 7.7) 1 ( 2.3) 2 ( 6.7) 0 ( 0.0) 2 ( 6.7) 8 ( 4.8)
Preeclampsia 1 ( 2.6) 1 ( 2.3) 1 ( 3.3) 1 ( 4.0) 3 (10.0) 7 ( 4.2)
Abruption of placenta or placenta praevia 5 (12.9) 2 ( 4.7) 2 ( 6.7) 1 ( 4.0) 5 (16.7) 15 ( 9.0)
PPROM 8 (20.5) 0 ( 0.0) 1 ( 3.3) 0 ( 0.0) 0 ( 0.0) 9 ( 5.4)
Chorioamnionitis 5 (12.8) 8 (18.6) 1 ( 3.3) 1 ( 4.0) 1 ( 3.3) 16 ( 9.6)
Twins or triplets 7 (17.9) 9 (20.9) 2 ( 6.7) 0 ( 0.0) 2 ( 6.7) 20 (12.0)
Alive at admission, stillbirths n=52 n=39 n=17 n=20 n=9 n=137
Essential hypertension 0 ( 0.0) 2 ( 5.1) 4 (23.5) 3 (15.0) 1 (11.1) 10 ( 7.3)
Preeclampsia 2 ( 3.8) 6 (15.4) 4 (23.5) 6 (30.0) 0 ( 0.0) 18 (13.1)
Abruption of placenta or placenta praevia 4 ( 7.7) 5 (12.8) 3 (17.6) 1 ( 5.0) 1 (11.1) 14 (10.2)
PPROM 16 (30.8) 14 (35.9) 3 (17.6) 3 (15.0) 0 ( 0.0) 36 (26.3)
Chorioamnionitis 12 (23.1) 5 (12.8) 5 (29.4) 1 ( 5.0) 2 (22.2) 25 (18.2)
Twins or triplets 16 (30.8) 9 (23.1) 4 (23.5) 1 ( 5.0) 1 (11.1) 31 (22.6)
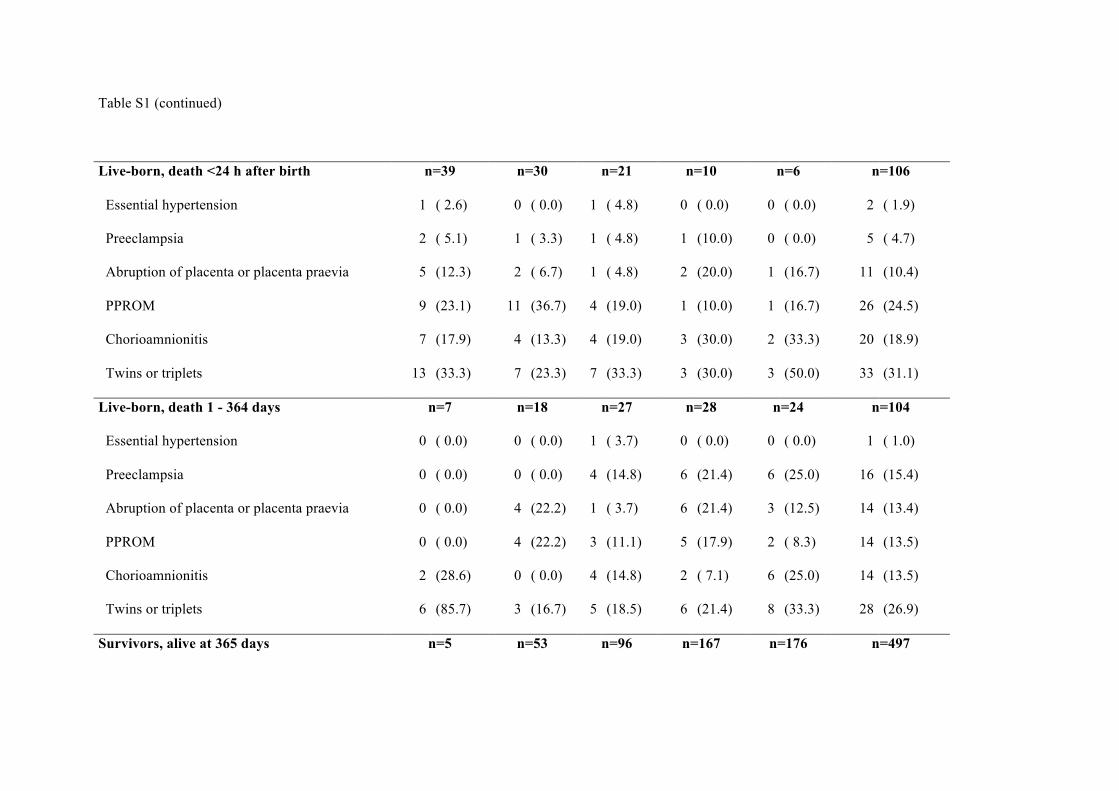
Table S1 (continued)
Live-born, death <24 h after birth n=39 n=30 n=21 n=10 n=6 n=106
Essential hypertension 1 ( 2.6) 0 ( 0.0) 1 ( 4.8) 0 ( 0.0) 0 ( 0.0) 2 ( 1.9)
Preeclampsia 2 ( 5.1) 1 ( 3.3) 1 ( 4.8) 1 (10.0) 0 ( 0.0) 5 ( 4.7)
Abruption of placenta or placenta praevia 5 (12.3) 2 ( 6.7) 1 ( 4.8) 2 (20.0) 1 (16.7) 11 (10.4)
PPROM 9 (23.1) 11 (36.7) 4 (19.0) 1 (10.0) 1 (16.7) 26 (24.5)
Chorioamnionitis 7 (17.9) 4 (13.3) 4 (19.0) 3 (30.0) 2 (33.3) 20 (18.9)
Twins or triplets 13 (33.3) 7 (23.3) 7 (33.3) 3 (30.0) 3 (50.0) 33 (31.1)
Live-born, death 1 - 364 days n=7 n=18 n=27 n=28 n=24 n=104
Essential hypertension 0 ( 0.0) 0 ( 0.0) 1 ( 3.7) 0 ( 0.0) 0 ( 0.0) 1 ( 1.0)
Preeclampsia 0 ( 0.0) 0 ( 0.0) 4 (14.8) 6 (21.4) 6 (25.0) 16 (15.4)
Abruption of placenta or placenta praevia 0 ( 0.0) 4 (22.2) 1 ( 3.7) 6 (21.4) 3 (12.5) 14 (13.4)
PPROM 0 ( 0.0) 4 (22.2) 3 (11.1) 5 (17.9) 2 ( 8.3) 14 (13.5)
Chorioamnionitis 2 (28.6) 0 ( 0.0) 4 (14.8) 2 ( 7.1) 6 (25.0) 14 (13.5)
Twins or triplets 6 (85.7) 3 (16.7) 5 (18.5) 6 (21.4) 8 (33.3) 28 (26.9)
Survivors, alive at 365 days n=5 n=53 n=96 n=167 n=176 n=497
Table S1 (continued)
Essential hypertension 0 ( 0.0) 0 ( 0.0) 5 ( 5.2) 10 ( 6.0) 6 ( 3.4) 21 ( 4.2)
Preeclampsia 0 ( 0.0) 4 ( 7.5) 7 ( 7.3) 23 (13.8) 30 (17.0) 64 (12.9)
Abruption of placenta or placenta praevia 0 ( 0.0) 5 ( 9.5) 11 (11.5) 24 (14.4) 31 (27.5) 71 (13.3)
PPROM 0 ( 0.0) 7 (13.2) 8 ( 8.3) 25 (15.0) 23 (13.1) 63 (12.7)
Chorioamnionitis 1 (20.0) 7 (13.2) 17 (17.7) 33 (19.8) 22 (12.5) 80 (16.1)
Other specified diseases and complications 0 ( 0.0) 3 ( 5.7) 3 ( 3.1) 6 ( 3.6) 10 ( 5.7) 22 ( 4.4)
Twins or triplets 2 (40.0) 6 (11.3) 20 (20.8) 29 (17.4) 40 (22.7) 97 (19.5)
*Includes 2 infants born alive at 21+5 and 21+6 (weeks+days), respectively; PPROM: preterm prelabour rupture of membranes.
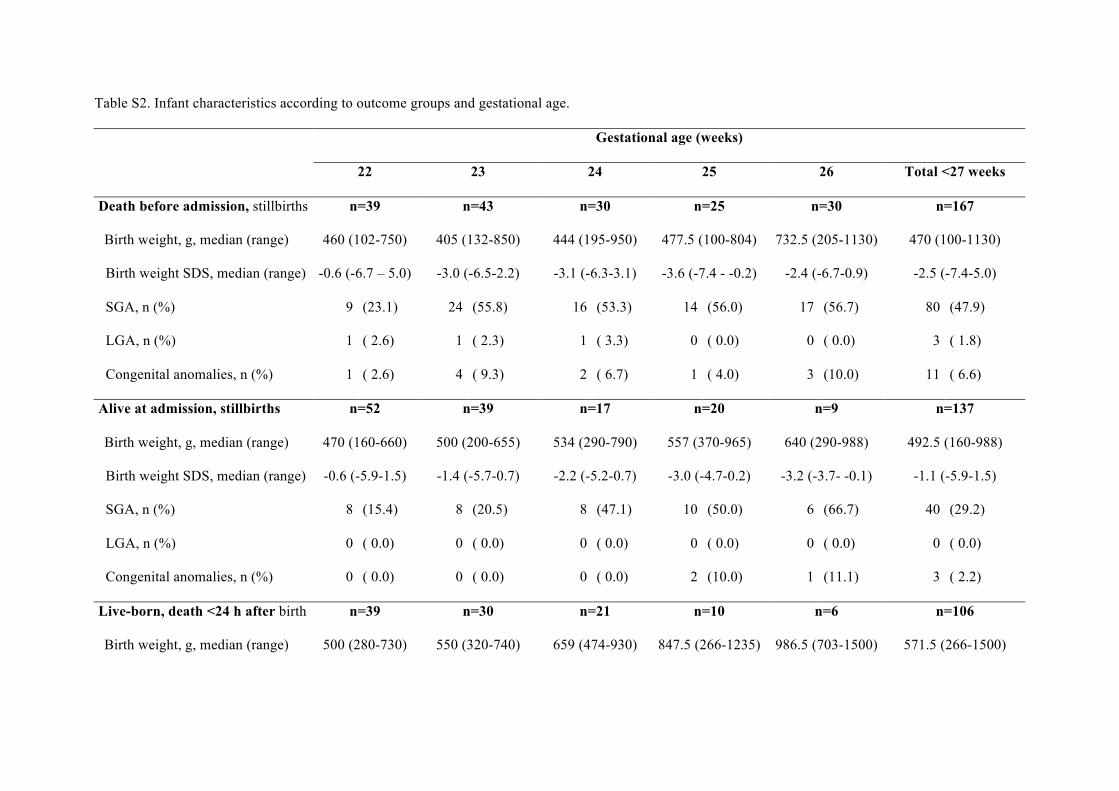
Table S2. Infant characteristics according to outcome groups and gestational age.
Gestational age (weeks)
22 23 24 25 26 Total <27 weeks
Death before admission, stillbirths n=39 n=43 n=30 n=25 n=30 n=167
Birth weight, g, median (range) 460 (102-750) 405 (132-850) 444 (195-950) 477.5 (100-804) 732.5 (205-1130) 470 (100-1130)
Birth weight SDS, median (range) -0.6 (-6.7 – 5.0) -3.0 (-6.5-2.2) -3.1 (-6.3-3.1) -3.6 (-7.4 - -0.2) -2.4 (-6.7-0.9) -2.5 (-7.4-5.0)
SGA, n (%) 9 (23.1) 24 (55.8) 16 (53.3) 14 (56.0) 17 (56.7) 80 (47.9)
LGA, n (%) 1 ( 2.6) 1 ( 2.3) 1 ( 3.3) 0 ( 0.0) 0 ( 0.0) 3 ( 1.8)
Congenital anomalies, n (%) 1 ( 2.6) 4 ( 9.3) 2 ( 6.7) 1 ( 4.0) 3 (10.0) 11 ( 6.6)
Alive at admission, stillbirths n=52 n=39 n=17 n=20 n=9 n=137
Birth weight, g, median (range) 470 (160-660) 500 (200-655) 534 (290-790) 557 (370-965) 640 (290-988) 492.5 (160-988)
Birth weight SDS, median (range) -0.6 (-5.9-1.5) -1.4 (-5.7-0.7) -2.2 (-5.2-0.7) -3.0 (-4.7-0.2) -3.2 (-3.7- -0.1) -1.1 (-5.9-1.5)
SGA, n (%) 8 (15.4) 8 (20.5) 8 (47.1) 10 (50.0) 6 (66.7) 40 (29.2)
LGA, n (%) 0 ( 0.0) 0 ( 0.0) 0 ( 0.0) 0 ( 0.0) 0 ( 0.0) 0 ( 0.0)
Congenital anomalies, n (%) 0 ( 0.0) 0 ( 0.0) 0 ( 0.0) 2 (10.0) 1 (11.1) 3 ( 2.2)
Live-born, death <24 h after birth n=39 n=30 n=21 n=10 n=6 n=106
Birth weight, g, median (range) 500 (280-730) 550 (320-740) 659 (474-930) 847.5 (266-1235) 986.5 (703-1500) 571.5 (266-1500)
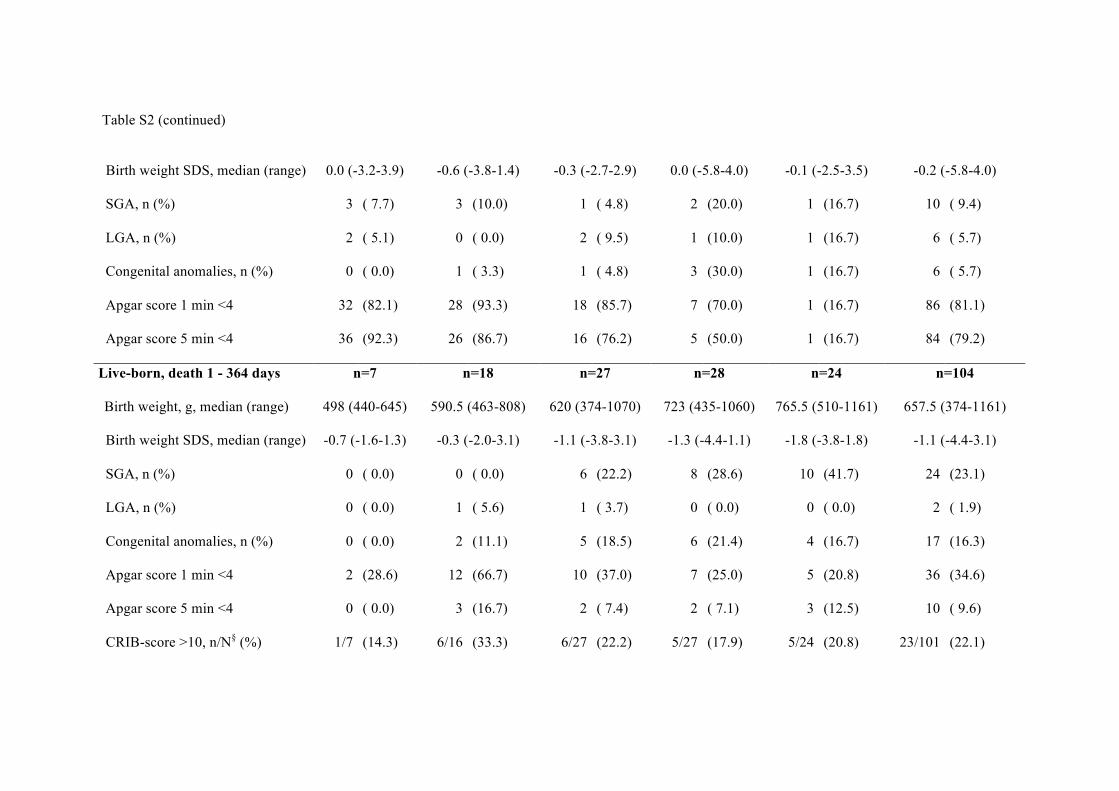
Table S2 (continued)
Birth weight SDS, median (range)
0.0 (-3.2-3.9) -0.6 (-3.8-1.4) -0.3 (-2.7-2.9) 0.0 (-5.8-4.0) -0.1 (-2.5-3.5) -0.2 (-5.8-4.0)
SGA, n (%) 3 ( 7.7) 3 (10.0) 1 ( 4.8) 2 (20.0) 1 (16.7) 10 ( 9.4)
LGA, n (%) 2 ( 5.1) 0 ( 0.0) 2 ( 9.5) 1 (10.0) 1 (16.7) 6 ( 5.7)
Congenital anomalies, n (%) 0 ( 0.0) 1 ( 3.3) 1 ( 4.8) 3 (30.0) 1 (16.7) 6 ( 5.7)
Apgar score 1 min <4 32 (82.1) 28 (93.3) 18 (85.7) 7 (70.0) 1 (16.7) 86 (81.1)
Apgar score 5 min <4 36 (92.3) 26 (86.7) 16 (76.2) 5 (50.0) 1 (16.7) 84 (79.2)
Live-born, death 1 - 364 days n=7 n=18 n=27 n=28 n=24 n=104
Birth weight, g, median (range) 498 (440-645) 590.5 (463-808) 620 (374-1070) 723 (435-1060) 765.5 (510-1161) 657.5 (374-1161)
Birth weight SDS, median (range) -0.7 (-1.6-1.3) -0.3 (-2.0-3.1) -1.1 (-3.8-3.1) -1.3 (-4.4-1.1) -1.8 (-3.8-1.8) -1.1 (-4.4-3.1)
SGA, n (%) 0 ( 0.0) 0 ( 0.0) 6 (22.2) 8 (28.6) 10 (41.7) 24 (23.1)
LGA, n (%) 0 ( 0.0) 1 ( 5.6) 1 ( 3.7) 0 ( 0.0) 0 ( 0.0) 2 ( 1.9)
Congenital anomalies, n (%) 0 ( 0.0) 2 (11.1) 5 (18.5) 6 (21.4) 4 (16.7) 17 (16.3)
Apgar score 1 min <4 2 (28.6) 12 (66.7) 10 (37.0) 7 (25.0) 5 (20.8) 36 (34.6)
Apgar score 5 min <4 0 ( 0.0) 3 (16.7) 2 ( 7.4) 2 ( 7.1) 3 (12.5) 10 ( 9.6)
CRIB-score >10, n/N§ (%)
1/7 (14.3) 6/16 (33.3) 6/27 (22.2) 5/27 (17.9) 5/24 (20.8) 23/101 (22.1)
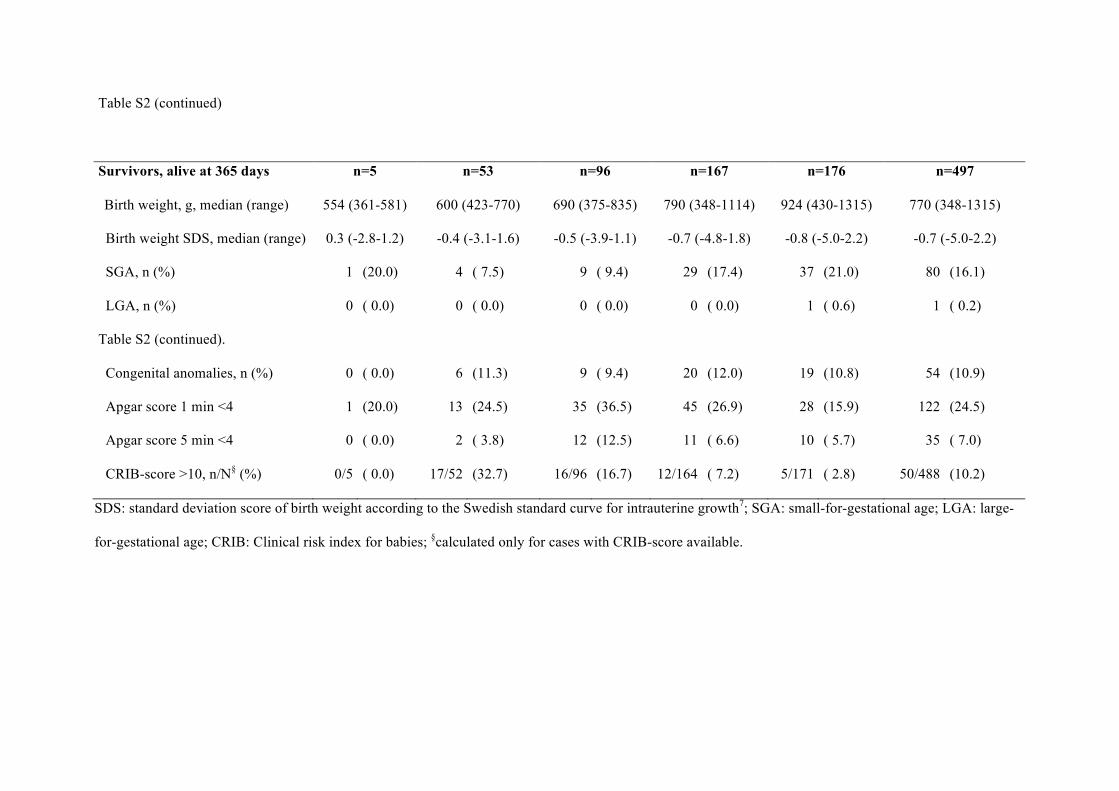
Table S2 (continued)
Survivors, alive at 365 days n=5 n=53 n=96 n=167 n=176 n=497
Birth weight, g, median (range) 554 (361-581) 600 (423-770) 690 (375-835) 790 (348-1114) 924 (430-1315) 770 (348-1315)
Birth weight SDS, median (range) 0.3 (-2.8-1.2) -0.4 (-3.1-1.6) -0.5 (-3.9-1.1) -0.7 (-4.8-1.8) -0.8 (-5.0-2.2) -0.7 (-5.0-2.2)
SGA, n (%) 1 (20.0) 4 ( 7.5) 9 ( 9.4) 29 (17.4) 37 (21.0) 80 (16.1)
LGA, n (%) 0 ( 0.0) 0 ( 0.0) 0 ( 0.0) 0 ( 0.0) 1 ( 0.6) 1 ( 0.2)
Table S2 (continued).
Congenital anomalies, n (%) 0 ( 0.0) 6 (11.3) 9 ( 9.4) 20 (12.0) 19 (10.8) 54 (10.9)
Apgar score 1 min <4 1 (20.0) 13 (24.5) 35 (36.5) 45 (26.9) 28 (15.9) 122 (24.5)
Apgar score 5 min <4 0 ( 0.0) 2 ( 3.8) 12 (12.5) 11 ( 6.6) 10 ( 5.7) 35 ( 7.0)
CRIB-score >10, n/N§ (%) 0/5 ( 0.0) 17/52 (32.7) 16/96 (16.7) 12/164 ( 7.2) 5/171 ( 2.8) 50/488 (10.2)
SDS: standard deviation score of birth weight according to the Swedish standard curve for intrauterine growth7; SGA: small-for-gestational age; LGA: large-
for-gestational age; CRIB: Clinical risk index for babies; §calculated only for cases with CRIB-score available.
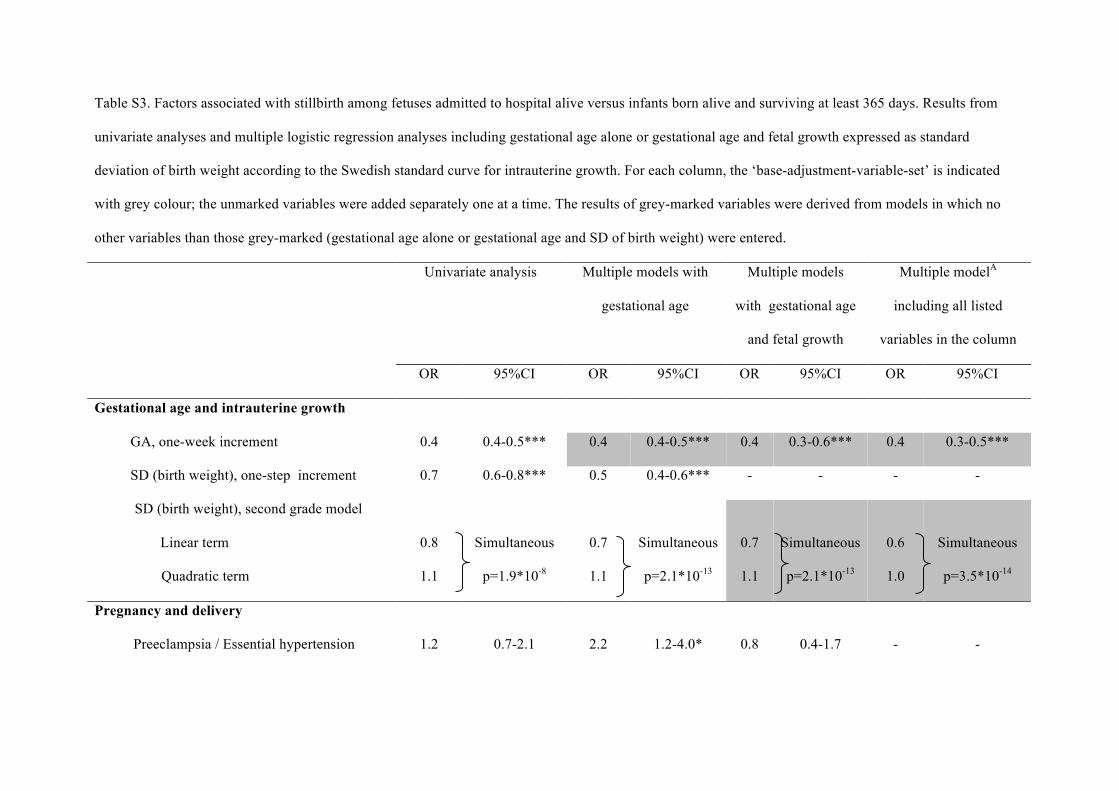
Table S3. Factors associated with stillbirth among fetuses admitted to hospital alive versus infants born alive and surviving at least 365 days. Results from
univariate analyses and multiple logistic regression analyses including gestational age alone or gestational age and fetal growth expressed as standard
deviation of birth weight according to the Swedish standard curve for intrauterine growth. For each column, the ‘base-adjustment-variable-set’ is indicated
with grey colour; the unmarked variables were added separately one at a time. The results of grey-marked variables were derived from models in which no
other variables than those grey-marked (gestational age alone or gestational age and SD of birth weight) were entered.
Univariate analysis Multiple models with
gestational age
Multiple models
with gestational age
and fetal growth
Multiple modelA
including all listed
variables in the column
OR 95%CI OR 95%CI OR 95%CI OR 95%CI
Gestational age and intrauterine growth
GA, one-week increment 0.4 0.4-0.5*** 0.4 0.4-0.5*** 0.4 0.3-0.6*** 0.4 0.3-0.5***
SD (birth weight), one-step increment 0.7 0.6-0.8*** 0.5 0.4-0.6*** - - - -
SD (birth weight), second grade model
Linear term
Quadratic term
0.8
1.1
Simultaneous
p=1.9*10-8
0.7
1.1
Simultaneous
p=2.1*10-13
0.7
1.1
Simultaneous
p=2.1*10-13
0.6
1.0
Simultaneous
p=3.5*10-14
Pregnancy and delivery
Preeclampsia / Essential hypertension 1.2 0.7-2.1 2.2 1.2-4.0* 0.8 0.4-1.7 - -
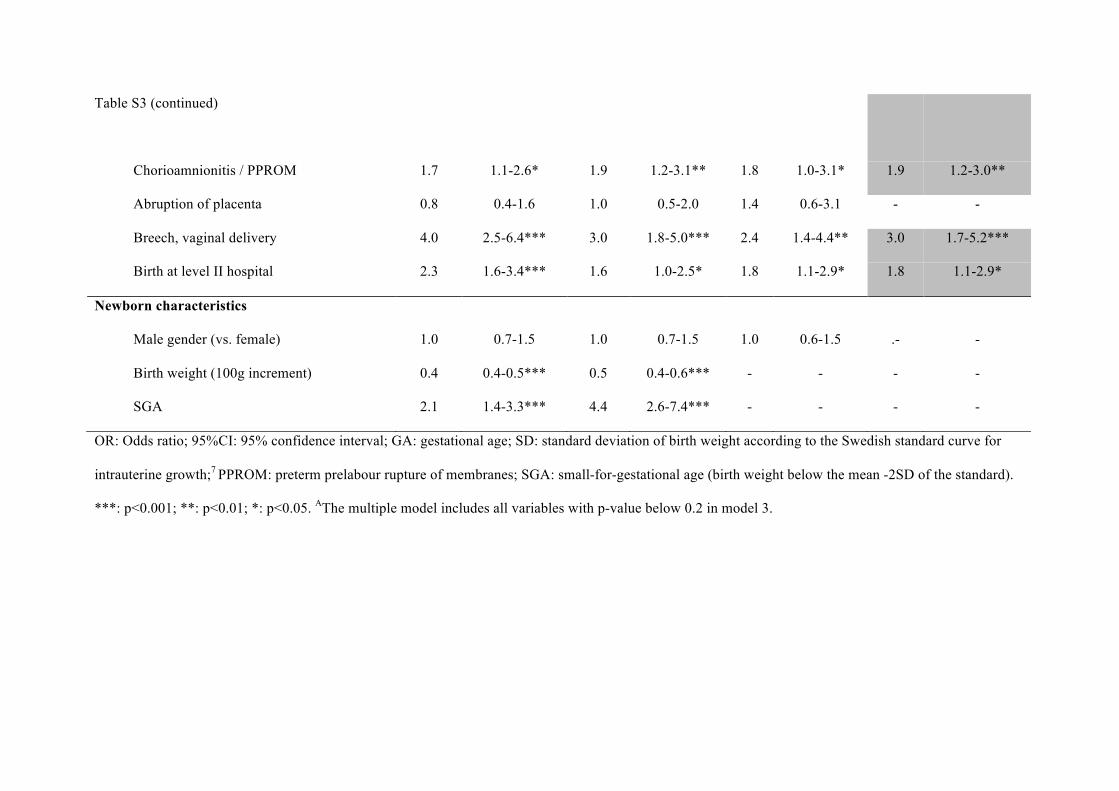
Table S3 (continued)
Chorioamnionitis / PPROM 1.7 1.1-2.6* 1.9 1.2-3.1** 1.8 1.0-3.1* 1.9 1.2-3.0**
Abruption of placenta 0.8 0.4-1.6 1.0 0.5-2.0 1.4 0.6-3.1 - -
Breech, vaginal delivery 4.0 2.5-6.4*** 3.0 1.8-5.0*** 2.4 1.4-4.4** 3.0 1.7-5.2***
Birth at level II hospital 2.3 1.6-3.4*** 1.6 1.0-2.5* 1.8 1.1-2.9* 1.8 1.1-2.9*
Newborn characteristics
Male gender (vs. female) 1.0 0.7-1.5 1.0 0.7-1.5 1.0 0.6-1.5 .- -
Birth weight (100g increment) 0.4 0.4-0.5*** 0.5 0.4-0.6*** - - - -
SGA 2.1 1.4-3.3*** 4.4 2.6-7.4*** - - - -
OR: Odds ratio; 95%CI: 95% confidence interval; GA: gestational age; SD: standard deviation of birth weight according to the Swedish standard curve for
intrauterine growth;7 PPROM: preterm prelabour rupture of membranes; SGA: small-for-gestational age (birth weight below the mean -2SD of the standard).
***: p<0.001; **: p<0.01; *: p<0.05. AThe multiple model includes all variables with p-value below 0.2 in model 3.
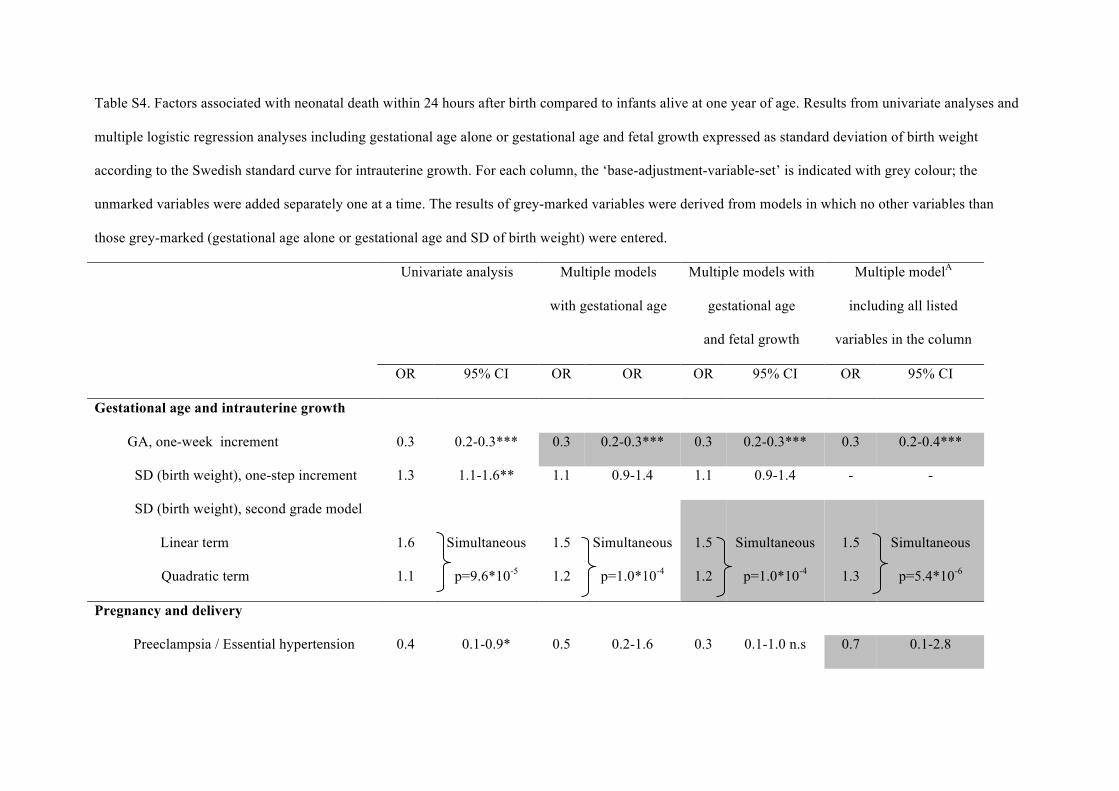
Table S4. Factors associated with neonatal death within 24 hours after birth compared to infants alive at one year of age. Results from univariate analyses and
multiple logistic regression analyses including gestational age alone or gestational age and fetal growth expressed as standard deviation of birth weight
according to the Swedish standard curve for intrauterine growth. For each column, the ‘base-adjustment-variable-set’ is indicated with grey colour; the
unmarked variables were added separately one at a time. The results of grey-marked variables were derived from models in which no other variables than
those grey-marked (gestational age alone or gestational age and SD of birth weight) were entered.
Univariate analysis Multiple models
with gestational age
Multiple models with
gestational age
and fetal growth
Multiple modelA
including all listed
variables in the column
OR 95% CI OR OR OR 95% CI OR 95% CI
Gestational age and intrauterine growth
GA, one-week increment 0.3 0.2-0.3*** 0.3 0.2-0.3*** 0.3 0.2-0.3*** 0.3 0.2-0.4***
SD (birth weight), one-step increment 1.3 1.1-1.6** 1.1 0.9-1.4 1.1 0.9-1.4 - -
SD (birth weight), second grade model
Linear term
Quadratic term
1.6
1.1
Simultaneous
p=9.6*10-5
1.5
1.2
Simultaneous
p=1.0*10-4
1.5
1.2
Simultaneous
p=1.0*10-4
1.5
1.3
Simultaneous
p=5.4*10-6
Pregnancy and delivery
Preeclampsia / Essential hypertension 0.4 0.1-0.9* 0.5 0.2-1.6 0.3 0.1-1.0 n.s 0.7 0.1-2.8
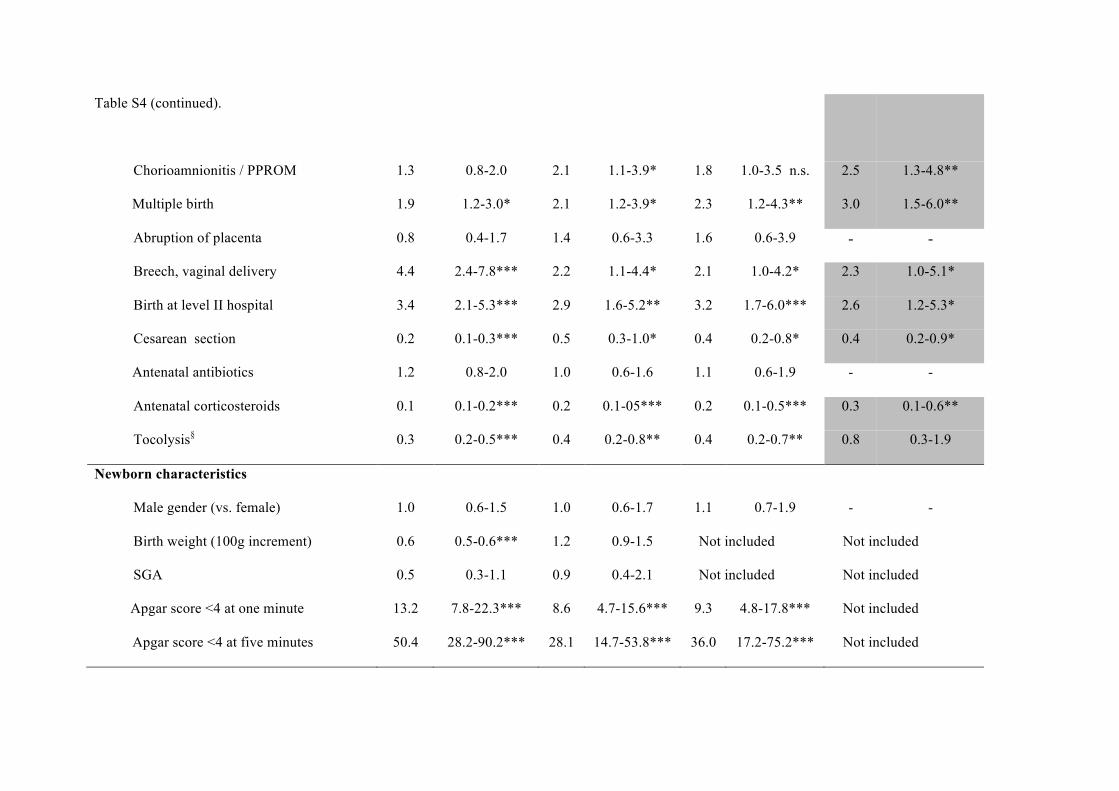
Table S4 (continued).
Chorioamnionitis / PPROM 1.3 0.8-2.0 2.1 1.1-3.9* 1.8 1.0-3.5 n.s. 2.5 1.3-4.8**
Multiple birth 1.9 1.2-3.0* 2.1 1.2-3.9* 2.3 1.2-4.3** 3.0 1.5-6.0**
Abruption of placenta 0.8 0.4-1.7 1.4 0.6-3.3 1.6 0.6-3.9 - -
Breech, vaginal delivery 4.4 2.4-7.8*** 2.2 1.1-4.4* 2.1 1.0-4.2* 2.3 1.0-5.1*
Birth at level II hospital 3.4 2.1-5.3*** 2.9 1.6-5.2** 3.2 1.7-6.0*** 2.6 1.2-5.3*
Cesarean section 0.2 0.1-0.3*** 0.5 0.3-1.0* 0.4 0.2-0.8* 0.4 0.2-0.9*
Antenatal antibiotics 1.2 0.8-2.0 1.0 0.6-1.6 1.1 0.6-1.9 - -
Antenatal corticosteroids 0.1 0.1-0.2*** 0.2 0.1-05*** 0.2 0.1-0.5*** 0.3 0.1-0.6**
Tocolysis§ 0.3 0.2-0.5*** 0.4 0.2-0.8** 0.4 0.2-0.7** 0.8 0.3-1.9
Newborn characteristics
Male gender (vs. female) 1.0 0.6-1.5 1.0 0.6-1.7 1.1 0.7-1.9 - -
Birth weight (100g increment) 0.6 0.5-0.6*** 1.2 0.9-1.5 Not included Not included
SGA 0.5 0.3-1.1 0.9 0.4-2.1 Not included Not included
Apgar score <4 at one minute 13.2 7.8-22.3*** 8.6 4.7-15.6*** 9.3 4.8-17.8*** Not included
Apgar score <4 at five minutes 50.4 28.2-90.2*** 28.1 14.7-53.8*** 36.0 17.2-75.2*** Not included

Table S4 (continued)
§Only cases with spontaneous preterm labour. OR: Odds ratio; 95%CI: 95% confidence interval; GA: gestational age; SD: standard deviation of birth weight
according to the Swedish standard curve for intrauterine growth;7 PPROM: preterm prelabour rupture of membranes; SGA: small-for-gestational age
(birthweight below the mean -2SD of the standard). ***: p<0.001; **: p<0.01; *: p<0.05; n.s.: non-significant. AThe multiple model includes all variables with
p-value below 0.2 in model 3 (with exception of Apgar score which was considered to be an intermediate variable).
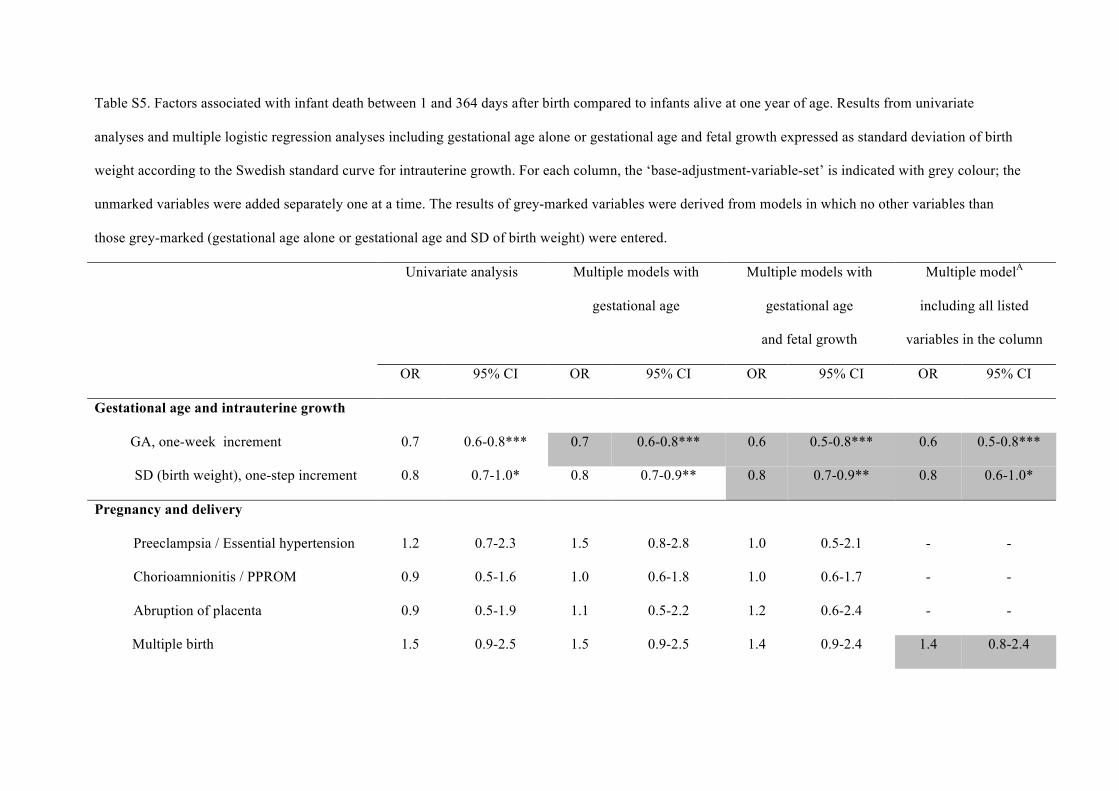
Table S5. Factors associated with infant death between 1 and 364 days after birth compared to infants alive at one year of age. Results from univariate
analyses and multiple logistic regression analyses including gestational age alone or gestational age and fetal growth expressed as standard deviation of birth
weight according to the Swedish standard curve for intrauterine growth. For each column, the ‘base-adjustment-variable-set’ is indicated with grey colour; the
unmarked variables were added separately one at a time. The results of grey-marked variables were derived from models in which no other variables than
those grey-marked (gestational age alone or gestational age and SD of birth weight) were entered.
Univariate analysis Multiple models with
gestational age
Multiple models with
gestational age
and fetal growth
Multiple modelA
including all listed
variables in the column
OR 95% CI OR 95% CI OR 95% CI OR 95% CI
Gestational age and intrauterine growth
GA, one-week increment 0.7 0.6-0.8*** 0.7 0.6-0.8*** 0.6 0.5-0.8*** 0.6 0.5-0.8***
SD (birth weight), one-step increment 0.8 0.7-1.0* 0.8 0.7-0.9** 0.8 0.7-0.9** 0.8 0.6-1.0*
Pregnancy and delivery
Preeclampsia / Essential hypertension 1.2 0.7-2.3 1.5 0.8-2.8 1.0 0.5-2.1 - -
Chorioamnionitis / PPROM 0.9 0.5-1.6 1.0 0.6-1.8 1.0 0.6-1.7 - -
Abruption of placenta 0.9 0.5-1.9 1.1 0.5-2.2 1.2 0.6-2.4 - -
Multiple birth 1.5 0.9-2.5 1.5 0.9-2.5 1.4 0.9-2.4 1.4 0.8-2.4
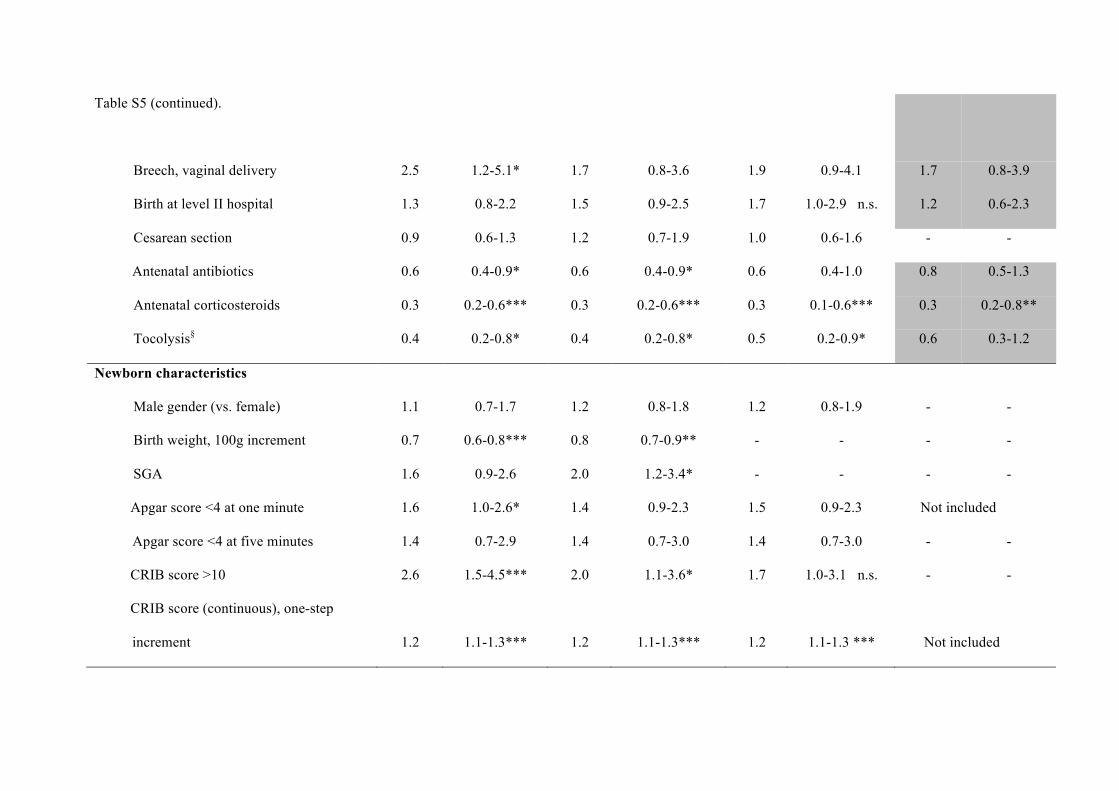
Table S5 (continued).
Breech, vaginal delivery 2.5 1.2-5.1* 1.7 0.8-3.6 1.9 0.9-4.1 1.7 0.8-3.9
Birth at level II hospital 1.3 0.8-2.2 1.5 0.9-2.5 1.7 1.0-2.9 n.s. 1.2 0.6-2.3
Cesarean section 0.9 0.6-1.3 1.2 0.7-1.9 1.0 0.6-1.6 - -
Antenatal antibiotics 0.6 0.4-0.9* 0.6 0.4-0.9* 0.6 0.4-1.0 0.8 0.5-1.3
Antenatal corticosteroids 0.3 0.2-0.6*** 0.3 0.2-0.6*** 0.3 0.1-0.6*** 0.3 0.2-0.8**
Tocolysis§ 0.4 0.2-0.8* 0.4 0.2-0.8* 0.5 0.2-0.9* 0.6 0.3-1.2
Newborn characteristics
Male gender (vs. female) 1.1 0.7-1.7 1.2 0.8-1.8 1.2 0.8-1.9 - -
Birth weight, 100g increment 0.7 0.6-0.8*** 0.8 0.7-0.9** - - - -
SGA 1.6 0.9-2.6 2.0 1.2-3.4* - - - -
Apgar score <4 at one minute 1.6 1.0-2.6* 1.4 0.9-2.3 1.5 0.9-2.3 Not included
Apgar score <4 at five minutes 1.4 0.7-2.9 1.4 0.7-3.0 1.4 0.7-3.0 - -
CRIB score >10 2.6 1.5-4.5*** 2.0 1.1-3.6* 1.7 1.0-3.1 n.s. - -
CRIB score (continuous), one-step
increment 1.2 1.1-1.3*** 1.2 1.1-1.3*** 1.2 1.1-1.3 ***
Not included
Table S5 (continued)
§Only cases with spontaneous preterm labour. OR: Odds ratio; 95%CI: 95% confidence interval; GA: gestational age; SD: standard deviation of birth weight
according to the Swedish standard curve for intrauterine growth;7 PPROM: preterm prelabour rupture of membranes; SGA: small-for-gestational age (birth
weight below the mean -2SD of the standard); CRIB: clinical risk index for babies. ***: p<0.001; **: p<0.01; *: p<0.05; n.s.: non-significant. . AThe multiple
model includes all variables with p-value below 0.2 in model 3 (with exception of Apgar score or CRIB score which were considered to be intermediate
variables).


![Evidence-Based Obstetric Anesthesia: An Update on ...cdn.intechopen.com/pdfs/37215.pdf · Evidence-Based Obstetric Anesthesia: An Update on Anesthesia for Cesarean Delivery 71 [6]](https://img.pdfslide.net/doc/110x75/5d4f1fe388c993790d8baf75/evidence-based-obstetric-anesthesia-an-update-on-cdn-evidence-based-obstetric.jpg)