Embed Size (px)
Citation preview

1
Impact of regional trade agreements on commodity trade between China and Australia
Tianshu Liu, Xuean Jiao*
May 2006
Abstract This paper aims to analyse the impact of current regional trade agreements on commodity trade
between China and Australia. The paper estimates data from 1992-2004, using China’s commodity
exports and imports to and from Australia as dependent variables to do a partial equilibrium
analysis. Economic variables that explain the economic condition in China are estimated.
Additional dummy variables that are related with China’s membership in a regional trade
agreement are introduced as dummy variables into the model. The regional trade agreements of
EU, NAFTA, CER, ASEAN and APEC are estimated in the model. The results show that the
inception of a regional trade agreement, especially NAFTA and APEC, has affected China’s
commodity trade with Australia to some extent.
Key words: Regional trade agreements, commodity trade, partial equilibrium analysis
* Tianshu Liu: School of Economics, Finance and Marketing, RMIT University, Melbourne, Australia. E-mail: [email protected] Xuean Jiao: School of Marketing, Monash University, Melbourne, Australia. E-mail: [email protected]

2
1. Introduction Since the beginning of the twenty-first century many countries has tended to pursue regional or
bilateral trade and economic cooperation with their major trading partners. China and Australia are
also involved in this activity.
China has strengthened its trade and economic relationship with Australia since 1973 when the
Trade Agreement between the Government of Australia and the Government of the People’s
Republic of China was carried out (Department of Foreign Affairs and Trade and Ministry of
Commerce of China 2005). Further bilateral agreements including reciprocal encouragement and
protection of investments, cooperation in customs, agricultural products trade, sanitary and
phytosanitary regulations, services trade and energy resources have been signed and
implemented in the last thirty-two years which enhance both countries’ trade relationship. This
relationship is further improved by two countries’ commitment in regional trade and economic
development in the Asia-Pacific Economic Cooperation (APEC). With China’s accession to WTO in
December 2001, China begins to pursue multilateral preferential trade as Australia, representing a
further cooperation with Australia in the world level. Simultaneously bilateral trade and economic
relationship between both countries has achieved great success when Trade and Economic
Framework between Australia and the People’s Republic of China was signed in 2003. The
expected future success of negotiation on a bilateral free trade on the basis of this Framework will
further push two countries’ trade and economic cooperation to a summit.
As a result of the implementation of these agreements, the two way trade between China and
Australia has increased rapidly in a large amount. China’s total merchandise trade with Australia
has increased from US$1287 million in 1980 to US$8453 million in 2000, averagely increasing
12.58 percent per annum. China’s merchandise exports to Australia increase 15.78 percent
annually from US$224 million in 1980 to US$3574 million in 2001; and its merchandise imports
from Australia increase 11.80 percent per annum from US$1063 million in 1980 to US$5024 million
in 2000. 1990s is the fastest growing period for two countries’ trade, with an average annual
increase in China’s total merchandise trade, exports and imports with Australia larger than average
per annum increase of those with the world. The great success in two countries merchandise trade
improves both of them as a major trading partner to each other. In 2003 China has become
Australia’s third trading partner, second exports destination, and third imports source; and Australia
is China’s twelfth trading partner, twelfth exports destination and eleventh imports source.
It is important for both countries to make their merchandise trade a further success in the future. As
China and Australia tends to develop regional trade and economic cooperation, this paper studies
what is the impact of current regional trade agreements on merchandise trade between China and
Australia. Section 2 explains a partial equilibrium model that is studied in this paper and its
explainable variables. Section 3 explains regression results, and Section 4 concludes.

3
2. Theoretical analysis
2.1 Determined factors Several factors reflecting a country’s economic condition have been considered affecting trade
value to some extent, including gross domestic product (GDP), total population, distance between
two countries, and exchange rate changes.
As larger economies could trade more than smaller ones, trade flows are considered to be larger
between countries with higher or increased gross domestic product and per capita GDP, as
wealthier economies could produce and trade more than poorer ones. Hence GDP is a crucial
determinant of a country’s trade volume. It is considered positively impacted on trade, i.e. a large
GDP will enable China to trade more with Australia.
An increase in population is expected to reduce trade due to a large domestic market that will
enable the realization of production economies of scale. Thus population has a negative impact on
trade, which indicates that a country tends to trade inside with a large population.
Physical distance between pairs of countries is considered another crucial factor affecting trade
flows. The reason is that long distance incurred higher transportation cost will increase products’
price that reduce their competitiveness, thus has a negative impact on trade volume. Frankel (1997)
highlighted this problem in his study and discussed its impact in his model in analysing the impact
of RTAs.
A relative change in exchange rate is thought to affect a country’s import and export volumes
because it can increase or decrease commodity prices counted in either national or foreign
currency. Depreciation of a country’s currency can enable this country to export more and import
less; on the other hand, appreciation can enable a country to export less and import more.
Furthermore, exchange rate can also be utilised to analyse a third country effect, which indicates
that the competitiveness from a third country will put an additional effect on two countries’ bilateral
trade besides their economic situations (Bayoumi and Eichengreen, 1997). In this paper if the
exchange rate is getting larger, it means Renminbi is depreciated compared with U.S. Dollars.
Therefore it has a positive relationship with China’s exports to Australia and negative relationship
with China’s imports from Australia.
Regional trade agreements tend to liberalize trade among their member countries, either cutting off
or diminishing customs duties. They also pursue to formalize domestic regulations that protecting
their trade from others and foreign direct investment. Thus it is understandable that trade between
member countries in a RTA can be increased by the implementation of this RTA. Therefore RTAs
are selected to put in the model as dummy variables to study their impact on changes of trade
volume between their members and non-members since 1970s. Many researchers, such as Aitken

4
(1973) and Braga, Sadafi and Yeats (1994), Bayoumi and Eichengreen (1997), Frankel (1997),
Soloaga and Winters (2001; 2004; 1986), have introduced RTAs in order to achieve this goal.
In this paper the RTA dummies of EU, CUSFTA, NAFTA, ASEAN and CER are considered to have
a positive impact on China’s trade with Australia, where member countries in these regions intend
to trade within the region, while pushing China to trade more with other non-members. Therefore
positive coefficients are expected for these RTAs. APEC’s development will enable China trading
more with other members; hence a positive coefficient is expected.
2.2 Model The model estimated in this paper is partial equilibrium model, using logarithms of exports and
imports as dependant variables in equation 1 and 2 respectively, and logarithms of GDP, distance,
population and exchange rate as explainable variables, and RTAs including EU, CUSFTA, NAFTA,
ASEAN, CER and APEC as dummy variables.
ε+++++++++++=
tttttt
tttit
APECPcCERcASEANcNAFTAcCUSFTAcEUcteexchangeracpopulationccediscGDPccDEXP
11109876
54321 lnlntanlnln)ln( (1)
ε+++++++++++=
tttttt
tttit
APECPcCERcASEANcNAFTAcCUSFTAcEUcteexchangeracpopulationccediscGDPccDIMP
11109876
54321 lnlntanlnln)ln( (2)
In these two equations DEXP and DIMP are China’s exports and imports by commodity to and from
Australia respectively (adjusted by GDP deflator). GDP is China’s gross domestic products at
constant 1990 price. Distance is the distance between capital cities of China and Australia.
Population is China’s population. Exchange rate is defined as one U.S. Dollar equals to a number
of Renminbi. T is time period, and i stands for different classified commodities.
EU, CUSFTA, NAFTA, ASEAN and CER are regional economic integration excluding China as
their member. They take the value of 1 when they form a regional economic agreement, indicating
the impact of their aggregation on China’s trade with Australia, and zero otherwise.
APEC is the only RTA China participates in. It is defined differently from other RTA dummies. As
China became a member of APEC in 1991 and the available commodity trade data is from 1992, it
is incredible to estimate the impact of APEC when it is defined the same as other RTA dummies.
Therefore a substitute dummy definition is adopted here. Lu points out that APEC’s development
over these fifteen years (until 2004) can be separated into two periods: the first period is
prosperous developing period from 1989 to 1997, and the second period is adjusting slow
developing period from 1998 up to now. The 1997 Asian financial crisis is the separated year.
During the first eight years, APEC actively promoted liberalizing trade and investment in Asia-
Pacific region pushed by 1994 Bogor Goals, 1995 Osaka Action Agenda, and 1996 Manila Action

5
Plan. However as the 1997 Early Voluntary Sectoral Liberalization that tends to liberalize trade in
sector level was negatively affected by the 1997 Asian financial crisis, APEC enters slowly
developing period, slowing down its trade and investment liberalization progress. Up to now APEC
has not yet come out of the low tide.
In regard to different developing period, I choose to separate APEC development into two periods
as a dummy variable, i.e. 1992-1997, and 1998-2004. It takes the value of 1 for the former period
and zero for the latter period, indicating the high speed development of APEC has a positively
significant impact on China’s trade with Australia. Thus a positive relationship is expected between
the dummy and dependent variables.
2.3 Data source China’s merchandise trade with Australia data are obtained from SourceOECD International Trade
by Commodities Statistics from 1992 to 2004 in thousand U.S. Dollars. The data are classified
according to Standard International Trade Classification system Revision 2. In this paper 1-digit
subheading including 10 broad classified commodities and 2-digit subheadings commodities are
estimated in the model.
GDP and exchange rate data are collected from United Nations National Aggregate Database. The
distance (measured in kilometres) between Beijing and Canberra is obtained from “Direct-Line
Distances (International Edition)” of Fitzpatrick and Modlin. Exports, imports and GDP are deflated
by GDP deflator which is obtained from United Nations database.
3. Empirical result The data are estimated using pooled least squares method from 1992 to 2004. Both exports and
imports are estimated as a whole and by commodity separately. In the model estimation, only five
variables can be worked out, including GDP, population, exchange rate, NAFTA and APEC; other
variables are finally excluded from final regression of the model. Consequently the results show
only these five variables.
When regressions are made by using the whole pooled data, it is clear that there are no any
particular factors that have any statistical significant impact on China’s exports to and imports from
Australia, including the formation of NAFTA and different development of APEC (Table 1 and Table
2). However when considering detailed classified commodity, the results can be shown and
explained by the following.
3.1 Empirical results of China’s exports to Australia Generally speaking, the coefficients of GDP are found to have expected positive sign in nine out of
ten 1-digit commodities, including classification 0 Food and live animals, classification 2 Crude
materials, inedible, except fuels, classification 4 Animal and vegetable oils, fats and waxes,
classification 5 Chemicals and related products, classification 6 Manufactured goods classified

6
chiefly by material, classification 7 Machinery and transport equipment, classification 8
Miscellaneous manufactured articles, and classification 9 Commodities and transactions not
elsewhere classified; only the coefficient of classification 3 Mineral fuels, lubricants and related
materials is negative. Except classifications 1 and 3, the coefficients of GDP of other classifications
are statistically significant at 1 percent or 5 percent level. The results indicate that most of China’s
exports to Australia are highly related with China’s GDP changes, i.e. a higher GDP in China
pushes more exports to Australia.
However when considering regression results for impact of GDP on 2-digit commodities, not all
detailed commodities are positively affected in China’s exports to Australia. When China’s GDP
increases those commodities are intended to fulfill domestic demand and serve Chinese market
first. They are goods of basic food for human being and animals and resources from classifications
0, 1 and 2, including meat, cereals, feeding stuff, tobacco, crude materials, pulp and waste paper;
energy in classification 3, including coal and petroleum; medicines and dyeing materials in
classification 5; and photographic apparatus and watches in classification 8. Most of these goods
are inputs or semi-products in manufacturing process and are highly related with Chinese people’s
daily life. They will be in large demand when China’s GDP is growing larger.
In the 1-digit commodity regression, the coefficients of population have expected negative sign in
eight out of ten classified commodities; while the coefficients of classifications 1 and 3 show
positive signs. The negative coefficients are statistically significant at 1 percent level except
classification 2. The significant negative sign indicates that China intends to produce and exchange
those goods inside the country instead of exporting them to Australia.
It is worth noting that regression results of some goods in 2-digit classification show that the
pushing effect of population increases to China’s exports to Australia is quite opposite to that of
GDP growth. All the 2-digit classified goods which are negatively related with GDP growth are
positively related with population increases, indicating China’s increasing population does not block
these goods from exporting outside China, especially for resources, crude materials and energy.
This result is quite puzzling, totally opposite to common concept that China’s large population
consumes more resources, materials and energy goods. In the 1-digit regression, most of the coefficients of exchange rate are statistically significant at 1
percent level and 10 percent level for classification 9. It is expected to see positive signed
coefficients in classifications 7 and 8, which clearly supports the fact that when Renminbi is
devalued, more machinery, transport and various manufactured goods are exported to Australia.
However other classified goods are not positively affected and seem to export less when RMB is
depreciated. This may indicate that those goods are in large demand in domestic market; thus they
are lured to serve Chinese market instead of Australian market. Considering the 2-digit
commodities, the only goods in the rest classifications that are positively related with exchange rate

7
are those commodities of fish and cereals in classification 0, crude rubber and pulp and waste
paper in classification 2, dyeing materials, medicines, perfumes, manufactured fertilizers and
plastic materials in classification 5, leather and rubber manufactured goods, and paper goods in
classification 6.
In the 1-digit commodity regression, most of the coefficients of NAFTA are statistically significant at
1 percent level and 10 percent level for classifications 5 and 9. The coefficients show expected
positive sign in classifications 0, 1, 2, 3, 4, 5, 6 and 9, while negative signed coefficients are found
in classifications 7 and 8. As China is expected to become a ‘world factory’, its cheap and quality
manufactured goods are quite competitive around world market. It is not a surprise that those
products are hindered to North American market after NAFTA is formed and freely traded within the
region, where Canada and USA can import from Mexico after cutting down their customs duties.
This instead affects China exporting more to Australia, enlarging Australian market instead.
However in the above broad classifications there are some kinds of goods that China does not
enlarge its exports to Australia when NAFTA market is not as easy to enter as before. These kinds
of commodities focus on fish, cereals and sugar products in classification 0, pulp and waste paper
in classification 2, dyeing materials, medicines, perfumes, manufactured fertilizers and plastic
materials in classification 5, leather and paper goods in classification 6. They are either largely
needed in Chinese domestic market or Australia has other better importing sources.
In the 1-digit regression, the expected positively signed coefficients for APEC dummy variable are
found in classifications 0, 2, 3, 5, 8 and 9, while negative coefficients occur in the classified goods
of classifications 1, 4, 6 and 7. The coefficients of classifications 1, 8 and 9 are not statistically
significant; others are significant either at 1 percent or 5 percent level.
The results indicate that China intends to export more goods in broad classifications 0, 2, 3 and 5,
and fewer goods in classifications 4, 6 and 7. Considering detailed 2-digit commodities, China
exports fewer goods in tobacco, cork and wood, metalliferous ores and metal scraps in
classifications 1 and 2, coal, coke and briquettes in classification 3, dyeing materials, manufactured
fertilizers, explosives and pyrotechnic products in classification 5, apparel and clothing accessories
in classification 8, arms of war in classification 9; while at the same period China enlarges its
exports to Australia in goods of cork and wood manufactures, paper articles, manufactures of metal
in classification 6, machinery specialized for particular industries, metalworking machinery, office
machines and automatic data processing equipment, and road vehicles in classification 7.
3.2 Empirical results of China’s imports from Australia In the 1-digit commodity regression, positive coefficients of GDP are found expectedly in the first
eight classified commodities, with classifications 8 and 9 negative coefficients. Most coefficients are
statistically significant at 1 percent level; the coefficient of classification 3 is significant at 10 percent
level. The results show that most goods China imports from Australia increase when

8
simultaneously China’s consumption ability estimated by GDP increases, while some kinds of
goods in classifications 8 and 9 decrease when China’s GDP increases.
Considering regression results of GDP for 2-digit classification, some kinds of commodities show
fewer imports from Australia, including dairy and fish, vegetables and fruit, sugar and feeding stuff
in classification 0, oil seeds in classification 2, petroleum and gas in classification 3, animal-
vegetable oils fats in classification 4, dyeing materials in classification 5, cork and wood
manufacturers, paper and textile related products in classification 6; some of these goods like fish
could be produced by China itself. China also imports a little more of goods of professional and
scientific instruments in classification 8, and coin in classification 9.
In the 1-digit regression, the coefficients of population are statistically significant at either 1 percent
or 5 percent level. They have expected negative sign in classifications 0, 1, 2, 4, 5, 6 and 7, and
positive signs are found in classifications 3, 8 and 9. It indicates although China tends to import
fewer goods from Australia when China can produce by itself, China needs more energy goods and
electronic and military goods in classifications 8 and 9 to support its economic development.
In the detailed 2-digit classification, China tends to import more as larger population needs more
goods to consume, including basic food for human and animals in classification 0, oils seeds, crude
rubber and textile fibres in classification 2, petroleum and gas in classification 3, animal-vegetable
oils in classification 4, inorganic chemicals, dyeing materials, medicines, perfumes in classification
5, cork and wood manufactures, paper, textile yarn, iron and steel in classification 6.
In the 1-digit regression, the expected negatively signed coefficients of exchange rate are found
only in classifications 2, 3 and 6, which are also statistically significant at 1 percent level, indicating
China tends to import fewer goods in these classifications when Renminbi is devalued. The
coefficients of other classifications 0, 1, 4, 5, 7, 8 and 9 are all positively signed and statistically
significant at either 1 percent or 5 percent level. This result shows that China does not decrease
imports in these classifications from Australia although the imported cost in Renminbi increases.
Considering detailed 2-digit commodities after the price of Renminbi changes, China imports more
goods of oil seeds, crude rubber, pulp and waste paper in classification 2, leather and leather
manufactures, cork and wood manufactures, paper and paper articles, non-metallic mineral
manufactures, iron and steel in classification 6. While China imports fewer goods of meat,
vegetables and fruit, feeding stuff in classification 0, fixed vegetable oils and fats in classification 4,
organic and inorganic chemicals, perfumes, manufactured fertilizers, explosives and pyrotechnic
products, chemical materials and products in classification 5, power generating machinery, office
machines and automatic data processing equipment in classification 7, sanitary, plumbing, heating
and lighting fixtures in classification 8.

9
In the 1-digit commodity regression, it is expectedly to find positive coefficients of NAFTA in
classifications 2, 3 and 6, while negative ones are found in classifications 0, 1, 4, 5, 7, 8 and 9. It
indicates that under the influence of NAFTA’s implementation, China begins to import more from
Australia in crude materials, mineral fuels and material manufactured goods.
Considering detailed 2-digit commodities after NAFTA is formed, China imports more goods of
meat, vegetables and fruit, feeding stuff in classification 0, hides and skins, cork and wood, crude
fertilizers, metalliferous ores and metal scrap, crude animal and vegetable materials in
classification 2, coal, petroleum and gas in classification 3, fixed vegetable oils in classification 4,
organic and inorganic chemicals, perfumes, manufactured fertilizers, chemical materials and
products in classification 5, textile yarn, non-ferrous metals, and metal manufactures in
classification 6, power generating machinery, office machines and automatic data processing
equipment in classification 7, sanitary, plumbing products in classification 8.
In the 1-digit regression, most of the coefficients of APECP are found expectedly positively signed
and statistically significant at 1 percent level, while the coefficient of classification 5 is negative and
significant at 5 percent level. The results indicate clearly that the quick and prosperous
development of APEC enables China importing more goods from Australia.
Only imports of the following goods in detailed 2-digit classification are not growing as expected in
APEC’s fast development: live animals chiefly for food, feeding stuff in classification 0, oil seeds,
crude fertilizers and crude materials in classification 2, non-ferrous metals in classification 6, power
generating machinery, metalworking machinery, office machines, telecommunications and sound
recording apparatus, electrical machinery, road vehicles in classification 7, footwear in
classification 8. In classification 5, some goods are imported more although the whole classification
is not. They are manufactured fertilizers, explosives and pyrotechnic products.
3.3 Major regression conclusion China’s large GDP and its dramatic growth pushes China’s trade with Australia, both in
exports and imports. It is a crucial determined factor in improving trade between two countries.
Although China’s large population promotes China’s trade with Australia in some detailed 2-
digit commodities, it traps manufactured goods exported to Australia in 2-digit classifications 6,
7 and 8.
Generally speaking exchange rate does not have a positive effect on China’s trade with
Australia. However when considering detailed classified commodities, the depreciation of
Renminbi pushes China’s exports to Australia in chemical goods, machinery and transport
equipment and miscellaneous manufactured articles, including clothing and footwear.
RTA variables are found positively affected China’s trade with Australia. The formation of
North American Free Trade Area and its trade liberalization development tends to exclude
China’s goods outside North American market, especially USA and Canada markets.
Therefore it indirectly pushes China’s exports to Australia and imports from Australia.

10
The quick development of APEC before 1997 pushes China’s exports to Australia in resources,
energy, animals and chemicals, and imports from Australia in most goods except chemicals.
3.4 Modeling issues The trade data time series are only from 1992 to 2004, which are not reflected the development of
the two countries’ trade before and after 1991 when China participated in APEC for the first time.
The data also could not reflect the conditions before and after EU, ASEAN and CER’s
establishment. Therefore the impact of these regional trade agreements could not be estimated in
the pooled model. The positive and negative effect from NAFTA and APEC on China’s trade with
Australia could not reflect thoroughly if all RTAs have a definite impact.
4. Conclusion This paper studies the impact of regional trade agreements on China’s commodity trade with
Australia in discussing current China’s exports to and imports from Australia in SITC listed
commodities. The paper uses partial equilibrium model to estimate the relationship between
China’s trade with Australia and other determined factors, including China’s GDP changes,
population changes, changes of Renminbi prices, the formation of NAFTA and the development of
APEC.
The increases of China’s GDP enable Chinese consuming more goods from Australia and
producing and exporting more to Australia. However the large population of China discourages
China’s trade with Australia to some extent, which indicates that China has the tendency of trading
inside the country if more population is expected in the future. The devaluation of RMB does not
bring more trade to China from Australia as expected, while decreasing trade between two
countries to some extent. It might indicate that China’s currency depreciation policy does not reflect
correspondent effect.
The inception and implementation of regional trade agreements have a crucial impact on China’s
commodity trade with Australia. The North American market is integrated by NAFTA in 1990s,
where Canada and USA can import cheaper manufactured goods from Mexico. China as a major
exporter to USA is severely impacted by this activity. Thus China diverts to other countries to
enlarge its exports and imports, making Australia become China’s third major trading partner in
2003. At the same time the quick development of APEC has pushed both countries’ commodity
trade to some extent as well. Therefore under the development of regional economic integration
around the world, it is possible and necessary for China and Australia to involve in bilateral free
trade, which in turn encourages trade between the two countries.
Acknowledgement This paper is supported by Endeavour Australia Cheung Kong Awards 2005. The author would like
to thank the Cheung Kong Enterprises and the Australian Government for the financial support and

11
Institute of World Economics and Politics of Chinese Academy of Social Sciences of Beijing China
for academic support and proper supervision.

12
Reference Aitken, N. D., 1973. The effect of the EEC and EFTA on European trade: a temporal cross-section
analysis. American Economic Review, 63, pp. 881-892.
Bayoumi, T. and B. Eichengreen, 1997. Is regionalism simply a diversion: evidence from the
evolution of the EC and EFTA, In: Regionalism Versus Multilateral Trade Arrangements.
(eds Ito, T.&Krueger, A. O.), pp. 141-167. Chicago: University of Chicago Press.
Braga, P., R. Sadafi and A. Yeats, 1994. Regional integration in the Americas: deja vu all over
again? World Economy, 17, pp. 577-601.
DFAT (Department of Foreign Affairs and Trade, A. G. and C. Ministry of Commerce, 2005.
Australia-China Free Trade Agreement Joint Feasibility Study.
Fitzpatrick, G. L. and M. J. Modlin, 1986. Direct-Line Distances (International Edition). The
Scarecrow Press, Inc..
Frankel, J. A., 1997. Regional Trading Blocs in the World Economic System. Institute for
International Economics: Washington, DC.
Lu, J., 2004. APEC facing five challenges -- written before the APEC leaders meeting in 2005.
International Economic Review (in Chinese), 9-10, pp.
Soloaga, I. and L. A. Winters, 2001. Regionalism in the nineties: what effect on trade? The North
American Journal of Economics and Finance, 12, pp. 1-29.
http://www.sciencedirect.com/science/article/B6W5T-42P531H-
1/2/29ac670d3b30cf8095bf845628e55beb.
13
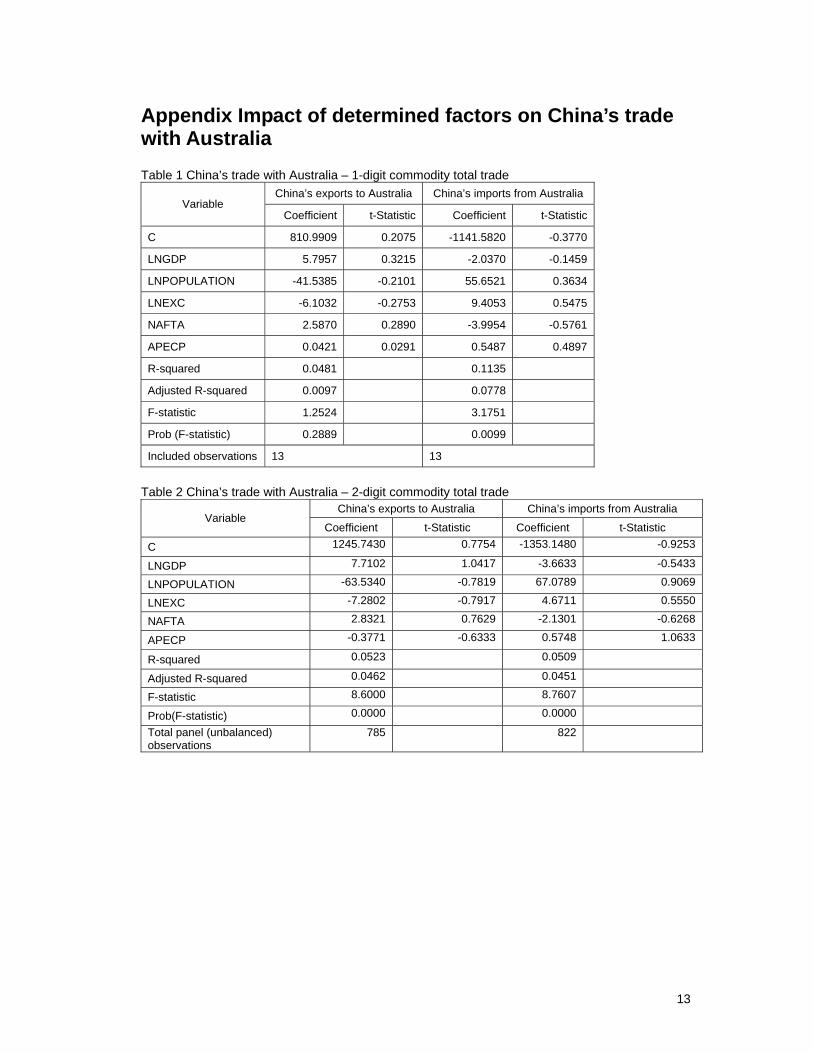
Appendix Impact of determined factors on China’s trade with Australia Table 1 China’s trade with Australia – 1-digit commodity total trade
China’s exports to Australia China’s imports from Australia Variable
Coefficient t-Statistic Coefficient t-Statistic
C 810.9909 0.2075 -1141.5820 -0.3770
LNGDP 5.7957 0.3215 -2.0370 -0.1459
LNPOPULATION -41.5385 -0.2101 55.6521 0.3634
LNEXC -6.1032 -0.2753 9.4053 0.5475
NAFTA 2.5870 0.2890 -3.9954 -0.5761
APECP 0.0421 0.0291 0.5487 0.4897
R-squared 0.0481 0.1135
Adjusted R-squared 0.0097 0.0778
F-statistic 1.2524 3.1751
Prob (F-statistic) 0.2889 0.0099
Included observations 13 13
Table 2 China’s trade with Australia – 2-digit commodity total trade
China’s exports to Australia China’s imports from Australia Variable
Coefficient t-Statistic Coefficient t-Statistic
C 1245.7430 0.7754 -1353.1480 -0.9253
LNGDP 7.7102 1.0417 -3.6633 -0.5433
LNPOPULATION -63.5340 -0.7819 67.0789 0.9069
LNEXC -7.2802 -0.7917 4.6711 0.5550
NAFTA 2.8321 0.7629 -2.1301 -0.6268
APECP -0.3771 -0.6333 0.5748 1.0633
R-squared 0.0523 0.0509
Adjusted R-squared 0.0462 0.0451
F-statistic 8.6000 8.7607
Prob(F-statistic) 0.0000 0.0000
Total panel (unbalanced) observations
785 822

14
Table 3 China's exports to and imports from Australia -- 1 digit commodity GDP Population Exchange rate NAFTA APEC
Exports Imports Exports Imports Exports Imports Exports Imports Exports Imports
0 Food and live animals Y Y N N N Y Y N Y Y
1 Beverages and tobacco __ Y __ N N Y Y N __ __
2 Crude materials, inedible, except fuels Y Y __ N N N Y Y Y Y
3 Mineral fuels, lubricants and related materials
__ Y Y Y N N Y Y Y Y
4 Animal and vegetable oils, fats and waxes
Y Y N N N Y Y N N Y
5 Chemicals and related products, n.e.s.
Y Y N N N Y Y N Y N
6 Manufactured goods classified chiefly by material
Y Y N N N N Y Y N Y
7 Machinery and transport equipment Y Y N N Y Y N N N __
8 Miscellaneous manufactured articles Y N N Y Y Y N N __ Y
9 Commodities and transactions not elsewhere classified
Y N N Y N Y Y N __ Y
Note: Y means increasing changes of explainable variables improves China’s exports to or imports from Australia
N means increasing changes of explainable variables decreases China’s exports to or imports from Australia
-- means no result or not statistically significant at all
15
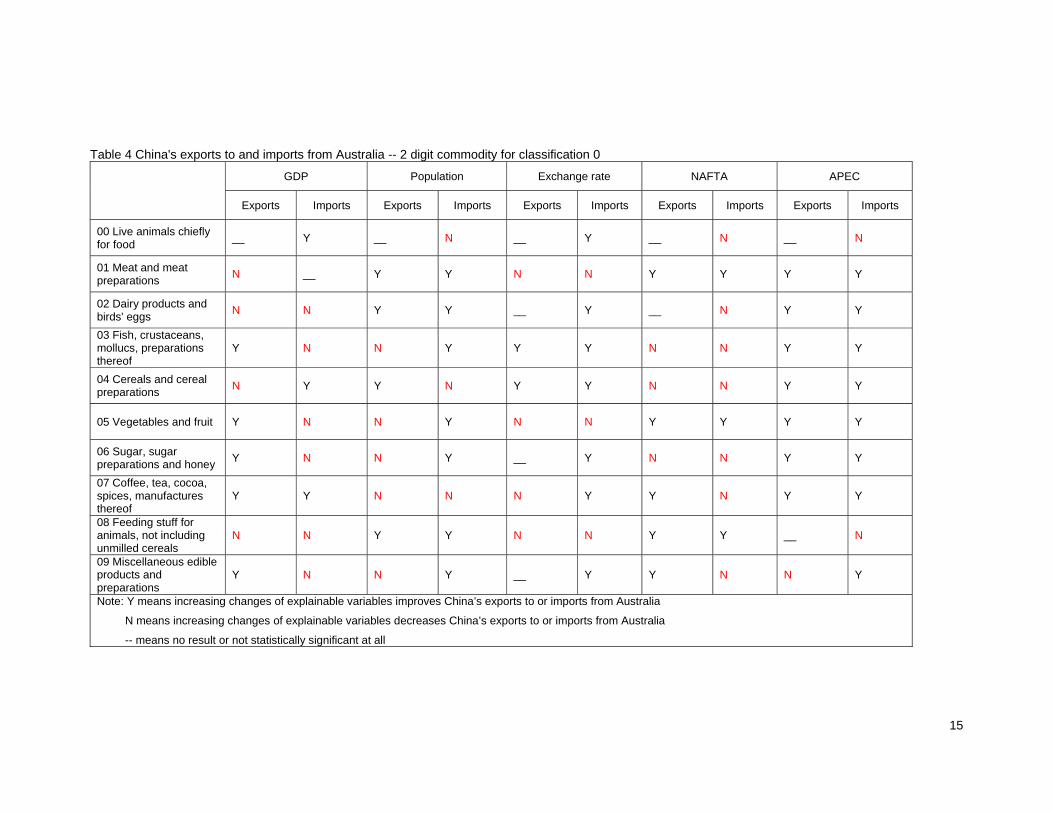
Table 4 China's exports to and imports from Australia -- 2 digit commodity for classification 0
GDP Population Exchange rate NAFTA APEC
Exports Imports Exports Imports Exports Imports Exports Imports Exports Imports
00 Live animals chiefly for food __ Y __ N __ Y __ N __ N
01 Meat and meat preparations N __ Y Y N N Y Y Y Y
02 Dairy products and birds' eggs N N Y Y __ Y __ N Y Y
03 Fish, crustaceans, mollucs, preparations thereof
Y N N Y Y Y N N Y Y
04 Cereals and cereal preparations N Y Y N Y Y N N Y Y
05 Vegetables and fruit Y N N Y N N Y Y Y Y
06 Sugar, sugar preparations and honey Y N N Y __ Y N N Y Y
07 Coffee, tea, cocoa, spices, manufactures thereof
Y Y N N N Y Y N Y Y
08 Feeding stuff for animals, not including unmilled cereals
N N Y Y N N Y Y __ N
09 Miscellaneous edible products and preparations
Y N N Y __ Y Y N N Y
Note: Y means increasing changes of explainable variables improves China’s exports to or imports from Australia
N means increasing changes of explainable variables decreases China’s exports to or imports from Australia
-- means no result or not statistically significant at all

16
Table 5 China's exports to and imports from Australia -- 2 digit commodity for classifications 1 & 2
GDP Population Exchange rate NAFTA APEC
Exports Imports Exports Imports Exports Imports Exports Imports Exports Imports
11 Beverages Y Y N N N Y Y N __ Y
12 Tobacco and tobacco manufactures N __ Y __ N __ Y __ N __
21 Hides, skins and furskins, raw __ Y __ N __ N __ Y __ Y
22 Oil seeds and oleaginous fruit Y N N Y N Y Y N Y N
23 Crude rubber (including synthetic and reclaimed) N __ Y Y Y Y __ N Y Y
24 Cork and wood Y Y N N N N __ Y N __
25 Pulp and waste paper N Y Y N Y Y N N Y __
26 Textile fibres (except wool tops) and their wastes Y Y N Y N __ Y N __ Y
27 Crude fertilizers and crude materials (excluding coal)
N Y Y N N N __ Y Y N
28 Metalliferous ores and metal scrap Y Y N N N N Y Y N Y
29 Crude animal and vegetable materials, n.e.s. Y Y __ N __ N __ Y Y Y
Note: Y means increasing changes of explainable variables improves China’s exports to or imports from Australia
N means increasing changes of explainable variables decreases China’s exports to or imports from Australia
-- means no result or not statistically significant at all

17
Table 6 China's exports to and imports from Australia -- 2 digit commodity for classifications 3 & 4
GDP Population Exchange rate NAFTA APEC
Exports Imports Exports Imports Exports Imports Exports Imports Exports Imports
32 Coal, coke and briquettes N Y Y N N N Y Y N Y
33 Petroleum, petroleum products and related materials
N N Y Y N N Y Y Y Y
34 Gas, natural and manufactured __ N __ Y __ N __ Y __ Y
35 Electric current __ __ __ __ __ __ __ __ __ __
41 Animal oils and fats Y Y N N N Y Y N N Y
42 Fixed vegetable oils and fats __ Y __ N N N Y Y N Y
43 Animal-vegetable oils-fats, processed, and waxes
Y N N Y N Y Y N N __
Note: Y means increasing changes of explainable variables improves China’s exports to or imports from Australia
N means increasing changes of explainable variables decreases China’s exports to or imports from Australia
-- means no result or not statistically significant at all

18
Table 7 China's exports to and imports from Australia -- 2 digit commodity for classification 5
GDP Population Exchange rate NAFTA APEC
Exports Imports Exports Imports Exports Imports Exports Imports Exports Imports
51 Organic chemicals Y __ N __ N N Y Y Y N
52 Inorganic chemicals Y Y N Y N N Y Y Y N
53 Dyeing, tanning and colouring materials N N Y Y Y Y N N N N
54 Medicinal and pharmaceutical products N __ Y Y Y Y N N Y __
55 Essential oils & perfume materials; toilet polishing and cleansing preparations
Y Y __ Y Y N N Y Y N
56 Fertilizers, manufactured Y Y N N Y N N Y N Y
57 Explosives and pyrotechnic products __ Y Y N N N Y __ N Y
58 Artificial resins, plastic materials, cellulose esters and ethers
Y Y N N Y Y N N Y N
59 Chemical materials and products, n.e.s. Y Y N N N N Y Y Y N
Note: Y means increasing changes of explainable variables improves China’s exports to or imports from Australia
N means increasing changes of explainable variables decreases China’s exports to or imports from Australia
-- means no result or not statistically significant at all
19
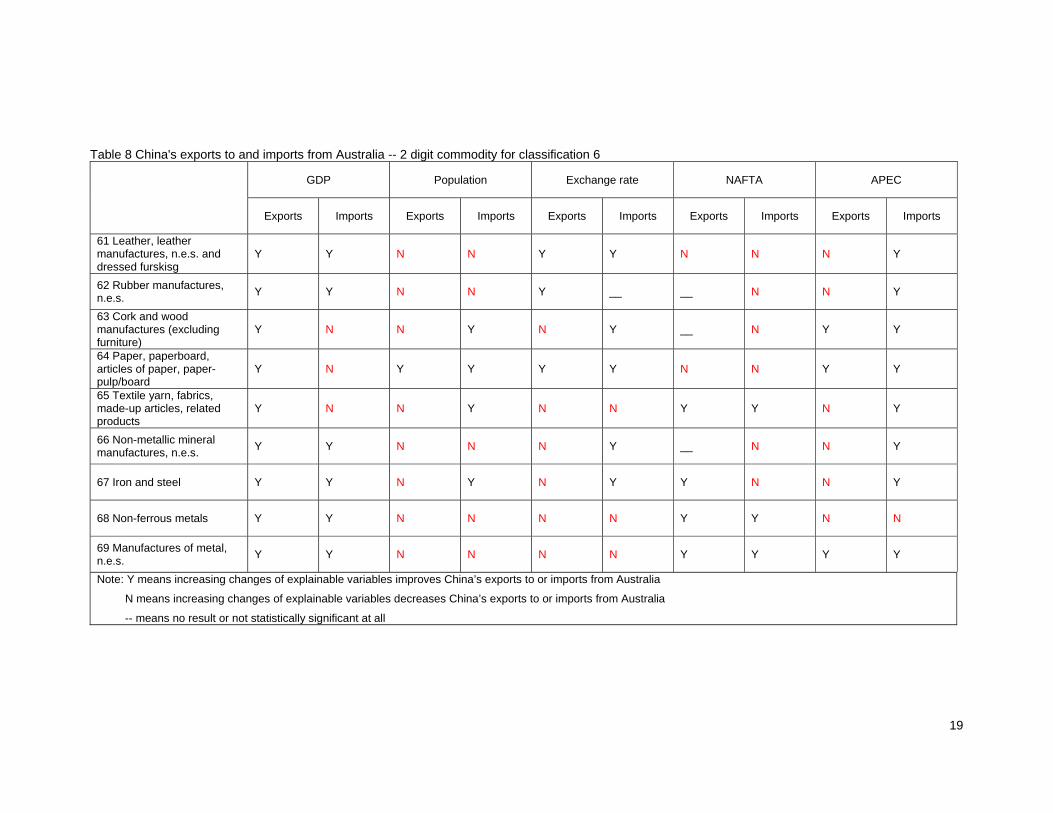
Table 8 China's exports to and imports from Australia -- 2 digit commodity for classification 6
GDP Population Exchange rate NAFTA APEC
Exports Imports Exports Imports Exports Imports Exports Imports Exports Imports
61 Leather, leather manufactures, n.e.s. and dressed furskisg
Y Y N N Y Y N N N Y
62 Rubber manufactures, n.e.s. Y Y N N Y __ __ N N Y
63 Cork and wood manufactures (excluding furniture)
Y N N Y N Y __ N Y Y
64 Paper, paperboard, articles of paper, paper-pulp/board
Y N Y Y Y Y N N Y Y
65 Textile yarn, fabrics, made-up articles, related products
Y N N Y N N Y Y N Y
66 Non-metallic mineral manufactures, n.e.s. Y Y N N N Y __ N N Y
67 Iron and steel Y Y N Y N Y Y N N Y
68 Non-ferrous metals Y Y N N N N Y Y N N
69 Manufactures of metal, n.e.s. Y Y N N N N Y Y Y Y
Note: Y means increasing changes of explainable variables improves China’s exports to or imports from Australia
N means increasing changes of explainable variables decreases China’s exports to or imports from Australia
-- means no result or not statistically significant at all

20
Table 9 China's exports to and imports from Australia -- 2 digit commodity for classification 7
GDP Population Exchange rate NAFTA APEC
Exports Imports Exports Imports Exports Imports Exports Imports Exports Imports
71 Power generating machinery and equipment Y Y N N Y N N Y N N
72 Machinery specialized for particular industries Y Y N N Y Y N N Y Y
73 Metalworking machinery Y __ N __ Y Y N N Y N
74 General industrial machinery & equipment, and parts
Y Y N N Y Y N N N Y
75 Office machines & automatic data processing equipement
Y Y N N N N Y Y Y N
76 Telecommunications & sound recording apparatus Y Y N N Y Y N N N N
77 Electrical machinery, apparatus & appliances n.e.s. Y Y N N Y Y N N N N
78 Road vehicles (including air-cushion vehicles) Y Y N N Y Y N N Y N
79 Other transport equipment Y Y N N N Y Y N N Y
Note: Y means increasing changes of explainable variables improves China’s exports to or imports from Australia
N means increasing changes of explainable variables decreases China’s exports to or imports from Australia
-- means no result or not statistically significant at all
21
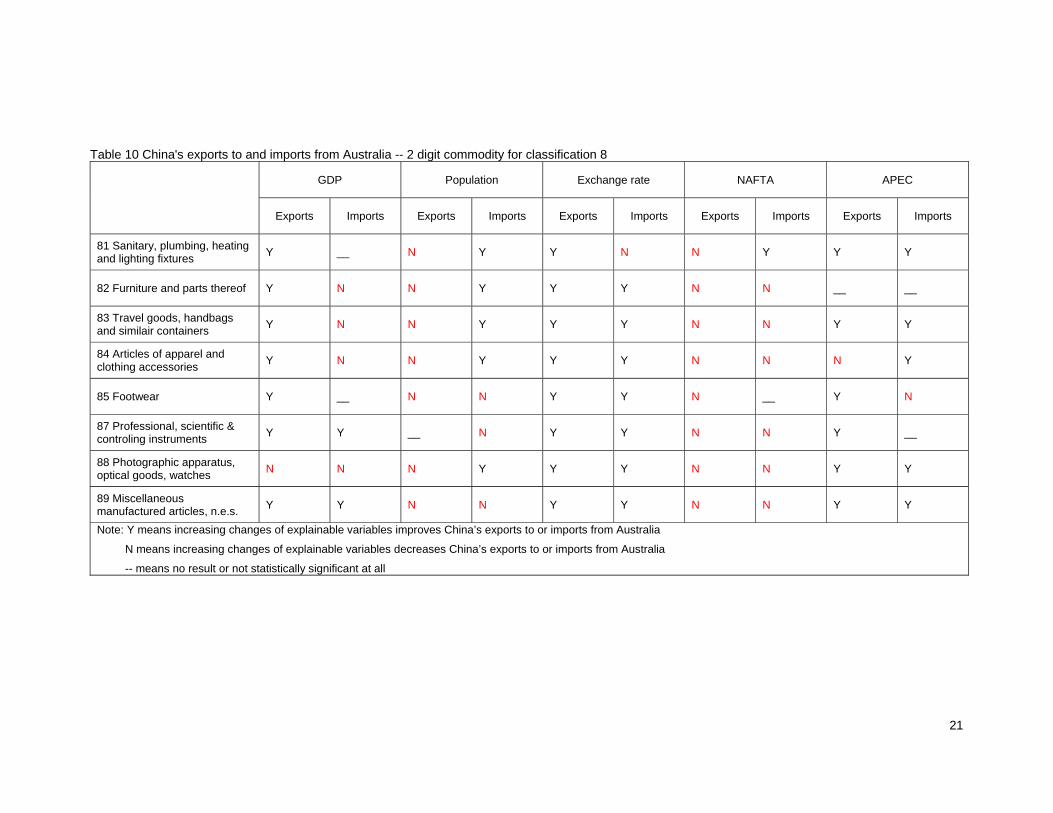
Table 10 China's exports to and imports from Australia -- 2 digit commodity for classification 8
GDP Population Exchange rate NAFTA APEC
Exports Imports Exports Imports Exports Imports Exports Imports Exports Imports
81 Sanitary, plumbing, heating and lighting fixtures Y __ N Y Y N N Y Y Y
82 Furniture and parts thereof Y N N Y Y Y N N __ __
83 Travel goods, handbags and similair containers Y N N Y Y Y N N Y Y
84 Articles of apparel and clothing accessories Y N N Y Y Y N N N Y
85 Footwear Y __ N N Y Y N __ Y N
87 Professional, scientific & controling instruments Y Y __ N Y Y N N Y __
88 Photographic apparatus, optical goods, watches N N N Y Y Y N N Y Y
89 Miscellaneous manufactured articles, n.e.s. Y Y N N Y Y N N Y Y
Note: Y means increasing changes of explainable variables improves China’s exports to or imports from Australia
N means increasing changes of explainable variables decreases China’s exports to or imports from Australia
-- means no result or not statistically significant at all

22
Table 11 China's exports to and imports from Australia -- 2 digit commodity for classification 9
GDP Population Exchange rate NAFTA APEC
Exports Imports Exports Imports Exports Imports Exports Imports Exports Imports
91 Postal packages not classified according to kind
__ __ __ __ __ __ __ __ __ __
93 Special transactions not classified according to kind
__ N N Y N Y Y N Y N
94 Animals, live, zoo animals, dogs, cats etc. __ N __ Y __ Y __ N __ Y
95 Arms, of war and ammunition therefor Y __ N __ N __ Y __ N __
96 Coin (other than gold) , not being legal tender
__ Y __ N __ Y __ __ __ Y
97 Gold, non-monetary __ __ __ __ __ __ __ __ __ __
Note: Y means increasing changes of explainable variables improves China’s exports to or imports from Australia
N means increasing changes of explainable variables decreases China’s exports to or imports from Australia
-- means no result or not statistically significant at all