Embed Size (px)
Citation preview

Impact of Safe Patient Handling Legislation on Musculoskeletal
Disorders Among California Healthcare Workers
Labor Research and Evaluation (LRE) Grants
Grant No.: EO-30270-17-60-5-6
FINAL REPORT
Prepared for:
United States Department of Labor
Chief Evaluation Office (CEO)
Prepared by:
University of California, San Francisco
School of Nursing
Principal Investigator:
Soo-Jeong Lee, PhD, RN, FAAOHN
Co-Investigators:
Robert Harrison, MD, MPH
Joung Hee Lee, PhD, RN
Laura Stock, MPH
April 23, 2020

DISCLAIMER This report was prepared for the U.S. Department of Labor (DOL), Office of the Assistant
Secretary for Policy, Chief Evaluation Office, under grant number EO-30270-17-60-5-6. The
views expressed are those of the authors and should not be attributed to DOL, nor does mention
of trade names, commercial products, or organizations imply endorsement by the U.S.
Government.

i
TABLE OF CONTENTS
LIST OF TERMS AND ABBREVIATIONS ............................................................................ iv
ABSTRACT ....................................................................................................................................1
INTRODUCTION .........................................................................................................................3
Study purpose.......................................................................................................................4
Conceptual Framework ........................................................................................................5
A. ANALYSIS OF CALIFORNIA WORKERS’ COMPENSATION CLAIMS DATA
METHODS ....................................................................................................................................6
Study Design ........................................................................................................................6
Data Source ..........................................................................................................................6
Case Definitions and Identification .....................................................................................7
Data Analysis .....................................................................................................................11
RESULTS ...................................................................................................................................13
Healthcare Worker Claims in 2007-2016, California ........................................................13
MSD Claims among Healthcare Workers ..........................................................................15
MSD Claims by Setting: PHI and non-PHI .......................................................................17
MSD and PHI Claims among Nursing Workers ................................................................19
MSD and PHI claims rates .................................................................................................21
MSD and PHI claims rates among Nursing Workers ........................................................22
MSD and PHI Claims by Case Demographics ..................................................................26
MSD and PHI Claims by Injury Characteristics ................................................................28
Medical Costs Paid for MDS and PHI Claims by Healthcare Workers, 2008-2015 .........30
DISCUSSION ........................................................................................................................................ 32
Methodological Considerations and Limitations ..............................................................32
Main Findings ....................................................................................................................33
B. FOCUS GROUPS
METHODS .................................................................................................................................34
Study Design and Sample ..................................................................................................34
Data Collection ..................................................................................................................35
Data Analysis .....................................................................................................................36
RESULTS ...................................................................................................................................36
Knowledge and Impact of the Safe Patient Handling Law ................................................36
Hospital Policies, Procedures, and Employee Involvement ..............................................37
Training ..............................................................................................................................39
Patient Handling Equipment ..............................................................................................39
Lift Team ...........................................................................................................................40
Staffing ...............................................................................................................................41
Safety Culture ....................................................................................................................42
Workload............................................................................................................................43
Injury Concerns ..................................................................................................................44
DISCUSSION ..............................................................................................................................45
CONCLUSIONS ..........................................................................................................................45
REFERENCES ............................................................................................................................46

ii
LIST OF FIGURES
Figure 1. Conceptual Framework ..................................................................................................5
Figure 2. Overview of cases in the study ......................................................................................7
Figure 3. MSD case definition and search methods ....................................................................10
Figure 4. Workers’ compensation claims among healthcare workers, 2007-2016, California:
All workers and nursing workers ................................................................................13
Figure 5. MSDs in workers’ compensation claims among California healthcare workers, 2007-
2016: Claims by setting, occupation, and injury type .......................................................15
Figure 6. PHI claims among California healthcare workers, 2007-2016 ....................................17
Figure 7. MSD and PHI claims among nursing workers by year and setting, 2007-2016,
California ....................................................................................................................19
Figure 8. MSD and PHI claim rates (per 100 employees) among healthcare workers by setting,
2007-2016, California .................................................................................................21
Figure 9. MSD and PHI claim rates (per 100 employees) among nursing workers by setting,
2007-2016, California .................................................................................................22
Figure 10. Characteristics of MSD claim cases among healthcare workers, 2007-2016,
California ....................................................................................................................26
Figure 11. Part of body injured in MSD and PHI claims among hospital workers, 2007-2016,
California ....................................................................................................................28
Figure 12. Medical costs paid for healthcare worker claims, 2008-2015, California .................30

iii
LIST OF TABLES
Table 1. Industry codes and WCIS Class codes for healthcare worker case identification ..........8
Table 2. Healthcare worker case categories ..................................................................................9
Table 3. Hospital case categories ..................................................................................................9
Table 4. Examples of nursing worker occupation coding terms .................................................10
Table 5. Examples of patient handling injury and violence search terms ...................................11
Table 6. Workers’ compensation claims among healthcare worker cases, 2007-2016, California
.........................................................................................................................................14
Table 7. Workers’ compensation claims due to MSD by setting, occupation, and injury type
among healthcare workers, California, 2007-2016 ........................................................16
Table 8. Workers’ compensation claims due to MSD and PHI by type of setting among
healthcare workers, California, 2007-2016 ....................................................................18
Table 9. Workers’ compensation claims due to MSD and PHI among nursing workers by type
of setting, California, 2007-2016 ....................................................................................20
Table 10. MSD and PHI claim cases and rates (per 100 employees) among healthcare workers
by type of setting in 2007-2016, California ............................................................ 23-24
Table 11. Percent change of the average rates of MSD and PHI claims among California
healthcare workers, 2007-2016: Pre- vs. post-safe patient handling legislation and
regulation.......................................................................................................................25
Table 12. MSD and PHI claim cases among California healthcare workers in 2007-2016:
Demographic characteristics by setting ........................................................................27
Table 13. MSD and PHI claim cases among California hospital workers in 2007-2016: Injury
characteristics by year ...................................................................................................29
Table 14. Medical costs paid for workers’ compensation claims among healthcare workers,
2008-2015, California: MSD and PHI by part of body injured before and after safe
patient handling legislation ...............................................................................................31
Table 15. Focus group participants ...............................................................................................35

iv
LIST OF TERMS AND ABBREVIATIONS
ANA American Nurses Association
BLS Bureau of Labor Statistics
CDPH California Department of Public Health
DIR Department of Industrial Relations
DWC Division of Workers’ Compensation
FROI First Reports of Injury
MSD Musculoskeletal Disorder
NAICS North American Industry Classification System
NIOSH National Institute for Occupational Safety and Health
OSHA Occupation Safety and Health Administration
OSHPD Office of Statewide Health Planning and Development
PHI Patient Handling Injury
QCEW Quarterly Census of Employment and Wages
SD Standard Deviation
SIC Standard Industrial Classification
SROI Subsequent Reports of Injury
U/E Upper Extremities
WC Workers’ Compensation
WCIRB Workers’ Compensation Insurance Rating Bureau
WCIS Workers’ Compensation Information System

1
ABSTRACT
Healthcare workers are well known to be at high risk of musculoskeletal disorders (MSDs) from
patient handling. In 2011, California passed the Hospital Patient and Health Care Worker Injury
Protection Act (AB 1136) that requires acute care hospitals to implement safe patient handling
policies and programs to prevent patient handling injuries (PHIs). In 2014, the California
Division of Occupational Safety and Health (Cal/OSHA) established regulations to implement
the safe patient handling law. We aimed to: (1) assess the impact of the safe patient handling law
and regulation on MSD prevention at the state level and (2) explore workers’ perceptions and
experiences regarding the implementation of the safe patient handling policy, programs, and
practices. We used two approaches: (1) quantitative analysis of workers’ compensation (WC)
data from 2007 to 2016 and (2) qualitative focus groups.
We identified 311,269 MSD claims that occurred in 2007-2016 in private, state, and local
government healthcare facilities in California. MSD claims accounted for 40.3% of all claims
among healthcare workers (n=772,897). Of the MSD claims, 40.2% were by hospital workers,
and 28.1% were identified as PHI cases. It should be noted that due to methodological
limitations, the number of PHI cases is highly likely to underestimate the true magnitude of
PHIs. Compared to the pre-legislation period (2007-2011), MSD and PHI claims among hospital
workers decreased 4% and 14%, respectively, during the post-legislation period (2012-2016). In
contrast, those claims increased in nursing and residential care facilities, where the safe patient
handling law does not apply. The reductions of annual claim rates among hospital workers
during 2011-2016 were statistically significant and estimated to decrease by 3.3% per year for
MSD claims (IRR=0.967, 95% CI 0.943-0.991, p=0.0086) and by 7.3% per year for PHI claims.
(IRR=0.927, 95% CI 0.903-0.952, p<0.0001). The rate reduction of PHI claims was significantly
greater than the rate change of non-PHI claims (p=0.003). Moreover, hospital workers showed a
significantly greater rate reduction than nursing and residential care facility workers (p<0.0001).
Among hospital nursing workers, MSD and PHI claims decreased by 8.0% and 17.0%,
respectively, between the pre- and post-legislation periods, and the estimated reduction of claim
rates per year during 2011-2016 was 4.3% for MSD claims (IRR=0.957, 95% CI 0.938-0.977,
p<0.0001) and 8.5% for PHI claims (IRR=0.915, 95% CI 0.889-0.942, p<0.0001). Of the MSD
claims among hospital workers, 79.2% were strains or sprains. PHI claims in back, upper
extremities, and trunk showed apparent reductions during the post-legislation period. In 2008-
2015, 52.1% of healthcare worker cases had medical bill data for data analysis; $598 million and
$152 million were paid for medical bills of MSD claims and PHI claims among healthcare
workers over the 8-year period.
Three focus groups were conducted with 21 nurses and patient handling staff recruited from 12
hospitals located in eight counties in the San Francisco Bay Area and San Joaquin Valley.
The findings indicate that the participants had diverse and mixed experiences since the passage
of the safe patient handling law. Positive experiences and perceptions include feeling more
empowered to advocate for staff safety, awareness of safe patient handling policies and
committee activities, increased provision and variety of lift equipment, more provision of
training, and improvement in safety culture and practices including increased lift use. Perceived
concerns and obstacles include continuing barriers to safe practices and lift use (e.g., difficulty in
getting assistance, time burden associated with lift use, lack competence in using the equipment),

2
limited availability of lift teams, limited nursing employee input in the safety committee,
increased workload and continuing injury concerns, and more punitive management about
worker injury. Participants also indicated the need for more effective training, sufficient staffing,
supportive environment for worker safety and well-being, and management support for injured
workers.
In conclusion, our study identified positive changes of reductions of MSD and PHI claims
among hospital workers after the passage of California safe patient handling legislation. These
findings may indicate positive impacts associated with the safe patient handling law and
regulations; however, due to the limitation of the descriptive observation study design, the
positive changes may not be attributed to the law. Our study also described positive changes
perceived by hospital workers and continuing challenges and barriers to address for
improvement.

3
INTRODUCTION
The healthcare industry is the fastest-growing sector in the US and employs about 18 million
workers, accounting for 11.4% of the US workforce.[1, 2] The healthcare industry has high rates
of work-related injuries and illnesses. In 2017, 152,340 workers in the healthcare and social
assistance private sector were away from work for a median of 6 days.[3] Such injuries and
illnesses not only compromise the well-being and quality of work life of individual workers, but
also pose a challenge in maintaining optimal staffing levels to provide high-quality and timely
care.
Musculoskeletal disorders (MSDs) are a leading occupational health problem, accounting for
over 30% of lost-time work-related injuries and illnesses in the United States.[4] Healthcare
workers are well-known to be at high risk of MSDs. Every year, 30,000-37,000 nurses and
nursing assistants lose work days because of MSDs, and the injured nurses are away from work
for the median 8-9 days.[4] In 2013, nursing assistants and registered nurses ranked as the top 1st
and 5th occupations, respectively, with the most cases of lost-worktime MSDs.[5] A 2011 survey
by the American Nurses Association (ANA) showed that 56% of nurses had work-related
musculoskeletal pain.[6] The annual prevalence of low back pain in nursing personnel ranges
from 45% to 90% in US and international studies.[7-15] The resulting costs of MSDs among
healthcare workers are enormous but the data are limited. As an old estimate, direct and indirect
costs of back injuries in the US healthcare industry were estimated to be $7.4 billion (in 2008
dollars) annually.[16] The State of Washington reported that the total non-medical cost of work-
related MSD claims in healthcare was approximately $395 million during 2002-2010.[17] The
Oregon Occupational Safety and Health Administration reported that patient handling injuries
among registered nurses cost the state over $14 million during 1997-2006, with an average of
$16,090 per claim.[18] As such, MSD prevention is critically important to prevent and reduce
personal pain and suffering, productivity loss, and economic and social burden to families and
industry.
The primary risk factor for MSDs among healthcare workers is patient handling such as lifting,
transferring, repositioning, and helping patients with mobility. Patient handling injuries (PHIs)
account for 31-72% of musculoskeletal injuries [19-22] and 27-53% of workers’ compensation
costs among healthcare workers.[18, 21] A study analyzing injury reports from 112 U.S. health care
facilities reported a PHI incidence rate of 11.3 per 10,000 worker-months.[23] Another study
showed that work-related low back pain prevalence was two times higher among nurses who
performed patient handling than nurses without patient handling duty.[12] The current epidemic of
obesity and related increases of bariatric patients is expected to further elevate the risk of PHI.[24]
Research evidence indicates that programs for PHI prevention need to use multifaceted strategies
incorporating safe patient handling policy, patient handling equipment, lift teams, training,
patient care ergonomic assessment protocols, peer leaders, and safe work practices.[25-36]
In recognition of the substantial problem of injuries from unsafe patient handling and the critical
need for effective workplace interventions, state laws have been promulgated to protect
healthcare workers. Since 2005, 11 states have passed safe patient handling legislation and most
states require implementation of comprehensive safe patient handling policy and programs.[37] At
the national level, federal bills, including the 2015 Nurse and Health Care Worker Protection Act

4
(H.R.4266), have been introduced but not passed.[38, 39] Along with this effort, the ANA led a
national campaign for safe patient handling in 2003 and later developed the Safety Patient
Handling and Mobility Interprofessional National Standards in 2013.[40]
In California, the safe patient handling law (AB1136 Hospital Patient and Health Care Worker
Injury Protection Act) was passed on October 7, 2011 and became effective on January 1, 2012.
To implement the law, the California Division of Occupational Safety and Health (Cal/OSHA)
developed a specific regulation (General Industry Safety Orders §5120. Health Care Worker
Back and Musculoskeletal Injury Prevention), which became effective on October 1, 2014.[41, 42]
Research is needed to identify whether the policies and programs required by the safe patient
handling laws and regulations are successfully implemented, how the policies and programs
affect safety practices of workers, and whether the laws and regulations are effective in
preventing MSDs among healthcare workers. There have been studies examining the
effectiveness and outcomes of safe patient handling programs at the institutional level,[27, 29-31, 34,
36, 43, 44] but research evaluating the statewide impact of legislation has been very limited. Among
11 states with a safe patient handling law, Washington State (legislation in 2006) assessed the
legislative impacts. They analyzed workers’ compensation claims rates and conducted surveys of
direct care staff and safe patient handling committee representatives compared to a control state
of Idaho without safe patient handling legislation .[45] A 2011 report by the State of Washington
showed decreased rates for all workers’ compensation claims, back claims, and claims involving
another person in hospitals, increased adoption of a safe patient handling policy, increased
availability of patient handling equipment, and more routine use of patient handling equipment,
and lower perception of injury risk.[45] Although the Washington report provided valuable data
on the legislative impact, safe patient handling law requirements vary across states and the
findings may not be generalizable to other states. There are clear data gaps to understand the
impact of California’s safe patient handling law and regulations.
Study Purpose
The purpose of this study was to explore the impact of California’s safe patient handling law and
regulation on MSD and PHI prevention among healthcare workers in California using both
quantitative and qualitative approaches. This study analyzed California workers’ compensation
(WC) claims data to investigate changes in MSD and PHI claims and associated costs in 2007-
2016 among California healthcare workers. This study also conducted focus groups to
understand the perceptions and experiences of nurses and patient care staff regarding the safe
patient handling law, policies, programs, and practices. The study had the following specific
aims.
Aim 1. Describe the magnitude, distributions, and incidence rates of WC claims among
California healthcare workers in 20072016 (total and by year):
a. Claims by injury type: MSD (PHI and non-PHI) and non-MSD
b. Claims by setting: hospital, nursing and residential care facilities, and other
c. Claims by occupation: nursing workers
d. Claims by body part and nature of injury
e. Claims by demographics

5
Aim 2. Examine changes of claim numbers and incidence rates of MSD and PHI claims
over time in 20072016. Compare the data between MSD and non-MSD cases,
between PHI and non-PHI cases, and between hospital and non-hospital cases.
a. Pre- vs. post-legislation periods (2007-2011 vs. 2012-2016)
b. Pre-legislation vs. post-Cal/OSHA regulation periods (2007-2011 vs. 2015-
2016)
c. Change over a 6-year period (2011-2016)
Aim 3. Describe the cost of MSD and PHI claims among California healthcare workers.
Aim 4. Describe perceptions and experiences of nurses and patient care staff regarding the
safe patient handling law, policies and programs in their hospitals, and their impact
on patient handling practices.
Conceptual Framework
Figure 1. Conceptual Framework
Figure 1 shows the conceptual framework of this study. The study was based on the RE-AIM
framework that provides a useful guide for evaluating the impact of public health
interventions.[46] The framework guides to evaluate interventions in the following five
dimensions: Reach, Efficacy/Effectiveness, Adoption, Implementation, and Maintenance. In the
study, the five dimensions apply to both organizations and individuals. Reach refers to the
characteristics of hospitals or workers that are affected by the safe patient handling law, policies
or programs. Effectiveness refers to positive outcomes or improvement in targeted safety or
health indicators. Adoption refers to adoption of required policies, programs and practices by
hospitals and workers. Implementation refers to the extent to which the safe patient handling
programs are implemented and safety practices are performed and complied. Maintenance refers
to the extent to which the safe patient handling program and practices are sustained over time.
Reach, Adoption, Implementation, and Maintenance dimensions were assessed qualitatively by
the focus group study of nurses and patient care workers. Effectiveness was assessed
quantitatively by analyzing the WC data.
This study was conducted after receiving the approvals of the Institutional Review Boards in the
University of California, San Francisco (UCSF) and the California State Committee for the
Protection of Human Subjects (CPHS).

6
A. ANALYSIS OF CALIFORNIA WORKERS’ COMPENSATION CLAIMS DATA
METHODS
Study Design
This study was a retrospective, descriptive study with a time-series design and analyzed the WC
claims data for healthcare workers from 2007 to 2016 (10-year period) to assess the impact of
California’s safe patient handling legislation. The year of cases was based on the date of injury
of the claim. Data from 2007 to 2011 were claims on injuries that occurred in the pre-legislation
period; data from 2012 to 2016 were claims on injuries that occurred in the post-legislation
period. Cases during the post-legislation period were further divided into injury claims in the
pre-Cal/OSHA regulation period (2012-2014) and the post-Cal/OSHA regulation period (2015-
2016). As the California safe patient handling law applies to general acute care hospitals only,
this study used cases in other settings as comparison groups.
Data Sources
This study used claims data from the Workers’ Compensation Information System (WCIS) in the
California Department of Industrial Relations (DIR). This study also referred to the healthcare
facility data from the Office of Statewide Health Planning and Development (OSHPD). For
denominators for rate calculation, the Bureau of Labor Statistics (BLS) Quarterly Census of
Employment and Wages (QCEW) was used.
California WCIS
In California, occupational injury or illness that results in lost time beyond the date of the
incident or that requires medical treatment beyond first aid must be reported by workers
compensation insurance carriers to the California DIR.[47] The WCIS collects claims data on
employee, employer, industry, occupation, accident, injury, progress, benefits, and payments
using an electronic data interchange system.[48] Claim administrators—insurers, self-insured self-
administered employers, or third-party administrators—are required to submit First and
Subsequent Reports of Injury (FROI/SROI), medical bill/payment records, and annual summary
of benefits. It should be noted that WCIS covers only state employers and does not collect
information from federal employers (e.g., Veterans Affairs healthcare system). Electronic
submission of injury reports (FROI/SROI) has been required since 2000 and electronic reporting
of medical billing data has been required since September 2006.[48] We obtained FROI, SROI,
and medical billing data from 2007 (when injury reports and medical billing data both became
available) through 2016 from the Division of Workers’ Compensation (DWC). For the data
access, a Memorandum of Understanding (MOU) was established between the DWC and the
UCSF. The DWC extracted data for healthcare worker cases using a broad definition (described
later) from the WCIS system and delivered the data through a secure FTP site. This study used
the following data elements: date of injury, nature of injury, cause of injury, part of body injured,
accident description, date of birth, date of hire, gender, occupation description, employer name,
employer zip code, injury site zip code, class code, industry code, total amount paid per bill, and
total charge per bill.

7
California OSHPD
The OSHPD collects statewide data about healthcare infrastructure, workforce, and outcomes.[49]
The data are publicly available (http://www.oshpd.ca.gov/HID/DataFlow/). We utilized the
OSHPD healthcare facility listing information to verify the type of healthcare facility (i.e.,
hospital, long-term care, or clinic) or to identify zip codes of healthcare facilities for case
identification.
BLS QCEW
The BLS QCEW program provides monthly employment and quarterly wage information by
industry at national, state, and county levels.[50] Employers reporting to the QCEW program
cover 98% of all jobs in the US. Excluded are members of the armed forces, the self-employed,
proprietors, domestic workers, unpaid family workers, and railroad workers covered by the
railroad unemployment insurance system.[50] QCEW data are publicly available at
http://www.bls.gov/cew/data.htm. QCEW provides the annual average of employment counts by
industry. We used California data from the QCEW to obtain denominators to calculate incidence
rates of claims.
Case Definitions and Identification
Figure 2 presents the overview of cases used in this study.
Figure 2. Overview of cases in the study
Healthcare Worker Cases
Healthcare workers were defined as those who were employed in the healthcare industry. Our
case definition included various types of workers in healthcare industry or facilities, regardless of
their job titles, and contractors and trainees were also included. WCIS has two data elements
related to industry: Industry Code and Class Code. For Industry Codes, WCIS uses the Standard
Industrial Classification (SIC) and the North American Industry Classification System (NAICS);
claims administrators are asked to report the primary nature of employer’s business by either
code.[48] Class Codes are California-specific 4-digit codes from the Workers’ Compensation
Insurance Rating Bureau (WCIRB) of California. The codes represent the nature of the
employer’s business or type of job.[48] NAICS and SIC codes for healthcare industry and WCIS
Class Codes that can be used to identify healthcare worker cases are listed in Table 1.

8
Table 1. Industry Codes and WCIS Class Codes for healthcare worker case identification Industry Code (NAICS) Industry Code (SIC) Class Code
621 6211 6212 6213 6214 6215 6216 6219 622 6221 6222 6223 623 6231 6232 6233 6239
Ambulatory health care services Offices of physicians Offices of dentists Offices of other health practitioners Outpatient care centers Medical and diagnostic laboratories Home health care services Other ambulatory health care services Hospitals General medical and surgical hospitals Psychiatric and substance abuse hospitals Specialty (excl. Psychiatric/substance abuse) hospitals Nursing and residential care facilities Nursing care facilities (skilled nursing facilities) Residential intellectual and developmental disability, mental health, and substance abuse facilities Continuing care retirement communities and assisted living facilities for the elderly Other residential care facilities
80 801 802 803 804 805 806 807 808 809 8361
Health services Offices and clinics of doctors of medicine Offices and clinics of dentists Offices and clinics of doctors of osteopathy Offices and clinics of other health practitioners Nursing and personal care facilities Hospitals Medical and dental laboratories Home health care services Miscellaneous health and allied services, NEC Residential care
7332 8823 8827 8829 8830 8831 8834 8839 8851 8852 9043 9070 9085
Ambulance service Residential care facilities for children Homemaker services Nursing homes Institutional employees Hospitals-veterinary Physicians Dentists Congregate living facilities for the elderly Home infusion therapists – all employees Hospitals Residential care facilities for the elderly – NOC Residential care facilities for the developmentally disabled
It should be noted that workers employed in federal healthcare facilities are not reported to the
WCIS. In addition, in the WCIS, government healthcare facilities are generally coded as
government industry (not healthcare) and thus healthcare workers employed in these facilities are
not captured by Industry or Class Codes indicating healthcare. To capture all healthcare worker
cases, including cases in government facilities (particularly hospitals), we developed and used a
broad approach for initial case extraction using the following four search strategies:
Healthcare Industry and Class Codes (Table 1)
Employer Name search terms that can indicate healthcare employers (n=200: e.g.,
'%HOSP%', ‘% MED %’, ‘%SURGERY%’, ‘% MENTAL %’, ‘%DENTAL%’, ‘%CLINIC%’,
'%HEALTH%', '%CARE%', ’MD’, ‘O.D.’, '%AMBULA%').
Occupation search terms that can indicate healthcare (n=182: e.g., RN, LVN, CNA, M.D.,
'%MED.%', '%NURSE%', '%CARE%GIVE%', '%HEALTH%', '%PATIEN%').
Injury description indicating patient-related injuries: ‘PATIENT’ or ‘PT’ included in the
middle of the narrative; ‘PATIENT’ or ‘PT’ repeated twice in the narrative; both
‘PATIENT’/’PT’ and ‘BED’ are included in the narrative; ‘PATIENT’ or ‘PT’ included in
the narrative and Cause of Injury code=74 (Struck or injured by fellow worker, patient or
other person)
Using this method, the DWC extracted 959,292 potential healthcare worker cases in 2007-2016
from the WCIS. Of the cases, 44.4% (n=425,500) had both healthcare Industry and Class Codes;
13.1% (n=125,493) had only healthcare Industry Codes; 13.1% (n=125,195) had only healthcare
Class Codes; and 29.5% (n=283,104) had neither healthcare codes. We reviewed employer
name, occupation description, injury description, and, if needed, zip codes of employer and
injury sites to determine healthcare worker cases. Based on the level of evidence, cases were
classified into definite, possible, and not likely or not categories (Table 2). Using this method, the
potential healthcare cases extracted were categorized into 621,796 (64.8%) definite, 151,101
(15.8%), and 186,395 (19.4%) not likely or not healthcare cases. Healthcare cases for data
analysis included definite and possible case categories (n=772,897). Of the definite or possible
cases, 55.1% (n=425,478) had both relevant healthcare Industry and Class Codes, 29.7%
(n=229,795) had only one relevant code, and 15.2% (n=117,624) were identified by other
approaches using employer name, occupational description, and injury description.

9
Table 2. Healthcare worker case categories Category Criteria
Definite Healthcare by both Industry Code and Class Code
Healthcare by either Industry Code or Class Code (not both), plus any evidence indicating
healthcare worker from employer name, occupation description, or injury description
Possible No healthcare Industry and Class Codes, but 2 or more evidence indicating healthcare
worker from employer name, occupation description, or injury description
No healthcare Industry and Class Codes, but healthcare worker by employer name
(definite by the narrative)
Healthcare by either Industry Code or Class Code (not both), but no evidence for
healthcare worker from employer name, occupation description, or injury description
No healthcare Industry and Class Codes, but possibly healthcare worker by employer
name, occupation description, or injury description (by only one info)
Not
likely/Not Evidence indicating non-healthcare (e.g., veterinary, pharmacy (retail), medical
instrument manufacturing, police, firefighter, public health assistant/investigator)
Hospital Cases and Non-Hospital Cases
Healthcare worker cases were classified into hospital cases and non-hospital cases (nursing and
residential care facility and other). In defining hospital cases, we excluded cases in general acute
care hospitals within the Department of Corrections and Rehabilitation or the State Department
of Developmental Services. This exclusion was based on the stipulation of exceptions to the
Cal/OSHA safe patient handling regulation.[42] Depending on the strength of the evidence,
reviewed cases were classified into definite, possible, and not likely or not categories (Table 3).
Table 3. Hospital case categories Category Criteria
Definite Hospital by both Industry Code (SIC 80 & NAICS 622) and Class Code (9043)
Hospital by employer name (definite by the narrative)
Possible Hospital by either Industry Code or Class Code (not both), plus employer name possibly
indicating hospitals
Hospital by either Industry Code or Class Code (not both), plus either hospital or
ambulatory care is possible by employer name entry
Hospital by either Industry Code or Class Code (not both), plus HCW occupation
Hospital by either Industry Code or Class Code (not both), plus any information
indicating contractor by Industry/Class code or employer name
Government hospital cases identified by the combination of Industry/Class Codes,
employer name, zip code, occupational description, and injury description
Not
likely/Not
State prison hospitals, developmental service facilities
Non-hospital settings
Among 772,897 healthcare cases, 36.9% (n=285,166) were identified as hospital cases, including
197,180 (25.5%) definite and 87,986 (11.4%) possible hospital cases. Among these hospital
cases, less than 3% had Industry Codes or employer names indicating specialty, psychiatric, or
convalescent hospitals, and at least 90% had some levels of evidence indicating general acute
care hospitals: e.g., 50.3% (n=143,448) had General Medical and Surgical Hospitals Industry
Codes (SIC 8062 or NAICS 6221) and 33.1% (n=94,303) had hospital codes by both Class
(9043) and Industry (SIC 806 or NAICS 622) Codes along with employer names indicating

10
hospital cases. In the analysis, all definite and possible hospitals cases were grouped as hospital
cases, and other cases were grouped as non-hospital cases.
Among non-hospital cases, nursing and residential care facility cases were identified using Class
Codes (8823, 8829, 8851, 9070, 9085) and Industry Codes (SIC 805, 8361 or NAICS 623), and
employer names and occupation descriptions were further reviewed for additional capture or
exclusion of cases. Among 487,731 non-hospital cases, 180,739 (37.1%) cases were identified as
nursing and residential care facility cases: 78,943 (43.7%) cases by both Class and Industry
codes, 100,377 (55.5%) cases by either Class Codes or Industry Codes (not both), and 1,419
(0.8%) cases by review of employer name and occupation descriptions.
Nursing Worker Cases
The occupation description narrative data were used to identify nursing worker claims. In this
study, nursing workers included nurses and nursing or patient care assistant occupations.
Because it was not always possible to separate nurse and nursing assistant/aide titles from
occupation description, we used the broad definition by combining all nursing-related workers.
The examples of coding terms are presented in Table 4. Among the healthcare cases, 31.7%
(n=244,755) were identified as nursing workers: 114,055 (46.7%) in hospitals, 63,972 (26.1%) in
NRCFs, and 66,728 (27.3%) in other settings.
Table 4. Examples of nursing worker occupation coding terms 'RN %' 'R N %' 'R.N%' 'NP' '%LPN%' '%L.P.N%' '%L P N%' '%LVN%' '%L.V.N%'
'%L V N%' '%LIC%VOC%' '%CHARGE%NU%' '%LIC%PRACT%' '%CNA%' '%C.N.A%'
'C NA' '%RNA %' '%PT%CARE%' '%PAT%CARE%' '%PCA%' '%P.C.T%'
'PAITENT CARE AS' 'LICENSED VAC%'
MSD Cases
MSDs refer to injuries or illnesses of muscles, nerves, tendons, joints, cartilage, and supporting
structures of the upper and lower limbs, neck, and back that were caused, precipitated, or
exacerbated by sudden exertion or prolonged exposure to physical factors such as repetition,
force, vibration, or awkward posture.[51] To identify MSD cases from WC data, our case
definition was based on the combination of Cause of Injury, Nature of Injury, and Part of Body
Injured, and this study used a modified method of the case definition used by the California
Department of Public Health (CDPH) (Figure 3).
Figure 3. MSD Case Definition and Search Methods

11
PHI Cases
MSD cases were classified into PHI and non-PHI cases. PHIs are injuries that occur from or
during patient handling activities. Patient handling typically refers to activities of lifting,
transferring, repositioning, and helping patient mobility. In addition, PHI cases in this study
included injuries from patient care activities that involved moving or holding a body part or
assisting a patient’s body movement (e.g., dressing/bathing a patient, holding a leg during wound
care, making occupied bed) and patient transporting. PHIs were identified from narrative injury
descriptions. We used various combinations of specific terms or specific phrases to identify PHI
cases. The examples are presented in Table 5. Injuries where patients’ violent or combative
behaviors were likely to be the main cause were excluded from PHI cases. The examples of
violence case search terms are presented in Table 5. Because of incomplete or insufficient injury
descriptions, the identification of PHI cases was likely to be underestimated.
Table 5. Examples of patient handling injury and violence search terms Patient handling injury (“PATIENT” OR “PT” OR “RESIDENT” OR “CLIENT”)
AND (“REPOSITION” OR “TRANSFER” OR “LIFT” OR “TRANSPORT” OR “HANDLING”)
‘PULLED UP A PATIENT’
‘%PUSH% BED WITH % PATIENT%’
‘%TURN%PATIENT%’
‘%MOVE% FROM BED TO%’
'%ASSIST% PT FROM BED%'
'%ROLL% PATIENT%'
‘%HELP% TO AMBULATE%’
‘%PREVENT % PATIENT FROM FALLING%’
'PATIENT%FALL%GRAB%'
'%MAKE OCCUPIED BED%'
"HOLD" AND (“LEG” OR “ARM”)
Violence "ASSAULT"
"ATTACK"
"ALTERCATION"
"AGGRAVATE"
"AGGRESSIVE"
"ARGUMENT"
"ANGRY"
"AGITATE"
"BEAT"
"BITE"
"BIT"
"BLOW"
"CHOKE”
"COMBAT"
"CONFUSE"
"CHARGED"
"CONTAINMENT"
"FIGHT"
“HIT”
"HARASS"
"KICK"
"PUSHED"
"PUNCH"
"RESIST"
"SHOVED"
"STRUCK”
"SLAP"
"TACKLE"
"TAKEDOWN"
"VIOLEN"
Data Analysis
Data analysis was performed using the SAS 9.4 program (SAS Institute Inc., Cary, NC). Data
were described with frequency, percent, mean, median, standard deviation (SD), and interquartile
rage (IQR). Annual data were based on the year of injury. MSD and PHI claims were described
for all healthcare worker cases and by setting (hospital, nursing and residential care facility, and
other) and occupation (nursing workers). The changes of claim numbers between pre- and post-
legislation periods (2007-2011 vs. 2012-2016) were described by % change (difference in the
numbers between the two periods divided by the number for the pre-legislation period). MSD
and PHI claim cases were also described by age at the time of injury, gender, time from hire to
injury, and injury characteristics (cause of injury/activity, nature of injury, body part). Time from
hire to injury was calculated as the time interval between date of hire and date of injury and
categorized into 12 months or less, 13 months to 2 years, 3-4 years, 5-9 years, and 10+ years,
referring to the BLS.[52]

12
Annual incidence rates of MSD and PHI claims were calculated for all healthcare workers,
hospital workers, nursing and residential care facility workers, and nursing workers. The annual
average numbers of employees in healthcare industry, hospitals, and nursing and residential care
facilities from BLS QCEW were used as the denominators to calculate the annual incidence
rates. For nursing workers, the incidence rates were calculated for hospital cases and nursing and
residential care facility cases. As the specific numbers of nursing employees within hospitals and
nursing and residential care facilities were not available, the total numbers of all employees were
used as the proxy denominators to calculate rates for nursing workers in hospitals and in nursing
and residential care facilities. Average annual incidence rates and percent changes between the
time periods were calculated for pre- and post-legislation periods (2007-2011 vs. 2012-2016) and
the post-legislation period were further divided into pre- and post-Cal/OSHA regulation periods
(2012-2014 vs. 2015-2016). We modeled rates over time using a negative binomial model via
SAS Proc Genmod, and the Bayesian Information Criterion (BIC) was used for the model
selection.[53] We used data only from 2011 to 2016 for this analysis because we did not expect
rate reductions during the pre-legislation period and including the data before 2011 might
dilute the estimates of changes over time during the post-legislation period. The growth curve
model was fitted to the data to compare change over time between groups. Overall F test was
used to compare the growth curves between the groups. Incidence rate ratio (IRR) and 95%
Confidence Intervals (CI) were calculated.
To analyze medical costs, the FROI data were merged with the medical bill data using the unique
jurisdiction claim number. The data element “total amount paid per bill” from the medical bill
data was used to calculate the total payment for medical bills per claim. For each claim, the total
medical payment was calculated as the sum of payments for all medical bills. For the 10-year
medical bill data, 46-65% of injury cases in 2007-2015 had billing records but for 2016 injury
cases, only 6% had bill records. Thus, 2016 data were excluded from the medical cost analysis.
We further excluded 2007 data to look at equal time periods before and after legislation (2008-
2011 vs. 2012-2015). We also excluded 12 cases with negative numbers and 9,951 cases with
zero for the total paid amount, and 4 cases with outliers (> $10 million) with possible errors
indicated (i.e., the total paid amount was greater than the total charged amount). The 8-year total
paid medical costs from 2008 to 2015 were described with sum, mean, median, maximum, and
standard deviation (SD). Percentage changes over the time periods were also calculated.

14
RESULTS
Healthcare Worker Claims in 2007-2016, California
In 2007-2016, there were 5,781,856 WC claims reported to the California WCIS. Among the
cases, 772,897 claims (13.4%) were identified as definite or possible healthcare worker cases. Of
the healthcare worker claims, 36.9% were hospital cases (n=285,166), 23.4% were nursing and
residential care facility cases (n=180,739), and 39.7% were other cases (n=306,992). Among
healthcare worker claims, 31.7% were identified as nursing workers (n=244,755). Of the nursing
workers, 46.6% were hospital cases, 26.1% were nursing and residential care facility cases, and
27.3% were nursing cases in other settings. Annual numbers and percent distributions of
healthcare worker claims by case types in 2007-2016 are provided in Table 6.
Figure 4 shows changes of the numbers of all healthcare worker claims and nursing worker
claims by type of setting from 2007 to 2016. Comparing the numbers between the pre-legislation
period (2007-2011) and the post-legislation period (2012-2016), hospital claims decreased by
3.53% and hospital nursing worker claims decreased by 4.40%; on the other hand, non-hospital
claims in nursing and residential care facility and other settings rarely changed (-0.44%) and
non-hospital nursing worker claims increased by 3.16%.
Figure 4. Workers’ compensation claims among California healthcare workers, 2007-2016:
All workers and nursing workers
Data Source: California Department of Industrial Relations, Workers’ Compensation Information System

14
Table 6. Workers’ compensation claims among healthcare worker cases, California, 2007-2016
Year of Injury
Change:
Post-Pre
%
Changee
Pre-Legislation (Safe Patient Handling) Post-Legislation
Case type Total 2007 2008 2009 2010 2011 2012 2013 2104 2015 2016
Total claimsa 5,781,856 644,700 613,800 553,600 531,700 526,969 534,872 561,702 586,525 606,792 621,196 40,318 1.40
Healthcare worker casesb 772,897 78,038 78,277 77,115 79,007 77,105 78,424 76,050 76,195 77,216 75,470 -6,187 -1.59
Healthcare worker cases (%) 13.4 12.1 12.8 13.9 14.9 14.6 14.7 13.5 13.0 12.7 12.1
Healthcare cases by setting
Hospitalc 285,166 29,492 29,382 29,061 28,899 28,310 29,378 29,010 28,460 25,791 27,383 -5,122 -3.53
Hospital (%) 36.9 37.8 37.5 37.7 36.6 36.7 37.5 38.2 37.4 33.4 36.3
Nursing and residential care 180,739 18,193 18,433 17,960 18,692 17,574 17,628 17,836 18,015 18,490 17,918 -965 -1.06
Nursing and residential care (%) 23.4 23.3 23.6 23.3 23.7 22.8 22.5 23.5 23.6 24.0 23.7
Other 306,992 30,353 30,462 30,094 31,416 31,221 31,418 29,204 29,720 32,935 30,169 -100 -0.07
Other (%) 39.7 38.9 38.9 39.0 39.8 40.5 40.1 38.4 39.0 42.7 40.0
Nursing worker casesd 244,755 24,389 24,507 24,691 24,896 24,163 24,608 24,231 24,350 24,820 24,100 -537 -0.44
Hospital 114,055 11,561 11,535 11,983 11,906 11,326 11,757 11,534 11,310 10,382 10,761 -2,567 -4.40
Hospital (%) 46.6 47.4 47.1 48.5 47.8 46.9 47.8 47.6 46.5 41.8 44.7
Nursing and residential care 63,972 6,404 6,736 6,431 6,453 6,324 6,307 6,283 6,193 6,482 6,359 -724 -2.24
Nursing and residential care (%) 26.1 26.3 27.5 26.1 25.9 26.2 25.6 25.9 25.4 26.1 26.4
Other 66,728 6,424 6,236 6,277 6,537 6,513 6,544 6,414 6,847 7,956 6,980 2,754 8.61
Other (%) 27.3 26.3 25.5 25.4 26.3 27.0 26.6 26.5 28.1 32.1 29.0
Data Source: California Department of Industrial Relations, Workers’ Compensation Information System.
Note: Federal employees are not reported to the system. Percentage numbers may not add up to 100 due to rounding.
a. Source: California Commission on Health and Safety and Workers’ Compensation annual reports. https://www.dir.ca.gov/chswc/AnnualReportpage1.html
b. Case classification is based on the level of evidence from Class Code, Industry Code (SIC or NAICS), employer name, occupational description, and injury description.
c. Cases in general acute care hospitals within the Department of Corrections and Rehabilitation or the State Department of Developmental Services were excluded; these cases
were included in “Other” category.
d. Nursing workers include nurse, nursing assistant, and patient care occupations.
e. Difference in the numbers between the two periods divided by the number for the pre-legislation period

15
MSD Claims among Healthcare Workers
In 2007-2016, 311,269 claims were identified as MSD cases; these MSD claims accounted for
40.3% of healthcare worker claims. Among MSD claims in healthcare worker cases, 40.2% were
hospital cases, 23.9% were nursing and residential care facility cases, and 35.9% were other
cases. Nursing workers accounted for 32.9% of MSD claims. Figure 5 shows the changes of the
annual numbers of MSD claims among all healthcare workers and by setting, occupation, and
injury type during 2007-2016. Detailed data are presented in Table 7. Between the pre- and the
post-legislation periods, the number of MSD claims rarely changed among all healthcare workers
(-0.46%), yet the annual number of MSD claims was lowest in 2016 (n=29,838). Between the
two time periods, the number of non-MSD claims decreased by 2.34%.
Figure 5. Musculoskeletal Disorders (MSDs) in workers' compensation claims among California
healthcare workers, 20072016: Claims by setting, occupation, and injury type
Data Source: California Department of Industrial Relations, Workers’ Compensation Information System

16
Table 7. Workers’ compensation claims due to musculoskeletal disorders (MSD) by setting, occupation, and injury type among healthcare
workers, California, 2007-2016
Claim type Total
Year of Injury
Change:
Post-Pre %
Changed
Pre-Legislation (Safe Patient Handling) Post-Legislation
2007 2008 2009 2010 2011 2012 2013 2014 2015 2016
Healthcare worker cases 772,897 78,038 78,277 77,115 79,007 77,105 78,424 76,050 76,195 77,216 75,470 -6,187 -1.59
MSD cases 311,269 31,625 30,926 30,411 31,934 31,095 31,905 31,279 31,236 31,020 29,838 -713 -0.46
MSD cases (%) 40.3 40.5 39.5 39.4 40.4 40.3 40.7 41.1 41.0 40.2 39.5
Non-MSD cases 461,628 46,413 47,351 46,704 47,073 46,010 46,519 44,771 44,959 46,196 45,632 -5,474 -2.34
Non-MSD cases (%) 59.7 59.5 60.5 60.6 59.6 59.7 59.3 58.9 59.0 59.8 60.5
MSD cases by setting
Hospitala 125,237 13,103 12,828 12,656 13,024 12,277 13,019 13,033 12,843 10,932 11,522 -2,539 -3.97
Hospital (%) 40.2 41.4 41.5 41.6 40.8 39.5 40.8 41.7 41.1 35.2 38.6
Nursing and residential care 74,310 7,351 7,247 6,913 7,252 7,253 7,361 7,548 7,729 7,929 7,727 2,278 6.32
Nursing and residential care (%) 23.9 23.2 23.4 22.7 22.7 23.3 23.1 24.1 24.7 25.6 25.9
Other 111,722 11,171 10,851 10,842 11,658 11,565 11,525 10,698 10,664 12,159 10,589 -452 -0.81
Other (%) 35.9 35.3 35.1 35.7 36.5 37.2 36.1 34.2 34.1 39.2 35.5
MSD cases by occupation
Nursing casesb 102,271 10,389 10,239 10,182 10,516 10,077 10,229 10,195 10,161 10,391 9,892 -535 -1.04
Nursing cases (%) 32.9 32.9 33.1 33.5 32.9 32.4 32.1 32.6 32.5 33.5 33.2
Non-Nursing cases 208,998 21,236 20,687 20,229 21,418 21,018 21,676 21,084 21,075 20,629 19,946 -178 -0.17
Non-Nursing cases (%) 67.1 67.2 66.9 66.5 67.1 67.6 67.9 67.4 67.5 66.5 66.9
MSD cases by patient handling
PHIc cases 87,348 8,757 9,138 9,046 9,310 9,066 9,359 8,631 8,147 8,066 7,828 -3,286 -7.25
PHI cases (%) 28.1 27.7 29.6 29.8 29.2 29.2 29.3 27.6 26.1 26.0 26.2
Non-PHI cases 223,921 22,868 21,788 21,365 22,624 22,029 22,546 22,648 23,089 22,954 22,010 2,573 2.32
Non-PHI cases (%) 71.9 72.3 70.5 70.3 70.9 70.8 70.7 72.4 73.9 74.0 73.8
Data Source: California Department of Industrial Relations, Workers’ Compensation Information System.
Note: Federal employees are not reported to the system. Percentage numbers may not add up to 100 due to rounding.
a. Cases in general acute care hospitals within the Department of Corrections and Rehabilitation or the State Department of Developmental Services were excluded; these cases
were included in “Other” category.
b. Nursing workers include nurse, nursing assistant, and patient care occupations.
c. PHI: Patient handing injury
d. Difference in the numbers between the two periods divided by the number for the pre-legislation period
17
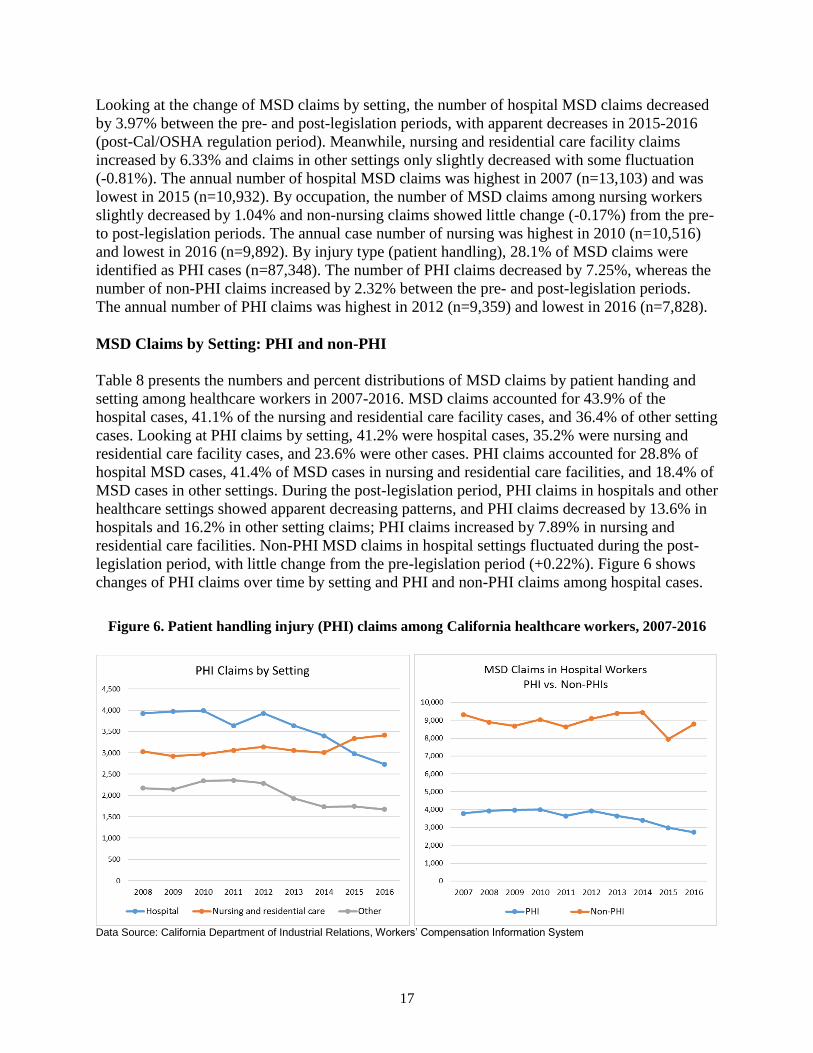
Looking at the change of MSD claims by setting, the number of hospital MSD claims decreased
by 3.97% between the pre- and post-legislation periods, with apparent decreases in 2015-2016
(post-Cal/OSHA regulation period). Meanwhile, nursing and residential care facility claims
increased by 6.33% and claims in other settings only slightly decreased with some fluctuation
(-0.81%). The annual number of hospital MSD claims was highest in 2007 (n=13,103) and was
lowest in 2015 (n=10,932). By occupation, the number of MSD claims among nursing workers
slightly decreased by 1.04% and non-nursing claims showed little change (-0.17%) from the pre-
to post-legislation periods. The annual case number of nursing was highest in 2010 (n=10,516)
and lowest in 2016 (n=9,892). By injury type (patient handling), 28.1% of MSD claims were
identified as PHI cases (n=87,348). The number of PHI claims decreased by 7.25%, whereas the
number of non-PHI claims increased by 2.32% between the pre- and post-legislation periods.
The annual number of PHI claims was highest in 2012 (n=9,359) and lowest in 2016 (n=7,828).
MSD Claims by Setting: PHI and non-PHI
Table 8 presents the numbers and percent distributions of MSD claims by patient handing and
setting among healthcare workers in 2007-2016. MSD claims accounted for 43.9% of the
hospital cases, 41.1% of the nursing and residential care facility cases, and 36.4% of other setting
cases. Looking at PHI claims by setting, 41.2% were hospital cases, 35.2% were nursing and
residential care facility cases, and 23.6% were other cases. PHI claims accounted for 28.8% of
hospital MSD cases, 41.4% of MSD cases in nursing and residential care facilities, and 18.4% of
MSD cases in other settings. During the post-legislation period, PHI claims in hospitals and other
healthcare settings showed apparent decreasing patterns, and PHI claims decreased by 13.6% in
hospitals and 16.2% in other setting claims; PHI claims increased by 7.89% in nursing and
residential care facilities. Non-PHI MSD claims in hospital settings fluctuated during the post-
legislation period, with little change from the pre-legislation period (+0.22%). Figure 6 shows
changes of PHI claims over time by setting and PHI and non-PHI claims among hospital cases.
Figure 6. Patient handling injury (PHI) claims among California healthcare workers, 2007-2016
Data Source: California Department of Industrial Relations, Workers’ Compensation Information System

18
Table 8. Workers’ compensation claims due to musculoskeletal disorders (MSD) and patient handling injuries (PHI) by type of setting
among healthcare workers, California, 2007-2016
Setting and Claim type Total
Year of Injury
Change:
Post-Pre %
Changeb
Pre-Legislation (Safe Patient Handling) Post-Legislation
2007 2008 2009 2010 2011 2012 2013 2014 2015 2016
Hospitala 285,166 29,492 29,382 29,061 28,899 28,310 29,378 29,010 28,460 25,791 27,383 -5,122 -3.53
MSD cases 125,237 13,103 12,828 12,656 13,024 12,277 13,019 13,033 12,843 10,932 11,522 -2,539 -3.97
MSD cases (%) 43.9 44.4 43.7 43.5 45.1 43.4 44.3 44.9 45.1 42.4 42.1
PHI cases 36,016 3,785 3,930 3,975 3,994 3,642 3,930 3,639 3,402 2,983 2,736 -2,636 -13.64
PHI cases (%) 28.8 28.9 30.6 31.4 30.7 29.7 30.2 27.9 26.5 27.3 23.7
Non-PHI cases 89,221 9,318 8,898 8,681 9,030 8,635 9,089 9,394 9,441 7,949 8,786 97 0.22
Non-PHI cases (%) 71.2 71.1 69.4 68.6 69.3 70.3 69.8 72.1 73.5 72.7 76.3
Nursing and residential care 180,739 18,193 18,433 17,960 18,692 17,574 17,628 17,836 18,015 18,490 17,918 -965 -1.06
MSD cases 74,310 7,351 7,247 6,913 7,252 7,253 7,361 7,548 7,729 7,929 7,727 2,278 6.32
MSD cases (%) 41.1 40.4 39.3 38.5 38.8 41.3 41.8 42.3 42.9 42.9 43.1
PHI cases 30,755 2,801 3,032 2,926 2,971 3,064 3,141 3,059 3,010 3,335 3,416 1,167 7.89
PHI cases (%) 41.4 38.1 41.8 42.3 41.0 42.2 42.7 40.5 38.9 42.1 44.2
Non-PHI cases 43,555 4,550 4,215 3,987 4,281 4,189 4,220 4,489 4,719 4,594 4,311 1,111 5.24
Non-PHI cases (%) 58.6 61.9 58.2 57.7 59.0 57.8 57.3 59.5 61.1 57.9 55.8
Other healthcare 306,992 30,353 30,462 30,094 31,416 31,221 31,418 29,204 29,720 32,935 30,169 -100 -0.07
MSD cases 111,722 11,171 10,851 10,842 11,658 11,565 11,525 10,698 10,664 12,159 10,589 -452 -0.81
MSD cases (%) 36.4 36.8 35.6 36.0 37.1 37.0 36.7 36.6 35.9 36.9 35.1
PHI cases 20,577 2,171 2,176 2,145 2,345 2,360 2,288 1,933 1,735 1,748 1,676 -1,817 -16.23
PHI cases (%) 18.4 19.4 20.1 19.8 20.1 20.4 19.9 18.1 16.3 14.4 15.8
Non-PHI cases 91,145 9,000 8,675 8,697 9,313 9,205 9,237 8,765 8,929 10,411 8,913 1,365 3.04
Non-PHI cases (%) 81.6 80.6 79.9 80.2 79.9 79.6 80.1 81.9 83.7 85.6 84.2
Data Source: California Department of Industrial Relations, Workers’ Compensation Information System.
Note: Federal employees are not reported to the system. Percentage numbers may not add up to 100 due to rounding.
a. Cases in general acute care hospitals within the Department of Corrections and Rehabilitation or the State Department of Developmental Services were excluded; these cases
were included in “Other” category.
b. Difference in the numbers between the two periods divided by the number for the pre-legislation period.

19
MSD and PHI Claims among Nursing Workers
Table 9 presents MSD and PHI claims by setting among nursing workers in 2007-2016; the
changes over time are shown in Figure 7. MSDs accounted for 41.8% of nursing worker claims:
by setting, 44.9% of hospital claims, 45.4% of nursing and residential care facility claims, and
33.3% of claims in other settings. Between the pre- and post-legislation periods, nursing workers
with MSD claims decreased in hospital settings by 7.99% but increased in nursing and
residential care facilities (+1.50%) and other settings (+13.4%). In 2007-2016, 48,487 nursing
worker claims were identified as PHI cases, and PHIs accounted for 47.4% of MSD claims
among nursing workers. By setting, PHIs accounted for 49.4% of MSD claims in hospital
nursing workers, 57.2% of MSD claims in nursing and residential care facility nursing workers,
and 29.8% of MSD claims in other nursing workers. The hospital nursing PHI claims showed an
apparent decreasing pattern during the post-legislation period with a decrease by 17.0%. PHI
claims in other settings also decreased by 10.5%; PHI claims in nursing and residential care
facilities had little change from the pre-legislation period (0.99%). Figure 7 shows the changes of
MSD and PHI claims among nursing workers over time by setting.
Figure 7. Musculoskeletal disorder (MSD) and patient handling injury (PHI) claims
among nursing workers by setting, 2007-2016, California
Data Source: California Department of Industrial Relations, Workers’ Compensation Information System

20
Table 9. Workers’ compensation claims due to musculoskeletal disorders (MSD) and patient handling injuries (PHI) among nursing
workers by type of setting, California, 2007-2016
Setting and Claim type Total
Year of Injury
Change:
Post-Pre %
Changeb
Pre-Legislation (Safe Patient Handling) Post-Legislation
2007 2008 2009 2010 2011 2012 2013 2014 2015 2016
Nursing workers, all 244,755 24,389 24,507 24,691 24,896 24,163 24,608 24,231 24,350 24,820 24,100 -537 -0.44
MSD cases 102,271 10,389 10,239 10,182 10,516 10,077 10,229 10,195 10,161 10,391 9,892 -535 -1.04
MSD cases (%) 41.8 42.6 41.8 41.2 42.2 41.7 41.6 42.1 41.7 41.9 41.1
PHI cases 48,487 5,010 5,260 5,090 5,240 4,961 5,140 4,797 4,438 4,453 4,098 -2,635 -10.31
PHI cases (%) 47.4 48.2 51.4 50.0 49.8 49.2 50.2 47.1 43.7 42.9 41.4
Non-PHI cases 53,784 5,379 4,979 5,092 5,276 5,116 5,089 5,398 5,723 5,938 5,794 2,100 8.13
Non-PHI cases (%) 52.6 51.8 48.6 50.0 50.2 50.8 49.8 52.9 56.3 57.1 58.6
Hospitala 114,055 11,561 11,535 11,983 11,906 11,326 11,757 11,534 11,310 10,382 10,761 -2,567 -4.40
MSD cases 51,189 5,303 5,264 5,394 5,618 5,081 5,333 5,215 5,055 4,437 4,489 -2,131 -7.99
MSD cases (%) 44.9 45.9 45.6 45.0 47.2 44.9 45.4 45.2 44.7 42.7 41.7
PHI cases 25,287 2,662 2,835 2,818 2,930 2,574 2,776 2,521 2,338 2,024 1,809 -2,351 -17.01
PHI cases (%) 49.4 50.2 53.9 52.2 52.2 50.7 52.1 48.3 46.3 45.6 40.3
Non-PHI cases 25,902 2,641 2,429 2,576 2,688 2,507 2,557 2,694 2,717 2,413 2,680 220 1.71
Non-PHI cases (%) 50.6 49.8 46.1 47.8 47.8 49.3 47.9 51.7 53.7 54.4 59.7
Nursing and residential care 63,972 6,404 6,736 6,431 6,453 6,324 6,307 6,283 6,193 6,482 6,359 -724 -2.24
MSD cases 29,038 2,923 3,038 2,779 2,771 2,900 2,860 2,873 2,841 3,044 3,009 216 1.50
MSD cases (%) 45.4 45.6 45.1 43.2 42.9 45.9 45.3 45.7 45.9 47.0 47.3
PHI cases 16,624 1,588 1,768 1,628 1,596 1,691 1,659 1,621 1,491 1,783 1,799 82 0.99
PHI cases (%) 57.2 54.3 58.2 58.6 57.6 58.3 58.0 56.4 52.5 58.6 59.8
Non-PHI cases 12,414 1,335 1,270 1,151 1,175 1,209 1,201 1,252 1,350 1,261 1,210 134 2.18
Non-PHI cases (%) 42.8 45.7 41.8 41.4 42.4 41.7 42.0 43.6 47.5 41.4 40.2
Other 66,728 6,424 6,236 6,277 6,537 6,513 6,544 6,414 6,847 7,956 6,980 2,754 8.61
MSD cases 22,044 2,163 1,937 2,009 2,127 2,096 2,036 2,107 2,265 2,910 2,394 1,380 13.36
MSD cases (%) 33.0 33.7 31.1 32.0 32.5 32.2 31.1 32.9 33.1 36.6 34.3
PHI cases 6,576 760 657 644 714 696 705 655 609 646 490 -366 -10.54
PHI cases (%) 29.8 35.1 33.9 32.1 33.6 33.2 34.6 31.1 26.9 22.2 20.5
Non-PHI cases 15,468 1,403 1,280 1,365 1,413 1,400 1,331 1,452 1,656 2,264 1,904 1,746 25.45
Non-PHI cases (%) 70.2 64.9 66.1 67.9 66.4 66.8 65.4 68.9 73.1 77.8 79.5
Data Source: California Department of Industrial Relations, Workers’ Compensation Information System.
Note: Federal employees are not reported to the system. Percentage numbers may not add up to 100 due to rounding.
a. Cases in general acute care hospitals within the Department of Corrections and Rehabilitation or the State Department of Developmental Services were excluded; these cases
were included in “Other” category.
b. Difference in the numbers between the two periods divided by the number for the pre-legislation period.

21
MSD and PHI Claim Rates
The trend of annual rates of WC claims among California healthcare workers by setting during
2007-2016 is shown in Figure 8. The detailed data are provided in Tables 10-11. Among all
workers, the MSD claim rate was highest in 2007 with 2.45 per 100 employees and was lowest
in 2016 with 1.86 per 100 employees; the rate decreased by 3.4% (IRR=0.966, 95% CI 0.958-
0.975, p<0.0001) per year during 2011-2016. The 5-year average claim rate decreased by 10.8%
from the pre-legislation (2.31) to the post-legislation period (2.06). The PHI claim rate was
highest in 2008 with 0.69 per 100 employees and lowest in 2016 with 0.52 per 100 employees;
the rate decreased by 6.0% (IRR=0.940, 95% CI 0.931-0.950) per year during 2011-2016. The 5-
year average claim rate decreased by 16.4% from the pre-legislation (0.67) to the post-legislation
period (0.56), more notably during the post-Cal/OSHA regulation period (-23.9%).
Figure 8. MSD and PHI claim rates (per 100 employees) among healthcare workers by setting
in 2007-2016, California
Data Source: California Department of Industrial Relations, Workers’ Compensation Information System
Among hospital workers, the annual MSD claim rate was highest during 2010-2013 and
decreased to 2.37-2.43 per 100 employees during 2015-2016. Compared to the pre-legislation
period, the 5-year average claim rate slightly decreased by 2.9% during the post-legislation
period, but there was a 12.7% decrease during the post-Cal/OSHA regulation period. During
2011-2016, the MSD rate among hospital workers decreased by 3.3% per year (IRR=0.967, 95%
CI 0.943-0.991, p=0.0086); the rate change tended to be greater than the changes of non-MSD
rates in hospital workers (IRR=0.981, 95% CI 0.971-0.990, p<0.0001) and MSD rates in nursing
and residential care facility workers (IRR=0.986, 95% CI 0.980-0.991, p<0.0001), but the
differences were not statistically significant (p >0.05).
The annual PHI claim rate among hospital workers was highest in 2010 with 0.88 per 100
employees and lowest in 2016 with 0.58 per 100 employees. Between the pre- and post-
legislation periods, the 5-year average PHI claim rate among hospital workers decreased by
12.0%; during 2011-2016, the PHI rate significantly decreased by 7.3% per year (IRR=0.927,

22
95% CI 0.903-0.952, p<0.0001); non-PHI rates fluctuated with little change (IRR=0.982, 95%
CI 0.956-1.009). The trends of rate changes were significantly different between PHI and non-
PHI claims (p=0.003). Moreover, the hospital PHI rate change over time was significantly
different from the trend of PHI rates among nursing and residential care facility workers
(p<0.0001), which had little change during 2011-2016 (IRR=0.990, 95% CI 0.976-1.005).
MSD and PHI Claim Rates among Nursing Workers
The reduction of MSD and PHI claim rates during the post-legislation period was more apparent
among nursing workers (Figure 9). In hospital settings, both MSD and PHI claim rates among
nursing workers were highest in 2010 and lowest in 2016. The 5-year average MSD claim rate
decreased by 7.0% between the pre-legislation and post-legislation periods, particularly during
the post-Cal/OSHA regulation period (16.5%). During 2011-2016, the MSD rate among hospital
nursing workers decreased by 4.3% per year (IRR=0.957, 95% CI 0.938-0.977, p<0.0001). The
rate reduction was significantly greater than the non-MSD rate change (p =0.011); the non-MSD
rate decreased by 1.5% per year among hospital nursing workers (IRR=0.985, 95% CI 0.976-
0.993, p=0.0006). Their MSD claim rate reduction was also significantly greater than the change
among nursing and residential care facility nursing workers (p =0.041), which showed a 2.0%
decrease per year (IRR=0.980, 95% CI 0.972-0.989, p<0.0001).
For PHI claims, the 5-year average rate decreased by 15.3% among hospital nursing workers
during the post-legislation period, including a 30.5% decrease during the post-Cal/OSHA
regulation period. During 2011-2016, the PHI claim rate significantly decreased by 8.5% per
year (IRR=0.915, 95% CI 0.889-0.942, p<0.0001). On the other hand, no significant changes
over time were found in non-PHI claim rates among hospital nursing workers (IRR=0.996, 95%
CI 0.976-1.016) and PHI claim rates among nursing and residential care facility nursing workers
(IRR=0.983, 95% CI 0.957-1.009, p<0.0001). Both trends were significantly different from the
trend of PHI claim rates among hospital nursing workers (p<0.0001 and p=0.0003, respectively).
Figure 9. MSD and PHI claim rates (per 100 employees) among nursing workers by setting,
2007-2016, California
Data Source: California Department of Industrial Relations, Workers’ Compensation Information System

23
Table 10. Musculoskeletal disorder (MSD) and patient handling injury (PHI) claim cases and rates (per 100 employees) among healthcare
workers by type of setting in 2007-2016, California
Case Type
Year of Injury Rate change per year,
2011-2016 Pre-Legislation (Safe Patient Handling) Post-Legislation
2007 2008 2009 2010 2011 2012 2013 2014 2015 2016 IRR 95% CI
Employmenta
Healthcare, all 1,289,541 1,326,603 1,350,617 1,381,878 1,402,366 1,437,027 1,464,511 1,494,903 1,546,705 1,602,051
Hospital 464,784 473,026 487,136 452,240 449,606 453,960 454,521 457,470 462,123 473,711
Nursing and residence care 230,490 238,619 243,898 247,507 254,002 258,379 265,759 276,282 287,186 292,598
Healthcare cases
MSD cases 31,625 30,926 30,411 31,934 31,095 31,905 31,279 31,236 31,020 29,838
PHI cases 8,757 9,138 9,046 9,310 9,066 9,359 8,631 8,147 8,066 7,828
Non PHI cases 22,868 21,788 21,365 22,624 22,029 22,546 22,648 23,089 22,954 22,010
Non-MSD cases 46,413 47,351 46,704 47,073 46,010 46,519 44,771 44,959 46,196 45,632
MSD rate 2.45 2.33 2.25 2.31 2.22 2.22 2.14 2.09 2.01 1.86 0.966 0.958 0.975
PHI rate 0.68 0.69 0.67 0.67 0.65 0.65 0.59 0.54 0.52 0.49 0.940 0.931 0.950
Non PHI rate 1.77 1.64 1.58 1.64 1.57 1.57 1.55 1.54 1.48 1.37 0.976 0.966 0.987
Non-MSD rate 3.60 3.57 3.46 3.41 3.28 3.24 3.06 3.01 2.99 2.85 0.973 0.968 0.978
Hospital casesb
MSD cases 13,103 12,828 12,656 13,024 12,277 13,019 13,033 12,843 10,932 11,522
PHI cases 3,785 3,930 3,975 3,994 3,642 3,930 3,639 3,402 2,983 2,736
Non PHI cases 9,318 8,898 8,681 9,030 8,635 9,089 9,394 9,441 7,949 8,786
Non-MSD cases 16,389 16,554 16,405 15,875 16,033 16,359 15,977 15,617 14,859 15,861
MSD rate 2.82 2.71 2.60 2.88 2.73 2.87 2.87 2.81 2.37 2.43 0.967 0.943 0.991
PHI rate 0.81 0.83 0.82 0.88 0.81 0.87 0.80 0.74 0.65 0.58 0.927 0.903 0.952
Non PHI rate 2.00 1.88 1.78 2.00 1.92 2.00 2.07 2.06 1.72 1.85 0.982 0.956 1.009
Non-MSD rate 3.53 3.50 3.37 3.51 3.57 3.60 3.52 3.41 3.22 3.35 0.981 0.971 0.990
Nursing and residence care
MSD cases 7,351 7,247 6,913 7,252 7,253 7,361 7,548 7,729 7,929 7,727
PHI cases 2,801 3,032 2,926 2,971 3,064 3,141 3,059 3,010 3,335 3,416
Non PHI cases 4,550 4,215 3,987 4,281 4,189 4,220 4,489 4,719 4,594 4,311
Non-MSD cases 10,842 11,186 11,047 11,440 10,321 10,267 10,288 10,286 10,561 10,191
MSD rate 3.19 3.04 2.83 2.93 2.86 2.85 2.84 2.80 2.76 2.64 0.986 0.980 0.991
PHI rate 1.22 1.27 1.20 1.20 1.21 1.22 1.15 1.09 1.16 1.17 0.990 0.976 1.005
Non PHI rate 1.97 1.77 1.63 1.73 1.65 1.63 1.69 1.71 1.60 1.47 0.983 0.965 1.001
Non-MSD rate 4.70 4.69 4.53 4.62 4.06 3.97 3.87 3.72 3.68 3.48 0.971 0.966 0.975

24
Table 10. Musculoskeletal disorder (MSD) and patient handling injury (PHI) claim cases and rates (per 100 employees) among healthcare
workers by type of setting in 2007-2016, California (cont’d)
Case Type
Year of Injury Rate change per year,
2011-2016 Pre-Legislation (Safe Patient Handling) Post-Legislation
2007 2008 2009 2010 2011 2012 2013 2014 2015 2016 IRR 95% CI
Hospital nursing casesc
MSD cases 5,303 5,264 5,394 5,618 5,081 5,333 5,215 5,055 4,437 4,489
PHI cases 2,662 2,835 2,818 2,930 2,574 2,776 2,521 2,338 2,024 1,809
Non PHI cases 2,641 2,429 2,576 2,688 2,507 2,557 2,694 2,717 2,413 2,680
Non-MSD cases 6,258 6,271 6,589 6,288 6,245 6,424 6,319 6,255 5,945 6,272
MSD rate 1.14 1.11 1.11 1.24 1.13 1.17 1.15 1.10 0.96 0.95 0.957 0.938 0.977
PHI rate 0.57 0.60 0.58 0.65 0.57 0.61 0.55 0.51 0.44 0.38 0.915 0.889 0.942
Non PHI rate 0.57 0.51 0.53 0.59 0.56 0.56 0.59 0.59 0.52 0.57 0.996 0.976 1.016
Non-MSD rate 1.35 1.33 1.35 1.39 1.39 1.42 1.39 1.37 1.29 1.32 0.985 0.976 0.993
Nursing and residence care
facility nursing casesd
MSD cases 2,923 3,038 2,779 2,771 2,900 2,860 2,873 2,841 3,044 3,009
PHI cases 1,588 1,768 1,628 1,596 1,691 1,659 1,621 1,491 1,783 1,799
Non PHI cases 1,335 1,270 1,151 1,175 1,209 1,201 1,252 1,350 1,261 1,210
Non-MSD cases 3,481 3,698 3,652 3,682 3,424 3,447 3,410 3,352 3,438 3,350
MSD rate 1.27 1.27 1.14 1.12 1.14 1.11 1.08 1.03 1.06 1.03 0.980 0.972 0.989
PHI rate 0.69 0.74 0.67 0.64 0.67 0.64 0.61 0.54 0.62 0.61 0.983 0.957 1.009
Non PHI rate 0.58 0.53 0.47 0.47 0.48 0.46 0.47 0.49 0.44 0.41 0.976 0.959 0.995
Non-MSD rate 1.51 1.55 1.50 1.49 1.35 1.33 1.28 1.21 1.20 1.14 0.966 0.959 0.974
Data Source: California Department of Industrial Relations, Workers’ Compensation Information System. Note: Federal employees are not reported to the system.
a. Employment in private sector and state and local governments. Source: U.S. Bureau of Labor Statistics, Quarterly Census of Employment and Wages b. Cases in general acute care hospitals within the Department of Corrections and Rehabilitation or the State Department of Developmental Services were excluded.
c. For rate calculation, hospital employment, including nursing and other employees, was used as the proxy denominator.
d. For rate calculation, nursing and residential care facility employment, including nursing and other employees, was used as the proxy denominator.

25
Table 11. Percent change of the average rates of musculoskeletal disorder (MSD) and patient handling injury (PHI) claims among
California healthcare workers, 2007-2016: Pre- vs. post-safe patient handling legislation and regulation
Average Claim Rate (per 100 employees)
Pre-
legislation
2007-2011
Post-
legislation
2012-2016
% Change
from
2007-2011
Pre-Cal/OSHA
regulation
2012-2014
% Change
from
2007-2011
Post-Cal/OSHA
regulation
2015-2016
% Change
from
2007-2011
All healthcare worker casesa
All claims 5.78 5.09 -11.9 5.25 -9.2 4.85 -16.1
MSD claims 2.31 2.06 -10.8 2.15 -6.9 1.94 -16.0
PHI claims 0.67 0.56 -16.4 0.59 -11.9 0.51 -23.9
Non-PHI claims 1.64 1.50 -8.5 1.55 -5.5 1.43 -12.8
Non-MSD claims 3.46 3.03 -12.4 3.10 -10.4 2.92 -15.6
Hospital casesb
All claims 6.24 6.09 -2.4 6.36 1.9 5.68 -9.0
MSD claims 2.75 2.67 -2.9 2.85 3.6 2.40 -12.7
PHI claims 0.83 0.73 -12.0 0.80 -3.6 0.62 -25.3
Non-PHI claims 1.92 1.94 +1.0 2.04 +6.3 1.79 -6.8
Non-MSD claims 3.50 3.42 -2.3 3.51 +0.3 3.29 -6.0
Nursing and residence care (NRCF)
All claims 7.49 6.52 -13.0 6.68 -10.8 6.28 -16.2
MSD claims 2.97 2.78 -6.4 2.83 -4.7 2.70 -9.1
PHI claims 1.22 1.16 -4.9 1.15 -5.7 1.17 -4.1
Non-PHI claims 1.75 1.62 -7.4 1.68 -4.0 1.54 -12.0
Non-MSD claims 4.52 3.74 -17.3 3.85 -14.8 3.58 -20.8
Hospital - Nursing cases
All claims 2.51 2.42 -3.6 2.53 +0.8 2.26 -10.0
MSD claims 1.15 1.07 -7.0 1.14 -0.9 0.96 -16.5
PHI claims 0.59 0.50 -15.3 0.56 -5.1 0.41 -30.5
Non-PHI claims 0.55 0.57 +3.6 0.58 +5.5 0.55 0.0
Non-MSD claims 1.36 1.36 0.0 1.39 +2.2 1.31 -3.7
NRCF - Nursing cases
All claims 2.67 2.30 -13.9 2.35 -12.0 2.22 -16.9
MSD claims 1.19 1.06 -10.9 1.07 -10.1 1.05 -11.8
PHI claims 0.68 0.60 -11.8 0.60 -11.8 0.62 -8.8
Non-PHI claims 0.51 0.45 -11.8 0.47 -7.8 0.43 -15.7
Non-MSD claims 1.48 1.23 -16.9 1.27 -14.2 1.17 -20.9
Data Source: California Department of Industrial Relations, Workers’ Compensation Information System. Note: Federal employees are not reported to the system.

26
MSD and PHI Claims by Case Demographics
Figure 10 and Table 12 show the demographic characteristics of MSD and PHI claim cases
among healthcare workers in 2007-2016. Of the MSD cases, 78.6% were females and 32.9%
were nursing workers; the proportion of nursing workers was significantly higher among hospital
cases than among non-hospital cases (40.9% vs. 27.5%, p<0.0001). The mean age was 43.0 years
and hospital MSD cases were older than non-hospital MSD cases (Mean age 44.3 vs. 42.1,
p<0.0001). Those age 55 and over accounted for 21.8% of hospital cases. The median time from
hire to MSD claims was 4.3 years among all healthcare workers; 39.0% had the injury in less
than 3 years after being hired, and the proportion was greater in cases in other settings (45.1%).
The median time was significantly longer among hospital cases than among non-hospital cases
(5.8 years vs. 3.2 years, p<0.0001). PHI claims showed similar patterns to MSD claims. Of
particular note, the proportion of nursing workers was 70.2% of hospital cases. The median time
from hire to PHI claims among all cases was 3.0 years (4.8 years in hospitals vs. 1.9 years in
other settings, p<0.0001), which was shorter than MSDs, and 56.7% of cases in other settings
had the injury in less than 3 years after being hired.
Figure 10. Characteristics of MSD and PHI claim cases among healthcare workers, 2007-2016,
California
Data Source: California Department of Industrial Relations, Workers’ Compensation Information System

27
Table 12. Musculoskeletal disorder (MSD) and patient handling injury (PHI) claim cases among California healthcare workers in 2007-
2016: Demographic characteristics by setting
MSD Claims MSD-PHI Claims
All cases
(n=311,269)
Hospitala
(n=125,237)
Other
(n=186.032)
All cases
(n=87,348)
Hospitala
(n=36,016)
Other
(n=51,332)
Variable N % N % N % N % N % N %
Gender
Female 244,736 78.6 98,311 78.5 146,425 78.7 70,316 80.5 28,755 79.8 41,561 81.0
Male 64,996 20.9 26,549 21.2 38,447 20.7 16,560 19.0 7,137 19.8 9,423 18.4
Unknown/Invalid 1,537 0.5 377 0.3 1,160 0.6 472 0.5 124 0.4 348 0.7
Age
16-24 years 20,573 6.6 4,198 3.4 16,375 8.8 8,379 9.6 1,468 4.1 6,911 13.5
25-34 68,524 22.0 25,929 20.7 42,595 22.9 21,963 25.1 8,833 24.5 13,130 25.6
35-44 75,513 24.3 32,035 25.6 43,478 23.4 22,082 25.3 10,187 28.3 11,895 23.2
45-54 83,499 26.8 35,618 28.4 47,881 25.7 21,073 24.1 9,332 25.9 11,741 22.9
55-64 54,220 17.4 23,791 19.0 30,429 16.4 11,908 13.6 5,487 15.2 6,421 12.5
65+ 8,196 2.6 3,519 2.8 4,677 2.5 1,706 2.0 665 1.9 1,041 2.0
Unknown/Invalid 744 0.2 147 0.1 597 0.3 237 0.3 44 0.1 193 0.4
Mean, SD (years) 43.0 12.2 44.3 11.6 42.1 12.5 40.9 12.2 42.4 11.4 39.8 12.7
Occupation
Nursing 102,271 32.9 51,189 40.9 51,082 27.5 48,487 55.5 25,287 70.2 23,200 45.2
Other 208,998 67.1 74,048 59.1 134,950 72.5 38,861 44.5 10,729 29.8 28,132 54.8
Time from hire to injury
12 months or less 60,261 19.4 15,284 12.2 44,977 24.2 22,181 25.4 5,240 14.6 16,941 33.0
13 months to 2 years 60,943 19.6 22,122 17.7 38,821 20.9 19,410 22.2 7,227 20.1 12,183 23.7
3-4 years 40,074 12.9 17,325 13.8 22,749 12.2 11,456 13.1 5,431 15.1 6,025 11.7
5-9 years 65,415 21.0 31,293 25.0 34,122 18.3 16,363 18.7 8,803 24.4 7,560 14.7
10+ years 69,755 22.4 36,492 29.1 33,263 17.9 14,115 16.2 8,619 23.9 5,496 10.7
Unknown/Invalid 14,821 4.8 2,721 2.2 12,100 6.5 3,823 4.4 696 1.9 3,127 6.1
Median, IQRb (years) 4.3 1.4-9.5 5.8 2.3-11.3 3.2 1.0-8.1 3.0 1.0-7.4 4.8 1.9-9.8 1.9 0.7-5.4 Data Source: California Department of Industrial Relations, Workers’ Compensation Information System.
Note: Federal employees are not reported to the system. Percentage numbers may not add up to 100 due to rounding.
a. Cases in general acute care hospitals within the Department of Corrections and Rehabilitation or the State Department of Developmental Services were excluded.
b. IQR: Interquartile range

28
MSD and PHI Claims by Injury Characteristics
Injury characteristics of MSD and PHI claim cases among California hospital workers in 2007-
2016 are presented in Table 13. As for the part of body injured in MSD claims, upper extremity
claims (29.5%) were the most common, followed by lower back (21.1%) and trunk (12.8%)
claims. As for the nature of injury, strain and sprain accounted for 79.2% of MSD claims among
hospital workers; 1.4% had carpal tunnel syndrome. Among PHI claims, lower back claims
(32.3%) were the most common, followed by trunk (17.4%), upper extremity (17.2%) and
shoulder (13.4%) claims. Strain and sprain accounted for 88.0% of PHI claims among hospital
workers.
Figure 11 shows the annual numbers of MSD and PHI claims by injured body part among
hospital workers in 2007-2016. During the post-legislation period, trunk claims showed the
largest reductions for MSD (-25.7%) and PHI (-33.3%) cases compared to the claims in the pre-
legislation period. Multiple body part and upper extremity claims showed the next largest
reductions: PHI cases decreased by 28.3% in multiple body part claims and by 18.5% in upper
extremity claims. As for lower back claims, PHI cases decreased by only 5.8% during the post-
legislation period. This was because the annual number of claims was highest in 2012; since then
it has shown apparent reductions every year. The number of claims in 2016 decreased by 39.5%
from 2012. On the other hand, shoulder claims increased for MSD (21.2%) and PHI (10.3%)
cases and neck claims increased by 17.1% for MSD cases during the post-legislation period.
There was a significant increase in the annual rate of shoulder MSD claims over time during
2007-2016 (IRR=1.033, 95% CI 1.012-1.055). Among PHIs, strain and sprain decreased by
34.2% during the post-legislation period.
Figure 11. Part of body injured in MSD and PHI claims among hospital workers, 2007-2016, California
Data Source: California Department of Industrial Relations, Workers’ Compensation Information System

29
Table 13. Musculoskeletal disorder (MSD) and patient handling injury (PHI) claim cases among California hospital workers in 2007-
2016: Injury characteristics by year
MSD Claims
All healthcare
(n=311,269)
Hospital cases by year of injury (n=125,237)
Pre-Legislation (Safe Patient Handling) Post-Legislation
N % Change:
Post-Pre
%
Change Variable N % 2007 2008 2009 2010 2011 2012 2013 2014 2015 2016
Part of body injured
Neck 11,063 3.6 380 383 390 401 397 431 539 505 352 457 4,235 3.4 333 17.1
Lower back 75,270 24.2 2,628 2,604 2,402 2,633 2,782 2,997 2,909 2,860 2,307 2,281 26,403 21.1 305 2.3
Trunk 33,869 10.9 1,968 1,882 2,055 1,906 1,345 1,479 1,304 1,325 1,297 1,402 15,963 12.8 -2,349 -25.7
Shoulder 34,589 11.1 1,251 1,331 1,257 1,452 1,393 1,642 1,699 1,690 1,465 1,604 14,784 11.8 1,416 21.2
Upper extremities 90,443 29.1 3,775 3,822 3,688 3,773 3,916 3,897 3,887 3,878 3,098 3,257 36,991 29.5 -957 -5.0
Lower extremities 29,451 9.5 1,202 1,164 1,223 1,189 1,158 1,174 1,230 1,171 1,067 1,044 11,622 9.3 -250 -4.2
Multiple 36,584 11.8 1,899 1,642 1,641 1,670 1,286 1,399 1,465 1,414 1,346 1,477 15,239 12.2 -1,037 -12.7
Nature of injury
Strain 198,820 63.9 8,093 7,824 8,738 8,740 7,616 7,900 7,907 7,905 6,854 7,390 78,967 63.1 -3,055 -7.4
Sprain 46,985 15.1 2,439 2,491 1,750 1,921 1,960 1,998 2,166 2,143 1,725 1,555 20,148 16.1 -974 -9.2
Inflammation 7,928 2.6 356 303 250 239 230 263 278 257 132 182 2,490 2.0 -266 -19.3
Carpal tunnel syndrome 5,467 1.8 190 190 165 181 204 176 205 202 114 135 1,762 1.4 -98 -10.5
Multiple physical injuries 4,434 1.4 84 99 124 221 219 254 277 234 242 220 1,974 1.6 480 64.3
Dislocation 1,028 0.3 35 23 40 29 40 31 33 35 28 21 315 0.3 -19 -11.4
Hernia 1,023 0.3 47 32 49 29 47 39 37 36 24 28 368 0.3 -40 -19.6
Other 45,584 14.6 1,859 1,866 1,540 1,664 1,961 2,358 2,130 2,031 1,813 1,991 19,213 15.3 1,433 16.1
MSD-PHI Claims
All healthcare
(n=87,348)
Hospital cases by year of injury (n=36,016)
Pre-Legislation (Safe Patient Handling) Post-Legislation
N % Change:
Post-Pre
%
Change Variable N % 2007 2008 2009 2010 2011 2012 2013 2014 2015 2016
Part of body injured
Neck 2,589 3.0 127 128 132 115 117 127 153 133 93 98 1,223 3.4 -15 -2.4
Lower back 32,156 36.8 1,107 1,217 1,146 1,246 1,265 1,382 1,291 1,156 972 836 11,618 32.3 -344 -5.8
Trunk 12,993 14.9 792 798 821 810 529 575 507 465 497 458 6,252 17.4 -1,248 -33.3
Shoulder 11,310 13.0 425 471 440 467 498 573 555 524 426 460 4,839 13.4 237 10.3
Upper extremities 14,671 16.8 603 670 754 716 663 683 587 584 468 455 6,183 17.2 -629 -18.5
Lower extremities 5,905 6.8 232 221 249 219 230 244 242 237 222 168 2,264 6.3 -38 -3.3
Multiple 7,724 8.8 499 425 433 421 340 346 304 303 305 261 3,637 10.1 -599 -28.3
Nature of injury
Strain 62,617 71.7 2,509 2,556 2,903 2,862 2,430 2,676 2,487 2,272 2,019 1,935 24,649 68.4 -1,871 -14.1
Sprain 15,424 17.7 856 921 678 738 730 722 713 710 578 412 7,058 19.6 -788 -20.1
Other 15,424 17.7 856 921 678 738 730 722 713 710 578 412 7,058 19.6 -629 -18.5 Data Source: California Department of Industrial Relations, Workers’ Compensation Information System. Percentage numbers may not add up to 100 due to rounding.

30
Medical Costs Paid for MSD and PHI Claims by Healthcare Workers, 2008-2015
In 2008-2015, there were 619,389 healthcare worker claims; 52.1% (n=322,550) had medical
billing data valid for analysis in this study. Among 249,806 MSD claims by healthcare workers,
55.2% (n=137,871) had medical billing data. Among 70,763 MSD-PHI claims, 54.0%
(n=38,186) had medical billing data. The total paid costs for medical bills among the healthcare
worker cases during the 8-year period are presented in Table 14. It should be noted that the year
represents the year of the injury that occurred.
For healthcare worker cases with injuries during 2008-2015, $1,154 million was paid for their
medical bills. Figure 12 shows medical costs by case types and injured body part. MSD cases
accounted for 52% ($598 million) of the total paid medical costs. PHI cases accounted for 26%
($152 million) of the total paid medical costs for MSD cases. Looking at the injured body part
for MSD claim medical costs, upper extremity claims accounted for the largest proportion of
26%, followed by lower back claims (24%) and shoulder claims (15%). For PHI claim medical
costs, lower back claims accounted for the largest proportion of 37%, followed by shoulder
claims (17%), upper extremity claims (12%), and trunk claims (11%).
Figure 12. Medical costs paid for healthcare worker claims, 2008-2015, California
Data Source: California Department of Industrial Relations, Workers’ Compensation Information System
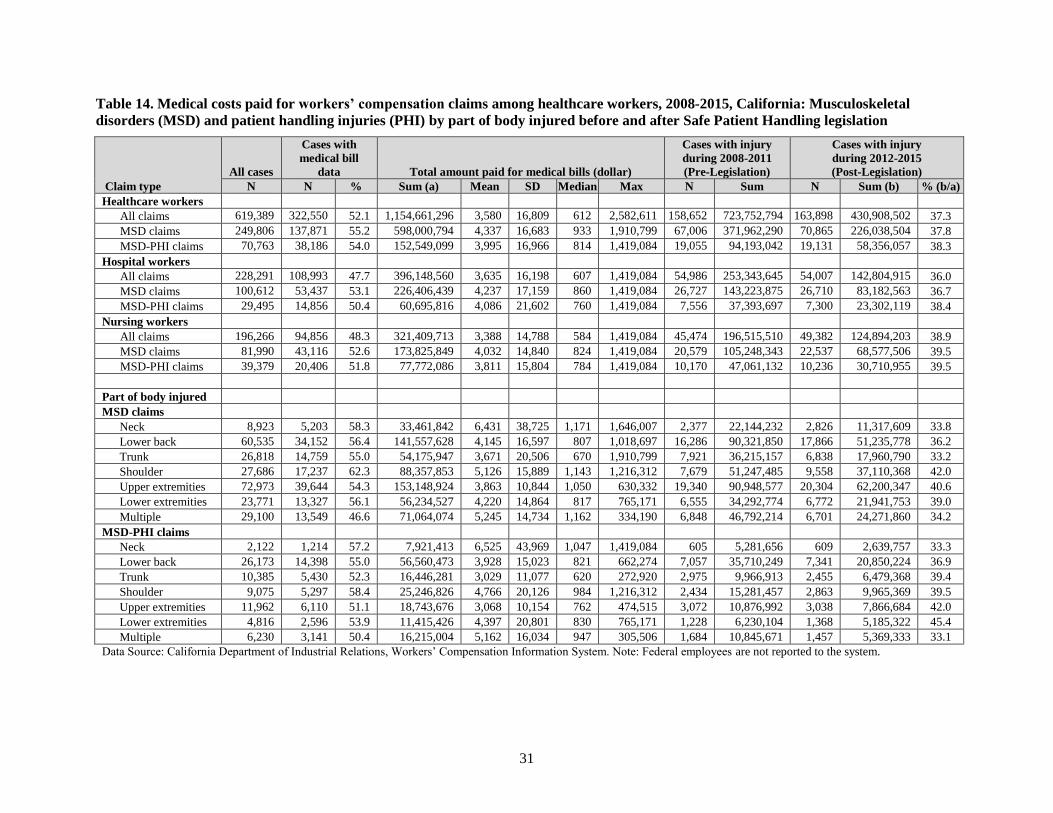
31
Table 14. Medical costs paid for workers’ compensation claims among healthcare workers, 2008-2015, California: Musculoskeletal
disorders (MSD) and patient handling injuries (PHI) by part of body injured before and after Safe Patient Handling legislation
Claim type
All cases
Cases with
medical bill
data Total amount paid for medical bills (dollar)
Cases with injury
during 2008-2011
(Pre-Legislation)
Cases with injury
during 2012-2015
(Post-Legislation)
N N % Sum (a) Mean SD Median Max N Sum N Sum (b) % (b/a)
Healthcare workers
All claims 619,389 322,550 52.1 1,154,661,296 3,580 16,809 612 2,582,611 158,652 723,752,794 163,898 430,908,502 37.3
MSD claims 249,806 137,871 55.2 598,000,794 4,337 16,683 933 1,910,799 67,006 371,962,290 70,865 226,038,504 37.8
MSD-PHI claims 70,763 38,186 54.0 152,549,099 3,995 16,966 814 1,419,084 19,055 94,193,042 19,131 58,356,057 38.3
Hospital workers
All claims 228,291 108,993 47.7 396,148,560 3,635 16,198 607 1,419,084 54,986 253,343,645 54,007 142,804,915 36.0
MSD claims 100,612 53,437 53.1 226,406,439 4,237 17,159 860 1,419,084 26,727 143,223,875 26,710 83,182,563 36.7
MSD-PHI claims 29,495 14,856 50.4 60,695,816 4,086 21,602 760 1,419,084 7,556 37,393,697 7,300 23,302,119 38.4
Nursing workers
All claims 196,266 94,856 48.3 321,409,713 3,388 14,788 584 1,419,084 45,474 196,515,510 49,382 124,894,203 38.9
MSD claims 81,990 43,116 52.6 173,825,849 4,032 14,840 824 1,419,084 20,579 105,248,343 22,537 68,577,506 39.5
MSD-PHI claims 39,379 20,406 51.8 77,772,086 3,811 15,804 784 1,419,084 10,170 47,061,132 10,236 30,710,955 39.5
Part of body injured
MSD claims
Neck 8,923 5,203 58.3 33,461,842 6,431 38,725 1,171 1,646,007 2,377 22,144,232 2,826 11,317,609 33.8
Lower back 60,535 34,152 56.4 141,557,628 4,145 16,597 807 1,018,697 16,286 90,321,850 17,866 51,235,778 36.2
Trunk 26,818 14,759 55.0 54,175,947 3,671 20,506 670 1,910,799 7,921 36,215,157 6,838 17,960,790 33.2
Shoulder 27,686 17,237 62.3 88,357,853 5,126 15,889 1,143 1,216,312 7,679 51,247,485 9,558 37,110,368 42.0
Upper extremities 72,973 39,644 54.3 153,148,924 3,863 10,844 1,050 630,332 19,340 90,948,577 20,304 62,200,347 40.6
Lower extremities 23,771 13,327 56.1 56,234,527 4,220 14,864 817 765,171 6,555 34,292,774 6,772 21,941,753 39.0
Multiple 29,100 13,549 46.6 71,064,074 5,245 14,734 1,162 334,190 6,848 46,792,214 6,701 24,271,860 34.2
MSD-PHI claims
Neck 2,122 1,214 57.2 7,921,413 6,525 43,969 1,047 1,419,084 605 5,281,656 609 2,639,757 33.3
Lower back 26,173 14,398 55.0 56,560,473 3,928 15,023 821 662,274 7,057 35,710,249 7,341 20,850,224 36.9
Trunk 10,385 5,430 52.3 16,446,281 3,029 11,077 620 272,920 2,975 9,966,913 2,455 6,479,368 39.4
Shoulder 9,075 5,297 58.4 25,246,826 4,766 20,126 984 1,216,312 2,434 15,281,457 2,863 9,965,369 39.5
Upper extremities 11,962 6,110 51.1 18,743,676 3,068 10,154 762 474,515 3,072 10,876,992 3,038 7,866,684 42.0
Lower extremities 4,816 2,596 53.9 11,415,426 4,397 20,801 830 765,171 1,228 6,230,104 1,368 5,185,322 45.4
Multiple 6,230 3,141 50.4 16,215,004 5,162 16,034 947 305,506 1,684 10,845,671 1,457 5,369,333 33.1
Data Source: California Department of Industrial Relations, Workers’ Compensation Information System. Note: Federal employees are not reported to the system.

32
The total paid medical costs from claims during 2008-2015 were broken down into pre-
legislation (2008-2011) and post-legislation (2012-2015) periods (Table 14). For PHI claims,
$58.3 million was paid for medical bills among healthcare workers during the post-legislation
period; this amount accounted for 38% of the total medical costs for injuries during 2008-2015.
For PHI claims among hospital workers, $23.3 million was paid for medical bills during the
post-legislation period; this amount accounted for 40% of medical costs for all healthcare worker
cases. For PHI claims among nursing workers, $30.7 million was paid for medical bills during
the post-legislation period; this amount accounted for 53% of medical costs for all healthcare
worker cases.
DISCUSSION
We examined changes in MSD and PHI WC claims among California healthcare workers during
2007-2016 to explore the impact of California’s safe patient handling legislation. The safe
patient handling law in California applied to only general acute care hospitals. We identified
reductions in the numbers and rates of the claims among hospital workers during the post-
legislation period, which may be associated with the safe patient handing legislation. MSD and
PHI WC claims among hospital workers showed different patterns of changes over the time from
non-MSD and non-PHI claims. We also found different patterns in the changes over the time
between hospital claims and claims in other settings, particularly in nursing and residential care
facilities. These findings may indicate positive effects associated with the safe patient handling
law and regulation and may suggest that the law and regulation can make positive impacts for
MSD and PHI prevention among healthcare workers.
Methodological Considerations and Limitations
In interpreting the study findings, our case definitions and case identification methods
considering the WC data system and data quality issues should be considered. For healthcare
worker cases, this study used the broad definition of claim cases involving those who were
employed or working in the healthcare industry regardless of their occupation or employment
types. Yet, it should be noted that our case definition had some exclusions due to the WCIS
system that excluded federal employers and the scope of California’s safe patient handling law
that excluded certain settings. Also, as noted earlier, government healthcare cases are generally
reported using government industry codes; thus, not all healthcare worker cases can be captured
by class code and industry code. Additionally, there were considerable discrepancies between
class and industry codes. For example, among cases with either hospital class codes or industry
codes, 36% had discrepancies between the two codes and 15% had missing data for one of the
two codes. We developed further sophisticated methods to search and determine healthcare cases
using the information of employer name, occupation description, and injury description and
classified cases based on the level of evidence. Although we conducted numerous manual data
reviews for validation of our case coding programs, our findings are subject to misclassification.
In addition, our PHI case identification was entirely based on the injury description record,
which had incomplete or limited narratives. Therefore, the PHI case counts are likely to be
underestimates. Considering this limitation of PHI case finding, we defined PHIs within MSDs
and it should be noted that PHI cases in this study did not include non-MSD PHIs.
We calculated claim rates using the BLS QCEW data for denominators. The data source
33
provides the total employment size by industry, which consists of both full-time and part-time
employees. Using this denominator data, we calculated claim rates per employees and were not
able to provide rates per full-time equivalents. In addition, the BLS QCEW used NAICS codes
whereas the WCIS used other codes of WCIS Class Code and SIC as well. Therefore, there can
be potential mismatches between the numerators based on the three industry codes and the
denominators based on NAICS only. Furthermore, we included contractors, trainees, or students
in cases. For contractors, their industry code is not healthcare; therefore, the contractor
population is not included in the denominator for healthcare workers. These issues could lead to
overestimation. For nursing worker rates, we could not obtain the specific denominators of total
nursing employment within specific settings at the state level. As the proxy, we used the total
employment in hospitals as the denominator for the hospital nursing claim rate and used the total
employment in nursing and residential care facilities for the rate of nursing and residential care
facility nursing cases. Thus, the nursing worker claim rates per se are not accurate and
substantially underestimate the true rates. On the other hand, as we calculated annual rate
estimates using consistent approach within the same case category, we would not have a problem
in comparing and examining the rate change over time within the same case category.
In the analysis of medical costs, we used the total amount paid for medical bills, which is
different from the total charges made by medical providers. We also excluded cases with some
outliers, which were believed to be errors, and with minus or zero values in the total amount paid
in 2008-2015 per case. Therefore, our findings are likely to be underestimates for the true
medical costs. In addition, our findings of paid medical costs by year require a special caution in
interpreting the data. It should be noted that the year represents the year of injury of cases and
thus the medial costs are cumulative in nature. Some chronic cases had multiple medical
payments lasting over several years.
Main Findings
MSDs are well known to be the leading occupational health problem, accounting for
approximately one third of lost-worktime occupational injuries and illnesses among US
workers.[4] Our study found that MSD claims accounted for 40% of WC claims among
healthcare workers in California in 2007-2016; the proportion was slightly higher among hospital
workers (44%). About 80% of the MSD claims were strains or sprains and 51% occurred in
upper extremities and lower back. Among the MSD claims, 28% were identified as PHI claims
in this study, which belongs to the lower end of estimates from other studies.[18, 21] We found that
during the post-legislation period, MSD and PHI claims decreased 4% and 14%, respectively,
among hospital workers. In contrast, the claims increased in nursing and residential care
facilities, where the safe patient handling law does not apply. The MSD and PHI claim reduction
was shown to be more apparent among nursing workers, with 8% and 17% reductions,
respectively, among hospital nursing workers. The reductions of annual MSD and PHI claim
rates over time during 2011-2016 among hospital workers were statistically significant. For PHI
claims, the rate reduction over time among hospital workers was significantly greater than the
change of non-PHI claims; moreover, the rate reduction among hospital workers was
significantly greater than the rate change in PHI claims among nursing and residential care
facility workers. The estimated reduction of PHI claim rates was 7.3% per year among hospital
workers and 8.5% per year among hospital nursing workers. In addition, the reductions of MSD
34
and PHI claim rates among hospital workers during the post-legislation period were shown to be
larger during the post-Cal/OSHA regulation period. These findings may suggest that the
reductions of PHI claims among hospital workers may be associated with the safe patient
handling law and regulation, and that these law and regulation may have made a positive impact
in hospital settings. However, we cannot determine a causal relationship due to the descriptive
study design and methodological limitations.
Concerning injury characteristics, we found that lower back claims were the most common PHI
claims; upper extremity claims were the most common among overall MSD claims in hospital
workers. During the post-legislation period, we found apparent decreasing patterns in PHI claims
in lower back and upper extremities each year and in trunk compared to the pre-legislation
period. These findings suggest that safe patient handling programs implemented in hospitals may
be beneficial in reducing the risk of injuries particularly in lower back, trunk, and upper
extremities. On the other hand, interestingly, we found that MSD and PHI claims in shoulders
increased during the post-legislation period, and that the annual rate of MSD claims in shoulders
showed a significant increase over time from 2007 to 2016. These findings indicate a special
need to evaluate ergonomic risk factors in shoulders.
In the literature, information on costs of MSDs and PHIs among healthcare workers are quite
limited. Our findings provide helpful information to understand the huge economic burden from
MSDs and PHIs among healthcare workers. In 2008-2015, 52% of WC claims among healthcare
workers had valid medical bill data for this study. Over the 8-year period, $598 million and $152
million were paid for medical costs of MSD claims and PHI claims and these costs accounted for
52% and 13% of all healthcare worker medical costs, respectively. Of the medical costs for PHI
claims, $94 million (62%) was paid for injuries occurred during the pre-legislation period (2008-
2011) and $58 million (38%) was paid for injuries occurred after the post legislation period
(2012-2015). This finding suggests that the safe patient handling legislation may have
contributed to the reduction of WC medical costs.
B. FOCUS GROUPS
METHODS
Study Design and Sample
Focus groups were conducted using a purposive sample of nurses or patient care staff employed
in hospitals. According to OSHPD,[54] as of December 31, 2015, there were 459 general acute
care hospitals licensed in California; 95 hospitals (21%) were located in 10 counties in the San
Francisco Bay Area (San Francisco, San Mateo, Santa Cruz, Santa Clara, Alameda, Contra
Costa, Marin, Sonoma, Napa, and Solano Counties). We aimed to recruit participants from
different hospitals in the San Francisco Bay Area. We distributed our study information by
posting study flyers at selected hospitals in convenient locations and by distributing the flyers at
nurse union training events. We also used email advertisements and word-of-mouth via various
networks of unions, nursing professional associations, and nursing schools. Eligible participants
were nurses or patient care workers who frequently performed patient handling duties and who
had been employed for at least five years in an acute care hospital. Initially, 46 people signed up
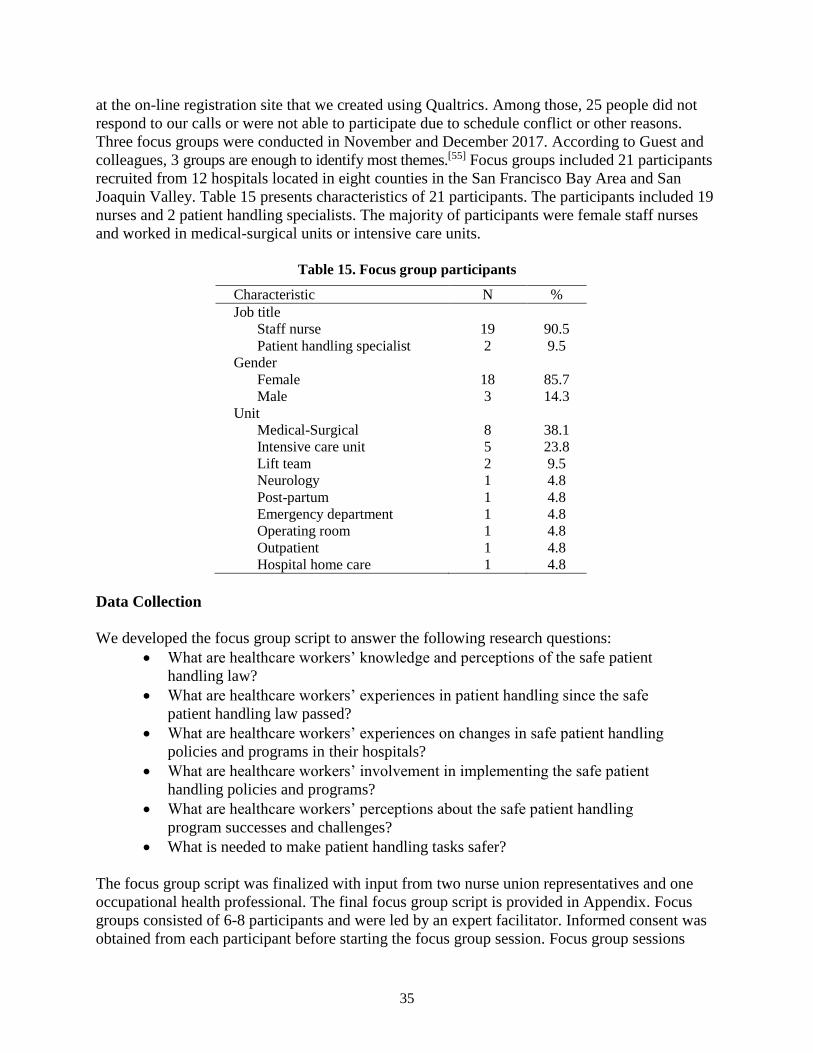
35
at the on-line registration site that we created using Qualtrics. Among those, 25 people did not
respond to our calls or were not able to participate due to schedule conflict or other reasons.
Three focus groups were conducted in November and December 2017. According to Guest and
colleagues, 3 groups are enough to identify most themes.[55] Focus groups included 21 participants
recruited from 12 hospitals located in eight counties in the San Francisco Bay Area and San
Joaquin Valley. Table 15 presents characteristics of 21 participants. The participants included 19
nurses and 2 patient handling specialists. The majority of participants were female staff nurses
and worked in medical-surgical units or intensive care units.
Table 15. Focus group participants
Characteristic N %
Job title
Staff nurse 19 90.5
Patient handling specialist 2 9.5
Gender
Female 18 85.7
Male 3 14.3
Unit
Medical-Surgical 8 38.1
Intensive care unit 5 23.8
Lift team 2 9.5
Neurology 1 4.8
Post-partum 1 4.8
Emergency department 1 4.8
Operating room 1 4.8
Outpatient 1 4.8
Hospital home care 1 4.8
Data Collection
We developed the focus group script to answer the following research questions:
What are healthcare workers’ knowledge and perceptions of the safe patient
handling law?
What are healthcare workers’ experiences in patient handling since the safe
patient handling law passed?
What are healthcare workers’ experiences on changes in safe patient handling
policies and programs in their hospitals?
What are healthcare workers’ involvement in implementing the safe patient
handling policies and programs?
What are healthcare workers’ perceptions about the safe patient handling
program successes and challenges?
What is needed to make patient handling tasks safer?
The focus group script was finalized with input from two nurse union representatives and one
occupational health professional. The final focus group script is provided in Appendix. Focus
groups consisted of 6-8 participants and were led by an expert facilitator. Informed consent was
obtained from each participant before starting the focus group session. Focus group sessions

36
lasted for 2 hours and were digitally recorded. Study participants received a $75 gift card as a
reward for their time and participation.
Data Analysis
Focus group recordings were transcribed verbatim. Qualitative content analysis was used for data
analysis. Qualitative content analysis is “a research method for the subjective interpretation of
the content of test data through the systematic classification process of coding and identifying
themes or patterns.”[56] The Dedoose software program was used for data coding. Three research
team members independently reviewed transcripts and derived initial codes from the text data.
Then, we organized and grouped the codes into the following nine categories: (1) knowledge and
impact of the safe patient handing law, (2) hospital policies, procedures, and employee
involvement, (3) training, (4) patient handling equipment, (5) lift teams, (6) staffing, (7) safety
culture, (8) workload, and (9) injuries. The categories and codes served as the coding scheme for
data analysis. New codes were added as needed within categories in the coding process. For
credibility, at least two members coded data for each transcript, and each member presented their
analysis results with identified themes to the team. We organized themes by subcategories of
positive experiences and perceived challenges/concerns within each category.
RESULTS
In discussing the impact of the new safe patient handling legislation, the focus group participants
described both improvements and continuing issues over the past several years since the passage
of the law. Participants expressed contradictory experiences in some areas. The participants’
perceptions and experiences are described by content category with positive experiences and
perceived challenges or concerns.
Knowledge and Impact of the Safe Patient Handing Law
Many participants (n=14) indicated some levels of awareness of the safe patient handling law. As
for positive experiences, most participants (n=16) mentioned increased equipment availability
and/or increased training. Three participants indicated feeling more empowered to advocate for
what they needed since the passage of the law.
I personally feel like that equipment has been provided to us because there’s a law. I don’t
feel like it would’ve ever been done had there not been this legislation.
I'm not very particular with my knowledge of the law, but I think the crux of it for me that I
know is that they require annual competency training.
[Legislation] has been the driver, has been the only reason that they have improved. Had
that legislation and regulation never been put into place we wouldn’t have what we have
now.
People pay more attention to safety and handling nurses having the knowledge that there is
something. They may not understand and have read the whole entire law and know the
language behind it, but at least the knowledge is out there that, hey wait a minute, there are

37
rules, and we're supposed to be doing this a different way. That has really helped. Because
the nurses now feel like they can speak to that and say, "I know there's a law about this
somewhere," or "I heard that there are regulations that we're not supposed to have to do
that." So that has empowered a lot of nurses. Just having equipment.
Perceived challenges were also identified. Four participants reported that they were unaware of
the safe patient handling law. Unions were identified to fill the gap as a source of knowledge and
education on the safe patient handling law and regulation. Five participants indicated that the
safe patient handling law is not protective enough in practice and there is a general lack of
change or improvement.
I didn't know about that it became a law. I don't know exactly how I was informed, but I
know that the union passed a lot of information about it.
I found out about it through my union and union activity with one of the shop stewards.
And I belong to SEIU, and the SEIU Alliance did a lot of lobbying around getting that law
passed.
So what I’m thinking as you’re talking is it looks pretty on paper. The policy is all nicely
updated. There’s nice handouts. There’s the required on-screen computer video we do
every year and there’s maybe more equipment. There’s definitely more education, but
there’s no more support to get the job done.
With the law, there was absolutely no change in the staffing. And the sort of-- how sketchy
and understaffed my department is, is just reflective of sort of acknowledging the law, but
actually doing nothing…
When nurses got involved and really invested in what this legislation we were hoping
would do for us was…nurses not being injured… But, what I’ve actually seen impacted in
real life is that the hospital industry, rather than valuing what it was supposed to be meant
for the intent of it, they spend so much time, their time, their energy, and their resources
finding ways to work around it.
Hospital Policies, Procedures, and Employee Involvement
As for positive experiences, eleven participants expressed some level of awareness of a policy on
safe patient handling in their hospital. Nine participants were aware of safety committees on
patient handling and one participant mentioned participation from various disciplines on the
committees.
I believe that there is a safe patient handling policy. And I was when the-- during my
orientation, they showed me where I can find it in online. And then if there is any question,
I can just search, and then I can bring it up as a document. And… there is a safety
committee, so there is a discussion every Wednesday. And they are focused on patient
safety as well as employee safety, and then in terms of handling of our equipment and then
patient as well.

38
Yeah, I've seen it [policy]… I attended a different task group last year that tasked me with
comparing what the law is to what our policy is…. And when you peel back all the layers,
the policy is you have to use a lift equipment.
Algorithms. That's one of the big words in our policy… I was just looking at my phone to
see if I could get remote access to the general Intranet site, because you can read the
policy about how to use… equipment when appropriate and the algorithms will tell you
how many people you need to do this. You can say no. If you see you're in an unsafe
situation, you can refuse to do it without being punished. (patient handing specialist)
… safe patient handling committee, per our union in contract. It is co-chaired by a member
of management and then a member of labor… So I think that’s appreciated. There is
involvement of a different bunch of disciplines: PT, nursing, lift team…
When you do get injured then there's a report that goes out to the region. Each week it's the
weekly injury report, and it tells you how somebody got hurt, and what they could've done
different to prevent it.
Many participants (n=11) indicated perceived challenges of the perceived lack of usefulness of
the policy, limited employee involvement or nursing representation in the safe patient handling
committee, and the committee’s lack of authority to make change.
I’m sure our hospital also have a policy. Honestly, I’ve never looked at it, but I really
didn’t check.
We have a really big committee that’s corporate-wide, but it hasn’t trickled down to our
hospital….They have definitely not involved employees in their policy and at a local level.
We have safety committees now. The involvement is those safety committees is primarily
administration, management and non-nursing staff. All of the ancillary staff departments
are represented, but the focus of that "safety committee" is… with no real nursing input,
they make decisions about our nursing workflow that had, first of all, no input from the
actual user, the nurses.
The significant issues don’t really get any traction from the committee to management.
We do have one, and it’s a powerless committee…They come up with little posters like it’s
been X amount of days since we’ve had an injury. There is nothing that is constructive. I
would say, that comes out of those committees.
I think the one thing that really stuck out in my mind when I read the policy is the discipline
associated with it. So if a nurse is injured moving a patient then they are subject to
discipline.

39
Training
Ten participants indicated that there was increased training since the passage of the safe patient
handling law. Training had a focus on equipment use and was provided in various formats:
training occurred at orientation, annually, tied to in-service, skills day and when new equipment
was introduced, using computer modules, hands-on, and competency tests.
There is more regular training.
So I got trained once. And then annually, we do a module on the computer, continuous
education program annually, and the annual skill check. And they bring the machines. So I
have to show how to use it. So they want to check the competency.
Six participants indicated that the training received was not sufficient or effective; one
participant commented that the training varied by facility, department, and shift.
…individual departments have control over how they use their budget, and if one decides
they want to spend more resources into the health and safety of their staff and patients and
train them in skills day and mobility, then you're going to see maybe more robust training.
It depends shift by shift, because when the education rolls out for something new it seems
like, day shift, they get the product rep there, they get hands-on. They have huddles. They
get this massive amount of education….And nights, you get a flyer...You get a picture.
With a lot of the equipment that was introduced you got initial training when they first were
planning to bring it. But then several months, a year later when the equipment finally
shows up, there's been this long gap of time between receiving the knowledge and using it.
And so you don't use it, you lose it. And there's no re-education. There's not refreshers.
…And whole departments, like our med-surge department, haven't had a training in three
years. And I had the director look me straight in the face and say, "We give you that
training every year." And I'm like, "I've not it for 10 years. I've never been invited or
anything." I think that what makes me the most crazy about it is that the lift equipment isn't
the only thing we need to be educating our people on.... We need to be taught how to take
care of ourselves in ergonomics and all that. And it's a huge component. Even when you're
using the lift equipment, you can so hurt your back using the lift equipment.
Patient Handling Equipment
Many participants (n=15) expressed both positive experiences and perceived challenges
regarding lifting equipment. Participants reported increased availability of lift equipment and
limited increase in the use of lift equipment with continuing barriers. Nine participants
mentioned certain types of equipment that are particularly helpful, such as HoverMatt and ceiling
lifts.
There’s more of a variety of equipment available. And I think there’s been an improvement

40
in the equipment available because of the law. But I don’t necessarily think there’s been a
huge increase of use of equipment.
We have in-ceiling lifts now, which are great. The union advocated for them. The hospital
got them. But I feel that people don't utilize them because they're slow or they're
intimidated by them because they don't feel like they have enough competency or training
on them.
It has been improved. And there’s this additional equipment… But I think the thing that’s
been the most beneficial …is that HoverMatt.... Now we all have it.
Another change is I think that we have a lot of training. That’s why if somebody fell on the
floor and then somebody says, “Oh, let’s use the machine.” So we can—because as old
nurses, we just do manpower. But the young ones, they say, “Oh, let’s use the machine”…
so a lot of change in our minds.
Perceived challenges in lift use were described as follows: using equipment is time-consuming;
equipment is often not readily available when needed and is inconvenient to use and store; there
is insufficient staff available to use the equipment; equipment is not always appropriate for the
specific patient situation; staff lack competence in using the equipment; and there were concerns
about quality of care or patient discomfort related to equipment.
It’s mostly time and convenience ... If we try to use it all day long, we wouldn’t be able to
finish our assignments…it is a difference between 60 seconds and 15 minutes.
So if the equipment is not nearby or if there’s not someone that I can grab as well as the
equipment, then you’re maybe going to try to do it in a way that really we shouldn’t be
doing.
Our rooms aren’t big enough for my body to be in the room half the time let alone bringing
equipment in with me…There’s not room to get a lift into most of our little rooms because
our hospital is old. They do provide us with the equipment but it’s not practical to use it.
You need that second person… That is a process that takes time and takes resources. And
you often don't have either one of them.
The equipment is not always appropriate. You can't use the equipment to get somebody out
of the bathroom that's fallen…. Equipment's not always the answer.
I mean there are so many little complications to using the equipment. It's intimidating.
I try to use that, but patients don’t much like it.
Lift Team
Seven participants noted that they had or used to have lift teams in their hospital and described
positive experiences of benefitting from designated staff to assist with patient handling, even
though access was difficult at times.

41
I can always depend on them… to know how to use the equipment quickly. They’ve been a
good resource for us.
We had at one time a very robust, very full lift team. They were well trained. They were
available. We had designated teams for different parts of the hospital and on different
shifts. It was a huge benefit for us on night shift where we had less nursing staff and that
trended away.
It wasn’t enough. It wasn’t 24/7. But it was something. And again they were dedicated.
They were very skilled at what they did.
As for perceived challenges, five participants described the limited availability of lift teams. Five
participants described that lift teams in their facilities were eliminated or replaced by a buddy
system where patient care staff would depend on each other for help with lifting, thereby taking
staff away from their other patient care responsibilities.
I never see them [lift team] on the day shift. So I don't know where they are, how many
there are, but I don't see them.
I'm on the lift team… But we're like this little island, and there's about eight of us covering
the whole hospital 24/7. And none of us get replaced if we're either on vacation or call in
sick. And now, we're in a bigger building that has more territory to cover in a way. So I
think we get less work because people figure it's going to take us a half hour to get there,
so they go ahead and wreck their backs on their own instead of letting us wreck ours for
them.
On night shift particularly is just nurses. We have no ancillary staff. We used to have lift
teams to aid us with patient mobility, but the teams were removed completely about five
years ago and replaced with equipment, technology.
So you would be assigned at the beginning of your shift a buddy co-worker, a nurse, and
depending on the proximity of your patient assignment was you would be her buddy. So
when she needs helps lifting you go help her. And vice versa. Without consideration for
what your individual workload was, your availability, how much more need one person had
for mobility over another one. It was a system that failed us.
Staffing
In terms of staffing, no participant expressed a positive experience. Instead, understaffing was
addressed as a critical issue. Sixteen participants described unchanged or decreased staffing and
difficulty securing lift assistance from staff. Some felt that the focus on increasing funding for
equipment led to a reduction in funding allocated to staffing. Most participants (n=15) indicated
that lift equipment would not replace the need for staff.
One of my favorite expressions is bariatrics is a team sport. You need a bunch of people.
Even if you've got the sling, you've still got to hold that thing when it gets to the-- when you

42
get them on the side, you got to have one or two people, that whole thing. (patient handling
specialist)
The lack of support, either through ancillary staff, CNA's or just additional nurses with
availability to help lift is very challenging.
We really need enough personnel resources. At my hospital, we only have one charge and
one break nurse. And the break nurse needs to cover each nurse's break, plus they have to
respond to code.
And now, the hospitals have had to spend a lot of money to do this, and they're looking at
how else can we take money from here. That's how I feel, and I feel like we've seen staffing
get worse and worse, and I just hope it doesn't get any worse than it is but lack of staffing,
lack of resources.
I think it’s just staffing primarily is quite a big issue... The money has been put into this
equipment, which is great. We need it…The money, it’s been taken from other places it
feels like, and it feels like that has been taken from the actual physical person who can help
you with things. You have this huge patient need to do a dressing change. That equipment
is not going to do that dressing change for you.
We are all chronically understaffed. There is not a unit that is not chronically understaffed
because there's lack of ancillary staff. The patients are sicker now than they ever have been
in my 25 plus years of nursing... They've got comorbidities. They've got a lot going on. So
without the additional staff to help with mobility, it impacts the total care that's delivered to
the patient. And it also impacts injuries to staff.
They [lift teams] have so much workload. So how can they really cover everybody? So
actually, right now, I'm not calling the lift guy at all because I understand. I'd rather ask
the nurse or try to by myself. So what I think is really, hospital need to hire more people,
more nurses, more lift guys for everybody.
So without the additional staff to help with mobility, it impacts the total care that’s
delivered to the patient. And it also impacts injuries to staff.
Safety culture
Many participants (n=11) described positive experiences and changes in safety culture,
specifically an increased awareness of the importance of safe lifting on the part of staff and
management, increased use of lifts, and increased appreciation of helping each other.
At least knowing that there’s a requirement that we’re supposed to be using equipment has
at least raised our awareness and we’re much better with the teamwork, I think. And much
more conscientious about what we’re doing and taking care of ourselves and making sure
we’re doing the right thing, and then putting on the breaks…and recognizing, wait a
minute, I’m gonna have to say, “It’s time to get the lift equipment. I’m not going to help
this patient unless I get it.”

43
I think it's the culture. Especially for the night shift. It's never had help, and traditionally
people feel` like there's less staff on nights. But I think culture, I definitely think the
training has been more regular and hitting-- now the night shift is aware and using it and
getting people to use it if it is appropriate.
…to prevent any injury is their teamwork, enough staff. This is going to make the job a lot
easier without a lot of injury. If my nurse, the one I'm coming to help her, she thinking
about me not only to make that quality care for the patient only, she care about me as well
anybody in the room, I'm willing to care about her too. So this is going to make that
teamwork really, really easier.
Many participants (n=9) also described perceived challenges. They indicated that management
did not prioritize worker safety and was punitive or ‘blaming of workers’ for their injuries.
So things are there because of the legislation, but the message from management and
hospital management is very punitive and condescending that, "Well you wouldn't have got
hurt if you would have done it my way." Hospital industry, in general, has gotten more
punitive over the years.
It's a very hostile, punitive environment, that if you don't use the equipment, you get hurt.
We're not going to pay for it.
I mean, they don't want to look at their own systems anymore. It used to be if there was an
injury or a mistake or a med error or whatever, they would look at their system and see if
there was something they could fix. Now they look at the person and want to blame the
person as a general rule on everything I think.
But the fact of the matter was, again, all of these pieces that we've talked about that were
missing. There was a lack of education. A lack of resources. A lack of staff. But it has a
turned this corner with this new regulation, and it seems like there has to be a way to put
the blame on that front-line person. That they are human, and they must've made a mistake
for this injury to occur. So it's not really caring in any way that you got hurt, and that they
want to do something to help you with that injury. It's you screwed up.
Workload
Many participants (n=10) expressed perceived challenges with their workload and changes in
patient care although it may not be directly linked to the safe patient handling law. They
described fast-paced, demanding or increased workload with insufficient staffing and concerns
about overtime.
It's become more frustrating to do my job. I've been a nurse for 20 years, and I'm more and
more frustrated every day at work because we're expected to do more with less every day.
Again, on a med-surge unit, it's very fast-paced. There's a lot of expectations. There's not
time allowed for things you do need to do like teaching and moving patients, and so people

44
have to move quickly. So if equipment is not nearby or if there's not someone that I can
grab as well as the equipment, then you're maybe going to try to do it a way that really we
shouldn't be doing it or it doesn't get done.
I feel like patients a lot heavier than before. They have more mobilizing problem. They
have knee or hip surgery. And then patients getting older.
They added so much more protocols, like the ERAS protocol. If a patient got a hip or knee
surgery, they have to stand up within eight hours of surgery. So all those demand is added
on the top of everything we have. I don't think any protocol was deleted. Keep adding,
added, added.
They're asking more with less. Because just the point is I don't care how much money that
you spent to install this big massive expensive piece of equipment in every single one of the
critical care rooms when you only have one nurse per shift.
I feel like, now am I going to wait for one hour to [get a] team delivered to my room, and
waiting for the second person to come here, and then save my back in my own bed that hurt
or ending up overtime, and then I get coached by my manager, "You're doing overtime. You
cannot do that. "So I would choose just-- okay, let's just quick do this, not get in the
[trouble], and then just get on with it.”
Injury Concerns
Most participants (n=15) expressed concerns regarding safety and injuries. Participants indicated
that workload, inadequate staffing resulting in the lack of help, and time pressures put nurses at
risk of unsafe behaviors and injuries and talked about injuries of their own or coworkers with
negative perceptions about workers’ compensation. Two participants raised interesting questions
that injury patterns may change with more use of equipment such as an increase in cervical and
shoulder injuries.
We have a lot of people on modified leave, and then I had my own back injury just recently.
A lot of times, you can’t really call or wait for help. And a lot of times, nurse, including
myself… just end up doing the lifting myself. And that is dangerous to myself, probably
dangerous to the patient, and over time, I know that I’m probably paying for it.
There's a general understanding that they don't get [adequate] medical care if they're on
Workers' Comp…. We have employees that have been injured that come limping back on
the floor and tell us their nightmare stories about not being able to get an MRI, and not
being able to get a cortisone shot, and not being able to get anything without pain pills.
There's more cervical and shoulder injuries now because you have to-- especially if they're
heavy, bringing the ceiling lift down and trying to get the equipment over. So it's switching
types of injuries, and I think that will become more apparent with time.

45
DISCUSSION
This focus group study was conducted with only a small number of nurses and patient handling
staff recruited from only a small number of hospitals; therefore, the findings cannot be
generalized to others. With this limitation, this study provides valuable information from
workers’ perspectives to explore the impact of the safe patient handling law. The focus group
findings indicate that the study participants had diverse and mixed experiences since the passage
of California’s safe patient handling law. The participants reported positive changes in the
hospital programs and practices related to the new law and regulations and perceived challenges
and barriers for safe practices and injury prevention.
Positive experiences and perceptions include feeling more empowered to advocate for staff
safety since the passage of the law, awareness of safe patient handling policies and committee
activities, increased provision and variety of lift equipment, more provision of training on safe
patient handling, and improvement in safety culture and practices including increased lift use and
appreciation of co-worker support.
Perceived concerns and obstacles include continuing barriers to safe practices and lift use, such
as insufficient staffing with difficulty in getting assistance, time burden associated with lift use,
lack of immediate availability of equipment, lack competence in using the equipment, concerns
about quality of care or patient discomfort related to equipment, and patient situations where
equipment use was inappropriate. Perceived concerns also include limited availability of lift
teams, limited nursing employee input in the safety committee, increased workload and
continuing injury concerns, and more punitive management about worker injury. Participants
also indicated the need for more effective training, sufficient staffing, supportive environment for
worker safety and well-being, and management support for injured workers.
As another interesting finding, two participants noted changes in injury patterns in relation to
more frequent use of lift equipment such as ceiling lifts. In the WC data analysis, we found a
significant increase of shoulder and neck injury claims. This quantitative study using the WC
data shows supporting evidence for the speculation made by the participants, but further research
is needed to identify the true cause of increases of shoulder and neck injury claims.
CONCLUSIONS
Our project assessed the impact of California’s safe patient handling legislation by using both
quantitative and qualitative approaches. By analyzing WC claims data from 2007 to 2016 among
California healthcare workers, we identified reductions in the numbers and rates of MSD and
PHI claims among hospital workers during the post-legislation period, which may be associated
with the safe patient handing legislation. Using the focus groups, we explored nurses and patient
handling staff’s experiences and perceptions about the safe patient handling law and their
hospital programs and practices and obtained complementary information to better explore the
impact and changes. The focus group study findings indicated positive changes in the hospital
programs and practices related to the new law, along with continuing challenges and barriers for
safe practices and injury prevention. These findings may indicate positive impacts associated
with the safe patient handling law and regulations; however, due to the limitation of the
descriptive observation study design, the positive changes may not be attributed to the law.
Our study findings also help to identify the areas for improvement.

46
REFERENCES
1. Bureau of Labor Statistics. Labor Force Statistics from the Current Population Survey:
Employed persons by detailed industry and age. 2016. Available from:
https://www.bls.gov/cps/demographics.htm.
2. Bureau of Labor Statistics. Employment projections -- 2010-2020. .Available from:
https://www.bls.gov/news.release/archives/ecopro_02012012.pdf.
3. Bureau of Labor Statistics. Injuries, Illnesses, and Fatalities: TABLE R65. Number of
nonfatal occupational injuries and illnesses involving days away from work by days away
from work groups and median number of days away from work by industry, private
industry, 2017. Available from: https://www.bls.gov/iif/oshwc/osh/case/cd_r65_2017.htm.
4. Bureau of Labor Statistics. Case and demographic characteristics for work-related injuries
and illnesses involving days away from work. Available from:
http://www.bls.gov/iif/oshcdnew.htm.
5. Bureau of Labor Statistics. Nonfatal occupational injuries and illnesses requiring days away
from work, 2013. Available from:
http://www.bls.gov/news.release/archives/osh2_12162014.pdf.
6. LCWA Research Group. American Nurses Association. Health & safety survey report;
2011.
7. Alexopoulos EC, Burdorf A, Kalokerinou A. A comparative analysis on musculoskeletal
disorders between Greek and Dutch nursing personnel. Int Arch Occup Environ Health.
2006. 79(1):82-8.
8. Dennerlein JT, Hopcia K, Sembajwe G, Kenwood C, Stoddard AM, Tveito TH, et al.
Ergonomic practices within patient care units are associated with musculoskeletal pain and
limitations. Am J Ind Med. 2012. 55(2):107-16.
9. Josephson M, Lagerstrom M, Hagberg M, Wigaeus Hjelm E. Musculoskeletal symptoms
and job strain among nursing personnel: a study over a three year period. Occup Environ
Med. 1997. 54(9):681-5.
10. June KJ, Cho SH. Low back pain and work-related factors among nurses in intensive care
units. J Clin Nurs. 2011. 20(3-4):479-87.
11. Lee SJ, Faucett J, Gillen M, Krause N, Landry L. Factors associated with safe patient
handling behaviors among critical care nurses. Am J Ind Med. 2010. 53(9):886-97.
12. Lee SJ, Lee JH, Gershon RR. Musculoskeletal Symptoms in Nurses in the Early
Implementation Phase of California's Safe Patient Handling Legislation. Res Nurs Health.
2015. 38(3):183-93.
13. Smedley J, Egger P, Cooper C, Coggon D. Manual handling activities and risk of low back
pain in nurses. Occup Environ Med. 1995. 52(3):160-3.
14. Chiou ST, Chiang JH, Huang N, Wu CH, Chien LY. Health issues among nurses in
Taiwanese hospitals: National survey. Int J Nurs Stud. 2013. 50(10):1377-84.
15. Trinkoff AM, Lipscomb JA, Geiger-Brown J, Brady B. Musculoskeletal problems of the
neck, shoulder, and back and functional consequences in nurses. Am J Ind Med. 2002.
41(3):170-8.
16. Collins JW. Testimony on safe patient handling and lifting standards for a safer American
workforce. Available from:
https://www.cdc.gov/washington/testimony/2010/t20100511.htm.
47
17. Howard N, Bao S, Lin J, Hunter D, Haas A. Work-related musculoskeletal disorders
(WMSDs) in Washington State - Health care. Available from:
http://www.lni.wa.gov/safety/research/files/wmsd/healthcare_summary_final.pdf.
18. Oregon Occupational Safety and Health Administration. Safe patient handling: A worthy
investment. Available from: http://www.slideserve.com/nia/safe-patient-handling-a-worthy-
investment.
19. D'Arcy LP, Sasai Y, Stearns SC. Do assistive devices, training, and workload affect injury
incidence? Prevention efforts by nursing homes and back injuries among nursing assistants.
J Adv Nurs. 2012. 68(4):836-45.
20. Kim H, Dropkin J, Spaeth K, Smith F, Moline J. Patient handling and musculoskeletal
disorders among hospital workers: Analysis of 7 years of institutional workers'
compensation claims data. Am J Ind Med. 2012. 55(8):683-90.
21. Lipscomb HJ, Schoenfisch AL, Myers DJ, Pompeii LA, Dement JM. Evaluation of direct
workers' compensation costs for musculoskeletal injuries surrounding interventions to
reduce patient lifting. Occup Environ Med. 2012. 69(5):367-72.
22. Pompeii LA, Lipscomb HJ, Schoenfisch AL, Dement JM. Musculoskeletal injuries resulting
from patient handling tasks among hospital workers. Am J Ind Med. 2009. 52(7):571-8.
23. Gomaa AE, Tapp LC, Luckhaupt SE, Vanoli K, Sarmiento RF, Raudabaugh WM, et al.
Occupational traumatic injuries among workers in health care facilities - United States,
2012-2014. MMWR Morb Mortal Wkly Rep. 2015. 64(15):405-10.
24. Cowley SP, Leggett S. Manual handling risks associated with the care, treatment and
transportation of bariatric (severely obese) clients in Australia. Work. 2011. 39(4):477-83.
25. Nelson A, Baptiste AS. Evidence-based practices for safe patient handling and movement.
Online J Issues Nurs. 2004. 9(3):4.
26. Collins JW, Wolf L, Bell J, Evanoff B. An evaluation of a "best practices" musculoskeletal
injury prevention program in nursing homes. Inj Prev. 2004. 10(4):206-11.
27. Nelson A, Matz M, Chen F, Siddharthan K, Lloyd J, Fragala G. Development and
evaluation of a multifaceted ergonomics program to prevent injuries associated with patient
handling tasks. Int J Nurs Stud. 2006. 43(6):717-33.
28. Hignett S. Intervention strategies to reduce musculoskeletal injuries associated with
handling patients: a systematic review. Occup Environ Med. 2003. 60(9):E6.
29. Garg A, Kapellusch JM. Long-term efficacy of an ergonomics program that includes
patient-handling devices on reducing musculoskeletal injuries to nursing personnel. Hum
Factors. 2012. 54(4):608-25.
30. Schoenfisch AL, Lipscomb HJ, Pompeii LA, Myers DJ, Dement JM. Musculoskeletal
injuries among hospital patient care staff before and after implementation of patient lift and
transfer equipment. Scand J Work Environ Health. 2013. 39(1):27-36.
31. Theis JL, Finkelstein MJ. Long-term effects of safe patient handling program on staff
injuries. Rehabil Nurs. 2014. 39(1):26-35.
32. Tullar JM, Brewer S, Amick BC, 3rd, Irvin E, Mahood Q, Pompeii LA, et al. Occupational
safety and health interventions to reduce musculoskeletal symptoms in the health care
sector. Journal of occupational rehabilitation. 2010. 20(2):199-219.
33. Kutash M, Short M, Shea J, Martinez M. The lift team's importance to a successful safe
patient handling program. J Nurs Adm. 2009. 39(4):170-5.
48
34. Powell-Cope G, Toyinbo P, Patel N, Rugs D, Elnitsky C, Hahm B, et al. Effects of a
national safe patient handling program on nursing injury incidence rates. J Nurs Adm. 2014.
44(10):525-34.
35. Mayeda-Letourneau J. Safe patient handling and movement: a literature review. Rehabil
Nurs. 2014. 39(3):123-9.
36. Lim HJ, Black TR, Shah SM, Sarker S, Metcalfe J. Evaluating repeated patient handling
injuries following the implementation of a multi-factor ergonomic intervention program
among health care workers. J Safety Res. 2011. 42(3):185-91.
37. American Nurses Association. State legislative agenda: Safe Patient Handling and Mobility
(SPHM). Available from: http://www.nursingworld.org/MainMenuCategories/Policy-
Advocacy/State/Legislative-Agenda-Reports/State-SafePatientHandling.
38. Association of Safe Patient Handling Professional. U.S. Federal and state legislative
summary: Safe patient handling/Ergonomics. 2011. Available from:
http://www.asphp.org/wp-
content/uploads/2011/05/SPH_Legislation_Update_March_2011.pdf.
39. Congress. H.R.4266 - Nurse and Health Care Worker Protection Act of 2015. 2015.
40. American Nurses Association. Safe patient handling and mobility: Interprofessional national
standards across the care continuum. Nursebooks.org; 2013. Available from:
http://nursingworld.org/DocumentVault/OccupationalEnvironment/SPHM-Standards-
Resources/Sample-of-the-SPHM-book.pdf.
41. California Department of Industrial Relations. Safe Patient Handling. Available from:
http://www.dir.ca.gov/dosh/Safe_Patient_Handling.htm.
42. California Department of Industrial Relations Division of Occupational Safety and Health,
§5120 Health Care Worker Back and Musculoskeletal Injury Prevention. 2014.
43. Darragh AR, Shiyko M, Margulis H, Campo M. Effects of a safe patient handling and
mobility program on patient self-care outcomes. Am J Occup Ther. 2014. 68(5):589-96.
44. Campo M, Shiyko MP, Margulis H, Darragh AR. Effect of a safe patient handling program
on rehabilitation outcomes. Arch Phys Med Rehabil. 2013. 94(1):17-22.
45. Washington State Department of Labor and Industries' SHARP Program. Implementation of
Safe Patient Handling in Washington State Hospitals. 2011. Available from:
http://www.lni.wa.gov/Safety/Research/Files/SafePatientHandlingRpt2010.pdf.
46. Glasgow RE, Vogt TM, Boles SM. Evaluating the public health impact of health promotion
interventions: the RE-AIM framework. Am J Public Health. 1999. 89(9):1322-7.
47. California Department of Industrial Relations. Answers to frequently asked questions about
the workers' compensation information system (WCIS) - first reports of injury and
subsequent reports of injury. Available from: http://www.dir.ca.gov/dwc/WCISFAQ.htm#4.
48. California Department of Industrial Relations. Workers' Compensation Information System:
California EDI implementation guide for first and subsequent reports of injury
(FROI/SROI). Available from: http://www.dir.ca.gov/dwc/EDI_Guide/ImpGuideFinal.pdf.
49. California Office of Statewide Health Planning & Development. About OSHPD. Available
from: http://www.oshpd.ca.gov/AboutUs.html.
50. Bureau of Labor Statistics. Quarterly Census of Employment and Wages: Overview.
Available from: http://www.bls.gov/cew/cewover.htm.
51. National Institute for Occupational Safety and Health. NIOSH program portfolio:
Musculoskeletal disorders. Available from: http://www.cdc.gov/niosh/programs/msd/.

49
52. Bureau of Labor Statistics. Employee tenure. Available from:
https://www.bls.gov/news.release/tenure.toc.htm
53. Cameron AC, Trivedi PK. Regression analysis of count data. Cambridge: Cambridge
University Press; 1998.
54. California Office of Statewide Health Planning and Development. Facility listings.
Available from: https://www.oshpd.ca.gov/HID/Facility-Listing.html.
55. Guest G, Namey E, K. M. How many focus groups are enough? Building an evidence base
for nonprobability sample sizes. Field Methods. 2017;29(1).
https://doi.org/10.1177/1525822X16639015
56. Hsieh HF, Shannon SE. Three approaches to qualitative content analysis. Qual Health Res.
2005;15(9):1277-88.