Embed Size (px)
Citation preview

International Journal of Marketing and Technology Vol. 8 Issue 11, November 2018,
ISSN: 2249-1058 Impact Factor: 6.559
Journal Homepage: http://www.ijmra.us, Email: [email protected]
Double-Blind Peer Reviewed Refereed Open Access International Journal - Included in the International Serial
Directories Indexed & Listed at: Ulrich's Periodicals Directory ©, U.S.A., Open J-Gage as well as in Cabell’s
Directories of Publishing Opportunities, U.S.A
1 International Journal of Marketing and Technology
http://www.ijmra.us, Email: [email protected]
IMPACT OF SALES PROMOTION ON SALES OF SOFT
DRINKS IN KATHMANDU VALLEY
Gita Aryal*
Abstract:
This study examines sales promotion adopted by Nepalese business organizations and its effects
on sales of soft drink in Kathmandu valley. This study is based on the primary data through
convenience sampling technique. The primary data collected from the different places of
Kathmandu valley by face to face field survey of 150 respondents. It is found that the sales
promotion activities play positive impact on sales of soft drink brands. It is believed that the
findings of this paper may facilitate the Nepalese business organizations for formulating policies
of sales promotion on sales of soft drinks products.
Key words: Brand preference, Sales promotion, Soft drinks.
* Shanker Dev Campus, Tribhuvan University, Kathmandu, Nepal

ISSN: 2249-1058 Impact Factor: 6.559
2 International Journal of Marketing and Technology
http://www.ijmra.us, Email: [email protected]
1. Introduction:
The world of business is going to complex day to day. Competition in every sector is increasing
high. In this situation, especially manufacturing companies find the situation cry though to sell
their product in the market smoothly. So, the businessmen are using various tools and techniques
to sell their products. Today market is growing so rapidly. Many products are being introduced
in the market day by day. Few decades back situation was not like this; market was limited to
few products. Market was growing means that a plentiful of supply of new costumers and
company could attract those new costumers without worrying of losing old ones. But now
competitions are though and market is sophisticated and companies are facing some marketing
realities. “Sales promotions consist of a diverse collection of incentive tools, mostly short-term,
designed to stimulate quicker and/or greater purchase of particular products/services by
consumers or the trade” (Kotler, 1997). In fact, sales promotion works as a quick stimulator,
which stimulates the consumer on the trade to buy the particular products.
Sales promotion can promote organization effectiveness through increase in profitability from
higher sales. Okoli (2011) explains that the “essence of setting up a business organization is to
make profit. Without profit, a business is bound to fail”. Loudon and Bitta (2002) said that sales
promotion plays a significant effect on decisions which help in achieving the organizational
objectives. Organization effectiveness is a totality of organization goodness, a sum of such
elements as production, cost performance, turnover, quality of output, profitability, efficiency
and the like (Katz and Kahn, 1966). It is the ability of an organization to achieve its objectives
and meet the needs of its various stakeholders (Khandwalla, 1995).
In real sales promotion have a method of making communication other than advertising and
personnel selling. Although in marketing communication mix, the entire element like
advertising, personal selling, publicity and sales promotion come together. Sales promotion has
effects on various aspects of consumer’s purchase decisions such as brand choice, purchase time,
quantity, and brand switching (Nijs, et al., 2001). Bamiduro (2001) established the positive
relationship between sales promotion and consumption rate of soft drink products as well as the
sales volume of the beverage industry in Nigeria. Oyedapo, et al. (2012) found that organization
promotion strategies enhance consumer buying pattern. Syeda, et al. (2012) explore the short

ISSN: 2249-1058 Impact Factor: 6.559
3 International Journal of Marketing and Technology
http://www.ijmra.us, Email: [email protected]
term and long term impact of sales promotion in Pakistani companies from two diverse
industries, i.e. Beverage Industry (Shezan International Ltd) and Foam Manufacturing Industry
(Diamond Supreme Foam) by regressing mean of brand loyalty on mean perception about
promotion obtained through financial analysis and consumer survey respectively. Aham (2008)
is of the opinion that sales promotion emerged as a reaction by manufacturers marketers, and
marketing strategies alike to find a short term solution to the problems of excess stock of goods
which are available in variables manufacturer’s warehouses but are not demanded by consumers
and organization. Pauwels, et al. (2002) are of the opinion that when a consumer is exposed to a
sales promotion offer majority of the time, the consumer has already purchased and practiced a
particular brand so the impact of learning form the that purchase is minimal and is easily
balanced by a simultaneous and similar competitive offering. However, sales promotion
activities are entirely different from place to place. Sales promotion concept is new in Nepal. By
keeping the view of this reality, this paper tries to examine the impact of sales promotion
activities on sales of soft drinks in Kathmandu Valley.
2. Methods and Materials
This study is based on the survey research design. So, the nature of this study is based on the
primary data. The primary data collected from the different places of Kathmandu by face to face
field survey. There were 150 samples are taken from the population of the study. Convenience
sampling technique has been adopted to collect the samples from the population. The data have
been analyzed by different tools such as percentage, frequency by using different table.
Inferential statistics like chi-square test has been adopted to test the independence of attributes.
χ2=∑ O-E ²
E
Where, O= Observed frequency and E= Estimated frequency
3. Results and Discussions
3.1 Consumers Soft Drinks Drinking Habit and Behavior
To know about consumer habit the research start from very preliminary questions like "Do you
drink soft drinks?" To the very specific question like "Dou you stick on any special brand of soft
drink?" The following series of table present response behavior.
ISSN: 2249-1058 Impact Factor: 6.559
4 International Journal of Marketing and Technology
http://www.ijmra.us, Email: [email protected]
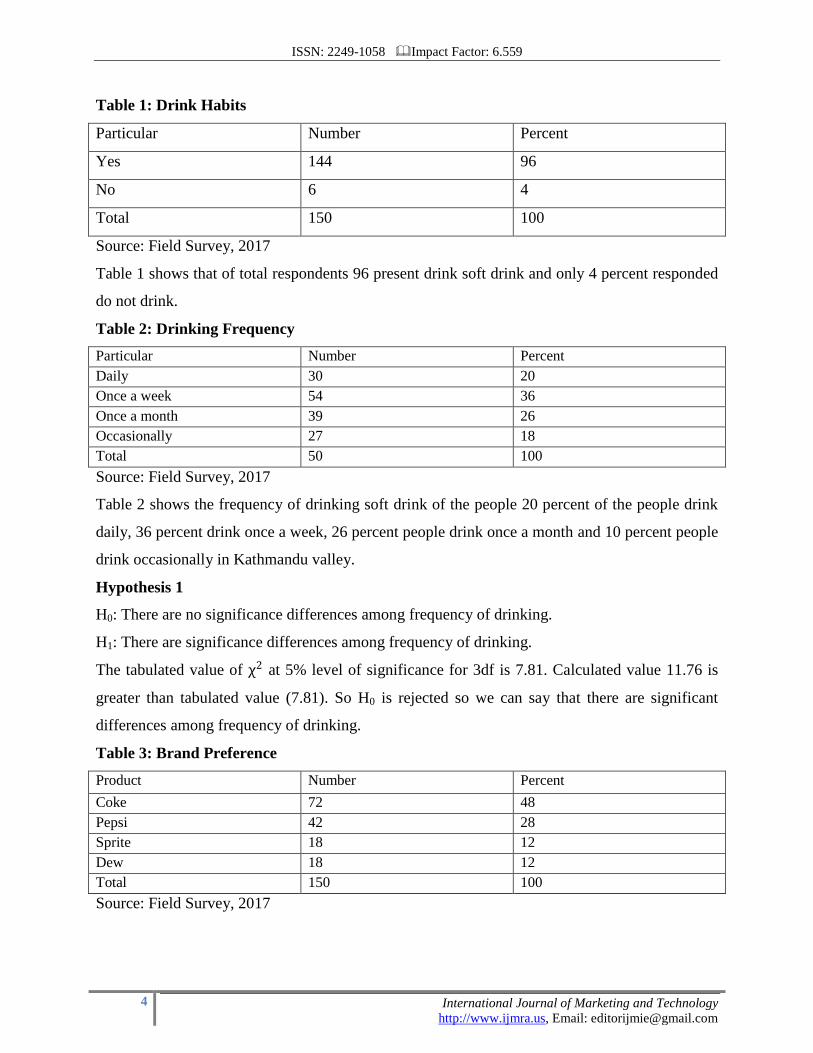
Table 1: Drink Habits
Particular Number Percent
Yes 144 96
No 6 4
Total 150 100
Source: Field Survey, 2017
Table 1 shows that of total respondents 96 present drink soft drink and only 4 percent responded
do not drink.
Table 2: Drinking Frequency
Particular Number Percent
Daily 30 20
Once a week 54 36
Once a month 39 26
Occasionally 27 18
Total 50 100
Source: Field Survey, 2017
Table 2 shows the frequency of drinking soft drink of the people 20 percent of the people drink
daily, 36 percent drink once a week, 26 percent people drink once a month and 10 percent people
drink occasionally in Kathmandu valley.
Hypothesis 1
H0: There are no significance differences among frequency of drinking.
H1: There are significance differences among frequency of drinking.
The tabulated value of χ2 at 5% level of significance for 3df is 7.81. Calculated value 11.76 is
greater than tabulated value (7.81). So H0 is rejected so we can say that there are significant
differences among frequency of drinking.
Table 3: Brand Preference
Product Number Percent
Coke 72 48
Pepsi 42 28
Sprite 18 12
Dew 18 12
Total 150 100
Source: Field Survey, 2017

ISSN: 2249-1058 Impact Factor: 6.559
5 International Journal of Marketing and Technology
http://www.ijmra.us, Email: [email protected]
Table 3 shows that the brand preference of the individual. 60% choose Coke, 28% choose Pepsi
and 12 percent choose Sprite and Dew.
Hypothesis 2
H0: Consumer is brand loyal.
H1: Consumer is not brand loyal.
The calculated value is 53.92. The tabulated value of χ2 at 5% level of significance for 2 df is
5.99. Calculated value is much greater than tabulated value. So, H0 is rejected i.e. Consumer is
not brand loyal.
3.2 Sales Promotion of Soft drinks
To know consumers opinion and their think about promotional work that soft drink company
perform. The researcher has picked up the subject with very simple question such as “Do you
know about the promotional work that soft drink manufactures perform?” The following is the
table relating with promotional work.
Table 4: Popularity of Promotion
Particular Number Percent
Yes 135 90
No 15 10
Total 150 100
Source: Field Survey, 2017
Table 4 reveals the popularity of promotional work which provide by manufacture of soft drinks.
According to the table 90% of people know about the promotional work and the only 10% of
people are unknown about the promotion.
Table 5: Aware of Promotion
Particular Number Percent
Item 48 32
Coupon 54 36
Cash price 42 28
Other 6 4
Total 150 100
Source: Field Survey, 2017

ISSN: 2249-1058 Impact Factor: 6.559
6 International Journal of Marketing and Technology
http://www.ijmra.us, Email: [email protected]
Table 5 shows that out of the total respondents’ 36% people are aware of the item price, 32%
aware of Coupon.28% Cash and remaining 4 % people aware of other promotional works.
Table 6: Effectiveness of the Promotional Tools
Particular Number Percent
Cash 66 44
Items 33 30
Coupon 45 22
Other 6 4
Total 150 100
Source: Field Survey, 2017
Table 6 shows the effectiveness of the promotional tools. Out of the Total respondents 44% of
people choose cash price. 30% item, 22% coupon and 4% of people choose other promotional
tools.
Table 7: Interest on Promotional Contents
Particular Number Percent
Very much 90 60
A bit 27 18
Don’t know 18 12
Don’t like 15 10
Total 150 100
Source: Field Survey, 2017
Table 7 shows the interest of the people on promotional contents. Out of total respondents, 60
percent of people contents very much. 18 percent like a bit, 12 percent of people are indifference
of these contents and 10 percent of people are against of these contents.
Hypothesis 3
Ho: There is not relationship between contents and consumer behavior.
H1: There is relationship between contents and consumer behavior.
Calculated value χ2 is greater than tabulated value (22.36>7.8). So, null hypothesis (Ho) is
rejected i.e. there is a relationship between contents and consumer behavior. It concludes those
consumers are like sales promotion contents.

ISSN: 2249-1058 Impact Factor: 6.559
7 International Journal of Marketing and Technology
http://www.ijmra.us, Email: [email protected]
Table 8: Participation in contents
Particular Number Percent
Yes 108 72
No 42 28
Total 150 100
Source: Field Survey, 2017
Table 8 depicts that 72 percent of people taking parts in contents and 28 percent of people do not
taking any parts in contents.
Table 9: Win Prizes
Particular Number Percent
Yes 36 24
No 114 76
Total 150 100
Source: Field Survey, 2017
Table 9 shows that 24 percent respondents win the prizes and remaining 24 percent do not win
the prizes.
Table 10: Encourage to Consumer More
Particular Number Percent
Yes 84 56
No 66 44
Total 150 100
Source: Field Survey, 2017
Table 10 shows that promotion scheme should be change 56 percent of people are encourage to
consumer more soft drink and 44 percent of people are not affected by any scheme.
Table 11: Brand switching
Particular Number Percent
Yes 111 74
No 39 26
Total 150 100
Source: Field Survey, 2017

ISSN: 2249-1058 Impact Factor: 6.559
8 International Journal of Marketing and Technology
http://www.ijmra.us, Email: [email protected]
Table 11 shows that 74 percent of people switch their brand if they do not provide any promotion
package. And 26 percent of people are brand loyal so they do not change their usual brand.
3.3 Media Graphic
To know which media is suitable to convey the massages of sales promotion, which media is
more popular, the researcher wants to ask some question like “Do you watch/read/listen the
programs and news from T.V., Paper and Radio?” The following is the table relating with media.
Table 12: Habit on Watching Programs
Particular Number Percent
Yes 150 100
No 0 0
Total 150 100
Source: Field Survey, 2017
Table 12 shows that 100 percent of people watch/listen/read programs and news on T.V., radio
and paper respectively.
Table 13: Media on Advertisement
Particular Number Percent
T.V. 69 46
Radio 12 8
Newspaper 9 6
All 60 40
Total 150 100
Source: Field Survey, 2017
Table 13 shows that 46 percent of people choose T.V., 8 percent choose radio, 6 percent choose
newspaper and 40 percent of people choose all these media to watch/listen/read the programs and
news.
Table 14: Interest on advertisement
Particular Number Percent
Yes 135 90
No 15 10
Total 150 100
Source: Field Survey, 2017
ISSN: 2249-1058 Impact Factor: 6.559
9 International Journal of Marketing and Technology
http://www.ijmra.us, Email: [email protected]
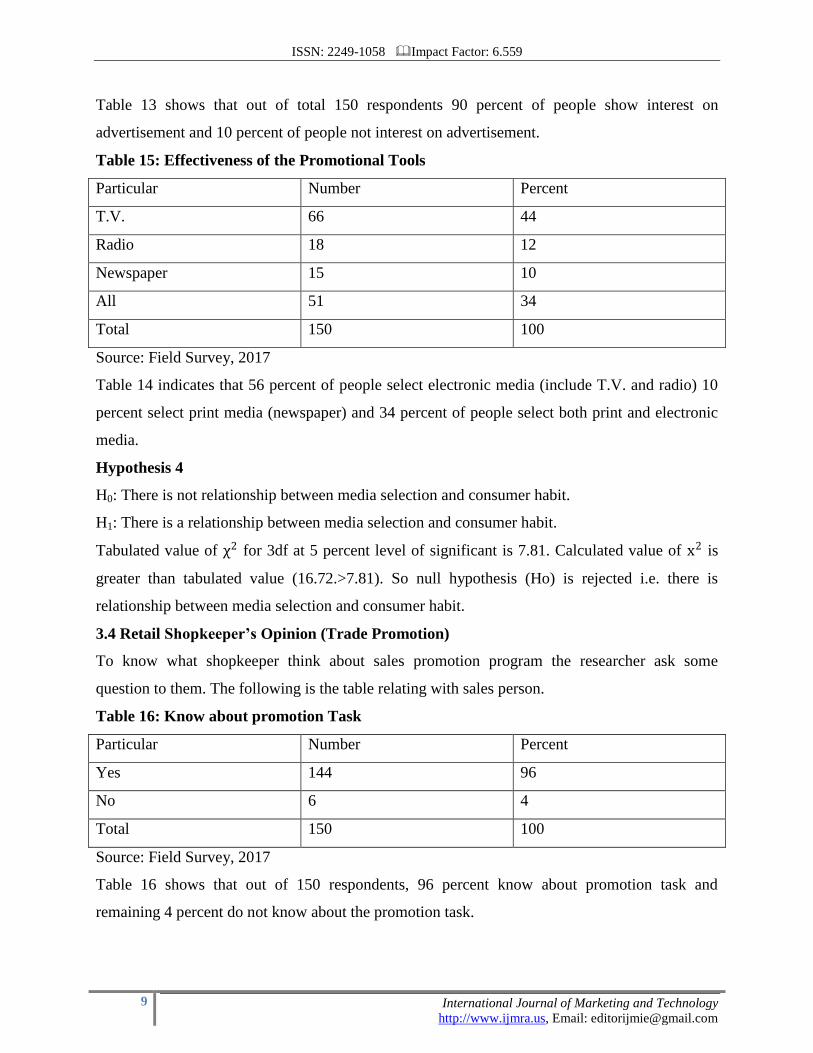
Table 13 shows that out of total 150 respondents 90 percent of people show interest on
advertisement and 10 percent of people not interest on advertisement.
Table 15: Effectiveness of the Promotional Tools
Particular Number Percent
T.V. 66 44
Radio 18 12
Newspaper 15 10
All 51 34
Total 150 100
Source: Field Survey, 2017
Table 14 indicates that 56 percent of people select electronic media (include T.V. and radio) 10
percent select print media (newspaper) and 34 percent of people select both print and electronic
media.
Hypothesis 4
H0: There is not relationship between media selection and consumer habit.
H1: There is a relationship between media selection and consumer habit.
Tabulated value of χ2 for 3df at 5 percent level of significant is 7.81. Calculated value of x2 is
greater than tabulated value (16.72.>7.81). So null hypothesis (Ho) is rejected i.e. there is
relationship between media selection and consumer habit.
3.4 Retail Shopkeeper’s Opinion (Trade Promotion)
To know what shopkeeper think about sales promotion program the researcher ask some
question to them. The following is the table relating with sales person.
Table 16: Know about promotion Task
Particular Number Percent
Yes 144 96
No 6 4
Total 150 100
Source: Field Survey, 2017
Table 16 shows that out of 150 respondents, 96 percent know about promotion task and
remaining 4 percent do not know about the promotion task.

ISSN: 2249-1058 Impact Factor: 6.559
10 International Journal of Marketing and Technology
http://www.ijmra.us, Email: [email protected]
Table 17: Aware of promotion
Particular Number Percent
Cash prizes 48 32
Discount 45 30
Coupon 36 24
Others 21 14
Total 150 100
Source: Field Survey, 2017
Table 17 shows that 32 percent aware of cash prizes. 30 percent aware of discount scheme, 26
percent aware of coupon scheme and 12 percent aware of other schemes.
Table 18: Encourage to Sales
Particular Number Percent
Cash prizes 48 32
Discount 45 30
Coupon 39 26
Others 18 12
Total 150 100
Source: Field Survey, 2017
Table 18 shows that the coverage of promotional tools whereas 32 percent of retailers encourage
by cash prize. 30 percent encourage by discount. 24 percent encourage by coupon and remaining
14 percent of retailer are encourage by others tools to sale more.
Hypothesis 5
H0: There is no significances difference between promotion and sales.
H1: There is significance difference between promotion and sales.
Tabulated value χ2 at 5 percent level of significance for 3 df is greater than its calculated value
(7.81>3.90). Null hypothesis (H0) is acceptable i.e. sales and sales promotion in related.
Table 19: Taken parts on contents
Particular Number Percent
Yes 147 98
No 3 2
Total 150 100
Source: Field Survey, 2017

ISSN: 2249-1058 Impact Factor: 6.559
11 International Journal of Marketing and Technology
http://www.ijmra.us, Email: [email protected]
Table 19 shows that 98 percent of salesperson (Shopkeepers) are involving at one content and
only 2 percent of are not taken parts on these contents.
Table 20: Win Prizes
Particular Number Percent
Yes 138 92
No 12 8
Total 150 100
Source: Field Survey, 2017
Table 20 shows that 92 percent of people win prize and only 8 percent of people do not win any
prize.
Table 21: Effectiveness of Sales promotion on Sales
Particular Number Percent
Yes 120 80
No 30 20
Total 150 100
Source: Field Survey, 2017
Table 21 shows that effectiveness of sales promotion. 76 percent of retailers are affected by
promotion but 24 percent of retailers are not affected by promotion.
Table 22: Effectiveness of Sales promotion on Sales
Particular Number Percent
Yes 120 80
No 30 20
Total 150 100
Source: Field Survey, 2017
Table 22 shows that 80 percent of retailer of says that they are affected by promotion work. If
any product does not provide any promotion package they switch their brand but 20 percent of
retailers are brand season.
4. Conclusion
The sales promotion activities do positive impact on sales of soft drink brands. From the analysis
it clears that if sizeable amount is spent on promotional activities the sales would increase
accordingly. The study finds that besides other cash prize is most accepted as well effective and
ISSN: 2249-1058 Impact Factor: 6.559
12 International Journal of Marketing and Technology
http://www.ijmra.us, Email: [email protected]
widely used mode of sales promotion. The electronic media is most accepted by the people. So
far sales promotion purpose the electronic media is very suitable. Comparative analysis shows,
there is a strong positive relationship between sales promotion expenses and sales volume of the
soft drinks Companies. Which justify the strong impact of sales promotion on sales and other
hand, it clarified that sales promotion helps to increase the sales. So, they can easily be directed
towards one particular brand through proper promotional activities. In summary, increasing sales
of one brand does not affect negatively to the sales of other brand. They all can increase their
sales through promotional activities and create own sales promotion is the key factor to increase
sales. Sales promotion covers a wide range of short term incentive tools designed to stimulate the
consumer market, the trade, and the organizations own sales force. Sales promotion expenditures
now exceed advertising expenditures and are growing at a faster rate. So as in Nepal too, the use
of this marketing techniques is increasingly high. Thus, the use of sales promotion is very
important if the exercise would be in a proper way.
References
Aham, A. (2008). Dimensions of Marketing. Nigeria: Okigwe, Avan Global Publication.
Bamiduro, J.A. (2001). “An analysis of sales promotion on sales volume in the beverage
industry: The case study Nigeria Bottling Company Plc. Journal Intellectual Scientific
and Cultural Interest, 10 (1) :11- 19.
Katz, D., & Kahn, R.L. (1966). The Social Psychology of Organizations. New York:
Wiley.
Khandwalla, P.N. (1995). Management Style. New Delhi: Mc-Graw Hill.
Kotler, P. (1997). Marketing Management, New Dehli: Prentice Hall of India Pvt. Ltd.
Loudon, D.L., & Bitta. D.A.J. (2002). Consumer Behaviour. New Delhi: Tata McGraw-
Hill.
Nijs, V.R., et al. (2001). The category-demand effects of price promotions. Marketing
Sciences. 20(1):1-22.
Okoli, B.E. (2011). Evaluation of the accounting systems used by small scale enterprises
in Nigeria: The case of Enugu-South East Nigeria. Asian Journal of Business
Management. 3(4): 235-240.

ISSN: 2249-1058 Impact Factor: 6.559
13 International Journal of Marketing and Technology
http://www.ijmra.us, Email: [email protected]
Oyedapo, W.O., et al. (2012). The impact of sales promotion on organization
effectiveness in Nigerian manufacturing industry. Universal Journal of Marketing and
Business Research, 1(14): 123-131.
Pauwels, K., et al. (2002). The long term effects of price promotions on category
incidence, brand choice and purchase quantity. Journal of Marketing, Pp. 27-29.
Syeda N.Z.R., et al. (2012). Short term and long term impact of sales promotion on
organizations’ profitability: A comparative study between convenience and shopping
goods.. International Journal of Business and Management, 7(5): 247-255.