Embed Size (px)
Citation preview
ORIGINAL RESEARCH
Impact of Social Determinants of Health on Patientswith Complex Diabetes Who Are Served byNational Safety-Net Health CentersVivian Li, MS, Mary Ann McBurnie, PhD, Melissa Simon, MD, MPH,Phil Crawford, MS, Michael Leo, PhD, Fred Rachman, MD, Erika Cottrell, PhD, MPP,Lydia Dant, MPH, Mary Oneha, APRN, PhD, and Rosy Chang Weir, PhD
Objective: Recent research demonstrates an increased need to understand the contribution of social deter-minants of health (SDHs) in shaping an individual’s health status and outcomes. We studied patients withdiabetes in safety-net centers and evaluated associations of their disease complexity, demographic character-istics, comorbidities, insurance status, and primary language with their HbA1c level over time.
Methods: Adult patients with diabetes with at least 3 distinct primary care visits between January 1,2006, and December 31, 2013, were identified in the CHARN data warehouse. These patients were cate-gorized into 4 groups: those without a diagnosis of cardiovascular disease (CVD) or depression; thosewith CVD but not depression; those with depression but not CVD; and those with CVD and depression.Charlson score; demographic characteristics such as age, sex, and race/ethnicity; and SDHs such as pri-mary language and insurance status were used as predictors. The outcome measure was HbA1c. Hypoth-esis testing was conducted using 3-level hierarchical linear models.
Results: Baseline HbA1c differed significantly across the 4 diabetes groups and by race/ethnicity. Theamount of HbA1c change over time differed by insurance status. Patients who were continuously insuredtended to have lower baseline HbA1c and a smaller increase. Chinese-speaking patients tended to havelower baseline HbA1c but a larger increase over time compared with English speakers. There were vari-ous unexpected associations: compared with the diabetes-only group, mean HbA1c tended to be loweramong the other more complex groups at baseline; women tended to have lower measures at baseline;older age and higher Charlson scores were associated with lower HbA1c.
Conclusions: There is still unexplained variability relating to both baseline HbA1c values and change overtime in the model. SDHs, such as insurance status and primary language, are associated with HbA1c, andresults suggest that these relationships vary with disease status among patients with diabetes in safety-netcenters. It is important to recognize that there are complex relationships among demographic and SDH mea-sures in complex patients, and there is work to be done in correctly modeling and understanding these relation-ships. We also recommend prioritizing the collection of SDH and enabling services data for safety-net patients thatwould be instrumental in conducting a more comprehensive study. (J Am Board Fam Med 2016;29:356–370.)
Keywords: Community Health Centers, Insurance, Safety-Net Providers, Social Determinants of Health
Social determinants of health (SDHs) contribute todisparities in health and a higher prevalence ofhealth-related problems, particularly for medically
underserved populations. The World Health Or-ganization Commission on Social Determinants ofHealth defines SDHs as “the structural determi-nants and conditions of daily life responsible for a
This article was externally peer reviewed.Submitted 20 July 2015; revised 2 March 2016; accepted 8
March 2016.From the Association of Asian Pacific Community Health
Organizations, San Leandro CA (VL, RCW); Kaiser Perma-nente Center for Health Research, Portland OR (MAB, PC,ML); Northwestern University, Feinberg School of Medicine,Chicago IL (MS); Alliance of Chicago Community
Health Services, Chicago IL (FR); OCHIN, Inc., Portland OR(EC); The Fenway Institute, Boston, MA (LD); and theWaimanalo Health Center, Waimanalo, HI (MO).
Funding: This Study was supported by grant no.HHSH250201400001C from the Health Resources andServices Administration.
Conflict of interest: none declared.
356 JABFM May–June 2016 Vol. 29 No. 3 http://www.jabfm.org
major part of health inequities between and withincountries.”1 SDHs play a powerful role in shapinghealth across a wide range of health indicators,settings, and populations.1–5 Traditional medicalcare is not the only influence on health, and theeffects of medical care may be more limited thancommonly thought, particularly in determiningwho becomes sick or injured.3–7 Interest in study-ing and describing SDHs has increased over thepast few decades,8–10 and it is clear that SDHs areassociated with suboptimal health status or poorhealth-related outcomes,11 such as higher rates ofmental disorders and medical conditions.12 In ameta-analysis conducted by Lorant and col-leagues,13 people with a low socioeconomic statuswere 1.8 times more likely to report being de-pressed than were people with higher status. Lett etal14 also found that low social support was associ-ated with a 1.5- to 2-times increased the risk ofdeveloping coronary heart disease or experiencingadverse outcomes associated with coronary heartdisease.
Community health centers (CHCs) are thehealth and medical homes for over 22 millionpeople in the United States, primarily popula-tions that have a disproportionately low income(93%), are uninsured (35%), or have limitedEnglish proficiency (23%).15 Studying these pop-ulations provides a unique opportunity to under-stand and characterize the effect of SDHs onhealth care use and health outcomes, and to bet-ter identify the factors that increase the risk ofpoor health. Typically, CHC patients are poorer,more racially and ethnically diverse, more likelyto report being in fair or poor health, and morelikely to be unemployed and uninsured than thebroader low-income population.16 For example,the rate of having diabetes mellitus (DM) orborderline DM is 19.2% among the CHC pop-ulation versus 12.0% among the general low-income US population; the rate of having �2health conditions (DM, asthma, hypertension, aliver condition, coronary heart disease, and em-physema) in a lifetime is 25.4% for CHC patientsbut 16.6% for the general low-income US pop-ulation; and the rate of being uninsured is 34.4%
for CHC patients versus 12.6% for the generallow-income US population.16 Moreover, a largeproportion of patients who receive care at CHCshave complex health needs, including multiplechronic diseases and behavioral health conditions(eg, depression or substance abuse).17 Among thebroader US population, those with behavioralhealth disorders have significantly higher rates ofhaving comorbid medical conditions,12 a higherincidence of DM,12 worse DM outcomes overtime,18 and a higher risk of death from DM-related complications.19 Moreover, the use ofnonpreventive medical services (eg, in an emer-gency department, hospitalization, 30-day read-mission, avoidable hospitalization) is significantlyhigher among patients with behavioral healthconditions than those without.20,21 Thus it isimportant to understand the relationship be-tween behavioral health, medical comorbidities,and SDHs in CHC settings to understand howbest to serve these high-risk populations.
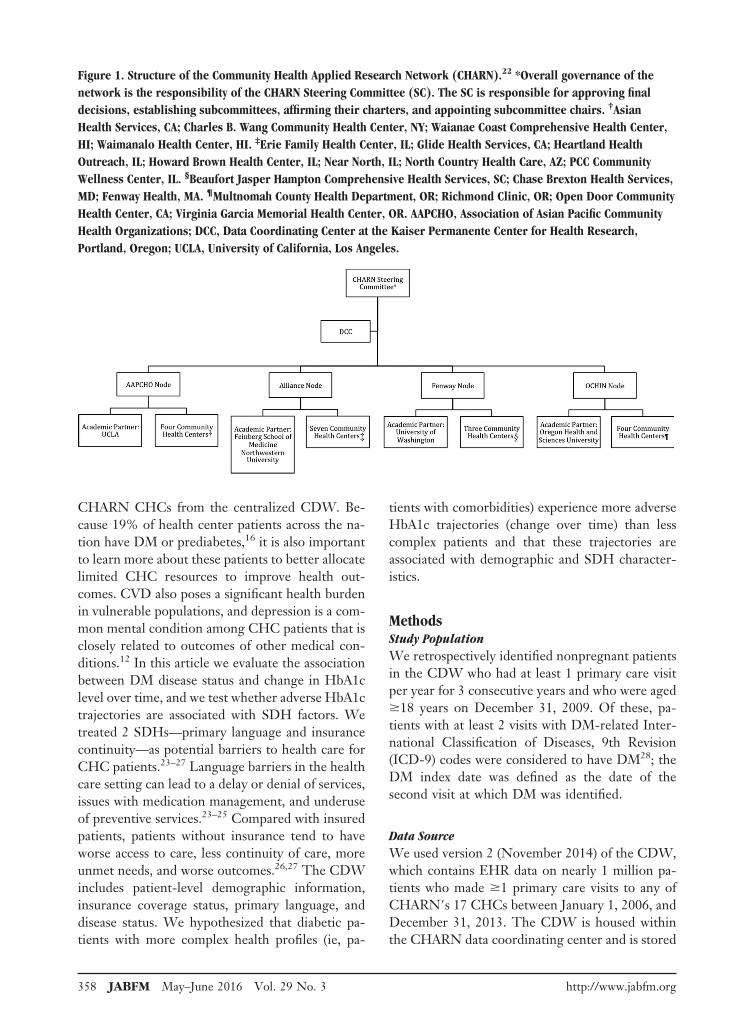
The Community Health Applied Research Net-work (CHARN), which was established in 2010,provides an opportunity to examine some of therelationships between behavioral health, medicalcomorbidities, and SDHs. CHARN consists of 4safety-net research nodes, each of which has affili-ated CHCs and an academic or research partner.Each node includes �3 CHCs (17 total). The par-ticipating CHCs are located in 9 states across thecountry, and all have provided standardized data tothe centralized CHARN Data Warehouse (CDW).The 4 nodes are Alliance of Chicago CommunityHealth Services (Alliance; Chicago, IL); the Asso-ciation of Asian Pacific Community Health Orga-nizations (AAPCHO; San Leandro, CA); FenwayHealth (Fenway; Boston, MA); and OCHIN (for-merly the Oregon Community Health InformationNetwork but shortened to OCHIN when otherstates joined; Portland, OR).22 Figure 1 shows thestructure of CHARN.
For this retrospective study, we identified dia-betic patients in the CDW and determinedwhether they also had a diagnosis of cardiovasculardisease (CVD), depression, or both. DM was cho-sen as the focus because of the potential complexityof the disease and its treatment (ie, with or withoutcomorbidities). In addition, DM is well docu-mented in electronic health records (EHRs), as isits outcome measure, glycohemoglobin (HbA1c)level, which enabled us to use EHR data across
Corresponding author: Vivian Li, MS, Association of AsianPacific Community Health Organizations, 101 Callan Ave-nue, Suite 400, San Leandro CA 94577 �E-mail:[email protected]�.
doi: 10.3122/jabfm.2016.03.150226 Patients with Diabetes Served by Safety-Net Centers 357
CHARN CHCs from the centralized CDW. Be-cause 19% of health center patients across the na-tion have DM or prediabetes,16 it is also importantto learn more about these patients to better allocatelimited CHC resources to improve health out-comes. CVD also poses a significant health burdenin vulnerable populations, and depression is a com-mon mental condition among CHC patients that isclosely related to outcomes of other medical con-ditions.12 In this article we evaluate the associationbetween DM disease status and change in HbA1clevel over time, and we test whether adverse HbA1ctrajectories are associated with SDH factors. Wetreated 2 SDHs—primary language and insurancecontinuity—as potential barriers to health care forCHC patients.23–27 Language barriers in the healthcare setting can lead to a delay or denial of services,issues with medication management, and underuseof preventive services.23–25 Compared with insuredpatients, patients without insurance tend to haveworse access to care, less continuity of care, moreunmet needs, and worse outcomes.26,27 The CDWincludes patient-level demographic information,insurance coverage status, primary language, anddisease status. We hypothesized that diabetic pa-tients with more complex health profiles (ie, pa-
tients with comorbidities) experience more adverseHbA1c trajectories (change over time) than lesscomplex patients and that these trajectories areassociated with demographic and SDH character-istics.
MethodsStudy PopulationWe retrospectively identified nonpregnant patientsin the CDW who had at least 1 primary care visitper year for 3 consecutive years and who were aged�18 years on December 31, 2009. Of these, pa-tients with at least 2 visits with DM-related Inter-national Classification of Diseases, 9th Revision(ICD-9) codes were considered to have DM28; theDM index date was defined as the date of thesecond visit at which DM was identified.
Data SourceWe used version 2 (November 2014) of the CDW,which contains EHR data on nearly 1 million pa-tients who made �1 primary care visits to any ofCHARN�s 17 CHCs between January 1, 2006, andDecember 31, 2013. The CDW is housed withinthe CHARN data coordinating center and is stored
Figure 1. Structure of the Community Health Applied Research Network (CHARN).22 *Overall governance of thenetwork is the responsibility of the CHARN Steering Committee (SC). The SC is responsible for approving finaldecisions, establishing subcommittees, affirming their charters, and appointing subcommittee chairs. †AsianHealth Services, CA; Charles B. Wang Community Health Center, NY; Waianae Coast Comprehensive Health Center,HI; Waimanalo Health Center, HI. ‡Erie Family Health Center, IL; Glide Health Services, CA; Heartland HealthOutreach, IL; Howard Brown Health Center, IL; Near North, IL; North Country Health Care, AZ; PCC CommunityWellness Center, IL. §Beaufort Jasper Hampton Comprehensive Health Services, SC; Chase Brexton Health Services,MD; Fenway Health, MA. ¶Multnomah County Health Department, OR; Richmond Clinic, OR; Open Door CommunityHealth Center, CA; Virginia Garcia Memorial Health Center, OR. AAPCHO, Association of Asian Pacific CommunityHealth Organizations; DCC, Data Coordinating Center at the Kaiser Permanente Center for Health Research,Portland, Oregon; UCLA, University of California, Los Angeles.
358 JABFM May–June 2016 Vol. 29 No. 3 http://www.jabfm.org
behind a secure firewall on an SQL Server (R2012)using industry-standard encryption at the KaiserPermanente Center for Health Research. The re-search nodes upload the EHR-based CHC limiteddata sets to the secure website at the data coordi-nating center from their local data warehouses,which conform to a standardized SQL relationaldatabase schema.29 All CHARN studies, includingthis one, have received institutional review boardapproval.
MeasuresAll information was retrospectively collected fromthe CDW. Self-reported measures included agecalculated as of 2013, sex, race/ethnicity, and pri-mary language. Insurance status was determinedbased on documented coverage at each encounterand was coded according to whether patients hadbeen continuously insured across all encounters,had gaps in insurance coverage (ie, a lapse of insur-ance coverage of �30 days), or had been continu-ously uninsured. To assess health care use, we cal-culated the average annual number of visits. Weevaluated primary language and insurance status asour SDH factors.
To adjust our analyses for patients’ overall co-morbidity burden, we computed the Charlson in-dex score based on the ICD-9 codes documented inthe EHR during a 12-month period (between 10months before and 2 months after the index date).The Charlson index was designed to estimate thelong-term prognosis and lethality of comorbid pa-tients and is based on a point-scoring system (from0 to 40) for the presence of specific associateddiseases. Points are accumulated according to theassociated diseases and a single point for each 10years of age for patients older than 40 (in 50 years,1 point; 60 years, 2 points; etc.). The distinguishingfeature and undisputed advantage of the Charlsonindex is its ability to evaluate a patient’s age anddetermine his or her mortality rate, which in theabsence of comorbidity (0 points) is 12%, at 1 or 2points is 26%, at 3 or 4 points is 52%, and at �5points is 85%. In 1992 Deyo et al30 added to thisindex chronic forms of ischemic cardiac disorderand the stages of chronic cardiac insufficiency.
Diabetic patients were categorized usingICD-9 codes as: without a diagnosis of CVD ordepression (DM-only); with only a diagnosisof CVD (DM � CVD); with only a diagnosis ofdepression (DM � DEP); or with diagnoses of
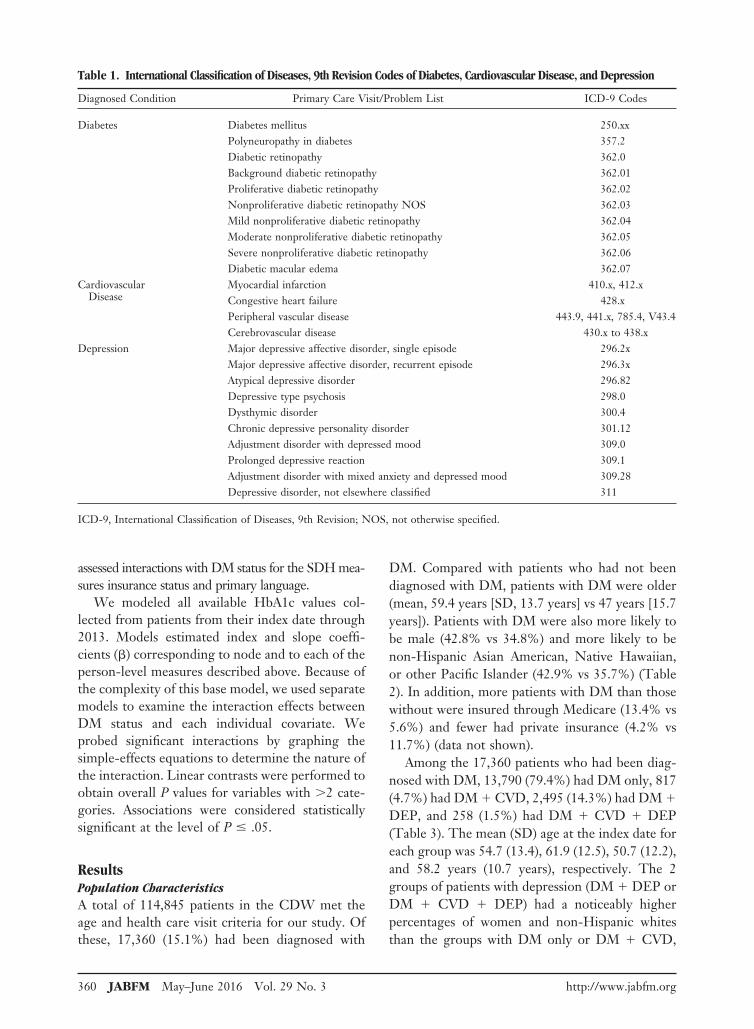
both CVD and depression (DM � CVD �DEP). CVD or depression diagnosed within 60days of the DM index date was considered acomorbidity. The outcome measure in this studywas change in HbA1c level over time. ICD-9codes used to define these conditions are listed inTable 1.
After careful discussion, we chose the above-mentioned variables to describe the patients’ basicdemographics, SDHs, and disease status withouthaving to include so many variables that the modelswould not have enough power. We consideredother variables such as homeless status and federalpoverty level, but because of the incompleteness ofthe data in CDW version 2.2, we were not able toinclude them in the study.
Data AnalysisPopulation characteristics are described using meansand standard deviations (SDs), percentages, and counts.Significance tests for differences in patient characteris-tics between disease groups were not performed becausewe did not have hypotheses of interest related to thesecomparisons. Observed differences are described for se-lected characteristics to orient the reader to the popula-tion studied. The hypothesis was tested using 3-levelhierarchical linear models in a growth curve frame-work31–33 to account for correlated observations of re-peated measures within patients and for patients withinCHCs. The first level of the model included time (yearsfrom index diagnosis) as a predictor, thus modeling thewithin-person variation. The second level includeddummy variables for the DM groupings (referent: DM-only group) and for the other categorical (also dummycoded) and continuous person-level predictors for boththe intercept and slope for time random effects. Person-level predictors included age, Charlson index score, sex,race/ethnicity, insurance status, primary language, andaverage number of annual primary care visits. The thirdlevel of the model was the CHC level and included node(dummy coded) as a predictor of the level-2 interceptand slope random effects. The interpretation of a signif-icant coefficient for a given nonreferent group (ie, DM� CVD, DM � DEP, or DM � CVD � DEP) on theintercept indicates that the nonreferent group differsfrom the referent group (DM only) on HbA1c level atthe time of the DM diagnosis, whereas a significantcoefficient for the slope of time indicates that there aredifferent trajectories across time. These interpretationsassume that all other variables are held constant. We
doi: 10.3122/jabfm.2016.03.150226 Patients with Diabetes Served by Safety-Net Centers 359
assessed interactions with DM status for the SDH mea-sures insurance status and primary language.
We modeled all available HbA1c values col-lected from patients from their index date through2013. Models estimated index and slope coeffi-cients (�) corresponding to node and to each of theperson-level measures described above. Because ofthe complexity of this base model, we used separatemodels to examine the interaction effects betweenDM status and each individual covariate. Weprobed significant interactions by graphing thesimple-effects equations to determine the nature ofthe interaction. Linear contrasts were performed toobtain overall P values for variables with �2 cate-gories. Associations were considered statisticallysignificant at the level of P � .05.
ResultsPopulation CharacteristicsA total of 114,845 patients in the CDW met theage and health care visit criteria for our study. Ofthese, 17,360 (15.1%) had been diagnosed with
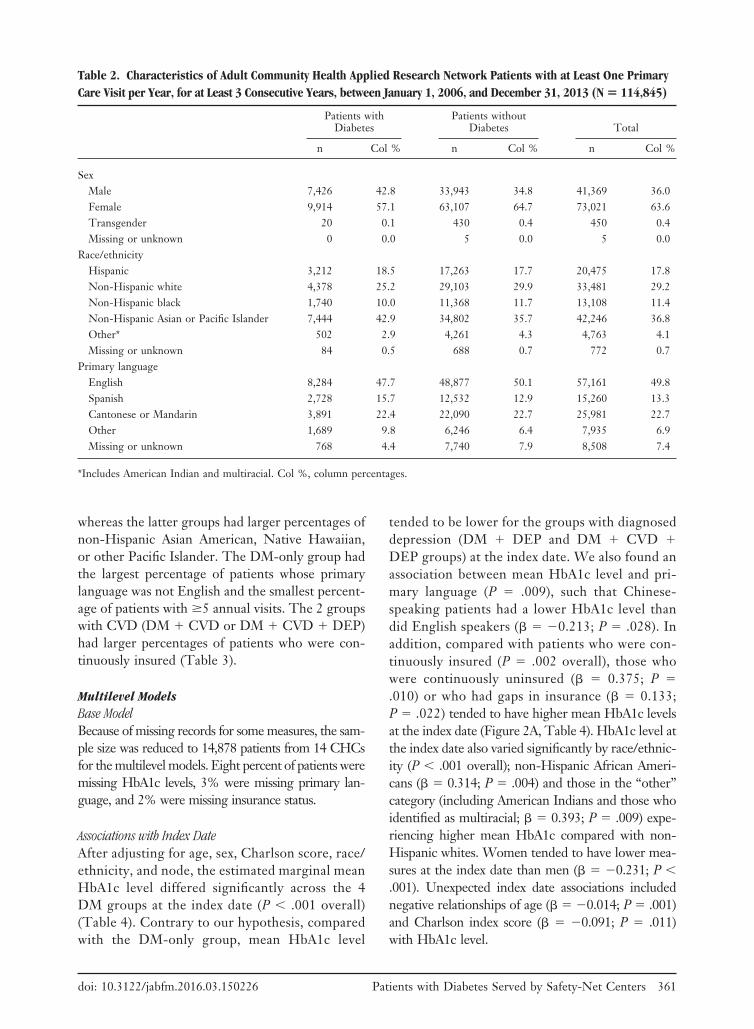
DM. Compared with patients who had not beendiagnosed with DM, patients with DM were older(mean, 59.4 years [SD, 13.7 years] vs 47 years [15.7years]). Patients with DM were also more likely tobe male (42.8% vs 34.8%) and more likely to benon-Hispanic Asian American, Native Hawaiian,or other Pacific Islander (42.9% vs 35.7%) (Table2). In addition, more patients with DM than thosewithout were insured through Medicare (13.4% vs5.6%) and fewer had private insurance (4.2% vs11.7%) (data not shown).
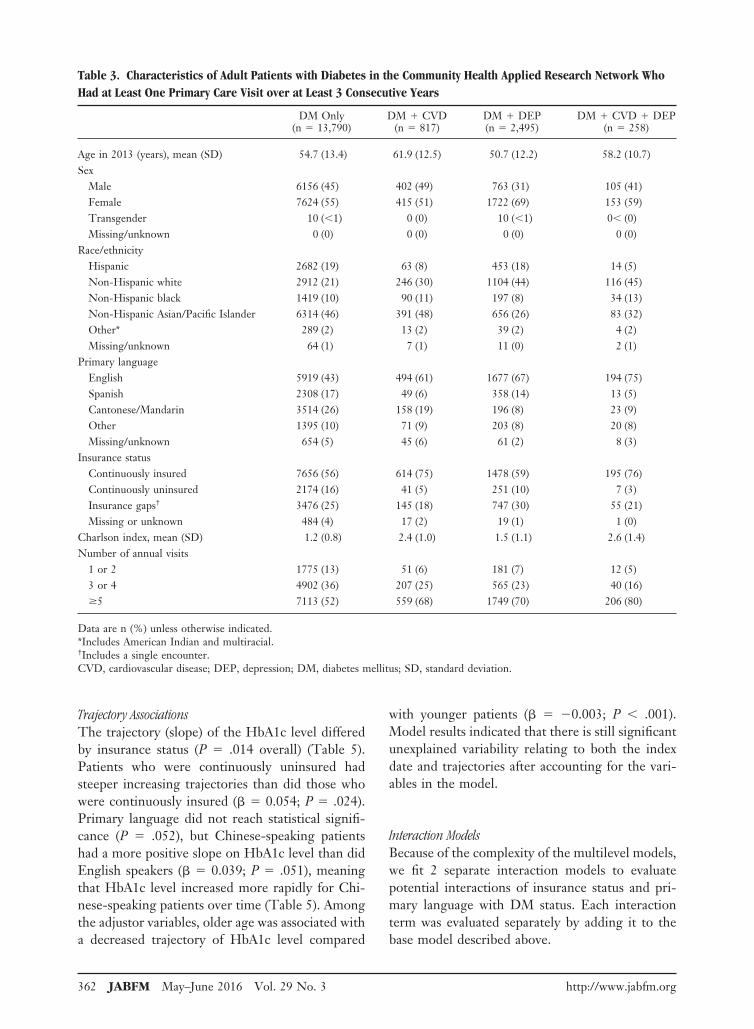
Among the 17,360 patients who had been diag-nosed with DM, 13,790 (79.4%) had DM only, 817(4.7%) had DM � CVD, 2,495 (14.3%) had DM �
DEP, and 258 (1.5%) had DM � CVD � DEP(Table 3). The mean (SD) age at the index date foreach group was 54.7 (13.4), 61.9 (12.5), 50.7 (12.2),and 58.2 years (10.7 years), respectively. The 2groups of patients with depression (DM � DEP orDM � CVD � DEP) had a noticeably higherpercentages of women and non-Hispanic whitesthan the groups with DM only or DM � CVD,
Table 1. International Classification of Diseases, 9th Revision Codes of Diabetes, Cardiovascular Disease, and Depression
Diagnosed Condition Primary Care Visit/Problem List ICD-9 Codes
Diabetes Diabetes mellitus 250.xxPolyneuropathy in diabetes 357.2Diabetic retinopathy 362.0Background diabetic retinopathy 362.01Proliferative diabetic retinopathy 362.02Nonproliferative diabetic retinopathy NOS 362.03Mild nonproliferative diabetic retinopathy 362.04Moderate nonproliferative diabetic retinopathy 362.05Severe nonproliferative diabetic retinopathy 362.06Diabetic macular edema 362.07
CardiovascularDisease
Myocardial infarction 410.x, 412.xCongestive heart failure 428.xPeripheral vascular disease 443.9, 441.x, 785.4, V43.4Cerebrovascular disease 430.x to 438.x
Depression Major depressive affective disorder, single episode 296.2xMajor depressive affective disorder, recurrent episode 296.3xAtypical depressive disorder 296.82Depressive type psychosis 298.0Dysthymic disorder 300.4Chronic depressive personality disorder 301.12Adjustment disorder with depressed mood 309.0Prolonged depressive reaction 309.1Adjustment disorder with mixed anxiety and depressed mood 309.28Depressive disorder, not elsewhere classified 311
ICD-9, International Classification of Diseases, 9th Revision; NOS, not otherwise specified.
360 JABFM May–June 2016 Vol. 29 No. 3 http://www.jabfm.org
whereas the latter groups had larger percentages ofnon-Hispanic Asian American, Native Hawaiian,or other Pacific Islander. The DM-only group hadthe largest percentage of patients whose primarylanguage was not English and the smallest percent-age of patients with �5 annual visits. The 2 groupswith CVD (DM � CVD or DM � CVD � DEP)had larger percentages of patients who were con-tinuously insured (Table 3).
Multilevel ModelsBase ModelBecause of missing records for some measures, the sam-ple size was reduced to 14,878 patients from 14 CHCsfor the multilevel models. Eight percent of patients weremissing HbA1c levels, 3% were missing primary lan-guage, and 2% were missing insurance status.
Associations with Index DateAfter adjusting for age, sex, Charlson score, race/ethnicity, and node, the estimated marginal meanHbA1c level differed significantly across the 4DM groups at the index date (P � .001 overall)(Table 4). Contrary to our hypothesis, comparedwith the DM-only group, mean HbA1c level
tended to be lower for the groups with diagnoseddepression (DM � DEP and DM � CVD �DEP groups) at the index date. We also found anassociation between mean HbA1c level and pri-mary language (P .009), such that Chinese-speaking patients had a lower HbA1c level thandid English speakers (� 0.213; P .028). Inaddition, compared with patients who were con-tinuously insured (P .002 overall), those whowere continuously uninsured (� 0.375; P .010) or who had gaps in insurance (� 0.133;P .022) tended to have higher mean HbA1c levelsat the index date (Figure 2A, Table 4). HbA1c level atthe index date also varied significantly by race/ethnic-ity (P � .001 overall); non-Hispanic African Ameri-cans (� 0.314; P .004) and those in the “other”category (including American Indians and those whoidentified as multiracial; � 0.393; P .009) expe-riencing higher mean HbA1c compared with non-Hispanic whites. Women tended to have lower mea-sures at the index date than men (� 0.231; P �.001). Unexpected index date associations includednegative relationships of age (� 0.014; P .001)and Charlson index score (� 0.091; P .011)with HbA1c level.
Table 2. Characteristics of Adult Community Health Applied Research Network Patients with at Least One PrimaryCare Visit per Year, for at Least 3 Consecutive Years, between January 1, 2006, and December 31, 2013 (N � 114,845)
Patients withDiabetes
Patients withoutDiabetes Total
n Col % n Col % n Col %
SexMale 7,426 42.8 33,943 34.8 41,369 36.0Female 9,914 57.1 63,107 64.7 73,021 63.6Transgender 20 0.1 430 0.4 450 0.4Missing or unknown 0 0.0 5 0.0 5 0.0
Race/ethnicityHispanic 3,212 18.5 17,263 17.7 20,475 17.8Non-Hispanic white 4,378 25.2 29,103 29.9 33,481 29.2Non-Hispanic black 1,740 10.0 11,368 11.7 13,108 11.4Non-Hispanic Asian or Pacific Islander 7,444 42.9 34,802 35.7 42,246 36.8Other* 502 2.9 4,261 4.3 4,763 4.1Missing or unknown 84 0.5 688 0.7 772 0.7
Primary languageEnglish 8,284 47.7 48,877 50.1 57,161 49.8Spanish 2,728 15.7 12,532 12.9 15,260 13.3Cantonese or Mandarin 3,891 22.4 22,090 22.7 25,981 22.7Other 1,689 9.8 6,246 6.4 7,935 6.9Missing or unknown 768 4.4 7,740 7.9 8,508 7.4
*Includes American Indian and multiracial. Col %, column percentages.
doi: 10.3122/jabfm.2016.03.150226 Patients with Diabetes Served by Safety-Net Centers 361
Trajectory AssociationsThe trajectory (slope) of the HbA1c level differedby insurance status (P .014 overall) (Table 5).Patients who were continuously uninsured hadsteeper increasing trajectories than did those whowere continuously insured (� 0.054; P .024).Primary language did not reach statistical signifi-cance (P .052), but Chinese-speaking patientshad a more positive slope on HbA1c level than didEnglish speakers (� 0.039; P .051), meaningthat HbA1c level increased more rapidly for Chi-nese-speaking patients over time (Table 5). Amongthe adjustor variables, older age was associated witha decreased trajectory of HbA1c level compared
with younger patients (� 0.003; P � .001).Model results indicated that there is still significantunexplained variability relating to both the indexdate and trajectories after accounting for the vari-ables in the model.
Interaction ModelsBecause of the complexity of the multilevel models,we fit 2 separate interaction models to evaluatepotential interactions of insurance status and pri-mary language with DM status. Each interactionterm was evaluated separately by adding it to thebase model described above.
Table 3. Characteristics of Adult Patients with Diabetes in the Community Health Applied Research Network WhoHad at Least One Primary Care Visit over at Least 3 Consecutive Years
DM Only(n 13,790)
DM � CVD(n 817)
DM � DEP(n 2,495)
DM � CVD � DEP(n 258)
Age in 2013 (years), mean (SD) 54.7 (13.4) 61.9 (12.5) 50.7 (12.2) 58.2 (10.7)Sex
Male 6156 (45) 402 (49) 763 (31) 105 (41)Female 7624 (55) 415 (51) 1722 (69) 153 (59)Transgender 10 (�1) 0 (0) 10 (�1) 0� (0)Missing/unknown 0 (0) 0 (0) 0 (0) 0 (0)
Race/ethnicityHispanic 2682 (19) 63 (8) 453 (18) 14 (5)Non-Hispanic white 2912 (21) 246 (30) 1104 (44) 116 (45)Non-Hispanic black 1419 (10) 90 (11) 197 (8) 34 (13)Non-Hispanic Asian/Pacific Islander 6314 (46) 391 (48) 656 (26) 83 (32)Other* 289 (2) 13 (2) 39 (2) 4 (2)Missing/unknown 64 (1) 7 (1) 11 (0) 2 (1)
Primary languageEnglish 5919 (43) 494 (61) 1677 (67) 194 (75)Spanish 2308 (17) 49 (6) 358 (14) 13 (5)Cantonese/Mandarin 3514 (26) 158 (19) 196 (8) 23 (9)Other 1395 (10) 71 (9) 203 (8) 20 (8)Missing/unknown 654 (5) 45 (6) 61 (2) 8 (3)
Insurance statusContinuously insured 7656 (56) 614 (75) 1478 (59) 195 (76)Continuously uninsured 2174 (16) 41 (5) 251 (10) 7 (3)Insurance gaps† 3476 (25) 145 (18) 747 (30) 55 (21)Missing or unknown 484 (4) 17 (2) 19 (1) 1 (0)
Charlson index, mean (SD) 1.2 (0.8) 2.4 (1.0) 1.5 (1.1) 2.6 (1.4)Number of annual visits
1 or 2 1775 (13) 51 (6) 181 (7) 12 (5)3 or 4 4902 (36) 207 (25) 565 (23) 40 (16)�5 7113 (52) 559 (68) 1749 (70) 206 (80)
Data are n (%) unless otherwise indicated.*Includes American Indian and multiracial.†Includes a single encounter.CVD, cardiovascular disease; DEP, depression; DM, diabetes mellitus; SD, standard deviation.
362 JABFM May–June 2016 Vol. 29 No. 3 http://www.jabfm.org
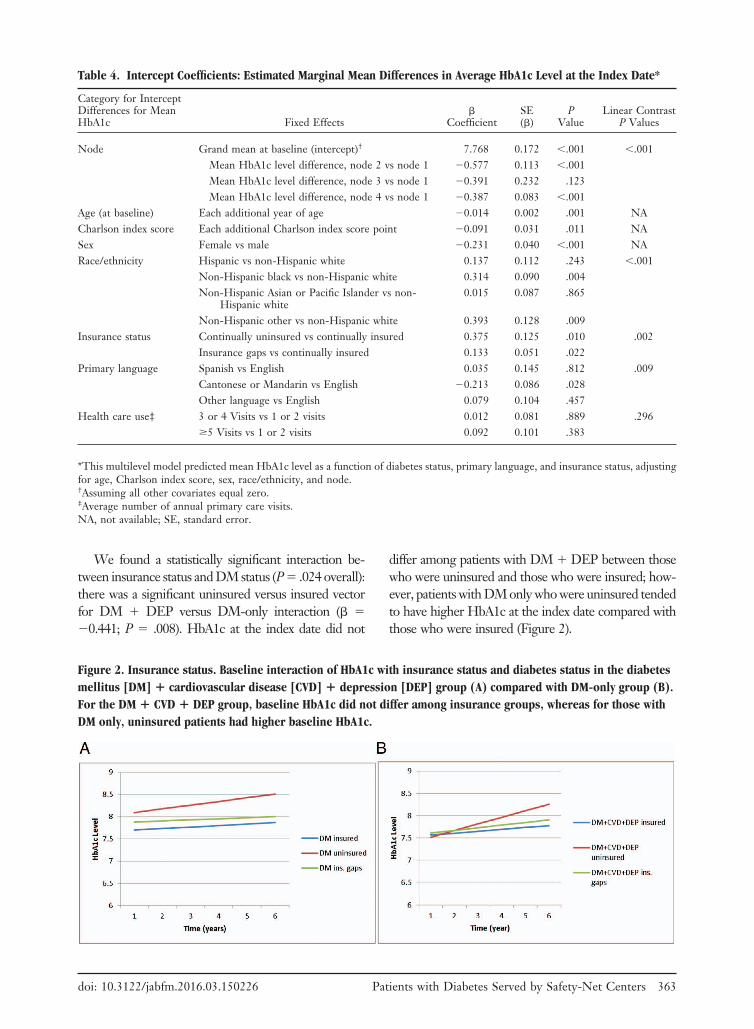
We found a statistically significant interaction be-tween insurance status and DM status (P .024 overall):there was a significant uninsured versus insured vectorfor DM � DEP versus DM-only interaction (� 0.441; P .008). HbA1c at the index date did not
differ among patients with DM � DEP between thosewho were uninsured and those who were insured; how-ever, patients with DM only who were uninsured tendedto have higher HbA1c at the index date compared withthose who were insured (Figure 2).
Table 4. Intercept Coefficients: Estimated Marginal Mean Differences in Average HbA1c Level at the Index Date*
Category for InterceptDifferences for MeanHbA1c Fixed Effects
�Coefficient
SE(�)
PValue
Linear ContrastP Values
Node Grand mean at baseline (intercept)† 7.768 0.172 �.001 �.001Mean HbA1c level difference, node 2 vs node 1 0.577 0.113 �.001Mean HbA1c level difference, node 3 vs node 1 0.391 0.232 .123Mean HbA1c level difference, node 4 vs node 1 0.387 0.083 �.001
Age (at baseline) Each additional year of age 0.014 0.002 .001 NACharlson index score Each additional Charlson index score point 0.091 0.031 .011 NASex Female vs male 0.231 0.040 �.001 NARace/ethnicity Hispanic vs non-Hispanic white 0.137 0.112 .243 �.001
Non-Hispanic black vs non-Hispanic white 0.314 0.090 .004Non-Hispanic Asian or Pacific Islander vs non-
Hispanic white0.015 0.087 .865
Non-Hispanic other vs non-Hispanic white 0.393 0.128 .009Insurance status Continually uninsured vs continually insured 0.375 0.125 .010 .002
Insurance gaps vs continually insured 0.133 0.051 .022Primary language Spanish vs English 0.035 0.145 .812 .009
Cantonese or Mandarin vs English 0.213 0.086 .028Other language vs English 0.079 0.104 .457
Health care use‡ 3 or 4 Visits vs 1 or 2 visits 0.012 0.081 .889 .296�5 Visits vs 1 or 2 visits 0.092 0.101 .383
*This multilevel model predicted mean HbA1c level as a function of diabetes status, primary language, and insurance status, adjustingfor age, Charlson index score, sex, race/ethnicity, and node.†Assuming all other covariates equal zero.‡Average number of annual primary care visits.NA, not available; SE, standard error.
Figure 2. Insurance status. Baseline interaction of HbA1c with insurance status and diabetes status in the diabetesmellitus [DM] � cardiovascular disease [CVD] � depression [DEP] group (A) compared with DM-only group (B).For the DM � CVD � DEP group, baseline HbA1c did not differ among insurance groups, whereas for those withDM only, uninsured patients had higher baseline HbA1c.
doi: 10.3122/jabfm.2016.03.150226 Patients with Diabetes Served by Safety-Net Centers 363
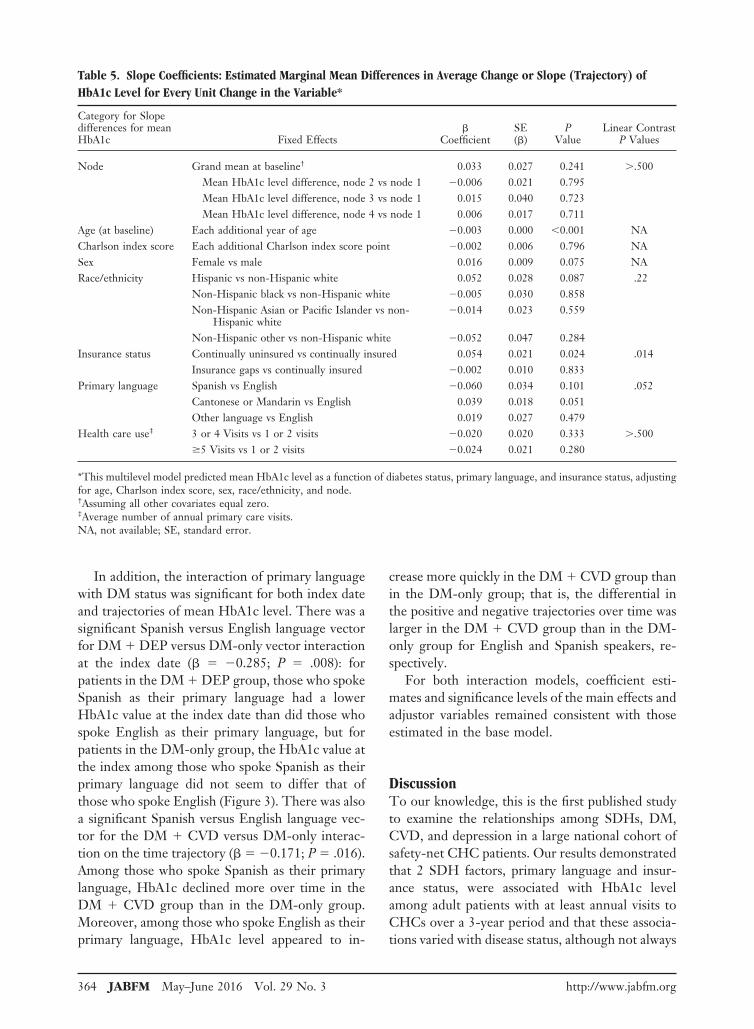
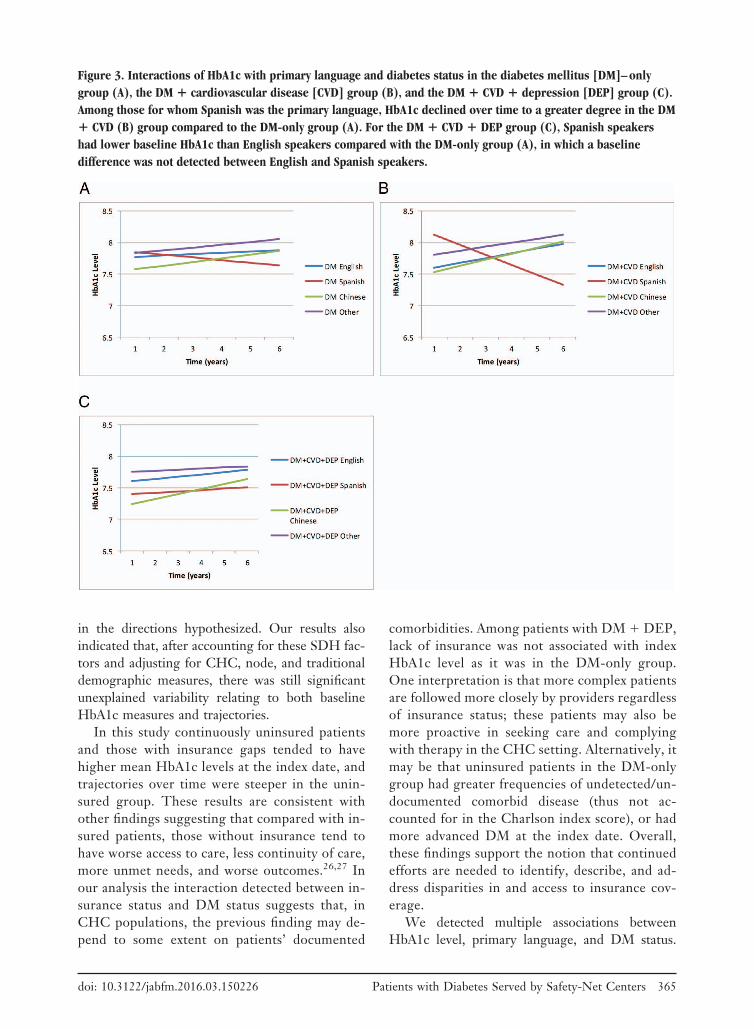
In addition, the interaction of primary languagewith DM status was significant for both index dateand trajectories of mean HbA1c level. There was asignificant Spanish versus English language vectorfor DM � DEP versus DM-only vector interactionat the index date (� 0.285; P .008): forpatients in the DM � DEP group, those who spokeSpanish as their primary language had a lowerHbA1c value at the index date than did those whospoke English as their primary language, but forpatients in the DM-only group, the HbA1c value atthe index among those who spoke Spanish as theirprimary language did not seem to differ that ofthose who spoke English (Figure 3). There was alsoa significant Spanish versus English language vec-tor for the DM � CVD versus DM-only interac-tion on the time trajectory (� 0.171; P .016).Among those who spoke Spanish as their primarylanguage, HbA1c declined more over time in theDM � CVD group than in the DM-only group.Moreover, among those who spoke English as theirprimary language, HbA1c level appeared to in-
crease more quickly in the DM � CVD group thanin the DM-only group; that is, the differential inthe positive and negative trajectories over time waslarger in the DM � CVD group than in the DM-only group for English and Spanish speakers, re-spectively.
For both interaction models, coefficient esti-mates and significance levels of the main effects andadjustor variables remained consistent with thoseestimated in the base model.
DiscussionTo our knowledge, this is the first published studyto examine the relationships among SDHs, DM,CVD, and depression in a large national cohort ofsafety-net CHC patients. Our results demonstratedthat 2 SDH factors, primary language and insur-ance status, were associated with HbA1c levelamong adult patients with at least annual visits toCHCs over a 3-year period and that these associa-tions varied with disease status, although not always
Table 5. Slope Coefficients: Estimated Marginal Mean Differences in Average Change or Slope (Trajectory) ofHbA1c Level for Every Unit Change in the Variable*
Category for Slopedifferences for meanHbA1c Fixed Effects
�Coefficient
SE(�)
PValue
Linear ContrastP Values
Node Grand mean at baseline† 0.033 0.027 0.241 �.500Mean HbA1c level difference, node 2 vs node 1 0.006 0.021 0.795Mean HbA1c level difference, node 3 vs node 1 0.015 0.040 0.723Mean HbA1c level difference, node 4 vs node 1 0.006 0.017 0.711
Age (at baseline) Each additional year of age 0.003 0.000 �0.001 NACharlson index score Each additional Charlson index score point 0.002 0.006 0.796 NASex Female vs male 0.016 0.009 0.075 NARace/ethnicity Hispanic vs non-Hispanic white 0.052 0.028 0.087 .22
Non-Hispanic black vs non-Hispanic white 0.005 0.030 0.858Non-Hispanic Asian or Pacific Islander vs non-
Hispanic white0.014 0.023 0.559
Non-Hispanic other vs non-Hispanic white 0.052 0.047 0.284Insurance status Continually uninsured vs continually insured 0.054 0.021 0.024 .014
Insurance gaps vs continually insured 0.002 0.010 0.833Primary language Spanish vs English 0.060 0.034 0.101 .052
Cantonese or Mandarin vs English 0.039 0.018 0.051Other language vs English 0.019 0.027 0.479
Health care use‡ 3 or 4 Visits vs 1 or 2 visits 0.020 0.020 0.333 �.500�5 Visits vs 1 or 2 visits 0.024 0.021 0.280
*This multilevel model predicted mean HbA1c level as a function of diabetes status, primary language, and insurance status, adjustingfor age, Charlson index score, sex, race/ethnicity, and node.†Assuming all other covariates equal zero.‡Average number of annual primary care visits.NA, not available; SE, standard error.
364 JABFM May–June 2016 Vol. 29 No. 3 http://www.jabfm.org
in the directions hypothesized. Our results alsoindicated that, after accounting for these SDH fac-tors and adjusting for CHC, node, and traditionaldemographic measures, there was still significantunexplained variability relating to both baselineHbA1c measures and trajectories.
In this study continuously uninsured patientsand those with insurance gaps tended to havehigher mean HbA1c levels at the index date, andtrajectories over time were steeper in the unin-sured group. These results are consistent withother findings suggesting that compared with in-sured patients, those without insurance tend tohave worse access to care, less continuity of care,more unmet needs, and worse outcomes.26,27 Inour analysis the interaction detected between in-surance status and DM status suggests that, inCHC populations, the previous finding may de-pend to some extent on patients’ documented
comorbidities. Among patients with DM � DEP,lack of insurance was not associated with indexHbA1c level as it was in the DM-only group.One interpretation is that more complex patientsare followed more closely by providers regardlessof insurance status; these patients may also bemore proactive in seeking care and complyingwith therapy in the CHC setting. Alternatively, itmay be that uninsured patients in the DM-onlygroup had greater frequencies of undetected/un-documented comorbid disease (thus not ac-counted for in the Charlson index score), or hadmore advanced DM at the index date. Overall,these findings support the notion that continuedefforts are needed to identify, describe, and ad-dress disparities in and access to insurance cov-erage.
We detected multiple associations betweenHbA1c level, primary language, and DM status.
Figure 3. Interactions of HbA1c with primary language and diabetes status in the diabetes mellitus [DM]–onlygroup (A), the DM � cardiovascular disease [CVD] group (B), and the DM � CVD � depression [DEP] group (C).Among those for whom Spanish was the primary language, HbA1c declined over time to a greater degree in the DM� CVD (B) group compared to the DM-only group (A). For the DM � CVD � DEP group (C), Spanish speakershad lower baseline HbA1c than English speakers compared with the DM-only group (A), in which a baselinedifference was not detected between English and Spanish speakers.
doi: 10.3122/jabfm.2016.03.150226 Patients with Diabetes Served by Safety-Net Centers 365
This is consistent with previous studies that pri-mary language is associated with receipt of recom-mended health care34,35 and that language barrierscontribute to health disparities in patients withDM.36 Our findings may also reflect the influencesof cultural, genetic, or socioeconomic factorsand/or health care access (or lack thereof). Forexample, among Chinese speakers, we saw a lowerindex HbA1c value and a steeper (positive) trajec-tory over time. Previous studies indicate that AsianAmericans are at higher risk for DM than theirwhite counterparts.37,38 Our results may suggestthat the trajectory of the disease could potentiallybe more aggressive in this population, which maywarrant more diligent monitoring. Such monitor-ing could include assessment of medications adher-ence or cultural perceptions/acceptance regardingavailable therapies.39 Protective associations notedfor speakers with limited English proficiency com-pared with English speakers in the more complexdisease groups compared with the DM-only group(ie, HbA1c at the index date in the DM � DEPgroup and trajectory differential for the DM �CVD group) may reflect more intensive monitor-ing or increased access to and effectiveness of cul-turally appropriate enabling services.
We also found some unexpected associations:both groups with depression diagnoses (DM �DEP and DM � CDV � DEP) had a lower HbA1cat the index date compared with the DM-onlygroup; older age was associated with a lowerHbA1c at the index date and a declining trajectoryover time; and lower Charlson index scores wereassociated with steeper increasing trajectories, con-tradicting earlier studies that higher HbA1c is as-sociated with depression,40,41 older age,42 and morecomorbidities.43 Similar findings have been ob-served previously in CHC settings,44 however, andare consistent with CHC missions of enhancedmonitoring and/or health care access for safety-netpatients with high comorbidity burdens. CHCs pri-oritize patients with greater disease complexityand/or more social needs and provide enhancededucation and enabling services, as well as out-reach, in an effort to ensure that these patientsreceive appropriate care and take the necessarysteps to manage their condition. For example,CHCs that are recognized as patient-centeredmedical homes are required to identify a chroniccondition for targeted improvement. A CHC pa-tient-centered medical home focusing on DM care
coordination may refer patients with HbA1c �8%to care coordination services, which may result inimproved health outcomes compared with patientsnot receiving services.45 In addition, more complexpatients may have more visits,46 providing moreopportunities for HbA1c monitoring and interven-tion, or providers may view controlling HbA1c as amore urgent priority in patients with multiple co-morbidities. Services and treatments received forthe comorbidities could also have contributed tothe stability of and adherence to DM treatment,even when the use of DM-related services wascomparable.47 In addition, patients in the morecomplex DM groups, because of their disease sta-tus, could have been receiving more social supportfrom their family, friends, and community, whichcontributes to better monitoring of their condi-tions. Another possibility is that, relative to othergroups, the DM-only group may have been earlierin the identification/trajectory of disease and there-fore less likely to have established stable treatmentand monitoring patterns and/or tended to haveadditional undetected or undocumented healthconditions.
LimitationsOur results should be interpreted with caution be-cause of the observational nature of the study andthe variability in EHR documentation/coding prac-tices across multiple systems. In addition, our re-sults relate only to patients who had �1 visits for atleast 3 consecutive years in a CHC ambulatorysetting. Our results may not apply to patients whodo not meet these criteria or who may be morevulnerable to poor health-related outcomes be-cause of more social, clinical, economical, and lo-gistic barriers than the patients studied. In addition,there are likely unmeasured covariates or con-founders (including other SDHs) that may influ-ence HbA1c. For example, we were unable to ac-count for potentially important SDHs such ashealth literacy, housing status, and domestic vio-lence. These unmeasured SDHs could have con-tributed to some of the unexplained variance in themodels. The relationships between the unmeasuredSDHs and the SDH variables in this study (insur-ance status and primary language) may also influ-ence a patient’s disease status. In addition, our useof the Charlson index score to adjust for comor-bidity burden does not account for conditions thatare not predictive of mortality but do affect, for
366 JABFM May–June 2016 Vol. 29 No. 3 http://www.jabfm.org
example, quality of life or physical functioning.Finally, there were relatively small numbers of pa-tients in certain groups (eg, DM � CVD, DM �CVD � DEP); our results should be confirmed inlarger populations. Nevertheless, our study, con-ducted in a large safety-net population across 17CHCs, demonstrates the need to better understandthe interplay between SDHs, comorbidity burden,and health outcomes in vulnerable patients.
Recommendations and Future PlansImproving population health requires collectingand examining data in a more holistic and system-atic way that reflects ecosystems of patients’ health-related risk factors. Understanding the relationshipbetween SDHs and health outcomes is vital toimproving outcomes for vulnerable populationsfacing health inequities. Reimbursement for Med-icaid populations is transitioning to global paymentmodels, and there is increasing pressure on CHChealth care practitioners to document needs forenabling services. Evaluating the way SDHs affecthealth outcomes is critical to appropriately allocateprimary care resources to patients who are most atrisk and to ensure that resources are allocated toservices that are most likely to affect outcomes.Standardized documentation of SDHs and servicesin the EHR,29 including enabling services,48,49
is especially important to carry out such evaluationsto assess the intermediary role of enabling servicesin treating complex patients. The data on SDHscan also help in the development of new risk pre-diction methods that assess the contribution ofSDHs to and their impact on health outcomes forall vulnerable populations at CHCs, including botholder patients with comorbidities and younger pa-tients with a single disease. By understanding theimpact of SDHs on outcomes, CHCs, health plans,and other health care stakeholders can be betterinformed about SDHs that should be collected andincluded in predicting outcomes for all patientswith any disease trajectory. In addition, using cul-turally and linguistically appropriate services forpatients with limited English proficiency, which areoften provided by multilingual and multiculturalcommunity health workers at CHCs, can be effec-tive in understanding and addressing patient SDHs,especially for potentially sensitive questions (re-garding, for example, incarceration and homelessstatus).
The goals set by HealthyPeople 2020 includeeliminating health disparities and explicitly supportimproving the social and physical environments ofpopulations.50 Collecting data on SDHs and ac-counting for these factors in analyses will contrib-ute to reaching these goals. Until recently, how-ever, SDHs have not been linked to clinicalpractice, and SDH data have not been routinely orsystematically collected in the medical setting. Rec-ognizing this gap, the Institute of Medicine of theNational Academies of Science highlighted theneed to integrate SDHs into EHRs to allow for amore holistic and integrated approach to care forall patients51 and to facilitate more rigorous re-search on the causes and consequences of healthdisparities and the development of interventionsand policies to reduce those disparities. Future ef-forts should prioritize the integration of standard-ized SDHs into EHR systems. To meet this need,the National Association of Community HealthCenters, AAPCHO, Oregon Primary Care Associ-ation, and the Institute of Alternative Futures havedeveloped a standardized, national SDH data col-lection tool that was piloted across CHCs andhealth center networks, including those participat-ing in CHARN. CHARN is also seeking to expandits data warehouse with additional SDHs so thatfuture analyses will be able to account for the roleof SDHs and their relationship to outcomes.
ConclusionInsurance status and primary language are 2 SDHsthat are associated with both index levels and tra-jectories of HbA1c in patients with DM who arereceiving health care from a CHC on a relativelyregular basis. In CHC settings these associationsmay vary depending on the complexity of diseaseburden. This study demonstrates the potentialpower of large, EHR-based data sets to identifypatient groups at higher risk for adverse outcomes.Routine EHR documentation and standardizationof SDHs, as well as enabling other ancillary ser-vices, will provide a more comprehensive under-standing of the complex relationships betweenthese measures and disease outcomes.
The authors gratefully acknowledge the following CHARNhealth centers and research nodes included in the study.
Association of Asian Pacific Community Health Organiza-tions (AAPCHO), San Leandro, CA: Rosy Chang Weir, PhD,
doi: 10.3122/jabfm.2016.03.150226 Patients with Diabetes Served by Safety-Net Centers 367
Vivian Li, MS, Gayathri Rajan, MA, and Morgan Ye; AsianHealth Services, Oakland, CA: Thu Quach, PhD, MPH, MasaTsutsumi, and Simin Kiani; Charles B. Wang CommunityHealth Center, New York, NY: Shao-Chee Sim, PhD, Jenni-fer D. Lau, Ady Oster, MD, Kai Yeung, and Chihang (Ray) Yu;Waianae Coast Comprehensive Health Center, Waianae,HI: Rachelle Enos, MPH, Vija Sehgal, MD, PhD, MPH, JohnWilliams, BBA, May Okihiro, MD, MS; Waima�nalo HealthCenter, Waima�nalo, HI: Mary Frances Oneha, APRN, PhD;University of California, Los Angeles (academic affiliate):Ninez Ponce, MPP, PhD, Marjorie Kagawa-Singer, PhD, MA,MN, RN, and Ying-Ying Meng, DrPH.
Alliance of Chicago Community Health Services, Chicago,IL: Fred Rachman, MD, Andrew Hamilton, RN, MS, SarahRittner, MA, Jessica Park, MPH, CHES, Elizabeth Adetoro,MPH, Anil Chitreddy, and Amro Hassan; Erie Family HealthCenter, Inc., Chicago, IL: David Buchanan, MD, MS, andSara Naureckas, MD; Heartland Health Outreach, Chicago,IL: Elizabeth Salisbury Afshar, MD, MPH, and Caroline Thur-low, MD; Howard Brown Health Center, Chicago, IL:Magda Houlberg, MD, Kristin Keglovitz Baker, MS, and JohnStryker, NP; Near North Community Health Center, Chi-cago, IL: Timothy Long, MD; North Country HealthCare,Flagstaff, AZ: Anne Newland, MD; PCC Community Well-ness, Chicago, IL: Marge Altergott, PhD; Northwestern Uni-versity, Chicago, IL (academic affiliate): Stephen Per sell, MD,MPH, Melissa Simon, MD, MPH, and Brian Hitsman, PhD.
Fenway Health, Boston, MA: Ken Mayer, MD, Chris Grasso,MPH, and Lydia Dant, MPH; Chase Brexton Health Care,Baltimore, MD: Sebastian Ruhs, MD, Amina Chaudhry, MD,MPH, and Mensah Amuzu; Beaufort-Jasper-Hampton Com-prehensive Health Services, Ridgeland, SC: Monica Godfrey,MPH, and Jeff Ratzel; University of Washington, Seattle(academic affiliate): Heidi Crane, MD, MPH, Bill Lober, MD,MS, Justin McReynolds, and Dana King, ALM.
OCHIN, Inc., Portland, OR: Christine Nelson, PhD, RN, JonPuro, MPA-HA, Melissa Laurie, MPH, and Jennifer DeVoe,MD, DPhil; Open Door Community Health Centers, Ar-cata, CA: Joseph Carroll, MD, PhD; Virginia Garcia Memo-rial Health Centers, Hillsboro, OR: Ann Turner, MD, andChristian Hill, MD, MPH; Multnomah County Health De-partment, Portland, OR: Paul Denouden, MD; OregonHealth & Science University, Portland (academic affiliate):Erika Cottrell, PhD, MPP, Steffani Bailey, PhD, Robert Schuff,MS, and John Saultz, MD; Richmond Family MedicineClinic, Portland, OR: John Muench, MD, MPH.
Data coordinating center, Kaiser Permanente, Center forHealth Research, Portland, OR: Mary Ann McBurnie, PhD,Steve Fortmann, MD, Michael Leo, PhD, Reesa Laws, BS, PhilCrawford, MS, Suzanne Gillespie, MS, Celeste Machen, KellyKirk, MS, Meredith Vandermeer, MPH, and Chalinya Ingpha-korn.
References1. Commission on Social Determinants of Health.
Closing the gap in a generation: health equitythrough action on the social determinants of health.
CSDH final report. Geneva: World Health Organi-zation; 2008. Available from: http://www.who.int/social_determinants/thecommission/finalreport/en/.Accessed March 28, 2016.
2. Marmot M, Bell R. Fair society, healthy lives. PublicHealth. 2012;126(Suppl 1):S4–10.
3. Braveman P, Egerter S, Williams DR. The socialdeterminants of health: coming of age. Annu RevPublic Health 2011;32:381–98.
4. Adler NE, Stewart J, eds. The biology of disadvan-tage: socioeconomic status and health. New York:John Wiley & Sons; 2010.
5. Braveman P, Gottlieb L. The social determinants ofhealth: it’s time to consider the causes of the causes.Public Health Rep 2014;129(Suppl 2):19–31.
6. Braveman PA, Egerter SA, Woolf SH, Marks JS.when do we know enough to recommend action onthe social determinants of health? Am J Prev Med2011;40(1 Suppl 1):S58–66.
7. McGinnis JM, Foege WH. Actual causes of death inthe United States. JAMA 1993;270:2207–12.
8. Marmot M, Wilkinson R, eds. Social determinantsof health. 2nd ed. Oxford: Oxford University Press;2006.
9. Hurt LS, Ronsmans C, Saha S. Effects of educationand other socioeconomic factors on middle age mor-tality in rural Bangladesh. J Epidemiol CommunityHealth 2004;58:315–20.
10. Crimmins EM, Saito Y. Trends in healthy life ex-pectancy in the United States, 1970–1990: gender,racial, and educational differences. Soc Sci Med2001;52:1629–41.
11. Farmer P. Infections and inequalities. Berkeley: Uni-versity of California Press; 1999.
12. Druss BG, Reisinger Walker E. Mental disordersand medical comorbidity. Research synthesis reportno. 21. Hoboken, NJ: The Robert Wood JohnsonFoundation; 2011. Available from: http://www.rwjf.org/content/dam/farm/legacy-parents/mental-disor-ders-and-medical-comorbidity. Accessed March 28,2016.
13. Lorant V, Deliege D, Eaton W, Robert A, PhilippotP, Ansseau M. Socioeconomic inequalities in depres-sion: a meta-analysis. Am J Epidemiol 2003;157:98–112.
14. Lett HS, Blumenthal JA, Babyak MA, Strauman TJ,Robins C, Sherwood A. Social support and coronaryheart disease: epidemiologic evidence and implicationsfor treatment. Psychosom Med 2005;67:869–78.
15. National Association of Community Health Centers(NACHC). America’s health centers. Bethesda, MD:NACHC; 2013. Available from: http://www.nachc.com/client/documents/USHealthCentersFS.pdf.Accessed April 15, 2016.
16. Shin P, Alvarez C, Sharac J, Rosenbaum S, VanVleet A, Paradise J, Garfield R. A profile of commu-nity health center patients: implications for policy.Menlo Park, CA: Henry J. Kaiser Family Founda-
368 JABFM May–June 2016 Vol. 29 No. 3 http://www.jabfm.org
tion; 2013. Available from: http://kff.org/medicaid/issue-brief/a-profile-of-community-health-center-patients-implications-for-policy/. Accessed March 28,2016.
17. Chang Weir R, Law H, Frances Oneha M, Lee SM,Chien AT. Impact of a P4P and HIT program toreduce emergency department hospital utilization atfederally qualified health centers in Hawai’i. AAPINexus Policy Pract Community 2014;12(1–2):83–96.
18. de Groot M, Anderson R, Freedland KE, ClouseRE, Lustman PJ. Association of depression and dia-betes complications: a meta-analysis. PsychosomMed 2001;63:619–30.
19. Park M, Katon WJ, Wolf FM. Depression and riskof mortality in individuals with diabetes: a meta-analysis and systematic review. Gen Hosp Psychiatry2013;35:217–25.
20. Sturm R. The effects of obesity, smoking, and drink-ing on medical problems and costs. Health Aff (Mil-wood) 2002;21:245–53.
21. Hansen MS, Fink P, Frydenberg M, Oxhøj ML. Useof health services, mental illness, and self-rated dis-ability and health in medical inpatients. PsychosomMed 2002;4:668–75.
22. Li V, Chang Weir R, Quach T, et al. Building acommunity health center data warehouse to pro-mote patient-centered research in the Asian Amer-ican, Native Hawaiian, and Pacific Islanders pop-ulation. AAPI Nexus Policy Pract Community2014;12(1–2):.
23. Green AR, Ngo-Metzger Q, Legedza ATR, Massa-gli MP, Phillips RS, Iezzoni LI. Interpreter services,language concordance, and health care quality: ex-periences of Asian Americans with limited Englishproficiency. J Gen Intern Med 2005;20:1050–6.
24. Gandhi TK, Burstin HR, Cook EF, et al. Drugcomplications in outpatients. J Gen Intern Med2000;15:149–54.
25. Jacobs EA, Shepard DS, Suaya JA, Stone EL. Over-coming language barriers in health care: costs andbenefits of interpreter services. Am J Public Health2004;94:866–9.
26. Agency for Healthcare Research and Quality. 2012National healthcare disparities report. Rockville,MD: Agency for Healthcare Research and Quality;2013.
27. Centers for Disease Control and Prevention. Vitalsigns: health insurance coverage and health care uti-lization—United States, 2006–2009 and January–March 2010. MMWR Morb Mortal Wkly Rep 2010;59:1448–54.
28. American Diabetes Association. Diagnosis and clas-sification of diabetes mellitus. Diabetes Care 2010;33(Suppl 1):S62–9.
29. Laws R, Gillespie S, Puro J, et al. The CommunityHealth Applied Research Network (CHARN) datawarehouse: a resource for patient-centered out-
comes research and quality improvement in under-served, safety net populations. EGEMS (WashDC) 2014;2:1097.
30. Deyo R, Cherkin DC, Ciol MA. Adapting a clinicalcomorbidity index for use with ICD-9-CM admin-istrative databases. J Clin Epidemiol. 1992;45:613–9.
31. Bryk AS, Raudenbush SW. Hierarchical linear mod-els: applications and data analysis methods. 2nd ed.Thousand Oaks, CA: Sage Publications; 2002.
32. Hox J. Multilevel analysis: techniques and applica-tions. 2nd ed. New York: Routledge; 2010.
33. Snijders T, Bosker R. Multilevel analysis: an intro-duction to basic and advanced multilevel modeling.Thousand Oaks, CA: Sage; 1999.
34. Cheng E, Chen A, Cunningham W. Primary lan-guage and receipt of recommended health careamong Hispanics in the United States. J Gen InternMed 2007;22(Suppl 2)283–8.
35. Clough J, Lee S, Chae DH. Barriers to health careamong Asian immigrants in the United States: atraditional review. J Health Care Poor Underserved2013;24: 384–403.
36. Fernandez A, Schillinger D, Warton M, et al. Lan-guage barriers, physician-patient language concor-dance, and glycemic control among insured Latinoswith diabetes: the Diabetes Study of Northern Cal-ifornia (DISTANCE). J Gen Intern Med 2011;26:170–6.
37. Lee JW, Brancati F, Yeh HC. Trends in the preva-lence of type 2 diabetes in Asians versus whites:results from the United States National Health In-terview Survey, 1997–2008. Diabetes Care 2011;34:353–7.
38. Maskarinec G, Jacobs S, Morimoto Y, Chock M,Grandinetti A, Kolonel LN. Disparity in diabetesrisk across native Hawaiians and different Asiangroups: the multiethnic cohort. Asia Pac J PublicHealth 2015;27:375–84.
39. Leung AY, Ai Bo A, Hsiao HY, Wang SS, Chi I.Health literacy issues in the care of Chinese Amer-ican immigrants with diabetes: a qualitative study.BMJ Open 2014;4:e005294.
40. Hassan K, Loar R, Anderson BJ, Heptulla RA. Therole of socioeconomic status, depression, quality oflife, and glycemic control in type 1 diabetes mellitus.J Pediatr 2006;149:526–31.
41. Lustman PJ, Clouse RE. Depression in diabetic pa-tients: the relationship between mood and glycemiccontrol. J Diabetes Complications 2005;19:113–22.
42. Kirkman MS, Briscoe VJ, Clark N, et al. Diabetes inolder adults. Diabetes Care 2012;35:2650–64.
43. Ahern MM, Hendryx M. Avoidable hospitalizationsfor diabetes: comorbidity risks. Dis Manag 2007;10:347–55.
44. Quach T, Gilmer TP, Hirota S, Ponce NA. Riskadjustment with social determinants of health andimplications for federally qualified health centers un-
doi: 10.3122/jabfm.2016.03.150226 Patients with Diabetes Served by Safety-Net Centers 369
der the Affordable Care Act. AAPI Nexus PolicyPractice Community 2014;12:73–82.
45. Chang Weir R, Emerson HP, Tseng W, Chin M,Caballero J. Utilization of enabling services by AsianAmerican, Native Hawaiian, and Pacific Islander pa-tients at community health centers. Am J PublicHealth 2010;100:2199–205.
46. Dixon LB, Kreyenbuhl JA, Dickerson FB, et al. Acomparison of type 2 diabetes outcomes among per-sons with and without severe mental illnesses. Psy-chiatr Serv 2004;55:892–900.
47. Struijs JN, Baan CA, Schellevis FG, Westert GP,AM van den Bos G. Comorbidity in Patients withDiabetes Mellitus: Impact on Medical Health CareUtilization. BMC Health Services Research. 2006;6:84 doi:10.1186/1472–6963-6–84.
48. Enabling services data collection implementationpacket. San Leandro, CA: Association of Asian Pa-cific Community Health Organizations; 2016. Avail-able from: http://www.aapcho.org/resources_db/
enabling-services-data-collection-implementation-packet/. Accessed March 28, 2016.
49. Chang Weir R, Proser M. Highlighting the role ofenabling services at community health centers: col-lecting data to support service expansion and en-hanced funding. San Leandro, CA: Association ofAsian Pacific Community Health Organizations;2010. Available from: http://www.aapcho.org/resources_db/highlighting-the-role-of-enabling-services-at-community-health-centers/. AccessedMarch 28, 2016.
50. Centers for Disease Control and Prevention (CDC).Leading health indicators development and frame-work. Available from: http://www.healthypeople.gov/2020/leading-health-indicators/Leading-Health-Indicators-Development-and-Framework. AccessedMarch 28, 2016.
51. Institute of Medicine. Capturing social and behav-ioral domains in electronic health records: phase 1.Washington, DC: National Academies Press; 2014.
370 JABFM May–June 2016 Vol. 29 No. 3 http://www.jabfm.org