Embed Size (px)
Citation preview
Volume-3,lssue-3, December 2011,ISSN No. 1998 - 7889 Eastern University Journal
Impact of Stock Market Development on Economic Growth: Evidence from SAARC Countries
Abstract
Muhammad Enamul Haque' Md_ Kaium Hossain ••
The benefit of stock market development for the economy an irreversible issue in modern economic theory. The paper empirically makes an al/empl to estimate (he impact of stock market development on economic growth in the SAARC region by the two dynamic panel models for the period of 1980 to 2008. The first model tries to assess the stock market effect directly after control/ing for other variables whereas the second one does it by having its influence through investment. The study finds that none of the dynamic model is effective to identify the stock market linkage to per capita growth rate in the SAARC region. This implies that stock market size, activity and liquidity do not have any influence on the real economic activity in the region. The results did not lead support to empirical studies of Levive(l991), Levine & Zervos (1996, 1998), Islam(1998) as well as other studies and theory that stock market has direct association with per capita growth rate. The main reasons identified that fund mobi/zed by stock market in the region is still in transitional period and it is very small relative to its economy.
Key Words: Economic growth, stock market development, turnover ratio, financial liberalization, dynamic panel model.
1.1 Background of the Study
The deepening and level of sophistication of modem financial markets is arguably a recent phenomenon. Since the 1980s the irreversible process of financial reforms, financial globalization, and the deregulation of the financial systems have been throwing up daunting challenges for developing countries. The very common ways of meeting these challenges are to overcome these apprehensions, to promote structural improvements to markets and to speedily move towards the development of regional stock markets.
The development of equity markets provides a more diversified set of channels (in channeling the limited resources from surplus units to deficit units) for financial intermediation to support growth, thus bolstering financial stability of economy. The most important measure taken in this regard by many Asian countries in general and South Asian (SAARC) countries in particular by the opening of their respective stock markets to international investors' liberalized their stock markets in the early 90s. It is noted that the growth in developing markets is evident from the fact that from 1985 to 1995, the period of stock market liberalization in many developing countries, and the market capitalization of all developing markets increased by 1,007 percent compared to an increase of 253 percer.t in the case of developed markets. As a resuit, the share of developing markets in the world market capitalization increased from 4 percent in 1985 to 11 percent in 1995. The trend of stock market growth continues more positively beyond 1995 for each of the market segment described above.
* Assistant Professor, Schoolo/Business & Economics, United International University, Dhanmoruli, Dhaka-1209 uSenior Lecturer, School of Business & Economics, United International University, Dhanmondi, Dhaka-1209
Corresponding author E-mail: [email protected]
Impact o/Stock Market Development on Economic Growth: EVidence/rom SAARC Countries
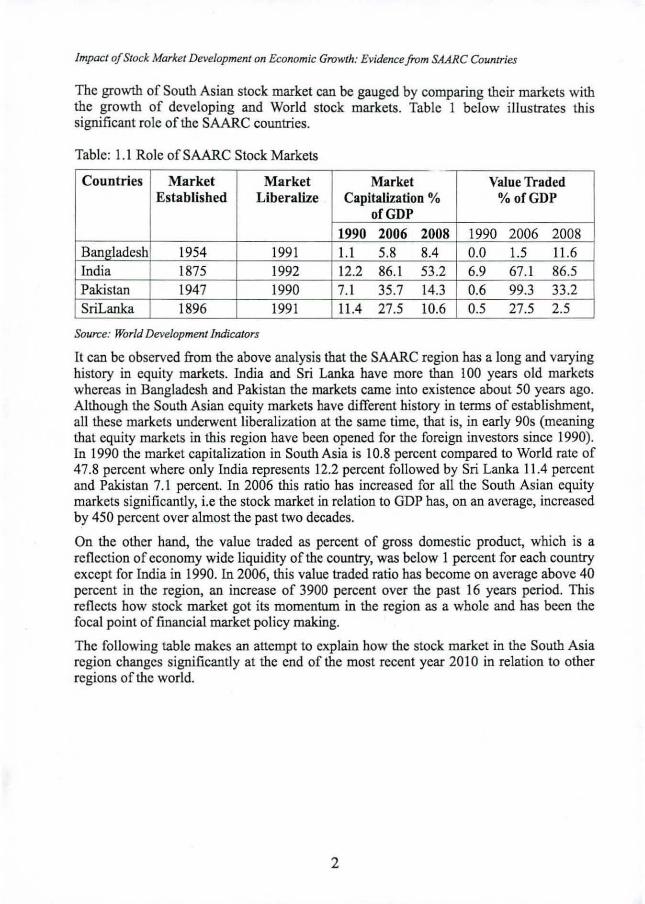
The growth of South Asian stock market can be gauged by comparing their markets with the growth of developiog and World stock markets. Table I below illustrates this significant role of the SAARC countries.
Table: 1.1 Role of SAARC Stock Markets
Countries Market Market Market Value Traded Established Liberalize Capitalization % % ofGDP
ofGDP 1990 2006 2008 1990 2006 2008
Bangladesh 1954 1991 l.l 5.8 8.4 0.0 1.5 11.6 India 1875 1992 12.2 86.1 53.2 6.9 67.1 86.5 Pakistan 1947 1990 7. 1 35.7 14.3 0.6 99.3 33.2 SriLanka 1896 1991 11.4 27.5 10.6 0.5 27.5 2.5
Source: World Development Indicators
It can be observed from the above analysis that the SAARC region has a long and varyiog history io equity markets. 10dia and Sri Lanka have more than 100 years old markets whereas io Bangladesh and Pakistan the markets came into ex.istence about 50 years ago. Although the South Asian equity markets have different history io terms of establishment. all these markets underwent liberalization at the same time. that is. io early 90s (meaning that equity markets io this region have been opened for the foreign iovestors since 1990). 10 1990 the market capitalization in South Asia is 10.8 percent compared to World rate of 47.8 percent where only India represents 12.2 percent followed by Sri Lanka 11.4 percent and Pakistan 7.1 percent. 10 2006 this ratio has increased for all the South Asian equity markets significantly. i.e the stock market in relation to GDP has. on an average. iocreased by 450 percent over almost the past two decades.
On the other hand, the value traded as percent of gross domestic product. which is a reflection of economy wide liquidity of the country. was below 1 percent for each country ex.cept for India in 1990. In 2006. this value traded ratio has become on average above 40 percent in the region. an increase of 3900 percent over the past 16 years period. This reflects bow stock market got its momentum io the region as a whole and has been the focal poiot of financial market policy makiog.
The foUowiog table makes an attempt to ex.plain how the stock market io the South Asia region changes significantly at the end of the most recent year 2010 io relation to other regions of the world.
2
Muhammad Enamul Haque, Md. Kaium Hossain
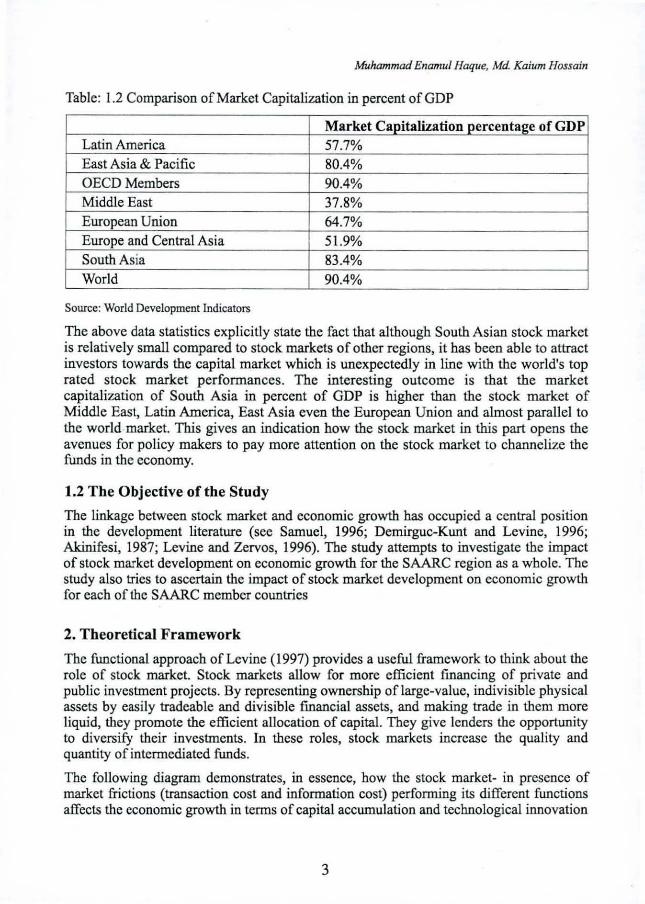
Table: 1.2 Comparison of Market Capitalization in percent of GDP
Market Capitalization percentage of GDP Latin America 57.7% East Asia & Pacific 80.4% OECD Members 90.4% Middle East 37.8% European Union 64.7% Europe and Central Asia 51.9% South Asia 83.4% World 90.4%
Source: World Development Indicators
The above data statistics explicitly state the fact that although South Asian stock market is relatively small compared to stock markets of other regions, it has been able to attract investors towards the capital market which is unexpectedly in line with the world's top rated stock market performances. The interesting outcome is that the market capitalization of South Asia in percent of GDP is higher than the stock market of Middle East, Latin America, East Asia even the European Union and almost parallel to the world market. This gives an indication how the stock market in this part opens the avenues for policy makers to pay more attention on the stock market to chaonelize the funds in the economy.
1.2 The Objective of the Study
The linkage between stock market and economic growth has occupied a central position in the development literature (see Samuel, 1996; Demirguc-Kunt and Levine, 1996; Akinifesi, 1987; Levine and Zervos, 1996). The study attempts to investigate the impact of stock market development on economic growth for the SAARC region as a whole. The study also tries to ascertain the impact of stock market development on economic growth for each of the SAARC member countries
2. Theoretical Framework
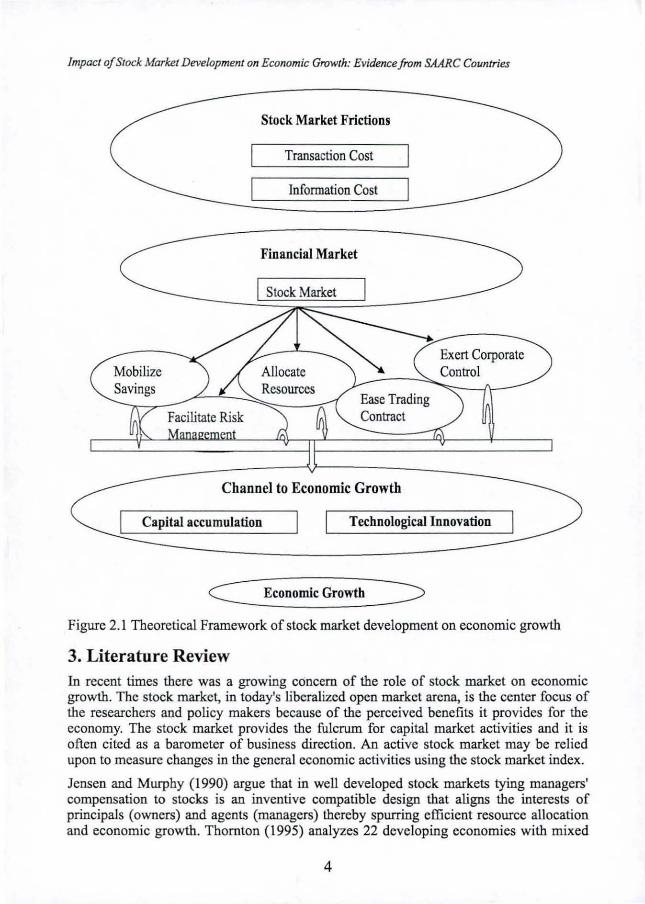
The functional approach of Levine (1997) provides a useful framework to think about the role of stock market. Stock markets allow for more efficient financing of private and public investroent projects. By representing ownership of large-value, indivisible physical assets by easily tradeable and divisible financial assets, and making trade in them more liquid, they promote the efficient allocation of capital. They give lenders the opportunity to diversify their investroents. In these roles, stock markets increase the quality and quantity of intermediated funds .
The following diagram demonstrates, in essence, how the stock market- in presence of market frictions (transaction cost and information cost) performing its different functions affects the economic growth in terms of capital accumulation and technological innovation
3
impact a/Stock Markei Development on Economic Growth: Evidence from SAARC Countries
Stock Market Frictions
Transaction Cost
Information Cost
Financial Market
Stock Market
Mobilize Savings Resources
Ease Trading Contract Facilitate Risk
Channel to Economic Growth
Exert Corporate Control
Capital accumulation Technological Innovation
C Economic Growth --------. -----_.-/ Figure 2.1 Theoretical Framework of stock market development on economic growth
3. Literature Review In recent times there was a growing concern of the role of stock market on economic growth. The stock market, in today's liberalized open market arena, is the center focus of the researchers and policy makers because of the perceived benefits it provides for the economy. The stock market provides the fulcrum for capital market activities and it is often cited as a barometer of business direction. An active stock market may be relied upon to measure changes in the general economic activities using the stock market index.
Jensen and Murphy (1990) argue that in well developed stock markets tying managers' compensation to stocks is an inventive compatible design that aligns the interests of principals (owners) and agents (managers) thereby spurring efficient resource allocation and economic growth. Tbornton (1995) analyzes 22 developing economies with mixed
4
Muhammad Enamul Haque, Md. Kaium Hossain
results although for some countries there was evidence that financial deepening promoted growth. Luitel and Khan (1999) study 10 developing economies and find bi-directional causality between financial development particularly stock market and economic growth in all the sample countries.
Levine and Zervos (1998) are among the first to ask whether stock markets are merely burgeoning casinos or are a key to economic growth and to examine this issue empirically finding a positive and significant correlation between stock market development and long-run growth.
Barro(l991) and Barro-I-Martin(199S) explore the ability of a large number of macroeconomic and demographic variables to explain the cross-sectional characteristics of economic growth rates. Rodrick(1999) examines the relation between openness to trade and economic growth with standard cross-country regression methodology. With a proxy for the general openness to trade, the evidence suggests that the relation between economic growth and openness is statistically weak.
Levine and Zervos (1998) found that stock market liquidity and banking development for 47 countries from 1976-1993, had a positive effect on economic growth, capital accumulation and productivity even after controlling for various other important factors such as fiscal policy, openness to trade, education and political stability. Singh and weisse( 1998) recently examined stock market development and capital flows for less developed countries.
Arestis, Demetriades and Luintel (2001) use data for Germany, the US, Japan, France and UK but their sample only spans the last 2S years. The evidence [or stock market led growth is mixed across countries may be due to the short sample. Rousseau and Sylla(200S) foc us instead on the early stages of economic growth in the US(1790-1S-8S0). They convincingly argue that stock market development had signillcant impact on business incorporations and investment.
Bencivenga, et. AI. (1996) and Levine (1991) have argued that stock market liquidity plays a key role in economic growth. Although profitable investments require long-run commitment to capital, savers prefer not to relinquish control of their savings for long periods. The finding is that liquidity led to an increase in investor incentives to acquire information on firms and improve corporate governance, thereby facilitating growth.
4.1 Research Methodology
The study attempts to examine the impact of stock market development on economic growth for four South Asian countries: Bangladesh, India, Pakistan, and Sri Lanka over the sample period of 1 980-200S. To investigate the stock market impact, dynamic panel data approach is to be considered for the study. Two alternative models for estimating the long-run effects of stock markets development on economic growth will be used in this regard.
5
Impact o/Stock Market Development on Economic Growth: EVidence/rom SAARC Countries
Model One (Direct Effect of Stock Market on Growth Rate)
This model examines the relationsltip between stock market development and economic growth directly, rather than through investment behavior. Thus, the level of investments is used as a control variable. Since we focus on growth, the model is in the form of a dynamic panel estimate of growth following such works as Islam (1995) and Lee, Pesaran, and Smith (1997), as follows:
GroWlh it=ai+YI+pGrowlhil~l O,(MCR,,)+8,(STR,,)+O,(TR,,)+
$, (I NY ,)+$,(FDI,.l+$,(S E,.l+$.(OR")+$s(PC")+c,, ( ..... . ... 4.1)
Model Two (Indirect Effect of Stock Market on Growth Rate)
This model is a two-stage test of the hypothesis of whether the stock market affects economic growth. This is motivated by the well known theoretical study of Levine 1(1991) who proposes that investing in the stock market alleviates both the liquidity shock and the productivity shock that firms would otherwise face. Firms not facing liquidity shocks will have a higher level of investment leading to a ltigher growth rate.
I Levine and Zevros regress the growth rate of GDP per capita on a variety of control variables (to control for initial conditions) and a conglomerated index of stock market development, following the theoretical work of A~e and Jovanovic (1993). Though they find a positive and significant correlation between stock market development and long run economic growth, their approach entails possible measurement problems (use of two different sources: !Fe and IFS), statistical problems (cross-sectional approach) , and conceptual problems (combining several measures into a single measure) which may affect their results. The present paper is an attempt to address these shortcomings.
In order to test the above theoretical hypothesis we regress investment on three measures of the stock market and then we regress growth on value of investments as shown below:
Fi rst Equation
I lNV,,_(I,+Y,+ 0, (MCR".,)+O,(STR" .,)+O,(TR".,)+ E" ( .. .4.1. 1)
Eq uation Two:
Growthj,==ai+y,+$JGrowthit_l+Q2CfNVit_l)+ <j>,(FDI".,)+cp,(SE" .,)$s(OR".,)+<j>,(pC" .,) H" ( ... ..... .4.1.2)
6
Muhammad Enamul Haque, Md Kaium Hossain
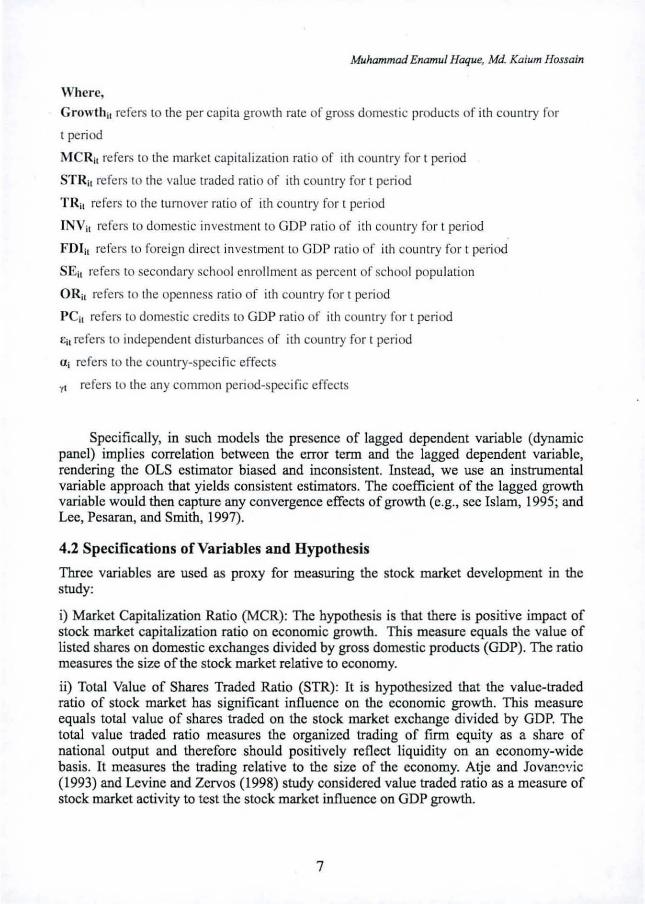
Where,
Growthu refers to the per capi ta growth ra te of gross domestic products of ith country for
t period
MCR;, refers to the market capi talizati on ratio of ith country for t period
STRu refers to the value traded ratio of ith country for t peri od
TRu refers to the tu rnover ratio of ith cou ntry for t period
INV;, refers to domestic investment to GOP ra tio of ith country for t peri od
1'01;, refers to foreign di rect in vestment to GOP ra tio of ith country for t period
SEu refers to secondary school enro ll ment as percen t of school popu lation
ORu refers to the openness rat io of ith country for t period
PCu refers to domestic credits to GOP ra tio of ith cou ntry fo r t peri od
£;, refers to independent dis turbances of ith country for t period
U; refers to the country-specific effects
"(' refers to the any common peri od-specific effects
Specifically, in such models the presence of lagged dependent variable (dynamic panel) implies correlation between the error term and the lagged dependent variable, rendering the OLS estimator biased and inconsistent. Instead, we use an instrumental variable approach that yields consistent estimators. The coefficient of the lagged growth variable would then capture any convergence effects of growth (e.g., see Islam, 1995; and Lee, Pesaran, and Smith, 1997).
4.2 Specifications of Variables and Hypothesis
Three variables are used as proxy for measuring the stock market development in the study:
i) Market Capitalization Ratio (MCR): The hypothesis is that there is positive impact of stock market capitalization ratio on economic growth. TIlls measure equals the value of listed shares on domestic exchanges divided by gross domestic products (GDP) . The ratio measures the size of the stock market relative to economy.
ii) Total Value of Shares Traded Ratio (STR): It is hypothesized that the value-traded ratio of stock market has significant influence on the economic growth. This measure equals total value of shares traded on the stock market exchange divided by GDP. The total value traded ratio measures the organized trading of firm equity as a share of national output and therefore should positively reflect liquidity on an economy-wide basis. It measures the trading relative to the size of the economy. Atje and Jov3I!~'!ic (1993) and Levine and Zervos (1998) study considered value traded ratio as a measure of stock market activity to test the stock market influence on GOP growth.
7
Impact o/Stock Markel Development on Economic Growth: Evidencefrom SAARC Countries
iii) Turnover Ratio (TR): The hypothesis is that turnover ratio has a positive association with GOP per capita growth rate. This ratio equals the value of total shares traded on domestic exchanges divided by market capitalization of the stock market. This ratio measures the size of the liquidity of the stock market. The turnover ratio meaSures the volume of domestic equities traded relative to the size of the market. The higher the ratio, the higher will be the liquidity of the stock market. Levine(1991), and Bencivenga, Demirguc & Levine (1996), Murinde (1996) used in their studies turnover ratio as one of the explanatory variable for assessing the stock market impact opn GOP growth rate.
5. Interpretation of Results
5.1 Unit Root Test
In statistics, a unit root test tests whether a time series variable is non-stationary using an autoregressive model. The most famous test is the augmented Dickey-Fuller test. Another test is the Phillips-Perron test. Both these tests use the existence of a unit root as the null hypothesis. An augmented Dickey-Fuller test (AD F) is a test for a unit root in a time series sample. It is an augmented version of the Dickey-Fuller test for a larger and more complicated set of time series models. The augmented Dickey-Fuller (ADF) statistic, used in the test, is a negative number. The more negative it is, the stronger the rej ection of the hypothesis that there is a unit root at some level of confidence
Often, ordinary least square (OLS) is used to estimate the slope coefficients of the autoregressive model. Use of OLS relies on the stochastic process being stationary. When the stochastic process is non-stationary, the use of OLS can produce invalid estimates. Granger and Newbold called such estimates 'spurious regression' results: high R2 values and high t-ratios yielding results with no economic meaning.
To estimate the slope coefficients, one should first conduct a unit root test, whose null hypothesis is that a unit root is present. If that hypothesis is rejected, one can use OLS. However, if the presence of a unit root is not rejected, then one should apply the difference operator to the series. If another unit root test shows the differenced time series to be stationary, OLS can then be applied to this series to estimate the slope coefficients.
For example. in the AR ( I ) case, 6y, = Y, - Yr- I = £, is stationary. In the AR(2) case. y, = a,y,_, + all',- 2 + E, can be wrinen as ( I - A,L)( I - A,L)y, = E, where L is a lag opermor that decreases the ti me index of a variable by one period: Ly, = y,_ I· I f A2 = I . the model has a unit root and we can define 'l,;; 6y,; !.hen :,=AIZr_1 +E,
is stat ion<lry if I )~I 1< 1. OLS can be used to estimate the slope coefficiem, A.I ·
i f the process has multiple unit roots. the difrercnce operator can be applicd multiple timcs.
Before the study makes attempt to estimate the impact of stock market development on economic growth rate among the SAARC countries, the unit root test has been made for all the variables for the study by using the Augmented Dickey Fuller test.
8
Muhammad Enamul Haque, Md. Kaium Hossain
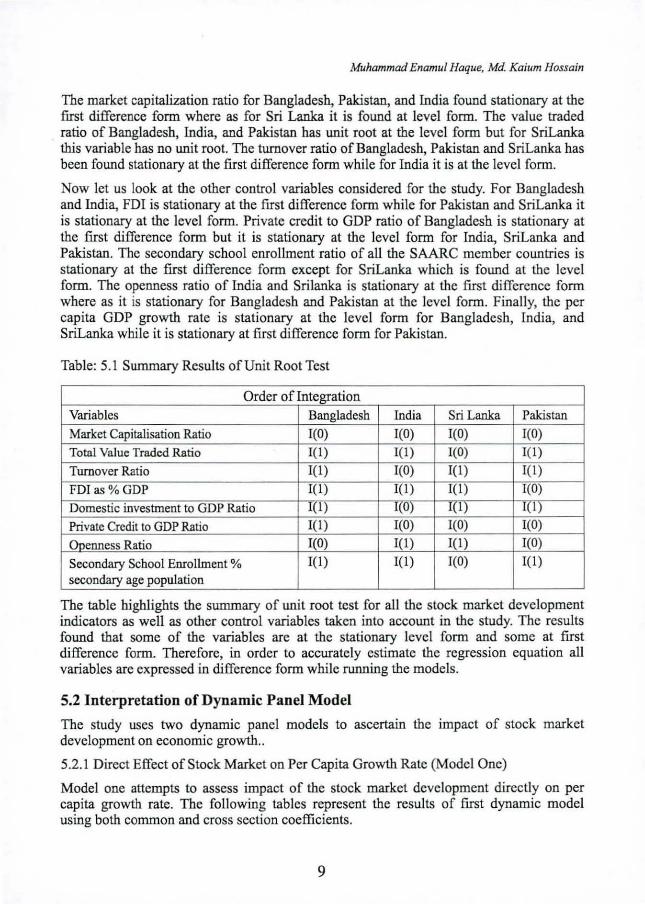
The market capitalization ratio for Bangladesh, Pakistan, and India found stationary at the first difference form where as for Sri Lanka it is found at level form. The value traded ratio of Bangladesh, India, and Pakistan has unit root at the level form but for SriLanka this variable has no unit root. The turnover ratio of Bangladesh, Pakistan and SriLanka has been found stationary at the first difference form while for Inelia it is at the level form.
Now let us look at the other control variables considered for the study. For Bangladesh and India, FDI is stationary at the first difference form while for Pakistan and SriLanka it is stationary at the level form. Private creelit to GOP ratio of Bangladesh is stationary at the first elifference form but it is stationary at the level form for Inelia, SriLanka and Pakistan. The secondary school enrollment ratio of all the SAARC member countries is stationary at the first difference form except for SriLanka which is found at the level form. The openness ratio of Inelia and Srilanka is stationary at the first elifference form where as it is stationary for Bangladesh and Pakistan at the level form. Finally, the per capita GOP growth rate is stationary at the level form for Bangladesh, Inelia, and SriLanka while it is stationary at first difference form for Pakistan.
Table: 5.1 Summary Results ofUoit Root Test
Order of Integration Variables Bangladesh Inelia Sri Lanka Pakistan Market Capitalisation Ratio 1(0) 1(0) 1(0) 1(0)
Total Value Traded Ratio 1(1) 1(1) 1(0) 1(1)
Turnover Ratio 1(1 ) 1(0) 1(1) 1(1 )
FDl as % GDP 1(1) 1(1) 1(1) 1(0)
Domestic investment to GDP Ratio 1(1) 1(0) 1(1) 1(1 )
Private Credit to GDP Ratio 1(1) 1(0) 1(0) 1(0)
Openness Ratio 1(0) 1(1 ) 1(1) 1(0)
Secondary School Enrollment % 1(1) 1(1) 1(0) 1(\ )
secondary age population
The table highlights the summary of unit root test for all the stock market development inelicators as well as other control variables taken into account in the study. The results found that some of the variables are at the stationary level form and some at first elifference form. Therefore, in order to accurately estimate the regression equation all variables arc expressed in elifference form while rurwing the models.
5.2 Interpretation of Dynamic Panel Model
The study uses two dynamic panel models to ascertain the impact of stock market development on economic growth ..
5.2.1 Direct Effect of Stock Market on Per Capita Growth Rate (Model One)
Model one attempts to assess impact of the stock market development directly on per capita growth rate. The following tables represent the results of first dynamic model using both co=on and cross section coefficients.
9
Impact o/Stock Market Development on Economic Growth: Evidence/rom SAARC Countries
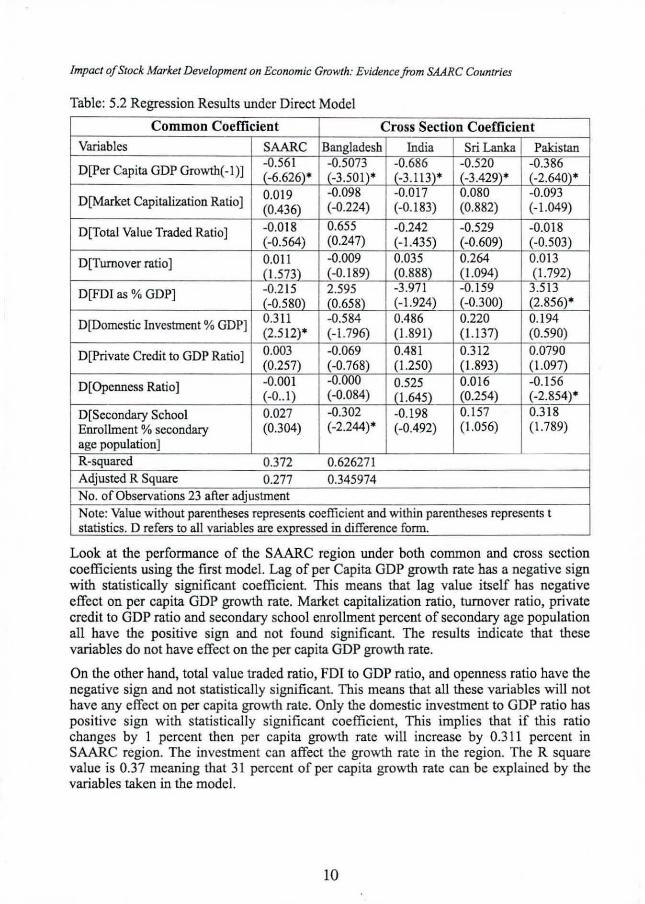
Table: 5.2 Regression Results under Direct Model
Common Coefficient Cross Section Coefficient
Variables SAARC Bangladesh India Sri Lanka Pakistan
D[per Capita GOP Growth(-I)] -0.561 -0.5073 -0.686 -0.520 -0.386 (-6.626)- (-3.501)- (-3.113)- (-3.429)' (-2.640)'
O[Market Capitalization Ratio] 0.019 -0.098 -0.017 0.080 -0.093 (0.436) (-0.224) (-0.183) (0.882) (-l.049)
D[Total Value Traded Ratio] -0.0 18 0.655 -0.242 -0.529 -0.018 (-0.564) (0.247) (-l.435) (-0.609) (-0.503)
O[Turoover ratio] 0.011 -0.009 0.035 0.264 0.013 (l.573) (-0.189) (0.888) (l.094) (l.792)
D[FDl as % GOP] -0.215 2.595 -3.971 -0. 159 3.513 (-0.580) (0.658) (-l.924) (-0.300) (2.856)'
O[Domestic Investment % GOP] 0.311 -0.584 0.486 0.220 0.194 (2.512)' (-l.796) (l.891) (1.137) (0.590)
D[private Credit to GOP Ratio] 0.003 -0.069 0.481 0.312 0.0790 (0.257) (-0.768) (l.250) (1.893) (l.097)
D[Opeoness Ratio] -0.001 -0:000 0.525 0.016 -0.156 (-0 .. I) (-0.084) (l.645) (0.254) (-2.854)'
D[Secondary School 0.027 -0.302 -0.198 0.157 0.3 18 Enrollment % secondary (0.304) (-2.244)' (-0.492) (\.056) (1.789) age population] R-squared 0.372 0.626271 Adjusted R Square 0.277 0.345974 No. orObserv.tions 23 after adjustment Note: V.lue without parentheses represents coefficient and within parentheses represents t statistics. 0 refers to all variables are expressed in difference form.
Look at the performance of the SAARC region under both common and cross section coefficients using the first model. Lag of per Capita GOP growth rate has a negative sign with statistically significant coefficient. This means that lag value itself has negative effect on per capita GOP growth rate. Market capitalization ratio, turnover ratio, private credit to GOP ratio and secondary school enrollment percent of secondary age population all have the positive sign and not found significant. The results indicate that these variables do not have effect on the per capita GOP growth rate.
On the other hand, total value traded ratio, FDI to GOP ratio, and openness ratio have the negative sign and not statistically significant. This means that all these variables will not have any elfect on per capita growth rate. Only the domestic investment to GOP ratio has positive sign with statistically significant coefficient, This implies that if tlils ratio changes by I percent then per capita growth rate will increase by 0 .3 11 percent in SAARC region. The investment can affect the growth rate in the region. The R square value is 0.37 meaning that 31 percent of per capita growth rate can be explained by the variables taken in the model.
10
Muhammad Enamul Haque, Md. Kaium Hossain
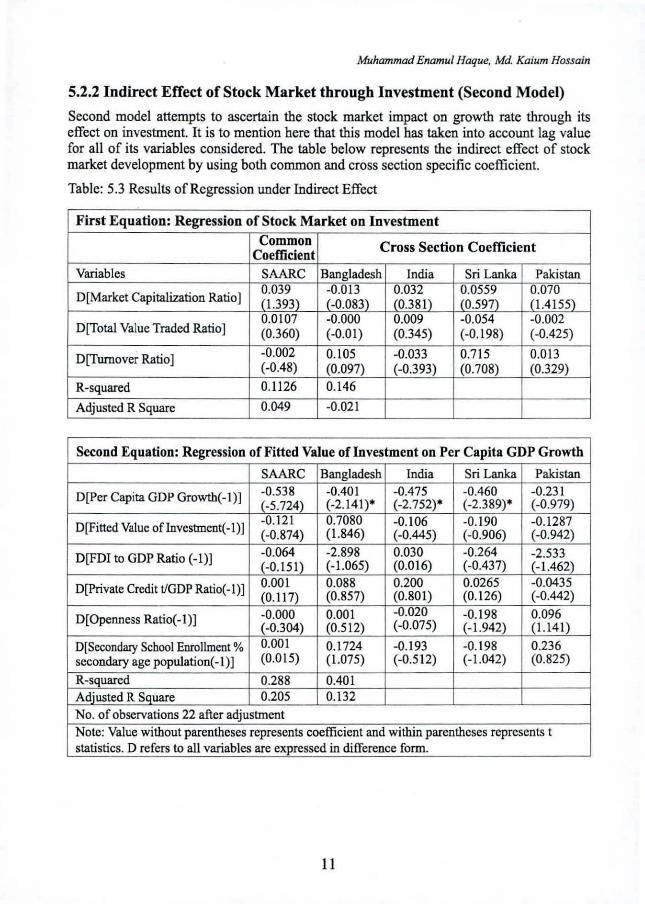
5.2.2 Indirect Effect of Stock Market through Investment (Second Model)
Second model attempts to ascertain the stock market impact on growth rate through its effect on investment. It is to mention here that this model has taken into account Jag value for aU of its variables considered. The table below represents the indirect effect of stock market development by using both co=on and cross section specific coefficient.
Table: 5.3 Results of Regression under Indirect Effect
First Equation: Regression of Stock Market on Investment
Cornmon Cross Section Coefficient Coefficient
Variables SAARC Bangladesh India Sri Lanka Pakistan
D[Market Capitalization Ratio] 0.039 ·0.013 0.032 0.0559 0.070 (1.393) (·0.083) (0.381) (0.597) (1.4155)
D[Total Value Traded Ratio] 0.0107 ·0.000 0.009 ·0.054 ·0.002 (0.360) (·0.01) (0.345) (·0.198) (·0.425)
D[Turnover Ratio] ·0.002 0.105 ·0.033 0.715 0.013 (·0.48) (0.097) (-0.393) (0.708) (0.329)
R-squared 0. IJ26 0.146
Adjusted R Square 0.049 -0.021
Second Equation: Regression of Fitted Value of Investment on Per Capita GDP Growth
SAARC Bangladesh India Sri Lanka Pakistan
D[Per Capita GDP Growtb(- I)] -0.538 -0.401 -0.475 -0.460 -0.231 (-5.724) (-2.141)" (-2.752)" (-2.389)" (-0.979)
D[Fitted Value oflnvestment(-I)] -0.121 0.7080 -0.106 -0.190 -0.1287 (-0.874) (1.846) (-0.445) (-0.906) (-0.942)
D[FDI to GDP Ratio (-I)] -0.064 -2.898 0.030 -0.264 -2.533 (-0.151) (-1.065) (0.016) (-0.437) (-1.462)
D[private Credit tlGDP Ratio(-I)] 0.001 0.088 0.200 0.0265 -0.0435 (0.117) (0.857) (0.801) (0.126) (-0.442)
D[Openness Ratio(-I)] -0.000 0.001 -0.020 -0.198 0.096 (-0.304) (0.512) (-0.075) (-1.942) (1.141)
D[Secondary School Enrollment % 0.001 0.1724 -0.193 -0.198 0.236 secondary age population( -1)] (0.015) (1.075) (-0.512) (-1.042) (0.825)
R-squared 0.288 0.401 Adjusted R Square 0.205 0.132
No. of observations 22 after adjustment Note: Value without parentheses represents coefficient and within parentheses represents t statistics. D reCers to all variables are expressed in difference Corm.
11
Impact of Stock Market Development on Economic Growth: Evidence from SAARC Countries
A look at the first equation of the above table which indicates that all the stock market indicators in the SAARC region as a whole are not statistically signifIcant. This can be interpreted in such a way that stock market does not have any positive impact on the investment ratio in the region. On the other hand, stock market indicators in Bangladesh, India, Sri Lanka, and Pakistan do not reflect the statistically significant coefficients meaning that stock market development variables considered in the study will not have any positive direct effect on the investment rate for anyone of the SAARC member countries. The R square value signifIes the findings that only 28 percent of the domestic investment can be explained by the stock market indicators. Now look at the second equation of the model wben fitted value of investment is regressed on per capita growth rate. The results indicate that FDr to GDP ratio, private credit and openness ratio all are not found significant meaning that they do not have any effect on per capita growth rate of SAARC region.
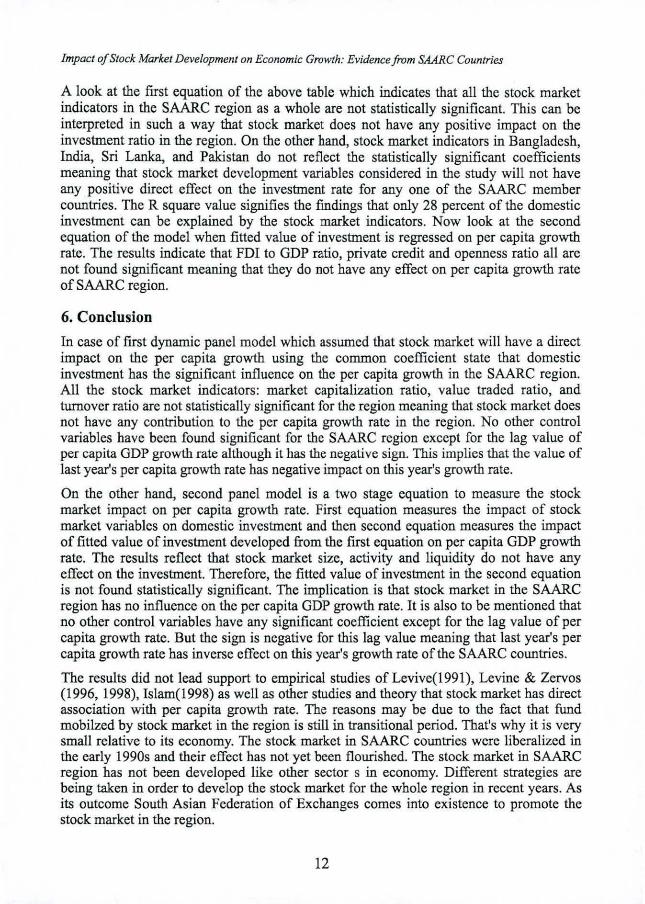
6. Conclusion
In case of first dynamic panel model which assumed that stock market will have a direct impact on the per capita growth using the common coefficient state that domestic investment has the significant influence on the per capita growth in the SAARC region. All the stock market indicators: market capitalization ratio, value traded ratio, and turnover ratio are not statistically significant for the region meaning that stock market does not have any contribution to the per capita growth rate in the region. No other control variables have been found significant for the SAARC region except for the lag value of per capita GOP growth rate although it has the negative sign. This implies that the value of last year's per capita growth rate has negative impact on this year's growth rate.
On the other hand, second panel model is a two stage equation to measure the stock market impact on per capita growth rate. First equation measures the impact of stock market variables on domestic investment and then second equation measures the impact of fitted value of investment developed from the first equation on per capita GOP growth rate. The results reflect that stock market size, activity and liquidity do not have any effect on the investment. Therefore, the fitted value of investment in the second equation is not found statistically significant. The implication is that stock market in the SAARC region has no influence on the per capita GOP growth rate. It is also to be mentioned that no other control variables have any signifIcant coefficient except for the lag value of per capita growth rate. But the sign is negative for this lag value meaning that last year's per capita growth rate has inverse effect on this year's growth rate of the SAARC countries.
The results did not lead support to empirical studies of Levive(l991), Levine & Zervos (1996,1998), Islam(1998) as well as other studies and theory that stock market has direct association with per capita growth rate. The reasons may be due to the fact that fund mobilzed by stock market in the region is still in transitional period. That's why it is very small relative to its economy. The stock market in SAARC countries were liberalized in the early 1990s and their effect has not yet heen flourished. The stock market in SAARC region has not been developed like other sector s in economy. Different strategies are being taken in order to develop the stock market for the whole region in recent years. As its outcome South Asian Federation of Exchanges comes into existence to promote the stock market in the region.
12
Muhammad Enamul Haque, Md. Kaium Hossain
References
Ahmed, M. F. (1999). "Stock Market, Macroeconomic Variables, and Causality: the Bangladesh Case", Savings and Development, No.2, 1999.
Arestis, Phillip, Panicos Demetriades, and Kul Luintel. (2001). "Financial Development and Economic Growth: The Role of Stock Markets", Journal of Money. Credit and Banking, 2001, pp. 16-41
Arifr, Mohamed, and A. M. Khalid. (200 I). Liberalization, Growth, and the Asian Financial Crises. Edward Elgar Publishing Ltd. UK, 2000.
Age, R., and B. Jovanovic. (1993). "Stock Markets and Development", European Economic Review, Vol. 37: 632-640.
Barro, R.J. (1991). "Economic Growth in a Cross Section of Countries", Quarterly Journal of Economies, Vol. CVl: 407-443.
Bencivenga, V.R., and B. Smith., and R.M. Starr. (1996). "Equity Markets, Transaction Costs, and Capital Accumulation: An LUustration", The World Bank Economic Review. Vol. 10: 241-65.
Chowdhury, A. R. (1994). "Statistical Properties of Daily Returns from Dhaka Stock Exchange", Bangladesh Development Studies 26, pp-61-76.
Claesseos, S. S. Dasgupta, and J. Glen. (1993). "Stock Price Behavior in Emerging Markets". In Portfolio Investment in Developing Countries, World Bank Discussion Paper No. 228, ed. Stijn Claessens and Sudarshan Gooptu. Washington DC: World Bank, 1993. pp-323-351
Demirgll9-Kunt, Asli and Ross Levine. (1996). "Stock Market, an Overview". The World Bank Review 10(2): pp-223-239
Demirguch-Kunt, A., and R. Levine. (1996). "Stock Market Development and Financial Intermediaries: Stylized Facts". The World Bank Economic Review, Vol. 10: pp-291-321 .
Elyasiani, E. P. Perera and T. N. Puri. (1998). "Interdependence and Dynamic Linkages between Stock Markets of Sri Lanka and Its Trading Partners", Journal of Multinational Financial Management 8, pp-89-1 0 1.
Filler, Randall K., Jan Hanousek and Nauro F. Campos. (1999). "Do Stock Market Promote Economic Growth?" The William Davidson Institute (University of Michigan Business School) Working Paper Series No. 267, September.
13