Embed Size (px)
Citation preview
IMPACT OF TAXATION ON GROWTH OF SMALL AND MEDIUM ENTERPRISES. A
CASE STUDY OF BIDCO UGANDA (2013 -2016)
BY
APINYFOSCA
BBA/41211/133/DU
A RESEARCH REPORT SUBMITTED TO THE COLLEGE OF ECONOMICS
AND MANAGEMENT SCIENCE IN PARTIAL FULFILMENT OF THE
REQUTREMENTS FOR THE AW ARD OF BACHELORS
DEGREE IN BUSINESS ADMINISTRATION OF
KAMP ALA lNTERNATIONAL
UNIVERSITY
APRIL 2016

-------~- -
DECLARATION
I Apiny Fosca declare that this research report is my original work and to the best of my
knowledge, it has never been presented elsewhere in any university or institution of learning for
approval.
Signed ....... ~ ...... . .
APINYFOSCA
BBA/41211/133/DU
[STUDENT]
Date . .,_ r .r. C?.i.l ~! 6 .....

----~----
APPROVAL
I, the undersigned certify that I have read and hereby recommend for acceptance by Kampala
International University a research report titled, the Impact of taxation on growth of small and
medium enterprises. A case study ofBIDCO Uganda (2013 -2016).
Signed ~ --DR. STANLEY KINY ATTA
rsUPERVISOR]
Date . f. I./ 0 t. ./ ii:P.({,
ii
DEDICATION
I dedicate this piece of work to my parents Mr. and Mrs. Okot Omia Thomas and lovely classmates
in the College of Economics and Management Science and my supervisor Dr. Stanley Kinyatta.
Ei
ACKNOWLEDGEMENT
I extend a vote of thanks to a number of people who unreservedly contributed towards the
accomplishment of this research work. I also would like to acknowledge the assistance and role
played by the following personalities to the successful completion of this study. I cannot say
exactly how grateful I am to my supervisor, Dr. Stanley Kinyatta. His guidance in this study was
beyond measure. Thank you also for providing me with professional advice, encouragement and
your time that has spurred me to success.
I also extend sincere thanks to my friends; Maureen, Isabella, Lillian, Jerry, brothers; Arnold,
Samuel, Bonnie and Isaac, and not forgetting my aunt; Gorret and family for their inspirations in
my studies.
May the Almighty God Bless you abundantly
T ADLE OF CONTENTS
DECLARATION ............................................................................................................................. i
APPROVAL ................................................................................................................................... ii
DEDICATION ........ ............... ............................................. ......... .................................................. iii
ACKNOWLEDGEMENT ................................... ............................................................. .......... ... iv
ABSTRACT .. .. ......... .................... . . ............. ....... ........................... . ... ... ........ viii LIST OFT ABLES ............................ ............... ........................... ................... ................................ ix
LIST OF FJGURES ........................................................................................................................ X
CHAPTER ONE ........................................................................................................................... 1
INTRODUCTION ......................................................................................................................... 1
1.0 Introduction ....... ........................................... .................... .... .... ................................................. 1
1.1 Background of the study ........................................................................................................... 1
1.2 Statement of the problem .................... ...................................................................................... 3
1.3 Purpose of the study .................................................................................................................. 3
1.4 Objectives of the study .............................................................................................................. 3
1.5 Research questious ..................................................................................................... ............... 4
1.6 Scope of the study ..................................................................................................................... 4
1.6.1 Subject scope ................ ................................................................... ...................................... 4
1.6.2 Geographical scope ........ ..... .................. ......................... ............................................. ...... ..... 4
1.6.3 Time scope .............. ............................................................................................................... 4
1.7 Significance of the study ................................................................................................... ........ 4
1.8 Conceptual frame ,vork ... ....................................... ...................... ............................................. 6
CHAPTER 'fWO ...................................................................... , ................................................... 8
LITERATURE REVIE\V ............................................................................................................ 8
2.0 Introduction ..... .. .......................... ......................................................................... ........... .......... 8
2.1 Effect of progressive tax on growth of SMEs ........................................................................... 8
2.2 The effect of corporation tax on growth of SNIEs ... ................... .......................................... . 10
2.3 The effect ofregressive tax on growth of SMEs ............. ............................. .................... ...... 12
V

CHAPTER THREE .................................................................................................................... 15
METHODOLOGY ..................................................................................................................... 15
3.0 Introduction ............................................................................................................................. 15
3 .1 Research Design ...................................................................................................................... 15
3 .2 Research Population .............. .................................................................................................. 15
3.2.1 Sample Size ...... ............. ....................................................................................................... 15
3.2.2 Sampling techniques and Procedure .................................................................................... 16
3.3 Sources of data ........................................................................................................................ 17
3.3.1 Primary data .................................................. ....................................................................... 17
3.3.2 Secondary data ..................................................................................................................... 17
3.4 Data collection Methods ..................................................... ..... ..................................... .......... 17
3.4.1 Questionnaire method ............................................................... .................................. ......... 17
3.4.2 Interview method ................................................................................................................. 18
3.5 Validity and reliability of research instrument ................................................................ ....... 18
3.5.1 Validity ................................................................................................................................ 18
3.5.2 Reliability ............................................................................................................................. 18
3.6 Data Processing and Analysis .............................................................................. ............. ..... . 19
3. 7 Ethical Considerations .......................................... .................................................................. 19
3.8 Limitations of the Study ........ .. ........ ............................................. ........................................... 19
CHAPTER FOUR ....................................................................................................................... 20
PRESENTATION, INTERPRETATION AND ANALYSIS OF FINDINGS ...................... 20
4.0 Introduction ........................................ ...... ........................................... ...... .................. ............ 20
4.1 Demographic Characteristics .................. ............. .. ................................................................. 20
4.1.1 Gender of respondents ...... : .................................................................................................. 20
4.1.2 .t\ge of respondents .............................................................................................................. 21
4.1.3 Academic Qualifications ofrespundents ............................................................................ 22
4.1.4 Marital status of respondents ................ ...................... ........................................ ................. 23
4.2 The effect of progressive tax on growth of SMEs in Kampala central division ..................... 24
vi
4.3 Effect of corporation tax on growth of SME~ in Kampala cer.tral division, Kampala district.
..................................................................................................................................... .. ................ 27
4.4 The effect of regressive tax on growth of SMEs in Kampala central division, Kampala
district. .............................................. ............................................................................................ 30
CHARPTER FIVE ...................................................................................................................... 33
SUMMARYs CONCLUSIONS, RECOMMENDATIONS AND AREAS OF FURTHER
RESEARCH ...................... , ......................................................................................................... 33
5.0 Introduction ............................... ............ .. ...... ... ............... .............................. ............... .. ......... 33
5.1 Summary of the findings ......................................................................................................... 33
5.2 Conclusions ................ .......... ................... ..................................................................... ........... 34
5.3 Recommendations ................................................................................................................... 35
5.4 Areas for further research ............................................. ........................................ .................. 35
REFERENCES ............................................................................................................................. 36
APPENDICES ............ ................................. ......................... .......... .............................................. 38
APPENDIX I: RESEARCH INSTRUfvffiNT: QUESTlO1'l'NAIRES .......................................... 38
APPENDIX H: INTERVIEW GUIDE ...................... ..................... ... .......... ............. ...... .. .... ........ 41
Appendix ii: Res~arch Budget ........................ ..... ........................... ........... ....................... ........... 42
APPEl\rorx iii: Research Time Fra!'ne ... .... ..... . ..... ........... . ... .. .......... . .... . ............... 44
Vl!
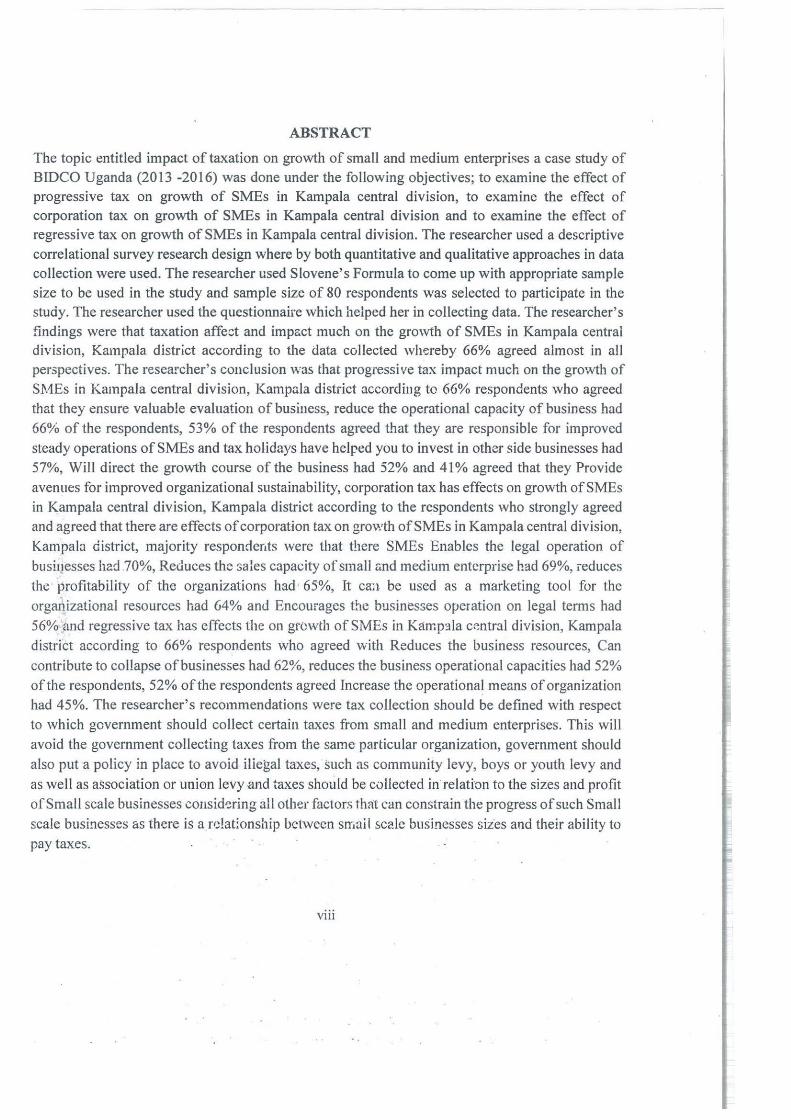
ABSTRACT
The topic entitled impact of taxation on growth of small and medium enterprises a case study of BIDCO Uganda (2013 -2016) was done under the following objectives; to examine the effect of progressive tax on growth of SMEs in Kampala central division, to examine the effect of corporation tax on growth of SMEs in Kampala central division and to examine the effect of regressive tax on growth of SMEs in Kampala central division. The researcher used a descriptive correlational survey research design where by both quantitative and qualitative approaches in data collection were used. The researcher used Slovene's Formula to come up with appropriate sample size to be used in the study and sample size of 80 respondents was selected to participate in the study. The researcher used the questionnaire which helped her in collecting data. The researcher' s findings were that taxation affe:;t and impact much on the growth of SMEs in Kampala central division, Kampala district according to the data collected whf.:reby 66% agreed almost in all perspectives. The researcher's conclusion was that progressive tax impact much on the growth of SMEs in Kampala central division, Kamp .. la district accordiug tc 66% respondents who agreed that they ensure valuable evaluation of business, reduce the operational capacity of business had 66% of the respondents, 53% of the respondents agreed that they are responsible for improved
steady operations of SMEs and tax holidays have heired you to invest in other side businesses had 57%, Will direct the growth course of the business had 52% and 41 % agreed that they Provide
avenues for improved organizational sustainability, corporation tax has effects on growth of SMEs in Kampala central division, Kampala district according to the respondents who strongly agreed and agreed that there are effects of corporation tax on growth of Sfv1Es in Kampala central division,
Kampala district, majority responder1ts were that there SMEs Enables the legal operation of busit}esses had 70%, Reduces the sales capacity of small &nd medium enterprise had 69%, reduces
the· profitability of the organizations had ' 65%, It caa be used as a marketing tool for the
organizational resources had 64% and Encourages the businesses operation on legal terms had 56% and regressive tax has effects the on grcwth of SMEs in Karr.p:1la c~ntral division, Kampala district according to 66% respondents who agreed Vvith Reduces the business resources, Can
contribute to collapse of businesses ha<l 62%, reduces the business operational capacities had 52% of the respondents, 52% of the respondents agreed Increase the operational means of organization had 45%. The researcher's recommendations were tax collection should be defined with respect to which government should collect certain truces from small and medium enterprises. This will avoid the government collecting taxes from the same particular organization, government should
also put a policy in place to avoid iliegal taxes, such as community levy, boys or youth levy and as well as association or uni0n levy .and taxes should be collected in relati'on to the sizes and profit
of Small scale businesses consid':!ring all other factors that can constrain the progress of such Small scale busi!iesses as there is a r1~!at:onship between smail scale businesses siz'es and their ability to pay taxes.
viii
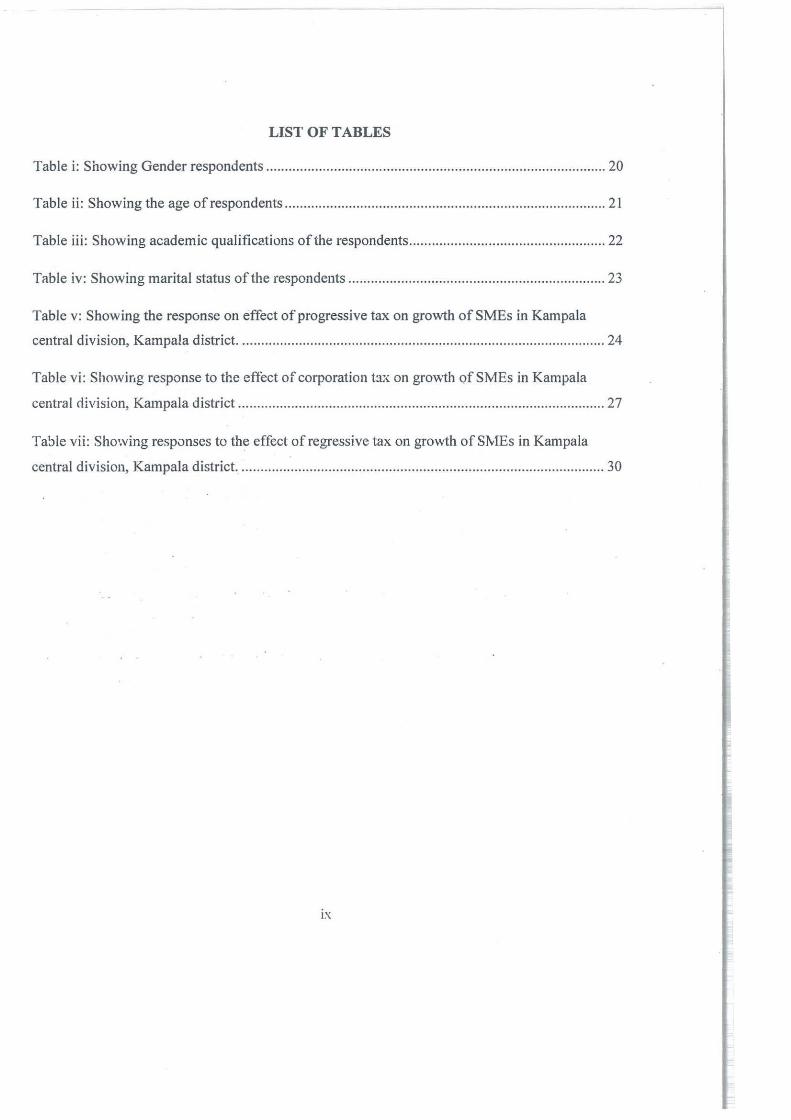
LIST OFT ABLES
Table i: Showing Gender respondents ..... ........... ...................................... ..... ............................... 20
Table ii: Showing the age of respondents ..................................................................................... 21
Table iii: Showing academic qualificc1.tions of the respondents .................................................... 22
Table iv: Showing marital status of the respondents ............................................................ ........ 23
Table v: Showing the response on effect of progressive tax on growth of SMEs in Kampala
central division, Kampala district. ................................................................................................ 24
Table vi: Showing response to the effect of corporation tax on gro\\1h of SMEs in Kampala
central division, Katnpala district ................................................................................................. 27
Ta!Jle vii: Showing responses to the effect of regressive tax on growth of SMEs in Kampala
central division, Kampala district. ................................................................................................ 30
ix
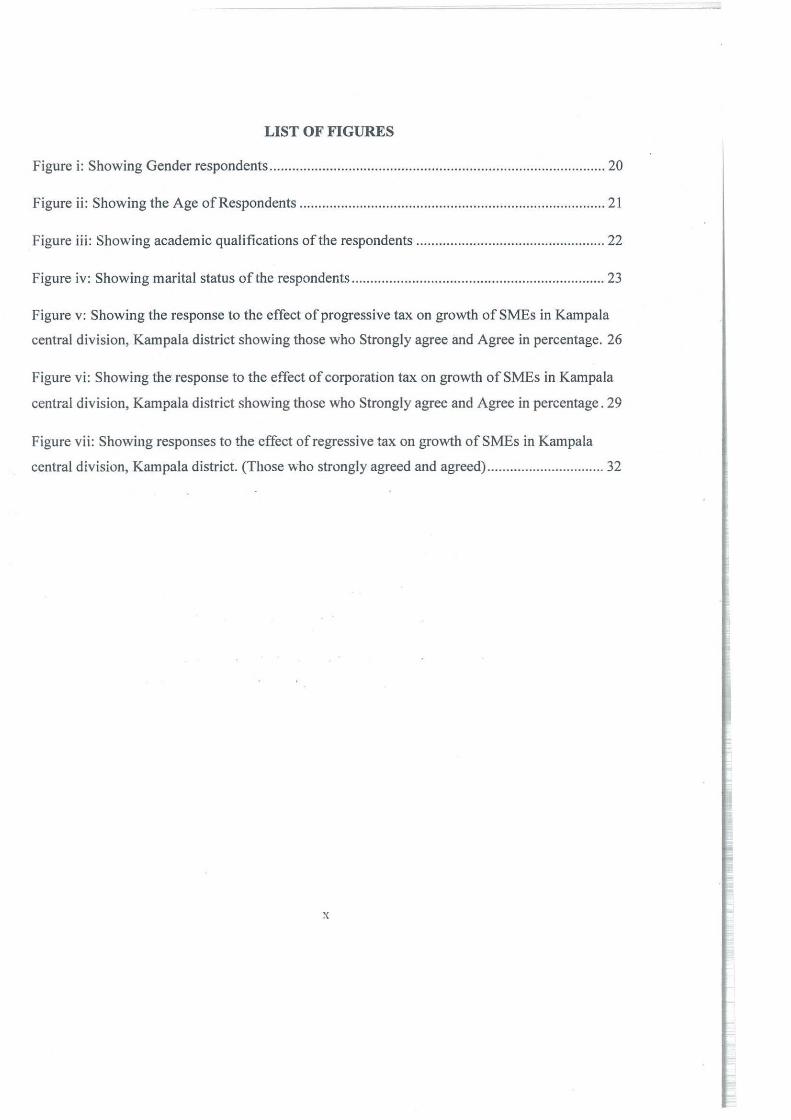
LIST OF FIGURES
Figure i: Showing Gender respondents ......................................................................................... 20
Figure ii: Showing the Age of Respondents ... ...... ............................ .................... ......... .... ........... 21
Figure iii: Showing academic qualifications of the respondents .................................................. 22
Figure iv: Showing marital status of the respondents ................................................................... 23
Figure v: Showing the response to the effect of progressive tax on growth of SMEs in Kampala
central division, Kampala district showing those who Strongly agree and Agree in percentage. 26
Figure vi: Showing the response to the effect of corporation tax on growth of SMEs in Kampala
central division, Kampala district showing those who Strongly agree and Agree in percentage. 29
Figure vii: Showing responses to the effect of regressive tax on growth of SMEs in Kampala
central division, Kampala district. (Those who strongly agreed and agreed) ............................ ... 32
CHAPTER ONE
INTRODUCTION
1.0 Introduction
The study was meant to investigate tax systems and growth of small and medium enterprises in
Kampala Central Division. This chapter consists of the background to the study, statement of the
problem, purpose of the study, objectives of the study, research questions, scope of the study,
significance of the study and the conceptual frame work.
1.1 Background of the study
Worldwide, different governments use different kinds of taxes and vary the tax rates. This is done
to distribute the tax burden among individuals or classes of the population involved in taxable
activities, such as business, or to redistribute resources between individuals or classes in the
population. Historically, the nobili.ty were supported by taxes on the poor; modern social security
systems are intended to support the poor, the disabled, or the retired by taxes on those who are still
working. In addition, taxes are applied to fund foreign aid and military ventures, to influence the
macroeconomic performance of the economy (the government's strategy for doing this is called
its fiscal policy; see also tax exempti0n), or to modify patterns of consumption or employment
within an economy, by making some classes of trcr.saction more or less attractive Income tax
proficiencies as a center of attention is rising hastily in both the private and public sectors and it is
imperative to appreciate the commenc!abk performan~e of many organizations of varying sizes as
a result (Kock, Gill and Ellstrom 2008; Risher 2000). Conversely, there are perceptible confines;
studies have often been predisposed towards large enterprises and public organization (Hill, 2004);
little (if any) proficiency literature in the area of taxation. But from a limited number of studies on
proficiencies in small to medium-sized enterprises (SMEs), the concentration has mainly been on
entrepreneurial, managerial and technological proficiencies.
Tax systems increase incentives· for· public · participation in the political process and creates
pressure for more accountability, better g,rver:iam:e, ·.;nd improved efficiency of government
spending. Tax systems also create incentives for governments to upgrade their institutions for tax
collection and administration and to provide more public services (Moore, 2007).
The tax systems affect the growth of small and medium enterprises in different ways for different
entrepreneurs and corporations. This calls for a thorough analysis of any proposed changes in the
tax system. The Uganda's tax system has witnessed a number of challenges since 1980. In the
l 980's, export taxes played a significant role in revenue collections when its share of total revenue
ranged between 15 percent and 68 percent. As the role of expo1t taxes started diminishing in the
late 80's, which was followed by a fall in tax-to-GDP ratio, Uganda sought tax reforms that could
improve revenue collections in a sustained manner. The reibrms started with the formation of a
semi-autonomous revenue agency (Uganda Revenue Authority, URA) to collect tax revenues on
behalf of the central Government. Later in the mid 1990's VAT was introduced to replace sales
tax and Commercial Transaction Levy (CTL), and the new Income Tax Act (!TA) (1997) replaced
the Income tax decree (1974). These tax reforms partly attributed to the increase in the tax-to-GDP
to 13.6 percent by end of2003/04, from its low level of7.8 percent in the pre-reform period and
thus affecting the growth of smail and medium enterprises.
According to Chen Loo & Keng Ho, (2005), an appropriate compliance can only be realized when
taxpayers liability is correctly computed, after taking into account all factors that have a bearing
on the tax liability. The taxpayer has to be competent to comprehend the income tax law and the
administrative procedures, given the complexities, uncertainties and ambiguities of the tax law,
rules and administrative procedures. Therefore, taxpayers who are tax illiterate or inadequately
informed may either be under-pitying or over-paying taxes. As well, the revenue authority has to
provide adequate resources to meet the needs of enhancing taxpayer functional literacy elements
in terms of skills and knowledge required to deal with tax matters and provide understanding about
tax systems.
In Uganda the tax systems and reforms of 1997 were implemented as a means of increasing the
government's revenue in a sustainable manner. It was expected that the revenue raised would be
used to support the government's poverty reduction interventions as identified in its Poverty
Eradication Action Plan (PEAP). But morethaa 40 percent of public spending in pove1ty reduction
activities is supported by donors. Tax revenue as a share of Gross Domestic Product (GDP)

increased from 10.8 percent in 1997/98 to only 13.6 percent in 2003/04. Uganda like many other
developing countries tax revenue as a share of the GDP remains small, constraining the
government's overall expenditure capacity and strict imposed rules in small and medium
e;nterprises.
All businesses in Kampala Central Division adhere to different forms of taxes and different
taxation systems are employed. At leas! 50 small scale :ind medium enterprises pay taxes to the
government. The small scale businesses are locally mirned and managed by private individuals
who sometimes employ their family members and s0me medium enterprises are owned by a group
of individuals and cooperatives. It's clear that both small scale and medium enterprises bear a wide
tax burden which has led to poor performance. Therefore, it was against this background that the
researcher undertook the study to investigate more about tax systems and growth of small and
medium enterprises in Kampala Central Division.
1.2 Statement of the problem
Despite of the tax systems in plac~-such as progrcssiv_e tax, corp_orate tax and regressive taxes
introduced to improve on Sl\1E's, th~ performance_ of SMES has not improved and one wonders
why they are still performing poorly. Therefore, the study is to establish the r_elationship between
tax system and grovvth of Small Scale and Medium Enterprises in Kampala central division,
Uganda.
1.3 Purpose of the study
The purpose of the study was to investigate tax system and growth of small and medium
enterprises i::i Kampala Central Divis:on, U~anda.
1.4 Objeetives of the study
i. To examine the effect of progressive t::ix on growth of SMEs in Kampala central division.
ii. To examine the effect of corporation tax on growth of SMEs in Kampala central division.
iii. To examine the effect ofregressi.ve tax on growth of SMEs in Kampala central division.
" J
1.5 Research questions
i. How does progressive tax affect growth of SMEs in Kampala central division?
ii. How does corporation tax affect growth of SMEs in Kampala central division?
iii. How does regressive tax affect growth of SMEs in Kampala central division?
1.6 Scope of the study
1.6.1 Subject scope
The study covered small scale and medium enterprises in Kampala Central Division. Specifically,
the study investigated the tax systems and growth of small scale and medium enterprises. The
researcher divided the topic inform of objectives which were to; examine the effect of progressive
tax on growth of SMEs in Kampala central division, examine the effect of corporation tax on
growth of SMEs in Kampala central division and to examine the effect ofregressive tax on growth
of SMEs in Kampala central division.
1.6.2 Geographical scope
The study was carried out in BIDCO, Kampala ce_ntral division, Kampala district. The area was
purposely selected because the researcher stays within the vicinity and therefore this eased data
collection.
1.6.3 Time scope
The study was carried out for the period between 2013 to 2016. This was considered because it
was appropriate eno,1gh for th~ researcher to get the required information about the topic of the
study. This period was also selected to enable the researcher come up with coherent information
from the respondents as it enabled the respo_ndents to give responses that were typical of their
opinion from the observations made over this period.
1.7 Significance of the study
The findings of tht: study are signif:c&nt on the following ways; 4

To scholars and researchers, the findings of the study are expected to contribute to the existing
literature about taxation and small and medium enterprises.
To the tax authority and government, the study will guide them in adjusting tax policies and tax
systems to suit requirements of small scale and medium enterprises.
To future academicians especially of Kampala International University, the study will help in
gaining insight about tax systems and growth of sr.1all scale and medium enterprises.
The accomplishment of the study wil! enable the researcher to acquire hands on skills about
processing of research work and data anc.lysis. This proficiency will enable the researcher to handle
such related work with a lot of precision and proficiency.
5
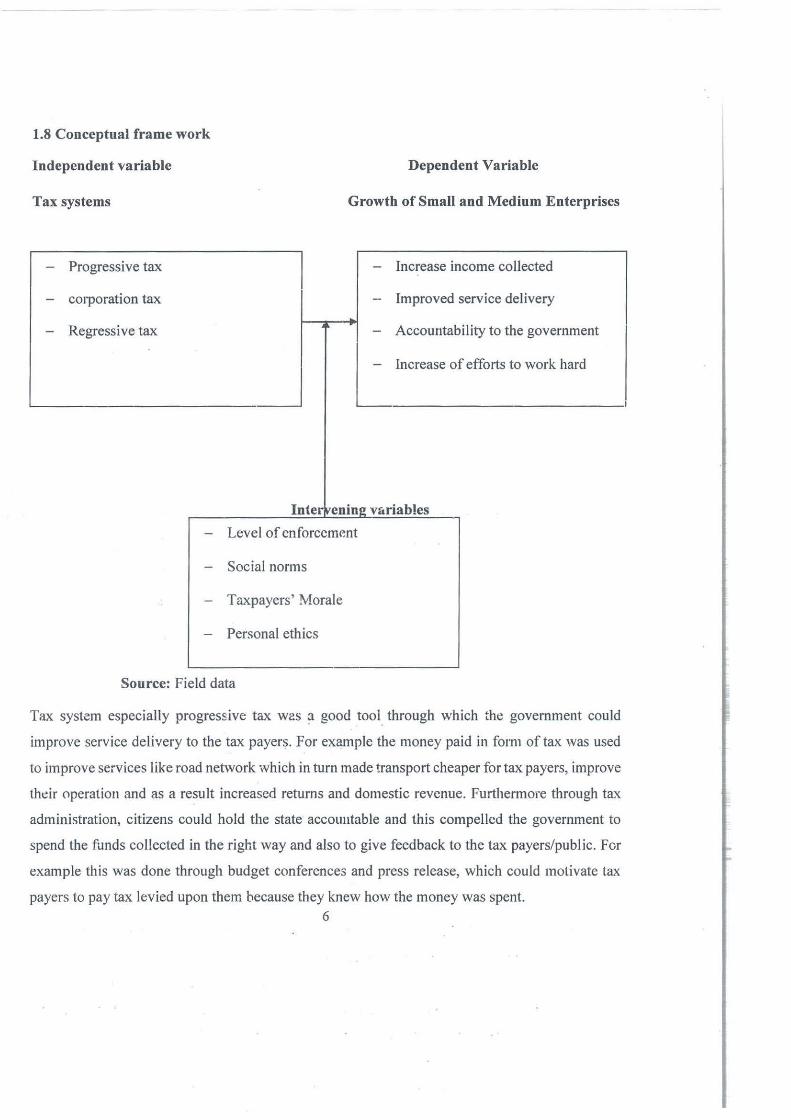
1.8 Conceptual frame work
Independent variable
Tax systems
- Progressive tax
- corporation tax
- Regressive tax
-
-
-
-
Dependent Variable
Growth of Small and Medium Enterprises
- Increase income collected
- Improved service delivery . ·~ .
Accountability to the government -
- Increase of efforts to work hard
Inter venine: v&riables
Level of enforcement
Social norms
Taxpayers' Morale
Personal ethics
Source: Field data
Tax system especially progres~ive tax was ;i good tool through which the government could
improve service delivery to the tax payer~. For example the money paid in form of tax was used
to improve services like road network ·,vhich in turn made transport cheaper for tax payers, improve
thdr operation and as a result increased returns and domestic revenue. Furthermore through tax
administration, citizens could hold the state accountable and this compelled the government to
spend the fonds collected in the right way and also to give feedback to the tax payers/public. For
example this was done through budget conferences and press release, which could motivate tax
payers to pay tax levied upon them because they knew how the money was spent. 6
I

Good and efficient tax administration of tax systems can increase the level of domestic revenue
collected. This was possible especially when the funds collected were correctly registered and
allocated to the right purpose.
'7 I
CHAPTER TWO
LITERATURE REVIEW
2.0 Introduction.
In this literature review, several materials for example textbooks, magazines, pamphlets
newspapers and the internet were consulted. This chapter provided literature on objectives of the
study.
2.1 Effect of progressive tax on growth of SMEs
A progressive tax is a tax where the tax rate increases as the taxable base amount increases. The
tem1 "progressive" refers to the way the tax rate progresses from low to high, with the result that
a taxpayer's average tax rate is less than the person's marginal tax rate. The term can be applied
to individual taxes or to a tax system as a whole; a year, multi-year, or lifetime. Progressive taxes
are imposed in an attempt to reduce the tax incidence of people with a lower ability-to-pay, as such
taxes shift the incidence increasingly to those with a higher ability-to-pay. The opposite of a
progressive tax is a regressive tax, where the relative tax rate or burden decreases as an individual's
ability to pay increases.
Progressive taxation is a form taxation where the taxpayer's tax base and liability are ascertained
basing on estimation ofactual activity. It is levied to combat avoidance; evasion buttressed by high
costs of verification and detection; and compliance difficulty, because of the nature of the activity
or perhaps at the lower income reaches, ignorance of procedures (Rajaraman, 1995). In Uganda,
progressive taxation is meant to be used when charging income taxes on the incomes of small and
medium enterprises. In Uganda, progressive taxation is meant to be used when charging income
taxes on the incomes of small and medium enterprises. The small and medium enterprises are most
of the time considered to make up the informal sector and normally do not keep records.
It is apparent that preferences for p·rogressivity in response· to conciete questions differ
significantly from abstract questions. Blum and Kalven (1953); Keene (1983) have suggested that
the complexities of progressive taxation may not be well understood by the general public. If the
8
consequences of progressive taxation are not well under- stood, then the results of surveys that
rely solely on abstract questions to determine public support for progressive or flat tax rates may
be misleading. In order to better describe the preferences for fair tax rates among the public,
researchers should consider using multiple methods, including more concrete frames, and
questions that allow a determination of the respondents understanding of tax terminology.
Progressive taxes are primarily aimed at financing public expenditures. Progressive taxes are also
used to promote other objectives, such as equity, and to address social and economic concerns.
They need to be set up to minimize taxpayers" compliance costs and government. The
administrative cost, while also discouraging tax avoidance and eyasion. But taxes also affect the
decisions of households to save, supply labour and invest in human capital, the decisions of firms
to produce, create jobs, invest and innovate, as well as the choice of savings channels and assets
by investors. What matters for these decisions is not only the level of taxes but also the way in
which different tax instruments are designed and combined to generate revenues (what this paper
will henceforth refer to as tax structures). The effects of tax levels and tax structures on agents"
economic behaviour arc likely to be reflected in overall living standards. Recognizing this, over
the past decades many OECD countries have undertaken structural reforms in their tax systems.
Most of the personal income tax reforms have tried to create a fiscal environment that encourages
saving, investment, entrepreneurship and provides increased work incentives. Likewise, most
corporate tax reforms have been ririven by the desire to promote cor,1petition and avoid tax-induced
distortions. Almost all of these tax reforms can be characterized as involving rate cuts and base
broadening in order to improve efficiency, while at the same time maintain tax revenues.
According to Mwenney (2003) Progressive tax syslem will need to consider the design of tax
systems in other countries, since countries are increasingly using their tax systems to improve their
ability tu compete in global m:!rkets. Globalization may also increase the opportunities for tax
avoidance and evasion especially as concerns mobile capital fr1come tax bases. Therefore, the
mobi I ity of the tax base plays some part in the design of tax reforms at the national level, and ,·
increased international tax policy cooperation among countries may allow for efficiency gains in
some areas.
9

Progressive tax system refers to a method of collecting taxes from tax payers using the gross annual
flirnovcr 1997). The income tax liability of the tax payers is determined without using financial
reports. The progressive method applies to resident, non-professionals with a gross annual turnover
ci not exceeding fifty million shilling (Akileng, 2006). This tax system does not apply to resident's
tax payers who are in the business of providing medical, dental, architectural, engineering,
accounting, legal or other professional services, public entertainer's public utility services and
construction services (1TA 1997 and Waliya 2005).
Braithwaite, V. (2009) argues that Self-Employment Tax is a social security and Medicare tax
imposed en freelancl.)rs and other self-employed workers. I It is identical to the social security tax
withheld from the pay of most workers, but because they are required to contribute both the
employer and the employee portions of the social security tax, the self-employed pay at :'l rate of
15.3% of net earnings double the amount paid by traditional employees The high social security
tax rate is a significant expense for many independent workers. Is it reasonable to require the self
employed to pay double social security taxes because they can be considered both the employer
and the employee, despite the fact th<!t they·aro a single worker? As the number of self- employed
workers grows, it may become time to consider strategies aimed at equalizing the social security
tax burden across all workers.
According to most political philosophies, taxes are justified as· they fund activities that are
necessary and beneficial to society. Addilionally, p:-ogressive taxation can be used to reduce
economic inequality in a society. According to this view, taxation in modern nation-states benefits
the majority of the population and social development. A common presentation of this view,
paraphrasing various· statements by Oliver Wendell Holmes, Jr. is Taxes are the price of civilization.
2.2 The effect of co:-.poration tax ou grow~t of SNlEs.
There have been severe.I writers who have talked about the cor:-elation cf corporation tax and
growth of small and medium erlterpiises. For example (Bird, 1992); (IMF, Jakarata 2000) noted
that improvement :n corporation tax woul<l lead to .ir.~re~sed revenue pt!rformance. In China,
corporation tax has led to increased contribution to the total revenue collection. More sources of
revenue were identified: corporation tax was able to contribute 61.6% to total revenue in 1995
10
~ ,: • J

from 7.8% in 1952. (IMF, China, October 2000). The same is the case for Malaysia and Singapore
(IMF. S. I I Asia studies 200 I).
Corporate taxes, influence productivity in several ways. Evidence in this study suggests that
towering statutory corporate tax rates can lead to particularly large productivity gains in firms that
are dynamic and profitable, i.e. those that can make the largest contribution to GDP growth. It also
appears that corporate taxes adversely influence productivity in all firms except in young and small
firms since these firms are often not very prcfitable. One possible implication is that tax
exemptions or reduced statutory corp0rate tax rates for small firm5 might be much less effective
in rais;ng productivity than a generalized reducti:.in in the overall stelutory corporate tax rnte. This
reduction could be financed by scaling down ex0mptions granted on firm size as they may only
waste resources without any substantial positive growth effects.
A widely-used policy avenue to improve productivity is to stimulate private-sector innovative
activity by giving tax incentives to R&D expenditure. This study finds that the effect of these tax
incentives on productivity appears to be relatively modest, although it is larger for industries that
are structurally mere R&D intensive. Nonetheless,' tax incentives have been found to have a
stronger effect on R&D expenditure than direct fimdlng. Lower corporate and labour taxes may
aiso epcourage inbcur.d fo~cign direct investment, wnici, has bee,1 f'"1und tc increase productivity
of resident firms. In addition, multinational eateq.,ris~s are attrnc:eJ by.tax systems that are stable
and p1:edictable, and which are administered in an efficier:t and transparent manner.
Corpt>rate tax is where a government authority determines the tax i·evcnue of organization:!! units
by identifying eligible taxpayers, assessing through setting the tax rate, collecting and sensitizing
the potential tax payers Bailey (I 999). As a reliable source of revenue, corporate tax as observed
by Musgrnve and Musgrave (1989) is the major representative of wealth taxation and third most
important tax in !he United Strrtcs and continues to dominate local taxation (US Statistics of
income, 20.05) The fimct:cins .. of the· Domestic Direct T~xes (DDT) m<i to ensur0 gnalily, timely
corporatimi t~xes a·J1Tl.inistr2.tio.a. The t:Xe:, i'nVoivcJ ~;e co;·pora~i·cn tax; individual inCome tax,
Pay as you c~rn (PA '{E) rGntal tax a1~d withhold[r.g tax. Co~poration !ax is ta:; ·1evid on the income
1 I
' ..
I I f,
I II I.
II r
I
I
ofcompanies following enactment of the Income Tax Act 1997 as amended to sustain the country's
growth.
Compulsory taxation of individuals, such as income tax, is often justified on grounds including
territorial sovereignty, and the social contract. Defenders of business taxation argue that it is an
efficient method of taxing income that ultimately flows to individuals, or that separate taxation of
business is justified on the grounds that commercial activity necessarily involves use of publicly
established and maintained economic infrastructure, and that businesses are in effect charged for
this use. Georgis! economists argue that all of the economic rent collected from natural resources
(land, mineral extraction, fishing quotas, etc.) is unearned income, and belongs to the community
rather than any individual.
2.3 The effect of regressive tax on growth of SMEs
According to Tindimwebwa (1999), basically regressive taxation is a method of determining
income and tax liability of small business taxpayers with the view of widening the tax base and
increasing the tax revenue yield. Rajaraman (1995) explains that the type of indicator selected
determines the form of presumption chosen and categories the indicators into; measures of entity
specific flows at either the output or input ends of the activity, stock measures of income
generating capacity or an income average across enterprises. In Uganda, the indicator ofestimation
used is the gcoss anr:ual turnover without dependence on financial accounting reports (Income fax
Act. l 997). The residents and nonµrofossional businesses with a gross turnover not exceeding fifty
million shillings are at liberty to use this system. Irrespective of the tax reforn1s to include small
and medium enterprises in Uganda's tax system, the non-compliance rate among the SMEs has
remained high (Sserwanga, 2003).
Sunley et al. (1996), recognizes the complex and complicated nature of taxation of small business
that existed under the deposit system before 1995, in making a recommendation for Uganda to re
adopt a form of regressive income taxation for sm~ll b~isiness enterprises based upon standard
assessments did not shO\v whether it was ari efficient kill'.l ofta'x for small business tax payers as
to qualify fer a good tax system.
12 I
I

As pointed out by Bird and Wallace (2004) the critical issue is whether these regressive methods
of taxation are really effective first in bringing firms into the formal economy and then, after few
years, forcing them to move into the normal tax system, while minimizing the number of firms
that move from the normal tax regime into the simplified one. The main problem is that these
objectives arc to some extent inconsistent. To be attractive for informal firms the methods need
not to be simple and based on readily available information to reduce compliance costs (Araujo,
Bonjean and Chambas, 2004), they should also provide for an effective taxation that will be lower
than that based on the normal tax rules. However, this would discourage them from moving into
the normal tax regime and attract firms that are in the formal sector to move to the regressive
regime, resulting in loss of revenue to the Tax Authority. One solution to this conundrum might
be a periodical revision of the threshold for eligibility for the simplified regime.
Many low-income countries have a tax-to-GDP ratio of less than 15% which could he due to low
tax potential, such as a limited taxable economic activity, or Low tax effort due to policy choice,
non-compliance, or administrative constraints. Some low-income countries have relatively high
tax-to- GOP ratios due to resource tax revenues (e.g. Angola) or relatively efficient tax
administration (e.g. Kenya, Brazil) whereas some middle-income countries have lower tax-to
GOP ratios (e.g. Malaysia) which reflect a more tax-friendly policy choice. Whiie overall tax
revenues have remained broadly const~nt, the global trend shows trade taxes have been declining
as a proportion of total revenues (IMF, 2011 ), with the share of revenue shifting away from border
trade taxes towards domestically levied sales taxes on goods and services. Low-income countries
tend to have a higher dependence on wade taxes, and a smaller proportion of from income and
consumption taxes, when compared to high income countries.
Regressive systems based on indicators have become increasingly popular in transition countries,
these systems aim at being more precise than turnover - based systems in estimating the profit
potential of the individual entrepreneur (Hughes, 1999). Howe.ver, this brings up a clear conflict
of the objective. The objecti,1e to tax the true potential profit of the small business conflicts with
tli~ objective to design a simple and transpa:·ent system policy makers in transition countries face
considerable difficulties designing indicator based systems that est?.blish a:'i acceptable balance
these objectives. Systems tend to be cxfremely complicated and unclear or tr.ey do not sufficiently
13

differentiate between business activities (Drake, 2000). The latter is in case Georgia, where
regressive system only distinguishes between five groups of activities. The gap left will be filled
by the current study using the case study of Uganda.
14
CHAPTER THREE
METHODOLOGY
3.0 Introduction
This chapter deals with research design, research population, sample size, instrumentation,
validity, reliability, data gathering procedures, data analysis, ethical considerations and limitations
of the study.
3.1 Research Design
This research study employed a descriptive correlational survey research design. The study was
descriptive since it describes the indicators of taxation and their effect on SMEs performance in
Kampala. The correlational design related the two variables of the study; taxation and their effect
on SMEs performance in Kampala includiI}g the di~ensions of regressive, progressive and
corporation taxes.
3.2 Research Population
According to Diamantopoulos et al., (2000), population is the totality of an entities in which the
researcher has an interest, means it is the collection of individuals, objects or events in which the
researchc.- wants to make inferences. The target popul?.tion of the ~tudy was selected frcm tile
business communit-; in BIDCO especially those with Small and medium enterprises. This study
intended to tackle a group of 100 business owners of the market. The total population therefore
was amount to 100; these was selected for data collection.
3.2.1 Sample Size
From the estimated population of 100, a sample size was determined using Slovene's Formula to
come up with appropriate sample size t0 b~ ust:d in the stl,ldy . .
Solven's Formula states tha~, given a population, the minimum Sa~ple size is given by:
15

Where; n = the sample size
n = total population of targeted respondents 100
a= the level of significance, that is 0.05
n= N
l+Na2
n = 100
1+100(0.05)2
n = 100
I+ JOO *0.0025
n = 100
1.25
N = 80
Therefore, the sample size was be 80
3.2.2 Sampling techniques and Procedure
It's the process of extracting a pc,rtion of the population from which generalization to the
population can be made, lsman, A. et ai. (2003) Because of resource constraints, a small sample
was chosen and handled using stratified sampling procedure to select the sample population and
the respective people for data collection. Then the researcher selected simple random sample
independently from each Sub-population. Purposive sampling was used in the selection of
management of the market, these is because these arc perceived to have more suitable information
so purposive sampling enabled the attaining data from those officials with key knowledge on
taxation policy in the market.
16

3.3 Sources of data
In this study two types of data were used by the researcher, in that secondary and primary data
were used.
3.3.1 Primary data
Primary data is that data collected afresh and for the first time, has not been processed (Mugenda,
2006). Primary data was gathered basically through structured questionnaires and
interviews involving the selection of respondents to provide information.
3.3.2 Secondary data
Secondary data is information which has been already collected by someone else for other
purposes and can be used to compile data or raw dat:i. Secondary data was obtained through notes,
correspondences and minutes of meetings from, jo:.imals published in majorly on the taxation
policies and their subsequent effect on SMEs performance.
3.4 Data collection Methods
3.4.1 Questionnaire method
This is a technique in which the researcher gave a list of short questions to the respondents
requesting them to fill and collect them later. Closed ended questions designed to suit the
objectives were used to effectively attain data for the study. The approved questionnaires were
hand delivered to the respmidents ofBIDCO by the researcher and or any other research assistant
to be appointed by the researcher. The researcher designed a questionnaire on taxation and
performance of SMEs in KampaJa on 4 point scale rating. Therefore, a 4 point likcrt scale self
administered questionnaire comprising of statements and responses ranging from 1 =Strongly
Disagree to 4=Strongly Agree was formulated. Questionnaires were designed to capture all the
aspects of the objectives of the study.
17 ·
3.4.2 Interview method
The interview is one of the data collection methods. Rather than asking respondents to fill out
questionnaires, interviewers ask questions orally and simultaneously record the respondents'
answers. This data collection method generally decreases the number of the respondents that do
not know the answers compared with self-administered surveys. Interviewers also provide a guard
against confusing items. If a respondent has misunderstood a question, the interviewer can clarify,
thereby obtaining relevant responses.
3.5 Validity and reliability of researeh instrument
3.5.1 Validity
To ensure that the instrument used was valid, face validity was done by the supervisors and other
research consultants. Content validit}' index was also ascertained by the researcher and her
supervisor. These authorities declared the instrument valid and suitable for use in the study.
3.5.2 Reliability
The instrumeut was piloted on a few r~spondents that were not included in the study sample and
modified to improve their validity and reliability coefficients to at least 0.70. Items with validity
and reliability coefficients of at least 0.70 were accepted as valid and reliable in research Amin,
(2005). Reliability estimates the consistency of the _measurement. The reliability test involves a
"test and retest" exercise. This means -the instruments were subjected to a representative sample.
According to Amin (2005) validity of instrument is determined by the formula:
CVI = RQ TQ
Legends: CVI =Content Validity Index RQ = Relevant Questions
TQ = Total number of Questions
18
3.6 Data Processing and Analysis
During and after data collection, the researcher used different methods to process the data that was
collected so as to come up with a report that is easy to interpret and understand. Quantitative data
and information collected using questionnaires and responses from numerous respondents were
coded. (Open-ended questions was also coded appropriately), and entered and analyzed using
tables. The data again was presented inform of descriptive analysis, tables and graphs. The findings
was then been determined arising from the analysis and interpretation of information.
3.7 Ethical Considerations
The respondents were protected by keeping the information given confidential and where there is
a need to reveal, consent was first obtained.
The questionnaires were not including the names of the respondents for issue of privacy and
secrecy.
After the collection of data, questionnaires -were destroyed so that collected information doesn't
leak.
3.8 Limitations of the Study
It was not easy to locate the respondents the fact that these respondents were widely spread and
conducted their activities from different departments, this hindered data collection. The researcher
however designed a structured questionnaire that enabled respondents fill in their free time.
f'i!:ancial constraints, it was difficult for the researcher to raise enough funds for the research study.
The researcher used the fonds saved sparingly so that it could fund the entire budget.
The time frame was too limited to allow the researcher gather meaningful data and also make
realistic conclusions. The researcher ensured that the set time for the research was adhered to and
timely data collection accomplished the research.
19

CHAPTER FOUR
PRESENTATION, INTERPRETATION AND ANALYSIS OF FINDINGS
4.0 Introduction
This chapter comprises of the findings that were gathered by the researcher from BIDCO Uganda
in relation to the topic; Impact of taxation on growth of small and medium enterprises. The data is
presented and interpreted in view of the objectives mentioned in chapter one of this research. The
interpretation also seeks to answer the research questions that were raised in chapter one.
Presentation and interpretation of data in this chapter has been done with the aid of quantitative
and qualitative methods for example the use of tables, graphs, percentages and personal analysis
and interpretation presented in essay form. Questionnaires were provided to 80 respondents who
filled them to the best of their knowledge.
4.1 Demographic Characteristics 4.1.1 Gender of respondents Table i: Showing Gender respondents
Respondents Frequency Percentage
Male 50 63
Female 30 37
Total 80 100
Source: Field data
Figure i: Showing Gender respondents
GENDER OF RESPONDENTS IN PERCENTAGE
• Male • Female
Source: Field data
20
- ,- - --
From the table and figure above, it can be seen that the majority of respondents are mal
respondents representing 63% of the total respondents and 30 respondents are female rep
37% of the respondents. From the above presentation, it is clear that though man
respondents were male representing the highest percentage, the issue of gender sens
ethatis 50
resenting
y of the
itivity was
adhered to by few female who were selected.
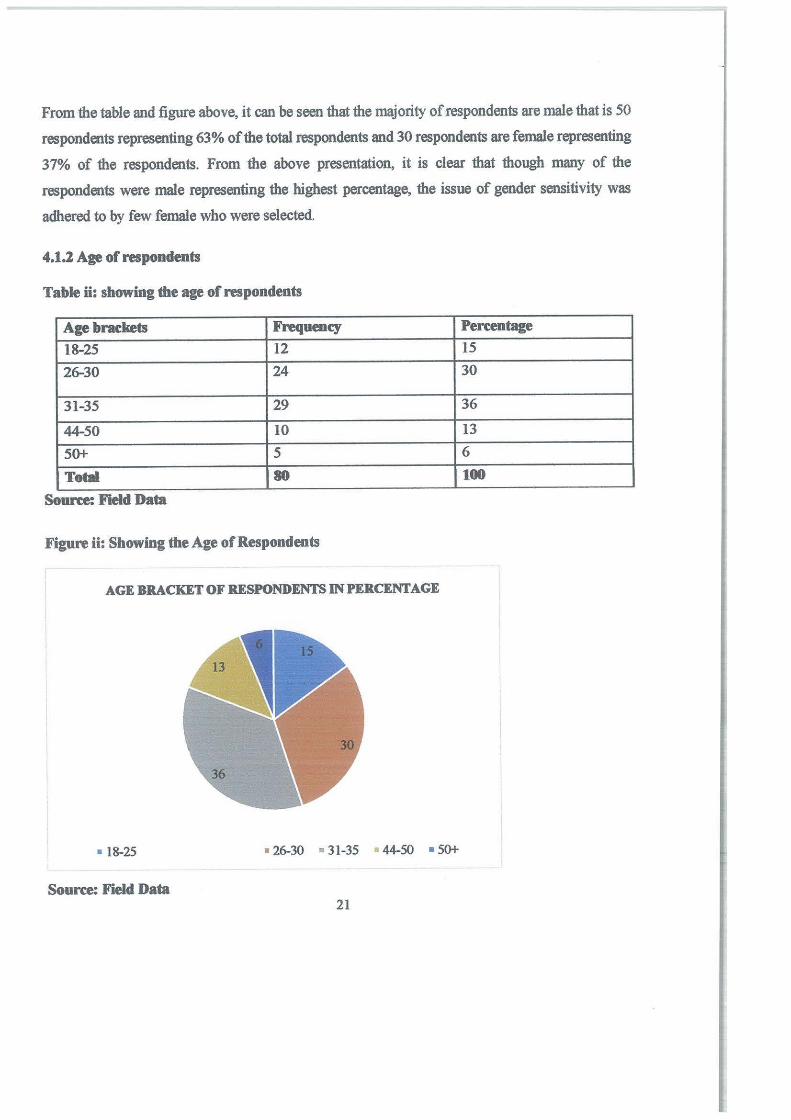
4.1.2 Age of respondents
Table ii: showing the age of respondents
Age brackets Frequency Percentage
18-25 12 15
26-30 24 30
31-35 29 36
44-50 10 13
so+ 5 6
Teal 80 100
Source: Field Data
Figure ii: Showing the Age of Respondents
AGEBRACKETOFRESPONDENTSINPERCENTAGE
• 18-25 • 26-30 • 31-35 44-50 • so+
Source: Field Da1a 21
· .cc_~ ~ --·--~-
I:
I•
i,
11 1:
!i p , I :
I:
1; 1: 1;:
1,
I •
'"
- ---
bracket of 31-35 has the highest percentage From the table and figure above, it is clear that the age
of 36% of the total respondents because they were cons
to contribute much information towards the subject of
who fall in the age bracket of 26-20 with 30% of total
with 15%, followed by age bracket of 44-50 with 13'¾
The bracket of 44-50 had few respondents compared t
idered to be the majority and being learned
the study. This was followed by respondents
respondents and followed by those of 18-25
o and finally 5 respondents representing 6%.
o other people who fall in other age brackets.
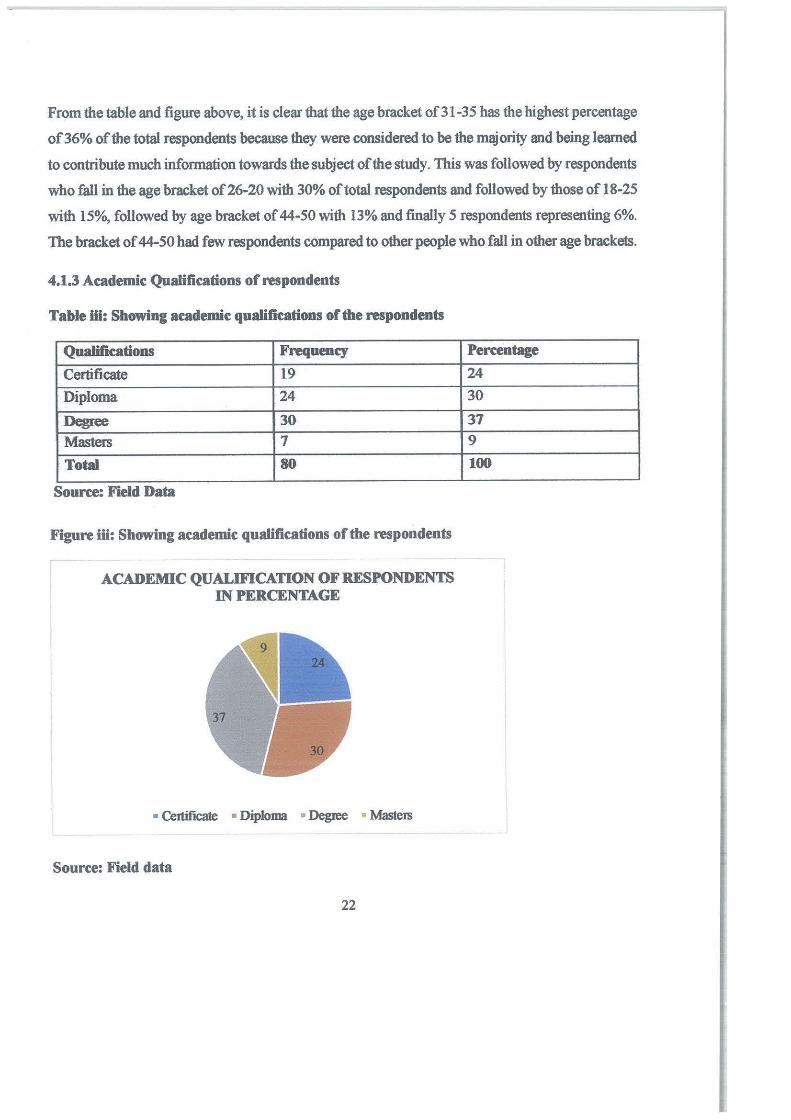
4.1.3 Academic Qualifications of respondents
pondents Table iii: Showing academic qualifications of ffle res
Qualifications Frequency
Certificate 19
Diploma 24
Degree 30 Masters 7
Total 80
Source: Field Data
Figure iii: Showing academic qualifications of the respondents
PONDENTS ACADEMIC QUALMCATION OF RES IN PERCENTAGE
• Certificate • Diploma • Degree • Maste IS
Source: Field data
22
Percentage
24
30
37
9
100
1::
1:,
:;:
!: 1,
I •
1:
ii Ii
1,
;,
u
From the above table and figure, it is seen that that the majority of the attendants in BIDCO Uganda:
are degree holders representing 37% followed by diploma holders at 300/o followed by
certificate holders representing 24% and finally others by masters holder respondents representing
a total percentage of 9% of the total respondents. This implies that the respondents from BIDCO
Uganda are well educated and therefore the information obtained from them can be relied upon
for the purpose of this study.
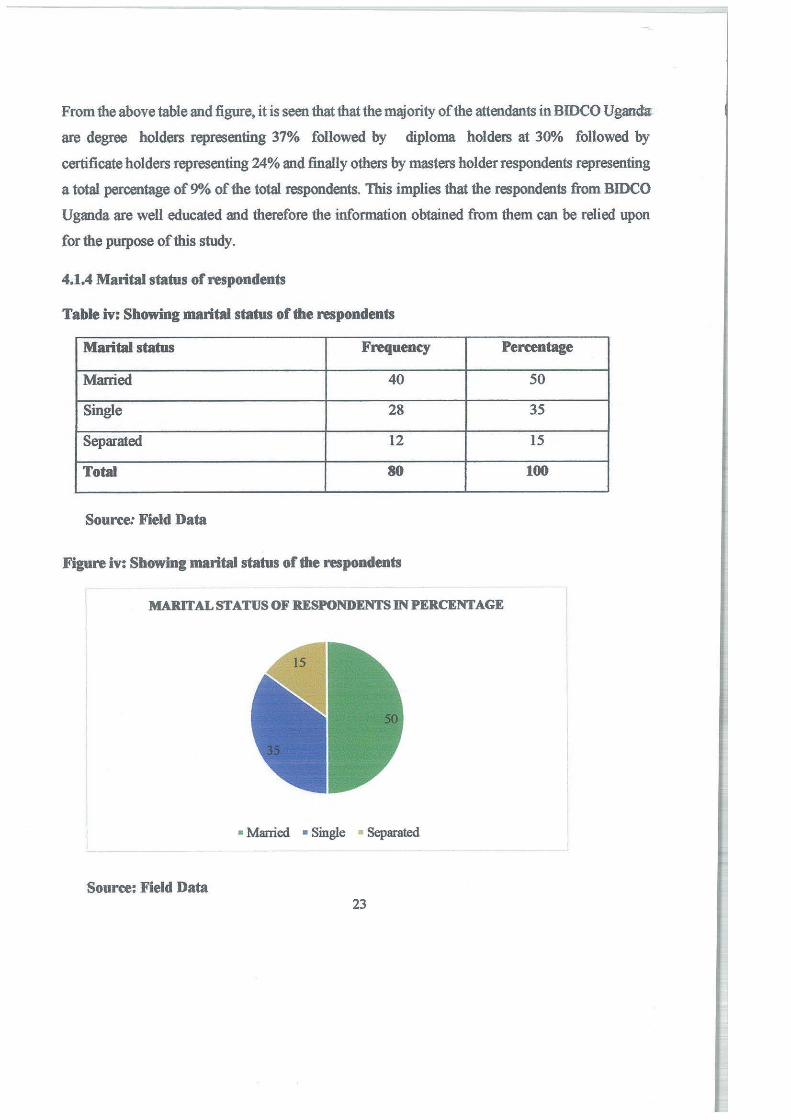
4.1.4 Marital status of respondents
Table iv: Showing marital status of the respondents
Marital status Frequency Percentage
Married 40 50
Single 28 35
Separated 12 15
Total 80 100
Source: Field Data
Figure iv: Showing marital status of the respondents
MAlllTALSTATUSOFRESPONDENTSINPERCENTAGE
• Married • Single • Separated
Source: Field Data 23
Results in table 4 indicated that majority of the respondents were married with 50% of the
respondents followed by single with 28 respondent with 35%, followed by separated with 15% of
respondents. This implies that the respondents are well divided and belonged to all categories as
shown above but in general analysis it indicates that most people belong to organized families and
are married hence Information can therefore be relied on for making serious decisions in the
company.
4.2 The effect of progressive tax on growth of SMEs in Kampala central division
The first objective of the study was to examine the effect of progressive tax on growth of SMEs in
Kampala central division with special attention to BIDCO Uganda. Data collected presented as
below.
Table v: Showing the response on effect of progressive tax on growth of SMEs in Kampala
central division, Kampala district.
Response on the Strongly Agree Not Disagree Strongly Total
effect of Agree Sure Disagree
progressive tax on
growth of SMEs in
Kampala central
division, Kampala
district.
F % F % F % F % F % F %
Ensures that valuable 44 .55 9 11 14 17 8 10 5 6 80 100 evaluation of business
Reduce the 37 46 14 20 7 operational capacity
9 13 16 9 11 80 100
of business
24
Will direct the 26 32 16 20 11 14 13 16 14 17 80 100 growth course of the business
Provides avenues 20 25 13 16 10 13 16 14 21 19 80 100 for improved
organizational sustainabiiity
Is responsible for 31 39 11 14 6 8 15 19 17 21 80 100 improved steady operations of SMEs
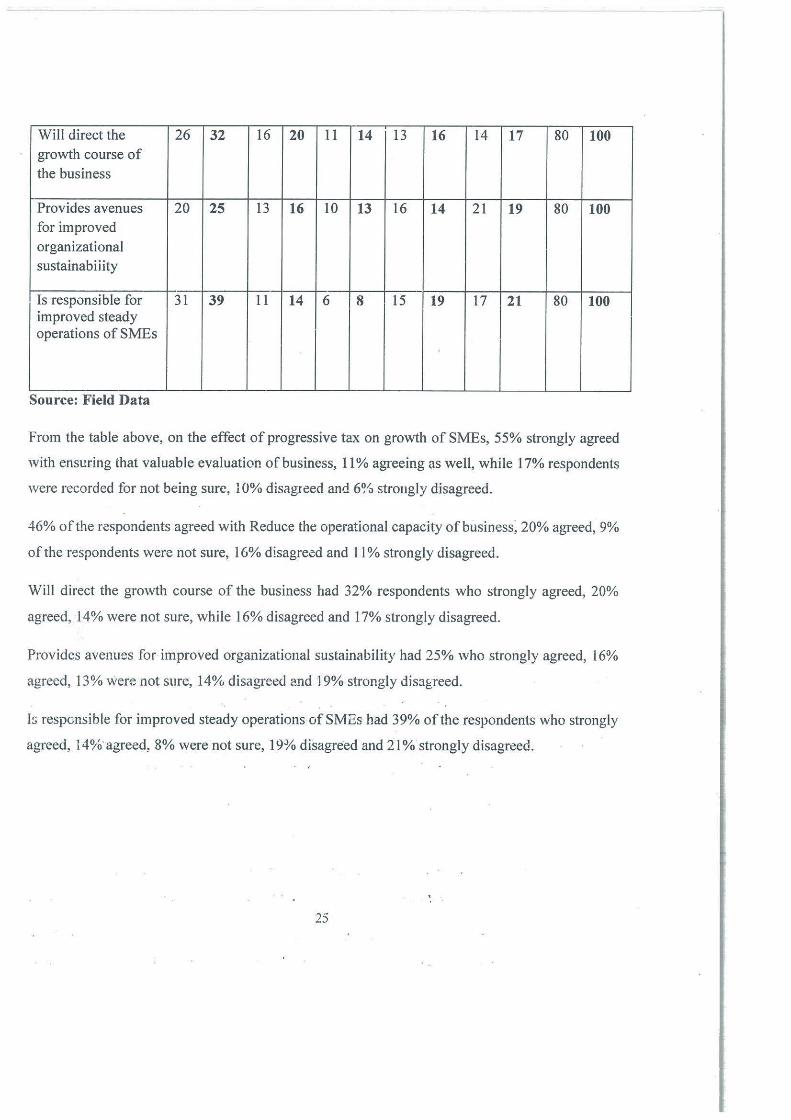
Source: Field Data
From the table above, on the effect of progressive tax on growth of SMEs, 55% strongly agreed
with ensuring that valuable evaluation of business, 11 % agreeing as well, while 17% respondents
were recorded for not being sure, 10% disagreed and 6% stro11gly disagreed.
46% of the respondents agreed with Reduce the operational capacity of business; 20% agreed, 9%
of the respondents were not sure, 16% disagreed and 11 % strongly disagreed.
Will direct the growth course of the business had 32% respondents who strongly agreed, 20%
agreed, 14% were not sure, while 16% disagreed and 17% strongly disagreed.
Provides avenues for improved organizational sustainability had 25% who strongly agreed, 16%
agreed, 13% were not sure, 14% disagreed and J 9% strongly dis:igreed.
I:; responsible for improved steady operations of SMEs had 39% of the respondents who strongly
agreed, 14%·agreed, 8% were not sure, 19¾ disagreed and 21% strongly disagreed.
25
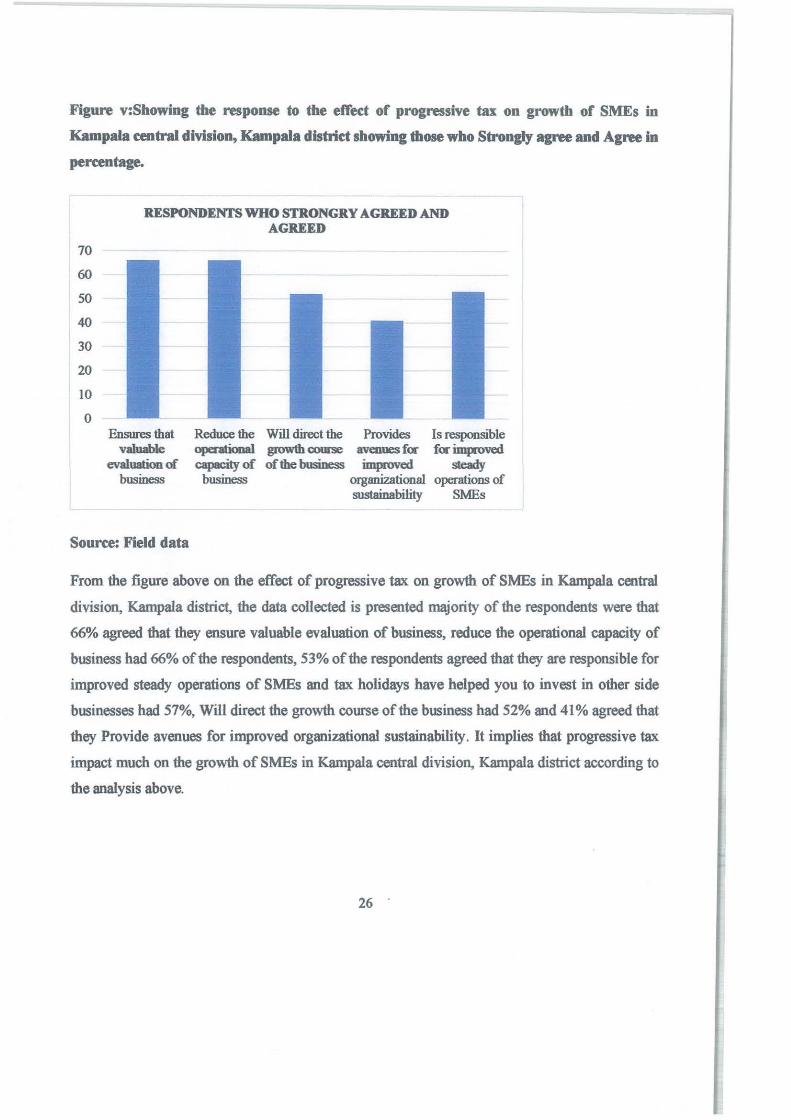
Figure v:Showing the response to the effect of progressive tax on growth of SMEs in
Kampala central division, Kampala district showing those who Strongly agree and Aaree in
percentage.
70
60
50
40
30
20
10
0
RESPONDENfS WHO STRONGRY AGRE:ED AND AGRE:ED
Ensures that valuable
evaluation of business
Reduce the opeaatiooal cai-:it:Yof
business
Will direct the Provides Is responsible growth course avenues f<r f<r improved of the business improved steady
organizational operations of sustainability SMEs
Source: Field data
From the figure above on the effect of progressive tax on growth of SMEs in Kampala central
division, Kampala district, the data collected is presented majority of the respondents were that
66% agreed that they ensure valuable evaluation of business, reduce the operational capacity of
business had 66% of the respondents, 53% of the respondents agreed that they are responsible for
improved steady operations of SMEs and tax holidays have helped you to invest in other side
businesses had 57%, Will direct the growth course of the business had 52% and 41% agreed that
they Provide avenues for improved organizational sustainability. It implies that progressive tax
impact much on the growth of SMEs in Kampala central division, Kampala district according to
the analysis above.
26 .
4.3 Effect of corporation tax on growth of SMEs in Kampala central division, Kampala
district.
The second objective of the study was to examine the effect of corporation tax on growth of SMEs
in Kampala central division, Kampala district. The responses to this objective were gathered on a
likert scale measure of I; 5 measuring responses.
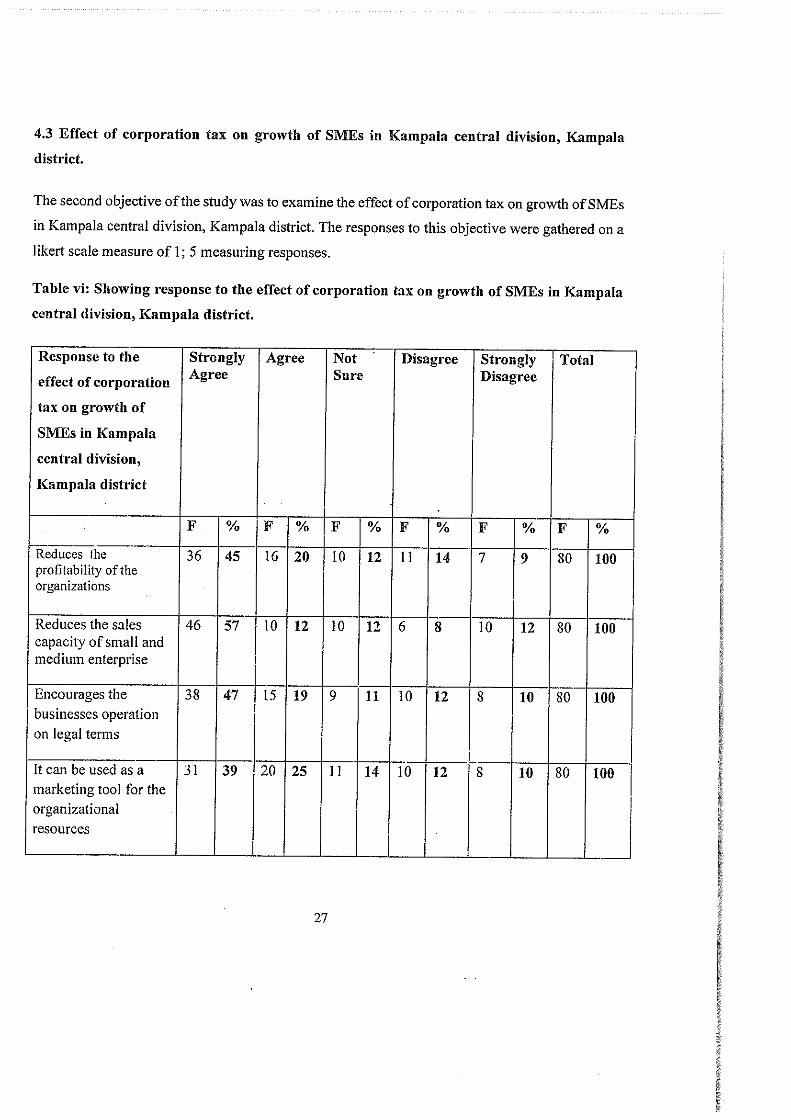
Table vi: Showing response to the effect of corporation tax on growth of SMEs in Kampala
central division, Kampala district.
Response to the Strongly Agree Not Disagree Strongly Total
effect of corporation Agree Sure Disagree
tax on growth of
SMEs in Kampala
central division,
Kampala district
F % F % F % F % F % F %
Reduces the 36 45 16 20 10 12 11 14 7 9 80 100 profitability of the organizations
Reduces the sales 46 57 10 12 10 12 6 8 10 12 80 100 capacity of small and medium enterprise
Encourages the 38 47 15 19 9 11 10 12 8 10 80 100 businesses operation
on legal terms
I
It can be used as a JI 39 20 25 11 14 10 12 8 10 80 100 marketing tool for the organizational
resources
27

Enables the legal 35 44 21 26 6 8 9 11 7 9 80 100 operation of businesses
Source: Field data
The data collected above shows that in line with the response to effect ofcorporation tax on growth
of SMEs in Kampala central division, Kampala district, corporation tax reduces the profitability
of the organizations had 45% of the respondents who strongly agreed, 20% agreed, 12% disagreed,
14% respondents were not sure and 9% strongly disagreed.
Reduces the sales capacity of small and medium enterprise had 57% of the respondents who
strongly agreed, 12% agreed, 12% disagreed, 8% of the respondents strongly disagreed and 12%
were not sure.
Encourages the businesses operation on legal terms had 47% of the respondents who strongly
agreed, 19% agreed, 11 % disagreed, 12% of the respondents were not sure and 10% strongly
disagreed.
3 9% of the respondents strongly agreed with it can be used as a marketing tool for the
organizational resources, 25% agreed, 14% disagreed and 12% of the respondents strongly
disagreed and 10% of the respondents were not sure.
Enables the legal operation of businesses had 44% of the respondents who strongly agreed, 26%
agreed, 8% were not sure, 11 % disagreed and 9% of the respondents strongly disagreed.
28
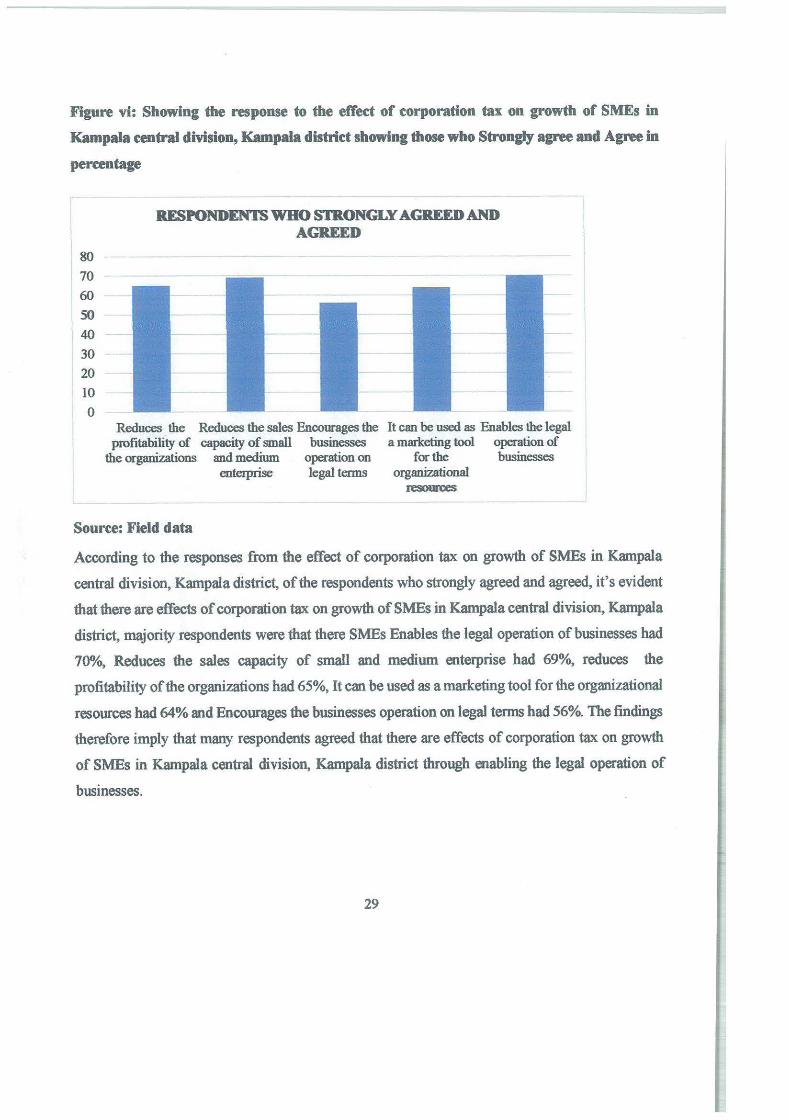
Figure vi: Showing the response to the effect of corporation tax on growth of SMEs in
Kampala central division, Kampala district showing those who StronalY aaree and Agree in
percentage
80
70
60
50
40
30
20
10
0
RESPONDENTS WHO STRONGLY AGREED AND AGREED
Reduces the Reduces the sales Encourages the profitability of capacity of small businesses
the organizations and medium operation on enterprise legal tenns
It can be used as Enables the legal a marketing tool operation of
for the businesses organizational
resouroes
Source: Field data
According to the responses from the effect of corporation tax on growth of SMEs in Kampala
central division, Kampala district, of the respondents who strongly agreed and agreed, it's evident
that there are effects of corporation tax on growth of SMEs in Kampala central division, Kampala
district, majority respondents were that there SMEs Enables the legal operation of businesses had
70%, Reduces the sales capacity of small and medium enterprise had 69%, reduces the
profitability of the organizations had 65%, It can be used as a marketing tool for the organizational
resources had 64% and Encourages the businesses operation on legal terms had 56%. The findings
therefore imply that many respondents agreed that there are effects of corporation tax on growth
of SMEs in Kampala central division, Kampala district through enabling the legal operation of
businesses.
29

4.4 The effect of regressive tax on growth of SMEs in Kampala central division, Kampala
district.
The third objective of the study was to examine the effect of regressive tax on growth of SMEs in
Kampala central division, Kampala district. The responses to this objective were gathered on a
likert scale measure of I; 5 measuring responses.
Table vii: Showing responses to the effect of regressive tax on growth of SMEs in Kampala
central division, Kampala district.
The effect of Strongly Agree Not Disagree Strongly Total
regressive tax on Agree Sure Disagree
growth of SMEs in
Kampala central
division, Kampala
district.
F % F % F % F % F % F %
Reduces the 43 54 10 12 11 14 9 11 7 9 80 100 business resources
Can contribute to 37 46 13 16 8 10 14 17 8 10 80 100 collapse of businesses
Reduces business 26 32 16 20 11 14 13 16 14 18 80 100 values affiliated to
pricing and
marketing
Reduces the 22 28 14 17 13 16 14 17 17 21 80 100 business
operational
capacities
30
Increase the 31 38 11 14 7 9 15 19 16 20 80 100 operational means of organization
Source: Field data
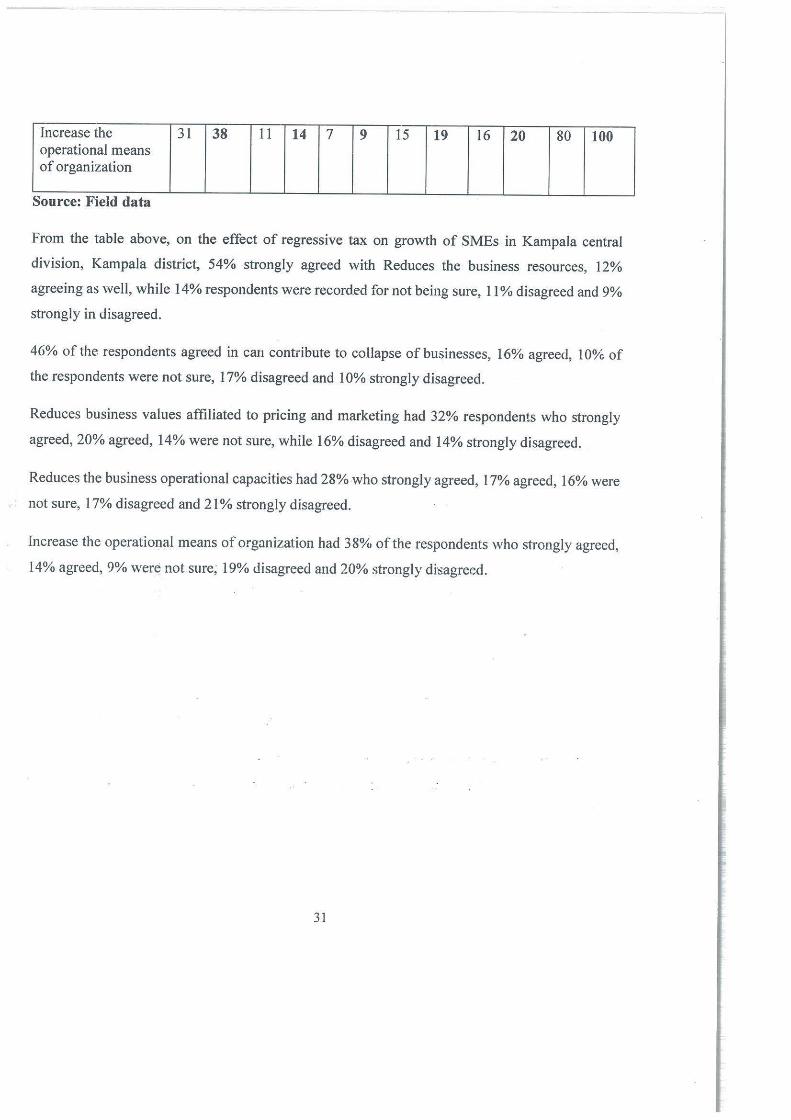
From the table above, on the effect of regressive tax on growth of SMEs in Kampala central
division, Kampala district, 54% strongly agreed with Reduces the business resources, 12%
agreeing as we.II, while 14 % respondents were recorded for not being sure, 11 % disagreed and 9%
strongly in Jisagreed.
4G% of the respondents agreed in can contribute to collapse of businesses, 16% agreed, 10% of
the respondents were not sure, 17% disagreed and 10% strongly disagreed.
Reduces business values affiliated to pricing and marketing had 32% respondents who strongly
agreed, 20% agreed, 14% were not sure, while 16% disagreed and 14% strongly disagreed.
Reduces the business operational capacities had 28%-who strongly agreed, 17% agreed, 16% were
not sure, 17% disagreed and 21 % strongly disagreed.
Increase the operational means of organization had 38% of the respondents who strongly agreed,
14% agreed, 9% were not sure; 19% disagreed and 20% strongly dh,agreed.
31
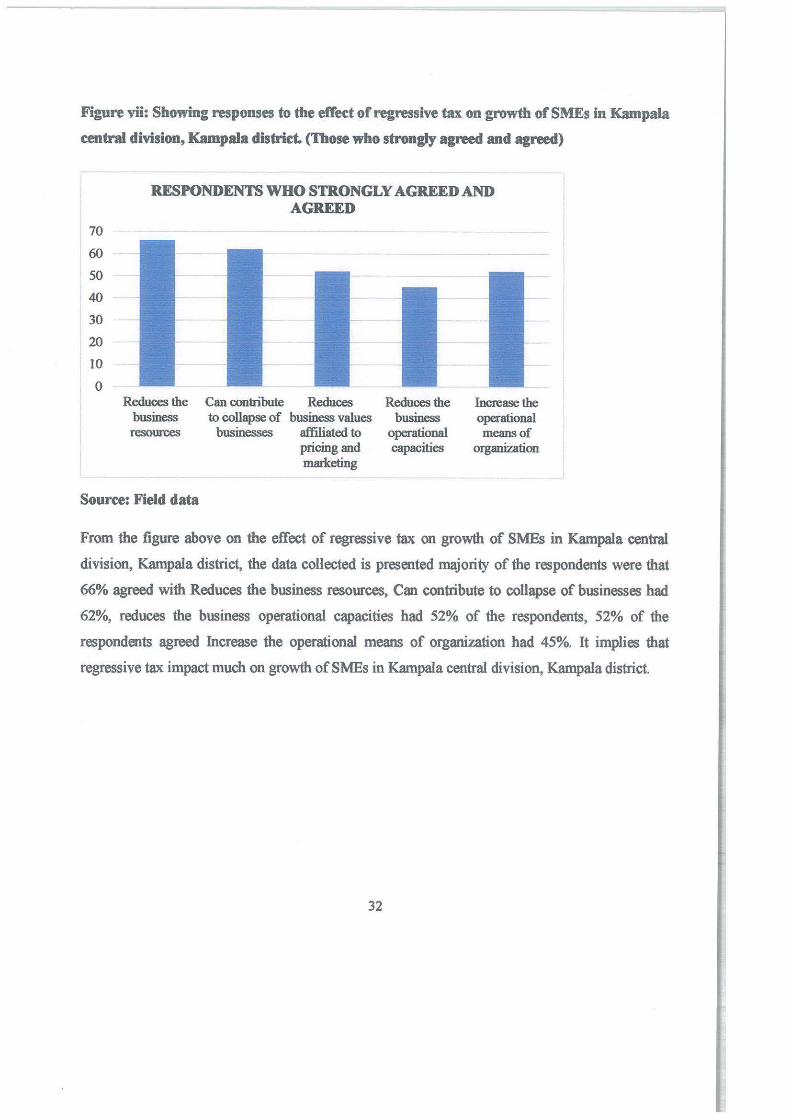
Figure vii: Showing responses to the effect of regressive tax on growth of SMEs in Kampala
central division, Kampala district. (Those who strongly agreed and aareed)
70
60
50
40
30
20
10
0
RESPONDENTS WHO STRONGLY AGREED AND AGREED
Reduces the business resources
Can contribute Reduces to collapse of business values
businesses affiliated to pricing and marlceting
Reduces the business
operational capacities
Increase the operational means of
organization
Source: Field data
From the figure above on the effect of regressive tax on growth of SMEs in Kampala central
division, Kampala district, the data collected is presented majority of the respondents were that
66% agreed with Reduces the business resources, Can contribute to collapse of businesses had
62%, reduces the business operational capacities had 52% of the respondents, 52% of the
respondents agreed Increase the operational means of organi7.ation had 45%. It implies that
regressive tax impact much on growth of SMEs in Kampala central division, Kampala district.
32
CHARPTER FIVE
SUMMARY, CONCLUSIONS, RECOMMENDATIONS AND AREAS OF FURTHER
RESEARCH
5.0 Introduction
This chapter is concerned with summary, conclusion, recommendations and suggestions about the
findings that were gathered from the case study and the areas of further research. The study was
carried out with the view to investigate tax system and growth of small and medium enterprises
(SMEs) in Kampala Central Division, Uganda. This chapter is concerned with summary,
conclusion, recommendations and suggestions about the findings that were gathered from the case
study and the areas of further research.
5.1 Summary of the findings
On the effect of progressive tax on growth ofSMEs in Kampala central division, Kampala district,
the data collected is presented majority of the respondents were that 66% agreed that they ensure
valuable evaluation of business, reduce the operational capacity of business had 66% of the
respondents, 53 % . of the respondents agreed that they arc responsible for improved steady
operations of SMEs ::aid tax holidays have helped you to invest in other side businesses had 57%,
Will direct the growth course of the business had 52% and 41 % agreed that they Provide avenues
for improved organizational sustainability.
On the effect of corporation tax on growth of SMEs in Kampala central division, Kampala district,
of the respondents who strongly agreed and agreed, it's evident that there are effects of corporation
tax on growth of SMEs in Kampala central division, Kampala district, majority respondents were
that there SMEs Enables the legal operation of businesses had 70%, Reduces the sales capacity of
small and medium enterprise had 69%, reduces the profitability of the organizations had 65%, It
can be used as a marketing tool for the organizational resources had 64% and Encourages the
businesses operation on legal terms had 56%.
33
On the effect of regressive tax on growth of SMEs in Kampala central division, Kampala district,
the data collected is presented majority of the respondents were that 66% agreed with Reduces the
business resources, Can contribute to collapse of businesses had 62%, reduces the business
operational capacities had 52% of the respondents, 52% of the respondents agreed Increase the
operational means of organization had 45%.
5.2 Conclusions
The purpose of the study was to investigate tax system and growth of small and medium enterprises
(SMEs) in Kampala Central Division, Uganda and it was carried out on the three research
objectives which included to: examine the effect of progressive tax on growth ofSMEs in Kampala
central division, examine the effect of corporation tax on growth of SMEs in Kampala central
division and to examine the effect of regressive tax on growth of SMEs in Kampala central
division, Kampala district.
The findings reveal that that progressive tax impact much on the growth of SMEs in Kampala
central division, Kampala district according to 66% respondents who agreed that they ensure
valuable evaluation of business, reduce the operational capacity of business had 66% of the
respondents, 53% of the respondents agreed that they are responsible for improved steady
operations of SMEs and tax holidays have helped you to invest in other side businesses had 57%,
Will direct the growth course of the bt:siness had 52% and 41% agreed that they Provide avenues
for improved organizational sustainability. It can be concluded that progressive tax has effects on
the growth ofSMEs in Kampala central division, Kampala district, Uganda.
The findings reveal that corporation tax has effects on growth of SMEs in Kampala central
division, Kampala district according to the respondents who strongly agreed and agreed that there
are effects of corporation tax on growth of SMEs in Kampala central division, Kampala district,
majority respondents were that there SMEs Enables the legal operation of businesses had 70%,
Reduces the sales capacity of ,mall 1.nd medium enterprise had 69%, reduces the profitability of
the organizations had 65%, rt can be used as a marketing tool for the organizational resources had
64% and Encourages the businesses operation on legal terms had 56%. It can be concluded that
34

there are effects of corporation tax on growth of SMEs in Kampala central division, Kampala
district through enabling the legal operation of businesses.
The findings reveal that regressive tax has effects the on growth of SMEs in Kampala central
division, Kampala district according to 66% respondents who agreed with Reduces the business
resources, Can contribute to collapse of businesses had 62%, reduces the business operational
capacities had 52% of the respondents, 52% of the respondents agreed Increase the operational
means of organization had 45%. It can be concluded that regressive tax impact much on growth of
Small business enterprises in Kampala central division, Kampala district.
5.3 Recommendations
Tax collection should be defined with respect to which government should collect certain taxes
from small and medium enterprises. This will avoid the government collecting taxes from the same
particular organization.
Government should also put a policy in place to avoid illegal taxes, such as community levy, boys
or youth levy and as well as association or union levy.
Taxes should be collected in relation to the sizes and profit of Small scale businesses considering
all other factors that can constrain the progress of such Small scale businesses as there is a
relatiorn:,hip between small scale businesses sizes and their ability to pay taxes.
5.4 Areas for further research
The results presented in this report may not be conclusive and should be treated as being
preliminary. Further analysis of the survey data on tax system on the performance of small and
medium enterprises needs to be done to validate these findings and provide greater confidence in
explaining the interaction of the variables. Therefore based on these there is need for further study
to be conducted on the following.
• The impact of multiple taxatio:1 on small and medium scale businesses
" An assessment on the impact of taxation on small and medium enterprises in a developing
economy
• Taxation of small and medium sized enterprises 35

REFERENCES
Adam, C. S. and O'Connell, S.A. (1999): "Aid, Taxation and Development in Sub-Saharan
Addison, T. and S. M. Murshed (2002), "Credibility and reputation in Peace Making", Journal
Africa", Economics and Politics, Volume 11(3), 225-54
Ali A.G. Au (2001), "Can Africa cut its poverty level by half by 2015?" United Nations
Allingham, M. 0., & Sandmo, A. (1972), Income tax evasion: a theoretical analysis. Journal of
Public Economics.
Aim, J., Cherry, T., Jones, M., & McKee, M. (2010). Taxpayer information assistance services
and tax compliance behavior.
Alm. J., Jackson. B., & McKee, M. (1992). Institutional uncertainty and taxpayer compliance.
American Economic Review, 82(4), 1018-1026.
Alm, J.. Sanchez, I., & Dejuan, A. (1995). Economic and noneconomic factors in tax compliance.
Kylc/os, 48(1), 3-18.
Braithwaite. V. (2009). Defiance in taxation and govirnance: resisting and dismissing authority
in a democracy. Cheltenham, Glos: Edward Elgar Publishing Ltd.
Carroll. J. (1992). Flow taxpayers think about their taxes: Frames and values. In J. Slemrod (Ed),
Why people pay taxes. Michigan: University of Michigan.
Holmes, R. Y. (2011). Forcing cooperation: A strategy for improving tax compliance. University
of Cincinnati Law Review, 79(4), 1415-1459.
IMF (1999). "Burundi: Statistical Annex", IMF Staff Country Report No. 99/8 (February).
International Monetary Fund, Washington, D. C.
Lawsky, S. B. (2009). Probably? Understanding tax law's unce11ainty. University of Pennsylvania
Law Review, 157(4), 1017-1074.
36

Minarik, Joseph J. (2008). "Taxation'. in David R. Henderson (ed). Concise Encyclopedia of
Economics (2nd ed). Library of Economics and Liberty.
Moser, D. V., Evans, J. H., & Kim, C. K. (1995). The effects of horizontal and exchange inequity
on tax reporting decisions. Accounting Review, 70(4), 619-634.
Rothengatter. M. R. (2008). 'Taxing taxis' - limits and possibilities for regulating tax compliance
behaviours of taxi-drivers an Australian case study. Doctor of Philosophy, University of
Queensland, Brisbane.
Wahl, I., Kastlunger, B., & Kirchier, E. (2010). Trust in Authorities and Power to Enforce Tax
Compliance: An Empirical Analysis of the "Slippery Slope Framework'. Law & Policy, 32( 4), 3
83-406
Wenzel. M. (2005). The multiplicity of taxpayer identities and their implications for tax ethics
Centre for Tax System Integrity, Australian National University. Canberra
37

APPENDICES
APPENDIX I: RESEARCH INSTRUMENT: QUESTIONNAIRES
Dear Sir/Madam,
I Apiny Fosca carrying out a study on impact of taxation on growth of small and medium
enterprises a case study of BIDCO Uganda, Kampala district I'm a student at Kampala
International University offering Bachelors Degree in Business Administration
I'm privileged to have you as my respondent and the information given to me is purely for
academic and will be treated with confidentiality.
In this section, you are kindly requested to tick that alternative response that fits your opinion.
SECTION (A)-DEMOGRAPIDC ASPECTS
I.Age
_ __ 18 - 25years _ _ _ 26 - 30 years ___ 31- 35 years ___ 50years
___ Above 50 years
2. Gender ___ Male
___ Female
3. Qualification academically
___ Certificate
___ Diploma
_ __ Degree
___ Masters
38

4. Marital status
___ single
___ Married
___ Separated/divorced
Direction: please tick the column corresponding rating that best describes your response using
the guide below
Please rate /indicate/tick appropriately your response with respect to the importance of the
statements below:
1. 2. 3. 4.
Strongly Disagree Disagree Not Sure Strongly Disagree
This objective of the study seeks to ascertain the aspects of taxation presented in table on the
scale ofI to 4. Therefore, the following items/statements/questions are intended to ascertain your
degree of agreement and so, carefully read and tick the appropriate number that indicates how
much you agree or disagree with each statement. Scale: It Strongly Disagree 2= Disagree 3
Agree 4 Strongly Agree. NB: There is no right or wrong answers.
Please tick the most appropriate number.
5. SECTION B: Effect of progressive tax on growth of SMEs
3 4
1 Ensures that valuable evaluation of business
2 Reduce the operational capacity of business
3 Will direct the growth course of the business
4 Provides avenues for improved organizational sustainability
5 Is responsible for improved steady operations of SMEs
39

6. SECTION C: Effects of corporation taxes on SMEs in Kampala central division
1 Reduces the profitability of the organizations
2 Reduces the sales capacity of small and medium enterprise
3 Encourages the businesses operation on legal terms
4 It can be used as a marketing tool for the organizational resources
5 Enables the legal operation of businesses
7. D: Effects ofRegrt>ssive taxes on SMEs in Kampala central division
1 Reduces the business resources
2 Can contribute to collapse of businesses
3 Reduces business values affiliated to pricing and marketing
4 Reduces the business operational capacities
5 Increase the operational means of organization
40
I

APPENDIX II: INTERVIEW GUIDE
1. Whether taxation has got great impact on the growth of small and medium enterprises.
2. How does progressive tax influence growth of small and medium enterprises in Kampala Central
division, Uganda?
3. What extent do effects of progressive tax lead to the growth and performance of small and
medium enterprise?
4. What are the effects of corporation tax on the growth of small and medium enterprise?
5. To what extent do effects of corporation tax lead to the growth of small and medium enterprise?
6. Whether there are effects of regressive tax on the growth of small and medium enterprises in
Kampala central division.
7. What are the effects of regressive tax towards the growth of small and medium enterprises in
Kampala central division, Uganda?
8. Comment on how taxation affects the growth of small and medium enterprises in Kampala
central division, Uganda.
41

Appendix ii: Research Budget
NO ITEM Cost
1 Photocopy/printing 120,000/=
2 Relevant Research analysis 100,000/=
3 Meals 100,000/=
4 Data analysis 100,000/=
5 Consultation 100,000/=
6 Miscellaneous 50,000/=
TOTAL 570,000/=
42

APPENDIX iii: Research Time Frame
NO ACTIVITY Time Months
1 Variable formulation March-April 2016
2 Chapter one formulation and design May 2016
3 Literature & Methodology June 2016
4 Data collection Early July 2016
5 Data analysis Late July 2016
6 Report writing and submission August 2016
43