Embed Size (px)
Citation preview
TEACHER PERCEIVED IMPACT OF TECHNOLOGY ON
ELEMENTARY CLASSROOMS AND TEACHING
A Dissertation
presented to
the Faculty of the Graduate School
University of Missouri-Columbia
In Partial Fulfillment
of the Requirements for the Degree
Doctor of Education
by
CONNIE M. CRANE
Dr. Dan Cockrell, Dissertation Supervisor
Dr. Jerry Valentine, Dissertation Supervisor
July 2005

© Copyright by Connie M. Crane 2005 All Rights Reserved
The undersigned, appointed by the Dean of the Graduate Faculty, have
examined a dissertation entitled:
TEACHER PERCEIVED IMPACT OF TECHNOLOGY ON ELEMENTARY CLASSROOMS AND TEACHING
presented by CONNIE MARIE CRANE a candidate for the degree of
DOCTOR OF EDUCATION and hereby certify that in their opinion it is worthy of
vdentine, Co-Advisor cational Leadership & Policy Analysis
Dr. Dan Cockrell, Co-Advisor Educat ionawership & Policy Analysis
D6/~a~'Scribner Educational Leadership & Policy Analysis
~r.)aren Cockrell E d u c a t i m Leadership & Policy Analysis
Dr. George Petersen Educational Leadership & Policy Analysis

ii
ACKNOWLEDGEMENTS
This project would not have been possible without the support and encouragement
of many people. First of all, I would like to thank my advisors, Dr. Dan Cockrell and Dr.
Jerry Valentine. As professional and caring mentors, they provided countless hours of
support, guidance, and encouragement along the way. I am grateful for their help and
confidence during this process. Their support and inspiration have had a dramatic impact
on my career.
I would also like to thank Dr. Karen Cockrell, Dr. George Petersen, and Dr. Jay
Scribner who also served on my dissertation committee. Their suggestions were
extremely insightful and useful. I appreciate their extra effort and support with this
project.
Sincere appreciation also goes to the administration and teachers from South
Elementary and North Elementary for providing me the opportunity to study the impact
of technology on elementary classrooms in their schools. I am exceptionally grateful to
the participants of this study for sharing their thoughts and perceptions.
Finally, I would like to thank my colleagues, friends, and family members,
especially my daughters, Elizabeth and Emily, and my parents, for the strength,
motivation, inspiration, understanding, and love they have given me over the past few
years while I completed my doctoral program. It meant a great deal that everyone had
confidence in me to successfully complete this prestigious degree.
iii
TEACHER PERCEIVED IMPACT OF TECHNOLOGY ON
ELEMENTARY CLASSROOMS AND TEACHING
Connie M. Crane
Dr. Dan Cockrell Dissertation Supervisor Dr. Jerry Valentine Dissertation Supervisor
ABSTRACT
Issues surrounding technology integration are varied. Over the last decade, the
presence of technology in elementary classrooms has increased; however, research
indicates that many teachers are not utilizing these resources effectively. Although
research supports the notion that technology in the classroom has an influence on student
learning, research also points to the teacher as an important lynch pin in technology
integration in the curriculum (Mandell, Sorge, & Russell, 2002).
The purpose of this study was to investigate how technology is used and
integrated into the elementary curriculum and to explore the influence of technology on
student success. The study focused primarily on the teachers’ knowledge and skill levels
in using and integrating technology into the curriculum and on professional development
opportunities in the area of technology use and integration provided to teachers. Using a
mixed method comparative design, data were generated from teacher surveys and focus
group and individual interviews.
Data from the survey questionnaire were analyzed using descriptive statistics. A
t-test was used to determine if there was a significant difference between the groups of
teachers, including those from a non-technology school and those from a technology
school who teach in non-technology and technology classrooms. Focus group and
iv
individual interview data were analyzed in order to identify patterns and topics of belief,
values, and practices related to the teachers’ classroom technology use.
The two schools in this study were an elementary school (technology school) that
has an intensive technology program (eMINTS) and another elementary school (non-
technology school) that does not have an intensive technology program. The following
subgroups of teachers from the schools were included in the study:
a) teachers in grades K-3 of both schools
b) teachers in the non-technology school grades 1-3 and Non-eMINTS
teachers in the technology school K-6
c) teachers in the non-technology school grades 1-3 and teachers in the
eMINTS program grades 3-6
d) teachers in the technology school grades 3-6 that were eMINTS teachers
and teachers in the same school grades K-6 that were not eMINTS
teachers.
The findings revealed significant differences between teachers’ perceptions of
their roles and responsibilities for integrating technology, the influence of technology on
student success, and the type of professional development activities conducted. With the
eMINTS grades 3-6 versus Non-eMINTS grades K-6 analysis at the technology school,
there was a significant difference in beliefs and reality of the teachers. Non-eMINTS
teachers perceived greater external pressure to use and integrate technology in the
classroom; whereas, the eMINTS teachers in grades 3-6 identified a greater ideology
about, competence level in, and resources available for technology. Differences in
perceptions about professional development were also found.
v
Qualitative findings for this study revealed three primary themes that appear to be
essential to understanding the use and integration of technology in elementary classrooms
and the influence of technology on student success. Those primary themes include: (1)
barriers to technology integration; (2) importance of technology training; and (3) learning
environment.
vi
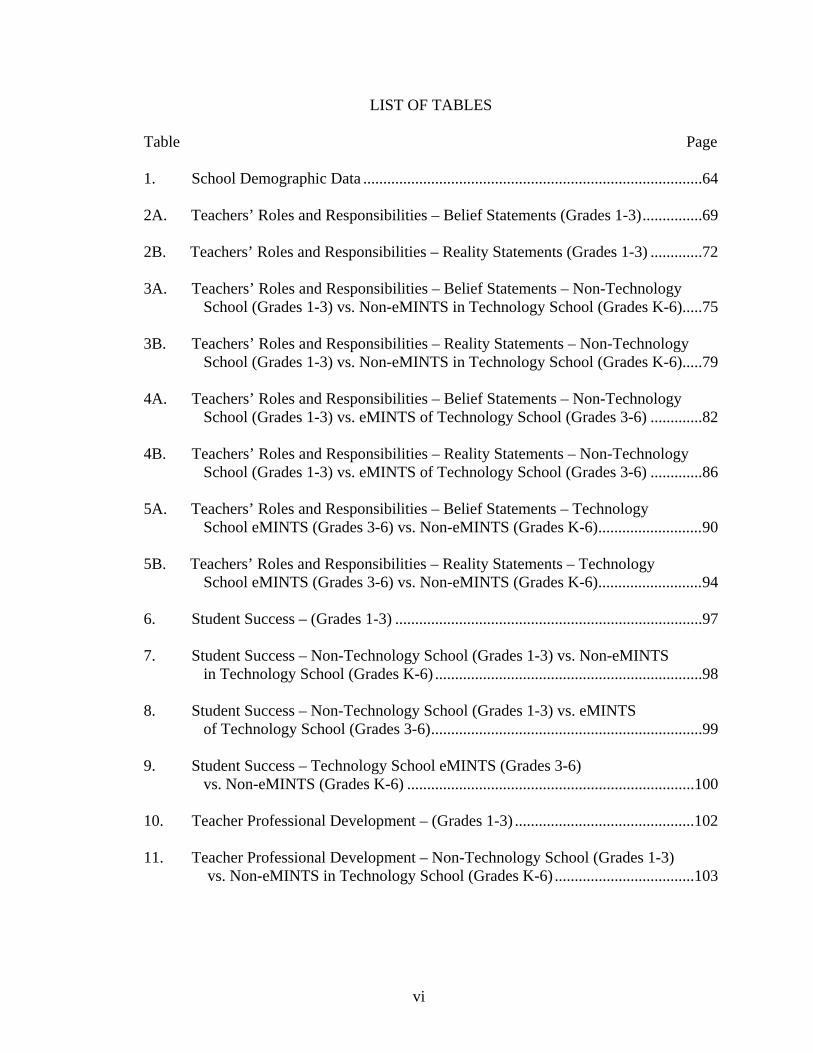
LIST OF TABLES
Table Page
1. School Demographic Data .....................................................................................64
2A. Teachers’ Roles and Responsibilities – Belief Statements (Grades 1-3)...............69 2B. Teachers’ Roles and Responsibilities – Reality Statements (Grades 1-3) .............72 3A. Teachers’ Roles and Responsibilities – Belief Statements – Non-Technology
School (Grades 1-3) vs. Non-eMINTS in Technology School (Grades K-6).....75 3B. Teachers’ Roles and Responsibilities – Reality Statements – Non-Technology
School (Grades 1-3) vs. Non-eMINTS in Technology School (Grades K-6).....79 4A. Teachers’ Roles and Responsibilities – Belief Statements – Non-Technology School (Grades 1-3) vs. eMINTS of Technology School (Grades 3-6) .............82 4B. Teachers’ Roles and Responsibilities – Reality Statements – Non-Technology School (Grades 1-3) vs. eMINTS of Technology School (Grades 3-6) .............86 5A. Teachers’ Roles and Responsibilities – Belief Statements – Technology School eMINTS (Grades 3-6) vs. Non-eMINTS (Grades K-6)..........................90 5B. Teachers’ Roles and Responsibilities – Reality Statements – Technology School eMINTS (Grades 3-6) vs. Non-eMINTS (Grades K-6)..........................94 6. Student Success – (Grades 1-3) .............................................................................97 7. Student Success – Non-Technology School (Grades 1-3) vs. Non-eMINTS in Technology School (Grades K-6) ...................................................................98 8. Student Success – Non-Technology School (Grades 1-3) vs. eMINTS of Technology School (Grades 3-6)....................................................................99 9. Student Success – Technology School eMINTS (Grades 3-6) vs. Non-eMINTS (Grades K-6) ........................................................................100 10. Teacher Professional Development – (Grades 1-3) .............................................102 11. Teacher Professional Development – Non-Technology School (Grades 1-3) vs. Non-eMINTS in Technology School (Grades K-6) ...................................103
vii
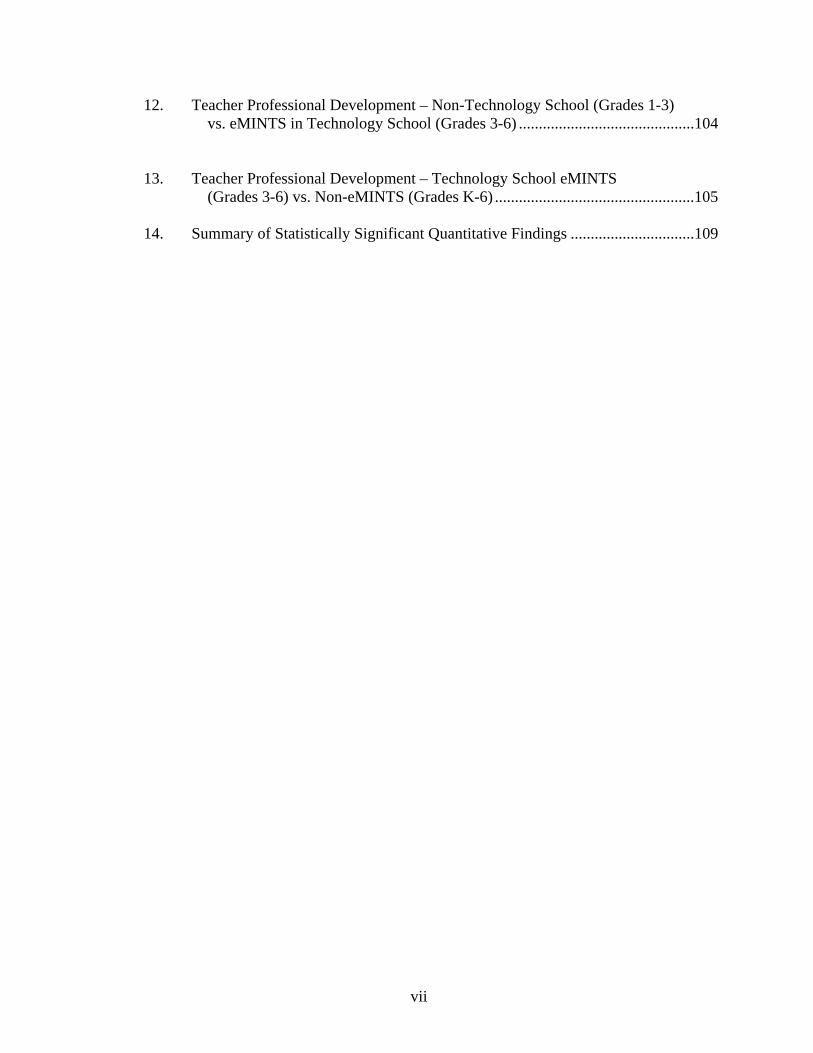
12. Teacher Professional Development – Non-Technology School (Grades 1-3) vs. eMINTS in Technology School (Grades 3-6) ............................................104 13. Teacher Professional Development – Technology School eMINTS (Grades 3-6) vs. Non-eMINTS (Grades K-6) ..................................................105 14. Summary of Statistically Significant Quantitative Findings ...............................109
viii
LIST OF FIGURES
Figure Page
1. Interthematic Relationship .........................................................................................121
ix
TABLE OF CONTENTS
ACKNOWLEDGEMENTS................................................................................................ ii ABSTRACT....................................................................................................................... iii LIST OF TABLES............................................................................................................. vi LIST OF FIGURES ......................................................................................................... viii CHAPTER 1 – INTRODUCTION TO THE STUDY.........................................................1 Conceptual Framework............................................................................................3 Purpose ....................................................................................................................7 Research Questions..................................................................................................7 Limitations ...............................................................................................................8 Definition of Terms .................................................................................................8 Rationale of the Study ...........................................................................................10 Overview of the Study ..........................................................................................12 CHAPTER 2 – REVIEW OF LITERATURE...................................................................13 Student Achievement .............................................................................................13 Technology in the Classroom ................................................................................16 Technology Influence on Student Achievement ...................................................19 Learning .................................................................................................................24 Teachers’ Roles and Responsibilities for Technology Integration ........................27 Barriers and Facilitators to Integration ..................................................................30 Barriers..............................................................................................................30 Teacher Preservice Preparation.........................................................................33 Teacher Learning ..............................................................................................36 Facilitators.........................................................................................................37 Professional Development .....................................................................................40 Summary ................................................................................................................45 CHAPTER 3 – RESEARCH DESIGN AND METHODS................................................46 Introduction ...........................................................................................................46 Purpose...................................................................................................................46 Research Methods ................................................................................................46 Setting ....................................................................................................................47 Research Questions ...............................................................................................47 Quantitative Research ............................................................................................48 Null Hypotheses...............................................................................................48 Participants.......................................................................................................50 Instrumentation ................................................................................................51 Data Collection ................................................................................................52 Data Analysis ...................................................................................................52
x
Qualitative Research ..............................................................................................52 Development of Categories..............................................................................53 Participants.......................................................................................................53 Data Sources ...................................................................................................53 Data Collection ................................................................................................54 Data Analysis ...................................................................................................55 Summary ...............................................................................................................56 CHAPTER 4 – PRESENTATION AND ANALYSIS OF DATA....................................58 Introduction............................................................................................................58 Study Design..........................................................................................................59 Research Questions................................................................................................61 Limitations ............................................................................................................61 Null Hypotheses.....................................................................................................61 Demographic Data .................................................................................................63 Quantitative Data ...................................................................................................67 Hypothesis One.............................................................................................67 Summary ................................................................................................96 Hypothesis Two ............................................................................................96 Summary ..............................................................................................100 Hypothesis Three ........................................................................................101 Summary ..............................................................................................106 Summary of Quantitative Findings.............................................................106 Qualitative Data ...................................................................................................110 Barriers to Technology Integration.............................................................110 Time ......................................................................................................110 Resources .............................................................................................112 Technical Support ................................................................................113 Importance of Technology Training ...........................................................114 Collaboration........................................................................................115 Type of Training ..................................................................................116 Learning Environment ................................................................................117 Enhancement of Curriculum...............................................................118 Effect on Students ...............................................................................119 Interthematic Relationships ........................................................................120 Summary of Qualitative Findings...............................................................121 Chapter Summary ................................................................................................121 CHAPTER 5 – FINDINGS, CONCLUSIONS, AND RECOMMENDATIONS ...........123 Introduction..........................................................................................................123 Overview of Study ...............................................................................................125 Research Questions..............................................................................................125 Limitations ...........................................................................................................125 Null Hypotheses...................................................................................................126 Summary of Findings...........................................................................................128
xi
Discussion of Findings.........................................................................................131 Research Question 1 ....................................................................................131 Research Question 2 ....................................................................................133 Research Question 3 ....................................................................................136 Recommendations................................................................................................141 Recommendations for Future Research .......................................................141 Recommendations for Improving Educational Practice ..............................142 Recommendations for Professional Development.......................................143 REFERENCES ................................................................................................................145 APPENDIX......................................................................................................................165 Appendix A – Letter to Building Administration ...............................................165 Appendix B – Consent for Survey .......................................................................166 Appendix C – Survey Questionnaire ...................................................................167 Appendix D – Consent to Interview ....................................................................171 Appendix E – Interview Questions ......................................................................172 Appendix F – Consent for Focus Group Interview..............................................173 Appendix G – Focus Group Interview Questions................................................174 VITA ..............................................................................................................................175
CHAPTER 1
Introduction to the Study
Nearly 50 years ago, with the Soviet’s launch of Sputnik, the United States was
suddenly scrambling to reclaim its place as a leader. One stride towards this revitalization
was a strong commitment and investment in public education (Berends, 2004). During
the 1960s and 1970s decade, school research revealed the lack of equal opportunities for
individuals; this lack of opportunities resulted in the Civil Rights Act of 1964. Students’
test scores had declined and compared poorly with students in other countries.
Recognizing the frustrations caused by academic deficiencies, the National Commission
on Excellence in Education (1983) published A Nation at Risk, and recommend that state
governments increase high school graduation requirements, adopt higher measurable
achievement standards, increase the time students engaged in learning, and develop
higher standards for teacher preparation and professional growth. This report noted that
the United States was falling behind other competitors and called for school reform
(Nystrand, 1992).
During the 1980s and 1990s, restructuring schools research became a focus of
reform and emphasized more rigorous and measurable standards (Berends, 2004). The
aim was to provide clear academic expectations for all students and the entire educational
system. As a result, individual states endorsed the standards movement, and Missouri
created the Missouri Assessment Program (MAP) and Show-Me Standards (Missouri
Department of Elementary and Secondary Education, 2000).
With more than two decades of educational reform efforts since the release of A
Nation At Risk, students and schools remained deficient in reaching higher standards, and
2
this deficiency prompted the passage of Goals 2000. Goals 2000 established a framework
for identifying standards and measuring student progress to improve student academic
achievement (Goals 2000, 1994). Then in 2002 the No Child Left Behind Act (NCLB)
containing the most sweeping changes in federal law effecting education was signed into
law. One aspect of NCLB, a government mandate establishing significant accountability
measures for public schools by the year 2014, focused on the integration of technology
into classrooms to improve teaching and learning.
Technology is revolutionizing much of the way the world operates (Falba, et al.,
2001). Workplaces are changing, employment skills are shifting, and new knowledge is
required to accommodate this rapid infusion of technology. People are required to learn
new ways to relate to different information sources and to communicate globally, as well
as locally (U.S. Congress, Office of Technology Assessment, 1995).
In the school setting technology, electric educational tools such as computers,
laptops, audiovisual equipment, digital cameras, graphing calculators, scanners,
projectors, and printers, is a rapidly increasing education resource that has the potential to
transform learning by creating an optimum teaching and learning environment. The
availability of technology and the Internet has increased significantly in the nation’s
schools and classrooms (Williams, 2000). Technology is available in almost every
classroom in the United States, with 98% of schools and 77% of classrooms connected to
the Internet (NCES, 2001). With all this connectivity in schools, teachers must be trained
to create technology rich learning environments for students (Anderson & Becker, 2001).
A 1998 survey found that while students, teachers, and parents agree on
technology’s potential to make substantial improvements in education, technology has
3
not been fully integrated into the learning process (Schroeder, 1999). Thirty percent of
teachers in grades four through twelve use technology for administrative tasks or do not
use technology at all (Becker, 1999).
National, state, and local initiatives have provided schools with computer
hardware and software, allowed schools and classrooms to connect to the Internet, and
supported technology-focused professional opportunities for teachers (Coley, et. al.,
1997; U.S. Department of Education, 1996). These initiatives are aimed toward
understanding how best to use technology to improve teaching and learning as well as
training educators to effectively use technology (Williams, 2000).
Conceptual Framework
Technology is not a panacea; it is a means used by teachers to improve and
enhance instruction (Mandell, Sorge, & Russell, 2002). A significant responsibility of
education is the preparation of students for the future; therefore, educators must teach
students to use technology to succeed in today’s world (Morrow, et al., 2002).
Teaching with technology requires a shift from the traditional teaching practice.
In order for technology to transform teaching and learning, the teacher’s role must be
redefined, and existing teaching practice must change (Wiburg, 1997). “To make real
changes in classrooms, so that technology is truly used each day as a thinking, creative,
and research tool, requires significant work in changing instructional approaches,
assessments, and management strategies” (Wiburg, 1997, p. 181).
According to the Office of Educational Technology (OET), technology enables
accountability and leadership to transform education, improves equality and increases
student access to learning (MO DESE, 2002; MO DESE, 2003; OET, 2003). As noted in
4
the Technology Policy Brief of WestEd (2002), the use of technology can have a
transformative effect on education by redefining teacher and student roles. Teachers
become coaches and collaborators rather than dispensers of knowledge. Students take
charge of their learning and construct knowledge.
Mandell, Sorge, and Russell (2002) also supported the notion that technology can
provide students with opportunities to discover and create knowledge thereby permitting
teachers to take on the role of facilitators. Educators using technology help students learn
how to learn and provide them with a valuable skill more important than the imparting of
factual information.
Mann and Shafer (1997) found that when technology was introduced in the
classroom, profound effects on achievement were observed. In conducting an extensive
study of 55 New York state school districts Mann and Shafer compiled and analyzed data
from 4,041 teachers, 1,722 students, 159 principals, and 41 superintendents to find out
how the investment in technology affected student achievement. Results indicated that
schools with more instructional technology and teacher training experienced increased
student achievement. At the elementary level significant gains were made on the state’s
Comprehensive Assessment Report in sixth-grade math. High school students also
reported a 42 percent variation with the addition of technology on the state college
preparatory exam in math and a 12 percent variation with the addition of technology on
the state college preparatory exam in English.
According to Page (2002), students in technology-enriched classrooms appeared
to score significantly higher in mathematics achievement than their peers in non-
technology-enriched classrooms. Page’s study consisted of 211 students of low
5
socioeconomic status and of various backgrounds, races, and ability levels from 10
Louisiana classrooms (five technology-enriched environments and five without
technology). Therefore, incorporating technology is no longer a special effect or idea; it
is a necessity for today’s and tomorrow’s world. (Morrow, Barnhart, & Rooyakkers,
2002).
Research on one program, Enhancing Missouri’s Instructional Networked
Teaching Strategies (eMINTS), compared the results of the 2004 Missouri Assessment
Program (MAP) for 4,322 third and fourth grade students in 40 school districts. The
eMINTS Evaluation Project (2005) revealed significant differences between eMINTS
and Non-eMINTS schools. Students scored higher in communication arts and
mathematics in eMINTS classrooms versus students in Non-eMINTS classrooms.
However, as schools and districts increasingly invest in new technologies, the
actual use of technology in classrooms remains meager (Mouza, 2002/2003). The mere
presence of technology in classrooms is no assurance that teachers use technology to
support and promote the curriculum they teach. As schools and their communities rush to
provide students with access to technology, the vital issue of implementation is largely
overlooked. Technology access does not immediately equal implementation of
technology (Smith & Robinson, 2003). As quoted by Schroder (1999), “We have spent
millions of dollars on educational technology, but have not yet seen much of a return on
this investment” (p.76).
For technology to become a core component of teachers’ instructional repertoire,
teachers need time to explore, reflect, collaborate with peers and engage in hands-on
6
learning. (WestEd, 2002). Teachers need to be taught how to use technology to deliver
instruction (White, Ringstaff, & Kelley, 2002; Albee, 2003; WestEd, 2002).
Technology needs to be integrated as a tool so that curriculum and student needs
drive technology, not the reverse (Dockstader, 1999; Wolosoff, 1998; Mann & Shafer,
1997; Harvey & Purnell, 1995). Research has indicated that many teachers do not feel
prepared to integrate technology into their classroom instruction (Charp, 2003). Smith
and Robinson (2003) found that because of an absence of technical skills, teachers
become frustrated quickly. Teachers often feel uncomfortable using technology and are
unaware of the teaching and learning pedagogies that technology and the Internet are able
to support (Mouza, 2002/2003). In particular, teachers’ beliefs about their ability to use
technology in instruction may be key (Ertmer, et al., 2003).
For teachers to be able to effectively integrate technology with instruction, extant
literature points to the fact that teachers need to integrate technology with their personal
lives (Nisan-Nelson, 2001). When teachers know how to use and then actually do use all
the tools at their disposal, the potential for student learning is also increased (Mills &
Tincher, 2003).
Results of research on use of technology have also indicated that teachers must be
supported as they introduce technology and must be sufficiently flexible to adapt and
integrate technologically based or supported instruction as problems occur. Teachers who
lack support and encouragement are likely to abandon a technology-enriched lesson when
it goes awry (Hornung & Bronack, 2000). Doersch (2002) states that teachers are willing
to try new things if they know they will have help and support when they need it.
Armstrong (1996) also discusses the necessity of proper support in a non-threatening
7
environment. In such an environment, teachers are more willing to take a chance and see
where technology integration will take them.
Therefore, if teachers are going to embrace technology and integrate it into the
elementary curriculum, they need meaningful professional development. Mouza
(2002/2003) indicated that professional development is a critical ingredient in effective
use of technology in the classroom. Kopp and Ferguson (1996) state that teachers cannot
just magically utilize the many facets of technology without training, guidance, and
models. Teachers’ effective use of technology will make the difference. Clearly, the
teacher is the most important ingredient for success in schools using technology
(Mandell, Sorge, & Russell, 2002). Professional development sessions in integrating
technology into the curriculum and classroom will more effectively enable the teachers to
know what technology can do to support and enhance their teaching strategies.
Purpose
The purpose of this study was to investigate the use and integration of technology
into the elementary curriculum and to explore the influence of technology on student
success. Through a comparative study of two elementary schools in a mid-western state,
this study concentrated on the teachers’ knowledge and technological skill levels as they
integrate technology into the curriculum and on the professional development
opportunities in technology integration provided to the teachers.
Research Questions
The overarching question guiding this mixed method comparative study is: Does
the use of technology influence student success in elementary classrooms? The following
research questions were designed to address this overarching question: (1) What are the
8
teachers’ perceptions of their role and responsibility in integrating technology? (2) What
are the teachers’ perceptions of technology influence on student success? and (3) Are
there differences in the professional development related to integrating in elementary
classrooms?
Limitations
One school in this study was selected because of the technological interventions
present in that school, and the other school was selected because of geographic proximity
and demographic similarity with the technology school. This study utilized self-reporting
data. Findings of the study are based on the perception data of teachers and the
assumption that teachers will respond honestly and interpret the instrument as intended.
Definition of Terms Cooperative learning. Cooperative learning is a teaching strategy that involves
students working together in teams to accomplish a common goal with positive
interdependence, individual accountability, interpersonal skills, interaction and group
processing (Johnson, Johnson, & Smith, 1991).
Educational technology. Educational technology involves using technological
resources to aid in teaching all subjects and is concerned with creating the optimum
teaching and learning environment through the use of technology (Dugger, 1999).
Implementation. In this study, implementation means how the teachers and
students used technology; how often various technological tools were used; where
technology was used; and to what degree or extent was technology being utilized (Dexter,
Anderson, & Becker, 1999).
9
Inservice. Providing opportunities for teachers to learn new educational topics as
well as perform activities to enhance their teaching and learning strategies (Ertmer, et. al.,
2003).
Integration. Integration in this study was defined as the process of blending
technology into curricula disciplines (Pierson, 2001).
Professional development. Professional development is the degree to which
teachers value continuous personal development and school-wide improvement. Teachers
seek ideas from seminars, colleagues, organizations, and other professional sources to
maintain current knowledge, particularly current knowledge about instructional practices
(Gruenert, 1998).
Self-efficacy. Self-efficacy refers to personal beliefs about one’s capability to
learn or perform actions at designated levels (Bandura, 1997).
Student achievement. Student achievement refers to the measure of student
learning by means of national and state standardized tests and teacher reports (Colbaugh,
2001).
Student success. Student success refers to an accomplishment or attainment of a
desired end (Keeler, 1996).
Technology. For this study technology is the myriad of electronic tools used to
enrich the educational experiences of students. It includes, but is not limited to,
computers, laptops, audiovisual equipment, digital cameras, graphing calculators,
scanners, projectors, and printers (Morrison & Lowther, 2002).
10
Technology-enriched. Technology-enriched refers to environments that utilize
technological resources to assist in the learning process of students while taking notes,
producing assignments, and constructing projects (Simms & Knezek, 2001-2002).
Technological fluency. Technology fluency is a combination of the information
skills, communication skills, and technology skills necessary to function in a
technological environment. (Fulton, K. 1997).
Technology integration. Technology integration is the process of using
technology to achieve educational objectives and to cause students to engage in more
meaningful learning experiences (Dias, 1999).
Technology training. Teachers expand their repertoire by learning to use word
processing, databases, spreadsheets, and presentation graphics to enhance classroom
teaching and learning activities (Wilkes, 2000).
Rationale of the Study
More teacher inservice focusing on integrating technology needs to be developed
(Smith & Robinson, 2003; Desimone, et al., 2002; Ertmer, et al., 2003). Although,
professional development is critical for classroom teachers to successfully integrate
technology, extant research has indicated that current teacher training methods often fall
short (Lieberman, 1995). Abbott and Faris (2000) cited computer technology components
as requisite to teacher education programs, but few programs provide application of
technology in instruction.
Educators need to enable students to use technology of their time; teaching
today’s children in ways that educators were taught is insufficient (Jacobsen & Lock,
2004). Rushkoff (1996) refers to children today as screenagers, “born into a culture
11
mediated by the television and the computer” in which they participate fluidly in online,
interactive digital environments and media (p. 3). Integrating technology is much more
than simply learning how to use the equipment; such integration is more about the
fundamental changes to teaching and learning that are enabled and required (Jacobsen,
2001).
Pierson and McNeil (2000) proposed improving the use of technology in teacher
preparation programs through the “purposeful creation of collaborative, authentic and
content-focused learning environments” (p. 9). Moursund and Bielefeldt (1999) also
noted that increased levels of technology integration versus the delivery in a few isolated
classes are needed throughout the entire teacher preparation program.
Ringstaff and Yocam (1994) stated “current methods of professional development
are woefully inadequate because most focus on learning about computers rather than
learning how to integrate computers into the curriculum” (p. 31). Redesigning current
professional development may help reduce some of the barriers experienced during the
implementation. Smith and Robinson (2003) found that changes in the delivery of
professional development opportunities must be considered to avoid teacher frustration.
Schmeltzer (1995) and Charp (1996) clearly agree that if educators are asked
about challenges related to effective technology in schools, they will invariably bring up
the issue of professional development. Schmeltzer cites one of the biggest obstacles to the
integration of technology is the lack of teacher training. Hurst (1994) maintains if
classroom teachers are to use technology effectively in their classrooms, they must be
provided with adequate training.
12
Nevertheless, over the past decades, schools have made limited progress toward
integrating technology into the curriculum (Becker, 1992; Cuban 1993). Thurston and
Levin (1996) address the urgent need for professional development: “Teachers need
appropriate infrastructure and access, opportunities to integrate technology into the
curriculum, and technical and administrative support; but they also need effective
training” (p. 48). “Technology adds value to schools when it is an integral part of a
comprehensive plan for instructional improvement and when teachers are adequately
prepared to use it as one more tool in their arsenal” (Dwyer, 1996b, p. 26). Consequently,
an urgent need exists to integrate technology.
This study concentrated on how elementary teachers use and integrate technology
resources into the elementary curriculum while exploring the influence of technology on
student success. The primary focus of the study was the role and perception of classroom
teachers along with the effect professional development activities in technology
integration had on student success.
Overview of the Study The literature review related to technology in the classroom, its influence on
student learning, and teachers’ roles in technology integration are presented in Chapter 2.
Chapter 2 includes a review of technology in teacher pre-service preparation and
professional development and an analysis of the barriers and enhancers to the effective
use of technology in the classroom. The methods and procedures for conducting this
research are presented in Chapter 3. The data findings are presented in Chapter 4, and the
discussion of findings, conclusions, and recommendations are presented in Chapter 5.
13
CHAPTER 2
Review of Literature
The purpose of this chapter is to review selected literature relevant to this study.
Areas of literature addressed include (1) student achievement (2) technology in the
classroom, (3) technology influence on student achievement, (4) learning, (5) teachers’
roles and responsibilities for technology integration, (6) barriers and facilitators to
technology integration, and (7) professional development.
Student Achievement
The role of student achievement and assessment has shifted greatly in the United
States (Darling-Hammond & Wise, 1985). In the years past, before state-mandated
criterion-referenced tests existed, most school districts administered only nationally
normed achievement tests that had been designed to compare the student population in a
district with students throughout the nation. In the eyes of various authors, public
education had begun to assume a close relationship with the continuation of the American
way of life. In 1947 New York Times editor, Benjamin Fine, alluding to a crisis facing
education declared that the United States would surely suffer the consequences of the
present neglect of education in generations yet to come. A 1955 best seller, Why Johnny
Can’t Read, warned that the refusal of educators to use research-based phonics methods
would destroy democracy in the country (Rothstein, 1998).
The Soviet launch of Sputnik in 1957 accelerated complaints about declining
student achievement in the United States. For the first time, schools were seen as an
integral part of national security. The United States needed a great number of engineers,
mathematicians, scientists, and foreign language speakers, and these specialists were not

14
being produced by America’s public schools and postsecondary institutions in sufficient
numbers to compete with the numbers being produced and utilized by the U.S.S.R.
(Bracey, 1997).
The 1960s and 1970s saw strong public concern accompanied by extensive and
continuing efforts at all levels of government to improve the public education system
(Congress of the United States Congressional Budget Office, 1987). Scores on
standardized achievement tests played a central role in this debate. American students’
test scores declined during the 1960s and 1970s and compared poorly with test scores of
students in other countries. Fluctuations in student achievement during these decades
were compounded by radical changes in the federal government’s role in education.
These changes were brought about by the implementation of the Economic Opportunity
Act of 1964, which created Head Start, and by the Civil Rights Act of 1964, which
focused on social inequalities and prohibited discrimination in the use of federal funds
(Congress of the United States Congressional Budget Office, 1987; Berends, 2004).
The notions of equity and excellence dominated the educational landscape in the
1980s (Keith & Girling, 1991). Since the early 1980s, national efforts focused on
reestablishing the United States as a major world competitor. The National Commission
on Excellence in Education’s (1983) report, A Nation at Risk, captured national attention
when the report findings indicated, “The educational foundations of our society are
presently being eroded by a rising tide of mediocrity that threatens our very future as a
Nation and a people” (p. 5). A number of the report’s findings and recommendations
sought more rigorous curricula and higher standards of performance for students and
teachers. A Nation at Risk (1983) expressed the fear that high school students in the
15
United States might now be scoring lower on achievement tests than when Sputnik was
launched in 1957 and called for school reform. As a result, education reform became a
number one national issue (Nystrand, 1992).
During the 1980s and 1990s, individual states, including Missouri, joined the
standards movement to improve instruction. As a result of the Outstanding Schools Act
of 1993, the Missouri Assessment Program (MAP) was developed. In developing the
MAP, Missouri officials followed the standards for assessment established by the
National Assessment Governing Board. These standards, known as the Show-Me
Standards, provided a definition of what Missouri students should know and be able to
demonstrate by high school graduation. The MAP test was intended to raise the bar for
students’ learning (Missouri Department of Elementary and Secondary Education, 2000).
The Goals 2000: Educate America Act (P.L. 103-227) was signed into law on
March 31, 1994, and provided resources to states and communities to ensure that all
students reach their full potential. Goals 2000 was based on the premise that students will
reach higher levels of achievement when more is expected of them and established a
framework for identifying world-class academic standards, measuring student progress,
and providing the support those students may need to meet the standards. This Act
codified into law the six original education goals concerning school readiness, school
completion, student academic achievement, leadership in math and science, adult literacy,
and safe and drug-free schools and added two new goals encouraging teacher
professional development and parental participation (Goals 2000, 1994).
In January 2002, President Bush signed the "The No Child Left Behind Act
(NCLB)" and reauthorized the existing Elementary and Secondary Education Act
16
(ESEA). Containing the most sweeping changes in federal law regarding public schools
in nearly 40 years, NCLB includes significant new accountability measures for all public
schools and is based on the ambitious goal that ALL children will be proficient in reading
and math by 2014. By 2006, Missouri must develop new, annual tests in reading and
math for grades 3-8 to measure students’ academic progress. The law requires that all
children be taught by "highly qualified" teachers and emphasizes improving
communication with parents and making all schools safer for students (Missouri
Department of Elementary and Secondary Education, 2004). One aspect of NCLB that
separates it from previous national mandates on education is the law’s emphasis on the
integration of technology into classrooms to support and improve teaching and learning.
The Act requires state educational agencies to assist every student in crossing the digital
divide and to ensure that every student, regardless of the student’s race, ethnicity, gender,
family income, geographic location, or disability, is technologically literate by the time
the student finishes the eighth grade.
Technology in the Classroom
Technology is not new in the education field. Microcomputers have been
available in some school settings since the 1970s. As microcomputers entered increasing
number of schools, educators struggled with defining appropriate computer skills for
students (Bitter, 1983). Primarily used to support the traditional instruction mode,
technology was routinely used to reinforce memorization of facts rather than promote
higher-order thinking and problem-solving skills (Becker, 1992; Sandholtz, Ringstaff &
Dwyer, 1997). Technology integration was often equated with basic operations and
programming, and standards had yet to be established by the late 1980s (Roblyer, 2000).
17
The Enhancing Education through Technology Act, Title IID of NCLB, currently
requires technology to be fully integrated into the curricula and instruction by December
31, 2006 (NCLB, 2002).
Today, technology affects virtually every aspect of our lives, from enabling
citizens to perform routine tasks to requiring them to be able to make responsible,
informed decisions that affect individuals, society, and the environment. Students need
and deserve the opportunity to attain technological literacy through their educational
process (Dugger, Meade, Delany, & Nichols, 2003).
With this increasing expectation of technology literacy, the International Society
for Technology in Education (ISTE) and its partners have developed the National
Educational Technology Standards for Students (2000) and the National Educational
Technology Standards for Teachers (2000). These documents clearly indicate
expectations for effective computer usage in teaching and learning.
Technology should be viewed as a means to achieve educational objectives, not
an objective in and of itself (WestEd, 2002; Morrison & Lowther, 2002). Technology
should be a tool available to students to aid in the learning process and should be used as
a problem-solving tool in open-ended learning environments, not just as a substitute for
presenting material to the students (Morrison & Lowther).
Results from Cohen’s (2001) study on learning styles and technology indicate that
a technology-rich environment promoting collaborative learning affects the learning
styles of students. Technology in the classroom can also help the students learn how to
learn. Teachers who help students learn how to find information on their own provide
students with a valuable skill. Acquisition of this skill is perhaps more important than any
18
factual knowledge imparted to students (Mandell, Sorge, & Russell, 2002). Mandell,
Sorge, and Russell also noted that technology can provide students with opportunities to
discover and create knowledge and thereby permit teachers to better take on the role of
facilitator.
Technology appears to motivate children and to increase the time they are willing
to spend practicing important academic skills (Morrow, Barnhart, & Rooyakkers, 2002).
The potential for technology to help people learn has been largely overlooked until
recently (Winn & Synder, 2001). Educators are beginning to comprehend the potential
for technology to help students construct meaning for themselves based on learning
activities. Technology is quickly becoming more than just a tool for acquiring content or
skill more efficiently and effectively (Mills & Tincher, 2003).
Cuban (1993) attributes technology’s appeal to three factors: (1) the desire to
prepare students for the transition into an increasing technological workforce; (2) the
potential for technology to provide a vehicle for self-directed learning; and (3) the
perception that technology use in the classroom will increase productivity. According to
Wenglinsky’s (1998) study, technology can and does matter, but it is highly dependent
upon the context in which it is used.
White, Ringstaff, and Kelley (2002) point out two different uses of technology in
the classroom—learning “from” computers and learning “with” computers. Learning
from computers occurs when the technology functions as a tutor directing the student
through a learning process. Learning with computers occurs when students take a more
active role exploring the Internet and using email. Technology should be seen as a tool
19
that supports and extends student understanding, providing a means to authentic, hands-
on inquiry related to a problem, issue, or theme (Moersch, 1995).
Bitner and Bitner (2002) point out eight areas of consideration that have been
shown to be important as teachers successfully integrate technology. These
considerations are fear of change, training of basics, personal use, teaching models,
learning styles and strategies, climate, motivation, and support. Mouza (2002/2003)
suggests major factors that appeared to influence teacher use of technology in the
classroom are: (a) support teachers received from the school administration, (b) student
population and needs, (c) collaboration with other teachers, and (d) availability of school
resources (Mouza, 2002/2003). Cuban (2001) states that teacher belief systems about
technology significantly influence actual classroom practice using technology.
Along with these factors, ongoing support is critical. Teachers are more willing to
take a chance and try new things with technology integration if they know they will have
help and support when they need it (Doersch, 2002). Smith and Robinson (2003) also
state that integration is most likely to occur if the support system for such innovation is
already in place.
Technology Influence on Student Achievement
According to Eachus and Cassidy (1999), “self-efficacy has repeatedly been
reported as a major factor in understanding the frequency and success with which
individuals use computers” (p. 2). Significant increases in students’ ratings of perceived
self-efficacy regarding technology integration were noted by Ertmer, et. al. (2003).
Numerous studies, summarized by Bialo and Sivin-Kachala (1996), revealed students are
motivated to learn and feel more successful in school when using technology. Keeler
20
(1996) also reported that students felt positive about using the computers. The results
represented a positive attitude toward the use of the computer in the classroom, and
students enjoyed having some instruction on computers. When teachers increase their use
of technology in the classroom, students are engaged, and learning is exponentially
enhanced (Falba, et. al., 2001; Mills & Tincher, 2003).
Based on a study focused around the effects of technology on academic
accomplishments of elementary students, Page (2002) indicated that children in
technology-enriched classrooms appear to score higher on standardized tests in
mathematics. Participants consisted of 211 low socioeconomic status students from 10
classrooms (five technology-enriched environments and five without technology).
Results of univariate analysis of covariance (ANCOVA), performed to determine if a
statistically significant difference existed, indicated classroom technology contributed
significantly to the academic achievement and self-esteem of elementary students of low
socioeconomic status.
An analysis of student test scores in Missouri offers solid evidence to suggest that
using technology as a primary tool in their classroom to facilitate learning can boost
student achievement (Missouri Department of Elementary and Secondary Education,
2002). This boost in achievement was a result of the Enhancing Missouri’s Instructional
Networked Teaching Strategies (eMINTS) program which helps teachers use technology
in ways that change student engagement and student products through high-quality
professional development (eMINTS Evaluation Project, 2005).
The eMINTS philosophy is based on transforming teaching using inquiry-based
methods and strategies powered by technology (eMINTS National Center, 2005). This
21
inquiry-based approach that emphasizes the importance of students exploring ideas,
engaging in projects of choice, working collaboratively, and gaining conceptual
understanding is valued by many advocates of technology (Kleiman, 2004).
The eMINTS program has undergone rigorous external program evaluation by
Missouri’s Office of Social and Economic Data Analysis (OSEDA) and has been
recognized by the U.S. Department of Education as a key strategy in helping schools and
districts meet the requirements of NCLB legislation (eMINTS Evaluation Project, 2004).
Three years of data analysis verify that students enrolled in eMINTS classrooms at the
third and fourth grade levels on average perform at a higher level when compared to
students not enrolled in eMINTS classrooms (eMINTS Evaluation Project, 2005).
The analysis of the 2004 Missouri Assessment Program (MAP) compared the
results of 4,332 third and fourth grade students in 40 school districts and revealed
eMINTS students scored higher than Non-eMINTS students on both the communication
arts and mathematics tests. The analysis of the MAP scores shows positive differences
associated with the eMINTS enrollment. The differences on the communication arts test
were clearly significant and showed that students enrolled in eMINTS classrooms
outperformed all other students. The differences on the mathematics test were more
subtle; nevertheless, the results suggest that students enrolled in eMINTS classrooms did
perform better on the mathematics test than other students (eMINTS Evaluation Project,
2005).
Results from the 2004 MAP Communication Arts test show significant
differences between the eMINTS and Non-eMINTS schools and significant differences
by the number of years a teacher has been in the eMINTS professional development
22
program (eMINTS Evaluation Project, 2005). The percentage of students scoring in the
Proficient and Advanced categories of second-year eMINTS classrooms exceeds other
first-year eMINTS classrooms and Non-eMINTS classrooms, which indicates the
teacher’s completion of the eMINTS professional development program does have a
positive impact on test performance (eMINTS Evaluation Report, 2005).
Results from Donaldson’s study (2001) indicate the integration of technology into
life science and biology instruction from elementary through college level had an impact
on students’ attitude about the subject matter. The project focused on more student-
directed and collaborative learning activities. Students completed an online survey using
a Likert-type scale and a set of open-ended questions. A total of 157 pre-surveys and 132
post-surveys were completed. The greatest increase was reflected in the acquisition of
transferable skills to other classes.
The Apple Classrooms of Tomorrow (ACOT) project focused on the process of
K-12 schools technology integration in which teachers and students could use technology
on a routine basis (Sandholtz, Ringstaff, & Dwyer, 1997; Bitner & Bitner, 2002).
Findings from this study indicated that technology encouraged interaction among
students and between students and teachers as well as engaged students in high-order
cognitive tasks. This study reported technology as an integral part of teaching and
learning.
Keeler (1996) reported that technology created a community of learners in which
student motivation and behavior improved as students were allowed to make choices and
learn to become responsible for their own learning. Computers brought about changes in
traditional teaching strategies, including moving from a more teacher-centered to a more
23
student-centered environment (Keeler). Keeler also noted that computer implementation
can meet the needs of all types of learners while acting as a catalyst for change in the
classroom, building, and district.
Mann and Shafer (1997) found that when technology was introduced to the
classroom environment, profound effects on achievement were observed. When teachers
know how to use technology and then actually use all the tools at their disposal, the
potential for student learning is increased (Mills & Tincher, 2003). Page (2002) suggests
that computer environments, after aiding the knowledge gain of the participants involved,
encouraged lifelong learning habits and increased commitment for further learning or
learning to learn. However, Stellwagen (1999) suggests the effect of computer usage
varies with the diverse student ability levels.
While 84 percent of teachers responding to one survey believe that computers and
access to the Internet improve the quality of education in the school setting (NetDay,
2001), two-thirds report that the Internet is not well integrated into their classes. Shields
(2003) suggests that technology and curriculum are still not fully connected.
Computers are capable of helping kids do discovery learning. But computer
technology in schools—even though it’s practically in every classroom in some
form—still isn’t configured to allow kids to go off and do curiosity things.
Schools have to be model-based reasoning places. But the money that has been
poured into computers in recent years is still just an enhancement of the old
construct: schools give information. So we’ve got wonderful airplanes, with no
wings, that drive on roads. (p. 27)
24
As quoted in Shields (2003), Rob Reilly, a former elementary computer teacher,
stated that curriculum development and technology plans should not be allowed to
happen in separate rooms. “It’s like a Reese’s peanut butter cup….the curriculum
chocolate and the peanut butter technology have to go together. Schools will proudly
announce their computer-to-student ratio, but that’s only a statement about hardware—
just the peanut butter part” (p. 27).
According to White, Ringstaff, and Kelley (2002), if technology is to improve
student learning, then the teachers’ beliefs must be consistent with this integrated use of
technology in teaching and learning. Much work remains to be done in regard to both
acknowledging the role that beliefs play in the integration process and assisting teachers
to adapt their beliefs to accommodate technology in the classroom (Albion & Ertmer,
2002). Understanding how such visions and beliefs are formed and transformed is
important in creating a technology rich learning environment. Providing opportunities for
teachers to examine the beliefs and practices of exemplary technology-using teachers
offers a promising starting point (Albion & Ertmer). As a result, the student learning
process will become more learner-centered as teachers focus on the utilization of
technology in the classroom.
Learning
Ensuring students’ success in learning has long been the goal of teachers, but over
the years student learning has become even more critical (Brown, 2003). The groundwork
for making a shift in basic beliefs and assumptions about learning and the learner was
laid in 1990, when the American Psychological Association [APA] and the Mid-
Continent Regional Education Laboratory [McREL] joined to form the APA Presidential
25
Task Force on Psychology in Education. The purpose of this task force was twofold: (1)
to determine ways in which the psychological knowledge base related to learning,
motivation, and individual differences could contribute directly to improvements in the
quality of student achievement and (2) to provide guidance for the design of educational
systems that would best support individual student learning and achievement (McCombs
& Whisler, 1997). The task force studied research focused on learning that inspired
educators to place increased emphasis on high standards, effective instructional practices,
and improved assessment methods (McCombs & Whisler).
As a result of this emphasis, technical and organizational changes occurred to
enable students to achieve higher levels of learning (McCombs & Whisler, 1997).
However, these educators and researchers overlooked the impact of the changes on
students in areas other than in the area of academic achievement. Consequently,
educational systems were not structured to provide support for the complex needs of the
students (McCombs & Whisler).
By synthesizing the research in the areas of learning and instruction, members of
the task force created a framework, the APA Learner-Centered Psychological Principles,
to improve the educational experience of all learners (Alexander & Murphy, 1998). The
central understanding of the learner-centered principles called for educational systems to
effectively meet the needs of all learners by providing, “a focus on the individual learner
as well as an understanding of the learning process and the essential knowledge and skills
to be learned” (McCombs, 2000, p. 31). The learner-centered principles were defined by
a theoretical perspective rather than a prescribed method of instruction and set of
practices (McCombs & Whisler, 1997).
26
The fourteen learner-centered principles were categorized into four domains of
basic factors that have been identified in research as critical to achieving increased
motivation, learning, and academic achievement. These four domains include cognitive
and metacognitive factors, motivational and affective factors, developmental and social
factors, and individual differences. An understanding of these domains and the principles
within them establishes a framework for designing learner-centered practices at all levels
of schooling (American Psychological Association, 1997).
Learner-centered classroom practices, which allow students choice and
opportunities to interact with students of varying abilities, cultures, and ages, should
foster greater learning. Mastering content can be demonstrated in more than one way, and
students are allowed to work individually. Teachers function as facilitators holding high
expectations for all students and respecting the opinions and viewpoints of all. Finally,
instructional strategies and methods make learning relevant to the students. Higher level
thinking skills are emphasized, and students are encouraged to become more responsible
for their own learning. Students are able to assist each other in constructing meaning.
(Alexander & Murphy, 1998; McCombs & Whisler, 1997).
McCombs and Whisler (1997) described practices that enhance learning,
including tying learning both to prior learning and to authentic tasks, knowing the
individual needs of students and their unique backgrounds, respecting diversity, and
developing relationships. The importance of collaboration in the learning process was
noted in many publications (Bruffee, 1999; Paul & Marfa, 2001; APA, 1997). In a
collaborative learning process, students construct knowledge socially.
27
Teachers’ Roles and Responsibilities for Technology Integration
As the demand for K-12 technology use increases, many teachers feel unprepared
to integrate technology into the classrooms (Sprague, Kopfman, & Dorsey, 1998). With
technology as an integral part of everyday life, educators are responsible for teaching
students how to use relevant equipment. Technology incorporation in the classroom is no
longer a special effect or idea; technology integration is a necessity in preparing teachers
for today’s and tomorrow’s world (Morrow, Barnhart, & Rooyakkers, 2002). Teachers
must learn to use technology and must allow it to change their present teaching paradigm
(Bitner & Bitner, 2002).
The word integrate, according to The Merriam-Webster’s Dictionary (1997, p.
391), is defined as “to form, coordinate, or blend into a functioning whole.” Pierson
(2001) noted that technology integration occurs when a teacher draws on extensive
content knowledge and pedagogical knowledge in combination with technological
knowledge to provide a learning experience. The intersection of the three knowledge
areas (technological-pedagogical-content knowledge) would define effective technology
integration.
As indicated earlier, NCBL (2002) establishes significant accountability measures
for student achievement for all public schools by the year 2014. The impact of NCLB on
technology is revealed through The Enhancing Education through Technology Act
(NCLB Act, Title II, Part D, 2402) requires state educational agencies to assist every
student in crossing the digital divide to ensure that every student is technologically
literate by the time he or she finishes the eighth grade, regardless of his or her race,
ethnicity, gender, family income, geographic location, or disability. As technology
28
standards related to this Act are being implemented to support the integration of
technology into classrooms to improve teaching and learning, measures related to
technology integration become crucial. However, for technology to become a core
component of teachers’ instructional repertoire, they need time to explore, reflect,
collaborate with peers, and engage in hands-on learning (WestEd, 2002).
The U.S. Congress Office of Technology Assessment (1995) report stated that
helping teachers “effectively incorporate technology into the teaching and learning
process is one of the most important steps the nation can take to make the most of past
and continuing investments in educational technology” (p. 8). Moersch (1995) asserted
that the aim of technology integration is to find authentic ways to use technology for
concept/process-based instruction, higher-level thinking, and qualitative assessment.
Technology should be seen as a tool that supports and extends student understanding as
well as providing a hands-on inquiry to a problem or issue.
Dexter, Anderson, and Becker (1999) explained that as teachers implement any
new instructional strategy, they must first acquire the knowledge and then weave this new
knowledge into the curriculum and existing instructional skills. According to Sandholtz,
Ringstaff, and Dwyer (1997), the Apple Classrooms of Tomorrow (ACOT) research
produced the Stages of Instructional Evolution, an adoption model for the use of
technology in the classroom. This model describes the five stages of thought and practice
utilized when integrating technology. The five stages are entry, adoption, adaptation,
appropriation, and invention.
29
• Entry-stage teachers use text-based materials and instruction to support
teacher-directed activities. In this stage, teachers learn the basics of using
technology.
• Adoption-stage teachers use technology for keyboarding, word processing,
or drill-and-practice software to support traditional instruction.
• Adaptation-phase teachers integrate new technologies into traditional
classroom practices and students use word processors, databases, graphic
programs, and computer-assisted instruction.
• Appropriation-stage teachers begin to understand the usefulness of
technology and students work at computers frequently as cooperative,
project-based instruction begins to take place.
• In the invention-stage, learning becomes more student-centered as multi-
disciplinary, project-based instruction, peer tutoring, and individually
paced instruction occurs. During this stage, discovering new uses for
technology tools occurs.
As teachers advance through the developmental stages of technology integration, they
begin to realize that technology is more than a teaching tool, and then they start using
technology to create learning environments that augment student learning (Mills &
Tincher, 2003; Hadley & Sheingold, 1993).
According to the Office of Educational Research and Improvement (1993),
teachers are not motivated to tackle challenges of integrating technology unless they have
a vision for how it will improve teaching and learning. To maximize the probability that
teachers will effectively integrate technology into their teaching, the goals for learning
30
the technology must be clear, an explicit connection must be made between the
technology and teaching, and teachers must have experience with powerful technology
tools that provide access to rich information (MacKenzie, 1999).
McCombs (2003) stated that students no longer see technology as a separate
course; instead, they seamlessly apply technology tools in a wide assortment of
meaningful projects. Therefore, teachers need to establish an environment by using the
best resources available to assure that students learn and can construct their own learning
environment (Charp, 2003). Trilling and Hood (1999) stated, “We need to apply all of
our educational technology talent to the challenge of preparing teachers, parents, and
other helpers into the everyday experiences of all learners” (p. 25).
Barron, Kemker, Harmes, and Kalaydjian’s study (2003) focused on teachers’
instructional modes related to technology integration. In this study (N=2,156) with a
response rate of 35 percent, results indicated that many teachers are implementing
technology as a tool for research, communication, productivity, and problem-solving;
however, the integration across all subject areas and grade level is yet to be reached. The
study found that elementary teachers were twice as likely to use technology than high
school teachers. These results support findings by Becker, Ravitz, and Wong (1999), who
found elementary teachers use technology on a regular basis with their students.
Barriers and Facilitators to Integration
Barriers. Although most teachers recognize the importance of using technology in
their classrooms, numerous barriers can block implementation efforts (Roblyer, 1994).
Whelan, Frantz, Guerin, and Bienvenu (1997) indicated five barriers to the acquisition
and use of telecommunications are (1) lack of funds specifically allocated for
31
telecommunications (2) lack of or outdated equipment (3) inaccessibility of equipment,
(4) lack of inservice or training, and (5) lack of knowledge of ways to integrate advanced
telecommunications into the curriculum. Although teachers may not face all of these
barriers, literature suggests that any one of these barriers alone can significantly impede
meaningful classroom use (Hadley & Sheingold, 1993; Hannafin & Savenye, 1993).
Norris, Sullivan, Poirot, and Soloway (2003) reported that teachers’ use of
technology is dependent upon their access to technology. If the opportunity to access
technology is limited, use and integration of technology is minimal. Additional research
also revealed barriers to the integration of technology include lack of time, need for
ongoing assistance, required changes in attitude and pedagogical beliefs, need for a shift
in traditional teacher’s role, fear and confidence levels, and lack of relevancy of training
to instructional setting (Hruskocy, et al., 2000).
Lack of time is a critical issue (Barnett & Nichols, 1994). Many teachers are
overwhelmed by the prospect of spending additional hours after school learning to use
the computer-based technologies placed in their classrooms (Falba, et al., 2001). Whelan,
et. al., (1997) reported the biggest obstacle to using the Internet was time. Teachers
needed more time for learning to search the Internet, accessing the net, practicing their
technology skills, developing lesson plans, and correlating lesson plans with the
curriculum. “Most teachers reported spending almost three times as much as their own
time learning about computer-related technology as they spent in district-sponsored
training” (Mann & Shafer, 1997, p. 23). Findings from Mouza’s (2002/2003) study
demonstrate that expecting teachers to integrate computers into their classroom in
innovative ways in a short period of time would be unrealistic.
32
Bailey and Pownell (1998) compared using and integrating technology to the
basic physical needs in Maslow’s Hierarchy of Needs. Bailey and Pownell identified six
basic technology “physiological needs” which must be satisfied before higher-level
needs, such as the continuous application of technology, could be achieved. The first
basic need identified was time—time to learn new skills, time to think, time to practice,
coach, and collect feedback. A second “physiological need” was a detailed technology
plan that provides direction, vision, and projected outcomes. Third was a solid, well-
planned professional development program. Next were fundamental hardware, software,
and Internet access resources for teachers to be able to integrate into their curriculums.
The fifth need identified was a technology-facilitating infrastructure, the physical
availability of technology equipment and support necessary for the program to succeed.
And the sixth basic need was effective technical support readily available to provide
problem-solving and educational assistance.
Unfortunately, most schools do not allocate adequate funds for staff development.
While the private sector claims to spend 30 percent of technology budgets on training,
schools typically spend 10 percent or less (Mann & Shafer, 1997; WestEd, 2002).
Organizations should spend 30 percent of their technology budget on equipment and 70
percent on the “human infrastructure” to support ongoing training and technical
assistance (White, Ringstaff, & Kelley, 2002).
Smith and Robinson (2003) found that teachers are quickly frustrated in
technology usage by their lack of technical skills. Therefore, technical assistance and
support are also essential for curricular integration (Whelan, Frantz, Guerin, & Bienvenu,
1997). Boone (2001) discussed the importance of troubleshooting and the impact
33
technological failures have on the teaching and learning process. Those using technology
should consider all ramifications of technological failures.
Another barrier identified by Ertmer (2003, as stated by Hruskocy, 1999, and
Novak & Knowles, 1991) was the lack of knowledge among typical beginning teachers
about how to integrate computers within the more routine tasks of teaching and managing
their classrooms even though they have the technical skills and desire. Lack of
confidence for teaching with computers has been shown to influence the levels of student
computer use by beginning teachers (Ertmer, et al., 2003).
Teacher preservice preparation. Preservice teachers need more experience with
technology to be prepared to teach in our increasingly global and technological world
(Cavanaugh, 2003). According to the President’s Committee of Advisors on Science and
Technology, field experience is a critical aspect of preservice technology preparation
because it enables preservice teachers the opportunity to observe the use of educational
technology and to practice teaching with technology in schools (PCAST, 1997). Yet,
Hornung and Bronack (2000) noted that many preservice teachers find that experience
with the practical application of technology is lacking.
A survey by the American Association of Colleges of Teacher Education
(AACTE) found that one-third of preservice teachers surveyed were not required to
incorporate technology during their student teaching (Persichitte, Tharp, & Caffarella,
1997). To assist in the development of effective teacher training regarding technology
integration, Congress created the Department of Education’s Preparing Tomorrow’s
Teachers to Use Technology (PT3) grant program (Brush, 2003). PT3 was formed on the
principle that educators must understand how to create and deliver high quality,
34
technology lessons that engage students and improve learning (Mitchem, Wells, & Wells,
2003). Mitchem, Wells, and Wells reported that as teachers increase their use of
instructional technologies a concomitant increase in student engagement and instructional
practices also occurs.
Pierson (2001) stated that unless a teacher views technology use as an integral
part of the learning process, the use of technology will remain peripherally ancillary to
his or her teaching. Beyerbach, et al., (2001) reported focus group results of preservice
teachers in which the preservice teachers stated, “We learned about it, but never got to
apply it” (p. 116). These preservice teachers viewed technology as an “add-on” and
wanted more exposure to technology integration. During Beyerbach’s second year of the
study, results indicated a 15.9 percent to 68.9 percent increase in the area of instructional
methods of technology integration.
According to the most recent report of the National Center of Education Statistics
(NCES, 2000), nearly 70 percent of teachers reported not feeling well prepared to use
computers and the Internet in their teaching (Ertmer, et al., 2003). Research shows that
coursework alone is inadequate to prepare preservice teachers to be technology-using
teachers (Stuhlman, 1998). Ertmer, et al., (2003, as stated by Carlson & Gooden, 1999)
stated that few of our current or future teachers have either observed or experienced
learning with or from computers. Schrum (1999) noted that technology use is not being
effectively modeled for future teachers.
A study of Michigan preservice elementary teachers by Albee (2003) revealed
that 90 percent (n=1100) wanted more experience with using technology. Studies have
shown that preservice teachers are inadequately prepared to use instructional technology
35
and effectively integrate technology into the curriculum (Beaver, 1990; Brooks & Kopp,
1989; Roblyer, 1994). Hurteau (1990) reported only 20 percent of New York teachers felt
they had received sufficient preservice training in the integration of technology into their
classrooms. Traditionally, technology training has been software-based rather than
curriculum-based (Gilmore, 1995). Teachers lack knowledge about how to integrate
technology within the more routine tasks of teaching and managing their classrooms
(Hruskocy, 1999; Novak & Knowles, 1991). Teachers need specific ideas about how to
use technology in the classroom (Ertmer, 2003).
Ertmer, et al., (2003) reported that preservice teachers can benefit from observing
teacher models, and this modeling can help preservice teachers develop a vision for what
technology integration looks like in real classrooms as well as strategies for
implementing those visions. Data from this study suggest that providing preservice
teachers with opportunities to interact with exemplary technology users, through
electronic models, is a viable means for increasing capacity for technology integration.
Beyerbach, et al., (2001) also states that collaboration with peers is essential to
successfully integrate technology in the classroom.
America’s technological-based society is advancing at such a rapid pace that
universities are struggling to prepare students with the technology skills needed for today
(Albee, 2003). As university educators begin to realize that skill training is not enough to
prepare teachers to integrate technology within the curriculum, the attention and focus
must turn to helping both preservice and inservice teachers gain specific ideas and
confidence for technology integration (Ertmer, et al., 2003).
36
Moursund and Bielefeldt (1999) conducted a nationwide survey of 416 colleges
and schools of education in preparing teachers to use technology effectively. Results
indicated that few programs are adequately preparing preservice teachers to use
technology. Moursund and Bielefeldt noted that while a required educational technology
course may provide a useful foundation, a technology course by itself is inadequate in
preparing teachers to use technology effectively. Preservice teachers need greater
opportunities to use technology.
Beyerbach, et al., (2001) revealed that students want more technology integration
activities and desire these opportunities much earlier in their teacher preparation
programs. Using the technology, gives students more choices and direction in their own
learning (Beyerbach).
Teacher learning. Not only are preservice teachers in need of increased
preparation in technology integration, the National Center for Education Statistics
(NCES, 2000) reported that 70 percent of teachers are not well prepared to use
technology in their teaching. Rosen and Weil (1995) estimate that between one-third and
two-thirds of all teachers do not take full advantage of the technology available to them
for instruction because they do not feel confident of their own abilities to use them.
According to the research by McCannon and Crews (2000), technology is
available in schools; however, teachers use the technology for administrative tasks
instead of as an integral part of instruction. McCannon and Crews, in surveying over 170
K-5 teachers, identified six reasons why teachers have not participated in training offered
to them. These reasons are: (a) teachers were too busy; (b) they had too far to travel after
school; (c) release time was not provided during the school day; (d) no stipends were
37
offered; (e) traffic on the way to the training site was too heavy; and (f) someone else was
already providing individual help.
Facilitators. Teachers are often resistant to using technology in the classroom;
therefore, changing teachers’ attitude is key (Marcinkiewicz, 1993-1994). Research on
teachers’ beliefs found that beliefs are the best indicators of the decision individuals
make. The relationship among these beliefs and the teachers’ instructional decisions and
practices are strong (Pajares, 1992). Kagan (1992) also reported that teachers’ beliefs
appear to lie at the heart of teaching and tend to be associated with a congruent style of
teaching. Knezek and Christensen (2002) noted that teachers’ attitudes toward technology
become more positive with ongoing training. Anxiety levels tend to be reduced rather
quickly with exposure to technology. According to Akbaba and Kurubacak (1998),
training programs must be designed not only to improve teachers’ skills with technology
but also to help teachers change their attitudes toward the use of technology.
Research studies highlight the correlation between “teacher attitude” and the
successful integration of technology (Becker, 1999; Ertmer, et al., 1999; Harvey &
Purnell, 1995). Teachers with positive attitudes toward computers have been shown to
demonstrate more successful integration of technology, while teachers with negative
attitudes do not.
Rogers (1999) noted that as teachers become more comfortable with technology,
their focus on barriers decreases. Advance technology users find ways to work around
problems; whereas, novice users are more likely to be frustrated and give up due to their
lack of skills or confidence to overcome these barriers.
38
Several studies suggest that attitudes are an important factor in the use of
technology (Todman & Dick, 1993; Woodrow, 1990; and Hignite & Echternacht, 1992).
Ertmer, et al., (2003) state that teachers’ beliefs about their ability to use technology in
instruction may be key, given the role self-efficacy appears to play in determining
behavior. As noted by Eachus and Cassidy (1999) “self-efficacy has repeatedly been
reported as a major factor in understanding the frequency and success with which
individuals use computers” (p. 2).
Many characteristics affect attitudes toward new interventions in schools, but
certainly the teacher’s level of knowledge is critical (Keeler, 1996). Pierson (2001)
reported that the ways in which teachers used technology determined their personal
definitions of technology integration. Beyerbach (2001) stated that teachers learn by
doing. Technology infusion to enhance teaching is a multifaceted process that takes time,
support, and collaboration.
Coley, et. al., (1997) noted peer collaboration as essential for continuous learning.
Teachers benefit when they learn about technology from one another and provide one
another with motivation to continue learning. According to Cole (2000), individual
modeling by one teacher for others can be a valuable tool. Teachers who actually see
what another teacher has developed may come up with more ideas of how they can use
technology.
Becker and Riel (2000) found the more that teachers were involved in formal and
informal communication with their peers, the more they used technology in exemplary
ways. Time spent with other teachers in their own school and from other schools
appeared to have a strong, positive affect on their use of technology in the classroom.
39
Perhaps one of the most effective strategies an educator can use for gaining
support for integrating technology into the curriculum is to be an example and offer
support to peers (Karene, Grabinger, & Duffield, 1999). Karene, Grabinger, and Duffield
also stressed the need for administrative support. Administrators play a critical role in
facilitating change associated with integrating technology through (1) providing
opportunities to make the classroom change possible, (2) allowing time for staff
development activities, (3) sharing the vision for technology in the school, and (4)
allocating funding to technology.
Variations in technology use are closely linked to the teachers’ respective levels
of general teaching expertise. The methods teachers use to teach with and about
technology reflect ways in which he or she learns best (Pierson, 2001). Pierson states that
true integration can only be understood as the intersection of multiple types of teacher
knowledge, and, therefore, is likely as rare as expertise.
Technology should be used as a problem-solving tool in open-ended learning
environments. Morrison and Lowther (2002) noted that if a survey was conducted on
students’ parents who use technology at work, the results would most likely indicate that
parents use technology to solve problems. Education must shift the focus from the skill of
using technology to the solving of problems.
Doersch (2002) provided several tips in coaching teachers to integrate technology.
The tips include (1) assist teachers in designing lessons that integrate technology into
their regular lessons, (2) model good teaching-with-technology skills for teachers and
students, (3) co-teach with other teachers, (4) act as a resource person who can acquaint
teachers with resources that will be best for the chosen project, (5) serve as head
40
cheerleader and support person for teachers who are working hard to integrate technology
into their lessons, (6) be available in the computer lab to assist in troubleshooting, and (7)
teach the teacher how to solve common technical problems. ACOT (1999) found that
teachers who work collaboratively with others are more likely to integrate technology in
their classroom.
Professional Development
Teachers are consistently reporting an increased need for professional
development to enable them to effectively use technology to improve student learning
(NCES, 2000). Yet, best practice technology applications are not being fully
implemented into preK-12 classrooms because of limited teacher technology training
(Smith & Robinson, 2003). NCLB (2002) requires school districts to use at least 25
percent of their allocation for high quality professional development activities to prepare
teachers to integrate technology into instruction.
The Outstanding Schools Act of 1993 (SB380) indicates that each school district
shall allocate one percent of its revenue from the foundation formula for professional
development. Of the funds allocated, 75 percent shall be spent in the same fiscal year on
activities approved and consistent with the district’s improvement plans. The remaining
25 percent must also be spent on professional development but may be carried over to the
succeeding year (Missouri Department of Elementary and Secondary Education, 2004).
Desimone, et. al., (2002) states that professional development focusing on specific
training practices increased teachers’ use of those practices in the classroom. However,
Desimone, et. al., (2002) also noted that schools generally do not have an approach that is
effective in building consistency among teachers much less a coherent, coordinated
41
approach to professional development and instruction. Professional development must be
an ongoing activity in order to promote real change in education (Slavit, Sawyer, &
Curley, 2003).
Findings from longitudinal data reports reveal that professional development is
more effective in changing teachers’ classroom practices when collective participation of
teachers from the same school, department, or grade occurs. Teachers benefit from
relying on one another in developing technology skills and become “active learners”
(Desimone, et. al., 2002). Lieberman (1995) suggest that participants in professional
development should be part of a collegial network with opportunities for observation,
practice, and instructional approaches. Opportunities for teachers to observe for
themselves the impact of technology use on learning and teaching in their colleagues’
classrooms can often serve as a strong impetus for changing teachers’ beliefs (White,
Ringstaff, & Kelley, 2002).
Beyerbach’s (2001) survey findings indicated a need for more focus on
instructional methods of integrating technology. Teachers want more technology but need
step-by-step instruction and collaboration. Younger teachers may have the ability to use
word-processing applications, spreadsheets, presentation software, and Internet browsers,
but they still need help in applying these skills to teaching and learning (Charp, 2003).
As teachers advance through the developmental stages of technology integration,
they begin to realize that technology is more than a teaching tool, and then they start
using technology to create learning environments that augment student learning (Mills &
Tincher, 2003).
42
Technology infusion can transform the education process, facilitate incremental
improvements in learning, be a vital tool for educator’s professional growth, and prepare
students for a life in a high-tech world. Successful integration strategies combine these
aspects of technology, drawing support from the unique contribution of technology to
instruction, professional development, and administration. (Miller, 2001, p. 43)
According to Mouza (2002/2003), teachers need professional development that is
hands-on, is directly related to curriculum goals, and allows for follow-up support in their
classrooms. Professional development is a critical ingredient in effective use of
technology in the classroom and must be aligned to the teachers’ needs.
Pierson (2001) reported findings on exemplary technology-using teachers. These
teachers spent a good deal of personal time working with computers but also had more
extensive computer training and teaching experience. Mouza (2002/2003) noted that
teachers who received skill-based training felt more confident using technology, made
more use of digital content in their classrooms, and were more willing to experiment than
teachers who received no such training. By exposing teachers to effective classroom
strategies involving the integration of technology and by providing time for teachers to
learn and adapt those strategies, professional development does affect classroom
practices (U.S. Department of Education, 2000).
Results from the U.S. Department of Education Office of Educational Research
and Improvement (2000) indicated that professional development and teachers’ feelings
of preparation are related. The more time teachers spend in technology related
professional development activities, the better prepared they are to use technology for
classroom instruction. When teachers know how to use and then actually do use all the
43
technology tools at their disposal, the potential for student learning is increased (Mills &
Tincher, 2003).
Even when available, technological training can create a digital divide. Teachers
interested in technology increased their skills in great leaps, while the others fall further
behind in what they could offer their students. This learning differential creates a wider
gap in technology skills and applications and thus creates a digital divide (McCombs,
2003).
One must note that technology training is not a one-time effort. One or two
computer courses will not be enough to prepare teachers to integrate technology into their
classrooms. Moving teachers into more advanced levels of technology integration
requires three to five years with at least 80 hours of training (Anderson, 1998; Becker,
1994). Research and best teaching practices consistently show that without effective staff
development and continuous support, technology integration will not be achieved (Bailey
& Powell, 1998).
This continuous technology support can be found in the eMINTS program. The
eMINTS program offers extensive professional development, which includes 200 hours
of training over a two-year period along with classroom visits and access to electronic
materials (eMINTS National Center, 2005). Through the professional development
sessions and ongoing classroom support, teachers learn how to incorporate more inquiry-
based lessons and learning activities using technology into their curricula. The mission of
eMINTS is to support Missouri educators as they integrate technology into inquiry-based,
student-centered, interdisciplinary, collaborative teaching practices that result in higher
levels of student performance (Kleiman, 2004).
44
eMINTS results showed students of teachers who consistently apply the inquiry-
based instructional practices with the use of technology scored higher on the MAP tests
than did students whose teachers used other instructional practices (Kleiman, 2004). The
eMINTS Evaluation Project (2005) noted that second-year teachers in the eMINTS
program adopted more inquiry-based instructional practices utilizing technology than
first-year eMINTS teachers. This finding is expected, as teachers in their first year of
eMINTS are just beginning to teach in a fully operational eMINTS environment, but
through time and continuous training change their instructional practices to include more
inquiry-based activities (eMINTS Evaluation Project).
A number of reasons are cited in the literature as being responsible for the failure
of many professional development efforts. These reasons include: (1) the development of
activities away from the school site, (2) the irrelevance of activities to teacher classroom
practices, (3) provision of one-shot workshops without follow-up support, and (4) the
inability to address the individual needs and concerns of the teachers. (Fullan, 1991;
Miller 1998, as cited in Mouza 2002/2003).
Although lack of professional development opportunities is often reported in
terms of quantity, quality also seems to be an important issue. Traditional sit-and-get
training sessions lacking follow-up support have not been effective in preparing teachers
to integrate classroom technologies (Mouza, 2002/2003). One reason for the lack of
quality professional development is that most school districts have been preoccupied with
the acquisition of equipment rather than the allocation of adequate funds to the
professional development of their teachers (Mouza, 2002/2003).
45
Summary
The purpose of this literature review was to provide a background for the study.
Areas examined included student achievement, technology in the classroom, its influence
on student achievement, learning, and teachers’ roles and responsibilities in technology
integration. Other areas relating to teacher preservice preparation, professional
development, plus barriers and facilitators to integration were reviewed to validate and
strengthen the study.
This literature review revealed the history of student achievement and the
emphasis of the integration of technology in classrooms to support learning through the
No Child Left Behind legislation, the use of technology as a tool to help students learn,
and the increase of student success through the use of technology. Ongoing professional
development, teacher attitude, and barriers of time, access, and knowledge were also
addressed.
Chapter 3 describes the methodology used in this study. The purpose, research
questions, participants, data collection, and data analysis for both the quantitative and
qualitative research methods are presented.
46
CHAPTER 3
Research Design and Methods
Introduction
In this chapter, the problem and purpose overview of the study, research methods,
study design, procedures and research questions are presented. The appropriateness of the
methods used and the limitations of the study are discussed. The population for the study
is identified, and the methods of data collection and analysis are described.
Purpose
The purpose of this study was to investigate the use and integration of technology
into the elementary curriculum and to explore the influence of technology on student
success. This study concentrated on the teachers’ knowledge and skill levels as they
integrate technology into the curriculum and on the professional development
opportunities in technology integration provided to teachers.
Research Methods
Given the nature and focus of this investigation and research questions, a mixed
method comparative design of both quantitative and qualitative research was conducted
to more fully understand how technology is used in elementary classrooms. Data were
generated from a survey questionnaire, interviews with individual teachers, and focus
group interviews consisting of administrators and department heads. Triangulation of
data (survey questionnaire, individual interviews, and focus group interviews) provided
consistent evidence and increased the validity of the findings.
47
Setting
North Elementary School is a school of 689 students located in an urban setting in
a mid-western state. The district has five elementary schools, with a total district student
population of 3,131. The history of North Elementary School as a successful technology-
using school made it a desirable location to investigate. The site was chosen for this study
for the following reasons: (a) the school has incorporated several technology classrooms,
(b) the number of staff members was sufficiently large to support the study, (c) the school
was close in proximity to the researcher, and (d) the administration and faculty were open
to participating in the study.
South Elementary School is a school of 354 students located in an urban setting in
a mid-western state. The district has eight elementary schools with a total district
population of 5,839 students. This school was chosen for the study for the following
reasons: (a) similar grade pattern configurations, student demographics, free/reduced
lunch percentages, and level of technology access as North Elementary School, (b) the
school was close in proximity for the researcher, and (c) the administration and faculty
were open to participating in the study.
Research Questions
The overarching question guiding this multi-site mixed method comparative
design is: Does the use of technology influence student success in elementary
classrooms? The following research questions were designed to address this overarching
question: (1) What are the teachers’ perceptions of their role and responsibility in
integrating technology? (2) What are the teachers’ perceptions of technology influence on
48
student success? and (3) What types of professional development activities related to
integrating technology in elementary classrooms have been conducted?
Quantitative Research
Null Hypotheses
The following hypotheses were tested in this study:
HO1: There are no significant differences between teachers’ perception about their
roles and responsibilities in the use of technology in one elementary school
(technology school) that has an intensive technology program (eMINTS) and
another elementary school (non-technology school) that does not have an
intensive technology program for the following subgroups of teachers within the
two schools:
a) teachers in grades K-3 of both schools
b) teachers in the non-technology school grades 1-3 and Non-eMINTS
teachers in the technology school K-6
c) teachers in the non-technology school grades 1-3 and teachers in the
eMINTS program grades 3-6
d) teachers in the technology school grades 3-6 that were eMINTS teachers
and teachers in the same school grades K-6 that were not eMINTS
teachers.
HO2: There are no significant differences in teachers’ perception of technology
influence on student success in one elementary school (technology school) that
has an intensive technology program (eMINTS) and another elementary school
49
(non-technology school) that does not have an intensive technology program for
the following subgroups of teachers within the two schools:
a) teachers in grades K-3 of both schools
b) teachers in the non-technology school grades 1-3 and Non-eMINTS
teachers in the technology school K-6
c) teachers in the non-technology school grades 1-3 and teachers in the
eMINTS program grades 3-6
d) teachers in the technology school grades 3-6 that were eMINTS teachers
and teachers in the same school grades K-6 that were not eMINTS
teachers.
HO3: There are no significant differences in the type of professional development
activities related to integrating of technology in one elementary school
(technology school) that has an intensive technology program (eMINTS) and
another elementary school (non-technology school) that does not have an
intensive technology program for the following subgroups of teachers within the
two schools:
a) teachers in grades K-3 of both schools
b) teachers in the non-technology school grades 1-3 and Non-eMINTS
teachers in the technology school K-6
c) teachers in the non-technology school grades 1-3 and teachers in the
eMINTS program grades 3-6

50
d) teachers in the technology school grades 3-6 that were eMINTS teachers
and teachers in the same school grades K-6 that were not eMINTS
teachers.
Participants
This multi-site mixed method comparative design investigated the integration of
technology in two urban elementary schools, South Elementary School and North
Elementary School. School names were changed to protect the anonymity of the school
and its staff members. These schools are both urban elementary schools with similar
demographics. The criterion for selection were based on size of school, ethnicity of
school, free and reduced lunch statistics, rate of attendance, and level of technology
access.
Student demographic data consisted of South Elementary with 354 students in
grades one through three and North Elementary with 689 students, kindergarten through
grade six. Ethnicity data of the comparing schools included 93.2% African-American,
4.2% Caucasian, 1.4% Hispanic-American, and Asian-American 1.1% at South
Elementary School and 96.7% African-American, 3.2% Caucasian, and 0.1% American
Indian at North Elementary School. MAP data in grade three communication arts for
2004 reported South Elementary’s Step 1/Progressing at 48.5 and Proficient/Advanced at
12.9. North Elementary MAP data in grade three communication arts for Step
1/Progressing reflects 54.7 and 4.7 for Proficient/Advanced. Socioeconomic status
reflected through free and reduced lunch rates are 86.3% for South Elementary and
80.7% for North Elementary. The level of technology access for the schools indicated

51
3.78 students per computer for South Elementary and 3.46 students per computer for
North Elementary.
Teacher demographic data revealed 28 certificated staff members for South
Elementary and 59 certificated staff members at North Elementary. Ethnicity data of staff
at each school included 47.1% Caucasian, 29.4% African-American, 5.9% Hispanic-
American, and 17.6% not indicated at South Elementary with 80.5% Caucasian, 14.6%
African-American, and 4.9% not indicated at North Elementary. The average years of
experience for South Elementary is 10.6 years with North Elementary having 6.9 years.
The percentage of teachers with a Master Degree or higher was very similar between
South and North Elementary with a 29.3% and 29.4% respectively.
Instrumentation
Once the administration from each school agreed to participate in the study, a
letter (see Appendix A) explaining the purpose and focus of the study along with the
survey questionnaire (see Appendix C) were sent to each building principal. At a staff
meeting in both elementary schools, participants signed a consent form (see Appendix B)
explaining the study and reassuring them that their answers will remain confidential and
would only be used for this study. With the receipt of the signed consent form, survey
questionnaires were distributed to certificated staff members in both elementary schools
at a staff meeting and collected when completed.
The survey questionnaire (see Appendix C) was constructed by the researcher to
obtain feedback from participants regarding the use and integration of technology. The
survey questionnaire was field tested with pilot groups of administrators and teachers to
ensure validity. The survey questionnaire consisted of 37 Likert-type items using a 5
52
point scale: “1” Strongly Disagree, “2” Disagree, “3” Neutral, “4” Agree, and “5”
Strongly Agree; 2 open-ended questions; and 16 questions focusing on demographic data.
Examples of questions posed include: (1) Teachers are reluctant to use computers in our
school; (2) I think technology has empowered teachers; and (3) Staff development in
technology is encouraged.
Data Collection
Through this multi-site comparative case study design, three phases of data
collection took place. Data collection for the case study began with literature and survey
questionnaire data. Phase one included a survey questionnaire sent to all teachers in both
elementary schools (n=87). Prior to completing the survey questionnaire, participants
signed a consent form describing the study and assuring the participants that their
responses would be confidential.
Data Analysis
Through the quantitative method, data from the survey questionnaire were
analyzed using descriptive statistics through a statistical package, Statistical Package for
Social Sciences (SPSS) version 12.0. Frequencies and percentages on the demographic
characteristics of the respondents present a descriptive profile of those individuals who
actually responded to the survey questionnaire. A t-test was utilized to test the
significance of differences for the research questions.
Qualitative Research
Bogdan and Biklen (1998) defined qualitative data analysis as “working with
data, organizing them, breaking them into manageable units, synthesizing them,
searching for patterns, discovering what is important and what is to be learned, and
53
deciding what you will tell others” (p. 157). Qualitative data analysis consisted of
individual and focus group interviews. With the interviewees’ consent, all interviews
were tape recorded and transcribed to ensure that all the information was available for
analysis. This analysis, which involved open and axial coding, permitted the emergence
of categories and themes, and through selective coding, the development of interthematic
relationships.
Development of Categories
Initial open coding of the interview data revealed components that fit into
categories described in the literature. Axial coding methods were used to chart recurring
codes into categories. After reassembling and reconceptualizing the data and searching
for causal conditions through the process of axial coding and an affinity diagram,
selective coding was used to develop interrelationships among the categories for theme
development (Bogdan & Biklen, 1998; Creswell, 1994).
Participants
Participants involved in the qualitative research process included five individuals
teacher interviews and one focus group interview consisting of the building administrator
and department heads from both urban elementary schools, South Elementary and North
Elementary. The nature of qualitative research required the use of schools within close
proximity of the investigator. Repeated visits were made, so proximity was a viable issue.
Data Sources
A purposeful sampling of certificated teachers identified by their level of
technology usage from each elementary school was utilized to select participants to be
interviewed (Bogdan & Biklen, 1998). Informed consent was obtained prior to the
54
interviews. Prior to the start of the interview process, all certificated staff members were
requested to and did sign a consent form (see Appendix D and F) explaining the study
and its purpose. To gain a thorough understanding of the integration of technology in
elementary classrooms, a set of interview questions for the individual interviews
(Appendix E) and the focus group interviews (Appendix G) were asked to each
participant in order to provide consistent data.
Data Collection
Phase two involved interviews of individual certificated staff members from both
elementary schools (n=10) who were responsible for technology integration in their
classroom. Random purposeful sampling (Bogdan & Biklen, 1998) of teachers in both
elementary schools was utilized for interview participants. Participants were certificated
staff members and were randomly selected based on their grade level and level of
technology usage to facilitate this comparative study. Phase three included a focus group
interview of administrators and department heads was conducted at both elementary
schools.
As encouraged by Bogdan and Biklen (1998), protocols with points of emphasis
to cover at the beginning of each interview were designed to provide a consistent
foundation for the researcher. Each interviewee was provided with a consent form (see
Appendix D) with the purpose of the study and assurance of confidentiality outlined.
Sample questions that were asked of participants included: Do you think technology
positively or negatively influences student learning? Do you use technology in your
classroom? If so, when did you first begin to use it and why did you decide to use
technology? If not, why don’t you use technology? What do you think are benefits to
55
using technology? What are the pitfalls of using technology in the classroom? Is
technology used to increase basic skills and knowledge or as a resource helping students
develop higher order thinking skills?
These in-depth, semi-structured individual teacher and focus group interviews
were used to determine the perceptions of the participants around issues of technology
usage in the classroom. The research questions were explored by asking participants to
respond to interview questions (see Appendix E and G) about their role and responsibility
in integrating technology and the relationship of professional development activities with
the level of integration. Follow-up questions probed for deeper meaning and clarification
of the interviewee’s experience.
Interviews were conducted before, after, and during the day over a period of
several weeks. Most interviews were conducted in the area where the staff member
worked, although some had to be conducted in other areas of the building for logistical
reasons.
Data Analysis
All individual interviews and focus group interviews were conducted in person by
the researcher. Individual and focus group interview data were recorded, transcribed, and
analyzed to identify patterns, themes, threads, and topics of beliefs, values, and practices
as related to the teachers’ classroom technology use. Strauss and Corbin (as cited in
Hoepfl, 1997) indicate that qualitative methods can be used to better understand any
phenomenon about which little is yet known. The inductive process of qualitative
methods permits a more in-depth comprehension of a social or human problem as well as
56
building a complex picture with words that provide rich detail and insights into
participants’ experiences (Creswell, 1994).
To analyze the interview data, the process of open and axial coding was
developed as described by Bodgan and Biklen (1998). The coding process included
identifying concepts embedded within the data, organizing discrete concepts into
categories, and linking them to broad themes. The researcher read the data in search of
regularities and patterns as well as topics the data revealed. An affinity diagram was used
to reassemble and reconceptualize the data for theme development.
Focus group interview responses were also recorded, transcribed, and coded
through the open and axial coding system. Observation data were also analyzed to
identify patterns and topics. The observation data were used to substantiate the survey
questionnaire data. Triangulation of data (survey questionnaire, individual interviews,
and focus group interviews) provided consistent evidence and increased the validity.
Summary
This study employed a mixed method case study design of both quantitative and
qualitative investigation. The study examined how technology is used and integrated into
the elementary classroom of South Elementary School and North Elementary School and
the influence of technology on student success. Specifically, the role of the teacher with
regard to the teacher’s knowledge and skill level plus the professional development
opportunities provided to these teachers in the area of technology integration was studied.
The research problem and purposes overview, research methods, research
questions, research hypothesis, participants, instrumentation, data collection, and data
analysis were presented in Chapter 3. Results from the data analyses will be presented in

57
Chapter 4. The study’s findings, recommendations, and conclusions will be included in
Chapter 5.
58
Chapter 4
Presentation and Analysis of Data
Introduction
Since the 1960s, school reform issues have focused on restructuring schools to
include more rigorous and measurable standards to improve student academic success. In
2002, the No Child Left Behind Act (NCLB), containing the most sweeping changes in
federal law effecting education, was signed into law. One aspect of NCLB, a government
mandate establishing significant accountability measures for public schools by the year
2014, focused on the integration of technology into classrooms to improve teaching and
learning.
Many national, state, and local initiatives have provided schools with computer
hardware and software, allowed schools and classrooms to connect to the Internet, and
supported technology-focused professional opportunities for teachers (Coley, 1997; U.S.
Department of Education, 1996). These initiatives have been aimed at understanding how
best to use technology to improve teaching and learning as well as training educators to
effectively use technology (Williams, 2000).
Teaching with technology requires a shift from the traditional teaching practice.
For technology to transform teaching and learning, the teacher’s role must be redefined,
and existing teaching practice must change (Wiburg, 1997). While the Technology Policy
Brief of WestEd (2002) noted that the use of technology can have a transformative effect
on education by redefining teacher and student roles, few empirical studies have been
conducted to determine the influence of technology on student success (Page, 2002;
Mann & Shafer, 1997).
59
Study Design
The purpose of this study was to investigate the use and integration of technology
into the elementary curriculum and to explore the influence of technology on student
success. This study focused on teachers’ perception of their knowledge and skills and
their professional development experiences as they integrate technology into the
curriculum for two urban elementary schools in a mid-western state. Data were generated
from a survey questionnaire of teachers and interviews. One school, with the pseudonym
of South Elementary, was referred to as the “non-technology” school. The other school,
referred to as North Elementary, was the “technology” school for the purpose of this
study.
As a mixed method design this study utilized both quantitative and qualitative
data. A survey instrument (see Appendix C) was used to collect quantitative data for
analysis to determine (a) the teachers’ perceptions of their role and responsibility in
integrating technology, (b) the teachers’ perceptions of the influence of the use of
technology on student success, and (c) the type of professional development activities
related to integrating technology in elementary classrooms.
Respondents from two urban elementary schools were certificated staff members.
Teacher demographic data revealed 28 certificated staff members for South Elementary
and 59 certificated staff members at North Elementary. Ethnicity data of staff at each
school included 47.1% Caucasian, 29.4% African-American, 5.9% Hispanic-American,
and 17.6% not indicated at South Elementary with 80.5% Caucasian, 14.6% African-
American, and 4.9% not indicated at North Elementary. The average years of experience
for South Elementary was 10.6 years with North Elementary having 6.9 years. The
60
percentage of teachers with a Master Degree or higher was very similar between South
and North Elementary with a 29.3% and 29.4% respectively.
The teachers from the two schools were asked to complete a 37-item survey (see
Appendix C) designed to identify the respondents’ perceptions about the use of
technology in their school and classroom. The survey used a five-point Likert-type scale
of 1 = strongly disagree, 2 = disagree, 3 = neutral, 4 = agree, and 5 = strongly agree. The
survey also included two open-ended questions and 16 descriptive demographic
questions. The questions were developed to measure teachers’ perceptions about
technology and the influence of technology on student success. The subscales in the
survey were ideology, student success, time, computer efficacy, empowerment,
importance, external pressure, training, competence, resources, and technical support.
Following the analysis of quantitative survey data, qualitative data from
individual interviews and focus group interviews were used to better understand the
influence of technology on student success. Five individual teachers were interviewed
from each school. The focus group interview included the building administrator and
department heads or lead teachers at each elementary school. These in-depth, semi-
structured interviews were used to determine the perceptions of the participants about
issues of technology usage in the classroom. Through these interviews, participants
shared their role and responsibility in integrating technology and the relationship of
professional development activities about technology with the level of integration of
technology. Follow-up questions probed for deeper meaning and clarification of the
interviewee’s experience.
61
Interviews were conducted before, after, and during the day. Most interviews
were conducted in the area where the staff members worked, although some had to be
conducted in other areas of the building for logistical reasons.
Research Questions
The overarching question guiding this mixed method comparative study was:
Does the use of technology influence student success in elementary classrooms? The
following research questions were examined during the completion of this study:
1. What are the teachers’ perceptions of their roles and responsibilities for
integrating technology in the classroom?
2. What are the teachers’ perceptions of the influence of technology on student
success?
3. What types of professional development activities related to integrating
technology in elementary classrooms have been conducted?
Limitations
One school in this study was selected because of the technological interventions
present in that school, and the other school was selected because of geographic proximity
and demographic similarity with the technology school. This study utilized self-reporting
data. Findings of the study are based on the perception data of teachers and the
assumption that teachers will respond honestly and interpret the instrument as intended.
Null Hypotheses
The following hypotheses were tested in this study:
HO1: There are no significant differences between teachers’ perception about their
roles and responsibilities in the use of technology in one elementary school
62
(technology school) that has an intensive technology program (eMINTS) and
another elementary school (non-technology school) that does not have an
intensive technology program for the following subgroups of teachers within the
two schools:
a) teachers in grades K-3 of both schools
b) teachers in the non-technology school grades 1-3 and Non-eMINTS
teachers in the technology school K-6
c) teachers in the non-technology school grades 1-3 and teachers in the
eMINTS program grades 3-6
d) teachers in the technology school grades 3-6 that were eMINTS teachers
and teachers in the same school grades K-6 that were not eMINTS
teachers.
HO2: There are no significant differences in teachers’ perception of technology
influence on student success in one elementary school (technology school) that
has an intensive technology program (eMINTS) and another elementary school
(non-technology school) that does not have an intensive technology program for
the following subgroups of teachers within the two schools:
a) teachers in grades K-3 of both schools
b) teachers in the non-technology school grades 1-3 and Non-eMINTS
teachers in the technology school K-6
c) teachers in the non-technology school grades 1-3 and teachers in the
eMINTS program grades 3-6
63
d) teachers in the technology school grades 3-6 that were eMINTS teachers
and teachers in the same school grades K-6 that were not eMINTS
teachers.
HO3: There are no significant differences in the type of professional development
activities related to integrating technology in one elementary school (technology
school) that has an intensive technology program (eMINTS) and another
elementary school (non-technology school) that does not have an intensive
technology program for the following subgroups of teachers within the two
schools:
a) teachers in grades K-3 of both schools
b) teachers in the non-technology school grades 1-3 and Non-eMINTS
teachers in the technology school K-6
c) teachers in the non-technology school grades 1-3 and teachers in the
eMINTS program grades 3-6
d) teachers in the technology school grades 3-6 that were eMINTS teachers
and teachers in the same school grades K-6 that were not eMINTS
teachers.
Demographic Data
School, student, and teacher demographic data from the two schools participating
in this study are presented in Table 1. School demographic data included the grade levels
for each school site, the enrollment for those sites, and the number of certificated teachers
per site. Student demographic data included enrollment, race, free or reduced lunch, 2004
Missouri Assessment Program (MAP) results in third grade communication arts, and
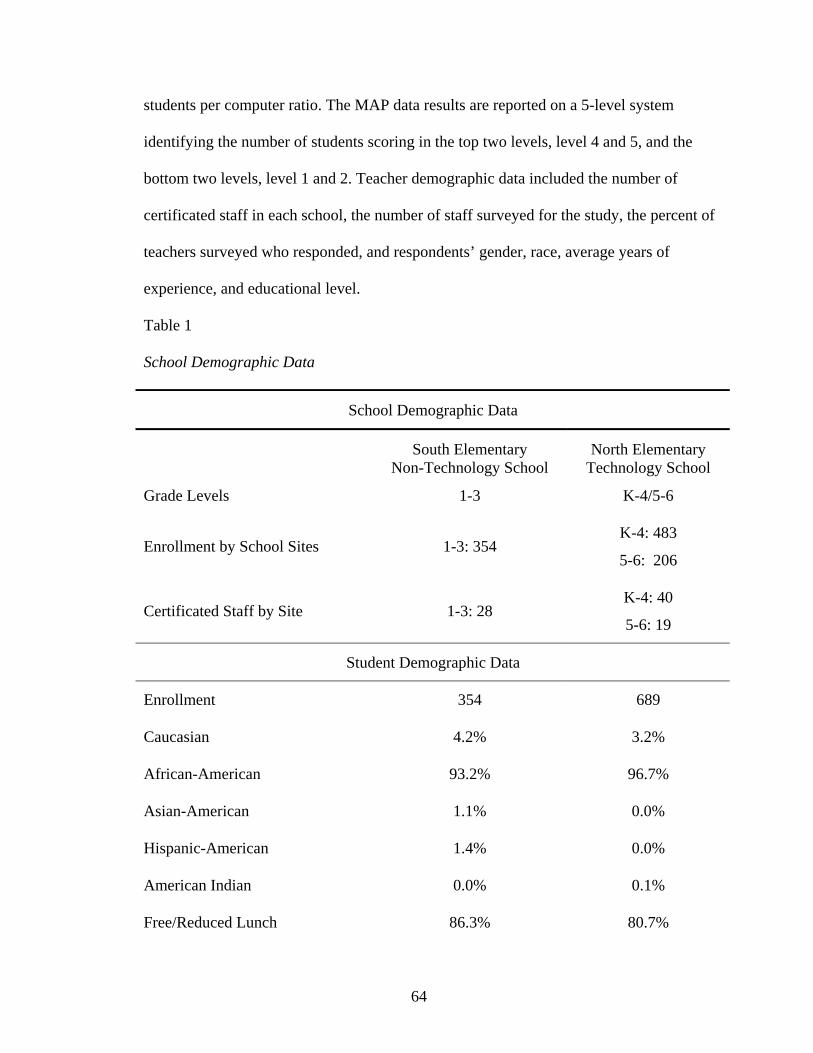
64
students per computer ratio. The MAP data results are reported on a 5-level system
identifying the number of students scoring in the top two levels, level 4 and 5, and the
bottom two levels, level 1 and 2. Teacher demographic data included the number of
certificated staff in each school, the number of staff surveyed for the study, the percent of
teachers surveyed who responded, and respondents’ gender, race, average years of
experience, and educational level.
Table 1 School Demographic Data
School Demographic Data
South Elementary Non-Technology School
North Elementary Technology School
Grade Levels 1-3 K-4/5-6
Enrollment by School Sites 1-3: 354 K-4: 483
5-6: 206
Certificated Staff by Site 1-3: 28 K-4: 40
5-6: 19
Student Demographic Data
Enrollment 354 689
Caucasian 4.2% 3.2%
African-American 93.2% 96.7%
Asian-American 1.1% 0.0%
Hispanic-American 1.4% 0.0%
American Indian 0.0% 0.1%
Free/Reduced Lunch 86.3% 80.7%
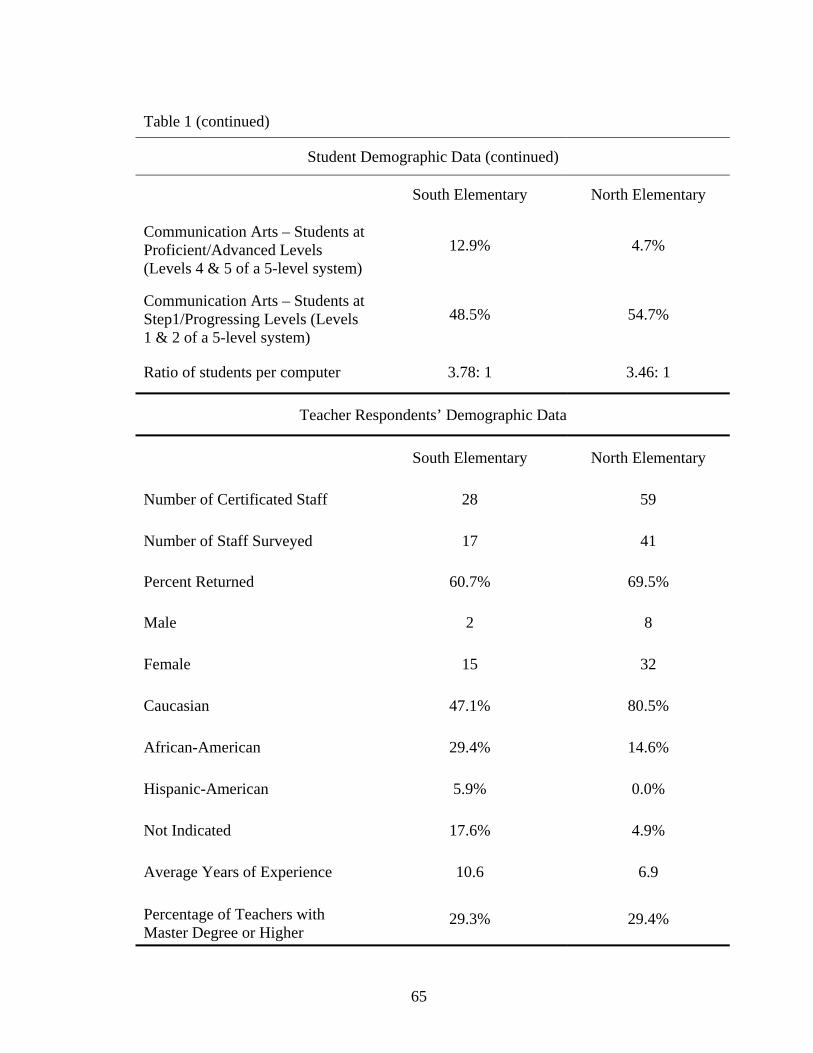
65
Table 1 (continued)
Student Demographic Data (continued)
South Elementary North Elementary
Communication Arts – Students at Proficient/Advanced Levels (Levels 4 & 5 of a 5-level system)
12.9% 4.7%
Communication Arts – Students at Step1/Progressing Levels (Levels 1 & 2 of a 5-level system)
48.5% 54.7%
Ratio of students per computer 3.78: 1 3.46: 1
Teacher Respondents’ Demographic Data
South Elementary North Elementary
Number of Certificated Staff 28 59
Number of Staff Surveyed 17 41
Percent Returned 60.7% 69.5%
Male 2 8
Female 15 32
Caucasian 47.1% 80.5%
African-American 29.4% 14.6%
Hispanic-American 5.9% 0.0%
Not Indicated 17.6% 4.9%
Average Years of Experience 10.6 6.9
Percentage of Teachers with Master Degree or Higher
29.3% 29.4%

66
South Elementary had an enrollment of 354 students in grades 1-3 and a
certificated staff of 28 teachers. North Elementary was a two-site school, with the two
buildings supervised by one principal and an assistant principal and located five city
blocks apart, with an enrollment of 698 students in grades K-6 and 59 certificated staff
members. School socio-economic status of students qualifying for free or reduced
lunches ranged from 86.3 percent of the students at South Elementary to 80.7 percent at
North Elementary. The majority of the student population at both elementary schools is
African-American, with 93.2 percent at South Elementary and 96.7 percent at North
Elementary. On the 2004 state assessment test for third grade communication arts test,
12.9 percent of the students at South Elementary scored at the Proficient/Advanced level
and 48.5 percent at the Step 1/Progressing level. The Proficient/Advanced levels are the
two highest levels of the 5-level system on the state assessment and represent scores
above grade level. The Step 1/Progressing levels are the two lowest levels on the state
assessment and represent scores below grade level. At North Elementary the comparable
assessment data were 4.7% in the Proficient/Advanced level and 54.7% in the Step
1/Progressing level. The ratio of students per computer for the two schools was 3.78:1 for
South Elementary and 3.46:1 for North Elementary.
Teacher demographic data are also presented in Table 1. North Elementary
schools had more than twice as many staff as South Elementary. The percent of teachers
completing the survey at each school were 60.7 percent (n=17) from South Elementary
and 69.5 percent (n=41) from North Elementary. Teacher ethnicity at South Elementary
was 47.1 percent Caucasian, 29.4 percent African-American, 5.9 percent Hispanic-
American, and 17.6 percent of respondents did not indicate ethnicity. The comparable
67
percentages for North Elementary respondents were 80.5 percent Caucasian, 14.6 percent
African-American, and 4.9 percent of respondents did not indicate ethnicity. Average
years teaching experience were 10.6 years for South Elementary and 6.9 years for North
Elementary respondents. The percentages of respondents with a Master Degree or higher
were the same for both schools.
Quantitative Data
Teacher responses to the survey instrument were recorded in an Excel spreadsheet
and then transferred into the Statistical Package for Social Sciences (SPSS), version 12.0
for analysis. The 37 Likert-type questions were clustered into eleven areas: ideology,
student success, time, computer efficacy, empowerment, importance, external pressure,
training, competence, resources, and technical support. From these eleven areas, two
broad categories, beliefs and realities, were created. A t-test was utilized to test
significant differences between the teachers’ perceptions in the two schools for the broad
categories of beliefs and realities as well as the specific sub-scales for the two broad
categories. Numerous t-tests were run during this exploratory study. Caution should be
used because the potential to obtain statistically significant findings by chance is high due
to the number of tests run and the size of the “n”.
Data for HO1 are presented in Tables 2A through 5B. Hypothesis two findings are
in Tables 6 through 9. Data for HO3 are presented in Tables 10 through 13.
Hypothesis One
Hypothesis one (HO1): There are no significant differences between teachers’
perception about their roles and responsibilities in the use of technology in one
elementary school (technology school) that has an intensive technology program
68
(eMINTS) and another elementary school (non-technology school) that does not have an
intensive technology program for the following subgroups of teachers within the two
schools:
a) teachers in grades K-3 of both schools
b) teachers in the non-technology school grades 1-3 and Non-eMINTS
teachers in the technology school K-6
c) teachers in the non-technology school grades 1-3 and teachers in the
eMINTS program grades 3-6
d) teachers in the technology school grades 3-6 that were eMINTS teachers
and teachers in the same school grades K-6 that were not eMINTS
teachers.
The means and test of differences for this hypothesis are presented in Table 2A
through 5B. The data in Table 2A and 2B are for respondents from staff in grades 1-3
from both schools, the grade levels that are directly comparable in the two schools. The
survey items were grouped by “beliefs” and “reality”. The data were analyzed for the
items associated with “beliefs” and thus included the subscales of (a) ideology, (b) time,
(c) computer efficacy, (d) empowerment, and (e) importance. The data were also
analyzed for the items associated with “reality” which included the subscales of (a)
external pressure, (b) competence, (c) resources, and (d) technical support.
The belief statements were reported in Table 2A. The ideology category was the
only cluster of items that showed a significant difference (t:2.115; p:.042). The mean for
South Elementary was 4.1282 and the mean for North Elementary was 3.8500. The
significantly different items were (a) “Computers motivate students” with the mean for
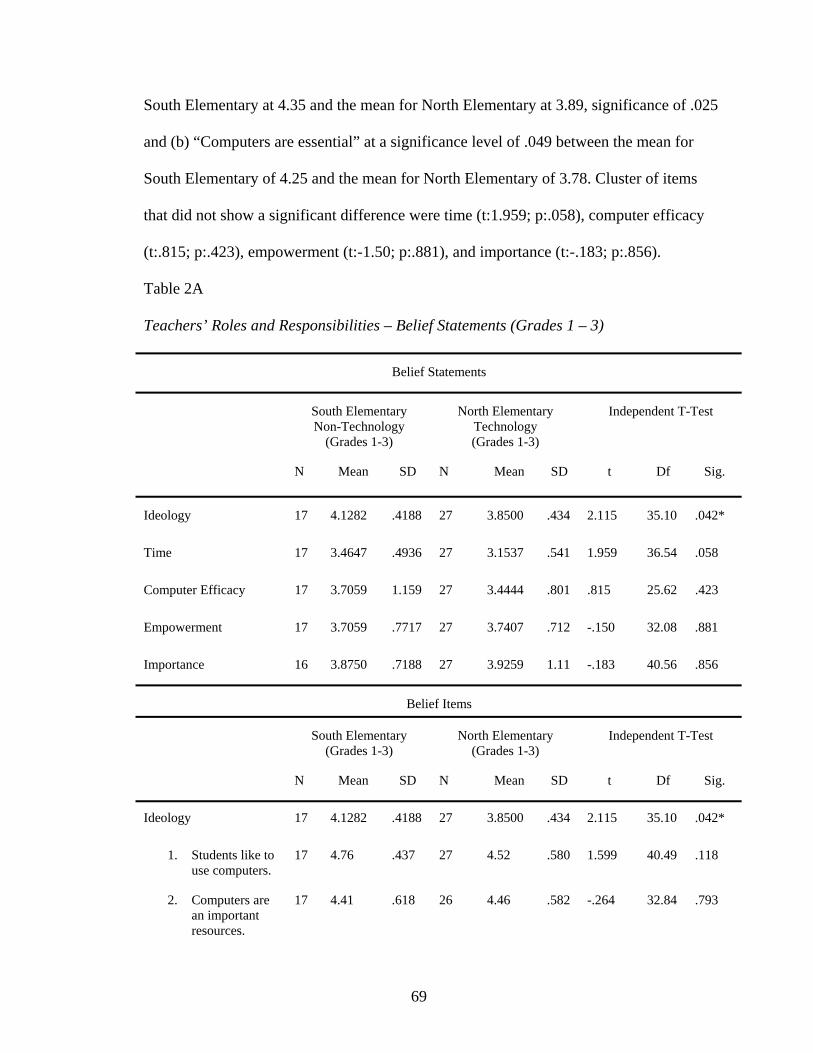
69
South Elementary at 4.35 and the mean for North Elementary at 3.89, significance of .025
and (b) “Computers are essential” at a significance level of .049 between the mean for
South Elementary of 4.25 and the mean for North Elementary of 3.78. Cluster of items
that did not show a significant difference were time (t:1.959; p:.058), computer efficacy
(t:.815; p:.423), empowerment (t:-1.50; p:.881), and importance (t:-.183; p:.856).
Table 2A
Teachers’ Roles and Responsibilities – Belief Statements (Grades 1 – 3)
Belief Statements
South Elementary Non-Technology
(Grades 1-3)
North Elementary Technology (Grades 1-3)
Independent T-Test
N Mean SD N Mean SD t Df Sig.
Ideology 17 4.1282 .4188 27 3.8500 .434 2.115 35.10 .042*
Time 17 3.4647 .4936 27 3.1537 .541 1.959 36.54 .058
Computer Efficacy 17 3.7059 1.159 27 3.4444 .801 .815 25.62 .423
Empowerment 17 3.7059 .7717 27 3.7407 .712 -.150 32.08 .881
Importance 16 3.8750 .7188 27 3.9259 1.11 -.183 40.56 .856
Belief Items
South Elementary (Grades 1-3)
North Elementary (Grades 1-3)
Independent T-Test
N Mean SD N Mean SD t Df Sig.
Ideology 17 4.1282 .4188 27 3.8500 .434 2.115 35.10 .042*
1. Students like to use computers.
17 4.76 .437 27 4.52 .580 1.599 40.49 .118
2. Computers are an important resources.
17 4.41 .618 26 4.46 .582 -.264 32.84 .793
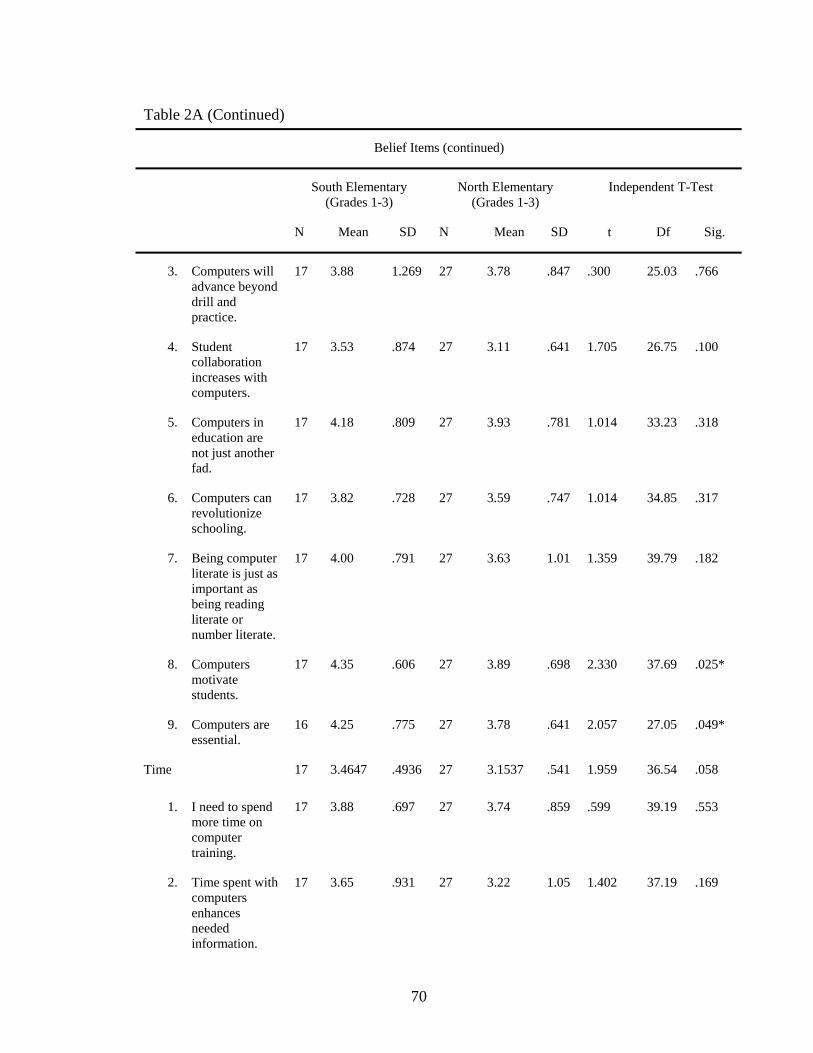
70
Table 2A (Continued)
Belief Items (continued)
South Elementary (Grades 1-3)
North Elementary (Grades 1-3)
Independent T-Test
N Mean SD N Mean SD t Df Sig.
3. Computers will advance beyond drill and practice.
17 3.88 1.269 27 3.78 .847 .300 25.03 .766
4. Student collaboration increases with computers.
17 3.53 .874 27 3.11 .641 1.705 26.75 .100
5. Computers in education are not just another fad.
17 4.18 .809 27 3.93 .781 1.014 33.23 .318
6. Computers can revolutionize schooling.
17 3.82 .728 27 3.59 .747 1.014 34.85 .317
7. Being computer literate is just as important as being reading literate or number literate.
17 4.00 .791 27 3.63 1.01 1.359 39.79 .182
8. Computers motivate students.
17 4.35 .606 27 3.89 .698 2.330 37.69 .025*
9. Computers are essential.
16 4.25 .775 27 3.78 .641 2.057 27.05 .049*
Time 17 3.4647 .4936 27 3.1537 .541 1.959 36.54 .058
1. I need to spend more time on computer training.
17 3.88 .697 27 3.74 .859 .599 39.19 .553
2. Time spent with computers enhances needed information.
17 3.65 .931 27 3.22 1.05 1.402 37.19 .169
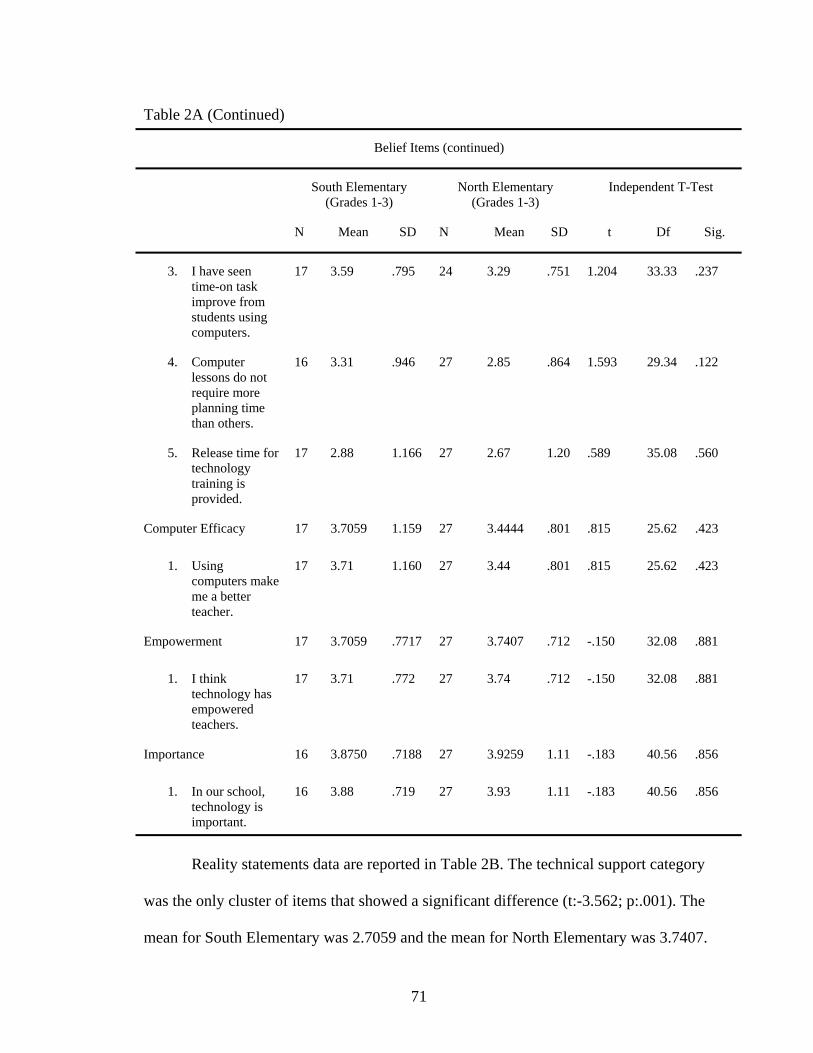
71
Table 2A (Continued)
Belief Items (continued)
South Elementary (Grades 1-3)
North Elementary (Grades 1-3)
Independent T-Test
N Mean SD N Mean SD t Df Sig.
3. I have seen time-on task improve from students using computers.
17 3.59 .795 24 3.29 .751 1.204 33.33 .237
4. Computer lessons do not require more planning time than others.
16 3.31 .946 27 2.85 .864 1.593 29.34 .122
5. Release time for technology training is provided.
17 2.88 1.166 27 2.67 1.20 .589 35.08 .560
Computer Efficacy 17 3.7059 1.159 27 3.4444 .801 .815 25.62 .423
1. Using computers make me a better teacher.
17 3.71 1.160 27 3.44 .801 .815 25.62 .423
Empowerment 17 3.7059 .7717 27 3.7407 .712 -.150 32.08 .881
1. I think technology has empowered teachers.
17 3.71 .772 27 3.74 .712 -.150 32.08 .881
Importance 16 3.8750 .7188 27 3.9259 1.11 -.183 40.56 .856
1. In our school, technology is important.
16 3.88 .719 27 3.93 1.11 -.183 40.56 .856
Reality statements data are reported in Table 2B. The technical support category
was the only cluster of items that showed a significant difference (t:-3.562; p:.001). The
mean for South Elementary was 2.7059 and the mean for North Elementary was 3.7407.
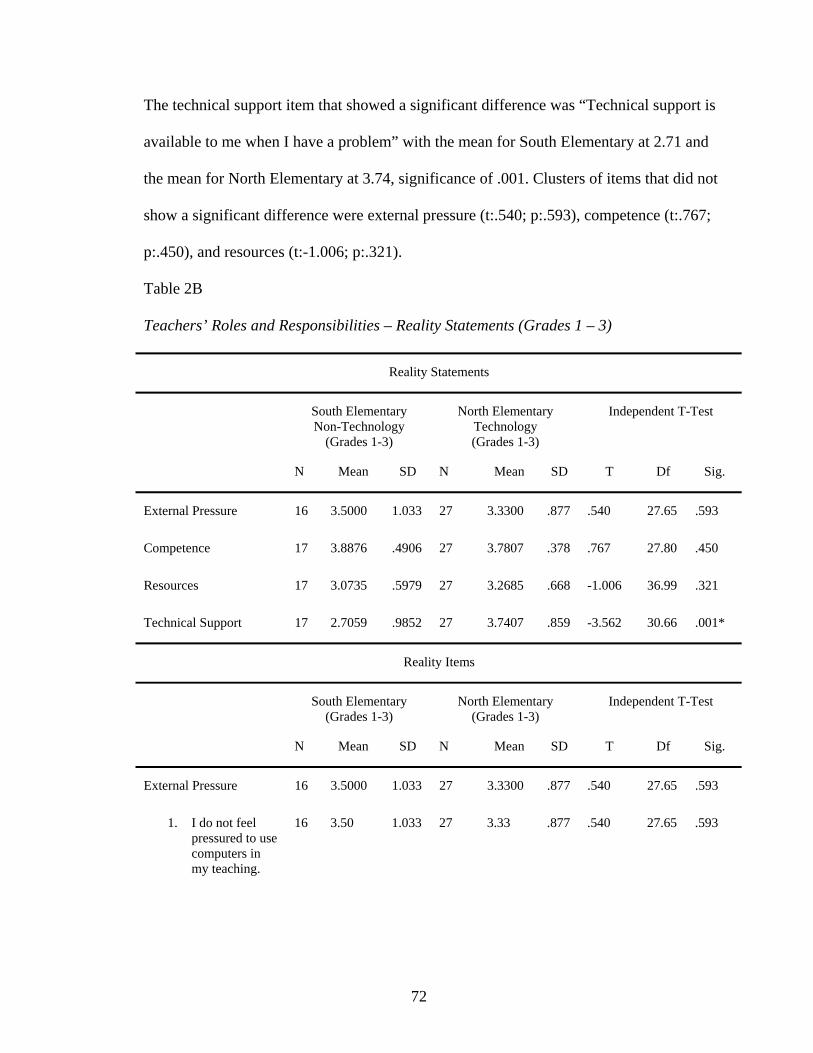
72
The technical support item that showed a significant difference was “Technical support is
available to me when I have a problem” with the mean for South Elementary at 2.71 and
the mean for North Elementary at 3.74, significance of .001. Clusters of items that did not
show a significant difference were external pressure (t:.540; p:.593), competence (t:.767;
p:.450), and resources (t:-1.006; p:.321).
Table 2B Teachers’ Roles and Responsibilities – Reality Statements (Grades 1 – 3)
Reality Statements
South Elementary Non-Technology
(Grades 1-3)
North Elementary Technology (Grades 1-3)
Independent T-Test
N Mean SD N Mean SD T Df Sig.
External Pressure 16 3.5000 1.033 27 3.3300 .877 .540 27.65 .593
Competence 17 3.8876 .4906 27 3.7807 .378 .767 27.80 .450
Resources 17 3.0735 .5979 27 3.2685 .668 -1.006 36.99 .321
Technical Support 17 2.7059 .9852 27 3.7407 .859 -3.562 30.66 .001*
Reality Items
South Elementary (Grades 1-3)
North Elementary (Grades 1-3)
Independent T-Test
N Mean SD N Mean SD T Df Sig.
External Pressure 16 3.5000 1.033 27 3.3300 .877 .540 27.65 .593
1. I do not feel pressured to use computers in my teaching.
16 3.50 1.033 27 3.33 .877 .540 27.65 .593
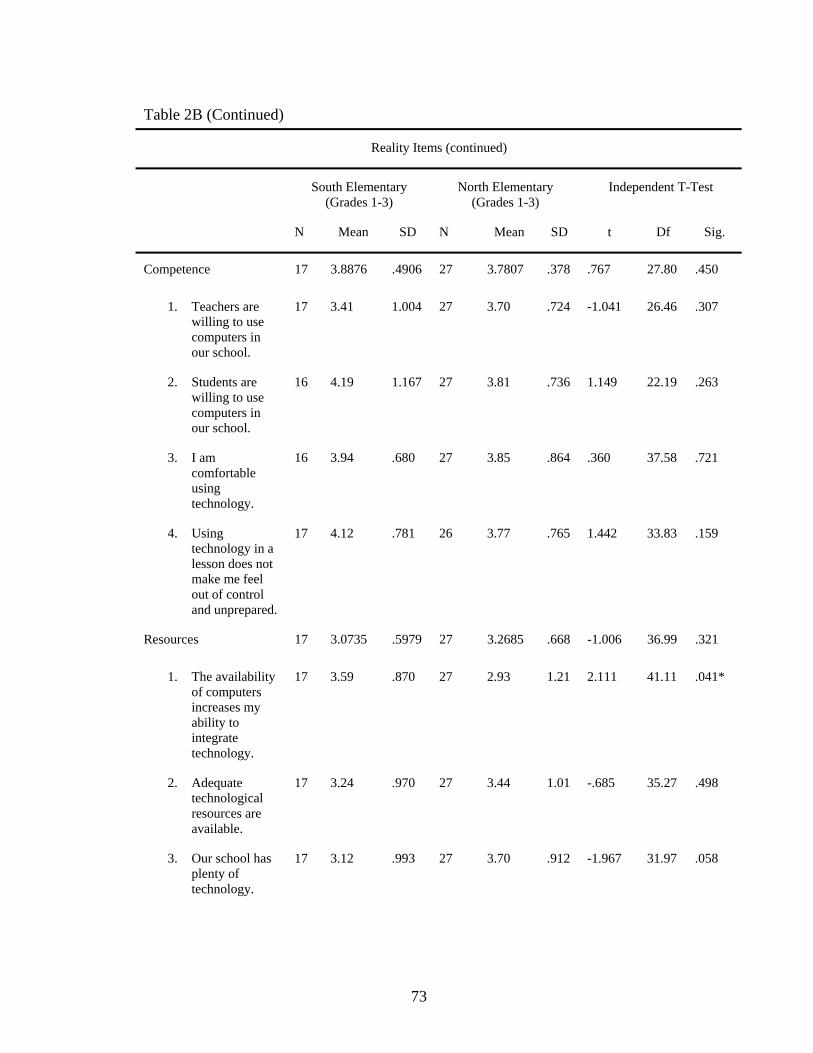
73
Table 2B (Continued)
Reality Items (continued)
South Elementary (Grades 1-3)
North Elementary (Grades 1-3)
Independent T-Test
N Mean SD N Mean SD t Df Sig.
Competence 17 3.8876 .4906 27 3.7807 .378 .767 27.80 .450
1. Teachers are willing to use computers in our school.
17 3.41 1.004 27 3.70 .724 -1.041 26.46 .307
2. Students are willing to use computers in our school.
16 4.19 1.167 27 3.81 .736 1.149 22.19 .263
3. I am comfortable using technology.
16 3.94 .680 27 3.85 .864 .360 37.58 .721
4. Using technology in a lesson does not make me feel out of control and unprepared.
17 4.12 .781 26 3.77 .765 1.442 33.83 .159
Resources 17 3.0735 .5979 27 3.2685 .668 -1.006 36.99 .321
1. The availability of computers increases my ability to integrate technology.
17 3.59 .870 27 2.93 1.21 2.111 41.11 .041*
2. Adequate technological resources are available.
17 3.24 .970 27 3.44 1.01 -.685 35.27 .498
3. Our school has plenty of technology.
17 3.12 .993 27 3.70 .912 -1.967 31.97 .058
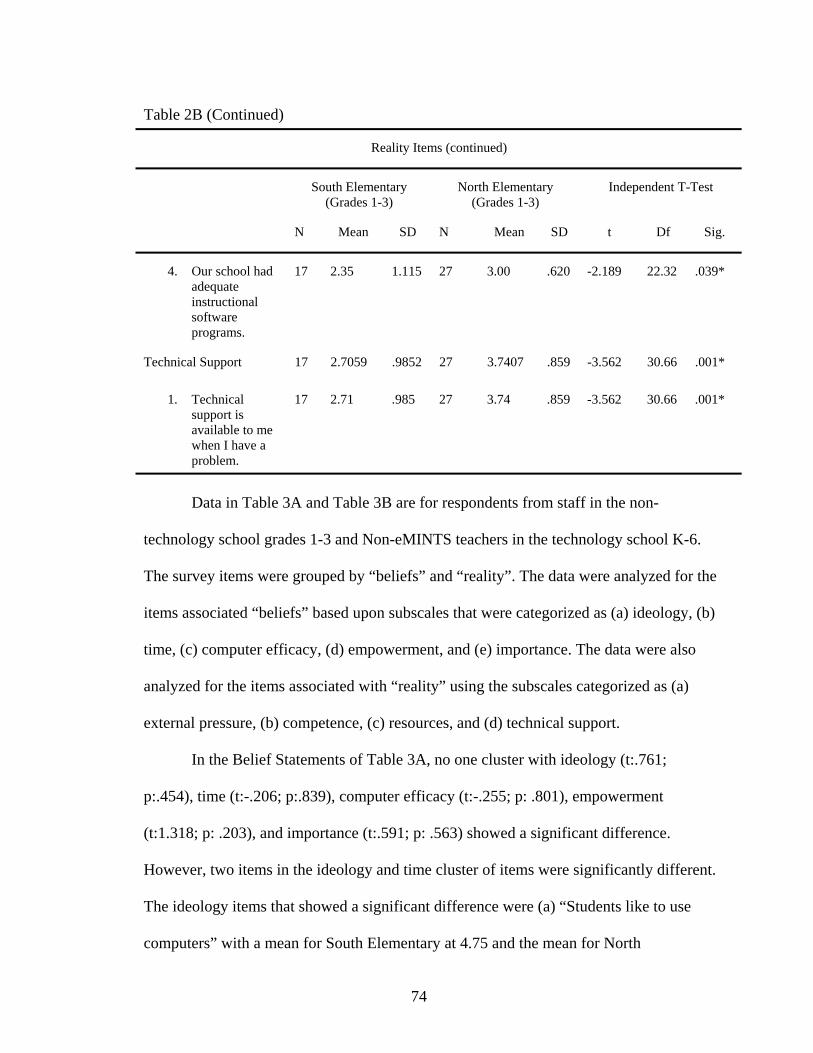
74
Table 2B (Continued)
Reality Items (continued)
South Elementary (Grades 1-3)
North Elementary (Grades 1-3)
Independent T-Test
N Mean SD N Mean SD t Df Sig.
4. Our school had adequate instructional software programs.
17 2.35 1.115 27 3.00 .620 -2.189 22.32 .039*
Technical Support 17 2.7059 .9852 27 3.7407 .859 -3.562 30.66 .001*
1. Technical support is available to me when I have a problem.
17 2.71 .985 27 3.74 .859 -3.562 30.66 .001*
Data in Table 3A and Table 3B are for respondents from staff in the non-
technology school grades 1-3 and Non-eMINTS teachers in the technology school K-6.
The survey items were grouped by “beliefs” and “reality”. The data were analyzed for the
items associated “beliefs” based upon subscales that were categorized as (a) ideology, (b)
time, (c) computer efficacy, (d) empowerment, and (e) importance. The data were also
analyzed for the items associated with “reality” using the subscales categorized as (a)
external pressure, (b) competence, (c) resources, and (d) technical support.
In the Belief Statements of Table 3A, no one cluster with ideology (t:.761;
p:.454), time (t:-.206; p:.839), computer efficacy (t:-.255; p: .801), empowerment
(t:1.318; p: .203), and importance (t:.591; p: .563) showed a significant difference.
However, two items in the ideology and time cluster of items were significantly different.
The ideology items that showed a significant difference were (a) “Students like to use
computers” with a mean for South Elementary at 4.75 and the mean for North
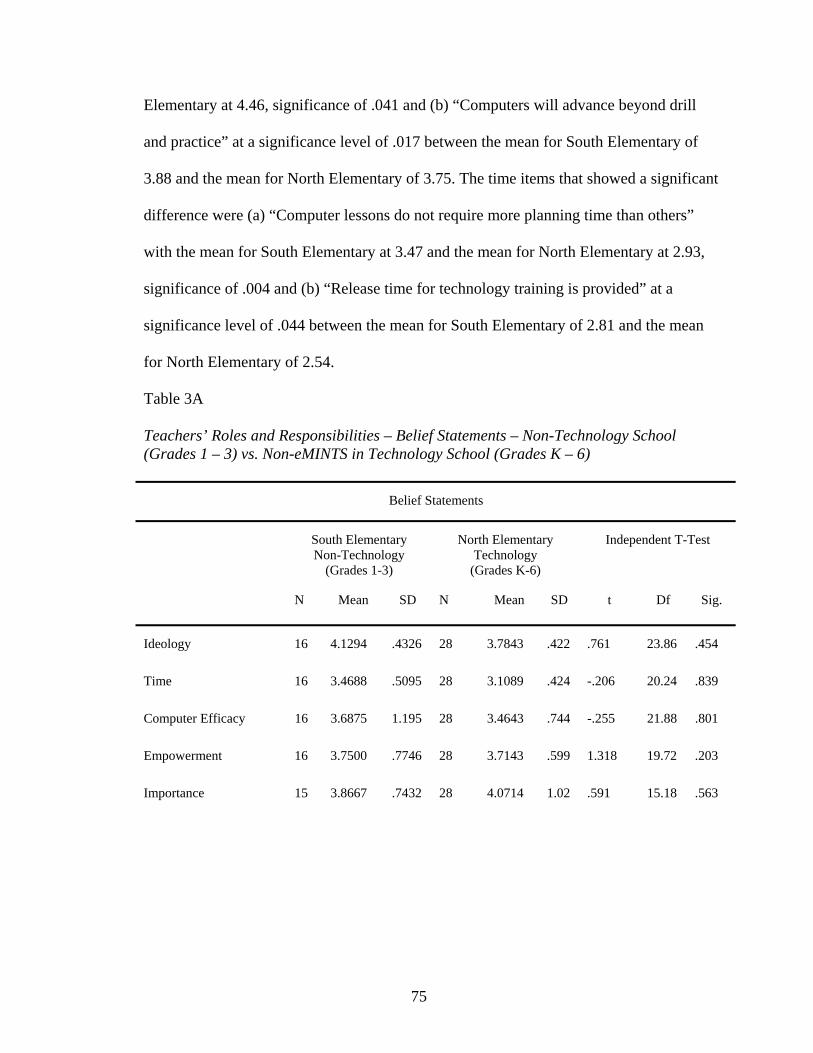
75
Elementary at 4.46, significance of .041 and (b) “Computers will advance beyond drill
and practice” at a significance level of .017 between the mean for South Elementary of
3.88 and the mean for North Elementary of 3.75. The time items that showed a significant
difference were (a) “Computer lessons do not require more planning time than others”
with the mean for South Elementary at 3.47 and the mean for North Elementary at 2.93,
significance of .004 and (b) “Release time for technology training is provided” at a
significance level of .044 between the mean for South Elementary of 2.81 and the mean
for North Elementary of 2.54.
Table 3A Teachers’ Roles and Responsibilities – Belief Statements – Non-Technology School (Grades 1 – 3) vs. Non-eMINTS in Technology School (Grades K – 6)
Belief Statements
South Elementary Non-Technology
(Grades 1-3)
North Elementary Technology
(Grades K-6)
Independent T-Test
N Mean SD N Mean SD t Df Sig.
Ideology 16 4.1294 .4326 28 3.7843 .422 .761 23.86 .454
Time 16 3.4688 .5095 28 3.1089 .424 -.206 20.24 .839
Computer Efficacy 16 3.6875 1.195 28 3.4643 .744 -.255 21.88 .801
Empowerment 16 3.7500 .7746 28 3.7143 .599 1.318 19.72 .203
Importance 15 3.8667 .7432 28 4.0714 1.02 .591 15.18 .563
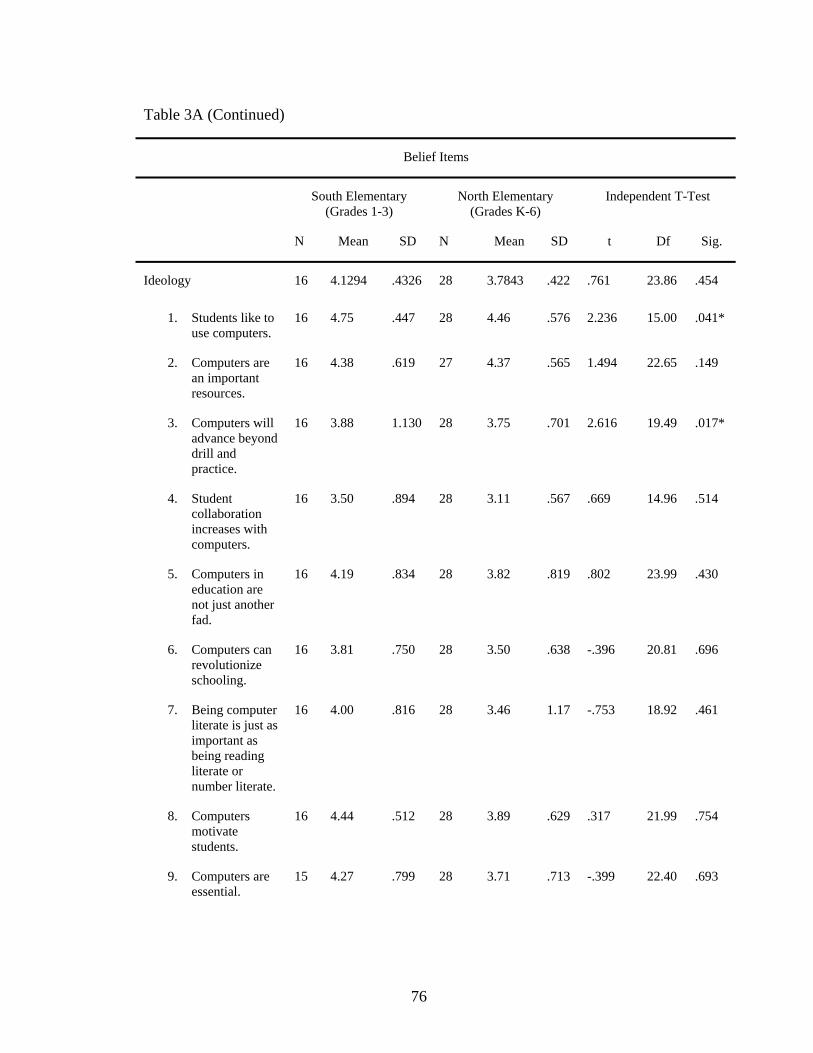
76
Table 3A (Continued)
Belief Items
South Elementary (Grades 1-3)
North Elementary (Grades K-6)
Independent T-Test
N Mean SD N Mean SD t Df Sig.
Ideology 16 4.1294 .4326 28 3.7843 .422 .761 23.86 .454
1. Students like to use computers.
16 4.75 .447 28 4.46 .576 2.236 15.00 .041*
2. Computers are an important resources.
16 4.38 .619 27 4.37 .565 1.494 22.65 .149
3. Computers will advance beyond drill and practice.
16 3.88 1.130 28 3.75 .701 2.616 19.49 .017*
4. Student collaboration increases with computers.
16 3.50 .894 28 3.11 .567 .669 14.96 .514
5. Computers in education are not just another fad.
16 4.19 .834 28 3.82 .819 .802 23.99 .430
6. Computers can revolutionize schooling.
16 3.81 .750 28 3.50 .638 -.396 20.81 .696
7. Being computer literate is just as important as being reading literate or number literate.
16 4.00 .816 28 3.46 1.17 -.753 18.92 .461
8. Computers motivate students.
16 4.44 .512 28 3.89 .629 .317 21.99 .754
9. Computers are essential.
15 4.27 .799 28 3.71 .713 -.399 22.40 .693
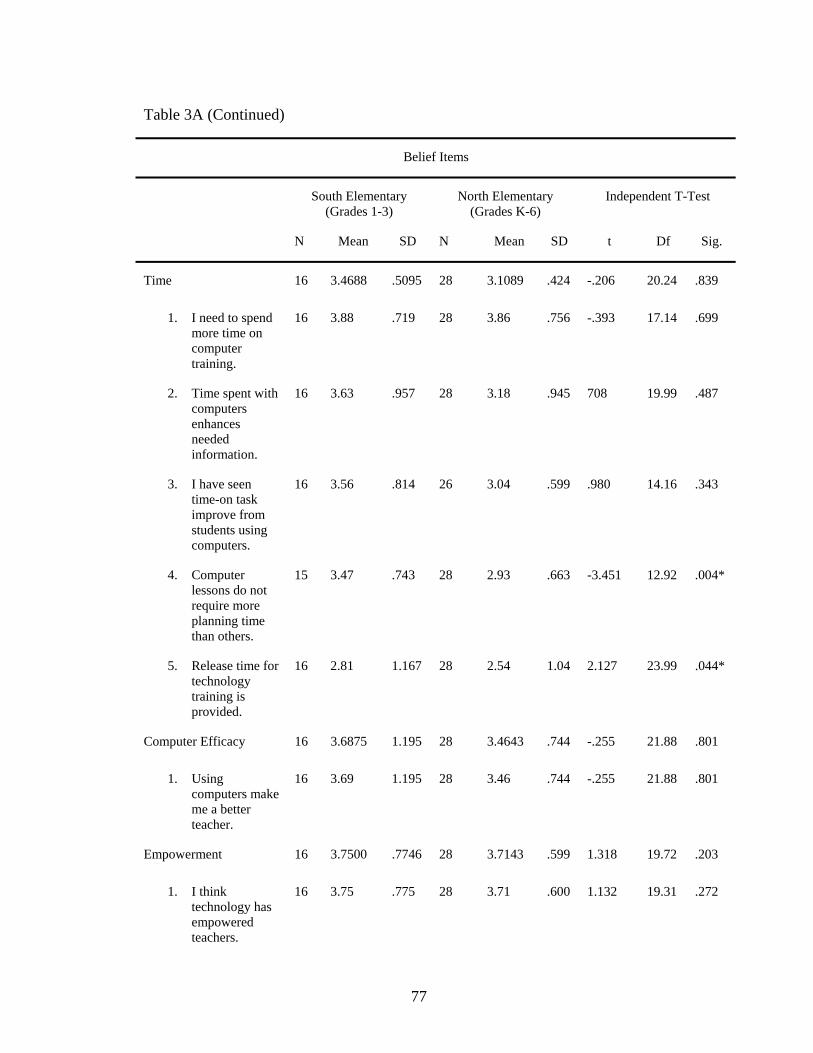
77
Table 3A (Continued)
Belief Items
South Elementary (Grades 1-3)
North Elementary (Grades K-6)
Independent T-Test
N Mean SD N Mean SD t Df Sig.
Time 16 3.4688 .5095 28 3.1089 .424 -.206 20.24 .839
1. I need to spend more time on computer training.
16 3.88 .719 28 3.86 .756 -.393 17.14 .699
2. Time spent with computers enhances needed information.
16 3.63 .957 28 3.18 .945
708 19.99 .487
3. I have seen time-on task improve from students using computers.
16 3.56 .814 26 3.04 .599 .980 14.16 .343
4. Computer lessons do not require more planning time than others.
15 3.47 .743 28 2.93 .663 -3.451 12.92 .004*
5. Release time for technology training is provided.
16 2.81 1.167 28 2.54 1.04 2.127 23.99 .044*
Computer Efficacy 16 3.6875 1.195 28 3.4643 .744 -.255 21.88 .801
1. Using computers make me a better teacher.
16 3.69 1.195 28 3.46 .744 -.255 21.88 .801
Empowerment 16 3.7500 .7746 28 3.7143 .599 1.318 19.72 .203
1. I think technology has empowered teachers.
16 3.75 .775 28 3.71 .600 1.132 19.31 .272
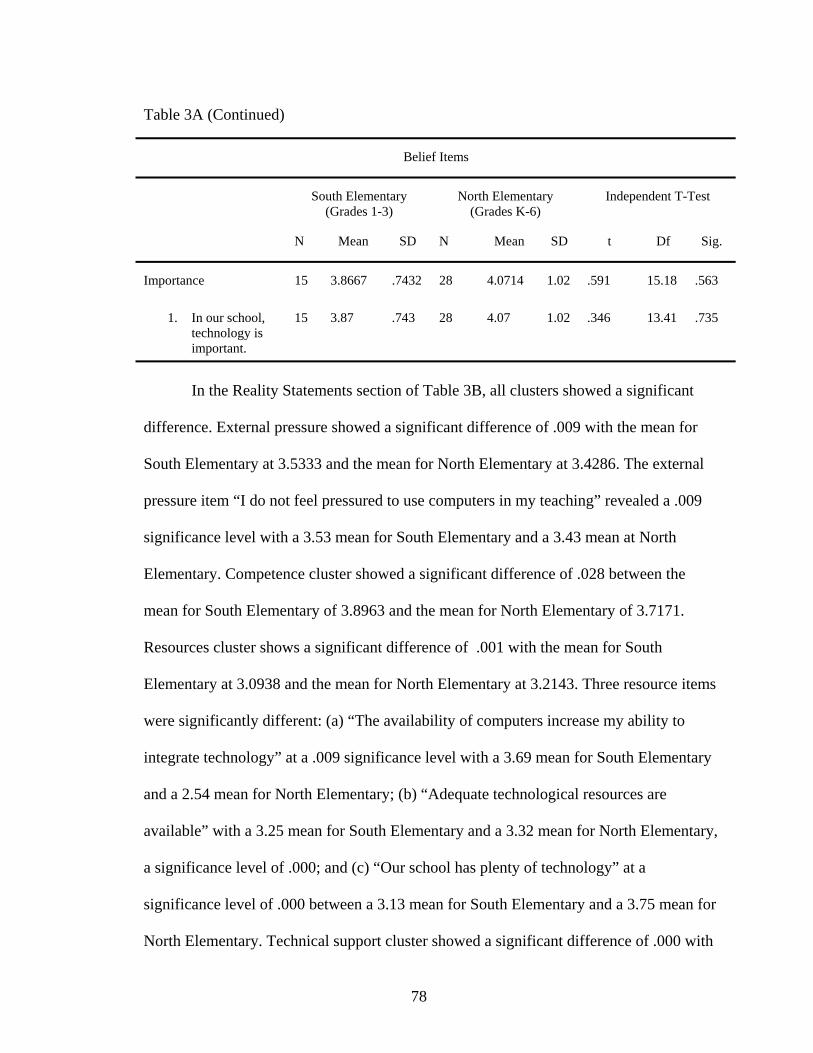
78
Table 3A (Continued)
Belief Items
South Elementary (Grades 1-3)
North Elementary (Grades K-6)
Independent T-Test
N Mean SD N Mean SD t Df Sig.
Importance 15 3.8667 .7432 28 4.0714 1.02 .591 15.18 .563
1. In our school, technology is important.
15 3.87 .743 28 4.07 1.02 .346 13.41 .735
In the Reality Statements section of Table 3B, all clusters showed a significant
difference. External pressure showed a significant difference of .009 with the mean for
South Elementary at 3.5333 and the mean for North Elementary at 3.4286. The external
pressure item “I do not feel pressured to use computers in my teaching” revealed a .009
significance level with a 3.53 mean for South Elementary and a 3.43 mean at North
Elementary. Competence cluster showed a significant difference of .028 between the
mean for South Elementary of 3.8963 and the mean for North Elementary of 3.7171.
Resources cluster shows a significant difference of .001 with the mean for South
Elementary at 3.0938 and the mean for North Elementary at 3.2143. Three resource items
were significantly different: (a) “The availability of computers increase my ability to
integrate technology” at a .009 significance level with a 3.69 mean for South Elementary
and a 2.54 mean for North Elementary; (b) “Adequate technological resources are
available” with a 3.25 mean for South Elementary and a 3.32 mean for North Elementary,
a significance level of .000; and (c) “Our school has plenty of technology” at a
significance level of .000 between a 3.13 mean for South Elementary and a 3.75 mean for
North Elementary. Technical support cluster showed a significant difference of .000 with
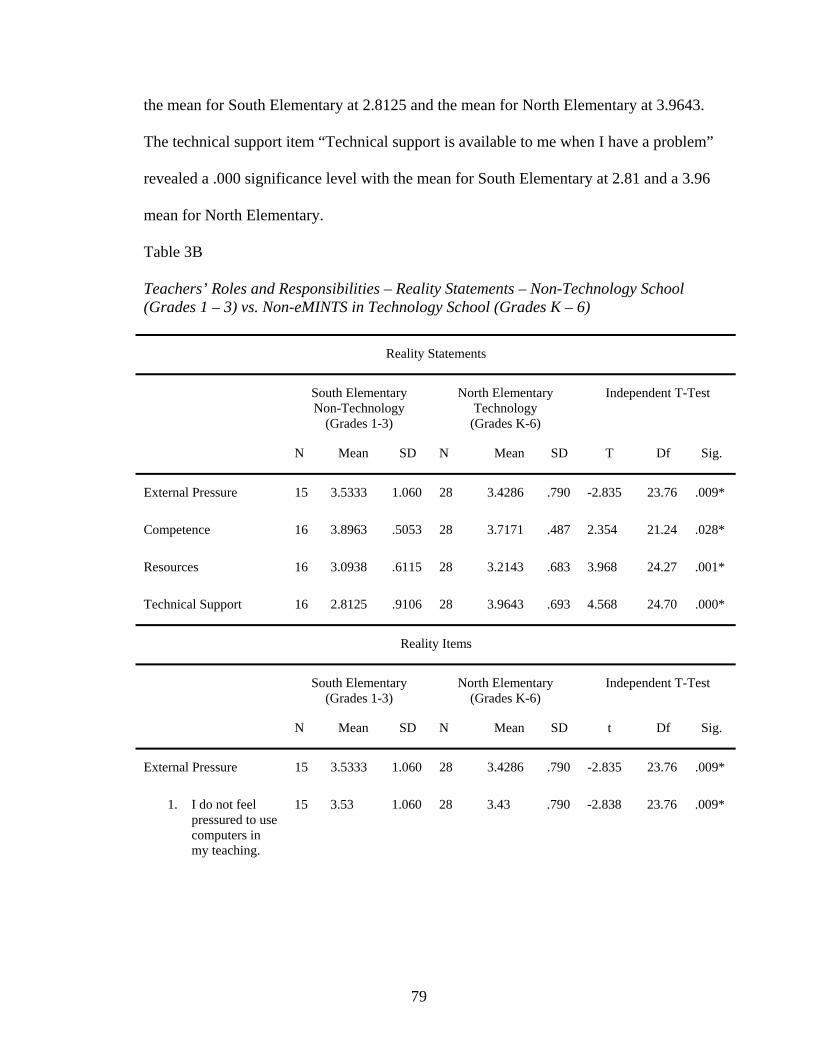
79
the mean for South Elementary at 2.8125 and the mean for North Elementary at 3.9643.
The technical support item “Technical support is available to me when I have a problem”
revealed a .000 significance level with the mean for South Elementary at 2.81 and a 3.96
mean for North Elementary.
Table 3B Teachers’ Roles and Responsibilities – Reality Statements – Non-Technology School (Grades 1 – 3) vs. Non-eMINTS in Technology School (Grades K – 6)
Reality Statements
South Elementary Non-Technology
(Grades 1-3)
North Elementary Technology
(Grades K-6)
Independent T-Test
N Mean SD N Mean SD T Df Sig.
External Pressure 15 3.5333 1.060 28 3.4286 .790 -2.835 23.76 .009*
Competence 16 3.8963 .5053 28 3.7171 .487 2.354 21.24 .028*
Resources 16 3.0938 .6115 28 3.2143 .683 3.968 24.27 .001*
Technical Support 16 2.8125 .9106 28 3.9643 .693 4.568 24.70 .000*
Reality Items
South Elementary (Grades 1-3)
North Elementary (Grades K-6)
Independent T-Test
N Mean SD N Mean SD t Df Sig.
External Pressure 15 3.5333 1.060 28 3.4286 .790 -2.835 23.76 .009*
1. I do not feel pressured to use computers in my teaching.
15 3.53 1.060 28 3.43 .790 -2.838 23.76 .009*
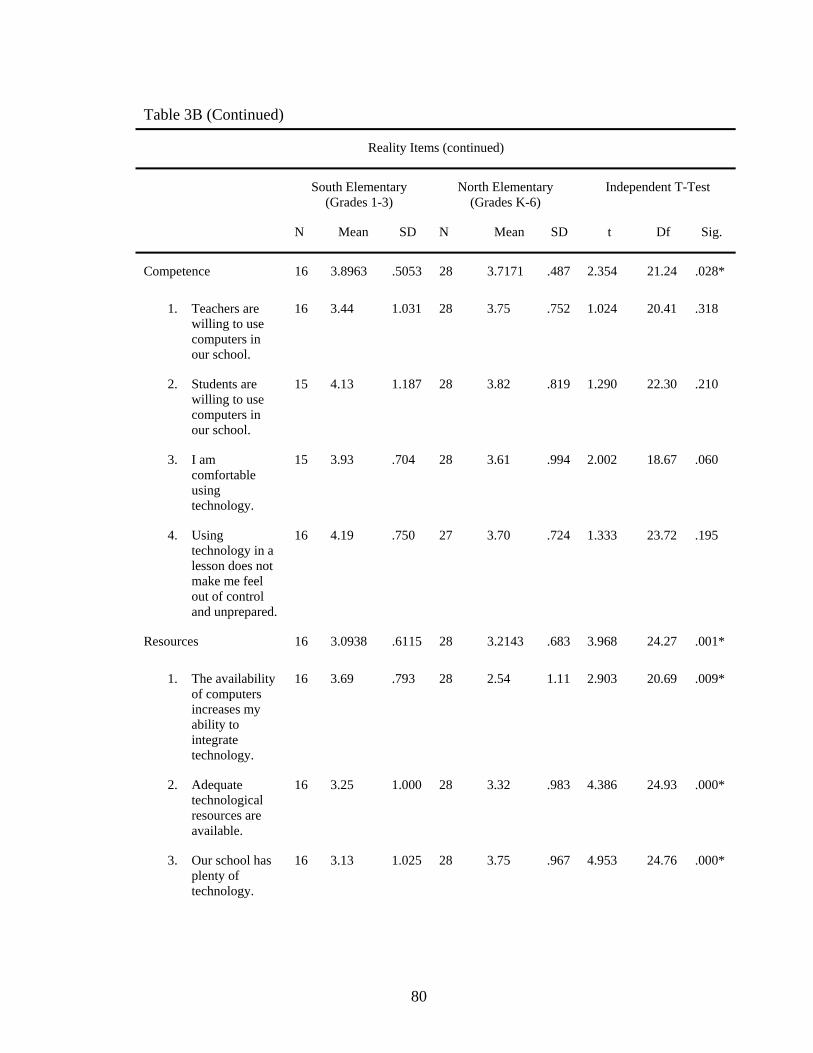
80
Table 3B (Continued)
Reality Items (continued)
South Elementary (Grades 1-3)
North Elementary (Grades K-6)
Independent T-Test
N Mean SD N Mean SD t Df Sig.
Competence 16 3.8963 .5053 28 3.7171 .487 2.354 21.24 .028*
1. Teachers are willing to use computers in our school.
16 3.44 1.031 28 3.75 .752 1.024 20.41 .318
2. Students are willing to use computers in our school.
15 4.13 1.187 28 3.82 .819 1.290 22.30 .210
3. I am comfortable using technology.
15 3.93 .704 28 3.61 .994 2.002 18.67 .060
4. Using technology in a lesson does not make me feel out of control and unprepared.
16 4.19 .750 27 3.70 .724 1.333 23.72 .195
Resources 16 3.0938 .6115 28 3.2143 .683 3.968 24.27 .001*
1. The availability of computers increases my ability to integrate technology.
16 3.69 .793 28 2.54 1.11 2.903 20.69 .009*
2. Adequate technological resources are available.
16 3.25 1.000 28 3.32 .983 4.386 24.93 .000*
3. Our school has plenty of technology.
16 3.13 1.025 28 3.75 .967 4.953 24.76 .000*
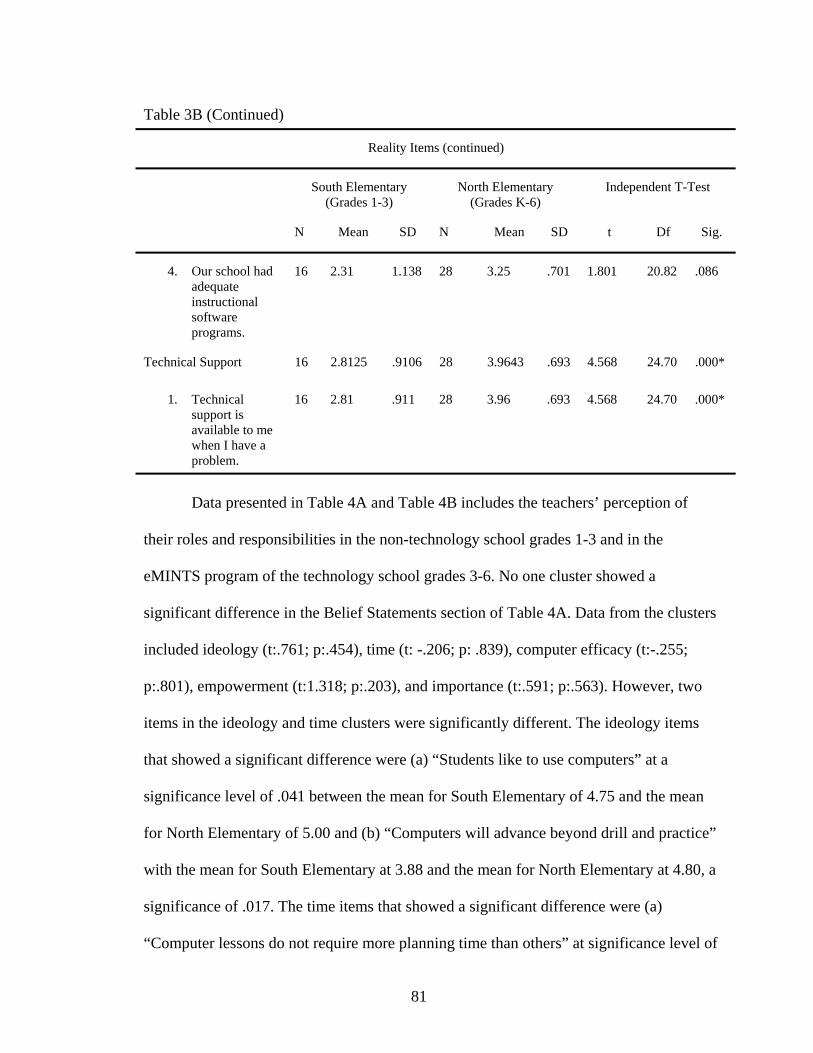
81
Table 3B (Continued)
Reality Items (continued)
South Elementary (Grades 1-3)
North Elementary (Grades K-6)
Independent T-Test
N Mean SD N Mean SD t Df Sig.
4. Our school had adequate instructional software programs.
16 2.31 1.138 28 3.25 .701 1.801 20.82 .086
Technical Support 16 2.8125 .9106 28 3.9643 .693 4.568 24.70 .000*
1. Technical support is available to me when I have a problem.
16 2.81 .911 28 3.96 .693 4.568 24.70 .000*
Data presented in Table 4A and Table 4B includes the teachers’ perception of
their roles and responsibilities in the non-technology school grades 1-3 and in the
eMINTS program of the technology school grades 3-6. No one cluster showed a
significant difference in the Belief Statements section of Table 4A. Data from the clusters
included ideology (t:.761; p:.454), time (t: -.206; p: .839), computer efficacy (t:-.255;
p:.801), empowerment (t:1.318; p:.203), and importance (t:.591; p:.563). However, two
items in the ideology and time clusters were significantly different. The ideology items
that showed a significant difference were (a) “Students like to use computers” at a
significance level of .041 between the mean for South Elementary of 4.75 and the mean
for North Elementary of 5.00 and (b) “Computers will advance beyond drill and practice”
with the mean for South Elementary at 3.88 and the mean for North Elementary at 4.80, a
significance of .017. The time items that showed a significant difference were (a)
“Computer lessons do not require more planning time than others” at significance level of
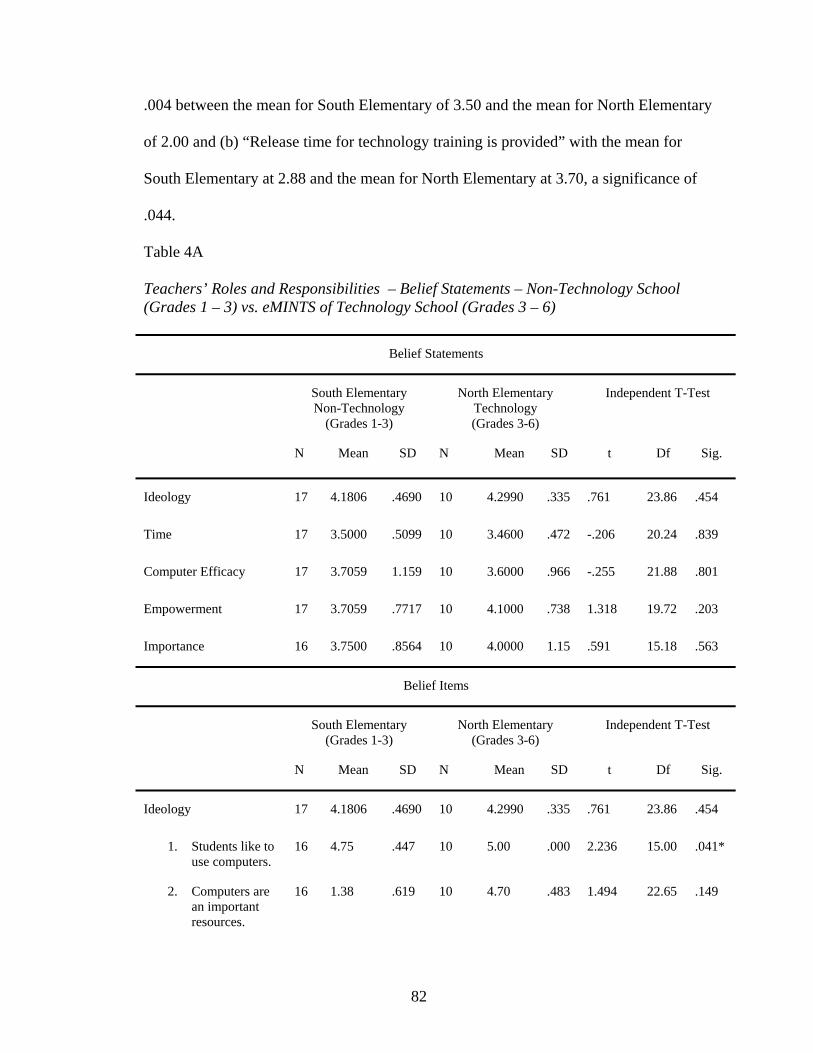
82
.004 between the mean for South Elementary of 3.50 and the mean for North Elementary
of 2.00 and (b) “Release time for technology training is provided” with the mean for
South Elementary at 2.88 and the mean for North Elementary at 3.70, a significance of
.044.
Table 4A Teachers’ Roles and Responsibilities – Belief Statements – Non-Technology School (Grades 1 – 3) vs. eMINTS of Technology School (Grades 3 – 6)
Belief Statements
South Elementary Non-Technology
(Grades 1-3)
North Elementary Technology (Grades 3-6)
Independent T-Test
N Mean SD N Mean SD t Df Sig.
Ideology 17 4.1806 .4690 10 4.2990 .335 .761 23.86 .454
Time 17 3.5000 .5099 10 3.4600 .472 -.206 20.24 .839
Computer Efficacy 17 3.7059 1.159 10 3.6000 .966 -.255 21.88 .801
Empowerment 17 3.7059 .7717 10 4.1000 .738 1.318 19.72 .203
Importance 16 3.7500 .8564 10 4.0000 1.15 .591 15.18 .563
Belief Items
South Elementary (Grades 1-3)
North Elementary (Grades 3-6)
Independent T-Test
N Mean SD N Mean SD t Df Sig.
Ideology 17 4.1806 .4690 10 4.2990 .335 .761 23.86 .454
1. Students like to use computers.
16 4.75 .447 10 5.00 .000 2.236 15.00 .041*
2. Computers are an important resources.
16 1.38 .619 10 4.70 .483 1.494 22.65 .149
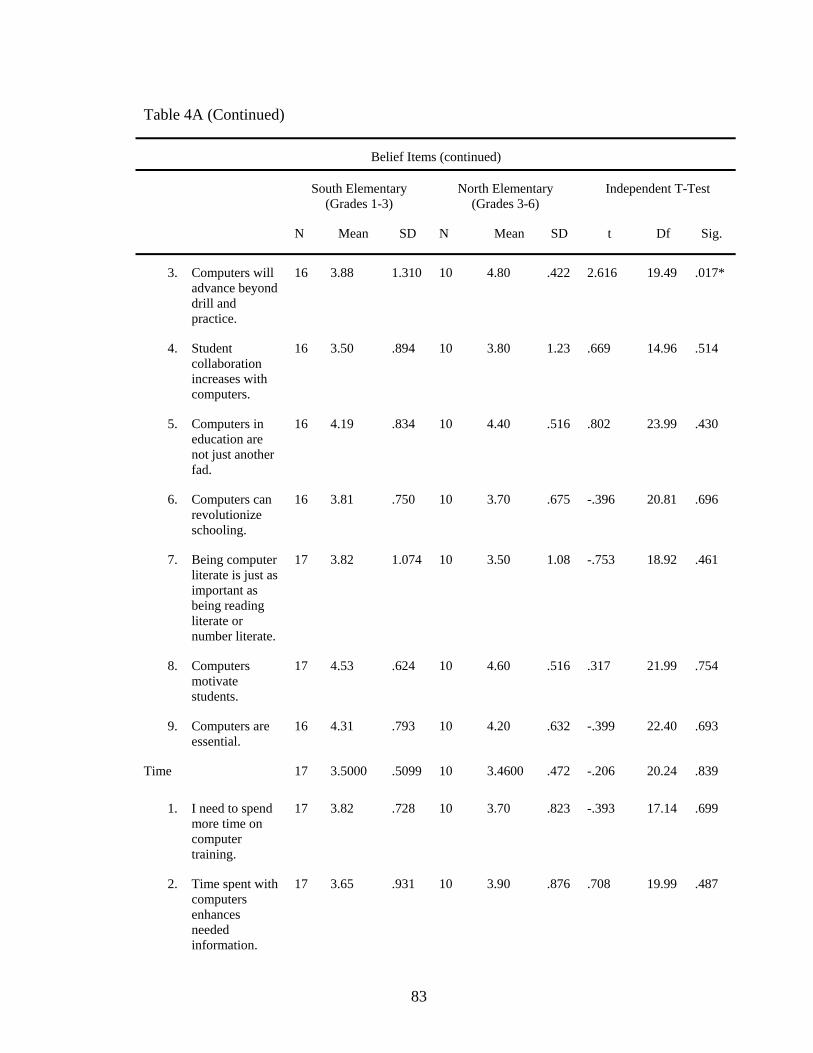
83
Table 4A (Continued)
Belief Items (continued)
South Elementary (Grades 1-3)
North Elementary (Grades 3-6)
Independent T-Test
N Mean SD N Mean SD t Df Sig.
3. Computers will advance beyond drill and practice.
16 3.88 1.310 10 4.80 .422 2.616 19.49 .017*
4. Student collaboration increases with computers.
16 3.50 .894 10 3.80 1.23 .669 14.96 .514
5. Computers in education are not just another fad.
16 4.19 .834 10 4.40 .516 .802 23.99 .430
6. Computers can revolutionize schooling.
16 3.81 .750 10 3.70 .675 -.396 20.81 .696
7. Being computer literate is just as important as being reading literate or number literate.
17 3.82 1.074 10 3.50 1.08 -.753 18.92 .461
8. Computers motivate students.
17 4.53 .624 10 4.60 .516 .317 21.99 .754
9. Computers are essential.
16 4.31 .793 10 4.20 .632 -.399 22.40 .693
Time 17 3.5000 .5099 10 3.4600 .472 -.206 20.24 .839
1. I need to spend more time on computer training.
17 3.82 .728 10 3.70 .823 -.393 17.14 .699
2. Time spent with computers enhances needed information.
17 3.65 .931 10 3.90 .876 .708 19.99 .487
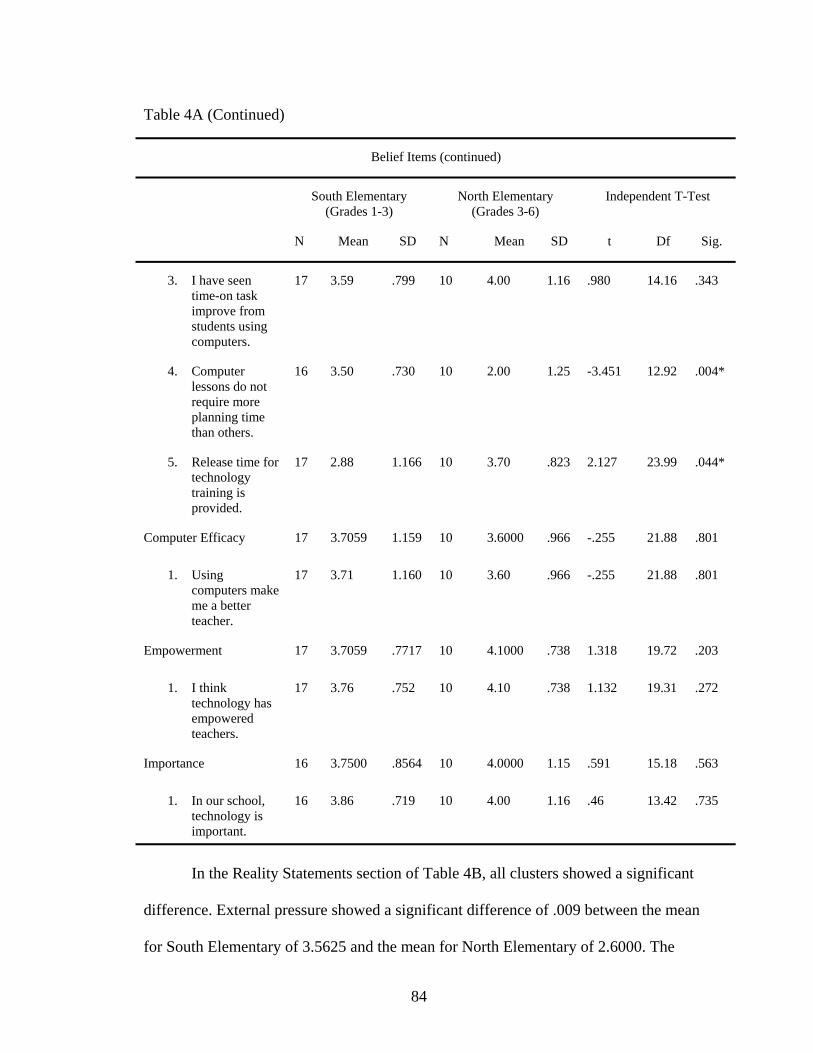
84
Table 4A (Continued)
Belief Items (continued)
South Elementary (Grades 1-3)
North Elementary (Grades 3-6)
Independent T-Test
N Mean SD N Mean SD t Df Sig.
3. I have seen time-on task improve from students using computers.
17 3.59 .799 10 4.00 1.16 .980 14.16 .343
4. Computer lessons do not require more planning time than others.
16 3.50 .730 10 2.00 1.25 -3.451 12.92 .004*
5. Release time for technology training is provided.
17 2.88 1.166 10 3.70 .823 2.127 23.99 .044*
Computer Efficacy 17 3.7059 1.159 10 3.6000 .966 -.255 21.88 .801
1. Using computers make me a better teacher.
17 3.71 1.160 10 3.60 .966 -.255 21.88 .801
Empowerment 17 3.7059 .7717 10 4.1000 .738 1.318 19.72 .203
1. I think technology has empowered teachers.
17 3.76 .752 10 4.10 .738 1.132 19.31 .272
Importance 16 3.7500 .8564 10 4.0000 1.15 .591 15.18 .563
1. In our school, technology is important.
16 3.86 .719 10 4.00 1.16 .46 13.42 .735
In the Reality Statements section of Table 4B, all clusters showed a significant
difference. External pressure showed a significant difference of .009 between the mean
for South Elementary of 3.5625 and the mean for North Elementary of 2.6000. The

85
external pressure item “I do not feel pressured to use computers in my teaching” revealed
a .009 significance level between the 3.56 mean for South Elementary and a 2.60 mean at
North Elementary. Competence cluster showed a significant difference with the mean for
South Elementary at 3.9024 and the mean for North Elementary at 4.2350, a significance
of .028. Resources cluster showed a significant difference of .001 with the mean for
South Elementary at 3.2059 and the mean for North Elementary at 4.1750. Three
resource items showed significant differences: (a) “The availability of computers increase
my ability to integrate technology” at a .009 significance level between the 3.65 mean for
South Elementary and a 4.50 mean for North Elementary; (b) “Adequate technological
resources are available” at a .000 significance level with a 3.24 mean for South
Elementary and a 4.50 mean for North Elementary; and (c) “Our school has plenty of
technology” at a .000 with a 3.15 mean for South Elementary and a 4.60 mean for North
Elementary. Technical support cluster showed a significant difference of .000 between
the mean for South Elementary of 2.8235 and the mean for North Elementary of 4.1000.
The technical support item “Technical support is available to me when I have a problem”
revealed a .000 significance level with the mean for South Elementary at 2.82 and a 4.10
mean for North Elementary.
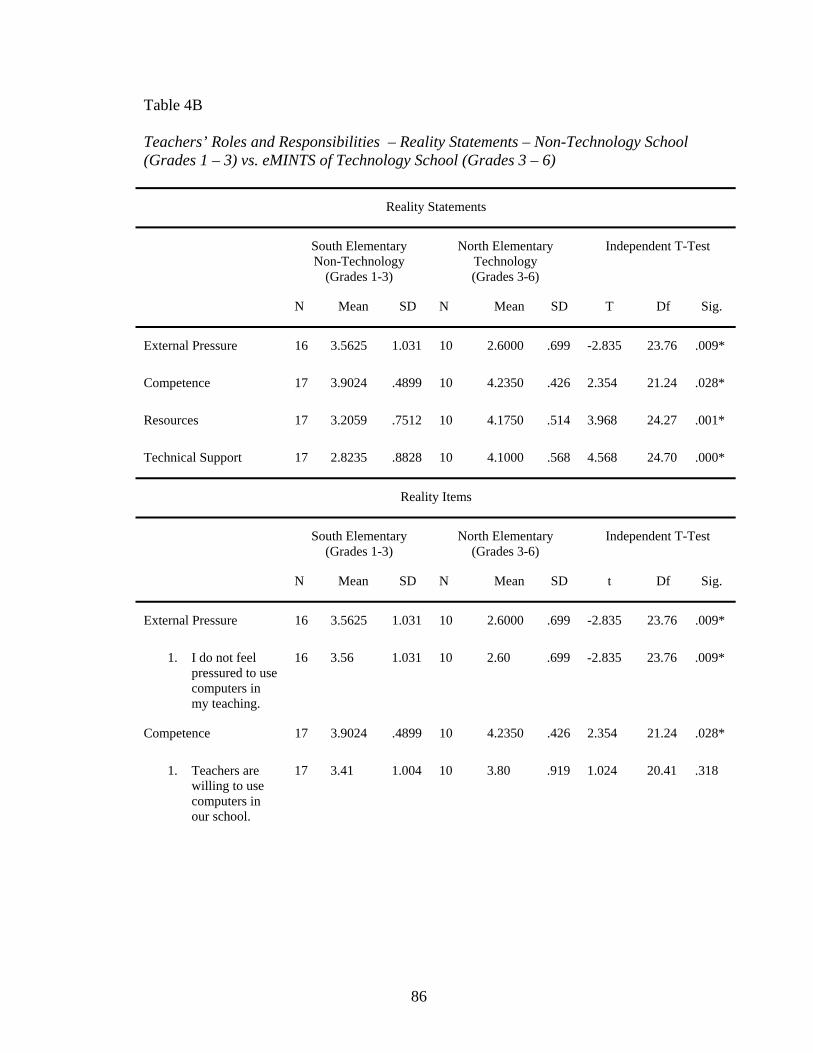
86
Table 4B Teachers’ Roles and Responsibilities – Reality Statements – Non-Technology School (Grades 1 – 3) vs. eMINTS of Technology School (Grades 3 – 6)
Reality Statements
South Elementary Non-Technology
(Grades 1-3)
North Elementary Technology (Grades 3-6)
Independent T-Test
N Mean SD N Mean SD T Df Sig.
External Pressure 16 3.5625 1.031 10 2.6000 .699 -2.835 23.76 .009*
Competence 17 3.9024 .4899 10 4.2350 .426 2.354 21.24 .028*
Resources 17 3.2059 .7512 10 4.1750 .514 3.968 24.27 .001*
Technical Support 17 2.8235 .8828 10 4.1000 .568 4.568 24.70 .000*
Reality Items
South Elementary (Grades 1-3)
North Elementary (Grades 3-6)
Independent T-Test
N Mean SD N Mean SD t Df Sig.
External Pressure 16 3.5625 1.031 10 2.6000 .699 -2.835 23.76 .009*
1. I do not feel pressured to use computers in my teaching.
16 3.56 1.031 10 2.60 .699 -2.835 23.76 .009*
Competence 17 3.9024 .4899 10 4.2350 .426 2.354 21.24 .028*
1. Teachers are willing to use computers in our school.
17 3.41 1.004 10 3.80 .919 1.024 20.41 .318
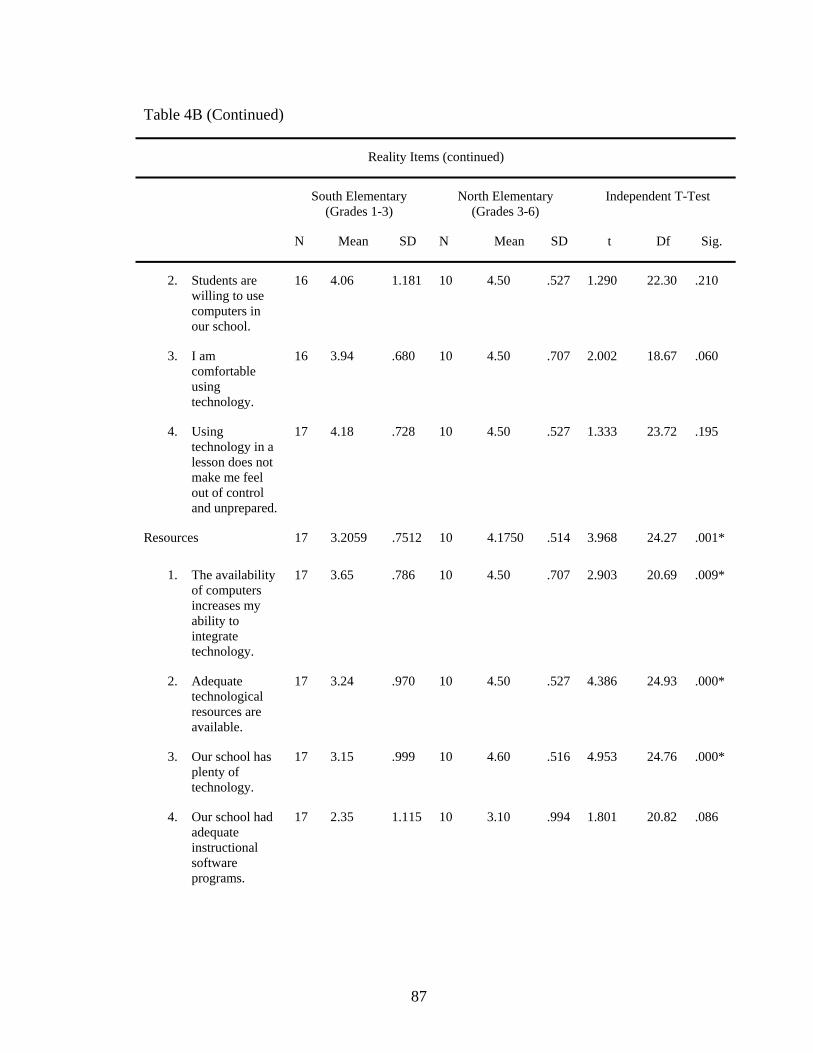
87
Table 4B (Continued)
Reality Items (continued)
South Elementary (Grades 1-3)
North Elementary (Grades 3-6)
Independent T-Test
N Mean SD N Mean SD t Df Sig.
2. Students are willing to use computers in our school.
16 4.06 1.181 10 4.50 .527 1.290 22.30 .210
3. I am comfortable using technology.
16 3.94 .680 10 4.50 .707 2.002 18.67 .060
4. Using technology in a lesson does not make me feel out of control and unprepared.
17 4.18 .728 10 4.50 .527 1.333 23.72 .195
Resources 17 3.2059 .7512 10 4.1750 .514 3.968 24.27 .001*
1. The availability of computers increases my ability to integrate technology.
17 3.65 .786 10 4.50 .707 2.903 20.69 .009*
2. Adequate technological resources are available.
17 3.24 .970 10 4.50 .527 4.386 24.93 .000*
3. Our school has plenty of technology.
17 3.15 .999 10 4.60 .516 4.953 24.76 .000*
4. Our school had adequate instructional software programs.
17 2.35 1.115 10 3.10 .994 1.801 20.82 .086
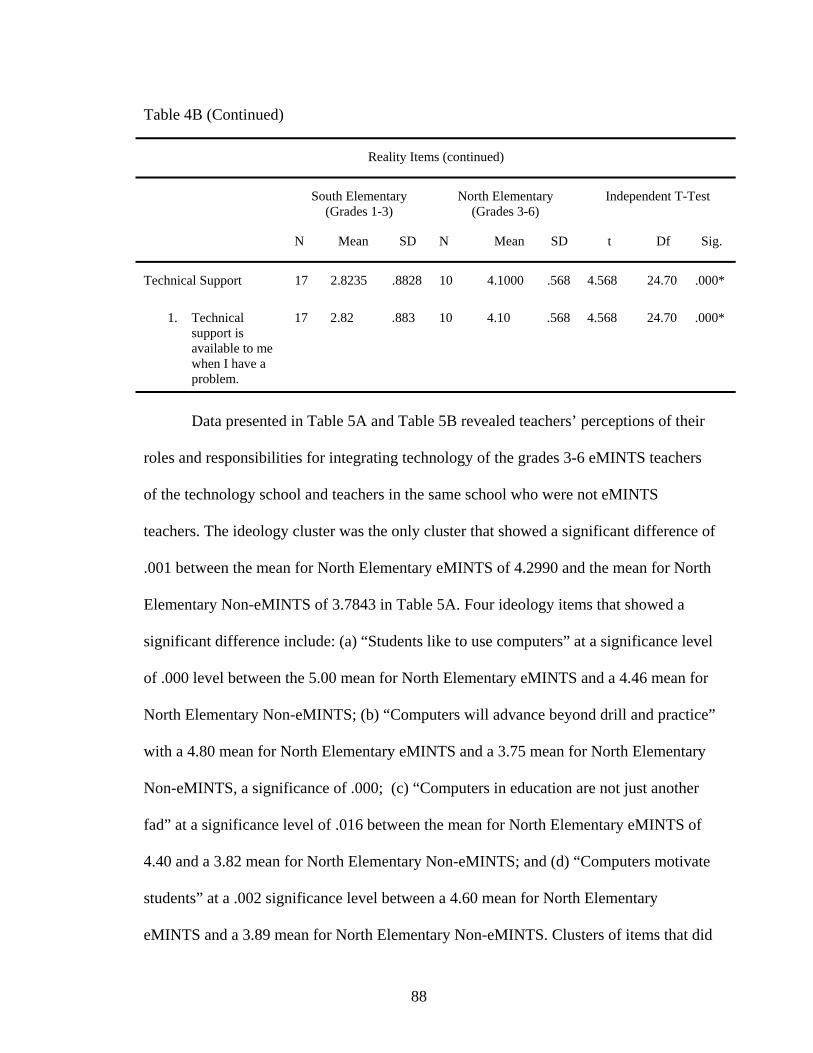
88
Table 4B (Continued)
Reality Items (continued)
South Elementary (Grades 1-3)
North Elementary (Grades 3-6)
Independent T-Test
N Mean SD N Mean SD t Df Sig.
Technical Support 17 2.8235 .8828 10 4.1000 .568 4.568 24.70 .000*
1. Technical support is available to me when I have a problem.
17 2.82 .883 10 4.10 .568 4.568 24.70 .000*
Data presented in Table 5A and Table 5B revealed teachers’ perceptions of their
roles and responsibilities for integrating technology of the grades 3-6 eMINTS teachers
of the technology school and teachers in the same school who were not eMINTS
teachers. The ideology cluster was the only cluster that showed a significant difference of
.001 between the mean for North Elementary eMINTS of 4.2990 and the mean for North
Elementary Non-eMINTS of 3.7843 in Table 5A. Four ideology items that showed a
significant difference include: (a) “Students like to use computers” at a significance level
of .000 level between the 5.00 mean for North Elementary eMINTS and a 4.46 mean for
North Elementary Non-eMINTS; (b) “Computers will advance beyond drill and practice”
with a 4.80 mean for North Elementary eMINTS and a 3.75 mean for North Elementary
Non-eMINTS, a significance of .000; (c) “Computers in education are not just another
fad” at a significance level of .016 between the mean for North Elementary eMINTS of
4.40 and a 3.82 mean for North Elementary Non-eMINTS; and (d) “Computers motivate
students” at a .002 significance level between a 4.60 mean for North Elementary
eMINTS and a 3.89 mean for North Elementary Non-eMINTS. Clusters of items that did
89
not show a significant difference in the Belief Statements were time (t:2.073; p:.056),
computer efficacy (t:.403; p:.693), empowerment (t:1.487; p:.160), and importance (t:-
.173; p:.865).
As the other Belief Statements in Table 5A were analyzed, the time cluster
revealed four items with significant differences. The time items that showed a significant
difference are: (a) “Time spent with computers enhances needed information” at a
significance level of .043 between the mean of 3.90 for North Elementary eMINTS and a
3.18 mean for North Elementary Non-eMINTS; (b) “I have seen time-on task improve
from students using computers” with a 4.00 mean for North Elementary eMINTS and a
3.04 mean for North Elementary Non-eMINTS, a significance level of .029; (c)
“Computer lessons do not require more planning time than others” at a significance level
of .047 between the mean of 2.00 mean for North Elementary eMINTS and a 2.93 mean
for North Elementary Non-eMINTS; and (d) “Release time for technology training is
provided” with a 3.70 mean for North Elementary eMINTS and a 2.54 mean for North
Elementary Non-eMINTS, a significance level of .002.
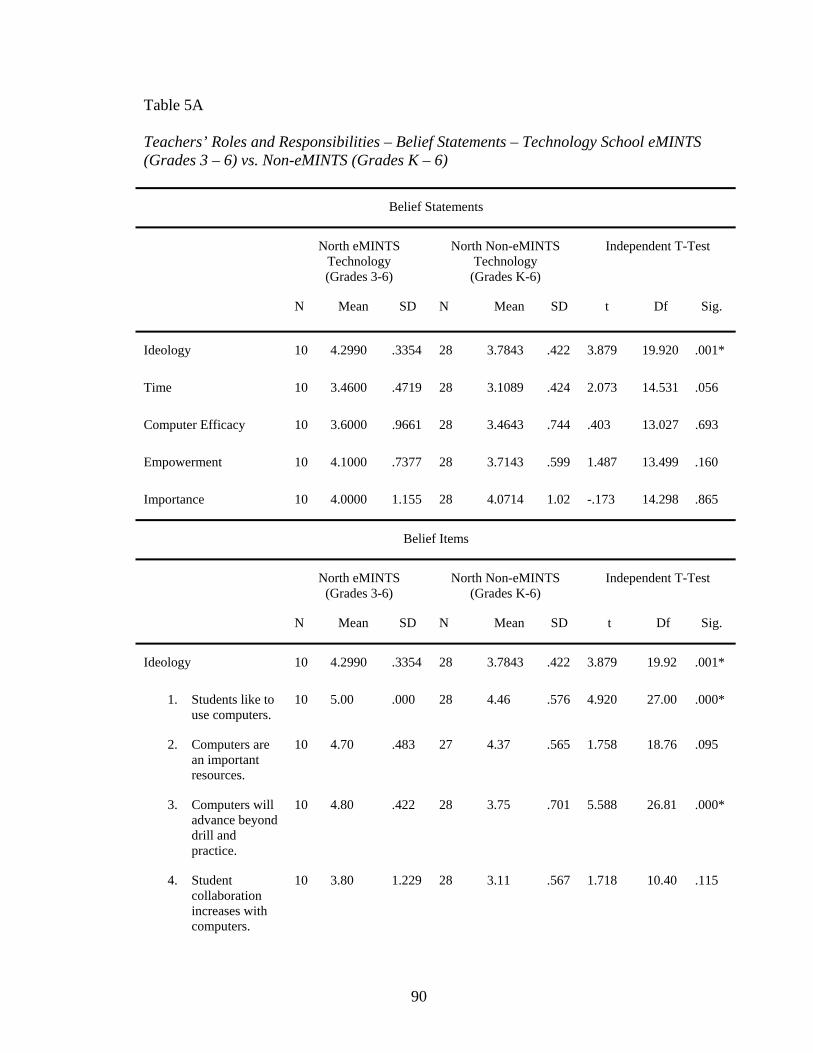
90
Table 5A Teachers’ Roles and Responsibilities – Belief Statements – Technology School eMINTS (Grades 3 – 6) vs. Non-eMINTS (Grades K – 6)
Belief Statements
North eMINTS Technology (Grades 3-6)
North Non-eMINTS Technology
(Grades K-6)
Independent T-Test
N Mean SD N Mean SD t Df Sig.
Ideology 10 4.2990 .3354 28 3.7843 .422 3.879 19.920 .001*
Time 10 3.4600 .4719 28 3.1089 .424 2.073 14.531 .056
Computer Efficacy 10 3.6000 .9661 28 3.4643 .744 .403 13.027 .693
Empowerment 10 4.1000 .7377 28 3.7143 .599 1.487 13.499 .160
Importance 10 4.0000 1.155 28 4.0714 1.02 -.173 14.298 .865
Belief Items
North eMINTS (Grades 3-6)
North Non-eMINTS (Grades K-6)
Independent T-Test
N Mean SD N Mean SD t Df Sig.
Ideology 10 4.2990 .3354 28 3.7843 .422 3.879 19.92 .001*
1. Students like to use computers.
10 5.00 .000 28 4.46 .576 4.920 27.00 .000*
2. Computers are an important resources.
10 4.70 .483 27 4.37 .565 1.758 18.76 .095
3. Computers will advance beyond drill and practice.
10 4.80 .422 28 3.75 .701 5.588 26.81 .000*
4. Student collaboration increases with computers.
10 3.80 1.229 28 3.11 .567 1.718 10.40 .115
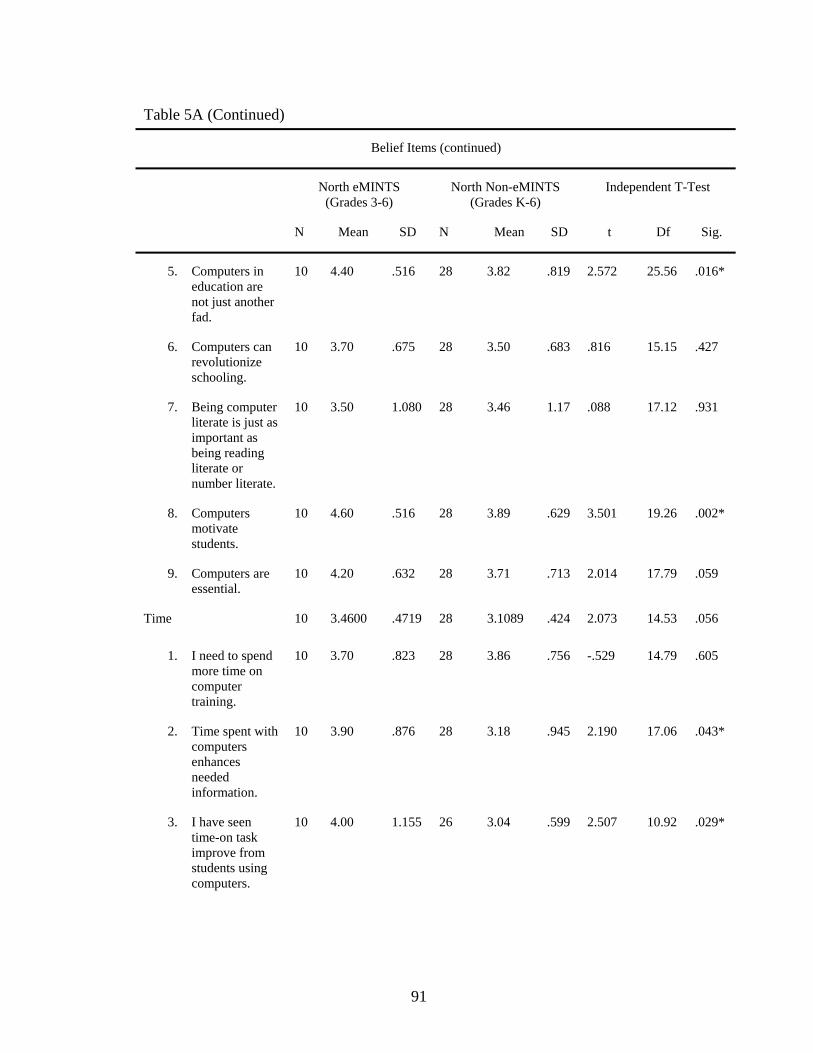
91
Table 5A (Continued)
Belief Items (continued)
North eMINTS (Grades 3-6)
North Non-eMINTS (Grades K-6)
Independent T-Test
N Mean SD N Mean SD t Df Sig.
5. Computers in education are not just another fad.
10 4.40 .516 28 3.82 .819 2.572 25.56 .016*
6. Computers can revolutionize schooling.
10 3.70 .675 28 3.50 .683 .816 15.15 .427
7. Being computer literate is just as important as being reading literate or number literate.
10 3.50 1.080 28 3.46 1.17 .088 17.12 .931
8. Computers motivate students.
10 4.60 .516 28 3.89 .629 3.501 19.26 .002*
9. Computers are essential.
10 4.20 .632 28 3.71 .713 2.014 17.79 .059
Time 10 3.4600 .4719 28 3.1089 .424 2.073 14.53 .056
1. I need to spend more time on computer training.
10 3.70 .823 28 3.86 .756 -.529 14.79 .605
2. Time spent with computers enhances needed information.
10 3.90 .876 28 3.18 .945 2.190 17.06 .043*
3. I have seen time-on task improve from students using computers.
10 4.00 1.155 26 3.04 .599 2.507 10.92 .029*
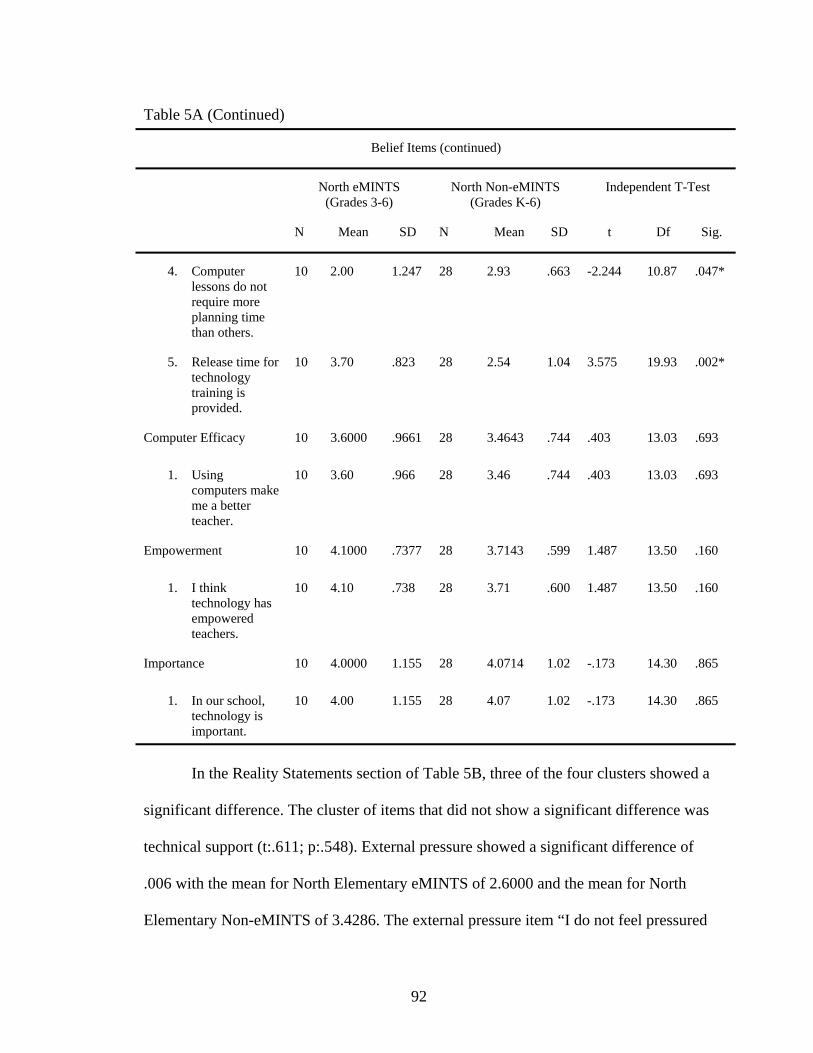
92
Table 5A (Continued)
Belief Items (continued)
North eMINTS (Grades 3-6)
North Non-eMINTS (Grades K-6)
Independent T-Test
N Mean SD N Mean SD t Df Sig.
4. Computer lessons do not require more planning time than others.
10 2.00 1.247 28 2.93 .663 -2.244 10.87 .047*
5. Release time for technology training is provided.
10 3.70 .823 28 2.54 1.04 3.575 19.93 .002*
Computer Efficacy 10 3.6000 .9661 28 3.4643 .744 .403 13.03 .693
1. Using computers make me a better teacher.
10 3.60 .966 28 3.46 .744 .403 13.03 .693
Empowerment 10 4.1000 .7377 28 3.7143 .599 1.487 13.50 .160
1. I think technology has empowered teachers.
10 4.10 .738 28 3.71 .600 1.487 13.50 .160
Importance 10 4.0000 1.155 28 4.0714 1.02 -.173 14.30 .865
1. In our school, technology is important.
10 4.00 1.155 28 4.07 1.02 -.173 14.30 .865
In the Reality Statements section of Table 5B, three of the four clusters showed a
significant difference. The cluster of items that did not show a significant difference was
technical support (t:.611; p:.548). External pressure showed a significant difference of
.006 with the mean for North Elementary eMINTS of 2.6000 and the mean for North
Elementary Non-eMINTS of 3.4286. The external pressure item “I do not feel pressured

93
to use computers in my teaching” revealed a .006 significance level with a 3.56 mean for
North Elementary eMINTS and a 2.60 mean for North Elementary Non-eMINTS.
Competence cluster showed a significant difference of .002 with the mean for
North Elementary eMINTS of 4.3250 and the mean for North Elementary Non-eMINTS
of 3.7171. Two competence items revealed a significance difference: (a) “Students are
willing to use computers in our school” at a .006 significance level with a 4.50 mean for
North Elementary eMINTS and a 3.82 mean for North Elementary Non-eMINTS; and (b)
“I am comfortable using technology” with a 4.50 mean for North Elementary eMINTS
and a 3.61 mean for North Elementary Non-eMINTS, a .006 significance level.
Resources cluster showed a significant difference of .001 with the mean for North
Elementary eMINTS of 4.1750 and the mean for North Elementary Non-eMINTS of
3.2143. Three resource items showed significant differences: (a) “The availability of
computers increase my ability to integrate technology” at a .000 significance level with a
4.50 mean for North Elementary eMINTS and a 2.54 mean for North Elementary Non-
eMINTS; (b) “Adequate technological resources are available” with a 4.50 mean for
North Elementary eMINTS and a 3.32 mean for North Elementary Non-eMINTS, a .000
significance level; and (c) “Our school has plenty of technology” at a significance level
of .002 between a 4.60 mean for North Elementary eMINTS and a 3.75 mean for North
Elementary Non-eMINTS.
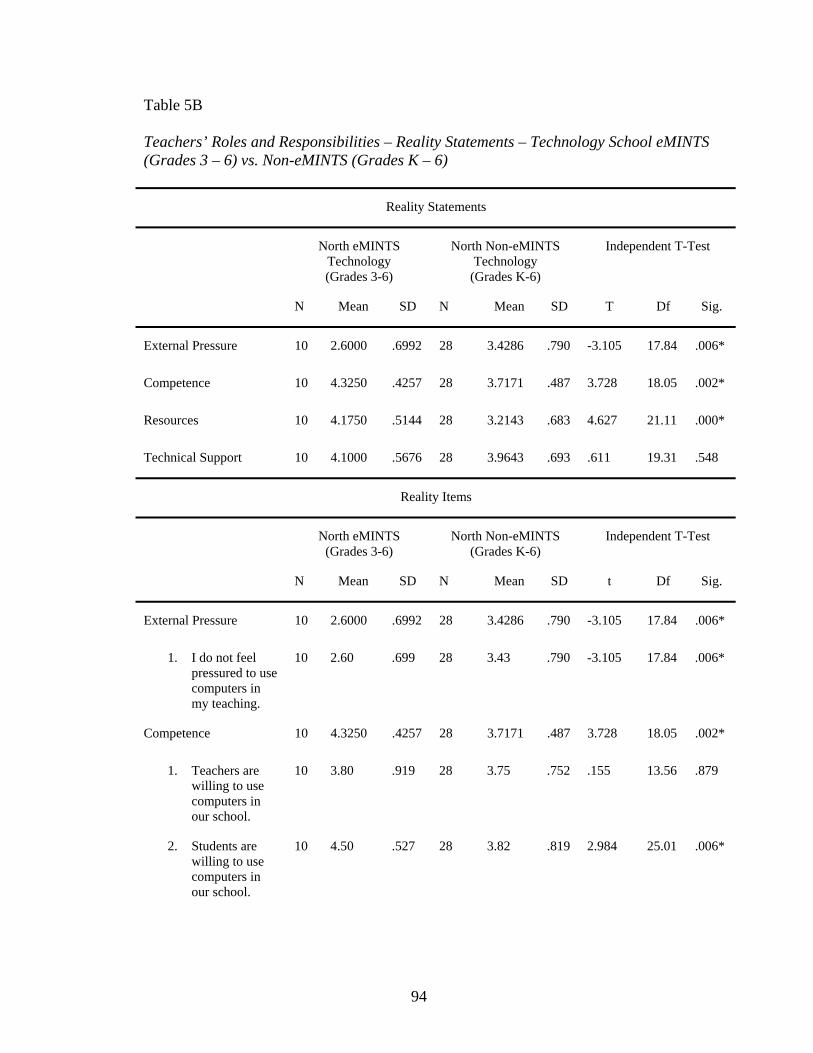
94
Table 5B Teachers’ Roles and Responsibilities – Reality Statements – Technology School eMINTS (Grades 3 – 6) vs. Non-eMINTS (Grades K – 6)
Reality Statements
North eMINTS Technology (Grades 3-6)
North Non-eMINTS Technology
(Grades K-6)
Independent T-Test
N Mean SD N Mean SD T Df Sig.
External Pressure 10 2.6000 .6992 28 3.4286 .790 -3.105 17.84 .006*
Competence 10 4.3250 .4257 28 3.7171 .487 3.728 18.05 .002*
Resources 10 4.1750 .5144 28 3.2143 .683 4.627 21.11 .000*
Technical Support 10 4.1000 .5676 28 3.9643 .693 .611 19.31 .548
Reality Items
North eMINTS (Grades 3-6)
North Non-eMINTS (Grades K-6)
Independent T-Test
N Mean SD N Mean SD t Df Sig.
External Pressure 10 2.6000 .6992 28 3.4286 .790 -3.105 17.84 .006*
1. I do not feel pressured to use computers in my teaching.
10 2.60 .699 28 3.43 .790 -3.105 17.84 .006*
Competence 10 4.3250 .4257 28 3.7171 .487 3.728 18.05 .002*
1. Teachers are willing to use computers in our school.
10 3.80 .919 28 3.75 .752 .155 13.56 .879
2. Students are willing to use computers in our school.
10 4.50 .527 28 3.82 .819 2.984 25.01 .006*
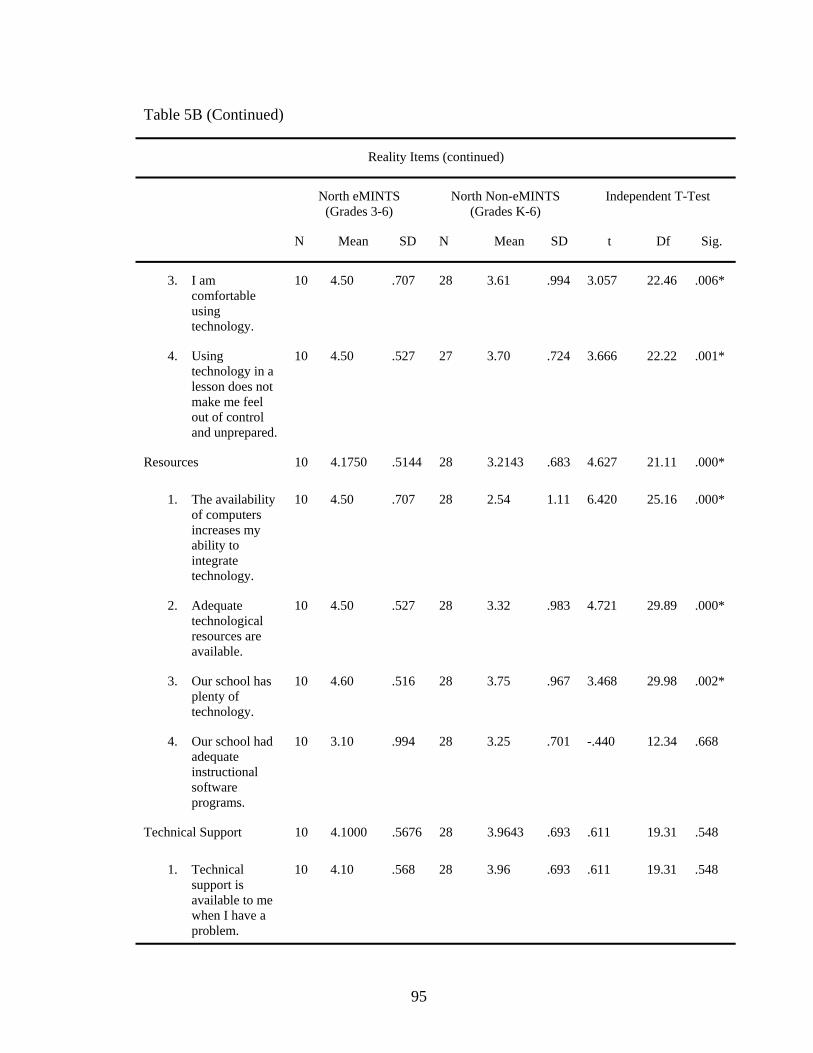
95
Table 5B (Continued)
Reality Items (continued)
North eMINTS (Grades 3-6)
North Non-eMINTS (Grades K-6)
Independent T-Test
N Mean SD N Mean SD t Df Sig.
3. I am comfortable using technology.
10 4.50 .707 28 3.61 .994 3.057 22.46 .006*
4. Using technology in a lesson does not make me feel out of control and unprepared.
10 4.50 .527 27 3.70 .724 3.666 22.22 .001*
Resources 10 4.1750 .5144 28 3.2143 .683 4.627 21.11 .000*
1. The availability of computers increases my ability to integrate technology.
10 4.50 .707 28 2.54 1.11 6.420 25.16 .000*
2. Adequate technological resources are available.
10 4.50 .527 28 3.32 .983 4.721 29.89 .000*
3. Our school has plenty of technology.
10 4.60 .516 28 3.75 .967 3.468 29.98 .002*
4. Our school had adequate instructional software programs.
10 3.10 .994 28 3.25 .701 -.440 12.34 .668
Technical Support 10 4.1000 .5676 28 3.9643 .693 .611 19.31 .548
1. Technical support is available to me when I have a problem.
10 4.10 .568 28 3.96 .693 .611 19.31 .548
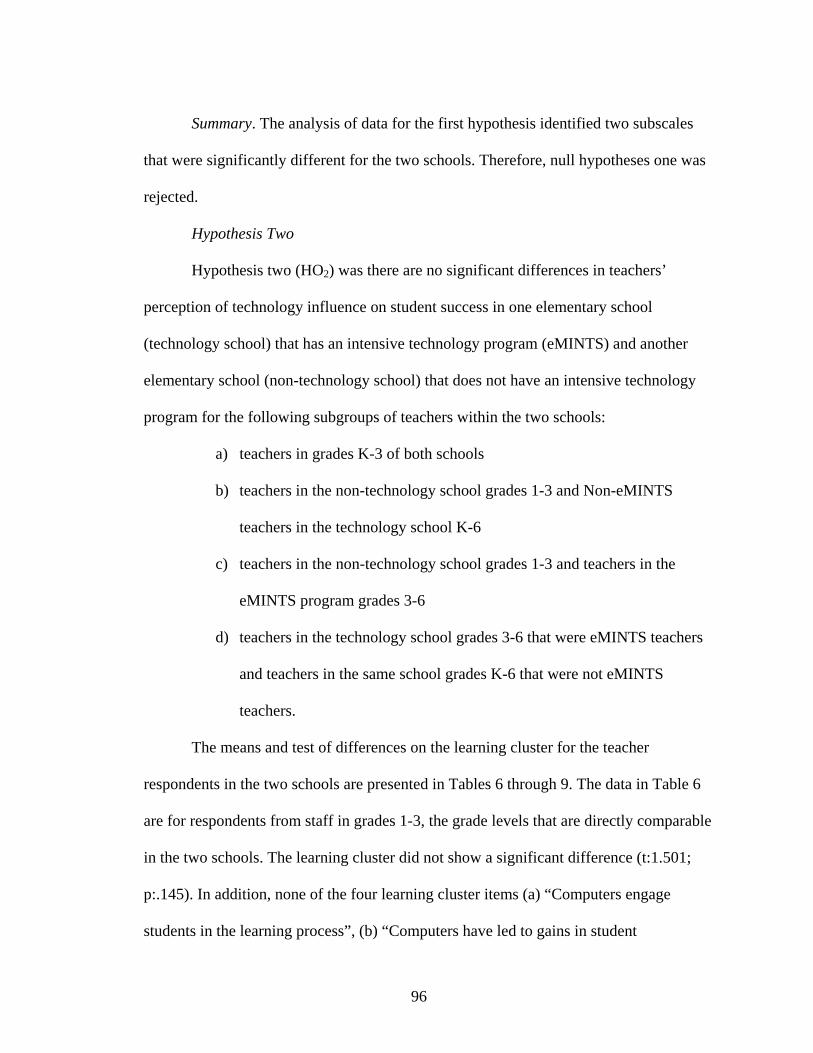
96
Summary. The analysis of data for the first hypothesis identified two subscales
that were significantly different for the two schools. Therefore, null hypotheses one was
rejected.
Hypothesis Two
Hypothesis two (HO2) was there are no significant differences in teachers’
perception of technology influence on student success in one elementary school
(technology school) that has an intensive technology program (eMINTS) and another
elementary school (non-technology school) that does not have an intensive technology
program for the following subgroups of teachers within the two schools:
a) teachers in grades K-3 of both schools
b) teachers in the non-technology school grades 1-3 and Non-eMINTS
teachers in the technology school K-6
c) teachers in the non-technology school grades 1-3 and teachers in the
eMINTS program grades 3-6
d) teachers in the technology school grades 3-6 that were eMINTS teachers
and teachers in the same school grades K-6 that were not eMINTS
teachers.
The means and test of differences on the learning cluster for the teacher
respondents in the two schools are presented in Tables 6 through 9. The data in Table 6
are for respondents from staff in grades 1-3, the grade levels that are directly comparable
in the two schools. The learning cluster did not show a significant difference (t:1.501;
p:.145). In addition, none of the four learning cluster items (a) “Computers engage
students in the learning process”, (b) “Computers have led to gains in student
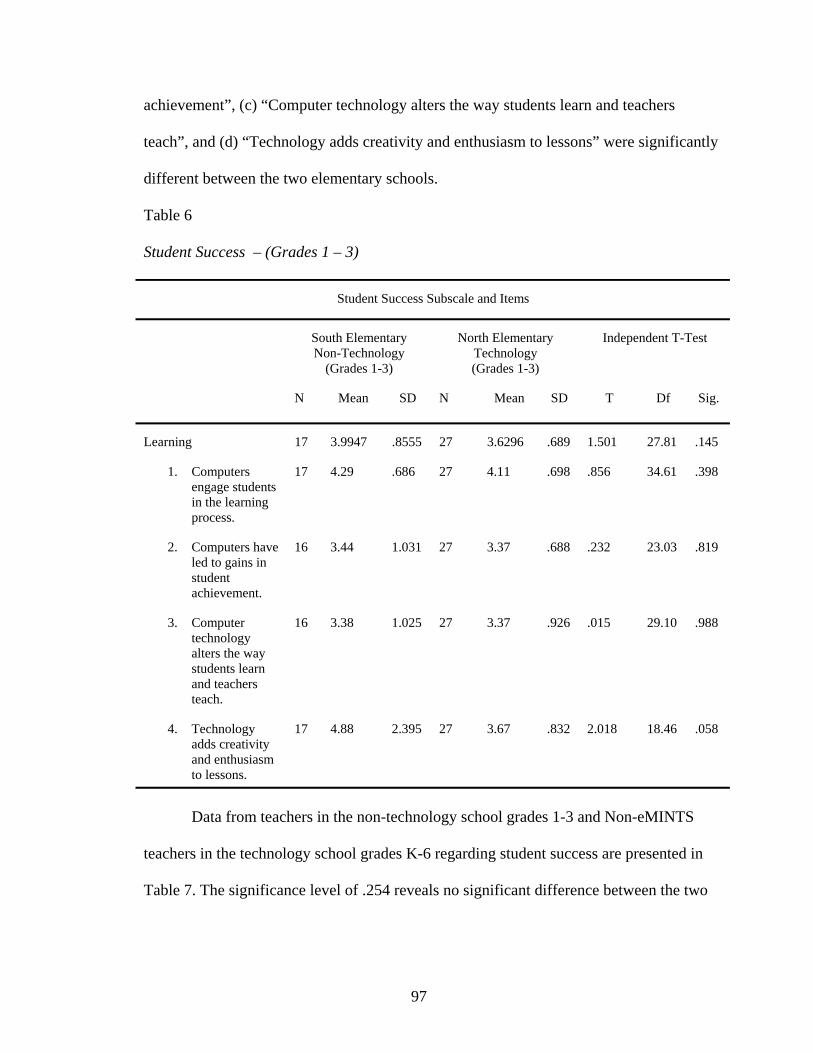
97
achievement”, (c) “Computer technology alters the way students learn and teachers
teach”, and (d) “Technology adds creativity and enthusiasm to lessons” were significantly
different between the two elementary schools.
Table 6 Student Success – (Grades 1 – 3)
Student Success Subscale and Items
South Elementary Non-Technology
(Grades 1-3)
North Elementary Technology (Grades 1-3)
Independent T-Test
N Mean SD N Mean SD T Df Sig.
Learning 17 3.9947 .8555 27 3.6296 .689 1.501 27.81 .145
1. Computers engage students in the learning process.
17 4.29 .686 27 4.11 .698 .856 34.61 .398
2. Computers have led to gains in student achievement.
16 3.44 1.031 27 3.37 .688 .232 23.03 .819
3. Computer technology alters the way students learn and teachers teach.
16 3.38 1.025 27 3.37 .926 .015 29.10 .988
4. Technology adds creativity and enthusiasm to lessons.
17 4.88 2.395 27 3.67 .832 2.018 18.46 .058
Data from teachers in the non-technology school grades 1-3 and Non-eMINTS
teachers in the technology school grades K-6 regarding student success are presented in
Table 7. The significance level of .254 reveals no significant difference between the two
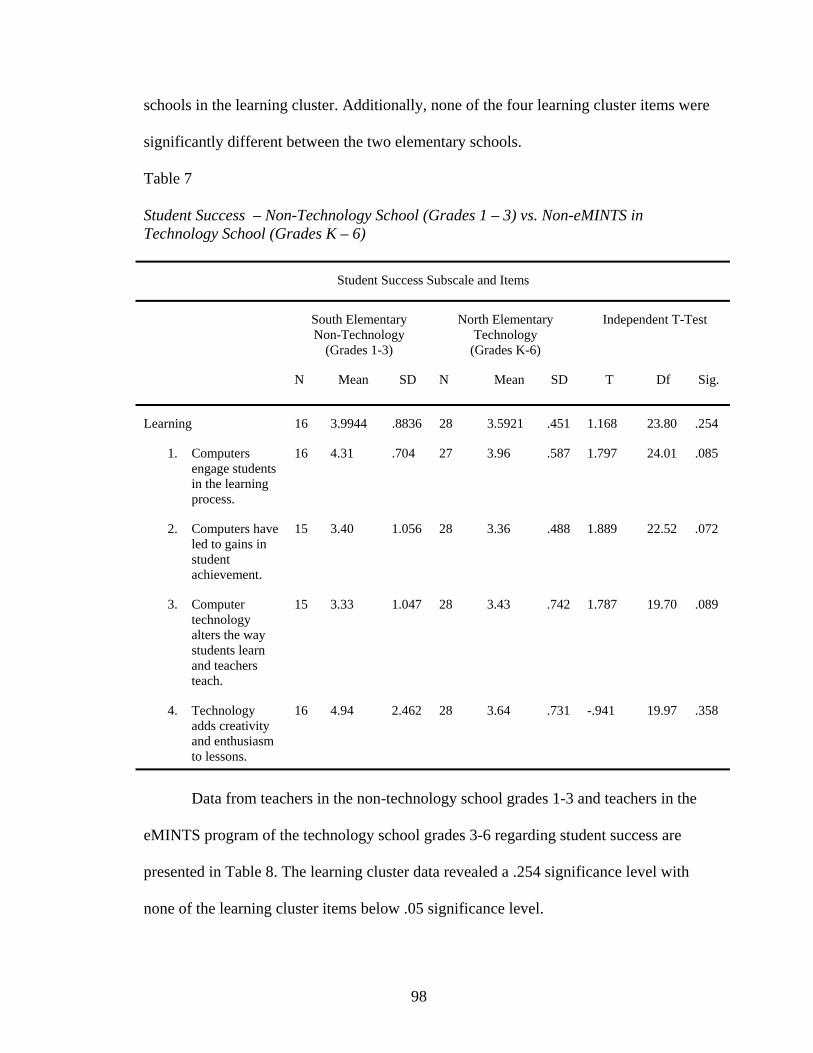
98
schools in the learning cluster. Additionally, none of the four learning cluster items were
significantly different between the two elementary schools.
Table 7 Student Success – Non-Technology School (Grades 1 – 3) vs. Non-eMINTS in Technology School (Grades K – 6)
Student Success Subscale and Items
South Elementary Non-Technology
(Grades 1-3)
North Elementary Technology
(Grades K-6)
Independent T-Test
N Mean SD N Mean SD T Df Sig.
Learning 16 3.9944 .8836 28 3.5921 .451 1.168 23.80 .254
1. Computers engage students in the learning process.
16 4.31 .704 27 3.96 .587 1.797 24.01 .085
2. Computers have led to gains in student achievement.
15 3.40 1.056 28 3.36 .488 1.889 22.52 .072
3. Computer technology alters the way students learn and teachers teach.
15 3.33 1.047 28 3.43 .742 1.787 19.70 .089
4. Technology adds creativity and enthusiasm to lessons.
16 4.94 2.462 28 3.64 .731 -.941 19.97 .358
Data from teachers in the non-technology school grades 1-3 and teachers in the
eMINTS program of the technology school grades 3-6 regarding student success are
presented in Table 8. The learning cluster data revealed a .254 significance level with
none of the learning cluster items below .05 significance level.
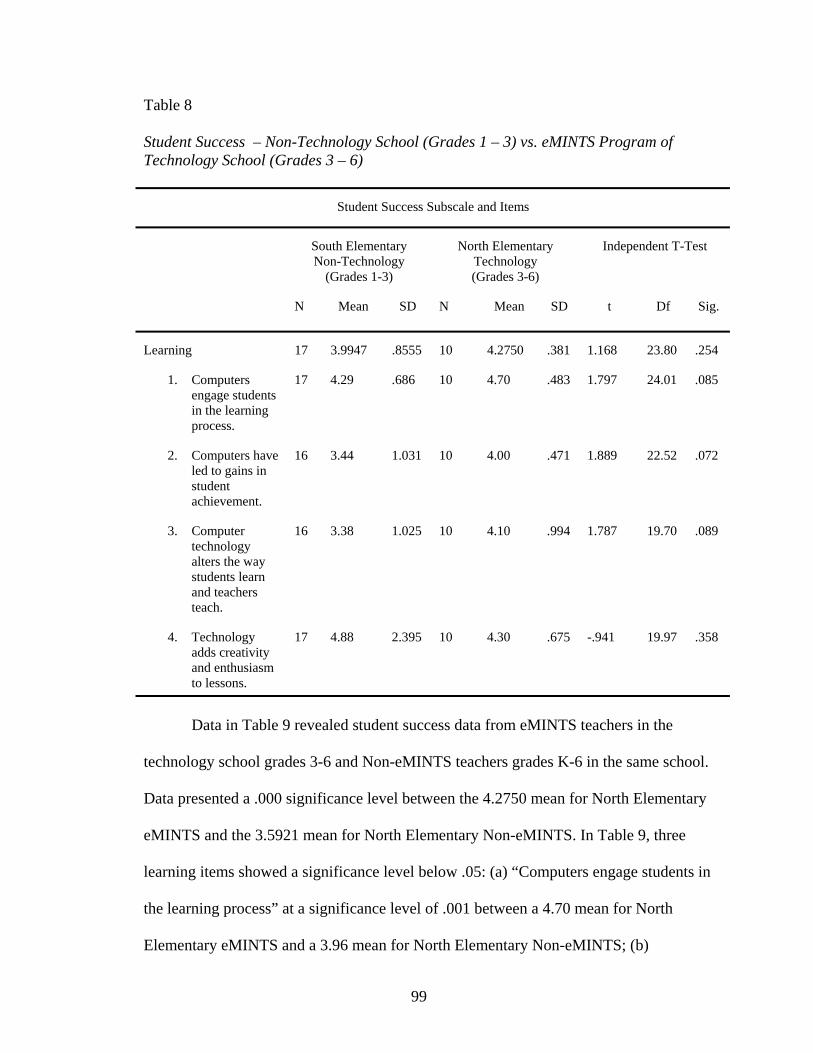
99
Table 8 Student Success – Non-Technology School (Grades 1 – 3) vs. eMINTS Program of Technology School (Grades 3 – 6)
Student Success Subscale and Items
South Elementary Non-Technology
(Grades 1-3)
North Elementary Technology (Grades 3-6)
Independent T-Test
N Mean SD N Mean SD t Df Sig.
Learning 17 3.9947 .8555 10 4.2750 .381 1.168 23.80 .254
1. Computers engage students in the learning process.
17 4.29 .686 10 4.70 .483 1.797 24.01 .085
2. Computers have led to gains in student achievement.
16 3.44 1.031 10 4.00 .471 1.889 22.52 .072
3. Computer technology alters the way students learn and teachers teach.
16 3.38 1.025 10 4.10 .994 1.787 19.70 .089
4. Technology adds creativity and enthusiasm to lessons.
17 4.88 2.395 10 4.30 .675 -.941 19.97 .358
Data in Table 9 revealed student success data from eMINTS teachers in the
technology school grades 3-6 and Non-eMINTS teachers grades K-6 in the same school.
Data presented a .000 significance level between the 4.2750 mean for North Elementary
eMINTS and the 3.5921 mean for North Elementary Non-eMINTS. In Table 9, three
learning items showed a significance level below .05: (a) “Computers engage students in
the learning process” at a significance level of .001 between a 4.70 mean for North
Elementary eMINTS and a 3.96 mean for North Elementary Non-eMINTS; (b)
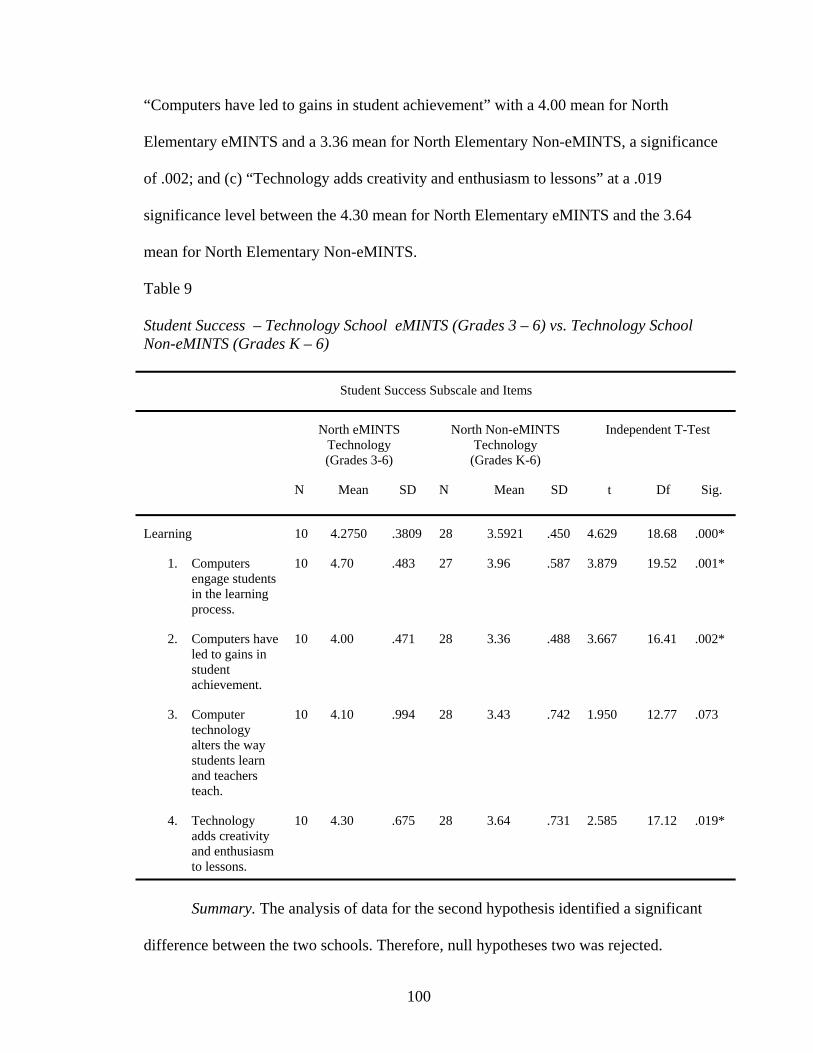
100
“Computers have led to gains in student achievement” with a 4.00 mean for North
Elementary eMINTS and a 3.36 mean for North Elementary Non-eMINTS, a significance
of .002; and (c) “Technology adds creativity and enthusiasm to lessons” at a .019
significance level between the 4.30 mean for North Elementary eMINTS and the 3.64
mean for North Elementary Non-eMINTS.
Table 9 Student Success – Technology School eMINTS (Grades 3 – 6) vs. Technology School Non-eMINTS (Grades K – 6)
Student Success Subscale and Items
North eMINTS Technology (Grades 3-6)
North Non-eMINTS Technology
(Grades K-6)
Independent T-Test
N Mean SD N Mean SD t Df Sig.
Learning 10 4.2750 .3809 28 3.5921 .450 4.629 18.68 .000*
1. Computers engage students in the learning process.
10 4.70 .483 27 3.96 .587 3.879 19.52 .001*
2. Computers have led to gains in student achievement.
10 4.00 .471 28 3.36 .488 3.667 16.41 .002*
3. Computer technology alters the way students learn and teachers teach.
10 4.10 .994 28 3.43 .742 1.950 12.77 .073
4. Technology adds creativity and enthusiasm to lessons.
10 4.30 .675 28 3.64 .731 2.585 17.12 .019*
Summary. The analysis of data for the second hypothesis identified a significant
difference between the two schools. Therefore, null hypotheses two was rejected.
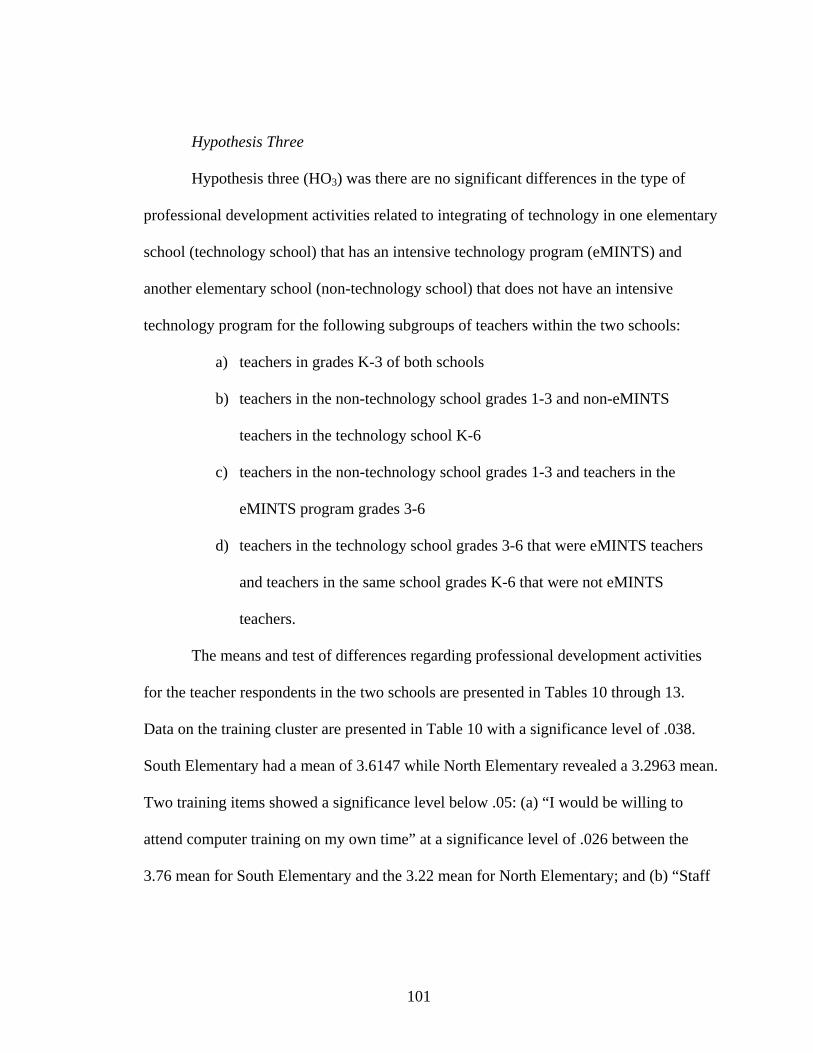
101
Hypothesis Three
Hypothesis three (HO3) was there are no significant differences in the type of
professional development activities related to integrating of technology in one elementary
school (technology school) that has an intensive technology program (eMINTS) and
another elementary school (non-technology school) that does not have an intensive
technology program for the following subgroups of teachers within the two schools:
a) teachers in grades K-3 of both schools
b) teachers in the non-technology school grades 1-3 and non-eMINTS
teachers in the technology school K-6
c) teachers in the non-technology school grades 1-3 and teachers in the
eMINTS program grades 3-6
d) teachers in the technology school grades 3-6 that were eMINTS teachers
and teachers in the same school grades K-6 that were not eMINTS
teachers.
The means and test of differences regarding professional development activities
for the teacher respondents in the two schools are presented in Tables 10 through 13.
Data on the training cluster are presented in Table 10 with a significance level of .038.
South Elementary had a mean of 3.6147 while North Elementary revealed a 3.2963 mean.
Two training items showed a significance level below .05: (a) “I would be willing to
attend computer training on my own time” at a significance level of .026 between the
3.76 mean for South Elementary and the 3.22 mean for North Elementary; and (b) “Staff
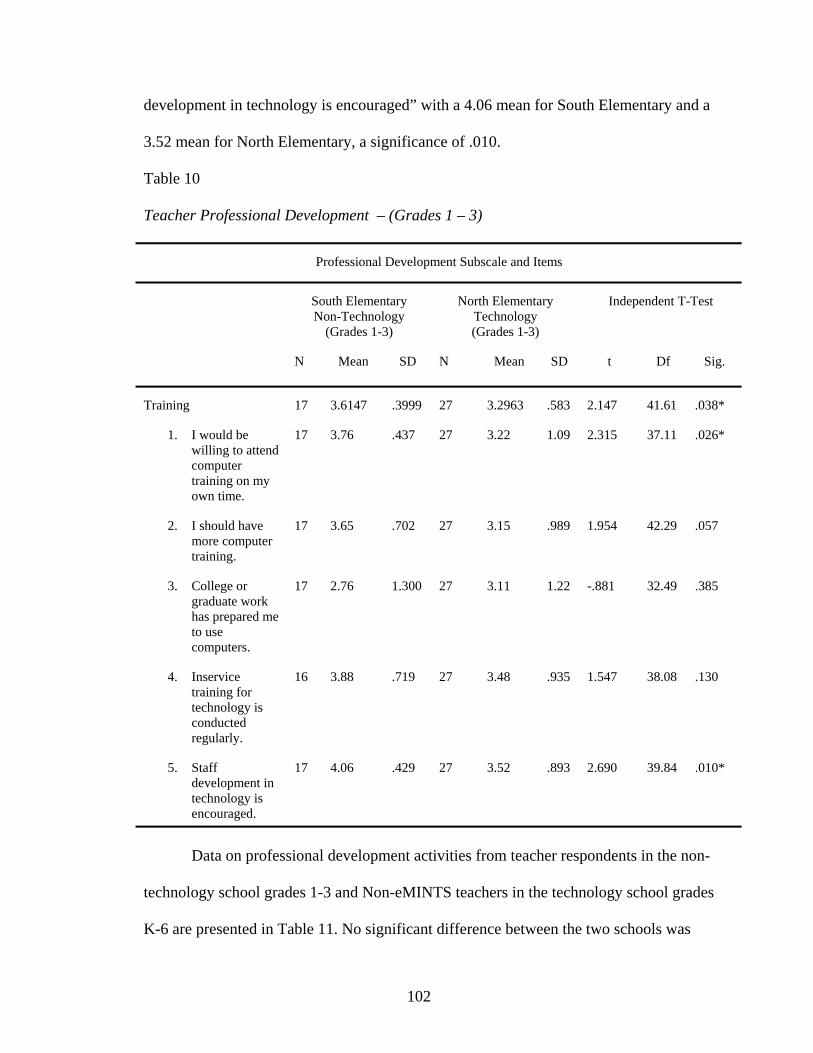
102
development in technology is encouraged” with a 4.06 mean for South Elementary and a
3.52 mean for North Elementary, a significance of .010.
Table 10 Teacher Professional Development – (Grades 1 – 3)
Professional Development Subscale and Items
South Elementary Non-Technology
(Grades 1-3)
North Elementary Technology (Grades 1-3)
Independent T-Test
N Mean SD N Mean SD t Df Sig.
Training 17 3.6147 .3999 27 3.2963 .583 2.147 41.61 .038*
1. I would be willing to attend computer training on my own time.
17 3.76 .437 27 3.22 1.09 2.315 37.11 .026*
2. I should have more computer training.
17 3.65 .702 27 3.15 .989 1.954 42.29 .057
3. College or graduate work has prepared me to use computers.
17 2.76 1.300 27 3.11 1.22 -.881 32.49 .385
4. Inservice training for technology is conducted regularly.
16 3.88 .719 27 3.48 .935 1.547 38.08 .130
5. Staff development in technology is encouraged.
17 4.06 .429 27 3.52 .893 2.690 39.84 .010*
Data on professional development activities from teacher respondents in the non-
technology school grades 1-3 and Non-eMINTS teachers in the technology school grades
K-6 are presented in Table 11. No significant difference between the two schools was
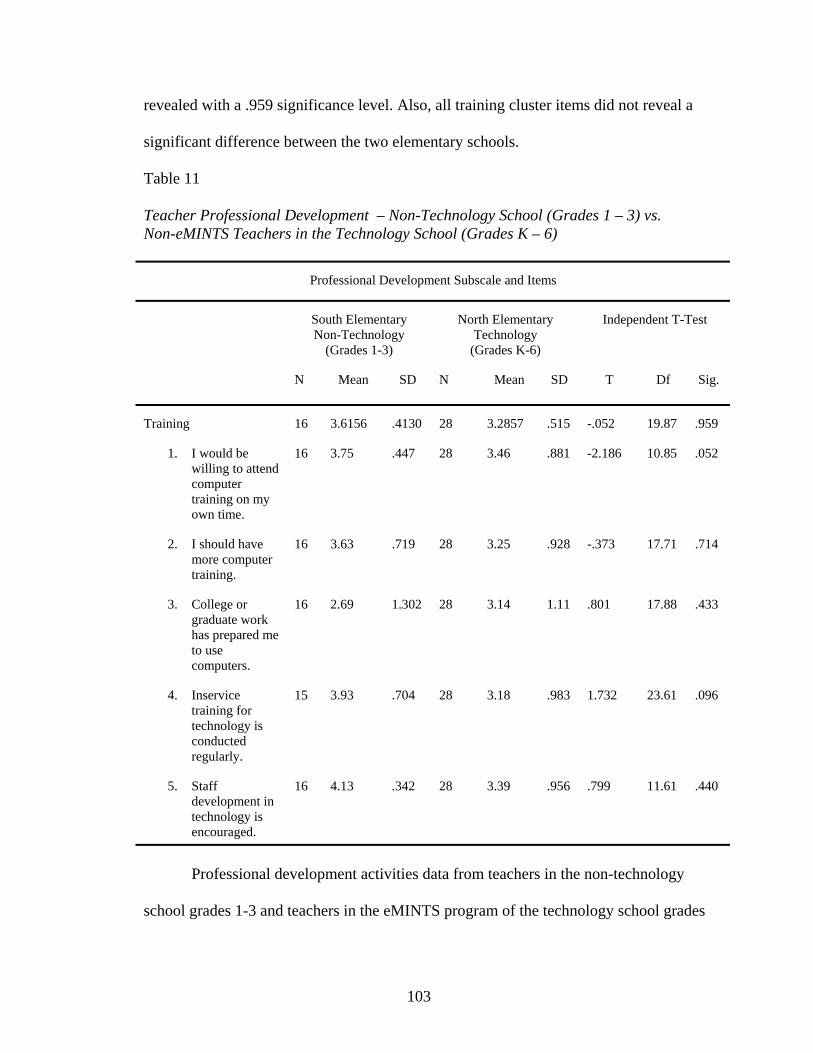
103
revealed with a .959 significance level. Also, all training cluster items did not reveal a
significant difference between the two elementary schools.
Table 11 Teacher Professional Development – Non-Technology School (Grades 1 – 3) vs. Non-eMINTS Teachers in the Technology School (Grades K – 6)
Professional Development Subscale and Items
South Elementary Non-Technology
(Grades 1-3)
North Elementary Technology
(Grades K-6)
Independent T-Test
N Mean SD N Mean SD T Df Sig.
Training 16 3.6156 .4130 28 3.2857 .515 -.052 19.87 .959
1. I would be willing to attend computer training on my own time.
16 3.75 .447 28 3.46 .881 -2.186 10.85 .052
2. I should have more computer training.
16 3.63 .719 28 3.25 .928 -.373 17.71 .714
3. College or graduate work has prepared me to use computers.
16 2.69 1.302 28 3.14 1.11 .801 17.88 .433
4. Inservice training for technology is conducted regularly.
15 3.93 .704 28 3.18 .983 1.732 23.61 .096
5. Staff development in technology is encouraged.
16 4.13 .342 28 3.39 .956 .799 11.61 .440
Professional development activities data from teachers in the non-technology
school grades 1-3 and teachers in the eMINTS program of the technology school grades
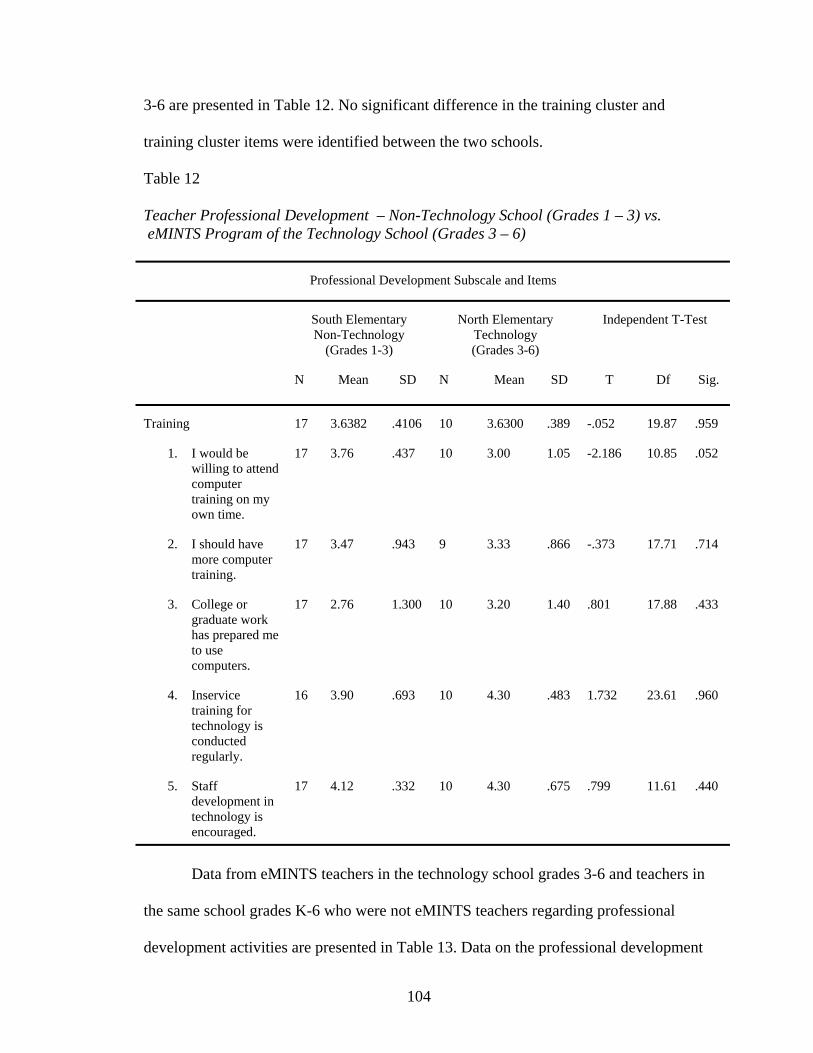
104
3-6 are presented in Table 12. No significant difference in the training cluster and
training cluster items were identified between the two schools.
Table 12 Teacher Professional Development – Non-Technology School (Grades 1 – 3) vs. eMINTS Program of the Technology School (Grades 3 – 6)
Professional Development Subscale and Items
South Elementary Non-Technology
(Grades 1-3)
North Elementary Technology (Grades 3-6)
Independent T-Test
N Mean SD N Mean SD T Df Sig.
Training 17 3.6382 .4106 10 3.6300 .389 -.052 19.87 .959
1. I would be willing to attend computer training on my own time.
17 3.76 .437 10 3.00 1.05 -2.186 10.85 .052
2. I should have more computer training.
17 3.47 .943 9 3.33 .866 -.373 17.71 .714
3. College or graduate work has prepared me to use computers.
17 2.76 1.300 10 3.20 1.40 .801 17.88 .433
4. Inservice training for technology is conducted regularly.
16 3.90 .693 10 4.30 .483 1.732 23.61 .960
5. Staff development in technology is encouraged.
17 4.12 .332 10 4.30 .675 .799 11.61 .440
Data from eMINTS teachers in the technology school grades 3-6 and teachers in
the same school grades K-6 who were not eMINTS teachers regarding professional
development activities are presented in Table 13. Data on the professional development
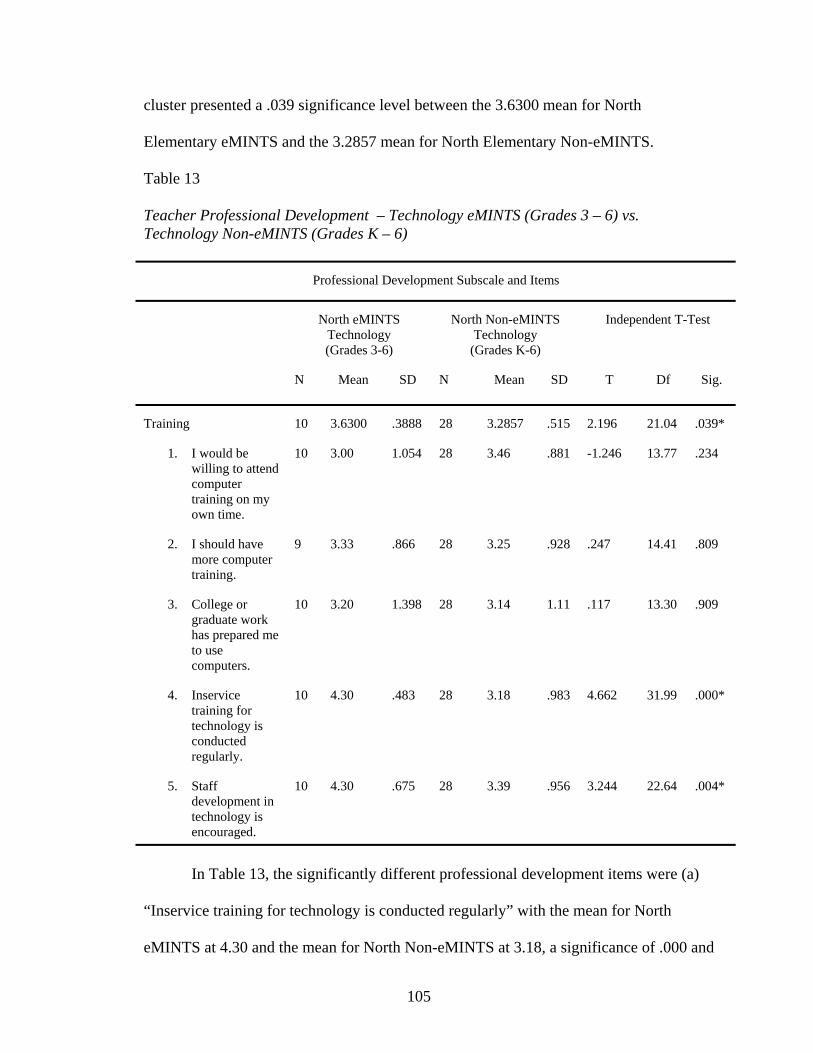
105
cluster presented a .039 significance level between the 3.6300 mean for North
Elementary eMINTS and the 3.2857 mean for North Elementary Non-eMINTS.
Table 13 Teacher Professional Development – Technology eMINTS (Grades 3 – 6) vs. Technology Non-eMINTS (Grades K – 6)
Professional Development Subscale and Items
North eMINTS Technology (Grades 3-6)
North Non-eMINTS Technology
(Grades K-6)
Independent T-Test
N Mean SD N Mean SD T Df Sig.
Training 10 3.6300 .3888 28 3.2857 .515 2.196 21.04 .039*
1. I would be willing to attend computer training on my own time.
10 3.00 1.054 28 3.46 .881 -1.246 13.77 .234
2. I should have more computer training.
9 3.33 .866 28 3.25 .928 .247 14.41 .809
3. College or graduate work has prepared me to use computers.
10 3.20 1.398 28 3.14 1.11 .117 13.30 .909
4. Inservice training for technology is conducted regularly.
10 4.30 .483 28 3.18 .983 4.662 31.99 .000*
5. Staff development in technology is encouraged.
10 4.30 .675 28 3.39 .956 3.244 22.64 .004*
In Table 13, the significantly different professional development items were (a)
“Inservice training for technology is conducted regularly” with the mean for North
eMINTS at 4.30 and the mean for North Non-eMINTS at 3.18, a significance of .000 and
106
(b) “Staff development in technology is encouraged” at a significance level of .004
between the mean for North eMINTS of 4.30 and the mean for North Non-eMINTS of
3.39.
Summary. Significant differences were identified between the two schools;
therefore, null hypothesis three was rejected.
Summary of Quantitative Findings
Table 14 summarizes the statistically significant quantitative findings for this
exploratory study. Significant data findings for each hypothesis (HO1, HO2, and HO3) by
subgroups of teachers within both schools are presented. The hypotheses are listed across
the top of the table followed by the category and item cluster that relate to each
hypothesis. On the left side of the table, the subgroups of teachers from both schools and
how they were grouped for this investigation are identified. The subgroups of teachers
include (a) teachers in the non-technology school in grades 1- 3, (b) teachers in the
technology school with both technology and non-technology classrooms in grades 1-3,
(c) teachers in the technology school who were not in technology classrooms grades K-6,
and (d) teachers in the technology school who were in technology classrooms grades 3-6.
The non-technology school was considered the control group, and the technology school
was considered the experimental school for this study.
The first grouping of teachers from both schools included (a) teachers in the non-
technology school in grades 1- 3 versus (b) teachers in the technology school with both
technology and non-technology classrooms in grades 1-3. Data from Table 14 revealed
that teachers in the non-technology school grades 1-3 had stronger views in ideology and
training than did the teachers in the technology school grades 1-3. The teachers in the
107
non-technology school in grades 1-3 were willing to attend more computer training on
their own time and staff development in technology was strongly encouraged. Teachers
from the technology school grades 1-3 felt they had more technical support than those
teachers in the non-technology school grades 1-3.
The next grouping of teachers consisted of (a) teachers in the non-technology
school in grades 1- 3 versus (c) teachers in the technology school who were not in
technology classrooms grades K-6. The area of differences was noticed in the Reality
section of Table 14. Teachers in the non-technology school in grades 1-3 felt more
external pressure to use technology in the classroom, and they felt more competent using
technology in the classroom than the teachers from the technology school who were not
in technology classrooms in grades K-6. However, the K-6 teachers in the technology
who were not in technology classrooms felt they had more resources and technical
support available to them than did the teachers at the non-technology school.
The third group of teachers that were studied included (a) teachers in the non-
technology school in grades 1- 3 versus (d) teachers in the technology school who were
in technology classrooms grades 3-6. Differences in the Reality section were noted
between the groups in Table 14. Teachers in the non-technology school in grades 1-3 felt
more external pressure to use technology in the classroom than the teachers in the
technology school who were in technology classrooms in grades 3-6. However, teachers
in the technology school who were in technology classrooms in grades 3-6 felt more
competent using technology and had greater resources and technical support available
than those teachers at the non-technology school in grades 1-3.
108
The last group of teachers that were compared included (d) teachers in the
technology school who were in technology classrooms grades 3-6 versus (c) teachers in
the technology school who were not in technology classrooms grades K-6. Many
significant differences were found between these groups in Table 14. External pressure
was stronger for teachers who were not in technology classrooms in grades K-6. Data on
roles and responsibilities from teachers who were in technology classrooms in grades 3-6
revealed a greater ideology of using technology in the classrooms, a greater competence
level, and more resources were available than did the teachers who were not in
technology classrooms in grades K-6. Technology influence on learning data identified a
greater influence in technology classrooms. The items that were highlighted include (1)
computers engage students in the learning process, (2) computers have led to gains in
student achievement, and (3) technology adds creativity and enthusiasm to lessons.
Training data from Table 14 identified teachers in technology classrooms in grades 3-6
had stronger views relating to training than did those teachers who were not in
technology classrooms in grades K-6. Items that were significantly greater were (1)
inservice training for technology is conducted regularly and (2) staff development in
technology is encouraged.
The data reported in Table 14 rejects all three hypotheses.
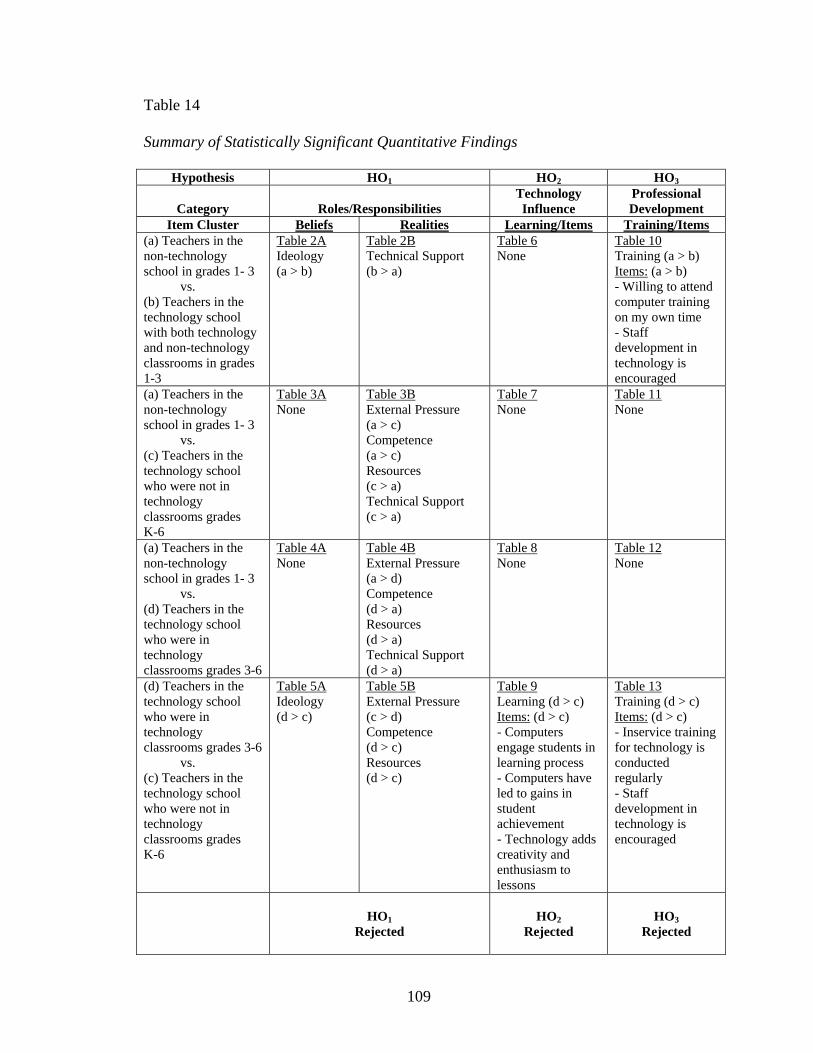
109
Table 14
Summary of Statistically Significant Quantitative Findings
Hypothesis HO1 HO2 HO3
Category
Roles/Responsibilities Technology Influence
Professional Development
Item Cluster Beliefs Realities Learning/Items Training/Items (a) Teachers in the non-technology school in grades 1- 3 vs. (b) Teachers in the technology school with both technology and non-technology classrooms in grades 1-3
Table 2A Ideology (a > b)
Table 2B Technical Support (b > a)
Table 6 None
Table 10 Training (a > b) Items: (a > b) - Willing to attend computer training on my own time - Staff development in technology is encouraged
(a) Teachers in the non-technology school in grades 1- 3 vs. (c) Teachers in the technology school who were not in technology classrooms grades K-6
Table 3A None
Table 3B External Pressure (a > c) Competence (a > c) Resources (c > a) Technical Support (c > a)
Table 7 None
Table 11 None
(a) Teachers in the non-technology school in grades 1- 3 vs. (d) Teachers in the technology school who were in technology classrooms grades 3-6
Table 4A None
Table 4B External Pressure (a > d) Competence (d > a) Resources (d > a) Technical Support (d > a)
Table 8 None
Table 12 None
(d) Teachers in the technology school who were in technology classrooms grades 3-6 vs. (c) Teachers in the technology school who were not in technology classrooms grades K-6
Table 5A Ideology (d > c)
Table 5B External Pressure (c > d) Competence (d > c) Resources (d > c)
Table 9 Learning (d > c) Items: (d > c) - Computers engage students in learning process - Computers have led to gains in student achievement - Technology adds creativity and enthusiasm to lessons
Table 13 Training (d > c) Items: (d > c) - Inservice training for technology is conducted regularly - Staff development in technology is encouraged
HO1
Rejected
HO2
Rejected
HO3
Rejected
110
Qualitative Data
For this study, two urban elementary schools with 58 certificated staff members
participated. Each participant completed the survey instrument to investigate the use and
integration of technology into the elementary curriculum and to explore the influence of
technology on student success. Five individual interviews and a focus group interview
with the building administrator and department heads were conducted at each elementary
school to gather a more in-depth understanding of the use and integration of technology
in elementary classrooms and to explore the influence of technology on student success.
Analysis of the qualitative data revealed three primary themes with subthemes
embedded within each of the primary themes. These themes were (a) barriers to
technology integration, (b) importance of technology training, and (c) learning
environment.
Barriers to Technology Integration
The first theme to emerge from this study was barriers to technology integration.
Further examination of the data from which this theme emerged revealed three
subthemes: (1) time; (2) resources; and (3) technical support. Each of the subthemes
directly affects technology integration.
Time. The first subtheme associated with barriers to technology integration was
time. Interview participants from South Elementary and North Elementary stressed the
challenge of time. Teachers from the non-technology school responded, “Time is a big
issue because all the stuff I look up on my own time when I am at home or have a few
extra minutes” (JS). “Actually finding time to find different things in different subjects is
the challenge” (EC). Data support the view of extant literature that using computers in the
111
classrooms requires a considerable time investment by teachers (Bitner & Bitner, 2002).
“It is a lot of work to have to do as a teacher and takes time” is a response from a teacher
at the technology school who does not work in a technology classroom (BS). One teacher
in a technology classroom responded, “Finding time to prepare which programs are good
and going to best help me instruct my class is a challenge” (NG).
Participants from both schools suggested that preparing lessons that integrate
technology requires more planning time. Responses from participants at the technology
school who teach in technology classrooms are: “It takes a long time. I try to bring in
technology as much as I can but it almost doubles your planning time” (CM). “It is
difficult to do because it takes time to find web sites and put them in web quest. It is a
time constraint” (NG). “It is time consuming finding web sites and lessons that fit my
students and are not too hard or too easy” (KR). “The challenges are organizing all of the
information on the Internet to help meet the needs of the students in my classroom. There
are so many web sites and so many web quests, so many helpful things that will help you
as the teacher and help the students that you have to really pick and choose which one
will benefit the most” (CM).
Time coupled with all the demands on teachers increases the barrier to successful
technology integration (Ertmer, Addison, Lane, Ross, Woods, 1999). Data revealed that
both elementary schools are balancing implementation of a new curriculum and
achievement of adequate yearly progress gains with technology integration. A teacher at
the technology school responded, “It’s been a balancing act trying to mesh our
curriculum and technology. They are both constructivist views. How do you do it and
provide time to see how that works” (NG). “I just wish we had more time to use it” (KR).
112
Teachers from the non-technology school responded, “I think we are all so busy. We got
a new curriculum. We are on a learning curve right now with that new curriculum” (CD).
“There is not enough time in the day. What do I have to give up in order for the student to
have technology” (JS).
Resources. The second subtheme supporting barriers to technology integration
was resources. The availability of hardware and software resources is essential for
technology to positively influence student success (Dexter, Anderson, & Becker, 1999).
Several participants from the two selected urban elementary schools discussed the
importance of resources.
Participants suggested that the lack of equipment and limited access to computers
limits the level of technology integration that will occur in the classroom. One teacher
from the non-technology school responded, “There will have to be a big change in the
way we implement this stuff to make an impact on achievement with 20 students and 2
computers for them to use” (JS). “I think we need more computers in each room” (PB).
Teachers from the technology school responded, “Student access is important” (LW).
“The lack of exposure is a challenge” (AB).
Another resource component that emerged as the qualitative data were analyzed
was the availability of appropriate software programs. “It is important to make sure all
software is appropriate for the students’ level” (CD). Interview participants at both South
Elementary and North Elementary also discussed how more resources are needed. “We
are starting a new unit on data in math and there is a whole section for technology to use
on the computer, but we have to skip it because we don’t have enough computers” (AB).
113
“I have found some great web sites that have interactive things for the teachers and
students, but I can’t utilize them” (AB).
When utilizing various technological resources in the classroom, the level of
technology integration amplifies (Dias,1999). “We have invested our money in more
eMINTS classrooms versus a lab. Because in a lab, it is hit and miss. Kids get 30 minutes
a week. So you are not really getting the full effect of technology” is the response for a
participant at the technology school (NG). “SmartBoards take direct instruction to
another level. It is not really instruction. You are bringing students up and they are
interacting with the SmartBoard” (KR). “I literally think I am addicted to my
SmartBoard. I could not use a chalkboard if I wanted to now because there are so many
advantages of having a SmartBoard that I use it in reading, writing, science, social studies
and every subject of the day throughout the entire day” (CM).
Technical support. The final subtheme that influenced barriers to technology
integration was technical support. Interview data revealed that teachers must have
adequate technical support when integrating technology in the classrooms. “It is
important to make sure everything is up and running” (SG). A teacher from the non-
technology school responded, “Our computers this year have been on the blink” (CD).
Participants expressed their concerns regarding timely response to technical
problems. “My computer keeps messing up so I haven’t been able to use it” (BS).
Responses from participants at the non-technology school, South Elementary, include
“They [administration] want everything done on the computer. They [administration]
want your lesson plans, progress reports, grades, test scores, but the computer doesn’t
always work” (JS). “We have gone through some problems with the virus. Now we are at
114
the point still with reloading everything. We hired a new technology team to meet our
needs” (PB).
Data from this exploratory study of two urban elementary schools revealed
technical challenges in integrating technology. These challenges echoed a negative tone
to the notion of technology integration (Hannafin, & Savenye, 1993). “The server being
down is my biggest challenge” is a response for a teacher at the technology school, North
Elementary, (KR). “You cannot use any program on the computer unless it is issued by
the district. It has been a big hurdle” (JS). “We had a virus or something and lost
everything. Any grades you had on there if you didn’t save them they were lost” (JS).
Importance of Technology Training
The second theme that emerged from the analysis of the qualitative data gathered
in this study was the importance of technology training. To successfully integrate
technology in the classrooms, training is needed (Kopp, & Ferguson, 1996). Two
subthemes that surfaced from the further analysis of the data included: (1) collaboration
and (2) type of training. Data that transpired from the interviews of two urban elementary
schools suggested that teachers are willing and do attend training sessions.
At South Elementary, teachers are required to use technology in their classrooms.
With this requirement, technology training is mandatory and conducted mostly within the
district. Teachers meet regularly to learn technology skills and to integrate technology
into their lessons. “The push started a couple years ago when I asked all teachers to do
their lesson plans on the computer” (FG). “Everything we do is on the computer. We do
progress reports, grade cards, lessons. You name it. It’s done on the computer” (SG).
“We are going through stages and right now we are in stage one of our technology plan.
115
Training is mandatory. We have to turn in a performance event in order to get a
certificate” (FG).
Technology training at North Elementary is voluntary. Teachers sign up for
training sessions if interested. However, teachers cannot access the technology unless
they have successfully completed training on the equipment. “I am taking technology
courses right now to learn how to use a SmartBoard” (BS). “Next year I will be able to
employ a lot more with math because there’s graph paper and other things that I haven’t
been able to utilize” (RS). Teachers focus on inquiry based learning and developing
lessons that fit the curriculum versus the tool.
Collaboration. The first subtheme of the importance of technology training was
collaboration. Interview data from both elementary schools suggested that collaboration
increases with the use of technology. “Every other month they’ll teach us something new
to use in our classroom and the other month we’ll bring lessons and collaborate” (KR). “I
think we collaborate a lot – more of it is unplanned. If I have a question about technology
or a lesson through technology, I know that I can go to any of my teachers right here”
responded a teacher from the technology school (CM). “We collaborate on just about
everything on every subject” (RS).
With increased collaboration, teachers shorten the learning curve for using and
integrating technology (MacKenzie, 1999). “We are always sharing websites with each
other” (FG). It might be “emailing each other with different sites that we have come
across that may be useful or helpful in the classroom” (KR). Both elementary schools
conduct regular staff meetings and emphasize training. “Teachers meet regularly to share
certain lessons and activities that the students have done on the computers” (CM).
116
“Technology has opened the door to getting online and looking at other teacher’s lessons.
Collaboration has improved because you can get countless number of lessons from
people across the country” (LW).
Type of training. The second subtheme in the importance of technology training
was the type of training. These training types include basic skills, application software,
administrative uses, and curriculum integration. “The type of training varies with the
expertise of the teacher and the time that they have been exposed to it” (NG). Data from
the interviews suggest that training sessions are held at each elementary school.
South Elementary has a technology team that conducts training sessions once a
month for teachers to learn a new concept or skill. These sessions are referred to as
Technology Tuesdays. Teachers are required by the district to attend and complete
specific performance activities. “Everybody was trained to do basic things, but we had a
lot of reluctant learners” (PB). Currently teachers are progressing through stage one
learning the basics. Next year they will move on to stage two. “We have never done any
training on integration. If you want to do it, you need to figure it out yourself and if you
don’t know anything about computers you are sort of at a loss” (JS).
North Elementary offers various types of training within the district. Teachers can
sign up for classes to learn basic skills, administrative uses, and application software. “On
workdays, they always have computer courses available. I took two courses on
computers, one was Microsoft basics and the other was how to put your grades online”
(LW). “They showed us how to do our grades and keep records on the technology and
not just using it for the students” (KR). “Couple computer classes after school taught us
how to set up our email, but it has really been how to use versus utilizing it in your
117
classroom” (AB). Interview data suggests that the integration training is minimal. “We
are trying to figure out how we can integrate workshop and technology because we know
that workshop works and we know that technology works, but we would like to bring
them together. It is very challenging – having curriculum and having technology and
trying to figure out how the two are supposed to work together” responded a teacher from
the technology school (CM). “I have to learn how to include technology in my daily
lessons” (LW).
Learning Environment
The third theme to emerge from this study was the how technology affected the
learning environment of elementary classrooms. The data revealed two subthemes
affecting the learning environment which include: (1) enhancement of curriculum and (2)
effect on students.
Interview data suggested technology positively impacts student learning. Utilizing
computers in the classroom broadens students’ experiences while enhancing learning
opportunities (Mann & Shafer, 1997; Missouri Department of Elementary and Secondary
Education, 2002). A teacher from the non-technology school responded, “Technology is
used as resource to find out more about something” (JS). “Technology gets them ready
for the real world. Everything is computerized now and a lot of them don’t have
computers at home” (TG). “Technology lets children explore more than they are now.
They get to see more and do more than they would just in the classroom” (LW). “It
broadens students’ horizons to things that they wouldn’t probably get to see or do
otherwise. The Internet can take you everywhere,” responded a teacher from the
technology school (KR).
118
All interview participants at both South Elementary and North Elementary
suggested the use and integration of computers enhance the learning environment of
elementary classrooms. The use and integration of technology provide another learning
tool for the different types of learners in the classroom. “There are a lot of things out
there on the web like forces in motion and very hard concepts my children have struggled
with. Being able to pull technology into the lesson to help my children achieve has been
beneficial” (RS). Using computers in the classroom “positively affects their learning
because it motivates them and they can see things in different ways” (KR).
Computers enable students to participate in interactive and virtual learning
(Sandholtz, Ringstaff, & Dwyer, 1997). “Technology positively influences student
learning because it is just another avenue or way for students to learn” (CD). “Being able
to access things on the Internet or put up their writing and interactively edit it has really
made a difference” (RS). “Technology enhances the lessons. If they have a question they
have to answer students have to go and find the answer” (SG).
Enhancement of curriculum. The first subtheme of learning environment is
enhancement of curriculum. The interview participants from both South Elementary and
North Elementary revealed the use and integration of technology in elementary
classrooms enhance and enrich the curriculum. “Students have more access to recent
research and information” (ZY). “The Internet has many virtual tours students can select.
Right now we are studying weathering and they got to actually go out and look at the
Grand Canyon. They get to see things that they will probably never see in their life”
(KR). “It provides a lot of interactive learning for the whole classroom” (CM).
119
The availability of online research via the Internet provides increased learning
opportunities in the classroom (Williams, 2000). “It enriches and brings something more
to the table” response from a technology classsroom teacher (CM). “If I have something
that is not covered in the curriculum, it is amazing. You just pick up Google and the
information is endless. I use technology to locate information about a subject” response
from a non-technology classroom teacher (PB).
Curriculum is also enhanced through inquiry-based learning. When students are
constructing their knowledge, the level of learning is increased (eMINTS, 2005; Kleiman,
2004). One teacher from the technology school responded, “I would have my students do
all their research and all the inquiry based stuff with partners to create projects. I saw
great things out of them” (CM).
Effect on students. The second subtheme of learning environment is the effect on
students. Data from the interviews revealed that teachers perceive students to be
motivated and excited to use computers. “Kids are really focused on what they are doing
and really enjoy it” (BS). “Students love to use computers. They don’t even know they
are learning when they are on the computers. They are so excited to start a project about
the life cycle of a frog because they get to get on Inspiration and do a PowerPoint
presentation. They are learning so much about it that they don’t even know they are
learning” (CM).
When using computers in the elementary classrooms, students are engaged in the
learning process (Sandholtz, Ringstaff, & Dwyer, 1997). A teacher from the non-
technology school responded, “Students become more aware of what’s going on. With
the Tsunami disaster we were able to get on the computer and find out some things about
120
what exactly a tsunami was and how tsunami occur. It allows them to expand their mind”
(ML).
Students become more interested in learning when using technology (Charp,
2003). “Technology is a non-threatening learning tool and I think a lot of kids know that
and appreciate it. Some of those kids who have poor motor skills can be put in front of a
computer and not have to be worried about the quality of work they are turning out. Also
kids that are needy, academically speaking, or very bright benefit an awful lot from
technology. Those kids that are behavior concerns also benefit. You put them in front of
the computer and those concerns go away” (PB). “Students are more engaged with it. If
there is a problem, they would just figure it out because they are so interested in it” (BS).
Interthematic Relationships
The three primary themes that emerged from the analysis of the interviews were
barriers to technology integration, importance of technology training, and learning
environment. Figure 1 illustrates the interaction of these primary themes and subthemes
of this exploratory study.
Barriers to technology integration that includes time, resources, and technical
support impact technology training. Technology training through collaboration and the
type of training influences the learning environment of elementary classrooms and the
level of student success. Learning environment focuses on the enhancement of
curriculum and the effect on students. Thus, the learning environment is hindered through
the existence of barriers to technology integration and the level of technology training.
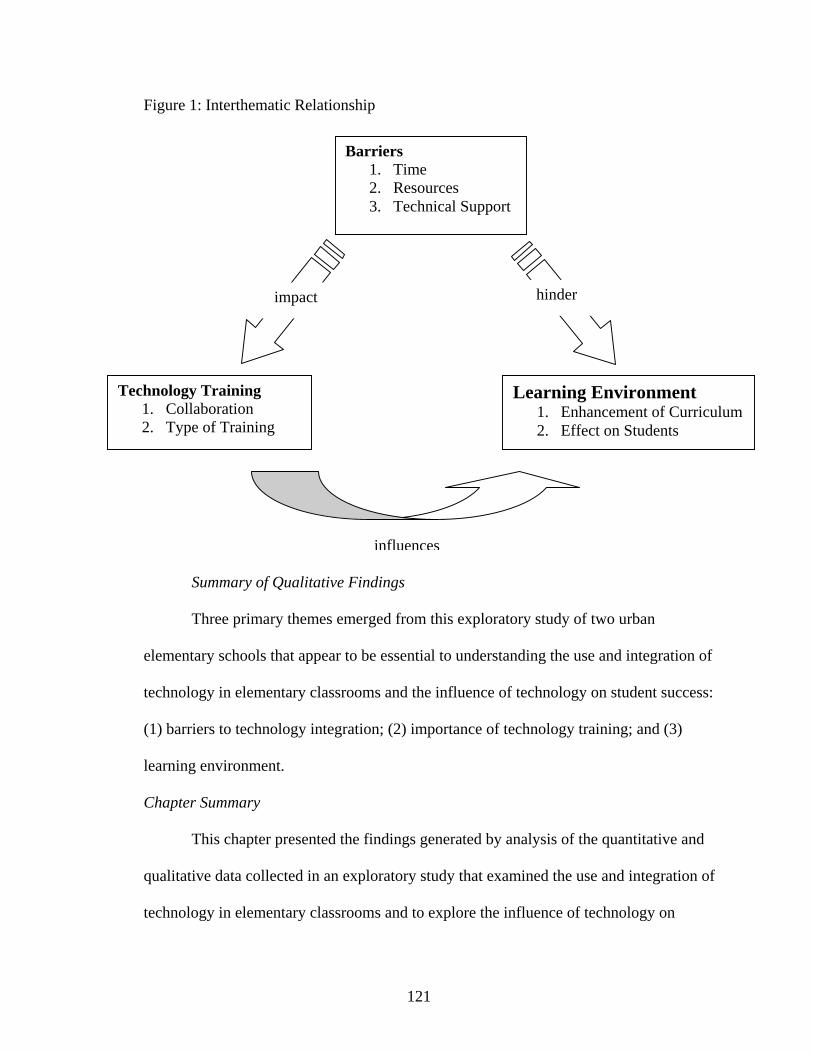
121
Figure 1: Interthematic Relationship
Summary of Qualitative Findings
Three primary themes emerged from this exploratory study of two urban
elementary schools that appear to be essential to understanding the use and integration of
technology in elementary classrooms and the influence of technology on student success:
(1) barriers to technology integration; (2) importance of technology training; and (3)
learning environment.
Chapter Summary
This chapter presented the findings generated by analysis of the quantitative and
qualitative data collected in an exploratory study that examined the use and integration of
technology in elementary classrooms and to explore the influence of technology on
Barriers 1. Time 2. Resources 3. Technical Support
impact hinder
Technology Training 1. Collaboration 2. Type of Training
Learning Environment 1. Enhancement of Curriculum2. Effect on Students
influences
122
student success. Three hypotheses were tested for significant differences and each was
rejected. From the qualitative data, three primary themes emerged that expanded the
findings of this exploratory study.
This investigation was primarily a quantitative study focusing on the teachers’
perceptions of their roles and responsibilities for integrating technology (HO1), the
influence of technology on student success (HO2), and the effect of professional
development on technology integration (HO3). The quantitative foundation of this study
was supported through the qualitative findings. The theme, barriers to technology
integration, and subthemes consisting of time, resources, and technical support
supplemented the findings for hypothesis one. Hypothesis two, focusing on the influence
of technology on student success, was supported through the primary theme of the
learning environment. The importance of technology training theme and the subthemes of
collaboration and type of training expanded and enhanced hypothesis three findings.
The final chapter contains a summary of the findings of this exploratory study and
a discussion of those findings. Implications for practice will be discussed and questions
for further study will be posed.
123
CHAPTER 5
Findings, Conclusions, and Recommendations
Introduction
Since the launch of Sputnik, numerous educational reform initiatives including
those generated after the publication of A Nation at Risk, Show-Me Standards, Missouri
Assessment Program (MAP), and No Child Left Behind (NCLB) have focused on
academic deficiencies and have greatly influenced student achievement (Berends, 2004;
Goals 2000, 1994; Missouri Department of Elementary and Secondary Education, 2002;
NCLB, 2002). NCLB, signed into law in 2002, established significant public school
accountability measures focusing on the integration of technology into classrooms to
improve teaching and learning (NCLB, 2002).
Enhancing Missouri’s Instructional Networked Teaching Strategies (eMINTS), a
technology enhancement program, which compared the results of the 2004 Missouri
Assessment Program (MAP) for 4,322 third and fourth grade students in 40 school
districts, reported the positive effects of technology on teaching and learning. Students in
eMINTS classrooms scored higher in communication arts and mathematics versus
students in Non-eMINTS classrooms (eMINTS Evaluation Project, 2005).
Mandell, Sorge, and Russell (2002) supported the notion that technology can
provide students with opportunities to discover and create knowledge thereby permitting
the teacher to take on the role of facilitator. Educators using technology help students
learn how to learn and provide them with a valuable skill more important than the
imparting of factual information.
124
Research has found that the availability of technology and the Internet has
increased significantly in the nation’s schools and classrooms (Williams, 2000).
Technology has the potential to transform learning by creating an optimum teaching and
learning environment (NCES, 2001). Therefore, teachers must be trained to create
technology rich learning environments for students (Anderson & Becker, 2001).
More teacher inservice focusing on integrating technology needs to be developed
(Smith & Robinson, 2003; Desimone, et al., 2002; Ertmer, et al., 2003). Ringstaff and
Yocam (1994) noted that professional development that focuses on learning about
computers rather than learning how to integrate computers into the curriculum is
inadequate. Redesigning current professional development may help reduce some of the
barriers experienced during the implementation (Smith and Robinson, 2003). According
to Hurst (1994), if classroom teachers are to use technology effectively in their
classrooms, these educators must be provided with adequate training.
Therefore, if teachers are going to embrace technology and integrate it into the
elementary curriculum, they need meaningful professional development. Professional
development sessions in integrating technology into the elementary classroom will more
effectively enable the teachers to know what technology can do to support and enhance
their teaching strategies (Mouza, 2002/2003). Clearly, the teacher is the most important
ingredient for success in schools using technology (Mandell, Sorge, & Russell, 2002).
This study explored the perceptions of elementary certificated staff members
about their roles and responsibilities for integrating technology and the impact of
professional development in teacher integration of technology on student success. The
findings of this study add some insight in how technology influences student success.
125
Overview of Study
The purpose of this mixed method comparative study was to investigate the use
and integration of technology into the elementary curriculum and to explore the influence
of technology on student success. This study focused on teachers’ perception of their
knowledge and skills and their professional development experiences as they integrate
technology into the curriculum for two urban elementary schools in a mid-western state.
Data were generated from a survey questionnaire, interviews with individual teachers and
focus group interviews consisting of administrators and department heads.
Research Questions
The overarching question guiding this mixed method comparative study is: Does
the use of technology influence student success in elementary classrooms? The following
research questions were examined during the completion of this study:
1. What are the teachers’ perceptions of their roles and responsibilities for
integrating technology in the classroom?
2. What are the teachers’ perceptions of the influence of technology on student
success?
3. What types of professional development activities related to integrating
technology in elementary classrooms have been conducted?
Limitations
One school in this study was selected because of the technological interventions
present in that school, and the other school was selected because of geographic proximity
and demographic similarity with the technology school. This study utilized self-reporting
126
data. Findings of the study are based on the perception data of teachers and the
assumption that teachers will respond honestly and interpret the instrument as intended.
Null Hypotheses
The following hypotheses were tested in this study:
HO1: There are no significant differences between teachers’ perception about their
roles and responsibilities in the use of technology in one elementary school
(technology school) that has an intensive technology program (eMINTS) and
another elementary school (non-technology school) that does not have an
intensive technology program for the following subgroups of teachers within the
two schools:
a) teachers in grades K-3 of both schools
b) teachers in the non-technology school grades 1-3 and Non-eMINTS
teachers in the technology school K-6
c) teachers in the non-technology school grades 1-3 and teachers in the
eMINTS program grades 3-6
d) teachers in the technology school grades 3-6 that were eMINTS teachers
and teachers in the same school grades K-6 that were not eMINTS
teachers.
HO2: There are no significant differences in teachers’ perception of technology
influence on student success in one elementary school (technology school) that
has an intensive technology program (eMINTS) and another elementary school
(non-technology school) that does not have an intensive technology program for
the following subgroups of teachers within the two schools:
127
a) teachers in grades K-3 of both schools
b) teachers in the non-technology school grades 1-3 and Non-eMINTS
teachers in the technology school K-6
c) teachers in the non-technology school grades 1-3 and teachers in the
eMINTS program grades 3-6
d) teachers in the technology school grades 3-6 that were eMINTS teachers
and teachers in the same school grades K-6 that were not eMINTS
teachers.
HO3: There are no significant differences in the type of professional development
activities related to integrating of technology in one elementary school
(technology school) that has an intensive technology program (eMINTS) and
another elementary school (non-technology school) that does not have an
intensive technology program for the following subgroups of teachers within the
two schools:
a) teachers in grades K-3 of both schools
b) teachers in the non-technology school grades 1-3 and Non-eMINTS
teachers in the technology school K-6
c) teachers in the non-technology school grades 1-3 and teachers in the
eMINTS program grades 3-6
d) teachers in the technology school grades 3-6 that were eMINTS teachers
and teachers in the same school grades K-6 that were not eMINTS
teachers.
128
Summary of Findings
Given the nature and focus of this investigation and research questions, a mixed
method comparative design of both quantitative and qualitative research was conducted
to more fully understand how technology is used in elementary classrooms. Data were
generated from a survey questionnaire, interviews with individual teachers, and focus
group interviews consisting of administrators and department heads. Triangulation of
data (survey questionnaire, individual interviews, and focus group interviews) provided
consistent evidence and increased the validity of the findings.
Significant quantitative data findings for each hypothesis (HO1, HO2, and HO3)
by subgroups of teachers within both schools are presented. The subgroups of teachers
included (a) teachers in the non-technology school in grades 1- 3, (b) teachers in the
technology school with both technology and non-technology classrooms in grades 1-3,
(c) teachers in the technology school who were not in technology classrooms grades K-6,
and (d) teachers in the technology school who were in technology classrooms grades 3-6.
The first grouping of teachers from both schools included (a) teachers in the non-
technology school in grades 1- 3 versus (b) teachers in the technology school with both
technology and non-technology classrooms in grades 1-3. Data from Table 14 revealed
that teachers in the non-technology school grades 1-3 had stronger views in ideology and
training than did the teachers in the technology school grades 1-3. The teachers in the
non-technology school in grades 1-3 were willing to attend more computer training on
their own time and staff development in technology was strongly encouraged. Teachers
from the technology school grades 1-3 felt they had more technical support than those
teachers in the non-technology school grades 1-3.
129
The next grouping of teachers consisted of (a) teachers in the non-technology
school in grades 1- 3 versus (c) teachers in the technology school who were not in
technology classrooms grades K-6. The area of differences was noticed in the Reality
section. Teachers in the non-technology school in grades 1-3 felt more external pressure
to use technology in the classroom, and they felt more competent using technology in the
classroom than the teachers from the technology school who were not in technology
classrooms in grades K-6. However, the K-6 teachers in the technology who were not in
technology classrooms felt they had more resources and technical support available to
them than did the teachers at the non-technology school.
The third group of teachers that was studied included (a) teachers in the non-
technology school in grades 1- 3 versus (d) teachers in the technology school who were
in technology classrooms grades 3-6. Differences in the Reality section were noted
between the groups of teachers. Teachers in the non-technology school in grades 1-3 felt
more external pressure to use technology in the classroom than the teachers in the
technology school who were in technology classrooms in grades 3-6. However, teachers
in the technology school who were in technology classrooms in grades 3-6 felt more
competent using technology and had greater resources and technical support available
than those teachers at the non-technology school in grades 1-3.
The last group of teachers that was compared included (d) teachers in the
technology school who were in technology classrooms grades 3-6 versus (c) teachers in
the technology school who were not in technology classrooms grades K-6. Many
significant differences were found between these groups of teachers at the technology
school. External pressure was stronger for teachers who were not in technology
130
classrooms in grades K-6. Data on roles and responsibilities from teachers who were in
technology classrooms in grades 3-6 revealed a greater ideology of using technology in
the classrooms, a greater competence level, and more resources were available than did
the teachers who were not in technology classrooms in grades K-6. Technology influence
on learning data identified a greater influence in technology classrooms. The items that
were significant included (1) computers engage students in the learning process, (2)
computers have led to gains in student achievement, and (3) technology adds creativity
and enthusiasm to lessons. Training data identified teachers in technology classrooms in
grades 3-6 had stronger views relating to training than did those teachers who were not in
technology classrooms in grades K-6. Items that were significantly greater were (1)
inservice training for technology is conducted regularly and (2) staff development in
technology is encouraged.
The quantitative data findings rejected all three hypotheses. The data from this
exploratory study supports the eMINTS program with the increased ideology,
competence, resources, learning, and training views from teachers in the technology
school who were in technology classrooms in grades 3-6.
Major themes and subthemes emerging from the qualitative data were noted and
analyzed. The three major themes that appeared to be fundamental to the use and
integration of technology in the classroom and the influence on student success include
(a) barriers to technology integration, (b) importance of technology training, and (c)
learning environment. Seven subthemes emerged from the factors and variables that
influenced these major themes.
131
In the next section, the discussion of findings from this exploratory study is
examined through the learning lens. Morgan (1997) described the learning lens
framework as a metaphor. Learning organizations focus on how organizations learn, what
organizations learn, and what limits learning. Double loop learning and tacit versus
explicit knowledge are characteristics of learning organizations. The learning lens
provides insight into the influence technology has on student success and provides the
interaction of the quantitative and qualitative data findings.
Discussion of Findings
The overarching question guiding this mixed method comparative study is: Does
the use of technology influence student success in elementary classrooms? Each research
question is discussed in light of the quantitative and qualitative findings to form the basis
for the discussion. The first section provides data from this investigation to answer
research question 1: What are the teachers’ perceptions of their roles and responsibilities
for integrating technology in the classroom?
Research Question 1
Through the quantitative data analysis, hypothesis one was tested. The use of a t-
test was conducted to determine if there was a statistical difference in the perceptions of
teachers in the use and integration of technology and the influence on student success.
The belief statements revealed a significance difference in the cluster of ideology with all
teachers in grades 1-3 from both schools (p: .042) and between the Non-eMINTS
teachers and eMINTS teachers at the technology school (p:.001). These findings support
the notion that perceptions of the classroom teacher strongly affect the level of
technology integration in the classroom and the literature according to Eachus and
132
Cassidy (1999), which reported that self-efficacy has been the major factor in
understanding the success with which individuals use computers.
Reality statements of external pressure, competence, resources, and technical
support showed significant differences between the subgroups of teachers within the two
elementary schools. Data suggest that the teachers’ perception vary between the two
elementary schools in the ideology cluster and reality clusters.
Data from interviews suggest that the participants from both schools expressed
concerns with the various barriers to technology integration. These barriers centered on
time, resources, and technical support issues. Interview findings discussing time,
resources, and technical support corroborate various pieces of literature (Hruskocy, et al,
2000; Ertmer, et al, 2003). “There is not enough time in the day” (JS). “The lack of
exposure is a challenge” (AM). “My computer keeps messing up so I haven’t been able to
use it” (BS). Norris, Sullivan, Poirot, and Soloway (2003) reported that teachers’ use of
technology is dependent upon their access to technology. If the opportunity to access
technology is limited, use and integration of technology will be minimal.
The research revealed that teachers’ roles and responsibilities for using and
integrating technology in the classroom to influence student success may be associated
with teachers’ ideology, level of technology training, and the amount of barriers that
existed.
Through the interviews at both schools, certificated staff members indicated that
they are experiencing some of the same barriers in integrating technology into their
classroom as indicated in the literature (Etmer, et al, 1999). For example, most
133
participants reported that time was a barrier; although, the time barrier apparently became
less of a barrier as the staff member became more trained and skilled in technology.
Many teachers are overwhelmed by the amount of additional hours after school
needed to learn how to use and integrate technology in their classrooms. Mann and
Shafer (1997) reported teachers spend more of their own time learning how to use and
integrate technology than in training sessions provided. Whelan, et. al., (1997) also
reported time as the biggest obstacle for teachers.
Therefore, more time during the school day must be made available to teachers.
Creative scheduling and increased opportunities for teachers to use and integrate
technology in the classrooms will provide for a greater influence on student success.
The preceding section reported findings of this study as they relate to the first
research question. The following section provides an analysis of the findings to answer
research question 2: What are the teachers’ perceptions of the influence of technology on
student success?
Research Question 2
The second research question asked what are the teachers’ perceptions of the
influence of technology on student success. The means and test of differences on the
learning cluster revealed a significant difference with only one subgroup of teachers,
eMINTS teachers in the technology school grades 3-6 and Non-eMINTS teachers in
grades K-6 in the same school, at a .000 significance level. Analysis of the perception of
teachers regarding student success supports the eMINTS literature. Teachers in
technology classroom believe computers engage students in the learning process,

134
computers have led to gains in student achievement, and technology adds creativity and
enthusiasm to the lessons.
With unlimited resources at learners’ fingertips via the Internet, participants
expressed how technology enhances and enriches the curriculum. Students are able to
participate in interactive and virtual learning opportunities to enrich the curriculum.
Utilizing these resources provides students an avenue to broaden their learning horizon
by enabling students to see and do outside of the classroom. Murphy and Thuente (1995)
echo the participants’ perceptions that technology in pre-kindergarten through third-grade
can expand and enhance learning.
Qualitative data revealed that participants perceive the learning environment to
impact student success. Two subthemes that emerged from the interviews include
enhancement of curriculum and effect on students. This primary theme along with the
two subthemes supports the quantitative findings for hypothesis two in regards to the
influence of technology on student success.
Interview data suggested technology positively impacts student learning. Teachers
perceive students to be motivated and excited to use computers. Alden (2003) reported
teachers are finding students more eager to sit down and concentrate on lessons using a
computer than those using traditional methods. Mann and Shafer (1997) and Missouri
Department of Elementary and Secondary Education (2002) noted utilizing computers in
the classroom broadens students’ experiences while enhancing learning. Using the
eMINTS model of inquiry-based learning, teachers use technology to engage students in
their learning. Students explore ideas, engage in projects of choice, work collaboratively,
135
and gain conceptual understanding of the topic at hand. “Technology lets children
explore more than they are now” (LW).
Teachers perceived student learning benefits include motivation, enthusiasm,
engagement, interest in learning, and collaboration. Finally, teachers reported students are
eager to use technology in the classroom. Additionally, teachers believed technology
presented expanded learning opportunities and preparation for the future. Alden (2003)
noted that using computers enhances and adds to a student’s learning experience and at
the same time enhances teaching capabilities. David (1994) stressed that technology can
serve as a vehicle for significantly changing what happens in the classroom and
diversifies how and what students learn.
Findings from this study support the notion that technology is a tool that
effectively supports student learning and collaboration. McCombs & Whistler (1997)
described practices that enhance learning, including tying learning both to prior learning
and to authentic tasks, knowing the individual needs of students and their unique
backgrounds, respecting diversity, and developing relationships. The importance of
collaboration in the learning process was noted in many publications (Bruffee, 1999; Paul
& Marfa, 2001; APA, 1997). In a collaborative learning process, students construct
knowledge socially.
Educators can structure students’ experiences to maximize learning. New learning
should be tied to prior knowledge (Flannery & Vanterpool, 1990; Nonaka & Takeuchi,
1995; APA , 1997) in order to facilitate the assimilation of new knowledge. Utilizing
technology and the Internet, unlimited resources are available to students while
enhancing their learning opportunities. Alden (2003) stated that with computers, students
136
have access to a new array of creativity tools, making it easier for them to express and
explore their creativity. Technology energizes teaching and brings learning to life.
Responses of the participants also support the literature in the influence of
technology on student success and the learning environment. Patton (2004) described the
influence technology has on students. “Students never want to miss school. It stretches
me and my students in all directions” (p. 51).
Knapp and Glenn (1996) claimed that studies have shown effective integration of
technology naturally leads to greater student collaboration and learning. Shade and
Watson (1990) stated that only where computers are integrated into the curriculum as a
vital element for instruction will students use computers as natural tools for learning.
This section provided data relevant to the second research question that guided
this exploratory study. The next section reports an analysis of findings to answer research
question 3: What types of professional development activities related to integrating
technology in elementary classrooms have been conducted?
Research Question 3
The last research question asked what types of professional development activities
related to integrating technology in elementary classrooms have been conducted. The
means and test of differences of the respondents in the two schools were conducted. Data
revealed a significant difference in the analysis of two subgroups of teachers.
The first subgroup consisted of all certificated teachers in grades 1-3 from both
schools with a significance level of .038. Data revealed that teachers in the non-
technology school grades 1-3 had stronger views in ideology, technical support, and
training than did the teachers in the technology school grades 1-3. The teachers in the
137
non-technology school in grades 1-3 were willing to attend more computer training on
their own time and staff development in technology was strongly encouraged.
The other subgroup of teachers included the eMINTS teachers in the technology
school grades 3-6 and the Non-eMINTS teachers grades K-6 of the same school with a
significant difference of .039. Training data identified teachers in technology classrooms
in grades 3-6 had stronger views relating to training than did those teachers who were not
in technology classrooms in grades K-6. Items that were significantly greater were (1)
inservice training for technology is conducted regularly and (2) staff development in
technology is encouraged.
Findings from this exploratory study suggest that current methods of technology
training appear to utilize the single loop process and do not appear to facilitate
technology integration into the learning process. Single-loop learning, designed to keep
the organization “on course,” is distinguished as the process of learning that rests in an
ability to detect and correct error in relation to a given set of operating norms (Hanson,
2001). Teachers from both elementary schools are taught how to use computers but are
not taught how to integrate the technology into their classrooms. For example, teachers
are often taught computer basics, software applications of Word, PowerPoint, and Excel,
and other administrative and management tasks including email, online attendance, and
grades. The expectation that follows these training sessions is that teachers will be able to
successfully integrate technology in their classrooms since they have been taught how to
do these basic computer tasks and know how to use a software application packages. This
expectation is an example of single loop learning.
138
Double loop learning exists when teachers look for innovative ways to use
technology in the classroom to enhance and enrich the curriculum and develop projects
that engage students in the learning process. Double-loop learning is distinguished as the
process of learning to learn and depends on being able to take a “double look” at the
situation by questioning the relevance of operating norms (Hanson, 2001). Teachers must
examine existing technology use assumptions and practices derived from those
assumptions regarding curriculum and technology’s role in presenting that curriculum to
determine what type of learning activities increase student learning.
In a similar fashion, teachers need engaging opportunities to learn how to
effectively integrate technology into the classrooms as opposed to simply attending
sessions on how to use computers and software programs. This view supports the
eMINTS design of providing extensive hours of professional development, interaction,
and collaboration for teachers to effectively integrate technology.
Technology training is critical to successful integration of technology in the
classrooms. Qualitative data that emerged from this study suggested that teachers are
willing to attend more training. Participants from both schools articulated that their
respective district focused on training the staff to use technology. “Everything we do is
on the computer” (SG). White, Ringstaff, and Kelley (2002) express the need for
organizations to spend more budget funds on training and technical assistance than
equipment. Through training and technical support essential curricular integration will
occur (Whelan, Frantz, Guerin, & Bienvenu, 1997).
Subthemes that supported this major theme included collaboration and type of
training. Participants in this study communicated their desire to share lessons and ideas
139
while working together to utilize technology. Teacher collaboration shortens the learning
curve for using and integrating technology (MacKenzie, 1999). “We collaborate on just
about everything on every subject” (FS). Clearly, the teacher is the most important
ingredient for success in schools using technology (Mandell, Sorge, & Russell, 2002).
This desire among teachers in this study to collaboratively share their technology
experiences and learn how to more effectively utilize technology suggested the presence
of at least a portion of Nonaka and Takeuchi’s knowledge creation spiral of tacit-explicit-
tacit knowledge (1995).
In this knowledge creation spiral, tacit knowledge, knowledge that has been
gained through experience and is not easily identified or verbalized, is made explicit and
shared with other organizational members, realigned with the information others bring to
the discussion topic, and then internalized again through four steps labeled socialization,
externalization, combination, and internalization (Nonaka & Takeuchi, 1995).
Organizational learning takes place during social interaction between group members
(Nonaka & Takeuchi; Gabrys, Weiner, & Lesgold, 1993).Collaboration and cooperative
learning tasks promote the social interaction that is the prerequisite of knowledge
construction (Bruffee, 1999). Learning is an active, participatory experience (APA); thus,
the most powerful learning comes from direct experience (Nonaka & Takeuchi, 1995).
Type of training, the second subtheme, includes mandatory versus voluntary
training, basics versus application training, and training within the district or outside of
the district. “The type of training varies with the expertise of the teacher and the time
they have been exposed to it” (NG). However, interview data suggest that integration
training is minimal. “I have to learn how to include technology in my daily lessons”
140
(LW). This notion of more integration training is supported through the literature (White,
Ringstaff, & Kelley, 2002; Albee, 2003; WestEd, 2002; Mouza 2002/2003).
Findings for this exploratory study suggest that another professional development
technique for integrating technology in the learning process that should be considered is
mentorship. Through mentoring, teachers can share lessons and ideas that will enhance
and enrich the curriculum. Utilizing the concept of mentoring for technology integration
also provides teachers an avenue to participate in the knowledge creation process and, in
turn, increase student success.
Figure 1 illustrates the relationship of the three primary themes, barriers,
technology training, and learning environment, which emerged from the analysis of this
study. Barriers to technology integration, which include time, resources, and technical
support, directly impact the technology training that takes place within the school. These
barriers also hinder the learning environment that includes the enhancement of
curriculum and the effect on students. Teachers must be given adequate time, resources,
and technical support to effectively integrate technology in the classrooms. With
increased technology training with a focus on collaboration and the type of training,
barriers to technology integration are reduced. The learning environment is influenced by
the technology training available to teachers.
Through the learning lens, knowledge must be tied to the experiences of the
learner as this knowledge moves from tacit to explicit and back again. Integrating
technology in the classroom utilizes knowledge creation components and clearly
influences student success.
141
Recommendations
Recommendations for Future Research
While the research findings of this study suggest a significant difference exists in
certificated staff members’ perception of their role and responsibility for integrating
technology, the influence of technology on student success, and the types of professional
development related to integrating technology, further quantitative and qualitative
investigations should be undertaken. This study suggests six areas for further exploration.
1. A similar study of the use and integration of technology into elementary
classrooms and the influence of technology on student success in other regions
should be conducted to determine if the results are similar or different from the
findings in this study.
2. A similar study of the use and integration of technology into elementary
classrooms and the influence of technology on student success in other eMINTS
schools should be conducted to determine if the results are similar or different
from the findings in this study.
3. A similar study of the use and integration of technology into elementary
classrooms and the influence of technology on student success in other Non-
eMINTS schools should be conducted to determine if the results are similar or
different from the findings in this study.
4. A similar study of the use and integration of technology into elementary
classrooms and the influence of technology on student success in elementary
schools with high socioeconomic status percentages should be conducted to
determine if the results are similar or different from the findings in this study.
142
5. A similar study of the use and integration of technology and the influence of
technology on student success in middle schools and high schools should be
conducted to determine if the results are similar or different from the findings in
this study.
6. A study investigating the benefits perceived by parents related to increased
technology use by their children in elementary schools should be conducted.
7. A study should be conducted to investigate the appropriate technology training
program for elementary schools.
Recommendations for Improving Educational Practice
The decision to study the use and integration of technology in elementary
classrooms and the influence of technology on student success reflected the researcher’s
personal experiences as a technology teacher and the director of data and technology,
strong support for integrating technology in education, and passion to utilize technology
as another instructional tool with elementary students. Designed to examine the use and
integration of technology in elementary classrooms for students in kindergarten through
sixth grade, this investigation was specifically geared to students in grades one through
three. Of particular importance were the objectives to determine the relationship of
professional development activities and the perceptions of certificated staff members on
technology.
Other recommendations for improving educational practice would include
investigating the use of technology in teacher preparation programs and mentorship.
Discovering how teacher preparation programs integrate technology and how teachers are
taught to use technology throughout these programs should impact educational practice.
143
The use of human capitol through mentorship by using eMINTS teachers as mentors for
Non-eMINTS teachers to integrate technology should enhance the use and integration of
technology in classrooms. The findings of this study imply that the successful integration
of technology in elementary classrooms and the influence on student success is
underscored by the importance of technology training, elimination of barriers, and
inquiry-based learning environment.
Recommendations for Professional Development
The findings of this study imply that more professional development activities on
how to effectively integrate technology in the classroom need to occur. Current methods
of technology training do not facilitate and focus on technology integration. Rather than
simply being taught how to use computers and various software applications, teachers
need to be taught how to use technology as a tool to support learning and enhance the
curriculum. When this approach to professional development for technology integration
is undertaken, learning with computers will occur and students will take a more active
and engaging role in their learning process (Keeler, 1996).
Along with the integration training, more training designed to meet teachers’
training needs and knowledge level should be conducted. Bitner and Bitner (2002)
discussed several areas that are essential for teachers to successfully integrate technology.
Some of these areas include training of basics, personal use, teaching models, and
learning styles. Technology training focusing on the training needs of teachers becomes
the catalyst for change in the classroom and provides another tool to support student
learning.
144
Inquiry-based learning is another area in which more teachers need to be trained.
This notion of inquiry-based learning has been successfully implemented in the eMINTS
program (eMINTS National Center, 2005). The inquiry-based approach emphasizes the
importance of students exploring ideas, engaging in projects, working collaboratively,
and gaining conceptual understanding of the topic.
145
References
Abbott, J. & Faris, S. (2000, Winter). Integrating technology into preservice literacy
instruction: A survey of elementary education students’ attitudes toward
computers. Journal of Research on Computing in Education, 33(2), 149, 13p.
Akbaba, S., & Kurubacak, G. (1998). Teachers’ attitudes towards technology. Computers
in Social Studies Journal [online series], 7(4). Available
www.webcom.com/journal/akbaba.html.
Albee, J. (2003). A study of preservice elementary teachers’ technology skill
preparedness and examples of how it can be increased. Journal of Technology
and Teacher Education, 11(1), 53-71.
Albion, P. & Ertmer, P. (2002, September/October). Beyond the foundations: The role of
vision and belief in teachers’ preparation for integration of technology.
TechTrends, 46(5), 34-8.
Alden, S.B. (2003, May). The role technology can play in preparing our children for the
21st century. Computer Learning, 23-25.
Alexander, P.A. & Murphy, P.K. (1998). The research base for APA’s learner-centered
psychological principles. In N.A. Lambert & B.L. McCombs. (Eds.), How
students learn: Reforming schools through learner-centered education (p. 25 –
60). Washington, DC: American Psychological Association.
American Psychological Association. (1997, November). Learner-centered psychological
principles: A framework for school redesign and reform. Retrieved August 5, 2002, from http://www.apa.org/ed/lcp.html.
146
Anderson, M. (1998). Ongoing staff development—sideways, bubbly, and chaotic!
Multimedia Schools, 5(1), 16-19.
Anderson, R., & Becker, J. (2001). School investments in instructional technology.
Teaching, Learning, and Computing Report, Report 8. Retrieved October 14,
2002, from: http://www.crito.uci.edu/tlc/findings/report_8/startpage.htm.
Apple Classrooms of Tomorrow. (1999). Apple learning professional development design
principles. In Apple Classrooms of Tomorrow (ACOT): 1999/2002.
Armstrong, G. (1996). One approach to motivating faculty to use multimedia.
Technological Horizons in Education Journal, 23(1), 69-71.
Bailey, G.D. & Pownell, D. (1998). Technology staff development and support programs:
Applying Abraham’s Maslow’s hierarchy of needs. Learning and Leading with
Technology, 26(3), 47-51.
Bandura, A. (1997). Self-efficacy: The exercise of control. New York: Freeman.
Barnett, H. & Nichols, C. (1994). Technology takes root. The Executive Educator, 16(5),
40-42.
Barron, A.E., Kemker, K., Harmes, C., & Kalaydjian, K. (2003). Large-scale research
study on teaching in k-12 schools: Technology integration as it relates to the
national technology standards. Journal of Research on Technology in Education,
35(4), 489-507.
Beaver, J. (1990). A profile of undergraduate educational technology (in)competence:
Are we preparing today’s education graduates for teaching in the 1990’s?
Research report. Buffalo, NY: SUNY at Buffalo.
147
Becker, H.J. (1992). Computer based integrated learning systems in the elementary and
middle grades: A critical review and synthesis of evaluation reports. Journal of
Educational Computing Research, 8(1), 1-41.
Becker, H. (1994). How exemplary computer-using teachers differ. Journal of Research
on Computing in Education, 26(3), 291-321.
Becker, H. (1994). Analysis and trends of school use of new information technologies.
United States Congress Office of Technology Assessment (contract #K3-0666.0).
Retrieved from the World Wide Web: http://www.gse.edu/EdTechUse/c-
tblcnt.htm.
Becker, H.J. (1999). Internet use by teachers: Conditions of professional use and
teacher-directed student use. Teaching, Learning, and Computing: 1998 National
Survey. Report #1.
Becker, H.J., Ravitz, J.L., & Wong, Y.T. (1999). Teacher and teacher-directed student
use of computers and software. Irvine, CA: Center for Research and Information
Technology and Organizations, University of California, Irvine & University of
Minnesota.
Becker, H.J. & Riel, M. (2000). Teacher professional engagement and constructivist-
compatible computer use. National Science Foundation and U.S. Department of
Education Research Project, Grant#REC-9600614.
Berends, M. (2004). In the wake of a nation at risk: New American schools’ private
sector school reform initiative. Peabody Journal of Education, 79(1), 130-63.
Beyerbach, B., Walsh, C., & Vannatta, R. (2001). From teaching technology to using
technology to enhance student learning: Preservice teachers’ changing
148
perceptions of technology infusion. Journal of Technology and Teacher
Education, 9(1), 105-27.
Bialo, E.R. & Sivin-Kachala, J. (1996). The effectiveness of technology in schools: A
summary of recent research. Washington, DC: Software Publishers Association.
Bitter, G. (1983). A scope and sequence curriculum (k-12) for computer literacy.
Presented at the Symposium on Computer Literacy, Baltimore, MD. (ERIC
Document Reproduction Service No. 235 792).
Bitner, N. & Bitner, J. (2002). Integrating technology into the classroom: Eight keys to
success. Journal of technology and teacher education, 10(1), 95-100.
Bogdan, R. C. & Biklen, S. K. (1998). Qualitative research for education: An
introduction to theory and methods (3rd edition). Boston: Allyn and Bacon.
Boone, W. (2001). A qualitative evaluation of utilizing dynamic quad screen technology
for elementary and middle school teacher preparation. Journal of Technology and
Teacher Education, 9(1), 129-45.
Bracey, G.W. (1997). A nation of learners: Nostalgia and amnesia. Educational
Leadership, 54, 54-57.
Brooks, D., & Kopp, T. (1989). Technology in teacher education. Journal of Teacher
Education, 40, 2-7.
Brown, D.M. (2003). Learner-centered conditions that ensure students success in
learning. Education, 124(1), 99-104.
Bruffee, K.A. (1999). Collaborative learning: Higher education, interdependence, and
the authority of knowledge (2nd Ed.). Baltimore: The John Hopkins University Press.
149
Brush, Thomas. (2003). Preparing tomorrow’s teachers to use technology (PT3).
Educational Technology Research and Development, 51(1), 39-128.
Cavanaugh, C. (2003). Information age teacher education: Educational collaboration to
prepare teachers for today’s students. TechTrends, 47(2), 24-27.
Charp, S. (1996). Curriculum integration. Technological Horizons in Education Journal,
23(10), 4.
Charp, S. (2003, March). Technology integration in teaching and learning. T.H.E.
Journal, 30(8), 8.
Cohen, V.L. (2001). Learning styles and technology in a ninth-grade high school
population. Journal of Research on Computing in Education, 33(4), 355-367.
Colbaugh, N. (2001). The development of leadership capacity within a school undergoing
comprehensive school reform. Doctoral dissertation, University of Missouri –
Columbia.
Cole, Shannon (2000). Technology has found its way into our schools—now what?
TechTrends, 44(6), 23-27.
Coley, R., Cradler, J., & Engel, P.K. (1997). Computers and classrooms: The status of
technology in U.S. schools. Policy information report. Princeton, NJ: Educational
Testing Service.
Congress of the United States Congressional Budget Office (1987). Educational
achievement: Explanations and implications of recent trends. Washington, DC:
Congressional Budget Office.
Creswell, J. W. (1994). Research design: Qualitative and quantitative approaches.
Thousand Oaks, CA: Sage.
150
Cuban, L. (1993). Computers meet classroom: Classroom wins. Teachers College
Record, 95(2), 185-210.
Cuban, L. (2001). Oversold and underused: Computers in the classroom. Cambridge,
MA: Harvard University Press.
Darling-Hammond L. & Wise, A. (1985). Beyond standardization: State standards and
school improvement. The Elementary School Journal, 85, 315-36.
David, J.L. (1994). Realizing the promise of technology: A policy perspective.
Technology and Education Reform, 169-189.
Desimone, L.M., Porter, A.C., Garet, M.S., Yoon, K.S., & Birman, B.F. (2002). Effects of
professional development on teachers’ instruction: Results from a three-year
longitudinal study. Educational Evaluation & Policy Analysis, 24(2), 81-112.
Dexter, S.L., Anderson, R.E., & Becker, H.J. (1999). Teachers’ views of computers as
catalysts for changes in their teaching practice. Journal of Research on
Computing in Education, 31, 221-238.
Dias, L.B. (1999). Integrating technology. Learning and Leading with Technology, 27(3),
10-13.
Dockstader, J. (1999). Teachers of the 21st century know the what, why, and how of
technology integration. T.H.E. Journal, 26(6), 73-74.
Doersch, D. (2002, November). Put me in coach! Learning and leading with technology,
30(3), 46-9.
Donaldson, A. (2001). Biology exploration through technology: Taking the leap from
theory to practice. Tech Trends, 45(5), 27-34.
151
Dugger, W.E. (1999). Putting technology education standards into practice. NASSP
Bulletin, 83(608), 57-63.
Dugger, W.E, Meade, S.D., Delany, L., & Nichols, C. (2003). Advancing excellence in
technological literacy. Phi Delta Kappan, 85(4), 316-320.
Dwyer, D. (1996b). A response to Douglas Noble: We’re in this together. Educational
Leadership, 54(3), 24-26.
Eachus, P. & Cassidy, S. (1999, February). Developing the computer self-efficacy (CSE)
scale: Investigating the relationship between CSE, gender, and experience with
computers. University of Salford, United Kingdom, 1-10. Available online at
http://www.salford.ac.uk/healthSci/selfeff/selfeff.htm.
eMINTS Evaluation Project (2004, May). Analysis of 2003 MAP results for eMINTS
students. Policy Brief #4 [online document].
http://www.emints.org/evaluation/reports/map2003.pdf.
eMINTS Evaluation Project (2005, January). Analysis of 2004 MAP results for eMINTS
students. Policy Brief #5 [online document].
http://www.emints.org/evaluation/reports/map2004.pdf.
eMINTS National Center (2005, January). What is the eMINTS national center? [online
document]. http://www.emints.org.
Ertmer, P., Addison, P., Lane, M., Ross, E., & Woods, D. (1999, Fall). Examining
teachers’ beliefs about the role of technology in the elementary classroom.
Journal of Research on Computing in Education, 32(1), 54, 19p.
152
Ertmer, P.A., Conklin, D., Lewandowski, J., Osika, E., Selo, M., & Wignall, E. (2003,
Winter). Increasing preservice teachers capacity for technology integration
through the use of electronic models. Teacher Education Quarterly, 30(1), 95-112.
Falba, C., Grove, K, Anderson, D. & Putney, L (2001, Summer). Benefits of laptop
computers for elementary teachers. Journal of Research on Technology in
Education, 33(5). [online document] http://206.58.233.20/jrte/33/5/falba.html.
Flannery, B. & Vanterpool, M. (1990). A model for infusing cultural diversity concepts
across the curriculum. In L. Hilsoni (Ed.), To improve the academy: Resources for student, faculty, & institutional development. The professional and organizational development network in higher education (pp. 159-175). Stillwater, OK: New Forums.
Fullan, M. (1991). The new meaning of educational change. New York: Teachers College
Press.
Fulton, K. (1997). Learning in a digital age: Insights into the issues: The skills students
need for technological fluency. [online document]. Available:
http://www.jff.org/pubs/ME164.pdf.
Gabrys, G., Weiner, A., & Lesgold, A. (1993). Learning by problem solving in a coached
apprenticeship system. In M. Rabinowitz (Ed.), Cognitive science foundations of instruction (pp.119-148). Hillsdale, NJ: Lawrence Erlbaum.
Gilmore, A.M. (1995). Turning teachers on to computers: Evaluation of a teacher
development program. Journal of Research on Computing in Education, 27, 251-
269.
153
Goals 2000: Educate America. (1994). [online document]
http://www.ed.gov/legislation/GOALS2000/TheAct/index.html.
Gruenert, S.W. (1998). Development of a school culture survey. Doctoral dissertation,
University of Missouri – Columbia.
Hadley, M. & Sheingold, K. (1993). Commonalities and distinctive patterns in teachers’
integration of computers. American Journal of Education, 101, 261-315.
Hannafin, R.D. & Savenye, W.C. (1993). Technology in the classroom: The teachers new
role and resistance to it. Educational Technology, 33(6), 26-31.
Hanson, M. (December 2001). Institutional theory and educational change. Educational
Administration Quarterly 37(5), 637-661.
Harvey, J. & Purnell, S. (1995). Technology and teacher professional development.
Department of Education, Washington, DC.
Hignite, M.A. & Echternacht, L.J. (1992). Assessment of the relationships between the
computer attitudes and computer literacy of prospective educators. Journal of
Research on Computers in Education, 24, 381-389.
Hoepfl, M. C. (1997). Choosing qualitative research: A primer for technology education
researchers. Journal of Technology Education, 9(1). Retrieved July 20, 2002,
from http://scholar.lib.vt.edu/ejournals/JTE/v9n1/hoepfl.htm.
Hornung, C. S. & Bronack, S. (2000). Preparing technology-based teachers. TechTrends,
44(4), 17-20.
Hruskocy, C. (1999). Students trainers as resource technologists (Project START): A
study of classroom interactions and use of student trainers. Unpublished doctoral
dissertation, Purdue University, West Lafayette, IN.
154
Hruskocy, C., Cennamo, K., Ertmer, P., & Johnson, T. (2000). Creating a community of
technology users: Students become technology experts for teachers and peers.
Journal of Technology and Teacher Education, 8(1), 69-84.
Hurst, D. (1994). Teaching technology to teachers. Educational Leadership, 51(7), 74-77.
Hurteau, J. (1990). Perceived needs of computer training for educators in New York
State. Unpublished master’s thesis, State University of New York College at
Oswego, NY.
Jacobsen, D.M. (2001). Building different bridges: Technology integration, engaged
student learning and new approaches to professional development. Paper
presented at AERA 2001: What We Know and How We Know It. Seattle, WA:
American Educational Research Association. Retrieved October 3, 2004, from:
http://www.ucalgary.ca/~dmjacobs/aera/building_bridges.html.
Jacobsen, D.M. & Lock, J.V. (2004). Technology and teacher education for a knowledge
era: Mentoring for student futures, not our past. Journal of Technology and
Teacher Education, 12(1), 75-100.
Johnson, D.W., Johnson, R.T., & Smith, K.A. (1991). Cooperative learning: Increasing
college faculty instructional productivity. ASHE-ERIC Higher Education Report
No. 4, George Washington University, 1991.
Kagan, D.M. (1992). Implications of research on teacher belief. Educational
Psychologist, 27(1), 65-90.
Karene, N., Grabinger, R.S., & Duffield, J.A. (1999). Healing the universe is an inside
job: Teachers’ views on integrating technology. Journal of Technology and
Teacher Education, 7(3), 187-203.
155
Keeler, Carolyn (1996, Spring). Networked instructional computers in the elementary
classroom and their effect on the learning environment: A qualitative evaluation.
Journal of Research on Computing in Education, 28, 329-45.
Keith, S. & Girling, R.H. (1991). Education, management, and participation: New
directions in educational administration. Needham Heights, MA: Allyn & Bacon.
Kleiman, G. (2004). Does technology enhance inquiry-based learning? CoSN: The
Consortium for School Networking [online document].
http://www.cosn.org/resources/edc/vol_1.cfm.
Knapp, L.R. & Glenn, A.D. (1996). Restructuring schools with technology. Needham
Heights, MA: Allyn & Bacon.
Knezek, G. & Christensen, R. (2002). Impact of new information technologies on
teachers and students. Education and Information Technologies, 7(4), 369-376.
Kopp, O. W., & Ferguson, K. E. (1996). Teacher training: Helping to construct the
information highway. Technological Horizons in Education Journal, 23(10), 80-
82.
Lieberman, A. (1995). Practices that support teacher development. Phi Delta Kappan,
76(8), 591-596.
MacKenzie, J. (1999). How teachers learn technology best. Bellingham, WA: FNO
Press.
Mandell, S., Sorge, D., & Russell, J. (2002, September/October). TIPS for technology
integration. TechTrends, 46(5), 39-45.
Mann, D. & Shafer, E. (1997). Technology and achievement. The American School
Board Journal, 184(7), 22-23.
156
Marcinkiewicz, H.R. (1993-1994). Computers and teachers: Factors influencing
computer use in the classroom. Journal of Research on Computing in Education,
26(2), 220-237.
McCannon, M. & Crews, T. (2000). Assessing the technology training needs of
elementary school teachers. Journal of Technology and Teacher Education, 8(2),
111-121.
McCombs, B.L. (2000). Reducing the achievement gap. Society, 37(5), 29-36.
McCombs, J. (2003, March). Ready, set, integrate! Learning and leading with
technology, 30(6), 54-8.
McCombs, B.L. & Whisler, J.S. (1997). What is “learner centered”? In The learner
centered classroom and school: Strategies for increasing student motivation and achievement (pp. 1-35). San Francisco: Jossey-Bass.
Miller, S.E. (2001, March). Technology: What’s it good for. Learning & Leading with
Technology, 28(6), 42-45.
Mills, S. & Tincher, R. (2003, Spring). Be the technology: A developmental model for
evaluating technology integration. Journal of Research on Technology in
Education, 35(3), 382-401.
Missouri Department of Elementary and Secondary Education (2000). Meeting the
challenge [online document].
http://dese.state.mo.us/stateboard/challengeintro.html.
Missouri Department of Elementary and Secondary Education, (2002, February). High-
tech classrooms produce higher test scores and other benefits, state study show
[online document]. http://dese.state.mo.us/news/2002/emints.htm.
157
Missouri Department of Elementary and Secondary Education, (2002, April). No child
left behind [online document]. www.dese.state.mo.us/divimprove/fedprog.
Missouri Department of Elementary and Secondary Education, (2003). Questions and
answers about no child left behind—and what it means for Missouri [online
document]. http://dese.mo.gov/divimprove/nclb/QandA.html.
Missouri Department of Elementary and Secondary Education. (2004). Mission,
mandates, and regulations for professional development. [online document].
www.dese.state.mo.us/divimprove/pd.
Missouri Department of Elementary and Secondary Education. (2004). Questions and
answers about no child left behind. [online document].
http://dese.mo.gov/divimprove/nclb/QandA.html.
Mitchem, K., Wells, D.L., & Wells, J.G. (2003). Effective integration of instructional
technologies (IT): Evaluating professional development and instructional change.
Journal of Technology and Teacher Education, 11(3), 397-414.
Moersch, C. (1995). Levels of technology implementation (LoTi): A framework for
measuring classroom technology use. Learning and Leading with Technology,
23(3), 40-42.
Morgan, G. (1997). Images of organization (2nd ed.). Thousand Oaks, CA: Sage.
Morrison, G. & Lowther, D. (2002). Integrating computer technology into the classroom.
New Jersey: Merrill Prentice Hall.
Morrow, L., Barnhart, S., & Rooyakkers, D. (2002, November). Integrating technology
with the teaching of an early literacy course. The Reading Teacher, 56(3), 218-
30.
158
Moursund, D. & Bielefeldt, T. (1999). Will new teachers be prepared to teach in a digital
age? A national survey on information technology in teacher education. Research
report by International Society for Technology in Education, Publication of
Milken Exchange on Education Technology.
Mouza, C (2002/2003, Winter) Learning to teach with new technology: Implications for
professional development. Journal of Research on Technology in Education 35(2),
272-289.
Murphy, V. & Thuente, K. (1995). Using technology in early learning classrooms.
Learning and Leading with Technology, 22(8), 17-20.
National Center for Education Statistics (2000). Public school teachers’ use of computers
and the internet. Washington DC: U.S. Department of Education.
National Center for Educational Statistics. (2001). Internet access in U.S. public schools
and classrooms 1994-2000 [Online]. Washington, DC: Author.
National Commission on Excellence in Education (1983). A nation at risk: The
imperative for educational reform. Washington, DC: U.S. Government Printing
Office.
National educational technology standards for students (2000). Eugene, OR: ISTE.
National educational technology standards for teachers (2000). Eugene, OR: ISTE.
NetDay (2001). The internet, technology, and teachers: Survey results [Online]. Irvine,
CA: Author. Available.
Nisan-Nelson, P.D. (2001). Technology integration: A case of professional development.
Journal of Technology and Teacher Education, 9(1), 83-103.
No Child Left Behind Act, Pub. L. No. 107-110, 115 Stat. 1425 (2002).
159
Nonaka, I. & Takeuchi, H. (1995). The knowledge-creating company. New York: Oxford University Press. Norris, C., Sullivan, T., Poirot, J., & Soloway, E. (2003). No access, no use, no impact:
Snapshot surveys of educational technology in k-12. Journal of Research on
Technology in Education, ISTE, 36(1), 15-28.
Novak, D.I. & Knowles, J.G. (1991). Beginning elementary teachers’ use of computers in
classroom instruction. Action in Teacher Education, 23(2), 43-51.
Nystrand, R.O. (1992). The new agenda for the nation’s schools. Education and Urban
Society, 25(1), 18-29.
Office of Educational Research and Improvement (1993). Using technology to support
education reform. Washington, DC: U.S. Government Printing Office.
Office of Educational Technology (OET), (2003, September). [Online document].
http://www.ed.gov/about/offices/list/os/technology/index.html.
Page, Michael (2002, Summer). Technology-enriched classrooms: Effects on students of
low socioeconomic status. Journal of Research on Technology in Education,
34(4), 389-409.
Pajares, M.F. (1992). Teachers’ beliefs and educational research: Cleaning up a messy
construct. Review of Educational Research, 62(3), 307-332.
Patton, C. (2004, June). High tech high payoff. District Administration, 47-51.
Paul, J.L., & Marfo, K., (Winter 2001). Preparation of educational researchers in
philosophical foundations of inquiry. Review of Educational Research 71 (4),
525-547.
160
Persichitte, K., Tharp, D., & Caffarella, E. (1997). The use of technology by schools,
colleges, and departments of education 1996. Washington, DC. American
Association of Colleges for Teacher Education.
Pierson, Melissa (2001, Summer). Technology integration practice as a function of
pedagogical expertise. Journal of Research on Computing in Education, 33(4),
413-30.
Pierson, M. & McNeil, S. (2000). Preservice technology integration through
collaborative action communities. Contemporary Issues in Technology and
Teacher Education, 1(1), 189-199.
President’s Committee of Advisors on Science and Technology, Panel on Technology
(March, 1997). Report to the president on the use of technology to strengthen k-12
education in the United States. Washington, DC. Executive Office of the
President.
Ringstaff, C. & Yocam, K. (1994, April). Integrating technology into classroom
instruction: Creating alternative context for teacher learning. Paper presented at
the meeting of the American Educational Research, New Orleans.
Roblyer, M.D. (1994). Creating technology using teachers: A model for preservice
technology training. Report of a Florida DOE-funded project, Tallahassee, FL.
Roblyer, M.D. (2000). The national educational technology standards (NETS): A review
of definitions, implications, and strategies for integrating NETS into k-12
curriculum. International Journal of Instructional Media, 27(2), 133-146.
Rogers, P. (1999). Barriers to adopting emerging technologies in education. Research
summary, Minnesota State Colleges and Universities System.
161
Rosen, L.D. & Weil, M.M. (1995). Computer availability, computer experience, and
technophobia among public school teachers. Computers in Human Behavior, 11,
9-31.
Rothstein, R. (1998). The way we were? The myths and realities of America’s student
achievement. New York: The Century Foundation Press.
Rushkoff, D. (1996). Playing the future: How kids’ culture can teach us to thrive in an
age of chaos. New York: Harper Collins.
Sandholtz, J., Ringstaff, C., & Dwyer, D. (1997). Teaching with technology: Creating
student-centered classrooms. New York: Teachers College Press.
Schmeltzer, T. (1995). Adding another piece to the staff development puzzle: Some
products and services you should know about. Technology and Learning, 16(1),
56-60.
Schroeder, K. (1999). Computers in schools. The Education Digest, 64(8), 76-77.
Schrum, L. (1999). Technology professional development for teachers. Educational
Technology Research and Development, 47(4), 83-90.
Shade, D.D. & Watson, J.A. (1990). Computers in early education: Issues put to rest,
theoretical links to sound practice, and the potential contribution of microworlds.
Journal of Educational Computing Research, 6(4), 92-104.
Shields, C. (2003, August). Are we there yet? Technology across the curriculum holds
promise, but payoff has been elusive. District Administration, 26-28.
Simms, R.L. & Knezek, G.A. (2001-2002). Using a technology-enriched environment to
improve higher-order thinking skills. Journal of Research on Technology in
Education, 34(2), 109-119.
162
Slavit, D., Sawyer, R., & Curley, J. (2003). Filling your plate: A professional
development model for teaching with technology. TechTrends, 47(4), 35-38.
Smith, S & Robinson, S. (2003, May/June) Technology integration through collaborative
cohorts. Remedial and Special Education, 24(3), 154-60.
Sprague, D., Kopfman, K., & Dorsey, S. (1998). Faculty development in the integration
of technology in teacher education courses. Journal of Computing in Teacher
Education, 2(14), 24-28.
Stellwagen, Joel (1999, Winter). Technology and action research: How effective are
classroom computer minilabs? American Secondary Education, 28(2), 3-9.
Stuhlman, J. (1998). A model for infusing technology into teacher training programs.
Journal of Technology and Teacher Education, 6(2/3), 125-139.
The Merriam-Webster Dictionary. (1997). Springfield, MA: Meriam-Webster, Inc.
Thurston, C. & Levin, J.A. (1996). Research summary: Educational electronic networks.
Educational Leadership, 54(3), 46-50.
Todman, J. & Dick, G. (1993). Primary children and teachers’ attitudes to computers.
Computers in Education, 20(2), 199-203.
Trilling, B. & Hood P. (1999, May/June) Learning, technology, and education reform in
the knowledge age. Educational Technology, 25p.
U.S. Congress, Office of Technology Assessment. (1995). Teachers and technology:
Making the connection. Washington, DC: U.S. Government Printing Office.
U.S. Department of Education. (1996). Getting America’s students ready for the 21st
century: Meeting the technology literacy challenge. A report to the nation on
technology and education. Washington, DC: Author.
163
U.S. Department of Education, Office of the Under Secretary, Planning and Evaluation
Service. (2000). Does professional development change teaching practice?
Results from a three-year study. Washington, DC: Author.
U.S. Department of Education, Office of Educational Research and Improvement. (2000).
Teachers’ tools for the 21st century: A report on teachers’ use of technology.
(NCES 2000-102). Smerdon, Cronen, Lanahan, Anderson, Iannotti, and Angeles.
Washington, DC.
Wenglinsky, H. (1998). Does it compute? The relationship between educational
technology and student achievement in mathematics. Princeton, NJ: Policy
Information Center, Educational Testing Service.
WestEd (2002, August). Investing in technology: the learning return. Technology Policy
Brief, 1-4.
Whelan, C.S., Frantz, C., Guerin, F., & Bienvenu, S. (1997, Summer). A qualitative
evaluation of a statewide networking infrastructures in education project. Journal
of Research on Computing in Education, 29, 403-22.
White, N., Ringstaff, C., & Kelley, L. (2002). Getting the most from technology in
schools. Knowledge Brief of WestEd Publications.
Wiburg, K.M (1997). The dance of change: Integrating technology in classrooms.
Computers in the Schools, 13(1/2), 171-184.
Wilkes, D. (2000). A successful technology training program. Media & Methods, 37(2),
8.
164
Williams, C. (2000). Internet access in public schools: 1994-1999 (NCES 2000-086).
U.S. Department of Education. Washington, DC: National Center for Education
Statistics.
Winn, W. & Synder, D. (2001). Cognitive perspectives in psychology. In D. H. Jonassen
(Ed.), Handbook of Research for Educational Communications and Technology,
112-142. New York: Simon & Schuster Macmillan.
Wolosoff, R. (1998). Technology in the classroom: A local survey in New York. T.H.E.
Journal, 25(9), 51-53.
Woodrow, J.E. (1990). Locus of control and student teacher computer attitudes.
Computers in Education, 14(5), 421-432.
165
Appendix A – Letter to Building Administration
Connie M. Crane
766 Frenchman Bluff Road Troy, MO 63379 January 14, 2005
Dear Principals:
Enclosed are the technology survey questionnaires to be distributed to all certified staff teachers in your building. This is part of the “Impact of Technology on Elementary Classrooms and Teaching” dissertation study I am conducting as a requirement for the doctoral program at University of Missouri - Columbia. As previously mentioned to you, participation will require a very minor time commitment. This one-time survey should take teachers less than 20 minutes to complete. You can assure your staff that answers will remain confidential. Responses will be combined to provide descriptive statistics. Teachers should complete and return the survey in the self-addressed, stamped envelope at their earliest convenience. Complete surveys are due by January 21. Please help to ensure that the surveys are completed and returned in a timely manner, as gathering accurate and thorough data will be critical to the success of this study. Upon completion of this study, the school may request a complete report on these results. Your participation and support is greatly appreciated. If you have any questions, you may contact Dr. Jerry Valentine (my advisor) at 573-882-8221, the University of Missouri Institutional Review Board at 573-882-9585, or myself at work (636) 462-6098 ext. 164 or home (636) 528-5811. Sincerely, Connie M. Crane Enclosure: Survey questionnaire

166
Appendix B – Consent for Survey
I understand that Connie M. Crane, a doctoral student in the Educational
Leadership and Policy Analysis Program at the University of Missouri – Columbia, is
working on a study exploring the impact of technology on elementary classrooms and
teaching. The survey containing 37 Likert-scale questions, 2 open-ended questions, and
16 demographic questions will take less than 20 minutes to complete. I understand that
all information will be kept confidential. If I have any questions, I can contact Ms. Crane
by email ([email protected]) or telephone (636-462-6098 ext. 164) to obtain
answers to my questions. I may also contact the University of Missouri Institutional
Review Board at 573-882-9585 with questions regarding my rights as a research
participant. At any time during this study, I can stop participating in the study with no
fear of concern or consequences. Under these conditions, I agree to participate in this
study.
Printed Name: Signature: Date:
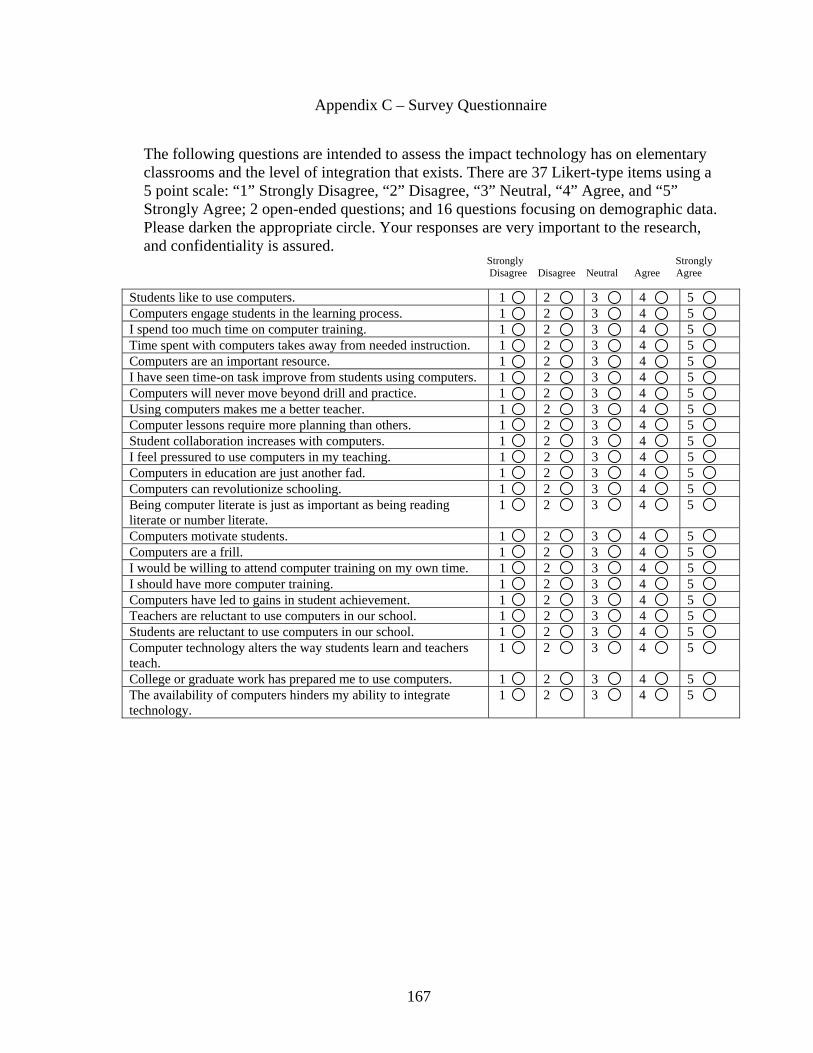
167
Appendix C – Survey Questionnaire The following questions are intended to assess the impact technology has on elementary classrooms and the level of integration that exists. There are 37 Likert-type items using a 5 point scale: “1” Strongly Disagree, “2” Disagree, “3” Neutral, “4” Agree, and “5” Strongly Agree; 2 open-ended questions; and 16 questions focusing on demographic data. Please darken the appropriate circle. Your responses are very important to the research, and confidentiality is assured.
Strongly Strongly Disagree Disagree Neutral Agree Agree
Students like to use computers. 1 2 3 4 5 Computers engage students in the learning process. 1 2 3 4 5 I spend too much time on computer training. 1 2 3 4 5 Time spent with computers takes away from needed instruction. 1 2 3 4 5 Computers are an important resource. 1 2 3 4 5 I have seen time-on task improve from students using computers. 1 2 3 4 5 Computers will never move beyond drill and practice. 1 2 3 4 5 Using computers makes me a better teacher. 1 2 3 4 5 Computer lessons require more planning than others. 1 2 3 4 5 Student collaboration increases with computers. 1 2 3 4 5 I feel pressured to use computers in my teaching. 1 2 3 4 5 Computers in education are just another fad. 1 2 3 4 5 Computers can revolutionize schooling. 1 2 3 4 5 Being computer literate is just as important as being reading literate or number literate.
1 2 3 4 5
Computers motivate students. 1 2 3 4 5 Computers are a frill. 1 2 3 4 5 I would be willing to attend computer training on my own time. 1 2 3 4 5 I should have more computer training. 1 2 3 4 5 Computers have led to gains in student achievement. 1 2 3 4 5 Teachers are reluctant to use computers in our school. 1 2 3 4 5 Students are reluctant to use computers in our school. 1 2 3 4 5 Computer technology alters the way students learn and teachers teach.
1 2 3 4 5
College or graduate work has prepared me to use computers. 1 2 3 4 5 The availability of computers hinders my ability to integrate technology.
1 2 3 4 5
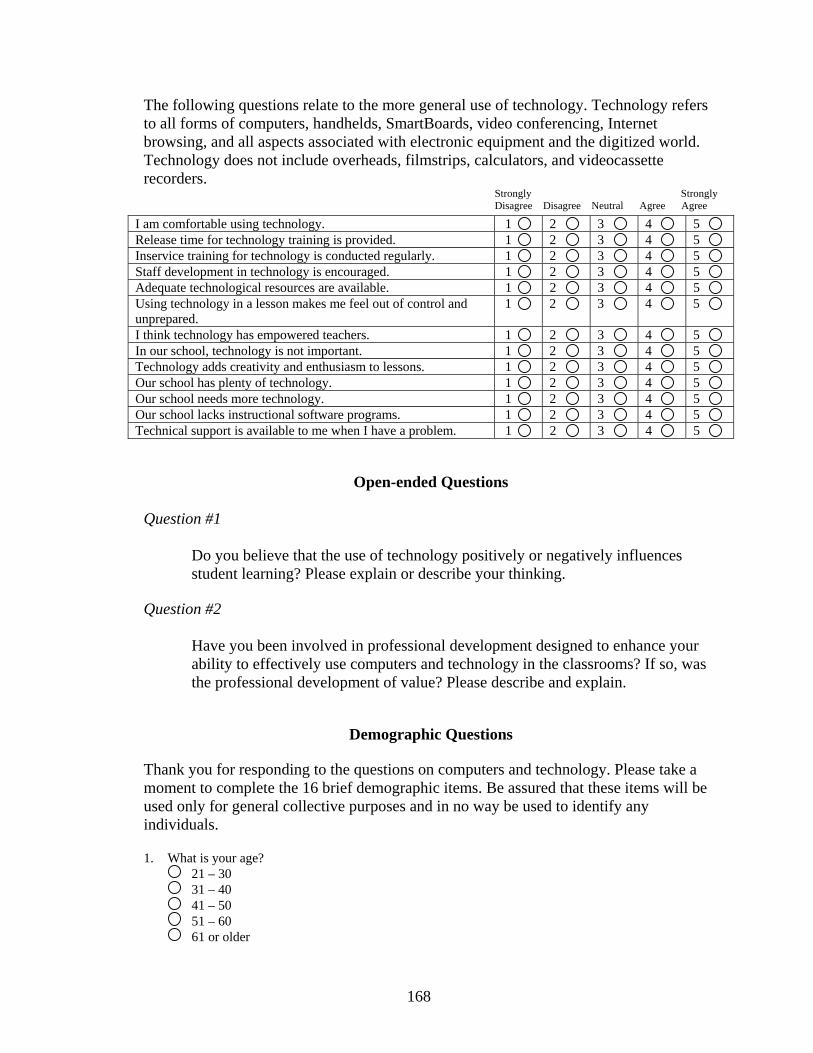
168
The following questions relate to the more general use of technology. Technology refers to all forms of computers, handhelds, SmartBoards, video conferencing, Internet browsing, and all aspects associated with electronic equipment and the digitized world. Technology does not include overheads, filmstrips, calculators, and videocassette recorders.
Strongly Strongly Disagree Disagree Neutral Agree Agree
Open-ended Questions
Question #1
Do you believe that the use of technology positively or negatively influences student learning? Please explain or describe your thinking.
Question #2
Have you been involved in professional development designed to enhance your ability to effectively use computers and technology in the classrooms? If so, was the professional development of value? Please describe and explain.
Demographic Questions Thank you for responding to the questions on computers and technology. Please take a moment to complete the 16 brief demographic items. Be assured that these items will be used only for general collective purposes and in no way be used to identify any individuals. 1. What is your age?
21 – 30 31 – 40 41 – 50 51 – 60 61 or older
I am comfortable using technology. 1 2 3 4 5 Release time for technology training is provided. 1 2 3 4 5 Inservice training for technology is conducted regularly. 1 2 3 4 5 Staff development in technology is encouraged. 1 2 3 4 5 Adequate technological resources are available. 1 2 3 4 5 Using technology in a lesson makes me feel out of control and unprepared.
1 2 3 4 5
I think technology has empowered teachers. 1 2 3 4 5 In our school, technology is not important. 1 2 3 4 5 Technology adds creativity and enthusiasm to lessons. 1 2 3 4 5 Our school has plenty of technology. 1 2 3 4 5 Our school needs more technology. 1 2 3 4 5 Our school lacks instructional software programs. 1 2 3 4 5 Technical support is available to me when I have a problem. 1 2 3 4 5
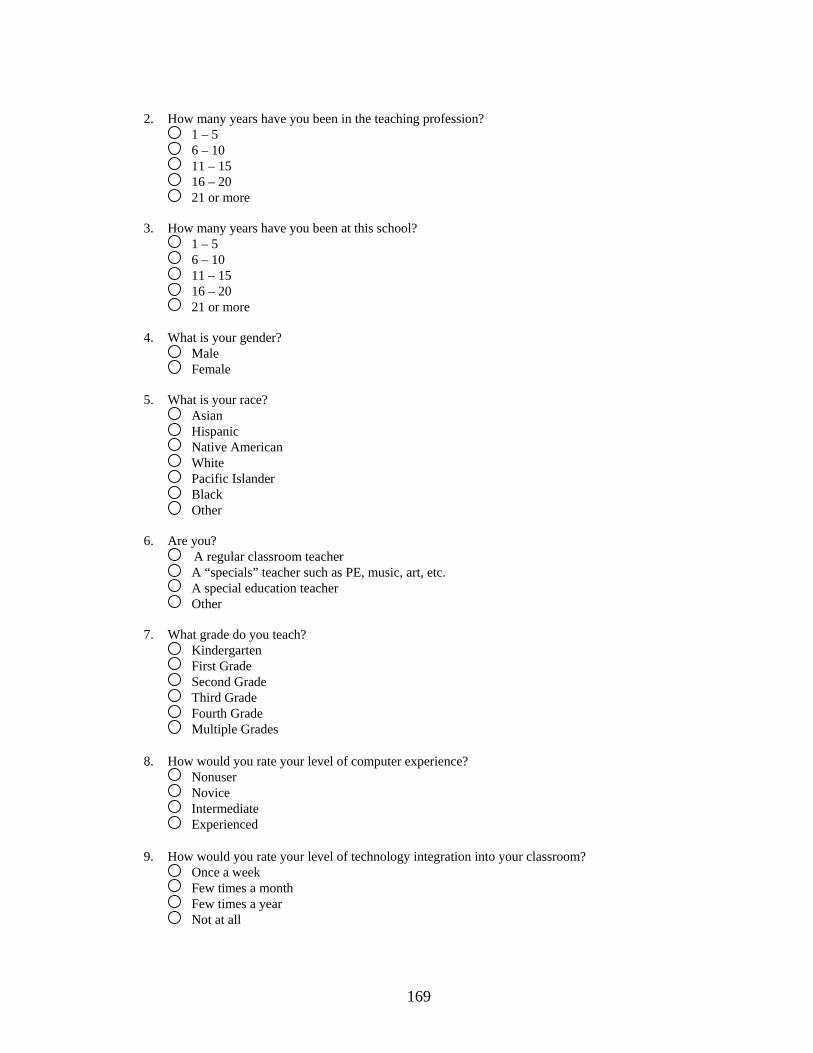
169
2. How many years have you been in the teaching profession?
1 – 5 6 – 10 11 – 15 16 – 20 21 or more
3. How many years have you been at this school?
1 – 5 6 – 10 11 – 15 16 – 20 21 or more
4. What is your gender?
Male Female
5. What is your race?
Asian Hispanic Native American White Pacific Islander Black Other
6. Are you?
A regular classroom teacher A “specials” teacher such as PE, music, art, etc. A special education teacher Other
7. What grade do you teach?
Kindergarten First Grade Second Grade Third Grade Fourth Grade Multiple Grades
8. How would you rate your level of computer experience?
Nonuser Novice Intermediate Experienced
9. How would you rate your level of technology integration into your classroom?
Once a week Few times a month Few times a year Not at all
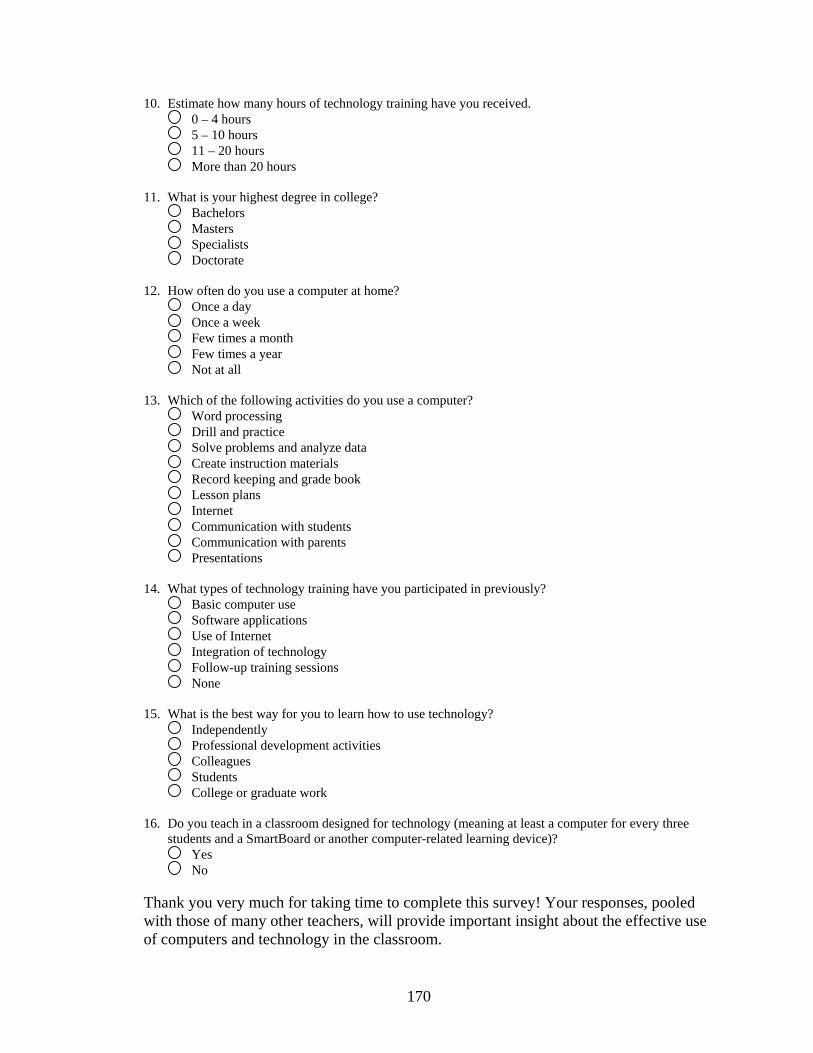
170
10. Estimate how many hours of technology training have you received. 0 – 4 hours 5 – 10 hours 11 – 20 hours More than 20 hours
11. What is your highest degree in college?
Bachelors Masters Specialists Doctorate
12. How often do you use a computer at home?
Once a day Once a week Few times a month Few times a year Not at all
13. Which of the following activities do you use a computer?
Word processing Drill and practice Solve problems and analyze data Create instruction materials Record keeping and grade book Lesson plans Internet Communication with students Communication with parents Presentations
14. What types of technology training have you participated in previously?
Basic computer use Software applications Use of Internet Integration of technology Follow-up training sessions None
15. What is the best way for you to learn how to use technology?
Independently Professional development activities Colleagues Students College or graduate work
16. Do you teach in a classroom designed for technology (meaning at least a computer for every three
students and a SmartBoard or another computer-related learning device)? Yes No
Thank you very much for taking time to complete this survey! Your responses, pooled with those of many other teachers, will provide important insight about the effective use of computers and technology in the classroom.

171
Appendix D – Consent to Interview
I understand that Connie M. Crane, a doctoral student in the Educational
Leadership and Policy Analysis Program at the University of Missouri – Columbia, is
working on a study exploring the impact of technology on elementary classrooms and
teaching. The interview will take approximately 30 minutes with questions focusing on
how I use technology in the classroom and the professional development activities I have
completed. I understand that all information will be kept confidential. If I have any
questions, I can contact Ms. Crane by email ([email protected]) or telephone (636-
462-6098 ext. 164) to obtain answers to my questions. I may also contact the University
of Missouri Institutional Review Board at 573-882-9585 with questions regarding my
rights as a research participant. At any time during this study, I can stop participating in
the study with no fear of concern or consequences. Under these conditions, I agree to
participate in this study.
Printed Name: Signature: Date:
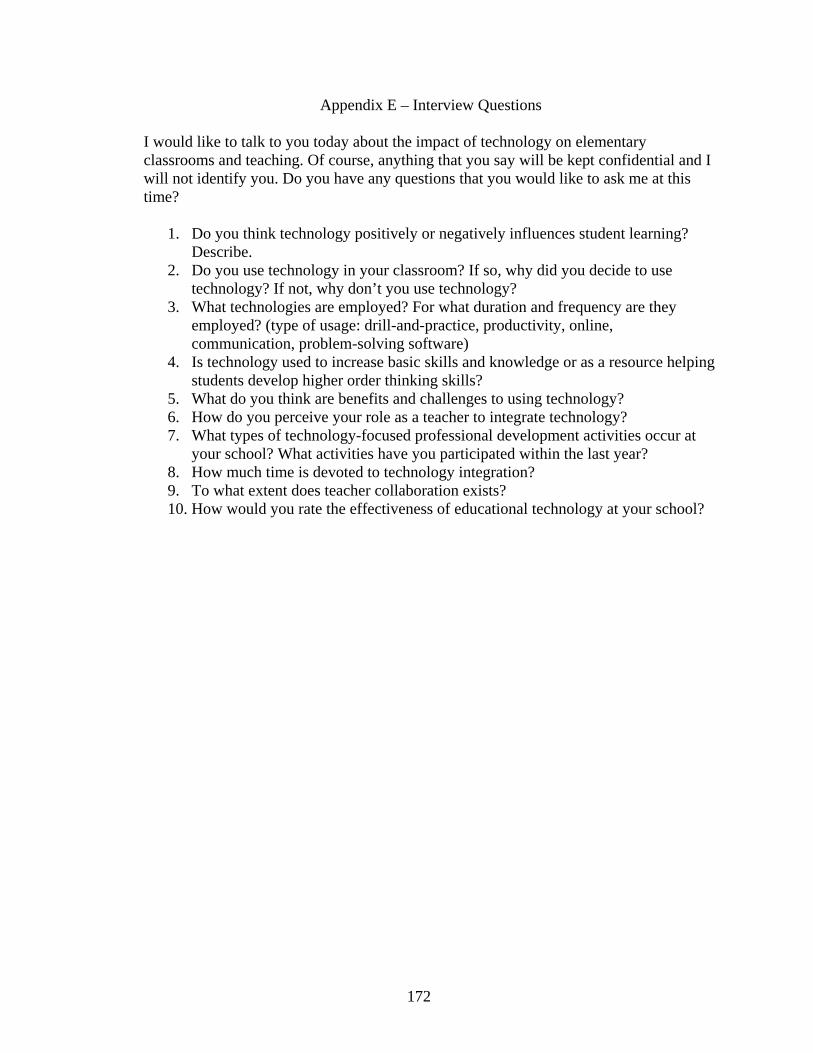
172
Appendix E – Interview Questions I would like to talk to you today about the impact of technology on elementary classrooms and teaching. Of course, anything that you say will be kept confidential and I will not identify you. Do you have any questions that you would like to ask me at this time?
1. Do you think technology positively or negatively influences student learning? Describe.
2. Do you use technology in your classroom? If so, why did you decide to use technology? If not, why don’t you use technology?
3. What technologies are employed? For what duration and frequency are they employed? (type of usage: drill-and-practice, productivity, online, communication, problem-solving software)
4. Is technology used to increase basic skills and knowledge or as a resource helping students develop higher order thinking skills?
5. What do you think are benefits and challenges to using technology? 6. How do you perceive your role as a teacher to integrate technology? 7. What types of technology-focused professional development activities occur at
your school? What activities have you participated within the last year? 8. How much time is devoted to technology integration? 9. To what extent does teacher collaboration exists? 10. How would you rate the effectiveness of educational technology at your school?

173
Appendix F – Consent for Focus Group Interview
I understand that Connie M. Crane, a doctoral student in the Educational
Leadership and Policy Analysis Program at the University of Missouri – Columbia, is
working on a study exploring the impact of technology on elementary classrooms and
teaching. The focus group interview consisting of the building administrator and
department heads will take approximately 30 minutes to complete. Questions will focus
on the integration of technology in elementary classrooms and types of professional
development activities provided. I understand that all information will be kept
confidential. If I have any questions, I can contact Ms. Crane by email
([email protected]) or telephone (636-462-6098 ext. 164) to obtain answers to my
questions. I may also contact the University of Missouri Institutional Review Board at
573-882-9585 with questions regarding my rights as a research participant. At any time
during this study, I can stop participating in the study with no fear of concern or
consequences. Under these conditions, I agree to participate in this study.
Printed Name: Signature: Date:
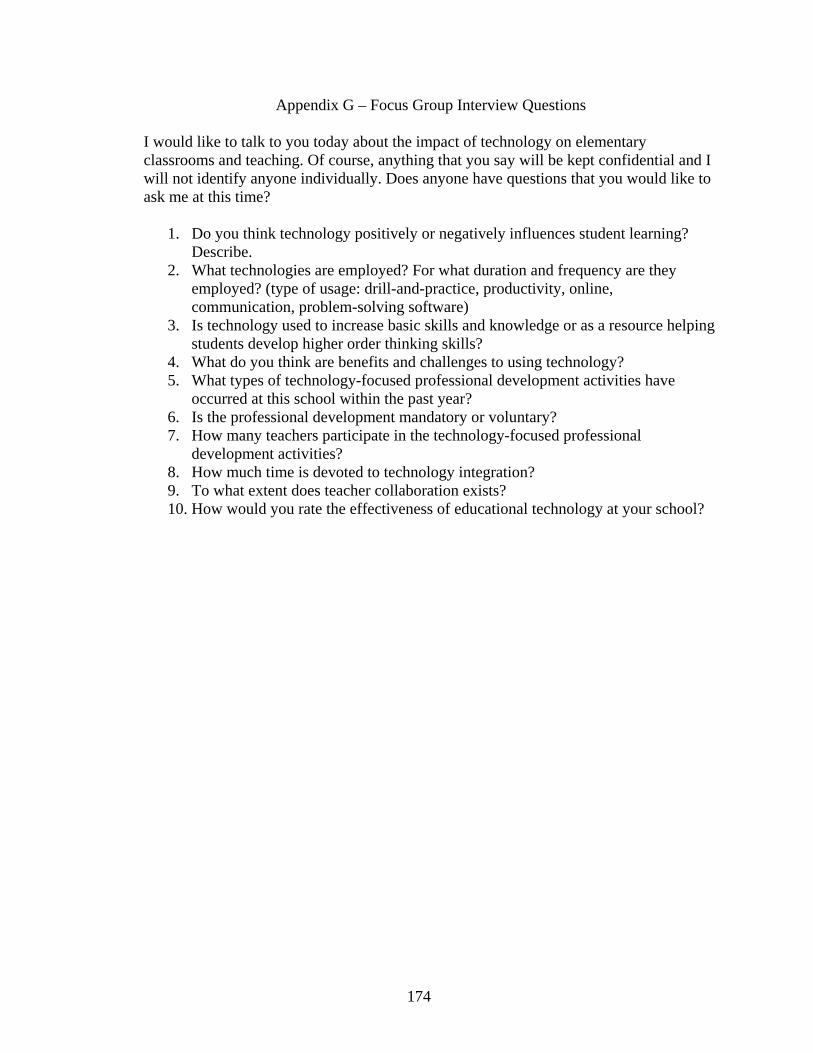
174
Appendix G – Focus Group Interview Questions I would like to talk to you today about the impact of technology on elementary classrooms and teaching. Of course, anything that you say will be kept confidential and I will not identify anyone individually. Does anyone have questions that you would like to ask me at this time?
1. Do you think technology positively or negatively influences student learning? Describe.
2. What technologies are employed? For what duration and frequency are they employed? (type of usage: drill-and-practice, productivity, online, communication, problem-solving software)
3. Is technology used to increase basic skills and knowledge or as a resource helping students develop higher order thinking skills?
4. What do you think are benefits and challenges to using technology? 5. What types of technology-focused professional development activities have
occurred at this school within the past year? 6. Is the professional development mandatory or voluntary? 7. How many teachers participate in the technology-focused professional
development activities? 8. How much time is devoted to technology integration? 9. To what extent does teacher collaboration exists? 10. How would you rate the effectiveness of educational technology at your school?
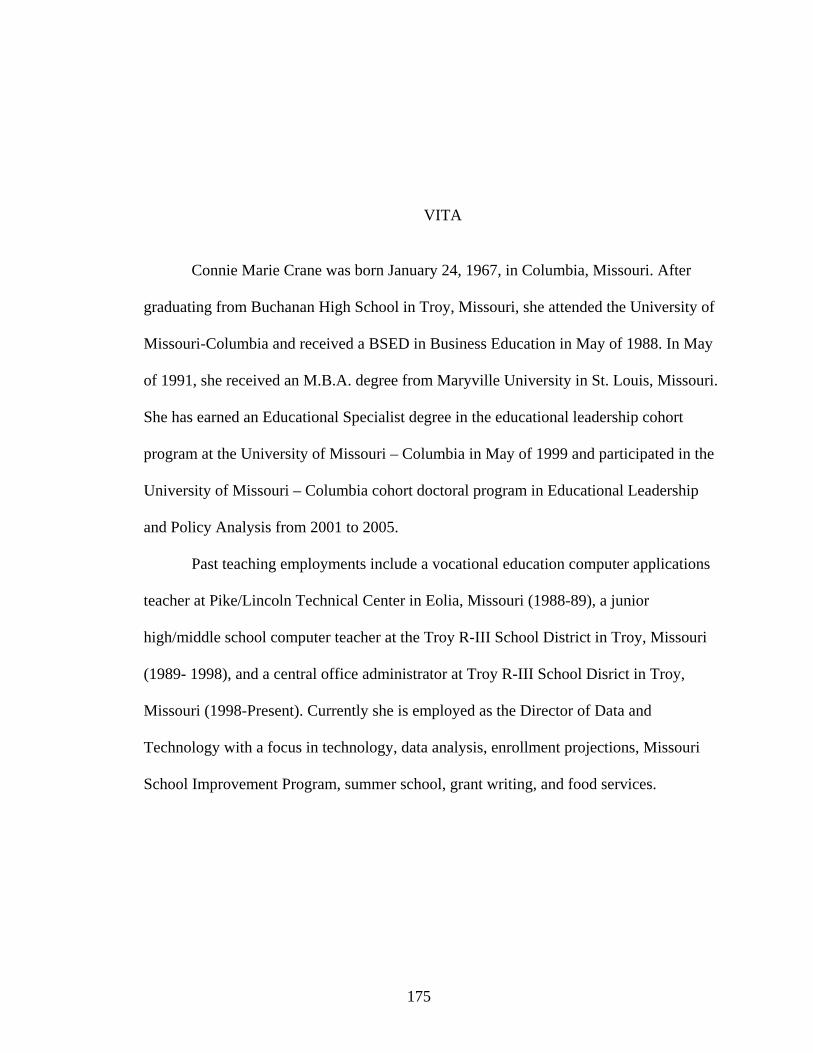
175
VITA
Connie Marie Crane was born January 24, 1967, in Columbia, Missouri. After
graduating from Buchanan High School in Troy, Missouri, she attended the University of
Missouri-Columbia and received a BSED in Business Education in May of 1988. In May
of 1991, she received an M.B.A. degree from Maryville University in St. Louis, Missouri.
She has earned an Educational Specialist degree in the educational leadership cohort
program at the University of Missouri – Columbia in May of 1999 and participated in the
University of Missouri – Columbia cohort doctoral program in Educational Leadership
and Policy Analysis from 2001 to 2005.
Past teaching employments include a vocational education computer applications
teacher at Pike/Lincoln Technical Center in Eolia, Missouri (1988-89), a junior
high/middle school computer teacher at the Troy R-III School District in Troy, Missouri
(1989- 1998), and a central office administrator at Troy R-III School Disrict in Troy,
Missouri (1998-Present). Currently she is employed as the Director of Data and
Technology with a focus in technology, data analysis, enrollment projections, Missouri
School Improvement Program, summer school, grant writing, and food services.