Embed Size (px)
Citation preview

National Renewable Energy Laboratory Innovation for Our Energy Future11
Impact of the 3Cs of Batteries on PHEV Value Proposition: Cost, Calendar Life, and Cycle Life
The 9th Advanced Automotive Battery Conference Long Beach, California
June 10-12, 2009Ahmad Pesaran,
Kandler Smith, and Tony MarkelNational Renewable Energy Laboratory
NREL/PR-540-45887
Funded by Energy Storage R&D (David Howell)Vehicle Technologies Program
U.S. Department of Energy
Operated by the Alliance for Sustainable Energy, LLC

National Renewable Energy Laboratory Innovation for Our Energy Future2222
Overview
• Introduction and background• Motivation for PHEV battery trade-off analysis• Battery calendar and cycle life models• Battery cost model• Battery life/cost trade-off results• Impact of temperature on battery life and cost• Summary

National Renewable Energy Laboratory Innovation for Our Energy Future3333
Introduction• PHEVs have the potential to significantly reduce (imported)
petroleum consumption (and GHG emissions) by improving efficiency and use of electricity
• Capacity, c-rate, cost, cycle life, and calendar life are all critical in making batteries for PHEVs commercially viable
• Incremental cost of the long-lasting batteries could be offsetwith government incentives and high petroleum prices

National Renewable Energy Laboratory Innovation for Our Energy Future4444
Introduction
• Cost, calendar life, and cycle life are the least known and have the biggest impact on PHEV value proposition
• Cost, fuel savings, and battery degradation characteristics at beginning of life vs. end of life must be evaluated
• The spectrum of battery degradation rates due to both cycle life and calendar life in various climates and operating states of charge (SOCs) are needed
• NREL has been studying trade-offs between the performance, life, and cost of batteries
• PHEVs have the potential to significantly reduce (imported) petroleum consumption (and GHG emissions) by improving efficiency and use of electricity
• Capacity, c-rate, cost, cycle life, and calendar life are all critical in making batteries for PHEVs commercially viable
• Incremental cost of the long-lasting batteries could be offsetwith government incentives and high petroleum prices

National Renewable Energy Laboratory Innovation for Our Energy Future555
Major Battery Requirements (5Cs)
Characteristics at EOL (End of Life) High Power/Energy Ratio Battery
High Energy/Power Ratio Battery
Reference Equivalent Electric Range miles 10 40Peak Pulse Discharge Power - 2 Sec / 10 Sec kW 50 / 45 46 / 38Peak Regen Pulse Power (10 sec) kW 30 25Available Energy for CD (Charge Depleting) Mode, 10 kW Rate kWh 3.4 11.6Available Energy for CS (Charge Sustaining) Mode kWh 0.5 0.3Minimum Round-trip Energy Efficiency (USABC HEV Cycle) % 90 90Cold cranking power at -30°C, 2 sec - 3 Pulses kW 7 7
CD Life / Discharge Throughput Cycles/MWh 5,000 / 17 5,000 / 58
CS HEV Cycle Life, 50 Wh Profile Cycles 300,000 300,000Calendar Life, 35°C year 15 15Maximum System Weight kg 60 120Maximum System Volume Liter 40 80Maximum Operating Voltage Vdc 400 400Minimum Operating Voltage Vdc >0.55 x Vmax >0.55 x VmaxMaximum Self-discharge Wh/day 50 50
System Recharge Rate at 30°C kW 1.4 (120V/15A) 1.4 (120V/15A)
Unassisted Operating & Charging Temperature Range °C -30 to +52 -30 to +52
Survival Temperature Range °C -46 to +66 -46 to +66
Maximum System Production Price @ 100k units/yr $ $1,700 $3,400
Requirements of End of Life Energy Storage Systems for PHEVs

National Renewable Energy Laboratory Innovation for Our Energy Future666
Major Battery Requirements (5Cs)
Characteristics at EOL (End of Life) High Power/Energy Ratio Battery
High Energy/Power Ratio Battery
Reference Equivalent Electric Range miles 10 40Peak Pulse Discharge Power - 2 Sec / 10 Sec kW 50 / 45 46 / 38Peak Regen Pulse Power (10 sec) kW 30 25Available Energy for CD (Charge Depleting) Mode, 10 kW Rate kWh 3.4 11.6Available Energy for CS (Charge Sustaining) Mode kWh 0.5 0.3Minimum Round-trip Energy Efficiency (USABC HEV Cycle) % 90 90Cold cranking power at -30°C, 2 sec - 3 Pulses kW 7 7
CD Life / Discharge Throughput Cycles/MWh 5,000 / 17 5,000 / 58
CS HEV Cycle Life, 50 Wh Profile Cycles 300,000 300,000Calendar Life, 35°C year 15 15Maximum System Weight kg 60 120Maximum System Volume Liter 40 80Maximum Operating Voltage Vdc 400 400Minimum Operating Voltage Vdc >0.55 x Vmax >0.55 x VmaxMaximum Self-discharge Wh/day 50 50
System Recharge Rate at 30°C kW 1.4 (120V/15A) 1.4 (120V/15A)
Unassisted Operating & Charging Temperature Range °C -30 to +52 -30 to +52
Survival Temperature Range °C -46 to +66 -46 to +66
Maximum System Production Price @ 100k units/yr $ $1,700 $3,400
Requirements of End of Life Energy Storage Systems for PHEVs
Available Energy = 11.6 kWh (ΔSOC = 70%)Capacity (EOL) = 16.6 kWh
Calendar Life at 35°C = 15 Years
Cost (system) = $3,400
Cycle Life (depleting) = 3K-5K cyclesCycle Life (sustaining) =200K-300K cycles
Peak Power Discharge (2S/10S) = 46/38 kW C-rate ~ 10-15 kW

National Renewable Energy Laboratory Innovation for Our Energy Future77
The Three Important Cs of Batteries
• Cost• Cycle Life• Calendar Life
These three attributes vary significantly from supplier to supplier, are not consistently
reported, and dramatically affect the market potential of PHEVs and EVs.

National Renewable Energy Laboratory Innovation for Our Energy Future88
C3 Data Is Critical to Many Analysis Efforts
Cost
CycleLife
CalendarLife
VehicleSystems
Simulation
Economic Analysis& Value Proposition
Linkagewith
Renewables
PerformanceModeling

National Renewable Energy Laboratory Innovation for Our Energy Future999
Optimization with vehicle simulations
under realistic driving cycles
and environments
PHEV Battery Design OptimizationDesign/size PHEV batteries to meet USABC technical
goals/requirements at minimum cost.
Source: ANL, INL, LBNL, SNL
Cycle Life,Calendar Life
Source: VARTA
Cost Capacity and C-ratePerformance
Life prediction represents greatest uncertainty
Complex dependency on t1/2, t, # cycles, T, V, ΔDOD
National Renewable Energy Laboratory Innovation for Our Energy Future

National Renewable Energy Laboratory Innovation for Our Energy Future10101010National Renewable Energy Laboratory Innovation for Our Energy Future
Motivation: Minimize Battery Cost, Maximize Life
How?
0) Select a high-quality, low-cost cell
1) Size battery appropriately so as not tooverstress/overcycle, but with minimum cost and mass1) Accelerated calendar and cycle life testing2) Accurate life and DOD predictive models
2) Minimize time spent at high temperatures1) Standby thermal management (vehicle parked!)2) Active thermal management (vehicle being driven)
3) Use proper electrical management, control design
System design
Component design/
selection

National Renewable Energy Laboratory Innovation for Our Energy Future11111111
Overview
• Introduction and background• Motivation for PHEV battery trade-off analysis• Battery calendar and cycle life models• Battery cost model• Battery life/cost trade-off results• Impact of temperature on battery life and cost• Summary

National Renewable Energy Laboratory Innovation for Our Energy Future12121212
Modeling to Predict Battery Life
Cycling Fade• Poorly understood• Typical t or N dependency• Often correlated log(# cycles) with ΔDOD or log(ΔDOD)
0 0.2 0.4 0.61
1.05
1.1
1.15
1.2
1.25
1.3
1.35
Time (years)
Rel
ativ
e R
esis
tanc
e
304047.555
Calendar Life Study at various T (°C)
Calendar (Storage) Fade• Relatively well established & understood• Typical t1/2 time dependency• Arrhenius relation describes T dependency
Source: V. Battaglia (LBNL), 2008
Life
(# c
ycle
s)
Life (# cycles)
Source: John C. Hall (Boeing), IECEC, 2006. Source: Christian Rosenkranz (JCS/Varta) EVS-20
ΔDOD
ΔDO
D

National Renewable Energy Laboratory Innovation for Our Energy Future13131313
Objectives for Battery Life Modeling
Develop a power and energy degradation model that —
1. Uses both accelerated and real-time calendar and cycle life data as inputs.
2. Is mathematically consistent with all calendar and cycle life empirical data.
3. Is extendable to arbitrary usage scenarios (i.e., it is predictive).

National Renewable Energy Laboratory Innovation for Our Energy Future14141414
Impedance Growth Mechanisms: Complex Calendar and Cycling Dependency
SEM Images: John C. Hall, IECEC, 2006.
Cell storedat 0oC
NCA chemistry: Different types of electrode surface film layers can grow.
(1) “Electrolyte film” or SEI layer (2) “Solid film”
Cell cycled1 cycle/day
at 80% DOD and 0°C
Electrolyte film*
• grows during storage α t1/2
• suppressed by cycling
Solid film• grows only with cycling α t or N
*Often called Solid-Electrolyte Inter-phase (SEI) layer

National Renewable Energy Laboratory Innovation for Our Energy Future15151515
Life Model Summary (equations & coefficients)
Impedance Growth Model• Temperature• Voltage• ΔDOD• Calendar Storage (t1/2 term)• Cycling (t & N terms)
Capacity Fade Model• Temperature• Voltage• ΔDOD• Calendar Storage (Li loss)• Cycling (Site loss)

National Renewable Energy Laboratory Innovation for Our Energy Future16161616
Life Model Summary (equations & coefficients)
Impedance Growth Model• Temperature• Voltage• ΔDOD• Calendar Storage (t1/2 term)• Cycling (t & N terms)
Capacity Fade Model• Temperature• Voltage• ΔDOD• Calendar Storage (Li loss)• Cycling (Site loss)
From impedance growth model
Reasonably fits available data Actual interactions of degradation mechanisms may be more complex.
QLi = d0 + d1 x (a1 t1/2)
Qsites = e0 + e1x (a2,t t + a2,N N)
a1 = a1,ref k1 exp(α1F/RT x V)a2 = a2,ref k2 exp(α2F/RT x V)
k1 = k1,ref exp(-Ea1 x (T-1 - Tref-1) /R)
k2 = k2,ref exp(-Ea2 x (T-1 - Tref-1) / R)
a2,t = a2 (1 - αN) a2,N = a2 αN
a1 = b0 + b1 (1 – ΔDOD)b2
a2 / a1 = max[0, c0 + c1 (ΔDOD)]
Q = min( QLi, Qsites )
R = a1 t1/2 + a2,t t + a2,N N

National Renewable Energy Laboratory Innovation for Our Energy Future17
Details of Calendar and Cycle Life Models Are Presented by Kandler Smith in the
Poster Session forAABC-09

National Renewable Energy Laboratory Innovation for Our Energy Future18
Life Model Summary• Model structure set by Boeing satellite battery dataset1,2
• Difficult to decouple ΔDOD and voltage degradation effects from cell-level dataset
• Model adjusted to reflect more recent experience with NCA-graphite cells from various Labs 3-6
• 4.5 years storage at 40oC, 50% SOC 10% capacity fade4
• 13.7 years storage at 35oC 110% resistance growth5
• 2700 PHEV charge depletion cycles at 25oC 8% capacity fade, 50% resistance growth6
• The following analysis illustrates trade-offs for a cell with low capacity fade but high resistance growth over life.
18
References:1. J. Hall, T. Lin, G. Brown, “Decay Processes and Life Predictions for Lithium Ion Satellite Cells,” 4th International Energy Conversion Engineering Conference & Exhibit,
San Diego, CA, June 26-29, 2006.2. J. Hall, A. Schoen, A. Powers, P. Liu, K. Kirby, “Resistance Growth in Lithium Ion Satellite Cells. I. Non Destructive Data Analyses,” 208th Electrochem. Soc. Mtg., Los
Angeles, CA, October 16-21, 2005.3. J.P. Christophersen, I. Bloom, E.V. Thomas, K.L. Gering, G.L. Henriksen, V.S. Battaglia, D. Howell, “Advanced Technology Development Program for Lithium-Ion
Batteries: DOE Gen 2 Performance Evaluation Final Report,” Idaho National Laboratory, INL/EXT-05-00913, July, 2006.4. M.C. Smart, K.B. Chin, L.D. Whitcanack, B.V. Ratnakumar, “Storage Characteristics of Li-Ion Batteries,” NASA Aerospace Battery Workshop, Huntsville, AL,
November 14-16, 2006.5. P. Biensan, Y. Borthomieu, “Saft Li-Ion Space Batteries Roadmap,” NASA Aerospace Battery Workshop, Huntsville, AL, November 27-29, 2007.6. L. Gaillac, “Accelerated Testing of Advanced Battery Technologies in PHEV Applications,” 23rd Electric Vehicle Symposium, Anaheim, CA, December 2-5, 2007.

National Renewable Energy Laboratory Innovation for Our Energy Future19
Life Analysis Conducted Using Simplified Cycling Profiles
Major input parameters that are varied.
19
Constant current profile
generator
Li-ion CellLife
Model
ΔDOD
Ncycles/day
EoCV = 3.9V(SOCmax = 90%)
Age (Yrs)
T (oC)
V (t) • Capacity (t)• Resistance (t)
:• BOL Energy &
Power needed to meet EOL requirements
:• Cost

National Renewable Energy Laboratory Innovation for Our Energy Future20202020
Results: Which Dominates — Calendar or Cycling?Capacity Fade − Energy
• Predominantly cycling controlled(calendar fade just 30% to 40% of cycling fade)
Moderate Climate
Calendarcontrolled
Cal
enda
rco
ntro
lled Cycling
controlled
Hot Climate
• Cycling controlled for High ΔDOD• Calendar controlled for Low ΔDOD
• 35oC, 1 cycle/day, SOCmax = 90%• 20oC, 1 cycle/day, SOCmax = 90%
Generally cycling controlled, though it depends on temperature
NCA chemistry

National Renewable Energy Laboratory Innovation for Our Energy Future21212121
Results: Which Dominates — Calendar or Cycling?Resistance Growth − Power
• Calendar degradation:> 60% of total resistance growth
Moderate Climate Hot Climate• 35oC, 1 cycle/day, SOCmax = 90%• 20oC, 1 cycle/day, SOCmax = 90%
Calendar effect dominates, though both are important.
• Calendar degradation:> 70% of total resistance growth
NCA chemistry

National Renewable Energy Laboratory Innovation for Our Energy Future22222222
Overview
• Introduction and background• Motivation for PHEV battery trade-off analysis• Battery calendar and cycle life models• Battery cost model• Battery life/cost trade-off results• Impact of temperature on battery life and cost• Summary

National Renewable Energy Laboratory Innovation for Our Energy Future2323
Developing a Simplified Cost ModelEstimating Manufacturer Pack Cost
• Battery cost estimates from EPRI-led HEV study as original source1
• EPRI HEV cost model used for NREL’s EVS-22 paper on PHEV Cost Benefit Analysis2
• DOE-sponsored TIAX study reviewed cost details of two Li-ion cathodes (NCA and NCM) manufacturing3
• Modified fixed costs to include a per-cell component based on TIAX estimates (this study)
• Cost at volume manufacturing at 2007 materials’ prices
Simplified Pack Cost Model$/pack = 11.1*kW + 224.1*kWh + 4.53*BSF + 340
Nominal Energy(kWh)
P/E Detailed Model: 3
NCM
Detailed Model: 3
NCA
Simple Model: 1.2
$=11*kW+224*kWh+680
6.9 5.8 $3120 $2600 $2660
8.5 4.7 $3510 $2860 $3020
11.6 3.5 $4290 $3500 $3680
1. Graham, R. et al. “Comparing the Benefits and Impacts of Hybrid Electric Vehicle Options,” Electric Power Research Institute (EPRI), 2001.2. Simpson, A., “Cost Benefit Analysis of Plug-In Hybrid Electric Vehicle Technology,” 22nd International Electric Vehicle Symposium, Yokohama, Japan, Oct. 2006.3. “Cost Assessment for Plug-In Hybrid Vehicles,” TIAX LLC, Oct. 2007.
EPRI-led HEV Study
NCA - Nickel Cobalt Alumina; NCM- Nickel Cobalt Manganese
BSF = Battery Size Factor

National Renewable Energy Laboratory Innovation for Our Energy Future24242424
Life-Cost Trade-Off Study: Approach• Choose a cycle life model and a calendar life model• We picked curve fits from slide 13 for NCA chemistry
• Choose a cost model• Manufacturing cost of a complete pack at high-volume production• We picked the equation on slide 18 for NCA chemistry
• Select the required battery energy and power • Energy: 3.4 kWh PHEV10; 11.6 kWh PHEV40 (USABC requirements)
• Select the required battery life• Cycles (charge depleting): 5000 CD cycles (USABC requirements)• Calendar life: 10 years at 30oC (less aggressive than 15-year USABC)
• Perform analysis to answer the following questions:• What ΔDOD & P/E meet life at minimum cost?• Which controls life? Calendar or cycle life?• What environmental parameters cause greatest life sensitivity?

National Renewable Energy Laboratory Innovation for Our Energy Future25252525
Life-Cost Trade-Off: Energy and Power Margin to Meet EOL Performance Requirements
BOLEnergy Margin
BOL Total Energy
EOL Available Energy Requirement
= - 1 x 100%
BOLPower Margin
BOL Total Power
EOL Available Power Requirement
= - 1 x 100%
BOL = Beginning of LifeEOL = End of Life
Next slides give results for typical Li-ion NCA chemistry and include fade for a chosen ΔDOD window (1 cycle/day, 30oC).
Battery Sizing Metrics:

National Renewable Energy Laboratory Innovation for Our Energy Future26262626
Example Results: Life-Cost Trade-Off Study (Energy & Power Margin, Usable ΔDOD)
PHEV10 battery sized for 10 years at 30oC, 1 cycle/day*
Largest mass
Pay forenergy
Smallest mass
Pay forpower
Lowestcost
• Too much power is preferable to too little• small increase in cost• reduces mass
• PHEV10 batteries can require >100% excess power at BOLAllows ~60% usable ΔDOD(More useable ΔDOD is possible with even more excess power)
* 3.9 EoCV (90% SOCmax) ** Excess power and energy relative to 50kW and 3.4 kWh PHEV 10 requirements
$440/kWh, P/E=15 hr-1 Today’s costs at volume production
NCA chemistry

National Renewable Energy Laboratory Innovation for Our Energy Future27272727
Example Results: Life-Cost Trade-Off Study (Energy & Power Margin, Usable ΔDOD)
PHEV40 battery sized for 10 years at 30oC, 1 cycle/day*
Scenario limited by deep cycling
• Higher excess power is not advantageous as it does not allow deeper ΔDOD cycling (Unlike PHEV10)
• PHEV40 batteries can require ~25% excess power at BOLLess power sensitivity compared with PHEV10
* 3.9 EoCV (90% SOCmax) ** Excess power and energy relative to 46kW and 11.6 kWh PHEV 40 requirements
Scenario limited by calendar
$320/kWh, P/E=4 hr-1
Lowest cost
Today’s costs at volume production
NCA chemistry

National Renewable Energy Laboratory Innovation for Our Energy Future28282828
Example Results: Life-Cost Trade-off Study(Sensitivity to Years of Life)
Increasing life requirement from 10 to 15 years means:
•10% less ΔDOD is usable
•$250 greater cost
* 1 cycle/day, 3.9 EoCV (90% SOCmax)
PHEV10 battery sized for10, 15 years at 30oC*
** Excess power relative to 50kW PHEV 10 requirement
NCA chemistry
National Renewable Energy Laboratory Innovation for Our Energy Future29292929
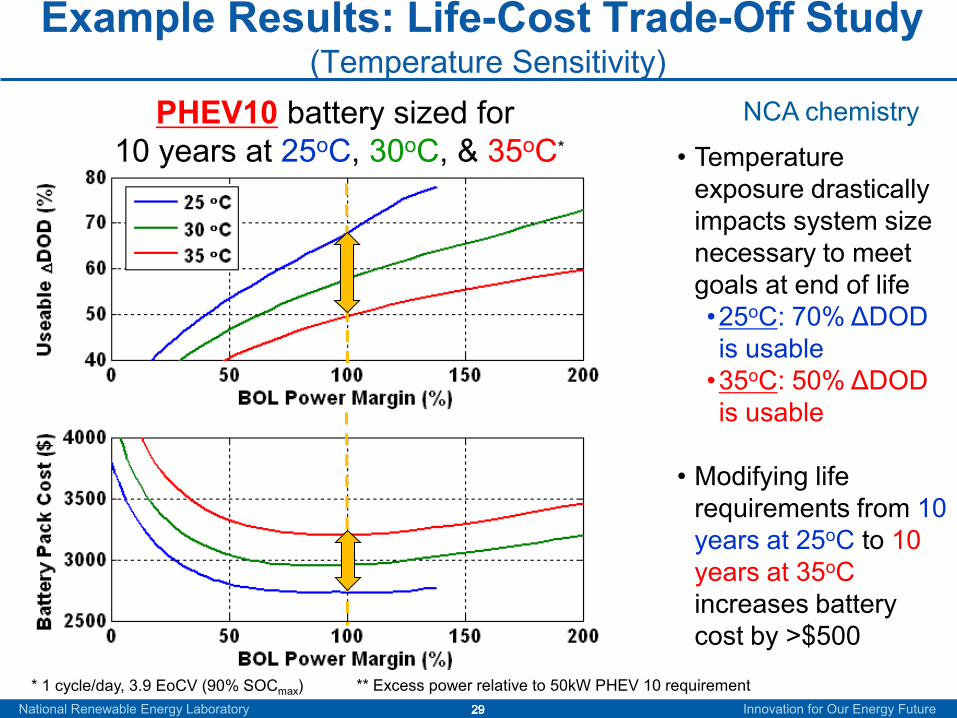
Example Results: Life-Cost Trade-Off Study(Temperature Sensitivity)
• Temperature exposure drastically impacts system size necessary to meet goals at end of life•25oC: 70% ΔDOD is usable•35oC: 50% ΔDOD is usable
• Modifying life requirements from 10 years at 25oC to 10 years at 35oC increases battery cost by >$500
* 1 cycle/day, 3.9 EoCV (90% SOCmax)
PHEV10 battery sized for 10 years at 25oC, 30oC, & 35oC*
** Excess power relative to 50kW PHEV 10 requirement
NCA chemistry

National Renewable Energy Laboratory Innovation for Our Energy Future30
Summary: Comparison of Battery Minimum Cost Designs for Varying Years of Life and Temperature
• Battery replacement not economically justified• Cost can be more sensitive to temperature than years life
(Especially true for small PHEV batteries with high power requirement)
30
15 years10 years7½ years
15 years10 years7½ years
PHEV40
PHEV10
NCA chemistry

National Renewable Energy Laboratory Innovation for Our Energy Future3131
Temperature Impacts Cost (Sizing & Life)
PowerLimits
15°C 35°C
discharge
charge
RatedPower
T
DegradationSluggishElectrochemistry
PowerLimits
15°C 35°C
discharge
charge
RatedPower
T
DegradationSluggishElectrochemistry
Dictates power capability through
cold cranking
Dictates the size depending on the
power and capacity fade rate
Limiting power to reduced T increase
and degradation
National Renewable Energy Laboratory Innovation for Our Energy Future3232
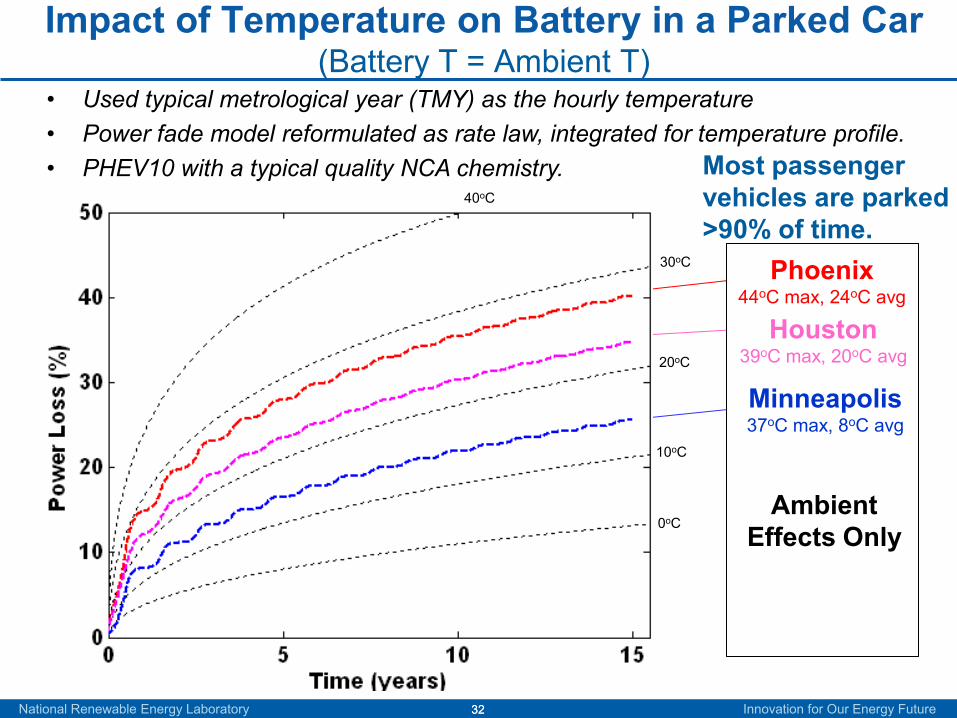
Impact of Temperature on Battery in a Parked Car (Battery T = Ambient T)
• Used typical metrological year (TMY) as the hourly temperature• Power fade model reformulated as rate law, integrated for temperature profile.• PHEV10 with a typical quality NCA chemistry.
Phoenix44oC max, 24oC avg
Houston39oC max, 20oC avg
Minneapolis37oC max, 8oC avg
Ambient Effects Only
Most passenger vehicles are parked >90% of time.
0oC
10oC
20oC
30oC
40oC

National Renewable Energy Laboratory Innovation for Our Energy Future3333
Phoenix49oC max, 27oC avg
Houston42oC max, 23oC avg
Minneapolis41oC max, 10oC avg
Ambient Effects +
Solar Gain (Vehicle/Battery
Thermal Interactions)
Impact of Temperature on Battery in a Parked Car (Battery T = Ambient T + Solar Gain)
• The same as previous slide (PHEV10, NCA chemistry and TYM weather) • Developed a vehicle-battery-ambient model to predict the battery temperature• Results show significant fade due to the ambient temperature and solar gain
0oC
10oC
20oC
30oC
40oC

National Renewable Energy Laboratory Innovation for Our Energy Future34343434
Analysis Shows Keeping Peak Battery Temperature below Extremes Could Greatly Improve Battery Life
PHEV10 – Power loss after 15 years Ambient temperature & solar radiation climate data input to vehicle/battery thermal model.
Assume peak battery temperatures can be eliminated.Typical Quality Current NCA Li-ion Technology
How much is it worth to spend on thermal control (parked too)?
Phoenix Houston Minneapolis

National Renewable Energy Laboratory Innovation for Our Energy Future35353535
Summary• Battery cost, cycle life, and calendar life must be optimized to
achieve maximum value for PHEV commercialization.– A process/approach such as the one discussed here is needed.
• Useful life of a given pack design is dictated by complex interaction of parameters (t1/2, t, N, T, V, DOD).– Different chemistries have different behaviors.
• Battery life is extremely sensitive to temperature exposure; solar loading can cause further battery heating and lower life.
• Thermal control (when parked or driving) could be a cost-effective method to reduce oversizing of battery for the beginning of life.
• PHEV battery “standby” thermal control can reduce power loss, particularly for PHEV10.
• Accurate degradation prediction requires a large experimental matrix (for different chemistries).

National Renewable Energy Laboratory Innovation for Our Energy Future36
Thank You!
www.nrel.gov/vehiclesandfuels/energystorage/