Embed Size (px)
Citation preview

IMPACT OF THE FINANCIAL CRISIS ON HEALTHCARE ACCESS IN THE U.S.
A Thesis submitted to the Faculty of the
Graduate School of Arts and Sciences of Georgetown University
in partial fulfillment of the requirements for the degree of
Master of Public Policy in Public Policy
By
WANG PAN, B.A.
Washington, DC April 8, 2015

ii
Copyright 2015 by WANG PAN All Rights Reserved

iii
IMPACT OF THE FINANCIAL CRISIS ON HEALTHCARE ACCESS IN THE U.S.
WANG PAN, B.A.
Thesis Advisor: William, Encinosa PhD
ABSTRACT
In this paper I use the Medical Expenditure Panel Survey Data in a difference in differences
model to explore whether the 2007-2008 financial crisis impacted healthcare access.
I find that it was harder for the uninsured to get care when needed, while the insured
experienced improved access of care after the financial crisis. Similarly, the number of outpatient
department physician visits declined differentially for the uninsured after the recession. Total
office-based expenses increased for the insured population, but the uninsured had significantly
decreased total office-based expenses post financial crisis. Overall, access for the uninsured
deteriorated and never recovered after the recession.
These findings suggest that health care access based on health insurance coverage was
adversely affected by the financial crisis, and disparities widened. Based on this research,
policymakers should improve the uninsured population’s access to health care especially in
economic downturns and expand health insurance coverage to a wider population to ensure
health care access.

iv
The research and writing of this thesis is dedicated to everyone who helped along the way.
Many thanks, WANG PAN

v
Table of Contents INTRODUCTION ............................................................................................................................... 1
New Contribution ........................................................................................................................ 2 LITERATURE REVIEW ..................................................................................................................... 3 THEORETICAL FRAMEWORK ........................................................................................................... 7
What is Healthcare Access? ........................................................................................................ 7 How the Economic Recession Adversely Affect Healthcare Access? ....................................... 8
HYPOTHESES AND RESEARCH METHOD ....................................................................................... 11 Hypothesis ................................................................................................................................. 11 Methods ..................................................................................................................................... 14
DATA AND DESCRIPTION OF VARIABLES ..................................................................................... 15 RESULTS AND DISCUSSION ........................................................................................................... 20
Got care when needed ............................................................................................................... 20 Medical Care Utilization ........................................................................................................... 23 Discussion ................................................................................................................................. 26
LIMITATIONS ................................................................................................................................. 26 CONCLUSIONS ............................................................................................................................... 28 BIBLIOGRAPHY ............................................................................................................................. 29

1
INTRODUCTION
The 2007-2008 financial crisis was unlike any other crisis in generations that rocked not just
Wall Street, but also turned into an economic recession that extended far beyond Wall Street.
The stock market collapsed, firms went out of business, jobs disappeared, and wealth declined.
Many studies have shed light on the social and economic impacts of the financial crisis on
individuals and families (Rogoff and Reinhart, 2013). In the U.S., housing prices declined
average 35 percent stretched out over six years, and the unemployment rate in creased on
average of 7% points over the economic downturn, which lasted on average over four years
(Rogoff and Reinhart, 2013). On the individual level, employees got lower earning wages;
household financial capability weakened because of the blow to investment-based pensions; and
many workers lost a substantial portion of their retirement saving (Chai, 2011). Thus, even
though global financial crisis is defined on paper as lasting from 2007 to 2008, its effects may
linger for quite some time, not least in regard to affordable health care.
In the United States, healthcare is shaped by the complex economic interactions of
employment, household economic situations, and the cost of the health service. Different from
many European welfare states that have universal health coverage, the United States has an
employment-based health coverage system. People generally get health insurance through
employment. As a result, many self-employed or unemployed population fall through the health
insurance safety net as non-group customers. Government has two social insurance programs,
which have not solved the problem. Medicare helps people over 65 and Medicaid helps lower

2
income families and individualsa, but people under 65 and over the poverty line were left out,
especially before the Affordable Care Actb. As a result, the uninsured rate remained as high as
16.4% after 2000 (Majerol et al., 2015). According to Kaiser Family Foundation, in 2009, due to
the worsened economic situation, the number of people without health insurance rose sharply to
50.7 million (16.7% of the total population) from 46.3 million (15.4%) in 2000– an all time
high (Villegas et al., 2015). The national survey also pointed out that 30% of households said
they had reduced spending further since the financial crisis, which posed constraints to
healthcare spending. Constantly rising Medicare cost may also have worsened the situation with
a wider divide between out-of-pocket health costs and individuals’ wage growth (WSJ, 2015).
Due to the complexity of the structure of health insurance and different accesses, the research
on how the economic recession has impacted on health care access is still ambiguous (RWJF,
2009). It is difficult, yet extremely important to understand how economic downturns impact
individual access to healthcare. Such an understanding will give us insights into whether
expanding Medicaid was the right choice to address the important policy of expanding healthcare
coverage, especially over economic downturns.
New Contribution
Most studies so far have focused on the healthcare access change over the financial crisis in
European countries. But to date, few studies have evaluated the empirical evidence on whether
a In 2008, pregnant women and infants under age 1 were required to have family incomes at or below 200% of poverty to be qualified for Medicaid. Pregnant women count as 2 (or more) family members. Children age 1 through age 5 (under age 6) were required to have family income at or below 133% of poverty. b The Patient Protection and Affordable Care Act, passed in 2010, would have revised and expanded Medicaid eligibility starting in 2014.

3
individuals’ healthcare access was affected by the economic recession in the U.S. Many
questions remain unanswered such as whether the increase in the uninsured population because
of job loss has led to worsened healthcare access and how much Medicaid has mitigated the
effect; whether people insured and uninsured would have different experiences after the financial
crisis; and whether austerity of expendable resources for each household also contributed to the
deteriorated access to healthcare. Borrowing the pathway model from Arne and Labonté (2012),
I focus on the social determinants of health care access, especially health insurance coverage
change because of the financial crisis, and I use a difference-in-differences model to examine
how the financial crisis impacted health care access.
LITERATURE REVIEW
Most studies so far assessing the impact of financial crisis on healthcare access and healthcare
service utilization have focused on European countries. I review thick literature on European
countries to find some shared trends among all the OECD countries.
For example, Greece is one of the countries most severely hit by the global financial crisis,
and many studies have examined the impact of the crisis, on healthcare demand and the change
of pattern of health delivery changes (Vandoros et al., 2013 & Ifanti et al., 2013). In Greece, the
financial crisis had major impacts on the provision of services in university hospital units in post
crisis times (Simou and Koutsogeorgou, 2014). Further studies provided evidences reductions in
public health expenditures and changes in healthcare services and the pharmaceutical market,
with an increasing number of admissions in the public healthcare sector, and efficiency and
organizational-related issues being evident overall (Simou and Koutsogeorgou, 2014).

4
Kentikelenis and others (2011) did an assessment of consequences on health status, which has
seen a dramatic downward change, including higher suicide rates, higher hospital visits
concerning Otorhinolaryngologic disordersc, a higher epidemic disease infection rate, and lower
scores for self rated health.
Similarly, in Italy, the economic crisis also led to big budget cuts on both the national and
state levels. And the policy response, to adjust the budget for healthcare expenditures, might
have also increased inequalities in access to care. Evidence from Italy also shows that the crisis
is having an impact on the quality of nutrition and psychiatric disorders incidence. Italy also
faced the risk of investment reductions for preventive medicine, evidence based medicine
infrastructure, and health information systems extra (Belvis et al., 2012). Also, the general cut
diluted previous achievements in shortening waiting times, improving the care quality, and
promoting integration between different health facilities. Private investment in the healthcare
industry also shrank dramatically, which had a direct impact on healthcare access initiatives and
sufficient medicine supply (Belvis et al, 2012).
Other studies have done general assessments of the financial crisis’s implications for
healthcare in other countries. Rucket and Labonté (2014) examined the pathways through which
the financial crisis affected health equities in Canada. This finding suggests that government
austerity budgets weakened social programs that address the social redistribution of social and
economic determinants of health outcomes (e.g. housing and social security programs). And after
the financial crisis, the forms of employment changed due to the labor market transformation.
c Otolaryngology is the area of medicine that deals with disorders and conditions of the ear, nose, and throat (ENT) region, and related areas of the head and neck.

5
But the paper concluded that further research is needed to tease out the immediate policy
responses to mitigate the actual effect.
Spain also faced a big government budget cut that potentially may influence the country’s
healthcare utilization in the long run (Gené-Badia et al., 2012). Similarly, a similar study of
Korea experience during the financial crisis of 1997-1998 found that that household consumption
of healthcare was severely adversely hit, and the unemployed were hit hardest (Yang et al.,
2001).
Some other studies focused on the financial crisis’s impacts on certain target populations like
children and pregnant women (Berger et al., 2011; Huang et al., 2011), and results have shown
that there were negative impacts on children’s health across the world, specifically there was an
increase in abusive head trauma. One article concluded that adolescents’ self-rated health was
fairly stable from 2001 through 2004, but worsened afterward. The adjusted percentage of
adolescents reporting excellent or very good health in 2009–2010 (51.8%) was significantly
lower than in 2001–2002 (63.4%) and 2003–2004 (64.0%) (Cui, 2013). Other studies focus on
the negative effects on family nutrition and child abuse during the financial crisis (Bruening. et
al., 2012; Rajmil. et al., 2014).
Most countries with universal health coverage face a similar problem that when government
tax revenues shrink and social security programs are cut, health care access, especially for low-
income families, and health service delivery become problematic. The fundamental problem of
government financed universal health coverage is that without enough financial resources, health
coverage, and all other healthcare system financial support are severely threatened, all of which
cause the individual’s use of medical services become more difficult.

6
After 2010, on the European Union level, policymakers did a wholesale examination of the
situation. They determined that pathways through which the financial crisis influenced the
health system were: 1) The public revenue streams were suddenly interrupted, which made
predicting the necessary finance for levels of care hard, and made pricing even harder; 2) The
public health system actually requires more resources to address the adverse health effects of
unemployment, but cuts to public spending may have decreased health services supply, which
largely worsened the situation; 3) Cuts to services especially necessary services may destabilize
the health system if the financial protection, access to health care, and the quality of care
provided is broken (Mladovsky, 2012).
The U.S. has a very different healthcare system from many other countries and faced a set of
unique challenges to its healthcare system during the financial crisis. Given the complicity of the
U.S. health system, most studies suggest that the economic crisis posed a serious threat to U.S.
healthcare and had disproportionately affected the nation’s most vulnerable groups. But there is
no clear causal relationship established between health outcome and the economic recession.
My research aims to shed light on how U.S. health care access was adversely impacted by the
financial crisis through the channel of loss of employment-based insurances. It provides evidence
for policy makers to design policies to extend health insurance coverage to wider population to
ensure health access no matter what the macroeconomic situation or the individual’s economic
status may be.

7
THEORETICAL FRAMEWORK
What is Healthcare Access?
Many programs have been launched to promote “health care access”, such as Medicaid
expansion, and managed care organization. The term “healthcare access” is broadly used and
defined operationally, but when it comes to research, healthcare access becomes a loose concept
and ill defined (Aday & Anderson, 1974). Access can be defined in terms of health supply,
measured in terms of the facilities and the quantity and quality physicians and nurses. It can also
be measured from the perspective of consumers, usually in terms of units of utilization of
healthcare services, and analyzed in terms of the correlation with health status, healthcare service
needs, and other socio-economic factors. Health policy is another important perspective from
which to analyze healthcare access. In this case, health care access may be closely related to
national budgets and dependent on factors such as tax revenue, regulations on the healthcare
market, and policy changes as for impact of changes on health care access can be used as quasi
experiment
In this paper, I approach health care access from the consumer perspective, and focus on the
individual level, whether there were healthcare access changes caused by the financial crisis
through health insurance coverage changes. I define healthcare access as (1) reported “got care
when needed” and (2) health care service utilization characterized by “outpatient department
physician visits” and “total office-based expenses”. The first indicator is a self-evaluated
indicator. The key point of healthcare access is whether people get into the system. It is always
important to assess the personal evaluation of whether people can enter the health care system
initially. Also utilization of healthcare is easily jeopardized by people’s own holistic perceptions

8
of all factors that may influence their decisions to use healthcare service. People may forgo
healthcare or delay medical service because of other more urgent needs for cash, or time
constraints, which could not be captured accurately by any single indicator. So, I used “got care
when needed” as my first indicator.
The second set of indicators measure service utilization – “outpatient department physician
visits” and “total office-based expenses”. These two indicators refer to two individual aspects of
utilization. “Outpatient department physician utilization” refers to the place where the care is
received, which is intended to capture actual healthcare service that is more elastic and more
related to socioeconomic status. Usually, emergency visits are more inelastic. People without
insurance are more willing to go to emergency rooms because emergency healthcare does not
discriminate patients between with or without insurances. In contrast, going to outpatient
departments is a more accurate assessment of elastic healthcare seeking behaviors.
Healthcare expense is another important indicator. Many researches have pointed out that
growing healthcare cost has become a major barrier for healthcare access. The uninsured often
face unaffordable medical bills when they seek care. And people may forgo healthcare due to
these bills. “Outpatient department physician visits” is used as indicator to show the difference
between elastic healthcare expenses because of healthcare service utilization variances. Higher
expenses are expected to see among insured because they face little out-of-pocket expense and
better household of financial means in general. Compared to insured, I expect to see very small
amount of expenditures among uninsured because of limited resources.
How the Economic Recession Adversely Affect Healthcare Access?
Implicit in the access concept is the idea that certain categories of people have more or less

9
“access” to medical care than others. The underlying characteristics of these categories are
different. Some may be biological; some may be demographic like age, sex or race; and some
may be social enabling factors such as income, education, and health insurance coverage.
Enabling factors are the major factors that I analyze in this research.
The social enabling factors that account for healthcare access were heavily hit by the financial
crisis, and many of these factors limited access to healthcare directly or indirectly. Rucket and
Labontés (2012) builds on a conceptual framework developed to map the various pathways that
link the global financial crisis to health care system, and expands it to analyze the impacts of
global financial crisis on health equity (see figure 1).
Figure 1. Health Equity-relevant Pathways of Global Financial Crisis
Source: Rucket and Labonté, 2012
I base my research on Rucket and Labontés’ model to assess how the global financial crisis
impacted health care access in the U.S. Under the category of direct channels, most of the past
research on Europe and Canada has focused on tax revenue decrease and its impact on national

10
universal health insurance generosity. In contrast, in the United States, even though Medicare is
the largest payer in the market, market forces, like private insurers and other private sector forces
are even stronger. In the United States, compared with Canada and Europe, the channels through
which the financial crisis impacted health care access are more complex, and all pathways in the
end concentrate on each individual’s access to healthcare. So individual level health care access
changes due to the financial crisis is the focus of this research.
In the U.S., the major influence of the financial crisis on health care access is directly
related to change of employment status because of the employment-based health insurance
system of United States, The Bureau of Labor Statistics’ current Population Survey (2015) shows
that the unemployment rate in the United States was 9.5 percent in June 2009, more than double
the rate of 4.6 percent in June 2007. The loss of jobs in the recession reduced US health
coverage.
However, the government Medicaid program may have mitigated the direct effect of
unemployment among adults. Government spending for subsidies for small businesses, and tax
benefits are also ways of helping the affordability of non-group health insurance consumers
during a financial crisis. In the times of financial crisis, there is a huge rise in the federal tax
expenditure for social security programs and the money allocated to Medicaid and Medicare also
rises (Federal Revenue Report, 2014; Kaiser, 2014). This may actually result in an increase of
healthcare access among the Medicaid population.
A channel of indirect influence, the austerity of household financial resources due to the
economic downturn, may also be a key issue. This may have kept patients from seeking inpatient
and elective services. Barriers to affordable access can be the relatively higher cost of healthcare

11
and low income/household means for the uninsured and the lower socioeconomic population. In
the U.S., private payments are required in the form of a fixed fee, which proportional to the total
healthcare cost being later reimbursed to the service user, or payments demanded to certain
threshold. Such cost-sharing arrangements can constitute a barrier to access, especially for
vulnerable populations (Saltman, 2004). For people with chronic diseases, there may also be a
concern about the sustained health cost and the frequent healthcare spending and the household
pressure of other necessary expenses. If payments are restricted to non-emergency care, some
may revert to using emergency units for non-emergency care (Mas et al., 2011). So, I assess the
outpatient department physician visits which would be mostly affected by insurance coverage.
Using this framework, I assess healthcare access from the individual perspective and try to
find how the financial crisis impacted on healthcare access through both direct and indirect
pathways.
HYPOTHESES AND RESEARCH METHOD
Hypothesis In this paper, I aim to answer several specific questions:
(1) How much did insurance coverage influence health service access over the economic
recession? Did the financial crisis worsen healthcare access?
(2) Did insurance coverage have an impact on self-evaluated health care access and health
care utilized?
(3) Were the insured and uninsured population adversely affected by the financial crisis
similarly?

12
My main hypothesis is question (1). I expect to find the financial crisis differentially affected
the uninsured, leaving them with worse health care access after the financial crisis compared to
the insured. To test this hypothesis, I control for many covariates, which arise from assumptions
and previous studies of the determinants of the healthcare access. Many studies have pointed out
that socioeconomic determinants are central to healthcare access (Vega, 2013; Marmot, 2008).
The major socioeconomic determinants previously used in the research are health coverage,
education, income, and gender. Among all the factors, health coverage is considered a major
factor in many national health interview surveys (National Health Interview Surveys, 2005;
National Health Interview Surveys, 2006).
Health insurance coverage is highly relevant in this case, as there were proven job losses. The
adverse effect on the U.S. labor market was prolonged and deep. When the U.S. Department of
Labor released its May jobs report in 2014, and U.S. economy added 200,000 jobs in May, U.S.
employment finally hit the break-even point where it recovered all the job losses over the
financial crisis. It had taken the United States about six years to recover from the economic
recession (CNN, 2014).
If the employment market had been so severely hit by the financial crisis, the natural chain
effect would be the incurred loss of private employment-based health coverage. Kaiser’s analysis
pointed out that the uninsurance rate increased between 2007-2010, resulting in 5.8 million more
working adults without coverage (Kaiser, 2012). This increase in uninsured adults was largely
driven by a decrease in the share of adults with employer-sponsored coverage and an increase in
the number of people living in poverty (Carrier et al., 2011).

13
When, considering people falling through private coverage, some of the adults were covered
by the Medicaid, which is a program to cover the poorest, therefore, the share of newly
uninsured increased slightly compared to losses in the percent of adults with private healthcare
insurance coverage. The change in the proportion of Medicaid population is minor, and the effect
was lagged relative to the financial crisis.
I have no prior expectations regarding what I might find in answer to question (2). Here, I
first investigate whether demand would be affected by the financial crisis. The effect may come
from two directions. First, there may be an increasing demand for healthcare services over the
economic recession. In Europe, there was much research showing that people’s demand for
healthcare service (Mladosvky, 2010). In the U.S., I assume people’s healthcare demand
remained the same or increased. Many pervious studies have pointed out that there was actually
an increase in healthcare service demand because of high pressure and more adoption of
unhealthy behaviors (Karanikolos et al., 2013; Rechel et al., 2011; Dubois, 2015). Second, with
insurance coverage deteriorating, the utilization should be dramatically different between
uninsured and uninsured.
For question (3), I assume that the people at the bottom of the pyramid were hit the most
severely. Individuals below the poverty line are at the highest risk of being uninsured, and this
group accounted for 27% of all the uninsured in 2013 (Kaiser Family Foundation). Indeed, most
of the uninsured are in low-income working families, with constrained budgets and big out-of-
pocket expenses.

14
Methods
For this analysis, I use a multivariate cross-sectional design with the individual person as the
unit of analysis for the national data. I use three access indicators, as described in the previous
discussion, and a difference-in-differences model to see the actual impact of the financial crisis
on my health care access indicators. I control for income, education, employment, Medicaid, sex
and age. The first indicator that I evaluate is the self-assed “got cared when needed”. This
approach calculates the effect of a treatment (insurance coverage) on the health care access
indicators by comparing the average change before and after the financial crisis in the health care
access variable for the group to the average change over time for the control group. “Got care
when needed” variable is an ordered categorical variable – 1 represents never, 2 represents
sometimes, 3 represents usual, and 4 represents always. So for this variable, a higher score
represents better access.
The second variable is the “outpatient department physician visits” which are measured in the
each individual’s total visits each year from 2005 to 2010. The third is “total office-based
expenses”, which is measured in total expenses on each patient for the same period of time.
(1) Got care when needed:
Y(got care when needed) = β0 + β1(post financial crisis)+ β2 (uninsured*post financial crisis)
+ β3(uninsured) +β4(education) +β5(income) +β6(Medicaid) + β7(sex)+ β8 (year) + β9 (control
variables)
(2) Office based Doctor Visits:
Y(visits) = β0 + β1(post financial crisis)+ β2 (uninsured* post financial crisis) + β3(uninsured)
+β4(education) +β5(income) +β6(Medicaid) + β7(sex)+ β8 (year) + β9 (control variables)

15
(3) Expenses:
Y(expenses) = β0 + β1(post financial crisis)+ β2 (uninsured* post financial crisis) +
β3(uninsured) +β4(education)+β5(income) +β6(Medicaid) + β7(sex)+ β8 (year) + β9 (control
variables)
To assess the results, I create one financial crisis variable, post 2007 (2008-2010). The reason
I created this variable is because the labor market did not recover until 2014, which may have
made prolonged impact on healthcare coverage as well.
DATA AND DESCRIPTION OF VARIABLES
I use data from the Medical Expenditure Panel Survey (MEPS), which is a set of large-scale
surveys of families and individuals, their medical providers, and employers across the United
States. MEPS is the most complete source of data on the cost and use of U.S. health care and
health insurance coverage. All the variables that I include in this analysis were MEPS data in the
period of 2005-2010. I limit the time window to 2010 because the ACA was enacted in 2010,
which gave incentives to hospitals to become more efficient and limit the admission of patients.
ACA may also give insurance companies an incentive to shift out high cost patients to
marketplace plans (Shafrin, 2012). So, to avoid the distorted behaviors caused by the big policy
change, my research is only extended to 2010.
To focus on the effect of the financial crisis on adults, I limit the analysis of healthcare
coverage to people aged 20-65, which excludes the Medicare and Children’s Health Insurance
Program age groups. Also, to have a similar underlying population and no other policy
interventions, I limit the time window from 2006-2010. The sample contains 155,984

16
observations, and size of the population is 205, 586,916. The population contains population
from all education levels, income levels and all races and sexes.
Table 1 contains all the variables I use in the difference-in-differences regressions in the later
part. The major variables are the three dependent variables: “got care when needed”, “outpatient
department physician visits” and “total office expenses”, and the independent variable � the
interaction variable of “uninsured*post financial crisis”.
Table 1. Description of Variables Used in the Regression Models
Variable Mean Std. Dev. Min Max
Never got care when needed .0101109 .1000438 0 1
Sometimes got care when needed .1329507 .3395293 0 1
Usually got care when needed .2694722 .4436958 0 1
Always got care when needed .5557678 .4968916 0 1
Outpatient department physician visits .1680606 1.462711 0 156
Total office-based visit expenses 888.9294 3285.518 0 335860
Uninsured .1982066 .3986509 0 1
Post financial crisis .404104 .4907205 0 1
Post financial crisis* Uninsured .0829448 .2758004 0 1
Employed .7987514 .4009356 0 1
Covered by Medicaid .0659945 .2482739 0 1
Had less than 12 years of education .1404108 .3474147 0 1
Had 12 years of education .3133658 .4638643 0 1
Had 17 years of education .4359966 .4958894 0 1

17
Had 17 years of education .1102268 .313174 0 1
Income 40168.71 38430.5 0 1
White .7358704 .4408711 0 1
Black |.1178837 1.3224721 0 1
Hispanic .1462459 .3533546 0 1
age 41.42024 12.58476 20 64
sex 1.506986 .499954 1 2
Source: MEPS data
Table 2 is the trend of the insurance coverage situation over the period before, during and
after financial crisis. I expect that the uninsured population increased over the financial crisis
because of the employment market withering. As seen from Table 2, the uninsured adults
increased from 2007 onwards, and increased from 18.85% in year 2005 to 20.92% in year 2009.
Going from 18.85% to 20.92% means millions of people became uninsured, and some of those
were not qualified for other social protection programs, which made overall healthcare access
even worse.
The percentage of people on Medicaid increased significantly after the recession, mainly
because of the weak economy and loss of jobs, and declining family incomes. In year 2007, the
number of people who were covered by Medicaid increased and afterwards the trend kept
increasing. Even though Medicaid’s overall increase may have offset some of the loss of
employment coverage losses over the period, the total number of the newly uninsured
outweighed the number of newly covered by Medicaid.
Table 2. Uninsured or Medicaid 2005-2010 (Percentage of the Total Adult Population) Insured 2005 2006 2007 2008 2009 2010

18
Uninsured 0.1885 0.1939 0.1978 0.2013 0.2092 0.2047 Medicaid 0.0667 0.0612 0.0648 0.0657 0.0714 0.0775 Total 17941 18169 18293 18349 18544 18649 Source: MEPS data
The dependent variable used as the major indicator is “self-evaluated got care when needed”,
divided into four categories: “never”, “sometimes”, and “usually” to “always”. The 1994 RWJF
National Access to Care Survey (1997) found that fewer than fifteen million Americans believed
that they had not obtained all of the medical care they needed (Berk, 1997), which makes me
believe that self-evaluated health access may be problematic for many people.
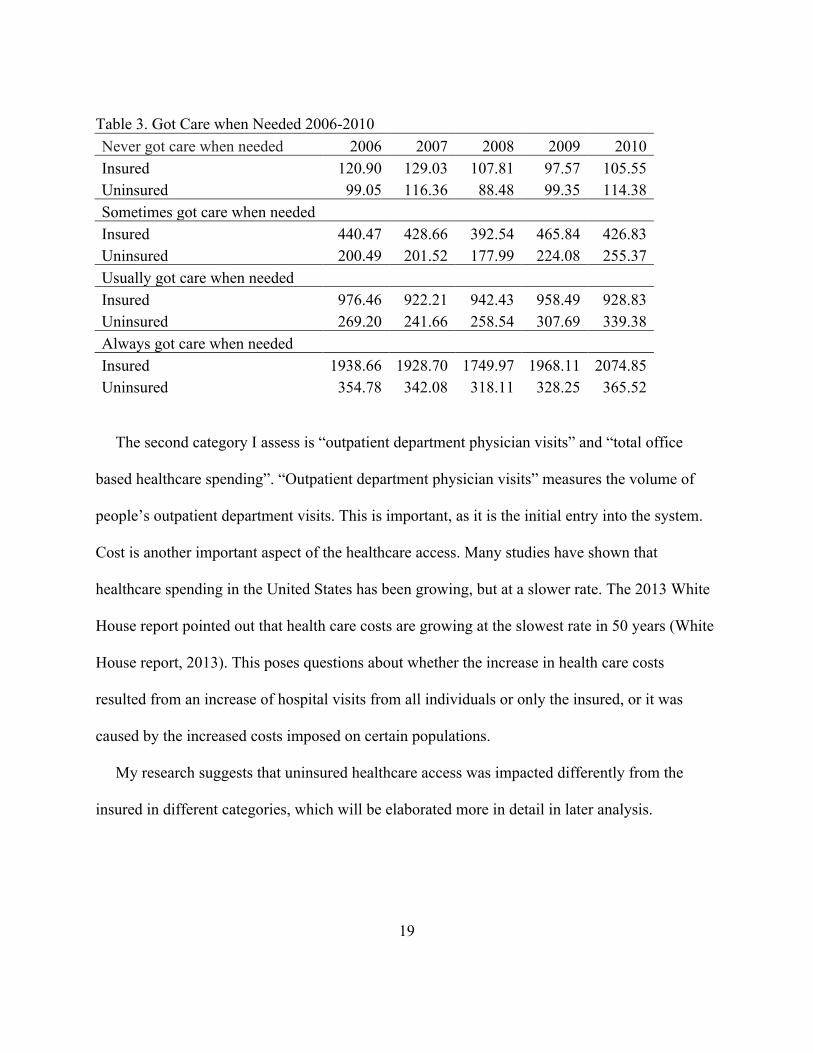
Table 3 shows how people categorized themselves with the trend from 2006 to 2010 listed
separately between insured and uninsured. From Table 3, we can see that among the insured,
over 50% of the people who reported that they always got care when they needed, but there were
still 39% of the people who reported that hey could not always get care. The number of people
who reported that they “never got care when needed” increased, while all the other three
categories representing better healthcare accesses all decreased. The trend reversed from 2008-
2009, the worst healthcare access category decreased, wile all the three other categories had a
significant growth. For the uninsured population, the trend for the category of “never got
healthcare when needed”, “sometime got healthcare when needed”, and “always got care when
needed” dwindled in 2008, and bounced back in 2009. The loss of the population in these
categories was soaked up by category three “usually got care when needed”.
These trends reflect the interaction of many factors impacted by the financial crisis, such as
an individual’s self-evaluation of their own healthcare expenses, and their insurance coverage
situation, either uninsured or newly covered by Medicaid.
19
Table 3. Got Care when Needed 2006-2010 Never got care when needed 2006 2007 2008 2009 2010 Insured 120.90 129.03 107.81 97.57 105.55 Uninsured 99.05 116.36 88.48 99.35 114.38 Sometimes got care when needed
Insured 440.47 428.66 392.54 465.84 426.83 Uninsured 200.49 201.52 177.99 224.08 255.37 Usually got care when needed
Insured 976.46 922.21 942.43 958.49 928.83 Uninsured 269.20 241.66 258.54 307.69 339.38 Always got care when needed
Insured 1938.66 1928.70 1749.97 1968.11 2074.85 Uninsured 354.78 342.08 318.11 328.25 365.52
The second category I assess is “outpatient department physician visits” and “total office
based healthcare spending”. “Outpatient department physician visits” measures the volume of
people’s outpatient department visits. This is important, as it is the initial entry into the system.
Cost is another important aspect of the healthcare access. Many studies have shown that
healthcare spending in the United States has been growing, but at a slower rate. The 2013 White
House report pointed out that health care costs are growing at the slowest rate in 50 years (White
House report, 2013). This poses questions about whether the increase in health care costs
resulted from an increase of hospital visits from all individuals or only the insured, or it was
caused by the increased costs imposed on certain populations.
My research suggests that uninsured healthcare access was impacted differently from the
insured in different categories, which will be elaborated more in detail in later analysis.

20
RESULTS AND DISCUSSION
Got care when needed
I analyze “Got Care when needed” as the first dependent variable in the difference-in-
differences model, and use odds ratio that represents the odds on that how healthcare access will
occur given the special circumstances of the financial crisis, compared to the odds of the “got
care when needed” occurring in the absence of the financial crisis. I control the socioeconomic
static factors: education, employment, income, race, age and sex, and focus on the major factor –
insurance change caused by financial crisis. The model I use is the difference-in-differences logit
model, and the odds-ratios and coefficients are presented below in Table 5. The newly uninsured
post the financial crisis had a significant decrease post the financial crisis (p<0.1). the financial
crisis had a statistically significant adverse impact on the dependent variable as well.
Table 4. Ordered Logit Estimates for the Impact of the Crisis on “Getting Care When Needed”
Variables Odds-Ratios Coefficients
Uninsured 0.486 (10.41)**
-0.375*** (0.0329)
Post financial crisis
1.076 (1.84)
0.0292* (0.0163)
Post financial crisis* uninsured
0.821 (2.22)*
-0.0781* (0.0434)
Employed 0.955 (1.08)
-0.0166 (0.0186)
Medicaid 0.751 (5.28)**
-0.133*** (0.0250)
12 years of education
1.157 (3.01)**
0.0687*** (0.0222)
13-17 years of education
1.341 (5.99)**
0.114*** (0.0218)
17 years of 1.259 0.0857***

21
Observations 27082
t statistics in parentheses *significant at 10%; ** significant at 5%; *** significant at 1%.
Table 5. Post Estimation Probabilities
Mean Std. Dev. Min Max Insured Before the Financial Crisis
never 0.035499 0.0099683 0 .0084527 0.0819762 sometime 0.1204025 0.0278311 0.0329712 0.2296333 usual 0.2641819 0.0319663 0.106223 0.3330873 always 0.5799166 0.0692105 0.3553032 0.8523532 Insured Post financial crisis
never 0.0330801 0.0093155 0.0078601 0.0766275 sometime 0.113516 0.0266485 0.0307497 0.219483 usual 0.2560908 0.0328349 0.1000506 0.3316276 always 0.5973132 0.3722619 0.0683233 0.8613396 Uninsured Before the Financial Crisis
never 0.0701593 0.018905 0.0172256 0.1551202 sometime 0.203136 0.0377661 0.0643752 0.3269361 usual 0.3215137 0.0153352 0.1810225 0.3338043 always 0.405191 0.0690815 0.2113831 0.7373767 Uninsured Post financial crisis
never 0.0786217 0.0209703 0.0194504 0.1720371 sometime 0.2194962 0.0387063 0.0719166 0.3409425 usual 0.3255607 0.0121159 0.1959107 0.3338043 always 0.3763213 0.0674643 0.1914921 0.7127222
education (3.08)** (0.0305) Income
1.000 (6.75)**
1.76e-06*** (2.24e-07)
Black 0.927 (1.75)
-0.0472** (0.0183)
Hispanic 0.816 (4.56)**
-0.0903*** (0.0218)
Age 20-29 0.991 (0.16)
-0.00254 (0.0240)
Age 30-39 0.954 (0.86)
-0.00950 (0.0233)
Age 40-49 1.115 (2.05)*
0.0519** (0.0222)
Age 50-59 1.115 (2.05)*
0.0519** (0.0222)
Age 60-65 1.557 (5.42)**
0.175*** (0.0320)
sex
1.097 (2.92)**
0.0533*** (0.0132)

22
Table 5 lists the post estimation results, and gives more information about the actual change
of different categories. The biggest changes happen in category four of “always” when the
insured population actually gain more access by a 2% [ (0.59-0.57)/0.57] probability over the
financial crisis. But, for the uninsured, the category four probabilities deteriorated by 7%
[(0.405-.376)/0.405], which is a bigger decrease in percentage than the increase for the insured.
This suggests that health insurance made a huge difference for people’s experiences of
healthcare access over the financial crisis. And, based on the data above, people did find it harder
to access healthcare during the economic hardship. Employment based health insurance and
Medicaid did not provide enough protection for people from falling through the system. People
without insurance found it much harder than before to always get healthcare when needed. That
happened because health providers could choose to not provide care to the uninsured. Only
emergency departments were required by federal law to screen and stabilize all individuals. If the
uninsured found themselves unable to pay for care in full, they were often turned away after they
had been treated in emergency rooms (Asplin, 2005).
The fact that insured found healthcare access improved during the financial crisis proved
health insurance could be a social protection mechanism. Both the employment- based-health
insurance and Medicaid gives people confidence of having health care service access, and people
could allocate household budgets to non-healthcare service expenses. The insured population
may also found the relative price of healthcare services cheaper because of low out-of-pocket
expenses. However, on the other side, most of the uninsured faced higher out-of-pocket
expenses, which put extra pressure on many other household expenses. People without insurance
23
found healthcare cost becoming a major barrier to healthcare access given this extremely
constrained budget over the financial crisis.
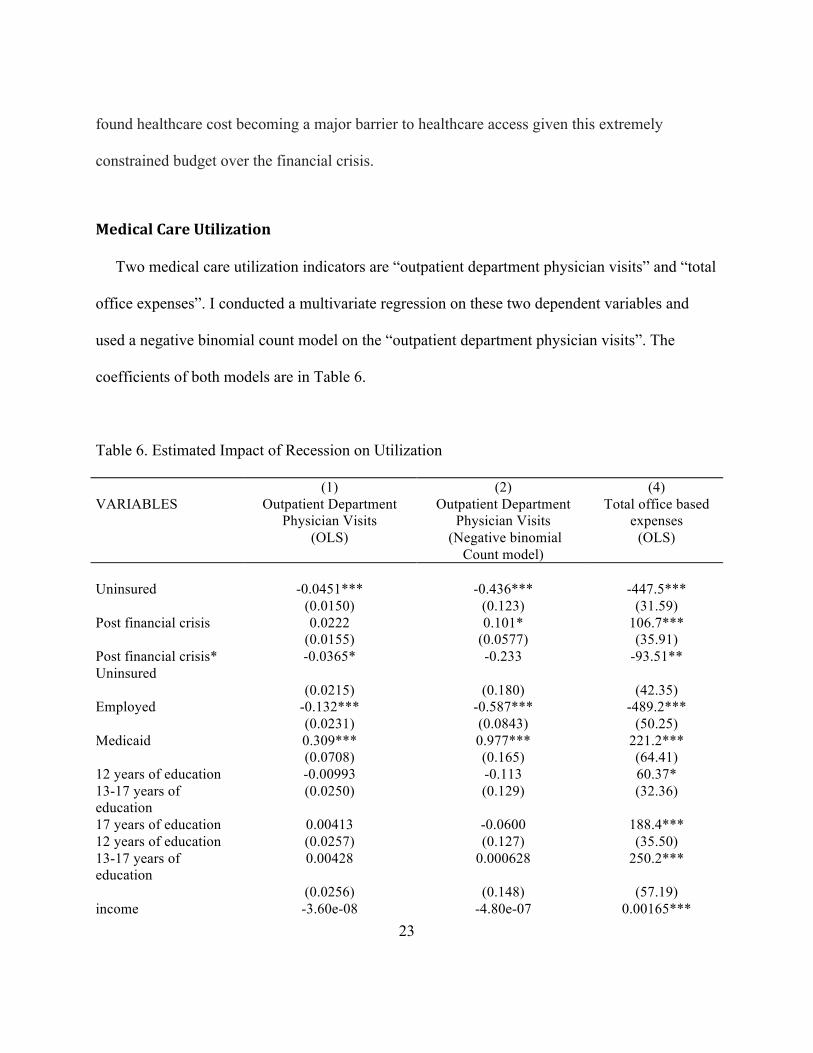
Medical Care Utilization
Two medical care utilization indicators are “outpatient department physician visits” and “total
office expenses”. I conducted a multivariate regression on these two dependent variables and
used a negative binomial count model on the “outpatient department physician visits”. The
coefficients of both models are in Table 6.
Table 6. Estimated Impact of Recession on Utilization
(1) (2) (4) VARIABLES Outpatient Department
Physician Visits (OLS)
Outpatient Department Physician Visits
(Negative binomial Count model)
Total office based expenses
(OLS)
Uninsured -0.0451*** -0.436*** -447.5*** (0.0150) (0.123) (31.59) Post financial crisis 0.0222 0.101* 106.7*** (0.0155) (0.0577) (35.91) Post financial crisis* Uninsured
-0.0365* -0.233 -93.51**
(0.0215) (0.180) (42.35) Employed -0.132*** -0.587*** -489.2*** (0.0231) (0.0843) (50.25) Medicaid 0.309*** 0.977*** 221.2*** (0.0708) (0.165) (64.41) 12 years of education -0.00993 -0.113 60.37* 13-17 years of education
(0.0250) (0.129) (32.36)
17 years of education 0.00413 -0.0600 188.4*** 12 years of education (0.0257) (0.127) (35.50) 13-17 years of education
0.00428 0.000628 250.2***
(0.0256) (0.148) (57.19) income -3.60e-08 -4.80e-07 0.00165***

24
(1.15e-07) (6.49e-07) (0.000540) Black 0.0551* 0.141 -124.6** (0.0282) (0.0974) (48.91) Hispanic -0.0469*** -0.381*** -163.7*** (0.0128) (0.0875) (23.95) Age 30-39 0.0598*** 0.496*** 156.1*** (0.0195) (0.124) (29.05) Age 40-49 0.0947*** 0.749*** 281.8*** (0.0151) (0.102) (30.22) Age 50-59 0.147*** 1.046*** 699.0*** (0.0163) (0.103) (40.89) Age 60-65 0.266*** 1.351*** 1,047*** (0.0469) (0.142) (108.8) sex 0.00758 0.176*** 378.4*** (0.0121) (0.0522) (30.68) Constant 0.158*** -2.344*** 249.9*** (0.0363) (0.188) (66.03)
Standard errors in parentheses *** p<0.01, ** p<0.05, * p<0.1
From Table 6, there was a significant increase of outpatient department physician visits after
the financial crisis, but the difference in the impact of financial crisis between the insured and
uninsured is significant in the linear count model, while not significant in the negative binomial
count model. In both cases these is a decline in per person physician visits post-recession for the
uninsured compared to the insured. With the stable health care needs, the healthcare service
access may change over the financial crisis, but peoples’ outpatient department physician visits
had not changed much especially among the newly-insured (Kentikelenis, 2011 & Mladovsky,
2012). The insurance situation over the financial crisis was not a significant factor impacting
outpatient department physician visits. But, when people’s health status change, the adverse
impact may be more obvious in the long run.
The impact of the financial crisis on total office-based expenses differed significantly
between the insured and uninsured gave me a lot of insights into the situation. The insured spend
447.5 more dollars on total office-based visits than the uninsured on average. Combined with the

25
results of the outpatients’ visits, that for the uninsured variable, uninsured used significantly less
health care service. The total expenses were less for uninsured majorly resulted from less
utilization. However, post financial crisis, total office-based visits spending bumped up by 106.7
dollars (p<0.01), consistent with the general trend of healthcare spending increasing overtime.
The general trend of total-office based expenses growing posed more access barriers to the
uninsured. Combining the two factors together, the uninsured post financial crisis spent 93.51
dollars less than before the financial crisis. The uninsured consumed much less health care
service than the insured initially, and shrank this health care utilization due to the higher total-
office expenses. Healthcare access worsened for the uninsured over the financial crisis.
With the information from Table 6, to understand the difference between the uninsured and
uninsured populations on “total-office based expenses”, I calculated the means of total office
based expenses in dollars in Table 7. On both insured and uninsured, there was a significant
increase from 2005 to 2009; for the insured, the percentage of increase is around 35 percent
based on 2005 level; for the uninsured, the increase was 10.5 percent. So, the cost inflating is
more concentrated on the insured, but the uninsured may be the victim of the total expense
thriving. And uninsured had higher risk of loosing the health access because the uninsured are
mainly lower income families, who faced more limit budgets.
Table 7. Means of Total Office-based Expenses Mean 2005 2006 2007 2008 2009
Insured $870 $965 $1105 $1024 $1182
Uninsured $31 $278 $294 $357 $344

26
Discussion
Health insurance coverage was only one of the ways that the financial crisis impacted health
access adversely, but this analysis did show us that the employment based health insurance
system could not protect people from falling through the health system over the economic
downturn. And Medicaid played the role of safety net for some newly uninsured, but many more
still lost their insurance and become uninsured through the financial crisis. Uninsured people
found it harder to always get care when needed, especially. In comparison, the insured found
“always got care when needed” improved, which indicated that health insurance coverage is
social protection that gave people certain degree of confidence to consume health access. Also,
there was significant before-and-after change between the outpatient department physician visits
among the uninsured population. Moreover, over the financial crisis, there was a general bump in
total office based expenses; mainly concentrated on the insured population, but it has pumped up
the general cost, which further impeded the access to healthcare to the uninsured. Mainly due to
much less utilization, uninsured had significant less spending on total office-based spending after
the financial crisis.
My analysis does conclude that the financial crisis widened healthcare access disparities
between insured and uninsured over the financial crisis.
LIMITATIONS
Perhaps the greatest limitation of this study is that health insurance coverage was not the only
channel through which financial crisis affected healthcare access. On the supply side, health
delivery was affected by the financial crisis directly as well. Medical professionals’ working

27
hours and quality of the medical service went down during the financial crisis from the evidence
of some studies on the Greek health system over the financial crisis, but this fact was not
included in my model. On the demand side, no data on the household assets over the financial
crisis was included in the model, that household financial capacity could be an important
influencer to the health care utilization decisions. Other unobserved changes affected by the
financial crisis which could have changed the result that I observed were not included in the
model either, including household housing situation, number of people in one household, and
familiarity to the health care system. And also the insurance types and quality were not observed
in the model, which could also swing the result.
Another concern is that all the variables that I have used in my model are correlated to some
extent, and I cannot tease out the covariates between the independent variables. The economic
downturn had a huge impact on household income, social security and health seeking behaviors
at the same time, and employment based health insurance change was not the only aspect
affected. It was hard to establish the casual relationship between the financial crisis and the
health access through health insurance change directly.
In addition to the limitations already discussed, another important aspect of f the financial
crisis is how one sub-population was hit more severely than others. This economic downturn’s
specific impact on certain vulnerable population is worth more attention from policy makers, but
it is not assessed in the research. Lower income families and the chronic disease patients may
have already been seeing difficulties getting care. Economic recession may add an extra layer of
difficulty in all aspects of their lives that makes accessing care extremely hard.
28
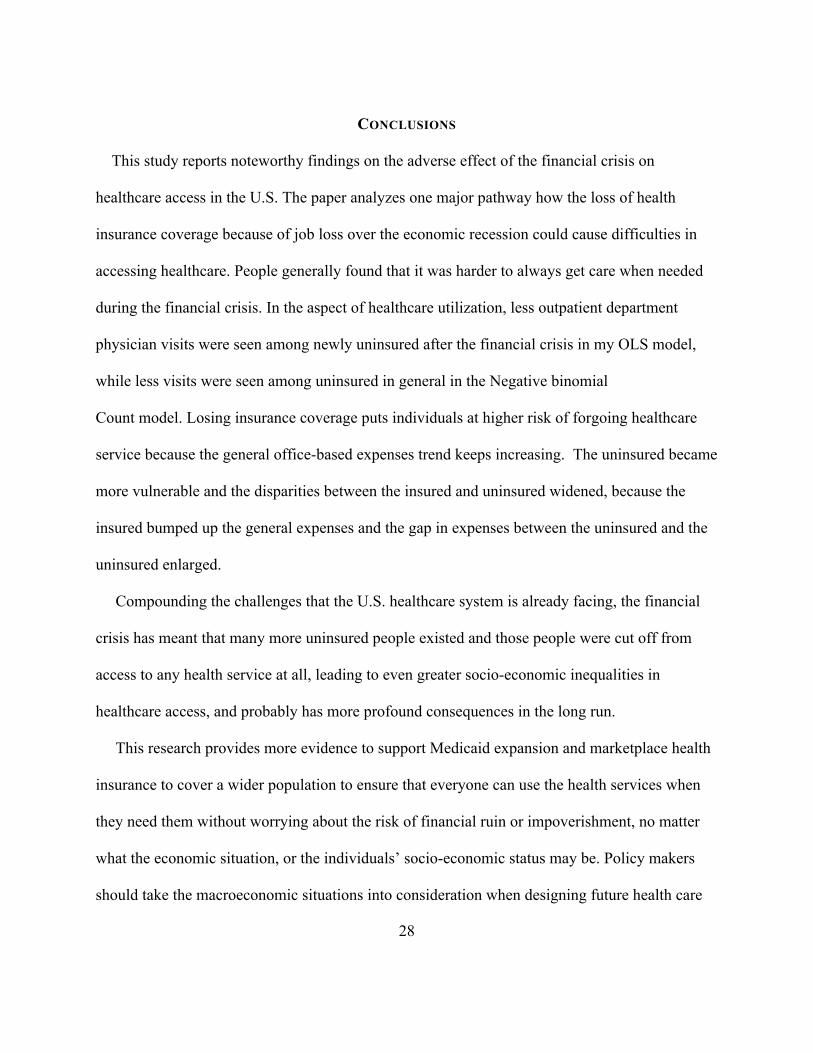
CONCLUSIONS
This study reports noteworthy findings on the adverse effect of the financial crisis on
healthcare access in the U.S. The paper analyzes one major pathway how the loss of health
insurance coverage because of job loss over the economic recession could cause difficulties in
accessing healthcare. People generally found that it was harder to always get care when needed
during the financial crisis. In the aspect of healthcare utilization, less outpatient department
physician visits were seen among newly uninsured after the financial crisis in my OLS model,
while less visits were seen among uninsured in general in the Negative binomial
Count model. Losing insurance coverage puts individuals at higher risk of forgoing healthcare
service because the general office-based expenses trend keeps increasing. The uninsured became
more vulnerable and the disparities between the insured and uninsured widened, because the
insured bumped up the general expenses and the gap in expenses between the uninsured and the
uninsured enlarged.
Compounding the challenges that the U.S. healthcare system is already facing, the financial
crisis has meant that many more uninsured people existed and those people were cut off from
access to any health service at all, leading to even greater socio-economic inequalities in
healthcare access, and probably has more profound consequences in the long run.
This research provides more evidence to support Medicaid expansion and marketplace health
insurance to cover a wider population to ensure that everyone can use the health services when
they need them without worrying about the risk of financial ruin or impoverishment, no matter
what the economic situation, or the individuals’ socio-economic status may be. Policy makers
should take the macroeconomic situations into consideration when designing future health care

29
policies. Employment-based health insurance coverage system solely leaves out many people of
the healthcare system. Policy makers should try to extend sufficient coverage to all people,
especially to those who are at higher risk of loosing health care insurance coverage and those
with lower expendable budgets.
BIBLIOGRAPHY
Aday, L., & Andersen, R. (1974). A Framework for the Study of Access to Medical Care.
Retrieved April 6, 2015, from http://www.ncbi.nlm.nih.gov/pmc/articles/PMC1071804/
Altman, Drew. "Why Low Growth in Health Costs Still Stings." Washington Wire RSS. Wall
Street Journal, 8 Apr. 2015. Web. 10 Apr. 2015.
Asplin, B. R. "Insurance Status and Access to Urgent Ambulatory Care Follow-up
Appointments." JAMA: The Journal of the American Medical Association (2005): 1248-
254. Print.
Berk, M., & Schur, C. (1998). Measuring Access to Care: Improving Information for
Policymakers. Health Affairs, 180-186.
Belvis, A., Ferrè, F., Specchia, M., Valerio, L., Fattore, G., & Ricciardi, W. (n.d.). The Financial
Crisis in Italy: Implications for the Healthcare Sector. Health Policy, 10-16.
Berger, R., Fromkin, J., Stutz, H., Makoroff, K., Scribano, P., Feldman, K., Fabio, A. (2011).
Abusive Head Trauma during a Time of Increased Unemployment: A Multicenter
Analysis. Pediatrics, 637-643.

30
Berk, M., & Schur, C. (1998). Measuring Access to Care: Improving Information for
Policymakers. Health Affairs, 180-186.
Berk, M., & Schur, C. (1997). A Review of the National Access-to-Care Surveys. Retrieved
April 7, 2015.
Bruening, M., Neumark-Sztainer, D., Loth, K., Maclehose, R., & Story, M. (2012). Feeding a
Family in a Recession: Food Insecurity among Minnesota Parents. Journal of the
American Dietetic Association, A100-A100.
Carrier, E., Yee, T., & Garfield, R. (2011, October 1). The Uninsured and Their Health Care
Needs: How Have They Changed Since the Recession? Retrieved April 7, 2015.
Chai, J., Maurer, R., Mitchell, O., & Rogalla, R. (2011, June 1). Lifecycle Impacts of the
Financial and Economic Crisis on Household Optimal Consumption, Portfolio Choice,
and Labor Supply. Retrieved April 6, 2015, from http://www.nber.org/papers/w17134
Cui, W., & Zack, M. (2013). Trends in Health-Related Quality of Life among Adolescents in the
United States, 2001–2010. Preventing Chronic Disease.
Davidson, P. (2014, April 1). Health care spending growth hits 10-year high. Retrieved April 7,
2015.
Dubois, H., & Anderson, R. (n.d.). Impacts of the Crisis on Access to Healthcare Services in the
EU. Retrieved April 6, 2015.
Gené-Badia, Joan, Pedro Gallo, Cristina Hernández-Quevedo, and Sandra García-Armesto.
"Spanish Health Care Cuts: Penny Wise and Pound Foolish?" Health Policy (2012): 23-
28. Print.
Federal Debt, Revenue and Expenditures as a Fraction of GDP. (n.d.). Retrieved April 6, 2015,

31
from http://www.deptofnumbers.com/misc/debt-revenue-and-expenditures-as-a-fraction-
of-gdp/
Huang, M., O'riordan, M., Fitzenrider, E., Mcdavid, L., Cohen, A., & Robinson, S. (n.d.).
Increased Incidence of Nonaccidental Head Trauma in Infants Associated with the
Economic Recession. Journal of Neurosurgery: Pediatrics, 171-176.
Ifanti, Amalia A., Andreas A. Argyriou, Foteini H. Kalofonou, and Haralabos P. Kalofonos.
"Financial Crisis and Austerity Measures in Greece: Their Impact on Health Promotion
Policies and Public Health Care." Health Policy: 8-12. Print.
Impact of the Economy on Health Care. (2009, August 1). Retrieved April 6, 2015, from
http://www.rwjf.org/en/library/research/2009/08/impact-of-the-economy-on-health-care-
.html
Kentikelenis, A., Karanikolos, M., Papanicolas, I., Basu, S., Mckee, M., & Stuckler, D. (2011).
Health Effects of Financial Crisis: Omens of a Greek Tragedy. The Lancet, 1457-1458.
Kurtz, A. (2014, June 1). U.S. Soon to Recover all the Jobs Lost in the Financial Crisis.
Retrieved April 7, 2015.
Latest Publications. (n.d.). Retrieved April 6, 2015.
Lionis, C., Symvoulakis, E., Markaki, A., Vardavas, C., Daniilidou, N., Papadakaki, M., . . .
Souliotis, K. (n.d.). Integrated Primary Health care in Greece, a Missing Issue in the
Current Health Policy Agenda: A Systematic Review. International Journal of
Integrated Care, 9(E88). Retrieved April 6, 2015, from
http://www.ncbi.nlm.nih.gov/pmc/articles/PMC2748181/
Marmot, M., Friel, S., Bell, R., Houweling, T., & Taylor, S. (2008). Closing The Gap In A

32
Generation: Health Equity Through Action On The Social Determinants Of Health. The
Lancet, 372, 1661-1669.
Mas, N., Cirera, L., & Vinolas, G. (2011, November 1). Los sistemas de copago en Europa,
Estados Unidos y Canada: Implicaciones para el caso Espanol. Retrieved April 6, 2015.
Majerol, Melissa, Rache Garfield, and Vann Newkirk. "The Uninsured: A Primer – What Was
Happening to Insurance Coverage Leading up to the ACA? – 7451-10." The Uninsured:
A Primer – What Was Happening to Insurance Coverage Leading up to the ACA? –
7451-10. 13 Jan. 2015. Web. 10 Apr. 2015.
Mladovsky, P., Srivastava, D., Cylus, J., Karanikolos, M., Mckee, M., Evetovits, T., & Thomson,
S. (2012). Health Policy in Financial Crisis. Eurohealth Incorporating Euro Observer,
18(1). Retrieved April 6, 2015.
Mladovsky, P., Srivastava, D., Cylus, J., Karanikolos, M., Evetovits, T., Thomson, S., & McKee,
M. (n.d.). Health Policy Responses to the Financial Crisis in Europe. Retrieved April 7,
2015, from http://www.euro.who.int/__data/assets/pdf_file/0009/170865/e96643.pdf
Pleis JR, Lethbridge-Çejku M. Summary health statistics for U.S. adults: National Health
Interview Survey, 2006. National Center for Health Statistics. Vital Health Stat 10(235).
2007.
The Effect of the Economic Crisis on American Households. (n.d.). Retrieved April 22, 2015,
from http://www.nber.org/bah/2010no3/w16407.html
Rajmil, L., Fernandez de Sanmamed, M., Choonara, I., Faresjö, T., Taylor-Robinson, D., Hjern,
A,. Spencer, N. (2014). Impact of the 2008 Economic and Financial Crisis on Child
Health: A Systematic Review. International Journal of Environmental Research and

33
Public Health, 11, 6529-6546.
Rechel, B. (2011). Migration and Health in the European Union. Maidenhead, Berkshire: Open
University Press.
Rogoff, K., & Reinhart, C. (n.d.). The Aftermath of Financial Crises. Retrieved April 6, 2015,
from http://scholar.harvard.edu/rogoff/publications/aftermath-financial-crises
Ruckert, A., & Labonté, R. (2012). The Global Financial Crisis and Health Equity: Toward a
conceptual framework. Critical Public Health, 267-279.
Ruckert, A., & Labonté, R. (2014). The Global Financial Crisis and Health Equity: Early
Experiences from Canada. Globalization and Health, 2-2.
Rudowitz, R., Snyder, L., Smith, V., Ellis, E., & Gifford, K. (2014, October 14). Implementing
the ACA – Medicaid Spending & Enrollment Growth – Issue Brief – 8640. Retrieved
April 6, 2015, from http://kff.org/report-section/implementing-the-aca-medicaid-
spending-enrollment-growth-issue-brief/
Saltman, R. (2004). Social Health Insurance Systems in Western Europe (Vol. Patterns and
performance in social health insurance systems). Maidenhead, Berkshire, England: Open
University Press.
Schiller, J., Adams, P., & Nelson, Z. (2005). Summary Health Statistics for the U.S. Population:
National Health Interview Survey, 2003. Retrieved April 7, 2015, from
http://europepmc.org/abstract/med/15884478
Simou, Effie, and Eleni Koutsogeorgou. "Effects of the Economic Crisis on Health and
Healthcare in Greece in the Literature from 2009 to 2013: A Systematic Review." Health
Policy (2014): 111-19. Print.

34
Shafrin, J. (2012, February 4). Does Obamacare Limit Profits for Health Insurance Companies in
Your State? | The Health Care Blog. Retrieved April 17, 2015, from
http://thehealthcareblog.com/blog/2012/02/04/does-obamacare-limit-profits-for-health-
insurance-companies-in-your-state/
The Financial Crisis: Five Years After. (2013, September 1). Executive Office of the President.
The Impact of the Financial Crisis on the U.S. Dental Industry. (n.d.). Retrieved April 7, 2015,
from http://www.dentaleconomics.com/articles/print/volume-104/issue-1/features/the-
impact-of-the-financial-crisis-on-the-u-s-dental-industry.html
The Uninsured A Primer - Key Facts about Americans without Health Insurance. (2012, October
1). Retrieved April 7, 2015, from
https://kaiserfamilyfoundation.files.wordpress.com/2013/01/7451-08.pdf
Vandoros, S., P. Hessel, T. Leone, and M. Avendano. "Have Health Trends Worsened in Greece
as a Result of the Financial Crisis? A Quasi-experimental Approach." The European
Journal of Public Health (2013): 727-31. Print.
Vega, J., & Frenz, P. (2013, December 1). Integrating Social Determinants of Health in the
Universal Health Coverage Monitoring Framework. Retrieved April 7, 2015, from
http://www.ncbi.nlm.nih.gov/pubmed/24569977
Villegas, A., & Galewitz, P. (2010, September 16). Uninsured Rate Soars, 50 Million Americans
Without Coverage. Retrieved April 5, 2015.
World Bank: Global Financial Crisis and Implications for Developing Countries. (n.d.).
Retrieved April 6, 2015, from http://www.cfr.org/financial-crises/world-bank-global-
financial-crisis-implications-developing-countries/p18238

35
Yang, B.-M. "The Impact of Economic Crisis on Health-care Consumption in Korea." Health
Policy and Planning (2001): 372-85. Print.