Embed Size (px)
Citation preview
Distr. LIMITED E/ESCWA/EDGD/2009/WP.2 14 March 2009 ORIGINAL: ENGLISH
ECONOMIC AND SOCIAL COMMISSION FOR WESTERN ASIA (ESCWA)
IMPACT OF THE INTERNATIONAL FINANCIAL CRISIS ON ESCWA MEMBER COUNTRIES*
* This paper was prepared within the framework of the ESCWA Initiative on Responding to the International Financial
Crisis.
09-0220
iii
CONTENTS Chapter Page I. INTRODUCTION ............................................................................................................. 1 II. THE ORIGIN AND CONSEQUENCES OF THE CRISIS........................................... 2 III. EFFECTS OF THE CRISIS ON FINANCIAL INSTITUTIONS IN ESCWA MEMBER COUNTRIES.................................................................................................. 5 A. Direct and indirect exposure to subprime losses.......................................................... 5 B. Liquidity needs ............................................................................................................ 5 C. Performance of individual banks and outlook of the banking sector ........................... 6 IV. EFFECT OF THE CRISIS ON FINANCIAL MARKETS IN THE ESCWA REGION............................................................................................................................. 7 A. Financial markets in the GCC countries ...................................................................... 7 B. Non-GCC financial markets ........................................................................................ 11 V. THE MACROECONOMIC EFFECTS OF THE CRISIS ON ESCWA MEMBER COUNTRIES.................................................................................................. 13 A. GCC countries ............................................................................................................. 13 B. Non-GCC countries ..................................................................................................... 16 VI. CONCLUSION AND POLICY RECOMMENDATIONS .............................................. 25 References...................................................................................................................................... 26
LIST OF TABLES
1. Stock price changes (2 January 2007 – 31 December 2008) ............................................... 10 2. Stock price correlation and volatility .................................................................................. 10 3. Performance of GCC stock market in 2008......................................................................... 11 4. Measures taken by GCC countries to ease the effect of the crisis....................................... 15
LIST OF FIGURES 1. Real GDP growth rates........................................................................................................ 2 2. Stock prices: 2 January 2007 = 100..................................................................................... 7 3. Oil revenues of GCC countries ........................................................................................... 14 4. Real GDP growth rates in GCC countries ........................................................................... 17 5. Inflation rates in GCC countries.......................................................................................... 18 6. Fiscal balances of GCC countries........................................................................................ 19 7. Current accounts of GCC countries..................................................................................... 20 8. Real GDP growth rates of non-GCC countries ................................................................... 21 9. Inflation rates of non-GCC countries .................................................................................. 22 10. Fiscal balances of non-GCC countries ................................................................................ 23 11. Current accounts of non-GCC countries ............................................................................. 24

I. INTRODUCTION The current international financial crisis has its roots in the subprime crisis in the United States. The excessive growth of subprime lending occurred because financial institutions offered non-standard mortgages to individuals with dubious credit profiles. The crisis has been described as a “credit crunch” and a “credit squeeze”, two terms that differ only to the extent of the curtailment in credit supply. Regardless of whether the current crisis is best described as a “credit crunch” or “credit squeeze”, one of the key characteristics of the present crisis is that there has been a tangible decline in the terms and availability of credit for consumers and businesses, which has in turn adversely affected consumption and investment spending, thus putting the economies of the United States and other countries around the world in recession. Another characteristic of the crisis has been in financial markets, as financial institutions have been unable to determine the true (or fair) value of assets that are no longer traded in sufficient volumes. This crisis is far more complex than earlier crises because financial innovation has (through securitization) allowed the creation of complex financial instruments, whose risk profiles are difficult to determine and which are therefore difficult to price. Another characteristic of the crisis is the speed with which it spread from the United States to other countries. A major difference between this crisis and the crises of the mid-1970s and early 1980s, which were mainly macroeconomic crises, is that earlier crises were dominated by concerns about inflation, whereas the most important concern in the current crisis is the risk of deflation. The difficult question facing policymakers and observers alike is when and how the crisis will end. What we also know is that the financial markets and economies of emerging countries, including ESCWA member countries, have been affected by the financial crisis, and that the situation is still in flux and that the impact of developments are still unfolding, primarily on the negative side. The objective of this paper is to examine and evaluate the effects of the crisis on ESCWA member countries, specifically the effects on financial markets, financial institutions and economies. This is because institutions, markets and economies are so strongly interlinked that one cannot explain the effect of the crisis on any of them in isolation of the others.
2
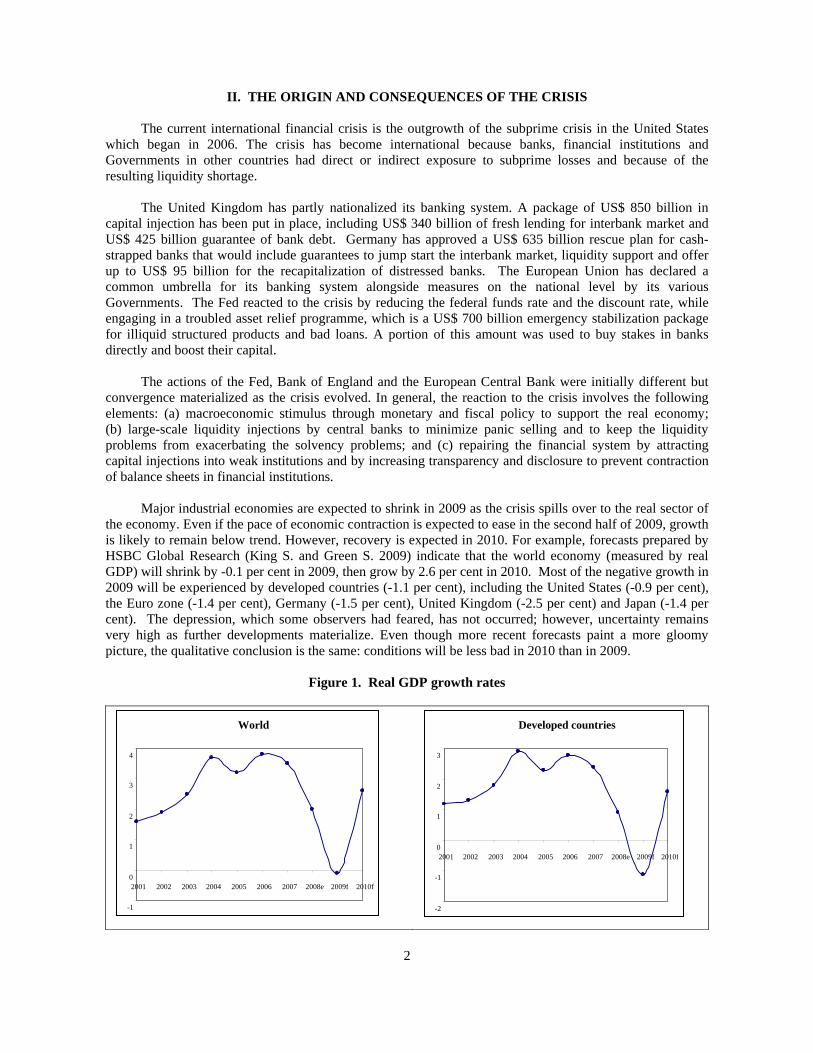
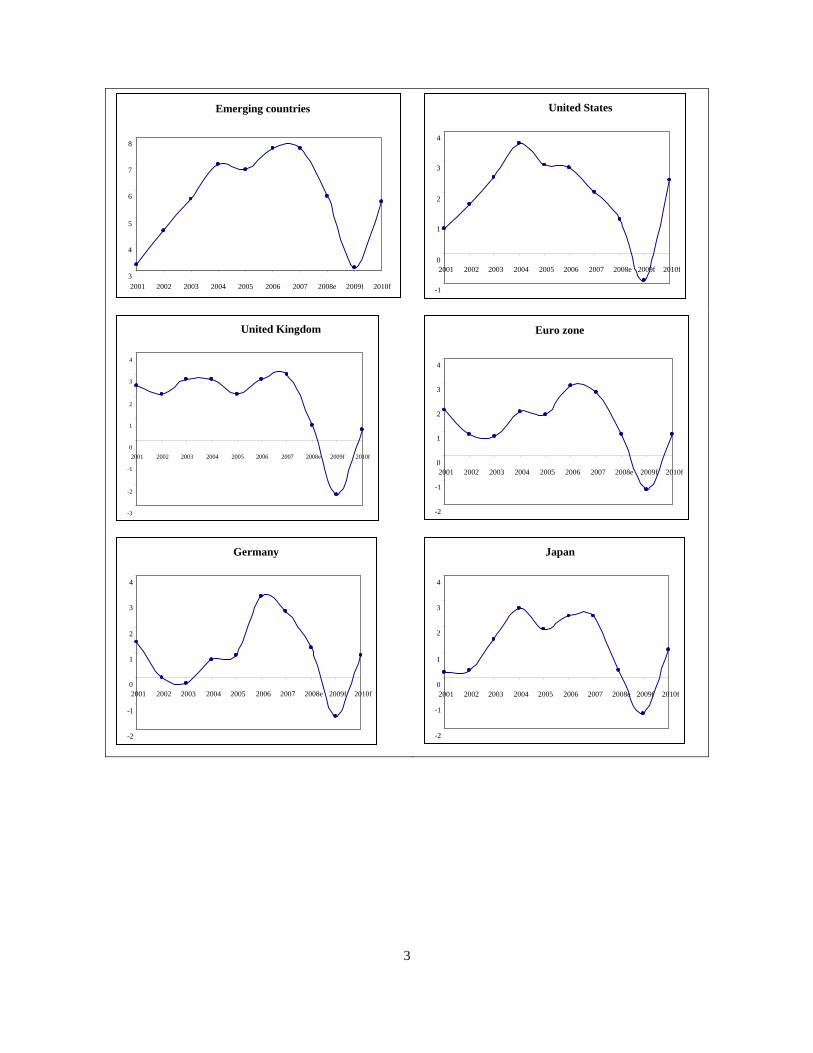
II. THE ORIGIN AND CONSEQUENCES OF THE CRISIS The current international financial crisis is the outgrowth of the subprime crisis in the United States which began in 2006. The crisis has become international because banks, financial institutions and Governments in other countries had direct or indirect exposure to subprime losses and because of the resulting liquidity shortage. The United Kingdom has partly nationalized its banking system. A package of US$ 850 billion in capital injection has been put in place, including US$ 340 billion of fresh lending for interbank market and US$ 425 billion guarantee of bank debt. Germany has approved a US$ 635 billion rescue plan for cash-strapped banks that would include guarantees to jump start the interbank market, liquidity support and offer up to US$ 95 billion for the recapitalization of distressed banks. The European Union has declared a common umbrella for its banking system alongside measures on the national level by its various Governments. The Fed reacted to the crisis by reducing the federal funds rate and the discount rate, while engaging in a troubled asset relief programme, which is a US$ 700 billion emergency stabilization package for illiquid structured products and bad loans. A portion of this amount was used to buy stakes in banks directly and boost their capital. The actions of the Fed, Bank of England and the European Central Bank were initially different but convergence materialized as the crisis evolved. In general, the reaction to the crisis involves the following elements: (a) macroeconomic stimulus through monetary and fiscal policy to support the real economy; (b) large-scale liquidity injections by central banks to minimize panic selling and to keep the liquidity problems from exacerbating the solvency problems; and (c) repairing the financial system by attracting capital injections into weak institutions and by increasing transparency and disclosure to prevent contraction of balance sheets in financial institutions. Major industrial economies are expected to shrink in 2009 as the crisis spills over to the real sector of the economy. Even if the pace of economic contraction is expected to ease in the second half of 2009, growth is likely to remain below trend. However, recovery is expected in 2010. For example, forecasts prepared by HSBC Global Research (King S. and Green S. 2009) indicate that the world economy (measured by real GDP) will shrink by -0.1 per cent in 2009, then grow by 2.6 per cent in 2010. Most of the negative growth in 2009 will be experienced by developed countries (-1.1 per cent), including the United States (-0.9 per cent), the Euro zone (-1.4 per cent), Germany (-1.5 per cent), United Kingdom (-2.5 per cent) and Japan (-1.4 per cent). The depression, which some observers had feared, has not occurred; however, uncertainty remains very high as further developments materialize. Even though more recent forecasts paint a more gloomy picture, the qualitative conclusion is the same: conditions will be less bad in 2010 than in 2009.
Figure 1. Real GDP growth rates
Developed countries
-2
-1
0
1
2
3
2001 2002 2003 2004 2005 2006 2007 2008e 2009f 2010f
World
-1
0
1
2
3
4
2001 2002 2003 2004 2005 2006 2007 2008e 2009f 2010f
3
Emerging countries
3
4
5
6
7
8
2001 2002 2003 2004 2005 2006 2007 2008e 2009f 2010f
United States
-1
0
1
2
3
4
2001 2002 2003 2004 2005 2006 2007 2008e 2009f 2010f
United Kingdom
-3 -2 -1 0 1 2
3 4
2001 2002 2003 2004 2005 2006 2007 2008e 2009f 2010f
Euro zone
-2
-1
0
1
2
3
4
2001 2002 2003 2004 2005 2006 2007 2008e 2009f 2010f
Germany
-2
-1
0
1
2
3
4
2001 2002 2003 2004 2005 2006 2007 2008e 2009f 2010f
Japan
-2
-1
0
1
2
3
4
2001 2002 2003 2004 2005 2006 2007 2008e 2009f 2010f
4
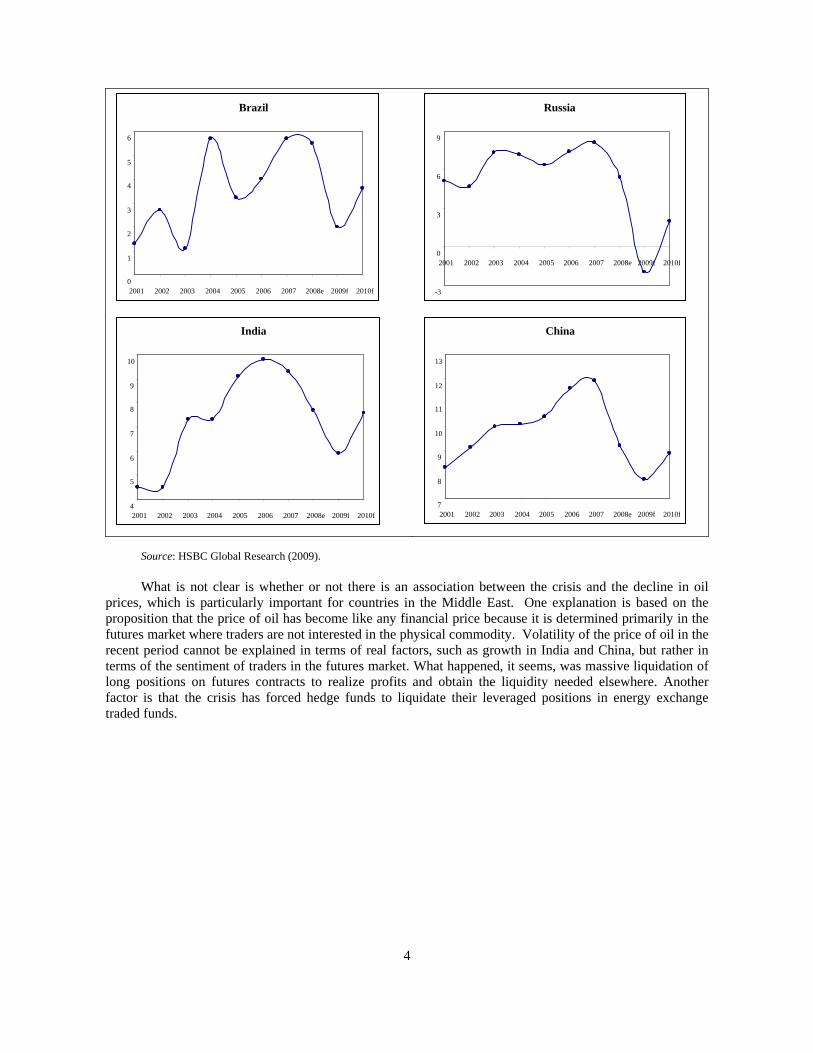
Source: HSBC Global Research (2009). What is not clear is whether or not there is an association between the crisis and the decline in oil prices, which is particularly important for countries in the Middle East. One explanation is based on the proposition that the price of oil has become like any financial price because it is determined primarily in the futures market where traders are not interested in the physical commodity. Volatility of the price of oil in the recent period cannot be explained in terms of real factors, such as growth in India and China, but rather in terms of the sentiment of traders in the futures market. What happened, it seems, was massive liquidation of long positions on futures contracts to realize profits and obtain the liquidity needed elsewhere. Another factor is that the crisis has forced hedge funds to liquidate their leveraged positions in energy exchange traded funds.
Brazil
0
1
2
3
4
5
6
2001 2002 2003 2004 2005 2006 2007 2008e 2009f 2010f
Russia
-3
0
3
6
9
2001 2002 2003 2004 2005 2006 2007 2008e 2009f 2010f
India
4
5
6
7
8
9
10
2001 2002 2003 2004 2005 2006 2007 2008e 2009f 2010f
China
7
8
9
10
11
12
13
2001 2002 2003 2004 2005 2006 2007 2008e 2009f 2010f

5
III. EFFECT OF THE CRISIS ON FINANCIAL INSTITUTIONS IN ESCWA MEMBER COUNTRIES
Financial institutions in ESCWA member countries have been affected by the crisis through: (a) direct exposure to the housing market in the United States, real estate products or collateralized debt obligations (CDOs); (b) exposure to institutions (both as shareholders and creditors) that have had a direct exposure to the housing market in the United States and real estate products; and (c) the effect of the crisis on the liquidity needs of the ESCWA institutions. These effects have been more conspicuous in the Gulf Cooperation Council (GCC) countries than in other countries in the region.
A. DIRECT AND INDIRECT EXPOSURE TO SUBPRIME LOSSES Subprime exposure is concentrated in the GCC countries. By the end of 2008, these countries held foreign assets valued at between US$ 1.8 trillion and US$ 2 trillion, about 60 per cent of these assets were denominated in United States dollars. Only a limited number of banks in the GCC countries have publicly admitted that they have incurred subprime-related losses estimated at US$ 3 billion; some observers, however, estimate that losses could reach US$ 10 billion (Hussain, 2008). The following are examples of exposure to subprime losses: (a) The Central bank of the United Arab Emirates has asked commercial banks in the country to declare their exposure to Lehman Brothers, but no public announcements have been made by the banks. This exposure is believed to have taken the form of bank loans, derivatives trades such as credit default swaps, and structured investments guaranteed by Lehman Brothers; (b) The Abu Dhabi Commercial Bank announced an exposure of US$ 272 million. According to Woertz (2008), the Bank “used Morgan Stanley and other banks in the case of an ill-fated Structured Investment Vehicle (SIV) deal”; (c) The Kuwait Gulf Investment Corporation announced write-downs of US$ 246 million at the end of 2007, and an additional US$ 200 million by the end of 2008; (d) The Gulf International Bank of Bahrain was downgraded by Moody’s because of its material investments in United States residential mortgage-backed securities (RMBS) and structured investment vehicles (SIVs); (e) The Qatar Insurance Company has also been associated with subprime losses; (f) The Arab Banking Corporation of Bahrain announced write-downs of US$ 230 million. The greatest losses from direct and indirect exposure to the subprime market were incurred by sovereign wealth funds (SWFs), such as the Abu Dhabi Investment Authority and the Kuwait Investment Authority (KIA). According to Woertz (2008), these SWFs are sophisticated investors and their exposure to the current market turmoil must be considerable. The probability was high that they invested more money than banks in risky assets, such as CDOs. We have already seen that the KIA injected massive amounts into Merrill Lynch that subsequently lost a substantial part of its value. The unavailability of exact and detailed figures prevents us from saying anything definitive.
B. LIQUIDITY NEEDS Woertz (2008) argues that “while the direct subprime exposure of GCC banks has been limited thus far, the real problem for the GCC banks lies in the direct exposure to increased costs of funding amidst maturity mismatches and credit exposure to local consumers, project and real estate financing”. What makes things worse is that even before the onset of the crisis, there was already a liquidity squeeze resulting from
6
negative real interest rates. Many of the funds that were speculating on the revaluation of local currencies were closed because of the recent strengthening of the dollar against these currencies. Foreign investors began to pull out of GCC markets to rebalance their portfolios and cover losses, leading to the removal of liquidity from the banking system, particularly the subsidiaries of foreign banks. In short, financial institutions in the GCC countries are facing constrained financing conditions and experiencing losses resulting from their exposure to local stock and real estate markets, which have fallen sharply in recent months. According to BMI (2008), the current liquidity crunch in GCC countries is not particularly a result of the global financial crisis, but rather because of the strong demand by a rapidly growing private sector. Furthermore, the Gulf Bank of Kuwait experienced huge losses and a mini run, not because of the crisis or exposure to the stock and real estate markets but rather because of faulty decisions, involving foreign exchange futures contracts. Financial institutions in other ESCWA countries are in a better position due to their greater dependence on domestic funding.
C. PERFORMANCE OF INDIVIDUAL BANKS AND OUTLOOK OF THE BANKING SECTOR If we consider the performance and outlook for individual institutions, we find that the situation varies greatly from one institution to another, and from one country to another. Fitch Risk, for example, has downgraded the stand-alone rating of 18 GCC banks as a result of the financial crisis. While the unavailability of final accounts for the full year prevents us from saying anything definitive, stock prices provide some indication as to the health of GCC banks. For example, the stock price of the Qatar National Bank rose by 17 per cent in December 2008, while the stock price of the Abu Dhabi Commercial Bank lost 33 per cent of its value in the same period. The preliminary 2008 results released by the 10 main commercial banks in Saudi Arabia confirmed that the fourth quarter of 2008 was the worst quarter that they had ever experienced. Nevertheless, these banks remain amongst the highest rated by Fitch in the GCC region. All of the banks reported full-year profit but the National Commercial Bank, Bank Aljazira and the Saudi Investment Bank reported losses in the fourth quarter due mainly to declining values of investment portfolios, including local stocks, international securities and hedge funds. In the United Arab Emirates, the National Bank of Abu Dhabi delivered the highest ever three-quarter result. However, most of these gains were made as a result of booming stock market because 54 per cent of the income was from non-interest sources. The 17 per cent decline in profits from US$ 229 million to US$ 189 million between the second and third quarters of 2008 can be explained by the falling local stock market in the summer of 2008. In general, banks in the United Arab Emirates have been adversely affected by over-exposure to local markets. Banks in Bahrain seem to be in reasonable shape, particularly when compared to banks in the United Arab Emirates; this is probably due to the fact that they have been less exposed to local markets, and because stock markets in Bahrain have not fallen as sharply. The National Bank of Bahrain, for example, posted a profit in 2008, albeit with a smaller profit than in 2007 (US$ 92.39 million as opposed to US$ 110.53 million). The decline in profit is attributed to mark-to-market losses on managed funds portfolios resulting from the sharp decline in stock markets, and the decision to make a 100 per cent provision for investments in the debt securities of institutions affected by the crisis. The Bahraini Saudi Bank announced net profits for 2008 from its core banking business, but provisioning for bad investments resulted in an overall net loss. The outlook for 2009 is not favourable, but it is expected that the current conditions will lead to an environment that is conducive to the emergence of stronger institutions and healthier financial systems. It is expected that there will be a contraction in deposits and loans, and rising numbers of defaults on loans. Banks with the largest exposures to local real estate and stock markets will be the hardest hit. It is also expected that both interest and non-interest income will be affected adversely. It is therefore very likely that the region will experience a wave of consolidation through a series of mergers and acquisitions.
7
IV. EFFECT OF THE CRISIS ON FINANCIAL MARKETS IN THE ESCWA REGION
Again, most of the discussion here centres on the GCC countries where international banks play a major role in the local project finance market. However, a brief discussion of non-GCC stock markets is also presented.
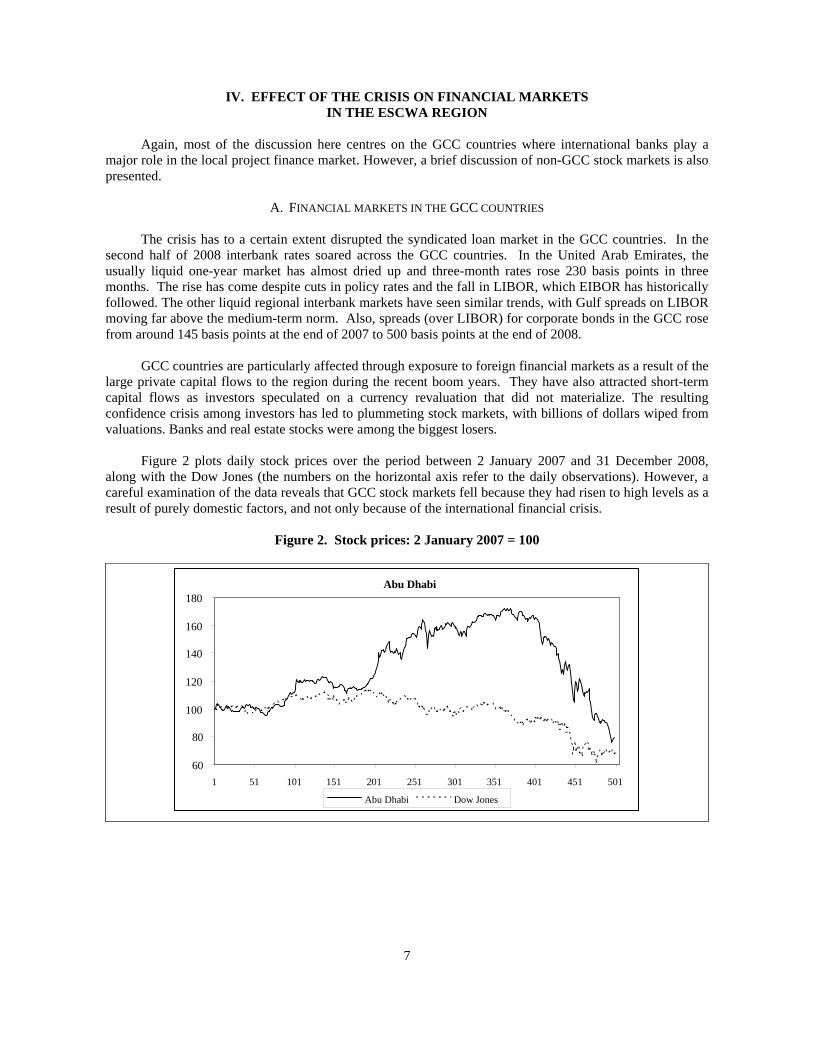
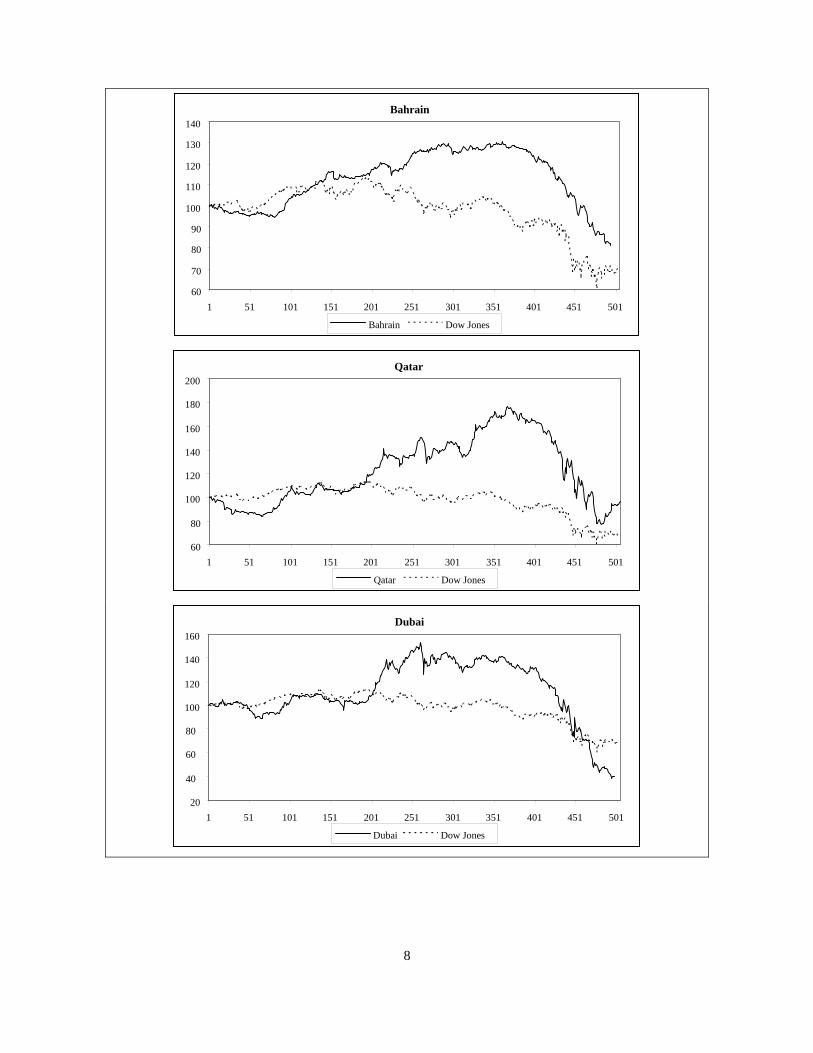
A. FINANCIAL MARKETS IN THE GCC COUNTRIES The crisis has to a certain extent disrupted the syndicated loan market in the GCC countries. In the second half of 2008 interbank rates soared across the GCC countries. In the United Arab Emirates, the usually liquid one-year market has almost dried up and three-month rates rose 230 basis points in three months. The rise has come despite cuts in policy rates and the fall in LIBOR, which EIBOR has historically followed. The other liquid regional interbank markets have seen similar trends, with Gulf spreads on LIBOR moving far above the medium-term norm. Also, spreads (over LIBOR) for corporate bonds in the GCC rose from around 145 basis points at the end of 2007 to 500 basis points at the end of 2008. GCC countries are particularly affected through exposure to foreign financial markets as a result of the large private capital flows to the region during the recent boom years. They have also attracted short-term capital flows as investors speculated on a currency revaluation that did not materialize. The resulting confidence crisis among investors has led to plummeting stock markets, with billions of dollars wiped from valuations. Banks and real estate stocks were among the biggest losers. Figure 2 plots daily stock prices over the period between 2 January 2007 and 31 December 2008, along with the Dow Jones (the numbers on the horizontal axis refer to the daily observations). However, a careful examination of the data reveals that GCC stock markets fell because they had risen to high levels as a result of purely domestic factors, and not only because of the international financial crisis.
Figure 2. Stock prices: 2 January 2007 = 100
Abu Dhabi
60
80
100
120
140
160
180
1 51 101 151 201 251 301 351 401 451 501
Abu Dhabi Dow Jones
8
Bahrain
60
70
80
90
100
110
120
130
140
1 51 101 151 201 251 301 351 401 451 501
Bahrain Dow Jones
Qatar
60
80
100
120
140
160
180
200
1 51 101 151 201 251 301 351 401 451 501
Qatar Dow Jones
Dubai
20
40
60
80
100
120
140
160
1 51 101 151 201 251 301 351 401 451 501
Dubai Dow Jones

9
Source: National Stock Exchanges and Yahoo Finance.
Saudi Arabia
40
60
80
100
120
140
160
1 51 101 151 201 251 301 351 401 451 501
Saudi Arabia Dow Jones
Kuwait
60
80
100
120
140
160
1 51 101 151 201 251 301 351 401 451 501
Kuwait Dow Jones
Oman
60 80 100
120
140
160
180
200
220
1 51 101 151 201 251 301 351 401 451 501
Oman Dow Jones

10
Table 1 presents the changes in stock prices in the seven GCC markets, with the normalized value corresponding to 100 on 2 January 2007. The column “last observation” refers to the price at the end of the sample period. The peak value refers to the highest value of the price and when the value was recorded (month/year). We can see that most markets peaked in June 2008, whereas the Dow reached its peak value in October 2007. Thus, even as the stock market in the United States was declining because of the subprime crisis, the GCC stock markets kept rising. The column “first to peak” refers to the percentage change in stock prices between the first observation and the peak. The stock markets of the GCC countries rose much faster than the United States market, which registered a rise of 13.54 per cent, compared with the Omani market which rose by 115.52 per cent. The last column “peak to last” shows the percentage change in stock prices between the peak and last observation. Apart from Bahrain, GCC markets lost more of their values than markets in the United States, as represented by the Dow. These figures provide a good indication that the GCC markets experienced their own bubbles and crashes.
TABLE 1. STOCK PRICE CHANGES (2 JANUARY 2007 – 31 DECEMBER 2008)
Market First
observation Last
observation Peak value (mm/yy)
First to peak (percentage)
Peak to last (percentage)
Abu Dhabi 100 79.75 171.81 (06/08) 71.81 -53.58 Bahrain 100 81.04 130.39 (06/08) 30.39 -37.84 Dubai 100 39.66 152.52 (01/08) 52.52 -73.99 Kuwait 100 77.84 156.58 (06/08) 56.38 -50.28 Oman 100 96.72 215.25 (06/08) 115.52 -55.06 Qatar 100 91.23 177.33 (06/08) 77.33 -45.46 Saudi Arabia 100 60.26 149.26 (01/08) 49.26 -59.62 Dow Jones 100 70.54 113.54 (10/07) 13.54 -38.04
Source: National Stock Exchanges and Yahoo Finance. Table 2 reports correlations of the GCC markets with the market in the United States. Correlations are not particularly high and differ significantly from one market to another, ranging between zero in the case of Oman and 0.52 for Saudi Arabia and Dubai. Volatility, as measured by the standard deviation of the daily percentage changes in stock prices, also shows significant variation, with some markets being almost three times as volatile as the market in the United States. Again, these figures show that domestic factors, and not the international financial crisis, propelled GCC markets into a bubble and then to a crash.
TABLE 2. STOCK PRICE CORRELATION AND VOLATILITY
Market Correlation with the
United States Standard deviation of daily
percentage changes Abu Dhabi 0.18 1.52 Bahrain 0.34 0.71 Dubai 0.55 2.10 Kuwait 0.34 0.90 Oman 0.00 4.80 Qatar 0.09 1.89 Saudi Arabia 0.52 4.96 Dow Jones 1.00 1.81
Source: National Stock Exchanges and Yahoo Finance. The good news is that by early 2009, it became clear that investors were beginning to make a distinction between various markets and stocks after the indiscriminate sell-off in the second half of 2008. Actually, there was a strong rally in the Qatar stock market towards the end of 2008 that reduced 2008 losses to 28 per cent. The Saudi market also ended the year with a small monthly gain, largely due to positive performance by large-cap petrochemical stocks and the gains made by Saudi Telecom. Table 3 shows the
11
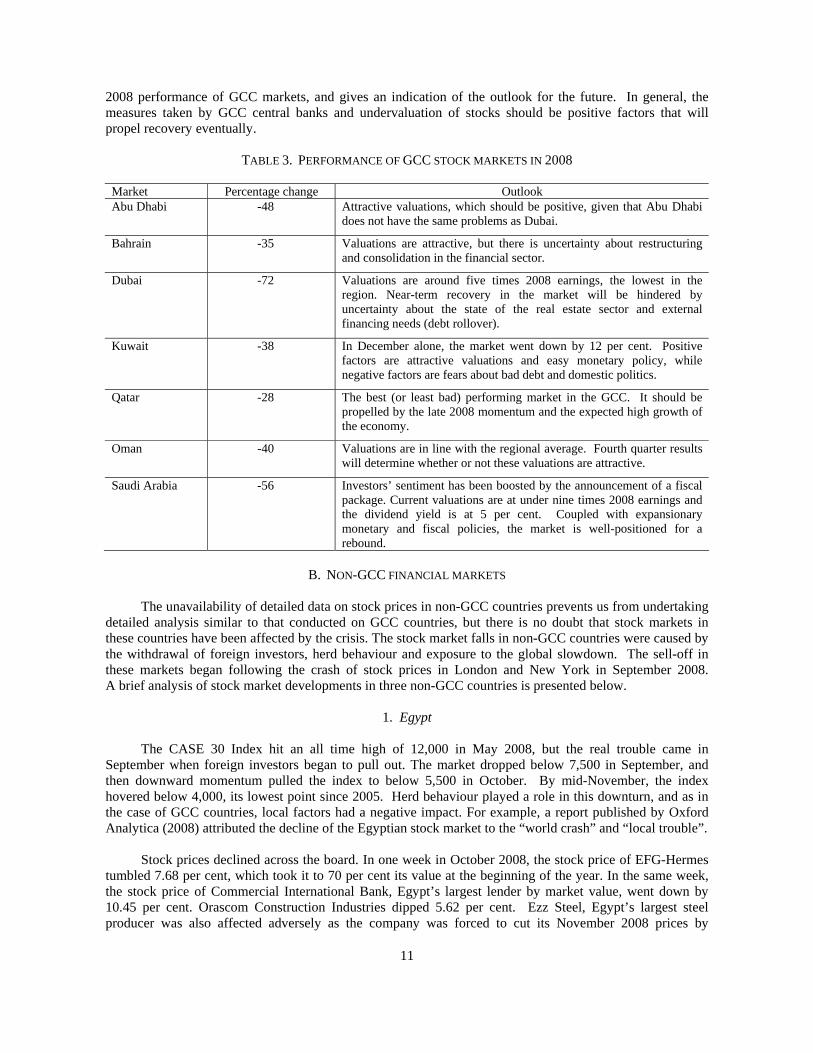
2008 performance of GCC markets, and gives an indication of the outlook for the future. In general, the measures taken by GCC central banks and undervaluation of stocks should be positive factors that will propel recovery eventually.
TABLE 3. PERFORMANCE OF GCC STOCK MARKETS IN 2008
Market Percentage change Outlook Abu Dhabi -48 Attractive valuations, which should be positive, given that Abu Dhabi
does not have the same problems as Dubai.
Bahrain -35 Valuations are attractive, but there is uncertainty about restructuring and consolidation in the financial sector.
Dubai -72 Valuations are around five times 2008 earnings, the lowest in the region. Near-term recovery in the market will be hindered by uncertainty about the state of the real estate sector and external financing needs (debt rollover).
Kuwait -38 In December alone, the market went down by 12 per cent. Positive factors are attractive valuations and easy monetary policy, while negative factors are fears about bad debt and domestic politics.
Qatar -28 The best (or least bad) performing market in the GCC. It should be propelled by the late 2008 momentum and the expected high growth of the economy.
Oman -40 Valuations are in line with the regional average. Fourth quarter results will determine whether or not these valuations are attractive.
Saudi Arabia -56 Investors’ sentiment has been boosted by the announcement of a fiscal package. Current valuations are at under nine times 2008 earnings and the dividend yield is at 5 per cent. Coupled with expansionary monetary and fiscal policies, the market is well-positioned for a rebound.
B. NON-GCC FINANCIAL MARKETS
The unavailability of detailed data on stock prices in non-GCC countries prevents us from undertaking detailed analysis similar to that conducted on GCC countries, but there is no doubt that stock markets in these countries have been affected by the crisis. The stock market falls in non-GCC countries were caused by the withdrawal of foreign investors, herd behaviour and exposure to the global slowdown. The sell-off in these markets began following the crash of stock prices in London and New York in September 2008. A brief analysis of stock market developments in three non-GCC countries is presented below.
1. Egypt The CASE 30 Index hit an all time high of 12,000 in May 2008, but the real trouble came in September when foreign investors began to pull out. The market dropped below 7,500 in September, and then downward momentum pulled the index to below 5,500 in October. By mid-November, the index hovered below 4,000, its lowest point since 2005. Herd behaviour played a role in this downturn, and as in the case of GCC countries, local factors had a negative impact. For example, a report published by Oxford Analytica (2008) attributed the decline of the Egyptian stock market to the “world crash” and “local trouble”. Stock prices declined across the board. In one week in October 2008, the stock price of EFG-Hermes tumbled 7.68 per cent, which took it to 70 per cent its value at the beginning of the year. In the same week, the stock price of Commercial International Bank, Egypt’s largest lender by market value, went down by 10.45 per cent. Orascom Construction Industries dipped 5.62 per cent. Ezz Steel, Egypt’s largest steel producer was also affected adversely as the company was forced to cut its November 2008 prices by
12
30 per cent because the credit crunch and the resulting slowdown forced builders to slash orders. The company was also forced to reduce prices in November 2008 to 3,900 Egyptian pounds per ton, taking it to 40 per cent below the peak price recorded in August. However, driven by very strong performances by Orascom Telecom and Commercial International Bank, the Egyptian stock market rose by 9 per cent in December 2008. This provides some momentum that will be reinforced by declining inflation, which gives the Central Bank some room to implement an expansionary monetary policy by lowering interest rates. Among the other positive factors are attractive valuations and the fiscal stimulus introduced by the Government.
2. Lebanon The story of the Lebanese stock market appears to be similar to that of the Egyptian market. Measured by the Crédit Libanais aggregate stock index (CLASI), the market rose from around 1,100 in January 2008 to reach its peak of over 1,800 in early July the same year. Subsequently, it started its continuous decline to reach the level of 909 at the end of January 2009. In the week between 16 and 23 January 2009, the market lost 2.65 per cent of its value, with the financial sector being the biggest loser. The Crédit Libanais financial sector index lost 3.69 per cent of its value during the week, while the index of the construction sector declined 0.84 per cent. Despite the overall market decline, some individual stocks are still doing well, even in the banking sector. For example, in the week ending 23 January 2009, Byblos Bank preferred shares rose 5.05 per cent, while the BLOM Bank listed share price declined by 10.69 per cent. In that same week, the shares of Holcim Liban rose 9.63 per cent, and there was no trading on a large number of stocks. This may indicate that there was no general sell-off and that confidence is grounded on performance of individual companies, and also possible exposure to the outside world.
3. Jordan As in the case of Lebanon, the Jordanian stock market experienced a general decline but there were still some winners. For example, during the week ending 17 November 2008, the stock price index of the Amman Stock Exchange lost a massive 16 per cent of its value. In the last day alone, the market declined 3.47 per cent, which triggered calls for Government intervention. However, out of the 170 companies whose shares were traded, there were 30 winners. In early March 2009, the market was still declining because of selling pressure on Arab Bank shares and strategic companies in the mining sector. However, it is now expected that the market will rebound as some strategic stocks have reached attractive price levels.
13
V. THE MACROECONOMIC EFFECTS OF THE CRISIS ON ESCWA MEMBER COUNTRIES
In discussing the macroeconomic effects of the crisis we need to distinguish between GCC and non-GCC countries. The economies of GCC countries have been affected by the credit squeeze, indebtedness problems resulting from the collapse of stock and real estate markets, and declining oil prices. Non-GCC countries for their part have been negatively affected by the global recession, and this has lead to reduced demand for exports and difficulties in obtaining finance.
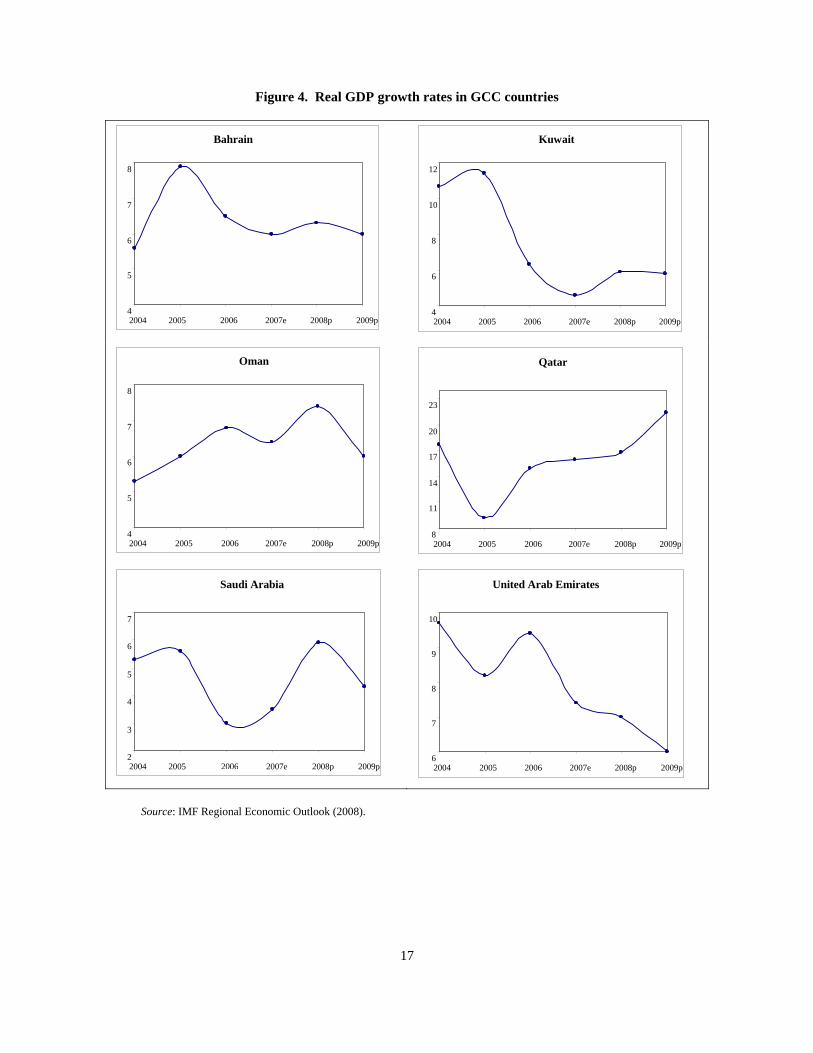
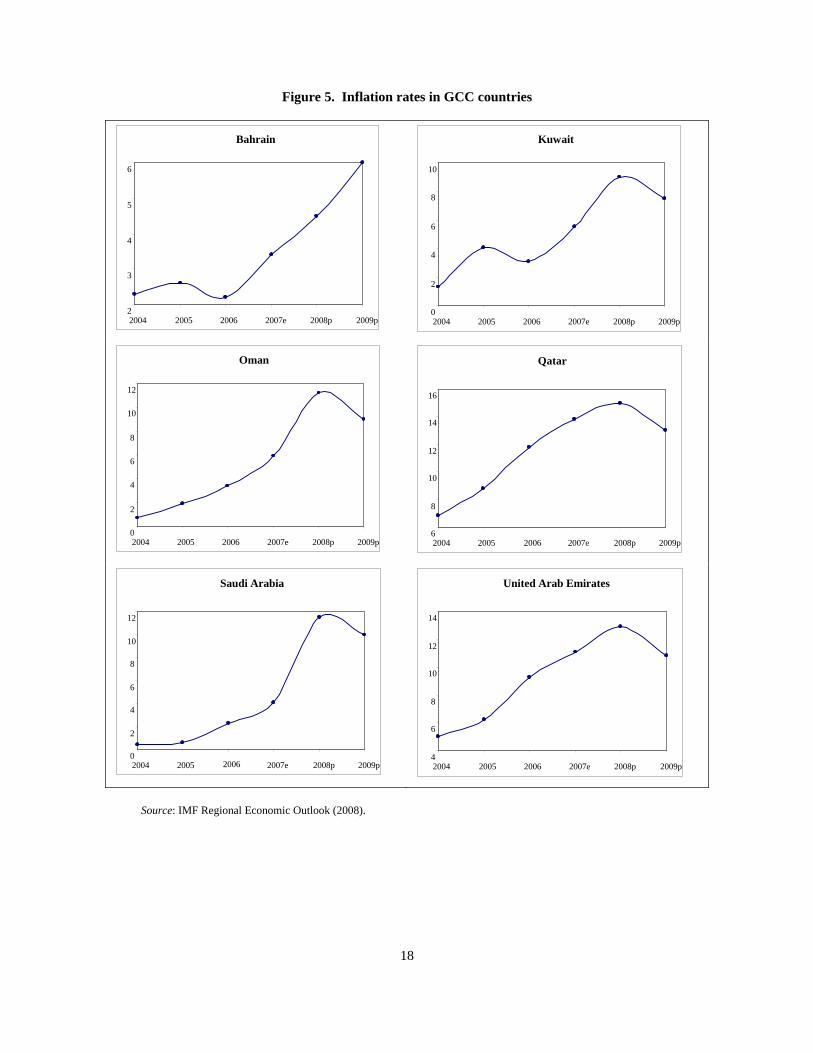
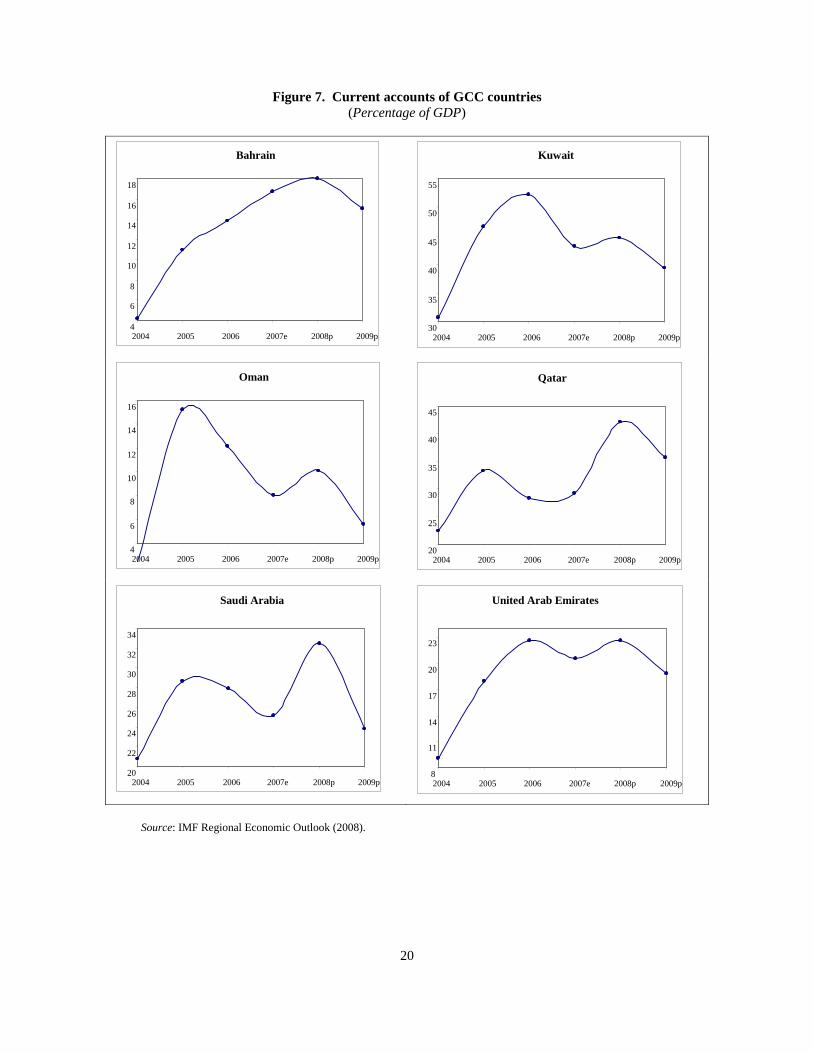
A. GCC COUNTRIES The problems arising from declining oil prices are compounded because: (a) GCC countries will have to cut their oil production as price falls; and (b) non-oil growth will be affected. The demand for other products, such as petrochemicals and aluminium, will also be affected. However, the demand for oil is not elastic in the short term and oil prices should rebound as the effect of the crisis gradually ease, the GCC economies should rebound following an insignificant slowdown in 2009. All of the published research shows that this is the case, for example: (a) Forecasts by the Middle East Monitor (2008) show that real gross domestic product (GDP) growth in the GCC region in 2009 will be 6.05 per cent, down only slightly from 6.60 per cent in 2008. Inflation, which has been a major problem recently, will ease from 9.28 per cent to 7.78 per cent; (b) Forecasts published by Credit Suisse show only a moderate slowdown in 2009, and are expected to fall to 7.2 per cent from 10.3 per cent in Qatar, 4 per cent from 7.5 per cent in Kuwait, 3.8 per cent from 6.5 per cent in Saudi Arabia and 3.8 per cent from 6.2 per cent in the United Arab Emirates; (c) Additional research from Credit Suisse also shows that the oil revenues of the big four GCC countries will recover from the lows of 2009. These forecasts are shown in figure 3. After the rebound, these forecasts indicate a sustained improvement until 2013; (d) Khan (2008) examines the effect of declining oil prices on the fiscal and current accounts of GCC countries under two scenarios for the price of oil in 2009 (US$ 75 and US$ 50). His analysis shows that Saudi Arabia will achieve twin deficits at US$ 50, but twin surpluses and positive growth at US$ 75. The United Arab Emirates is expected to achieve surpluses of US$ 75, but an external deficit of US$ 50. Kuwait will be spared difficulties if oil prices remain soft because it has embarked in less ambitious economic diversification programmes. Qatar will also do well even if oil prices stay soft, achieving positive growth under both scenarios. The figures produced by Khan are perhaps too pessimistic, particularly when we look at the forecasts produced by the International Monetary Fund. These forecasts are shown in figures 4 to 7 for real GDP growth, inflation, fiscal balances and the current account. The forecasts show positive real GDP growth in 2009 ranging between 21.4 and 4.3 per cent, while inflation levels are expected to fall in all of the six countries. Both the fiscal balance and current account are expected to be positive in 2009. The most vulnerable place in the GCC region is Dubai because it borrowed large amounts of money to finance massive development plans and real estate projects. The construction boom has mainly been financed through international borrowing because Dubai does not have large oil reserves. Two of the major concerns faced by Dubai are the real estate sector and how it will refinance the debt it has built up in recent years. However, a property market correction is needed. It is also likely that Dubai will receive financial assistance from the oil-rich Abu Dhabi.

14
Figure 3. Oil revenues of GCC countries (Billions of US dollars)
In general, therefore, the effects of the crisis on the economies of the GCC countries are not as detrimental as originally feared and the outlook is generally positive. The policy measures taken by the Central Banks of the GCC countries should be sufficient to guard against any major dislocation in financial markets. They also have additional measures at their disposal to enhance stability and support credit growth, albeit at far slower rates than before. The stress within the banking sector is a reflection of liquidity constraints and not counterparty risk. GCC countries have a track record of maintaining order and preserving banking sector stability during periods of intense volatility. At the time of political instability, for example, regional banks have seen rapid liquidity withdrawals. Although liquidity was curtailed during these episodes, pro-active action by regional central banks has been successful in ensuring the continued smooth functioning of the banking system. Further factors that call for a better than negative outlook are: (a) the ability and willingness of Governments to invest accumulated wealth in local companies to sustain growth; (b) the fact that regional markets are under-represented in global funds; (c) easing inflation; and (d) time for public investment because of drop in cost. The following are examples of the measures taken by the GCC central banks to combat the crisis. Table 4 lists these some of these measures. (a) The United Arab Emirates Government was the first to announce guarantees for bank deposits on 12 October 2008, thus echoing similar measures in the United States and Europe. In early October 2008, the Central Bank of the United Arab Emirates made available about US$ 13.6 billion to local banks to stimulate bank lending; (b) The Kuwait Central Bank followed a more active approach by cutting its discount rate from 5.75 to 4.5 per cent on 29 September 2008, followed by active liquidity injection, which has led to declining interbank rates;
0
100
200
300
400
500
2006 2007 2008 2009 2010 2011 2012 2013
Saudi Arabia Kuwait Qatar United Arab Emirates

15
(c) In Saudi Arabia, the Saudi Arabian Monetary Agency (SAMA) cut its repo rate to 5.5 for the first time since 2007 and reduced reserve requirements from 13 to 10 per cent on 12 October 2008; (d) At the same time, SAMA announced that around US$ 40 billion is available to help banks if required; (e) It was announced in September that the Kuwait Investment Authority was considering investing within the country to prop up local capital markets. The Qatar Investment Authority has set aside funds of US$ 5.3 billion on 13 October to buy 10-20 per cent stakes of local Qatari banks. For some time, the Central Banks of the GCC countries have been preoccupied with runaway inflation and credit growth, but they have now shifted to the liquidity crunch by monetary easing and other stabilization measures. The Central Banks of the GCC countries are increasingly following an accommodative stance at the expense of anti-inflationary considerations, which will mitigate the effect of the crisis on growth.
TABLE 4. MEASURES TAKEN BY GCC COUNTRIES TO EASE THE EFFECT OF THE CRISIS
Country Measures Bahrain • Raised bank deposit guarantees.
• Reduced the repurchase and overnight rates. • Expanded acceptable collateral for overnight funds to include Ijara sukuk.
Kuwait • Introduced new short-term repurchase agreements to give banks more access to funding.
• Set up a fund to invest in the local stock market. • Cut the discount rate. • Passed laws guaranteeing all bank deposits following the Gulf Bank affair. • Set a task force headed by the central bank governor to deal with the crisis. • Injected cash into the stock market by the KIA.
Oman • Amended of the reserve requirement rules to release 270 million rials into the banking system.
• Established a market-maker fund with the private sector to stabilize the stock market.
• Reduced the repurchase rate. • Allocated US$ 2 billion to local banks at an interest rate of LIBOR plus 150 basis
points to provide dollar liquidity for banks. Qatar • The Qatar Sovereign wealth fund bought 10-20 per cent of the capital of banks to
boost confidence. • The Qatar Central Bank announced that it stands ready to act if needed and that it
has many instruments at its disposal. Saudi Arabia • Reduced the repurchase rate to boost domestic credit.
• SAMA poured US$ 3 billion in long-term deposits into the banking system. • The Supreme Economic Council promised to guarantee deposits. • Extended US$ 2.67 billion in credit to low-income citizens having difficulty
getting access to loans. United Arab Emirates • Set up a committee to come up with a policy response to the crisis.
• The Dubai Government announced that it is prepared to help state-controlled firms to pay off debt.
• The Finance Ministry announced a US$ 19.1 billion rescue facility. • Guaranted bank deposits and protected lenders from credit risk. • The Central Bank sets up a US$ 13.6 billion emergency bank lending facility.
Source: Arab Times. GCC policy actions on credit crisis. 17 December 2008.

16
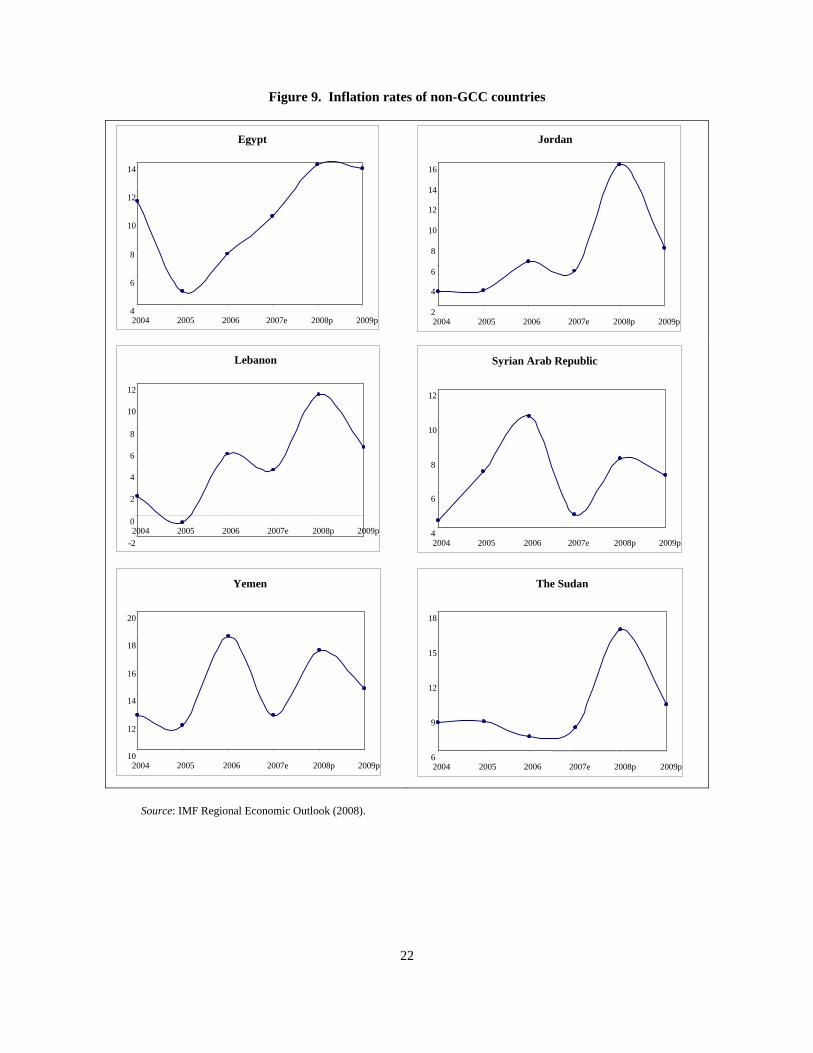
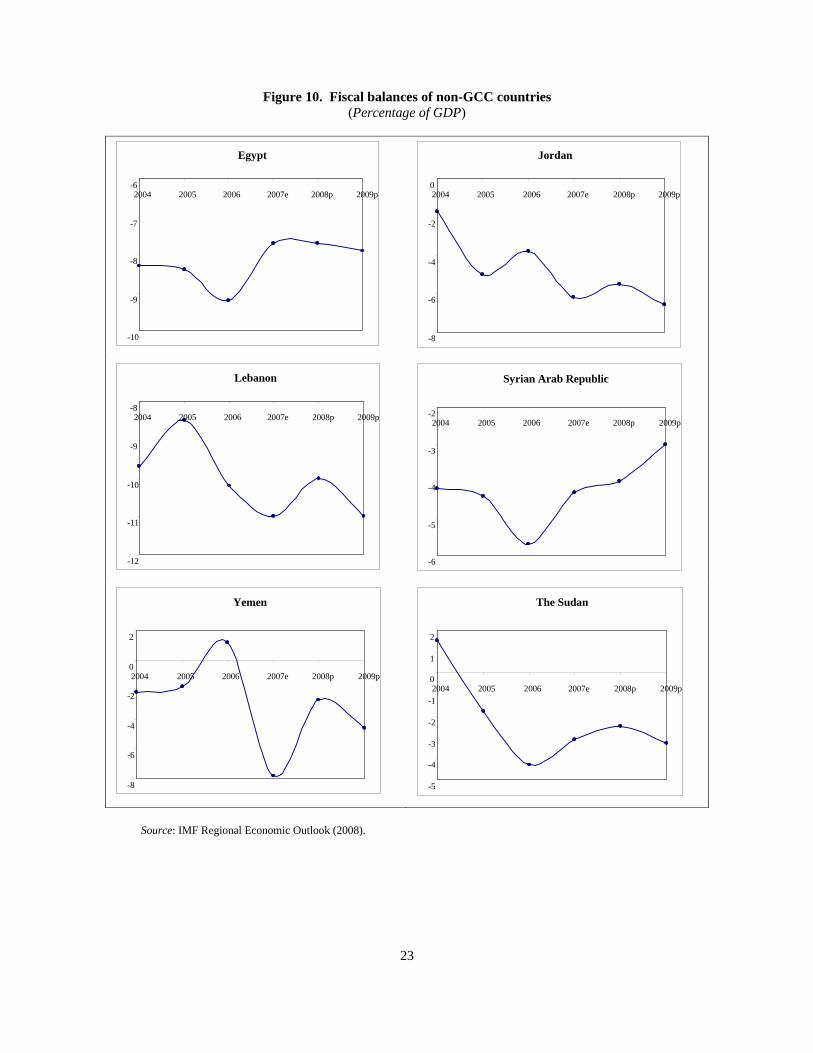
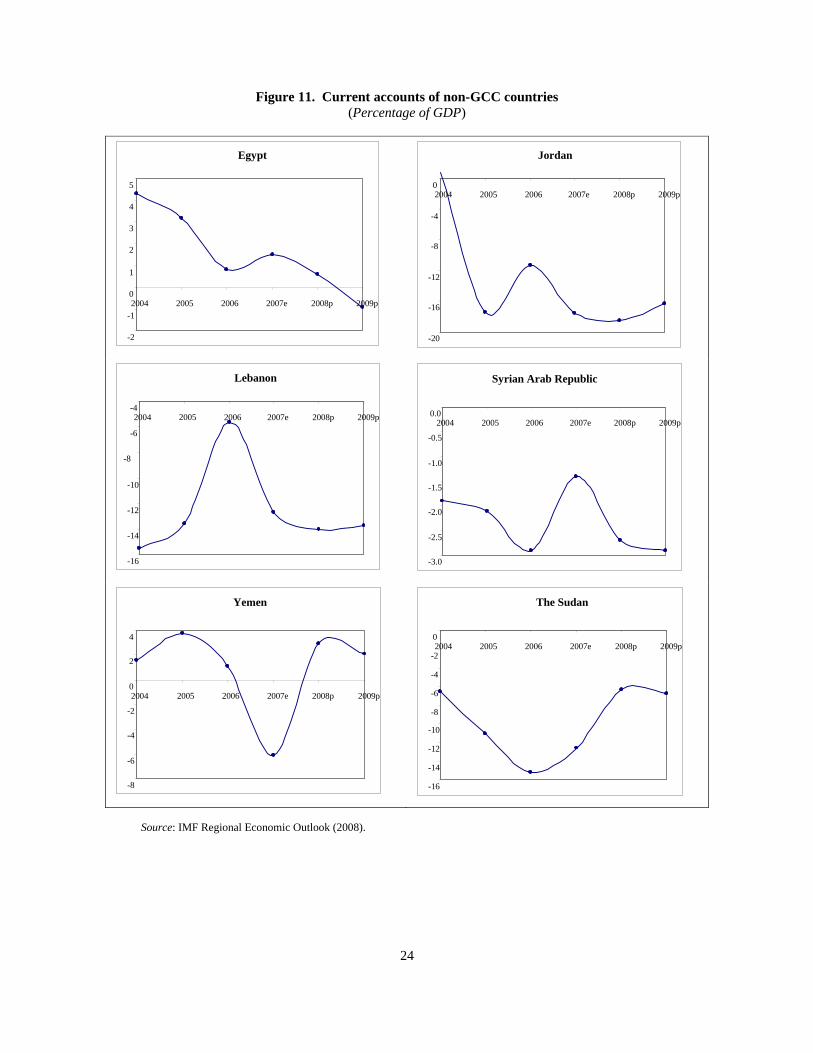
B. NON-GCC COUNTRIES In this sub-section we examine the economic prospects for Egypt, Jordan, Lebanon, the Syrian Arab Republic, Yemen and the Sudan. These countries seem to be less vulnerable than other emerging economies because of: (a) improved macroeconomic fundamentals over the past five years; (b) manageable external and internal positions; (c) limited reliance on international capital markets to finance internal and external deficits (with some exceptions); and (d) the banking systems of these countries are less integrated with the global financial system than those of the GCC countries. In general, growth will be positive in these countries in 2009 (figure 8), while inflationary pressure will ease (figure 9). No major change is expected with respect to the fiscal and current account deficits (figures 10 and 11). The following are comments pertaining specifically to each country: (a) In Lebanon, the major problem is the double digit fiscal and current account deficits and the large debt overhang (170 per cent of GDP). Tightening conditions in international financial markets, and slowdown in FDI, remittances and tourism receipts are major problems. There is also debt rollover risk; (b) Although Jordan has large deficits, it has reduced its public debt considerably, which means that it faces little debt rollover risk. This is also the case because most of Jordan’s public debt is from bilateral agreements. Slowdown in the GCC region will affect Jordan adversely, given its dependence on foreign direct investment (FDI) and remittances from the region; (c) Egypt has traditionally had a current account surplus, but a small deficit is expected to develop in 2009. However, as the deficit will be small, external financing needs will be limited. Egypt will be exposed to the risk of falling exports, FDI remittances, and tourism and Suez Canal receipts; (d) Yemen has a current account surplus, which reduces the risk associated with external financing. However, Yemen is a net oil exporter, which means that the outlook will be affected by the future course of oil prices; (e) The Syrian Arab Republic is a net oil exporter, which will make it vulnerable to changes in oil prices. A small current account deficit limits external financial needs; (f) The Sudan has a moderate external deficit but like Jordan, the Sudan’s debt comes from bilateral agreements. Still, growth is expected to be robust. Again, it should be stated that a lot of uncertainty surrounds the forecasts because the effects of the international financial crisis are still unfolding.
17
Figure 4. Real GDP growth rates in GCC countries
Source: IMF Regional Economic Outlook (2008).
Bahrain
4
5
6
7
8
2004 2005 2006 2007e 2008p 2009p
Kuwait
4
6
8
10
12
2004 2005 2006 2007e 2008p 2009p
Oman
4
5
6
7
8
2004 2005 2006 2007e 2008p 2009p
Qatar
8
11
14
17
20
23
2004 2005 2006 2007e 2008p 2009p
Saudi Arabia
2
3
4
5
6
7
2004 2005 2006 2007e 2008p 2009p
United Arab Emirates
6
7
8
9
10
2004 2005 2006 2007e 2008p 2009p
18
Figure 5. Inflation rates in GCC countries
Source: IMF Regional Economic Outlook (2008).
Kuwait
0
2
4
6
8
10
2004 2005 2006 2007e 2008p 2009p
Bahrain
2
3
4
5
6
2004 2005 2006 2007e 2008p 2009p
Oman
0
2
4
6
8
10
12
2004 2005 2006 2007e 2008p 2009p
Qatar
6
8
10
12
14
16
2004 2005 2006 2007e 2008p 2009p
Saudi Arabia
0
2
4
6
8
10
12
2004 2005 2006 2007e 2008p 2009p
United Arab Emirates
4
6
8
10
12
14
2004 2005 2006 2007e 2008p 2009p

19
Figure 6. Fiscal balances of GCC countries (Percentage of GDP)
Source: IMF Regional Economic Outlook (2008).
Bahrain
2
4
6
8
10
2004 2005 2006 2007e 2008p 2009p
Kuwait
20
24
28
32
36
40
2004 2005 2006 2007e 2008p 2009p
Oman
4
6
8
10
12
14
16
2004 2005 2006 2007e 2008p 2009p
Qatar
6
9
12
15
18
2004 2005 2006 2007e 2008p 2009p
Saudi Arabia
10
14
18
22
26
30
2004 2005 2006 2007e 2008p 2009p
United Arab Emirates
10
15
20
25
30
35
2004 2005 2006 2007e 2008p 2009p
20
Figure 7. Current accounts of GCC countries (Percentage of GDP)
Source: IMF Regional Economic Outlook (2008).
Kuwait
30
35
40
45
50
55
2004 2005 2006 2007e 2008p 2009p
Bahrain
4
6
8
10
12
14
16
18
2004 2005 2006 2007e 2008p 2009p
Saudi Arabia
20
22
24
26
28
30
32
34
2004 2005 2006 2007e 2008p 2009p
United Arab Emirates
8
11
14
17
20
23
2004 2005 2006 2007e 2008p 2009p
Qatar
20
25
30
35
40
45
2004 2005 2006 2007e 2008p 2009p
Oman
4
6
8
10
12
14
16
2004 2005 2006 2007e 2008p 2009p

21
Figure 8. Real GDP growth rates of non-GCC countries
Source: IMF Regional Economic Outlook (2008).
Jordan
5
6
7
8
9
2004 2005 2006 2007e 2008p 2009p
Egypt
4
5
6
7
8
2004 2005 2006 2007e 2008p 2009p
Lebanon
0
2
4
6
8
2004 2005 2006 2007e 2008p 2009p
Syrian Arab Republic
2
3
4
5
6
2004 2005 2006 2007e 2008p 2009p
Yemen
3
4
5
6
7
8
9
2004 2005 2006 2007e 2008p 2009p
The Sudan
5
6
7
8
9
10
11
12
2004 2005 2006 2007e 2008p 2009p
22
Figure 9. Inflation rates of non-GCC countries
Source: IMF Regional Economic Outlook (2008).
Jordan
2
4
6
8
10
12
14
16
2004 2005 2006 2007e 2008p 2009p
Egypt
4
6
8
10
12
14
2004 2005 2006 2007e 2008p 2009p
Lebanon
-2
0
2
4
6
8
10
12
2004 2005 2006 2007e 2008p 2009p
Syrian Arab Republic
4
6
8
10
12
2004 2005 2006 2007e 2008p 2009p
Yemen
10
12
14
16
18
20
2004 2005 2006 2007e 2008p 2009p
The Sudan
6
9
12
15
18
2004 2005 2006 2007e 2008p 2009p
23
Figure 10. Fiscal balances of non-GCC countries (Percentage of GDP)
Source: IMF Regional Economic Outlook (2008).
Jordan
-8
-6
-4
-2
02004 2005 2006 2007e 2008p 2009p
Egypt
-10
-9
-8
-7
-62004 2005 2006 2007e 2008p 2009p
Lebanon
-12
-11
-10
-9
-82004 2005 2006 2007e 2008p 2009p
Syrian Arab Republic
-6
-5
-4
-3
-22004 2005 2006 2007e 2008p 2009p
Yemen
-8
-6
-4
-2
0
2
2004 2005 2006 2007e 2008p 2009p
The Sudan
-5
-4
-3
-2
-1
0
1
2
2004 2005 2006 2007e 2008p 2009p
24
Figure 11. Current accounts of non-GCC countries (Percentage of GDP)
Source: IMF Regional Economic Outlook (2008).
Jordan
-20
-16
-12
-8
-4
02004 2005 2006 2007e 2008p 2009p
Egypt
-2
-1
0
1
2
3
4
5
2004 2005 2006 2007e 2008p 2009p
Lebanon
-16
-14
-12
-10
-8
-6
-42004 2005 2006 2007e 2008p 2009p
Syrian Arab Republic
-3.0
-2.5
-2.0
-1.5
-1.0
-0.5
0.02004 2005 2006 2007e 2008p 2009p
Yemen
-8
-6
-4
-2
0
2
4
2004 2005 2006 2007e 2008p 2009p
The Sudan
-16
-14
-12
-10
-8
-6
-4
-2
02004 2005 2006 2007e 2008p 2009p

25
VI. CONCLUSION AND POLICY RECOMMENDATIONS There is little doubt that the international financial crisis is indeed serious, but it is unlikely that GCC countries will face bankruptcy and that non-GCC countries will be driven further into poverty. The effects of the current financial crisis on ESCWA countries are not as detrimental as frequently portrayed. The GCC countries have accumulated large reserves from high oil prices, and these reserves should see them through the current crisis. The Central Banks of the GCC countries have taken appropriate measures, except that they have acted unilaterally, which may prove problematic. If interbank rates start to differ considerably due to different policies, borrowers from other countries will be attracted by the lower rates on offer in the most successful country. Without greater coordination between concerned countries, capital controls will need to be imposed. To avoid this situation, the following observations and recommendations are proposed: 1. The exchange rate regime of pegging local currencies to the United States dollar has exacerbated the liquidity problem. Shifting to a policy of pegging local currencies to an import-weighted basket of currencies would therefore be a wise decision. 2. GCC countries will need to show more fiscal prudence, particularly if oil prices do not rise. 3. Bankruptcies and consolidation in the financial sector will be inevitable, but this may be a positive development. 4. Central Banks in GCC countries should watch for bubbles in stock and real estate markets and adjust credit policy accordingly. 5. The current financial crisis has shown that capital-based regulation is ineffective. Regulation needs to be based on leverage instead. Regulation of credit is warranted, particularly the sectoral distribution of bank loans. 6. Central Banks should encourage consolidation and restructuring in the financial sector. There is little doubt that non-GCC countries will be affected by the global recession, which will result in declining exports, FDI, remittances and tourism revenue. However, the expected rebound in worldwide economic growth in 2010 may lead to improved economic prospects. Until such time as a recovery occurs, there is little that these countries can do, other than not become overly enthusiastic about capital account liberalization.
26
REFERENCES Arab Times. 2008. GCC Policy Actions and the Credit Crisis. 17 December. Hussain, S. 2008. Challenges in GCC Banks: Impact of the Financial Crisis. Paper Presented at the SMEs
Conference, Bahrain, 18 November. Available at: http://www.oecd.org/dataoecd/45/27/41728432.pdf. Khan Mustaq, M. 2008. Managing Domestic and Global Expectations: The Policy Challenges Facing the
GCC. Citi Economic and Market Analysis, 17 November. King S. and Green S. 2009. Lost and not yet found. HSBC Global Economics, Quarter 1. International Monetary Fund (2008). Regional Economic Outlook: Middle East and Central Asia. World
Economic and Financial Surveys. October. Middle East Monitor. 2008. Vol. 18, No. 10. Oxford Analytica. 2008. Egypt: Stock Market Hit by World Crash, Local Troubles. October. Available at:
http://www.alacrastore.com/storecontent/oxford/DB146150. Woertz, E. 2008. Impact of the US Financial Crisis on GCC Countries. Gulf Research Paper Report,
October.