Embed Size (px)
Citation preview

The Impact of the State Supervision Sanction:
A review of the NIJ and AOC Studies
Russell K. Van Vleet, M.S.W. Matthew J. Davis, B.S.
Edward C. Byrnes, Ph.D.
Criminal and Juvenile Justice Consortium College of Social Work
University of Utah
February 28, 2005

State Supervision 2

TABLE OF CONTENTS INTRODUCTION 5 METHODS 10 RESULTS 14
DISCUSSION AND RECOMMENDATIONS 20 APPENDIX A- Sample data collection sheet 26 APPENDIX B- Procedure Used to Classify State Supervision Contacts and Programming 28 APPENDIX C- Programs Reported Used for State Supervision 30 APPENDIX D- Sharing the State Supervision Sanction across Multiple State Agencies 40 APPENDIX E- State Supervision Data Tables 44 APPENDIX F- An Evaluation of the Visions Program at Davis Behavioral Health 52 APPENDIX G- The Risk and Protective Factor Model 58
State Supervision 3

State Supervision 4

INTRODUCTION
The Utah Administrative Office of the Courts (AOC) contracted with the Criminal and Juvenile Justice Consortium (CJJC) in the College of Social Work at the University of Utah to study the impact of the State Supervision sanction (termed the AOC study in this report). The AOC asked CJJC to identify the overall impact of the sanction on rates of re-offense and commitment to the Juvenile Justice Services (JJS). In addition, court administrators are interested in identifying specific programs that show the strongest promise for reducing youth involvement with the Juvenile Justice System. The Criminal and Juvenile Justice Consortium previously studied the State Supervision sanction as part of a larger study that explored the impact of Utah’s Juvenile Sentencing Guidelines under a grant from the National Institute of Justice (NIJ). Selected results from the NIJ study are presented in this report to provide a more comprehensive view of the State Supervision sanction’s impact on juvenile offending in Utah. A complete report of this study can be obtained from CJJC or on-line at www.socwk.utah.edu. Using information from the current AOC study and the NIJ study, the researchers have compiled a comprehensive, long-term, system-wide analysis of the statewide impact of the sanction. Analyses are reported for offenders who were sanctioned before and after the State Supervision sanction was implemented. In addition, the researchers have looked at offenders who received a sanction to probation or State Supervision since the creation of the State Supervision sanction. And finally, we have looked at differences between offenders on State Supervision who received intensive supervision and services compared with those who did not. Data was gathered on offenders statewide in all of the groups analyzed. The differences in demographical and offending characteristics between all groups were taken into account when conducting all analyses using statistical methods developed for these purposes. Rationale for Further Study of State Supervision Results of the NIJ study were difficult to attribute to the State Supervision sanction solely for the following reasons:
• State Supervision was implemented concurrently with the Juvenile Sentencing Guidelines. The guidelines significantly changed the sentencing process of the Juvenile Court and therefore could have contributed significantly to any impact of the implementation of the State Supervision sanction.
• The study, by necessity, compared two different cohorts of offenders. First time probationers from 1996 and 1999. These offenders differed significantly on individual characteristics, such as age at first offense,
State Supervision 5

which is a strong predictor of future offending. Further, overall rates of crime, particularly juvenile crime, were declining during the time period studied.
• Finally, the services received under the State Supervision sanction varied dramatically across judicial districts. For example, some probation offices reported contacting youth up to seven times daily, with others reporting two contacts per month.
These limitations notwithstanding, the NIJ study found little evidence that youth sentenced after the implementation of the State Supervision sanction were less likely to re-offend or enter JJS custody. However, offenders were more likely to have a longer period of time before re-offense. The current study of State Supervision sought to supplement these findings by taking a different methodological approach than the NIJ study by prospectively studying youth entering State Supervision and carefully tracking the services they received using weekly Probation Officer reports. A more detailed explanation of the methodology of both studies is provided in the next sections.
State Supervision 6

Research Questions The research topics of the current AOC study were structured similarly to those explored in the NIJ study. Both studies began with a general examination of the State Supervision in comparison to Probation and then proceeded toward a more detailed understanding of the effect of specific programming components on rates of re-offense and entrance into JJS custody. The individual study questions were:
Question 1: Does State Supervision reduce re-offense or JJS commitment rates compared to Probation? Question 2: What services have the largest effect on re-offense? In answering these questions, the researchers intend to provide supplemental information to policy makers and juvenile justice personnel that will either support or refute the conclusions of the NIJ study. Groups Studied The table below shows the offender groups analyzed when answering each question in the NIJ and AOC studies. The NIJ and AOC studies gathered data on probation and state supervision youth at different time periods. Data gathering methods also differed between the two studies. Because of these differences, the two studies, when looked at together, provide a more reliable and comprehensive analysis of the impact of the State Supervision sanction.
Offender groups by Study Study Question NIJ Study AOC Study
#1- Does State Supervision reduce re-offense or commitment rates?
1st time probationers before (1996) vs after (1999) State Supervision implementation
1st time probationers vs 1st time probationers who then received State Supervision*
#2- What services have the largest effect on re- offense?
N/A Contact and program data from probation officers on State Supervision offenders (2003)
*Difference between these offender groups were statistically accounted for in all analyses.
State Supervision 7
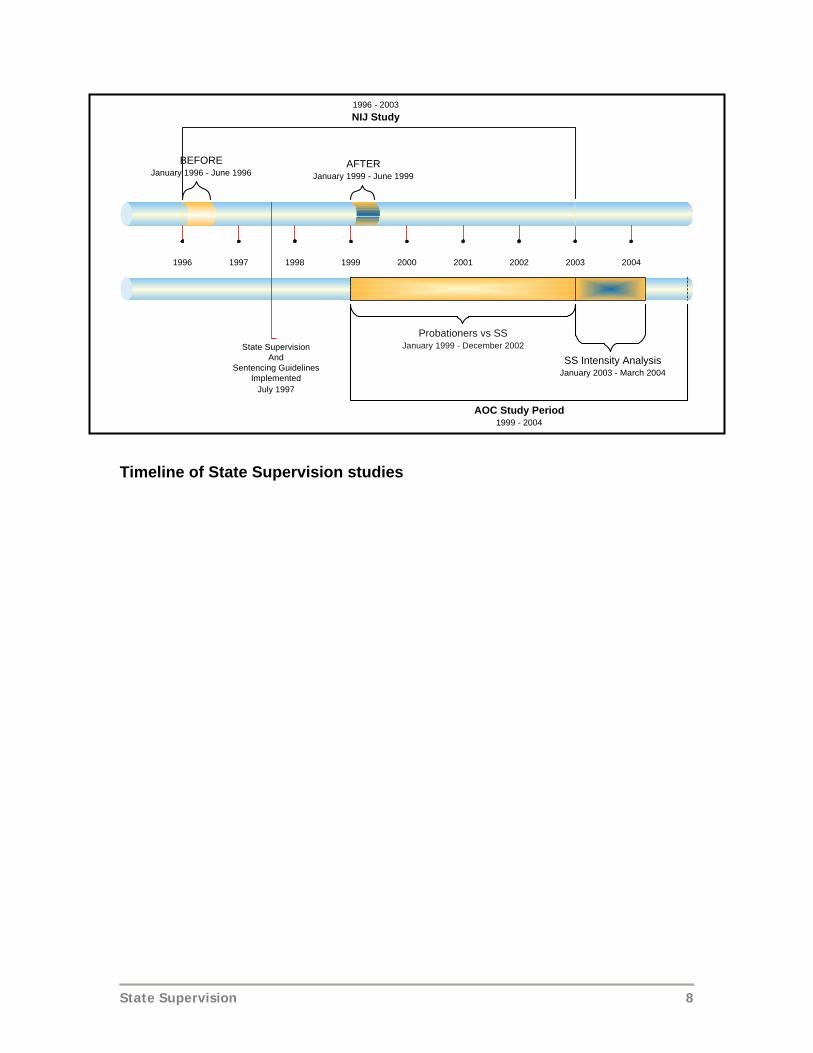
1996 - 2003NIJ Study
January 1996 - June 1996BEFORE
January 1999 - June 1999AFTER
Timeline of State Supervision studies
1998 2000 200119991997 20032002 20041996
January 1999 - December 2002Probationers vs SS
July 1997
State SupervisionAnd
Sentencing GuidelinesImplemented January 2003 - March 2004
SS Intensity Analysis
1999 - 2004AOC Study Period
State Supervision 8

State Supervision 9

METHODS Question 1: Does State Supervision reduce re-offense or JJS commitment rates compared to Probation? AOC Study Offenders who received State Supervision were compared to offenders who received Probation only. Information was compiled using the Juvenile Information System electronic database. Statistical analyses were conducted to test for differences in (1) the re-offense rate of State Supervision and Probation youths (2) the rate of commitment to JJS custody. This analysis looked at all youth receiving a State Supervision or Probation sanction since 1998. The follow-up period during which re-offense and commitment was calculated was 1 year from the disposition date. Statistical analysis was conducted using similar methods utilized in the NIJ study as detailed next. NIJ Study Decreased new offenses A pre-post analysis of variance in charges was conducted to assess differences in probationers sentenced before and after the program implementation. A repeated measures MANCOVA was used to examine offending differences before and after program implementation. The number of charge episodes in the year prior to and after a sentence to Probation was analyzed using a repeated measures analysis of covariance. Cohort year was entered as the independent variable, and one-year pre and post probation charge episodes were the within-subjects dependent variable. Covariates included age at start of probation, gender, and judicial district coded as a set of dummy variables with the largest urban district as the reference group. This analysis allowed for the difference between cohorts in their pre- and post-probation charge episodes to be assessed while controlling for extraneous variables that may affect differences between the two groups. The different pre and post charge patterns between the cohorts were examined because the policymakers hypothesized that the offenders sanctioned after implementation of State Supervision had significantly fewer prior offenses before probation placement. Reduced commitments to Youth Corrections A Chi-Square analysis was conducted to assess for differences between offender groups in the rate of commitment to the JJS. Logistic regression was used to explore how placement in a particular offender group predicted commitment to JJS. Prior charges were included as a predictor variable to assess the effect of placing offenders on probation with fewer offenses. The covariates included in previous analyses, age at probation start and sex, were included as predictor
State Supervision 10

variables. Time spent in detention was also included to identify differences between the two groups. Question 2: What services have the largest effect on re-offense? Only AOC data were used to analyze this question for the reasons detailed below. Accurate re-offense and JJS commitment data (i.e. outcome variables) are available using the JIS. Quality data on the services received, based on the evaluator’s past experiences, are much harder to obtain. While case files are the usual source, there are several challenges encountered when using data gathered from case files for research purposes. The chief concern arises from the fact that information in case files is created for purposes other than research. This typically creates data of poorer quality. The data are highly variable in the amount available, the manner in which it is recorded, and the accuracy with which it is recorded. Consequently, research based upon this source is also poorer in quality.
Using case file data also introduces problems of inconsistent definitions of a particular intervention or service. For example, when looking at the effect of contact frequency on re-offense, it is important to have a consistent definition of “a contact.” Is a contact a phone call, a message to the youth, or an in-person visit? This type of consistency is not important for the probation officer filling out the case file. Because he/she is interested in the content of the contact, the type of contact might not be recorded. In addition, the information contained in case files, the definitions used and the level of detail varies considerably by probation office and judicial district. Subsequently, two districts might have similar contact frequencies according to the case files; however, because “a contact” is not defined it is difficult to say whether the effect contact frequency has on re-offense is due to differences in frequencies or simply definitions. The end result many times is a study with ambiguous results, providing administrators with minimal knowledge about the effect of their programming efforts. For these reasons, the researchers gathered data on all State Supervision offenders weekly via the internet from the offender’s Probation Officer. Appendix A contains a copy of the data gathering form. The type of contact and programs received were categorized, along with the frequency of contact and program attendance. Appendix B provides a detailed explanation of the classification procedures that were used. Statistical analyses were conducted to examine the degree to which the type and intensity of State Supervision that an offender received was predictive of lower re-offense rates or commitment to JJS. In essence, this approach was designed to identify whether more contacts and services result in lower re-offense and commitment to JJS.
A note on the statistical analysis procedures is relevant at this point. A review of the graduated sanctions research conducted for the Office of Juvenile Justice and Delinquency Prevention states, “[a] common problem for researchers
State Supervision 11

conducting studies on graduated sanctions programs [such as State Supervision] is finding a comparable control group. Practitioners often resist studies with random assignment. Yet without random assignment, researchers must identify a control group. Such control groups often are not carefully selected, or the differences between the two groups are not taken into account in the analysis. As a result, it is unclear whether differences between the outcome of experimental and control programs are from differences between the youth each program serves.”
As the evaluators found in the NIJ study, pre-existing differences and system changes for probationers in 1996 and 1999 made it difficult to know the effect state supervision had on re-offense and rates of commitment to JJS. In order to minimize these problems, the current study employed statistical procedures that look for predictors of re-offense or commitment, rather than simply measuring the differences between two groups rate of offending. The approach taken examines whether the State Supervision sanction is a factor that predicts reduced rates of re-offense and commitment to JJS. The statistical analyses take into account other significant predictors such as age, race, sex, and number of prior offenses. Definition of Re-offense and Commitment The researchers used the following definitions when conducting the analyses for both the NIJ and AOC studies of State Supervision: Re-Offense- A charge episode is defined as the most serious charge on a calendar day. Charges, rather than convictions, were used to increase the likelihood of detecting delinquent behavior, as recording convictions would have required a longer follow-up period. Chronicity- The number of charge episodes during the follow-up period. Type- Charges were divided into Felonies vs. Misdemeanor and person, property, public and technical offenses. Technical offenses were excluded. Technical Violation- This category comprises any probation violation code as found on the JIS. Commitment to JJS- Court commitment of an offender to the custody of Youth Corrections comprises community placement, secure care, or out-of-state placement. Detention, SS JJS, and O & A were excluded. Time window for re-offense- The period of follow up began on the day an offender was sentenced to State Supervision. Beginning at this point allows the study to better take into account the effectiveness of State Supervision in preventing re-offense.
State Supervision 12

State Supervision 13

RESULTS Results are presented based upon data gathered up to April 1, 2004. Demographics, Offending History, and Placement History were gathered from the JIS on each offender given a Probation or State Supervision sanction since 1998. In addition, the type and frequency of contact and programming was gathered on all offenders receiving a State Supervision sanction during 2003. The impact of the State Supervision sanction is measured by examining rates of re-offense and commitment to JJS custody. Regression analyses, a group of statistical prediction methods, were used to examine the effect of the State Supervision sanction on rates of re-offense and entrance into JJS. This type of analysis takes into account pre-existing differences between offenders receiving State Supervision and Probation that influence rates of re-offense. Specifically, characteristics that predict future offending, such as sex and offense history, are used along with the sanction an offender receives when examining rates of re-offense and JJS commitment. Question 1: Does State Supervision reduce rates of re-offense or JJS commitment compared to Probation? The results in this section are based upon data collected from the Juvenile Information System on all offenders receiving a Probation or State Supervision sanction since 1998. Data was collected on 2689 Probation only youth and 1268 State Supervision youth. Demographics Demographic Data
Group Size Race Sex Caucasian Minority Male Female
AOC Study
Probation 2689 77% 23% 82% 18%
State Supervision 1268 71% 29% 82% 18%
NIJ Study
Pre-State Supervision Probationers 1996
871 73% 27% 81% 19%
Post-State Supervision Probationers 1999
1095 79% 21% 79% 21%
State Supervision 14

Criminal History Data AOC Study Age at Sanction
Start* Age At First Offense
Lifetime Prior Offense Episodes**
Probation 15.3 13.4 4.3 State Supervision 15.2 13.1 4.8
NIJ Study
Pre-State Supervision Probationers 1996
15.6 13.3 4.9
Post-State Supervision Probationers 1999
15.7 13.6 3.9
*Age at Sanction Start = Age on day receiving 1st probation sanction according to JIS records. **Episodes = Counts only most serious offense on calendar day.
Re-Offense Differences between these groups that are known to affect rates of re-offense were statistically controlled before examining the effect of the sanction placement. These factors included the offender’s age at their first offense, number of previous offense episodes in their lifetime, race, and gender. In both the NIJ and AOC studies all of these factors were found to be significant predictors of re-offense. In the NIJ study, probationers sanctioned after the State Supervision sanction was implemented had significantly fewer re-offense episodes than those sanctioned before implementation. This finding is difficult to attribute to State Supervision as the overall crime rates in Utah decreased during the study period and the offenders put on probation after State Supervision implementation had significantly fewer prior offenses than those put on before. The sanction that a youth received in the AOC study, Probation only or State Supervision, was not a statistically significant factor in predicting future rates of re-offending. In other words, offenders receiving State Supervision did not have statistically significantly lower rates of re-offense. As shown in the table on the following page, State Supervision youth actually had a slightly higher rate of re-offense, although this difference was not statistically significant, and most likely due to the substantial differences in the size of the groups. JJS Commitment The same factors used to control for differences between the groups were controlled before examining the effect of the sanction placement on JJS commitment rates. In the NIJ study, the difference in rate of commitment between groups was not significantly different. AOC study results showed that offenders receiving State Supervision had an increased likelihood of JJS placement. However, the effect that the sanction received has on rates of
State Supervision 15

commitment was quite small. Additional analyses show that this difference was most likely due to differences in group size.
It is important to note the difference in technical violations between the two groups. The NIJ study showed no significant differences in the rate of technical violations. The table above shows that in the AOC study State Supervision youth were almost twice as likely to receive a technical
charge in the years following the sanction start. This difference was statistically significant and might negate any positive effects of the State Supervision sanction. The implication of this finding is considered further in the discussion section below.
One Year After Sanction Start Re-
Offense Rate
JJS Commitment
Rate
Technical Violations
AOC Study Probation 2.6 19% 0.6 State Supervision 2.9 23% 1.0 NIJ Study Pre-State Supervision Probationers 1996
1.16 12% .82
Post-State Supervision Probationers 1999
.86 10% .80
State Supervision 16

Question 2: What services have the largest effect on re-offense? Results in this section are based upon data gathered weekly during the AOC study as reported by probation officers during 2003. This question is difficult to answer confidently at the current juncture. State Supervision appears to be used for longer than the 3-6 months that policymakers originally forecasted. The average period for which an offender was on the sanction over the year and half data collection period was 46.5 weeks. Over 60 different programs were reported as providers to this offender group statewide. Appendix C contains a full listing of programs along with a brief description of each. This large diversity of programs creates difficulties when attempting to identify specific types of programming or individual programs that have positive effects. In the current analysis, due to the relatively few programs that have sufficient numbers of offenders and the short period of follow-up, individual programs were not analyzed. Individual programs will be analyzed in a six-month follow-up report. Due to the above circumstances, the researchers created two measures of overall intensity. The first is a summation of the frequency of each type of Probation Officer contact divided by the weeks on State Supervision. The second is a summation of the number of programs and times each was attended divided by the weeks on State Supervision (See Appendix B for a more detailed explanation). These two summary variables were used to predict whether the intensity of Probation Officer contacts or programs leads to reduced rates of re-offense. Before examining the statistical results, descriptive statistics are provided for contact and program information. Demographics Demographic Data
Group Size
Race Sex
Caucasian Minority Male Female State Supervision with Contact and Program Data
597 65% 34% 84% 16%
Criminal History Data Age at Sanction
Start Age At First
Offense Lifetime Prior
Offenses State Supervision with Contact and Program Data
15.3 13.40 4.08
State Supervision 17

Contact and Program Data Summary of Weekly Probation Officer Contact Frequency Data
Average Weekly Contacts Average Weekly Program Attendance
Average Weeks Under Court Supervision
3.7 1.9 46.5 In Person Contact
with Offender Telephone Contacts
with Offender In Person Contacts
with Family Telephone Contacts
with Family 2.2 Times 0.9 Times 0.5 Times 0.1 Times
Any Attendance
by Service Type Court Services 97%
Clinical Services 94%
Correctional /Punishment Services
44%
Educational Services 41%
Work Crew/Community Restitution Services
41%
Psychosocial Skills Services 34%
Alternative Detention Services 28%
JJS State Supervision Services 23%
DCFS Services 18%
Drug Court Services 8%
Separate analyses were conducted for contact intensity and program intensity as these summary variables were correlated too highly to be correctly included in the same analyses. The same factors known to affect rates of re-offense and JJS commitment were statistically controlled for before examining the effect of contact and program intensity. These factors included the offender’s age at their first offense, number of previous offense episodes in their lifetime, race, and gender. In the current analysis all of these factors were again found to be significant predictors of re-offense and JJS commitment. However, the levels of contact and program intensity that a youth received was not a statistically significant factor in predicting future rates of either re-offending or JJS commitment. In other words, the amount and type of contact and services a State Supervision offender receives are not factors influencing reduced court involvement. The solidity of these findings should be tempered by the short period of follow-up after release from formal court supervision or programming. The importance of a longer follow-up period for psychosocial interventions, such as those that compromise many State Supervision programs is detailed in the discussion section.
Summary of Weekly Program Attendance
Average Times per Week
Juvenile Court Services 0.85
Clinical Services 0.57
Educational and Employment Services
0.08
Correctional Services 0.09
JJS State Supervision Services 0.03
DCFS Services 0.02
Detention Alternatives Services
0.05
Psychosocial Skills Services 0.12
Work Crew and Community Service Services
0.08
Drug Court Services 0.01
State Supervision 18

State Supervision 19

DISCUSSION AND RECOMMENDATIONS Based upon the AOC and NIJ studies, empirical support for the effectiveness of State Supervision is lacking. It is possible that increased probation officer contacts and provision of services do not reduce re-offense or JJS commitment rates. Previous research has shown little to no difference on rates of re-offense or conviction when intensive supervision and services are provided for offenders failing Probation, the target population for State Supervision. Similar patterns have been found in studies of adult offenders.
While the researchers believe the Juvenile Justice System should be open to the possibility that intensive supervision and services have a limited impact on re-offense and JJS commitment rates, there are several alternative explanations that may contribute to the current findings. Both the NIJ and AOC studies point out two systemic issues that are relevant to the effectiveness of the State Supervision sanction: Technical violations and excessive programming diversity. In addition, the researchers believe that new state of the art evaluation methodologies should be initiated in future examinations of the effectiveness of any legal or correctional supervision and services. The majority of the discussion and recommendations sections is devoted to development of this topic as we believe that the juvenile court stands to gain significant rewards from this type of research. Each of these areas are considered below under the headings containing the researchers suggested course of action. Implement a Technical Violation Policy The negative impact of technical violations on State Supervision offenders is important. The current findings show that State Supervision offenders have nearly twice as many technical violations as their probation counterparts. Other researchers have found increases in this type of violation when offenders are placed under intensive supervision and programming. Increased technical violations have also been found to lead to more restrictive sanctioning. A situation is created where an offender is put into a more restrictive sanction, negating the preventative effects of intensive intermediate sanctions. While offenders who do not comply with the court are a serious and difficult problem, it is necessary to have a strong policy in place that balances the need for compliance while avoiding placement in more restrictive sanctions, further escalating a youth’s progression into the judicial and correctional system. The court could benefit from a written policy that helps personnel understand the effect of intensive supervision and services on rates of technical violations. Additionally, this policy should provide clear guidance on methods of avoiding more restrictive sanctioning based on technical violations.
State Supervision 20
Decrease State Supervision Programming Diversity; Increase Empirically Supported Programming The NIJ study found the number and type of State Supervision programming was of a magnitude that precluded analysis. The AOC study findings lead to similar conclusions. The type and number of programs that comprise State Supervision continues to be quite large. A diverse range of programming is desirable when it enables interventions to be adapted to local needs. However, when the services comprising a sanction are individualized to the point where very few youth receive similar experiences, evaluation is difficult and program improvement even more so. The State Supervision sanction currently appears to be in need of more structure. Across the country, many court and correctional systems are moving towards contracting only with programs that have a structured curriculum with strong empirical support. The researchers agree with this approach and believe that directing the scarce State Supervision funding towards empirically supported programs would be beneficial. Implement a Continuous Outcome Evaluation System Under the current system used to develop programming for the juvenile court, increasing quality and system effectiveness is difficult to the point of impossibility. The legislature allocates limited funding to the court. The court then develops programming or contracts with a mix of providers that will hopefully give them the most effective results for the least money. Programs prove their value by creating a good reputation and charging the least. In addition contracting based upon process outcomes, such as percentage of compliance with state regulations, youth served, etc..., while important, does not show effectiveness. It shows an administratively well run program, a necessary but not sufficient component to program quality. Without a method of collecting outcomes on a continual basis, measurements of cost, regulatory compliance and reputation become the only means for measuring effectiveness. Effectiveness is not as important because the court currently has reliable means to measure it. Simply adopting empirically supported programs, however, will not ensure the judicial system is using effective programs. Analyses that examine rates of re-offense and JJS commitment are able to establish whether a program is empirically valid at a point in time. However, proving effectiveness at a certain point in time does not ensure continued effectiveness. The environment in which a program or intervention is implemented accounts for most of the effect of a program. The largest contribution to positive outcomes for any program are location specific variables such as facility conditions, adequate funding, and, most importantly, competent staff. Even the strongest empirically supported curriculum will fail when poorly implemented.
State Supervision 21

After four decades of research on identifying effective interventions in the mental health care field, many leading researchers, recognizing the overriding effect local implementation has on program effectiveness have put their energy into developing methods of continuously monitoring program effectiveness. Using such systems policymakers can identify not only curricula that have been shown in academic studies to be effective but can also identify whether local implementation is effective. Due to advances in information technology and research methodology, it has only recently become possible to cost effectively measure the effectiveness of individual programs and services on a continuous basis. Therefore, the researchers believe the court would benefit from implementing a continuous outcome monitoring system that enables identification of quality programs and interventions at any point in time. Measure Outcomes beyond Re-Offense and Commitment Rates; Such as Factors Known to Predict Delinquent and Other Problem Behavior Official statistics on court and corrections involvement provide important information on program effectiveness. While measuring changes in these types of outcomes has appeal as they appear to represent clear indicators of program impact, these ultimate outcomes are subject to many confounding influences that make strong conclusions difficult. For example, the offender groups analyzed in the NIJ study were comprised of two cohorts separated by several years during which crime as a whole was declining across the nation.
In addition, studies based solely on outcome measures such as re-offense and commitment rates do not allow the court to know if the program is changing offenders in important ways that might not be evidenced in official statistics or until an offender has left the juvenile system. It is also possible that in the current studies important difference between the offender groups that were examined have not been measured. For example, differences in factors in the community, family and school have been shown to be predictive of future delinquency. Without broader measures that showcase subtle group differences and variables that mediate re-offense and commitment outcomes, it is difficult to show conclusive results and program efficacy
In the absence of measures that target factors predictive of delinquency, it is also difficult to know how effects on the main outcomes policymakers want to influence, that of re-offense and commitment rates, can be increased. In the evaluations detailed in this report, the researchers gathered detailed information on many contact and program variables. However, more sensitive measures based upon sophisticated models of delinquency exist. These models, such as the Risk and Protective Factors approach developed by the Social Research Development Group at the University of Washington, provide a coherent framework that allows policymakers to understand how a broad range of factors predictive of delinquency are operating in a particular program, judicial district or
State Supervision 22

even the state as a whole (see Appendix G for more detail on the Risk and Protective Factor model). Program success can be measured on the factors that the program curriculum is intended to target.
Implementation of evaluations that include other measures of important outcomes known to predict future offenses should be added to a continuous outcome monitoring system to increase provider’s and policymaker’s ability to create a system that is able to be more efficient in creating and maintaining the system’s effectiveness. This data can then be reliably connected to traditional measures of outcome, such as re-offense and JJS commitment rates.
Use Similar Empirically Validated Measures across Programs
Just as too much diversity in programming can render evaluation impossible, diversity of outcome measures should be limited. Encouraging programs to implement measures that do not allow comparisons across providers, regions, and populations severely limits the usefulness of these additional measures. In such cases, policymakers have no coherent method of understanding the system as a whole or how to improve it.
Employing similar measures that have the breadth and flexibility to cover a wide range of outcomes can enable sophisticated understanding of individual programs, specific areas and the system as a whole. For example, using measures developed on a Risk and Protective Factor approach, offenders in a targeted program can be compared with population norms for Utah youth on the whole and, in the near future, for specific geographical areas, such as a judicial district, or population groupings, such as Pacific Islander youth or Probation offenders.
Measure Outcomes at the Program Level First The AOC study has shown that information on the amount of supervision received and services provided can be collected at the program level system-wide at a low cost. The researchers recommend collecting program level data first in order to build up the necessary numbers of offenders needed to identify, on an ongoing basis the programs that have the best outcomes. An example of an evaluation that the researchers carried out, in partnership with Bach-Harrison, LLC, a private evaluation firm is included in Appendix F. Several other State Supervision programs, such as Weber Human Services, appear to have quality continuous outcome monitoring systems in place. Aggregate Program Level Outcomes over Time to Inform Policy Researchers in the mental health care field using continuous outcome monitoring systems have shown that it is possible to reliably measure complex interventions in a manner that can be useful for increasing system-wide effectiveness and
State Supervision 23

fiscal economy. With several notable exceptions, these approaches have yet to be utilized in the juvenile justice arena. Juvenile justice researchers and policy- makers have instead focused on implementing services from lists of “promising” or “empirically supported” programs. This effort, while necessary, is not sufficient to improve system effectiveness. A continuous outcome monitoring system allows policy makers to identify which programs are currently most effective. Funding decisions can then be made based upon real time effectiveness data. Scarce funding can be directed towards replicating or expanding the most effective programs. In addition, less effective programs will have knowledge which can assist them in increasing program quality. A continuous outcome monitoring system can also alleviate some of the pressure policymakers have to increase system effectiveness. Under the current system administrators are charged with the difficult task of showing they are effectively using the money allocated to them. State agencies compete for limited funding from the legislature. These agencies in turn try to extend their limited budgets to create a well run, quality system by contracting with the lowest cost program that meets contract compliance standards and has a good reputation. Under this type of contracting, the burdens for creating a well run system is laid squarely upon agency heads, rather than the programs that are competing for a contract. Policymakers lack the structure to continuously monitor program performance beyond the most rudimentary level. For example, many times monitoring consists of site visits and audits to measure compliance with the contractual terms agreed upon. As stated above, while these measures of program processes are vital, they do not necessarily equate with positive outcomes. With a continuous outcomes monitoring system, agency heads can shift some of the burden for creating system excellence to the providers by implementing the means to clearly identify those who are creating the most positive outcomes. Rather than simply seeking methods to keep costs to a minimum and complying with agency standards, programs can demonstrate that while possibly more expensive in the short run, it will save money in the long run through greater reductions in rates of re-offense or DYC commitments. An Example of a Continous Outcome Monitoring System The Criminal and Juvenile Justice Consortium has implemented an outcome monitoring system for the Utah Board of Juvenile Justice (UBJJ). Several findings of this effort may be helpful for illustrating the positive benefits such a system can have on improving program and system-wide quality. The system employed by UBJJ is based upon a broad model of delinquency illustrated in the figure on the following page.
State Supervision 24

Factors Contributing to Delinquency
Community Family School Peer Individual
The risk and protective factor model is used to structure implementation of the outcomes system. Two surveys that measure the factors in the domains listed in the above figure, which have been empirically linked to delinquency, substance abuse, teen pregnancy, and school dropout rates, are given to youth entering UBJJ funded programs. Surveys are administered via the web for cost effective implementation across the state. Results are reported using easily understandable graphs. Since the surveys have been administered to more than a million youth, multiple comparisons can be made to evaluate what type of youth a program is serving and what type of youth the program is graduating. On demand reporting via the internet is currently under development which will enable program providers and UBJJ board members access to up-to-date evaluation information at any time. In the future, CJJC hopes to create a means for on-going access to the CARES system in order to link the current outcome measurement to traditional measurement of offending and commitment. Several results from the UBJJ effort illustrate the potential a continuous outcome monitoring system holds for the juvenile court. At the most simple level of analysis, the UBJJ board is able to independently verify how many youth are served by each program from start to finish. In some cases these numbers differed substantially from the contracted amount. Program providers can now access information about the needs of the aggregate group of youth entering the program and can adjust curricula for a better match when needed. In addition, several programs have used the information provided in reports to empirically demonstrate the needs of their youth in order to gain outside funding. Most often these programs are located in rural areas, geographical regions that are chronically under funded. The programs and board also have an ongoing marketing method that clearly shows the easily overlooked successes of prevention and intervention programming. Finally, the board has a reliable method for identifying geographical areas and specific populations that are most in need of services.
State Supervision 25
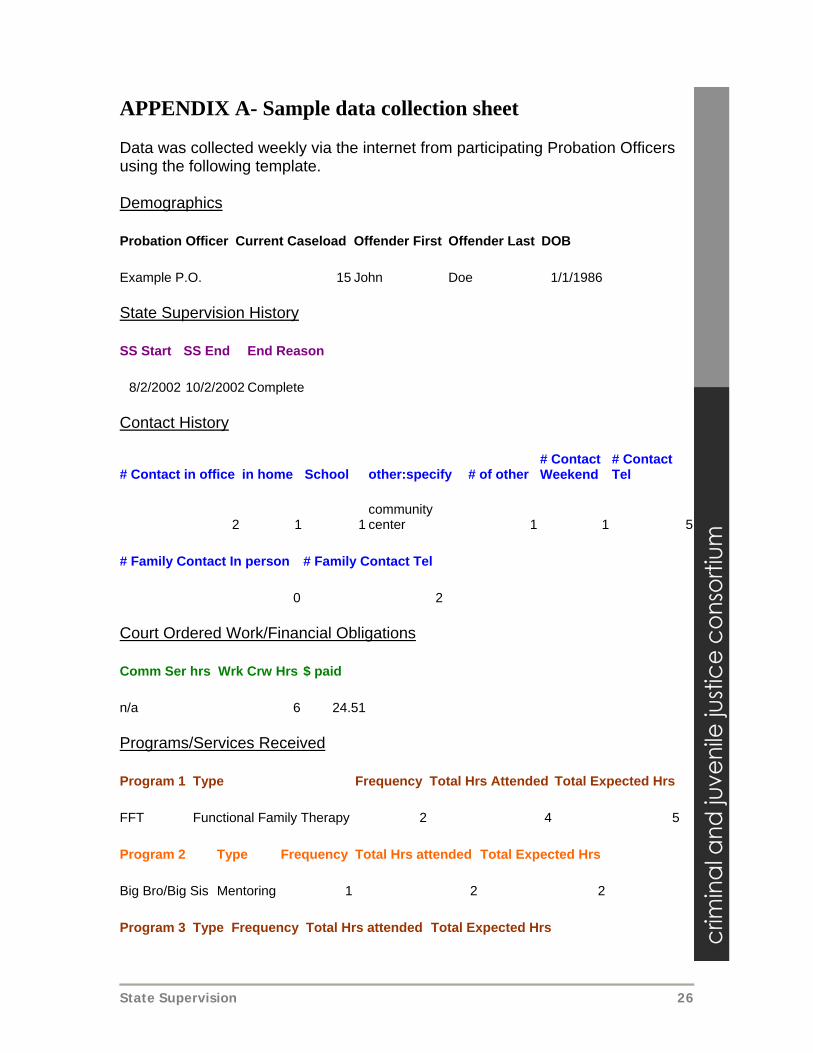
APPENDIX A- Sample data collection sheet Data was collected weekly via the internet from participating Probation Officers using the following template. Demographics Probation Officer Current Caseload Offender First Offender Last DOB Example P.O. 15 John Doe 1/1/1986 State Supervision History SS Start SS End End Reason
8/2/2002 10/2/2002 Complete Contact History
# Contact in office in home School other:specify # of other # Contact Weekend
# Contact Tel
2 1 1community center 1 1 5
# Family Contact In person # Family Contact Tel
0 2 Court Ordered Work/Financial Obligations Comm Ser hrs Wrk Crw Hrs $ paid n/a 6 24.51 Programs/Services Received Program 1 Type Frequency Total Hrs Attended Total Expected Hrs FFT Functional Family Therapy 2 4 5 Program 2 Type Frequency Total Hrs attended Total Expected Hrs Big Bro/Big Sis Mentoring 1 2 2 Program 3 Type Frequency Total Hrs attended Total Expected Hrs
State Supervision 26
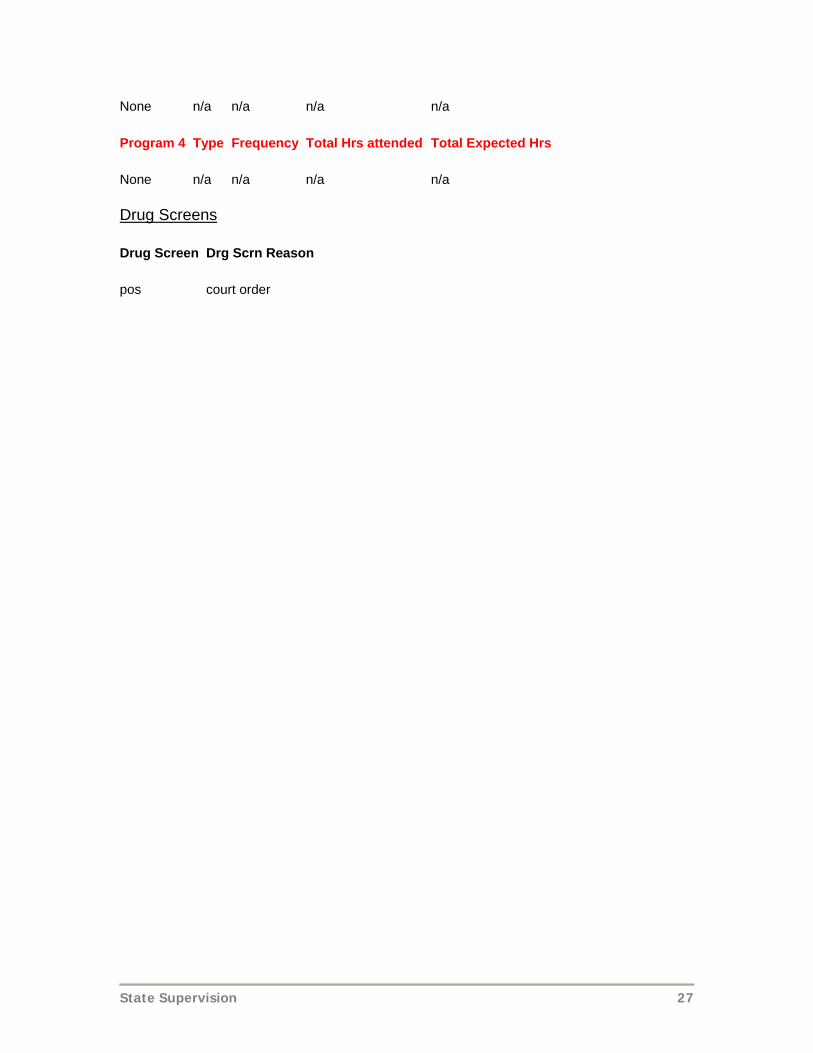
None n/a n/a n/a n/a Program 4 Type Frequency Total Hrs attended Total Expected Hrs None n/a n/a n/a n/a Drug Screens Drug Screen Drg Scrn Reason pos court order
State Supervision 27

APPENDIX B- Procedure Used to Classify State Supervision Contacts and Programming The following details the procedure used to summarize the supervision and services provided to State Supervision youth. Combining the different types and frequency of contacts and programs into summary variables is necessary to create a measurable definition of the intensity of the sanction and a statistical model that has enough sensitivity to detect the effect that the level of intensity has on future involvement with the Juvenile Court. Two summary variables were created to test for any overall impacts of the State Supervision sanction.
• Intensity of Contacts = (Type of Contact + Number of Contacts) divided by Weeks on State Supervision. Each contact type was summed and then the total was divided by the time spent on State Supervision.
• Intensity of Programming = (Program + Attendance Frequency) divided by
Weeks on State Supervision. When offenders received more than one program, the program + attendance frequency was summed and then divided by the period of time spent on State Supervision.
Types of Contact Measured In Person Contacts with Offender Telephone Contacts with Offender In Person Contacts with Family Telephone Contacts with Family Summary Program Categories 1 =Juvenile Court Services Only- Interstate compact, offenders waiting for program opening 2 =Clinical counseling (ind, group, fam, unknown, drug, sex), IOP, day treatment, residential, assessment, evaluation 3 =Educational- Educational, employment 4 =Correctional- detention, O & A, jail 5 =Received JJS services- JJSSS 6 =Received DCFS services- DCFS 7 =Alternatives to Detention- alternative to detention/electronic monitoring/home detention 8 =Prosocial skills building (didactic and experiential), self help group (aa, na), Life Skills/psychoeducational 9 =Community Service- Work Crew, Community service 10 =Drug Court 11 =Miscellaneous services- wrap around services, miscellaneous
State Supervision 28

State Supervision 29

APPENDIX C- Programs Reported used for State Supervision The following lists programs reported by the Probation Officers participating in the study as used for State Supervision. 1st District CAPSA : Program provides weekly, one-hour classes teaching topics including domestic violence, substance abuse, sexual assault, and relationship/communication skills. The youth participate in role-plays, workbooks, and other interactive learning activities. Planned Parenthood: Abstinence-based sexual and health education classes taught weekly for one hour. The course is optional and is free of cost to client. Individual/Family Counseling: Type of therapy is based upon the needs for individuals, families, and groups. Once a biopsychosocial assessment is completed, goals and objectives are set up to meet the needs of the clients. Sessions last b/w one hour and two hours, depending upon type of therapy and needs of client. Sliding scale fee applies. Tutoring: Various Utah State University practicum students are available for placement at probation centers for tutoring and social skills classes. Positive Solutions: Cognitive skills group taught weekly on an individual and group basis. It is an open-ended course that lasts about one-two hours and is free for the client. The program lasts about 8-10 weeks. Choices: A free program taught by inmates of local jail/prison of their experiences there. It is taught every other month and varies according to individual’s probation officer. Youth may ask questions to facilitate their learning but they must also write a paper about their experience. 2nd District Weber Human Services: Juveniles that are currently involved with the court system are required to complete individual/ family, and group therapy. The system works with Functional Family Therapy, Aggression Replacement Training, and Moral Recognition Therapy. There is no cost to the family. Youth participate ten hours a week for 90 days. Youth must also comply with probation officer and other court ordered treatment. Weber Valley Detention: Placement center for youth prior to being sentenced, picked up by parents, or otherwise in transition. It is strictly a holding center but youth must attend school, PE, and some groups.
State Supervision 30

Visions: This is the probate state supervision program of Davis County run by Davis Behavioral Health. It is a day treatment center for youth involved in the court system. They attend 1-3 times a week (depending upon their program status) for twelve weeks. The cost is paid for by the Juvenile Court Contract. Youth attend individual, family, and group therapy sessions, as well as individual case management. 3rd District Programs Life Skills: Psycho-educational program directed towards job training and independent living. Program includes individual therapy utilizing the adolescent development model, positive peer reinforcement model, teams/games/ tournaments (TGT), and holistic programming development. Average length of program is 8 weeks, Monday -Friday, 4-8pm. Client averages about 160 hours of services. SL County Division Substance Abuse Services:Licensed mental health therapists who provide individual and group therapy at a residential, day treatment and/or outpatient level providing alcohol/drug services through the following agencies: Asian Association- Individual, family and group counseling 1 or 2 times per week. The average length of stay is 4-6 months of 1-5 hours of treatment per week. This program focuses on thinking errors, value clarification, skills development, and relapse prevention. Cornerstone Counseling Center- Individual, family, medication evaluation and management, and group counseling that ranges from 1.5 to 5 hours of services per week for ASAM Level I, and 5-15 hours per week for clients scaled as ASAM Level II. The average length of stay is about 6 months. Valley Mental Health- Individual and family counseling once per week for ASAM Level I, and one individual, one family, one therapy group and/or two skills development groups per week for ASAM Level II clients. The average length of stay is approximately 4-6 months and the focus of the program is relapse prevention. Youth Services Center- 60 day program where the youth participates in 1-8 hours of direct services per week depending upon their ASAM level. Youth Support Center- Individual and family treatment, two sessions per week for ASAM Level I, and four to five sessions per week for ASAM Level II. Average length of stay is approximately 4 months, and the program utilizes an ecological/cognitive behavioral approach. Odyssey House – Residential and out patient services depending on the client’s need. Individual and group therapy sessions are provided weekly or
State Supervision 31

more, also depending upon the client’s level of need. Sexual issues and substance abuse are addressed in this program. ISAT- Outpatient therapy services addressing sexual abuse, domestic violence, and substance abuse. They provide individual, group, and family therapy, in addition to psycho educational classes, psychological evaluations, and risk assessments. Provides approximately 4-6 hours of treatment per week. The average length of stay ranges from 6-18 months depending on client. Richard Bashaw & Associates: Private, sex specific program providing evaluations, sexual behavioral assessments and polygraphs. Program utilizes “Pathways”, and therapeutic approach is cognitive behavioral. Client participates in one individual and one group therapy session per week in addition to periodic psychoeducational classes. Average length of stay is approximately one year, plus aftercare treatment. Adolescent Treatment Program: Private, sex specific program. Youth participates in one hour of individual and 1.5 hours of group therapy per week. Sex Specific Counseling-Dr. Morrow: Outpatient, sex specific therapy, provided through individual and family therapy. Individual Counseling- Dr. Thomas and Dr. Harris Individual and family counseling Aspen Youth Alternatives: Wilderness therapy program Dart: Detention alternatives Colors of Success Genesis Youth Center: Educational and work crew residential program to fulfill community services hours or restitution requirements. Lock down facility where non-clinical staff provides individual and group therapy. Program based on the Balanced and Restorative Justice Model. The average length of stay is approximately 60 days. Byrd House: Residential treatment for females. Program teaches life skills, female issues, self-reflection, and utilizes individual and group therapy once per week. Goal is for client to return home with services. Average length of stay is approximately 60 days. Introspect: Private, residential program providing counseling for substance abuse and sex offense through individual, group and family therapy. Program includes community restitution, educational, and proctor services. Client participates in
State Supervision 32

one individual and approximately four group therapy sessions per week. Average length of stay is approximately 60 days. Success Chart School: School-based program providing educational services to youth on probation until they either become mainstream students, or are taken off probation. Altaview Center for Counseling: Therapy relating to substance abuse, family issues, sexual issues, or behavioral issues. Columbus Community: Private, vocational work crew program for individuals with disabilities; may be residential or outpatient based on client need. Residential client receives service 24 hours a day, seven days a week. Outpatient client receives services approximately 6-8 hours a day. Length of stay ranges from three months to several years depending on client need. Slate Canyon Detention: Secure detention center Family Abuse Center: Sex specific NOJOS I and II Levels of treatment. Client attends individual and group therapy once or twice per weeks depending on specified level. Average length of stay is 3-4 months for Level I, and 12-24 months for Level II. Life Line: Sex specific counseling utilizing a five-phase system with weekly individual and group counseling. Client starts as a resident at phase one; at phase four client works toward returning home or independent living. Average length of stay is 10-12 months. Reflections: Provides individual, group and family therapy for girls-at-risk utilizing a substance abuse prevention approach. Requires approximately 8 hours of community service per week, and on-site daily educational services. Average length of stay is 90 days. Triumph (Proctor Home): Residential program where youth resides in proctor care and participates in once-weekly individual and group therapy. Youth receives one hour of skills development per day from proctor parent. Average length of stay is 90 days. Smart Moves (Sugarhouse Boys & Girls Club): After school program providing activities such as homework support and tutoring, computer education, leadership development, games, life and social skills groups, service learning projects, etc. Participation is voluntary, and length of stay is determined by individual youth.
State Supervision 33

Storm Ridge Ranch: Residential program providing weekly individual and group counseling, in addition to daily educational services. Youth works toward completing community service and restitution requirements. Average length of stay is 60 days. TASC: Work program considered part of the DART program. YWCA Teen Home: Residential program providing services to help pregnant teens or teen mothers break multi-generational cycle of poverty, sexual abuse, domestic violence and teen pregnancy. Utilizes education, weekly individual and group therapy, and vocational services to promote independence. Average length of stay is approximately five months, but varies depending on client needs. End (End Nicotine Dependence): Smoking cessation program providing educational classes to youth regarding tobacco use. Youth attends 4-8 sessions depending on specific class. Average duration is 3-6 weeks. 4th District Programs Lightening Peak Home Detention/Slate Canyon Work Crew: Alternative to detention providing youth with supervision while at school, work, or at the facility. Urine analysis, homework, community service and skill development services are provided Monday through Saturday. Average length of stay is approximately 30 days. Observation & Assessment/O&A/O&A EIP program/early intervention program: Medical and behavioral observation and assessment through 24-hour supervision, psychological evaluations and behavioral assessments to determine appropriate services for the youth. Genesis/Genesis Work Camp: Residential work crew program where youth works approximately 30 hours a week for non-profit organizations; additionally youth attends school 2-3 hours a day, five days a week. Average length of stay is approximately 60 days. Life Skills: Skill development classes once a week for 1.5 hours per class. Classes cover topics such as public speaking, cooking, aviation, nutrition, CPR, martial arts, rock climbing, photography, fencing, archery, auto mechanics, group and team building, career training and a variety of computer classes. Length of stay varies, and is determined by the probation officer and/or the judge. Positive Solutions: Cognitive skills program working with juvenile offenders. Youth attends the program once a week for twelve weeks.
State Supervision 34

Utah Family Institute/Functional Family Therapy/Family Therapy: Program offering Functional Family Therapy to youth and their families on a weekly basis following assessment and first phase of treatment. Average duration is approximately 3 months, and average amount of direct service totals about 16 hours. Heritage Drug Treatment/Family/Group/Individual/AA: Substance abuse treatment utilizing the 12-step AA model. Youth attends a minimum of weekly individual and group therapy, or more depending on their level of need. Family therapy is also provided when determined necessary. Average length of stay is 6-9 months. Dr. Roby & Associates: Sex offender, outpatient treatment following a psycho-sexual evaluation. Youth attends approximately one hour of individual therapy and 1.5 hours of group therapy per week. Average length of stay is one year. Wasatch Mental Health: Outpatient program providing sex offender treatment utilizing the NOJOS philosophy and the Pathways workbook. Youth attends one individual and one group therapy session per week as a regular outpatient, or two individual and two group sessions per week as an intensive outpatient. Program focuses on building empathy and relapse prevention. Average length of stay is 16-18 months. Unspecified substance abuse/ Residential/ Day Treatment Sierra Counseling: Individual counseling for sex-specific offences only. JP Lilly, provider. Sex Specific Girls Group: Sex offender treatment providing one individual and one group therapy session per week. Program focuses on relapse prevention and behavior modification. Average length of stay is approximately one year. Common Sense Solutions: A voluntary program that costs $2500 p/family. There is no psychiatric or psychological counseling. It is based on a program developed by L. Ron Hubbard for moral development and self-reliance. Youth participate approx 3 hours p/day, 5 days p/wk, for 3-6 months. Private Day or Boarding School: Day school or boarding, depending on need for 9-12th grade. There is a licensed counselor available once a week off campus. The cost is as follows: $28,900 for borders, $16,800 for day students, and financial aid is available. This is not a residential facility. School tutoring/after-school tutoring: All schools have some type of after-school tutoring/care available for students either free or low-cost.
State Supervision 35

UVMRC: Using behavior modification, the youth will participate in weekly sessions individually and with family for one hour each. There is a spiritual component based on client’s core beliefs. The program lasts about ten months and the cost is $128 initially, with following sessions costing $87 per visit minus insurance coverage. Individual Counseling- Terrence Yero: Therapist who utilizes Functional Family Therapy model for individual and family counseling. The youth will attend weekly sessions b/w 8-12 weeks. There is no cost to the family, as it is part of their required treatment as part of probation. Individual Counseling- Christine Durham: Therapist who assesses and treats youth with various issues including: Conduct Disorder, substance abuse, and poor school performance. Treatment is approx 6 months, with post treatment follow up. Youth can be seen weekly, then can taper as progression increases. Sessions are $100 each and family therapy is included. Odyssey House: START 5th District Individual Counseling- Dr. Brent Turek: Psychological evaluations only. This is an evaluator only. He conducts a thorough assessment including IQ, MMPI, SASSI, and Beck Depression Inventory, among others. The cost is $300 and the youth spends about two hours with him. He then makes an assessment and reports to the probation officer. Washington County Youth Crisis Center: Secure detention for DCFS youth. Southwest Youth Crisis Center (Detention Iron County or Iron County Youth Center): Secure detention for troubled youth. Educational Enhancement Program (Educational Assistant): After-school tutor that assists kids on probation with whatever academic area they are having trouble in. The youth is there for two hours at a time, two times per week. There is no cost to the youth. The tutor coordinates with the parents, the PO, and the school for regular updates. Tobacco Cessation Class: Using the N.O.T. program, youth are given positive alternatives to smoking and directed on daily life management skills with journaling, role playing, and group discussions. The youth are required to be there per their PO. The program is two hours p/session, once p/wk, for five weeks. The cost to the youth is $50.
State Supervision 36

Southwest Center- Youth Services Substance Abuse Treatment a.k.a. REACH: This is a residential/outpatient mental health and substance abuse program. The school component of the program is called REACH, they are not a part of the mental health/substance abuse services. There is both individual and group treatment and the substance abuse component is based upon the Aggression Replacement Training. IOP lasts approx 16 weeks for 1.5-6 hours weekly Monday through Friday. There is a sliding scale fee and they accept many Medicaid clients. Desert Hills Intermediate: An intermediate school which integrates youth in custody (proctor care) into the regular school system. The school will assist in tracking the youth with the proctor parents. Washington County Youth Crisis Center: This is a detention/crisis center for DCFS youth clients only. Not funded for state supervision purposes. DCFS foster placement/ protective supervision: Dept of Children and Family Services (DCFS) coordinates with Division of Youth Corrections if needed. DCFS provides individual and family therapy paid for by the parents. DCFS also provides temporary safe housing for youth removed from abusive or neglectful homes. Washington School District: provides educational tracking for state supervised youth. Individual Counseling- Kathy Killion Harmon: Provides individual and family counseling. Southwest Drug and Alcohol (formerly PACE): This is an IOP program designed to assist youth to discontinue drug and alcohol use. It is approx 16 weeks depending on the youth’s motivation and level of ability to complete the assignments. The youth are involved four days p/wk at three hours at a time. It is based upon a sliding fee scale. There is also a Prime for Life program, which is a less intensive drug and alcohol program. The youth are there for 16 hours total, taught in two- hour sessions. Turning Point Group Home: Residential facility treating youth with conduct disorders, drug/alcohol issues or other personality issues utilizing a positive peer culture. Youth attends group and individual therapy 3.5 hours each day, 5 days a week. Average length of stay is 10-12 months. 6th District Individual Counseling- Jamie Bacon: Counseling specifically for youth sexual offenders both male and female. The program focus is separated by ages, with ages 6-12 using the “Steps for Healthy Touching”, while the 12-17 year-olds use
State Supervision 37

the “Pathways” curriculum. The youth’s parents are strongly encouraged to attend and participate in their treatment. Youth also receive mental health treatment as needed. Youth may be involved from six months to two years. Counseling is also provided for victims of abuse. Youth will attend weekly individual and group therapy; the cost for the whole program is about $3000. Panguitch Middle/High School: An after-school program was developed to assist youth either voluntary or court-ordered with their assignments. The school liaison will track the student’s progress and provide information to the courts. Work Crew: Work crew to fulfill community service requirements through landscaping, picking up trash, and other manual labor jobs. Required to complete a minimum of 30 hours per month, but average around 36 hours. Participate in program three times per week for three hours each day. Southwest Center Group Therapy/ Southwest Center Aftercare/AA: Provides individual and group therapy to clients of the court. Program utilizes a strength-based theory and wrap-around services (multiple team involvement). The youth are involved for about twelve sessions and the family pays for each session unless they are Medicaid clients. 7th District Alternative Youth Adventures: Wilderness program. 8th District Connections: After school program to assist students in education and enrichment activities. Participation is voluntary, and youth attends 1-5 days per week throughout the year. Ashley Family Clinic: Provides family, individual, group treatment and psychological assessments. Northeastern Counseling Center: Youth are provided individual and family counseling, as well as substance abuse treatment and medication management. Services are based on a sliding scale fee. The amount of time spent with a youth depends upon the reason for treatment and program involvement. There is a drug court program, as well as a “Nurturing Parenting Program”.
State Supervision 38

ISAT:. Educational Enhancement Program: This is an aftercare/summer program designed to assist youth in improving their grades. State supervised youth are required to attend three times p/week, for two hours at a time. Youth are allowed to miss the program if they are working, are at counseling, or another identifiable excuse.
State Supervision 39

APPENDIX D- Sharing the State Supervision Sanction across Multiple State Agencies Background This paper revisits the effect of sharing the State Supervision sanction among multiple agencies by summarizing the findings of An Evaluation of Utah’s Early Intervention Mandate: The Juvenile Sentencing Guidelines and Intermediate Sanctions (the Sentencing Guidelines study) relevant to this topic. The Criminal and Juvenile Justice Consortium, under a grant from the National Institute of Justice, conducted the Sentencing Guidelines study. Findings State Supervision was intended to increase the ability of the juvenile system to control offenders who needed more than regular probation contacts and services without committing them to long-term, out-of-home placements. The sanction would be shared among the three agencies, with the Juvenile Court providing the core interventions and JJS and DCFS implementing short-term placements when needed. This arrangement was a new situation for the juvenile system as no other sanction is shared across agencies. From the evaluation interviews and documentation of the planning process, the major issue coloring the implementation of the State Supervision sanction involved the difficulty of these agencies, with diverse philosophies and approaches to juvenile offenders, coordinating to provide services within a single sanction. In practice, for many respondents coordinating services and supervision within the sanction has been difficult. The roles each agency should play were ambiguous to many respondents. A probation officer’s frustration over this issue typifies many respondents. He stated, “there is overlap between Youth Corrections and the Juvenile Court ...[and] DCFS [Division of Child and Family Services] doesn’t even know what [State Supervision] is!” The role of DCFS was questioned in every area of the state. Most respondents either didn’t know that this agency was involved with the State Supervision sanction or didn’t know what interventions had been created by this agency for State Supervision offenders. It should be noted that this agency received far less funding than the other two. However, it appears that there had been no discernable impact from the funds that DCFS did receive. Respondent views of the success of the Juvenile Court and JJS sharing the sanction were more mixed. Sixty-four percent of participants perceived problems sharing the sanction. Interviewees most commonly believed difficulties stemmed from coordinating supervision and services within one sanction. They attributed
State Supervision 40

these difficulties to deep differences between the agencies in philosophical orientation and in the lack of an efficient structure for negotiating combined service provision. Looking at the philosophical difficulties, in several areas these problems appeared to be due to pre-existing poor relations overall between the two agencies. These relations appeared to change little during the course of the study. In one probation office tensions had erupted into a refusal of each agency to work together with State Supervision offenders, as reported by both probation officers and case managers. In regards to the logistical tasks of sharing a sanction, there existed many ambiguities concerning who was responsible for sharing files, paying for services, and entering data into the Juvenile Information System. Most importantly, interviewees could not provide clear, consistent criteria for transferring State Supervision offenders between agencies. The majority of participants indicated they based their decision primarily on poor response to State Supervision when under the care of the Juvenile Court. Poor responding typically was defined as not responding to programs or services, technical violations, or new offenses. Additionally, most judges included decisions of whether “the child needs to be removed from the community” when evaluating what agency should be involved in his or her care. However, two judges indicated they would not sentence juveniles to Youth Corrections State Supervision programs at all. As one of these judges stated, “Juvenile Court State Supervision is the only [sanction] I put [an offender] on.... Otherwise I aggravate them up to Community Placement.” In other areas, offenders are ordered into Youth Corrections placement immediately upon qualifying for State Supervision rather than progressing through a graduated sanctioning approach by utilizing Juvenile Court services first. Without clear criteria for the transfer of State Supervision youth between agencies most local areas appeared to have implemented an ad hoc system that was dependent upon the personalities and programs in the local area. As mentioned above, this type of approach resulted in quite variable criteria and, for many practitioners, was a source of concern. Many respondents desired clarification of when and how State Supervision offenders were to be transferred between agencies.
Recommendations
The most pressing need is to clarify the intended progression between Juvenile Court and Youth Corrections within State Supervision. Criteria need to be set to guide front-line staff on which agency should be used and at what time during the period that an offender is on State Supervision. These criteria should include specific instructions on which agency is to have primary supervision of the
State Supervision 41

offender. It should also include guidance on who will make the decision as to when an offender should be sent to a program in another agency. The logistic difficulties of sharing a sanction among agencies should be attended too, including file sharing, fiscal responsibility and entry of JIS data. The new Juvenile Information System should make real-time file sharing possible. Lastly, the role of DCFS should be clarified. During the study period, this agency appeared to have no defined role. If it is to continue to receive funding for State Supervision, the purpose of this money should be clarified.
State Supervision 42

State Supervision 43

APPENDIX E- State Supervision Data Tables Question #1a- Re-Offense Linear Regression Predicting Non Technical, Re-Offense Episode Rates in the Year Following Placement in State Supervision or Probation Sanction
Model Summary(d)
Change Statistics
Model R R
Square
Adjusted R
Square
Std. Error of the
Estimate
R Square Change
F Change df1 df2
Sig. F Change
1 .659(a) .434 .434 1.38886 .434 1343.560 2 3506 .0002 .660(b) .435 .434 1.38780 .001 3.672 2 3504 .0263 .661(c) .437 .436 1.38604 .002 9.922 1 3503 .002a Predictors: (Constant), Age At First Offense, Lifetime Prior Non Technical Offenses b Predictors: (Constant), Age At First Offense, Lifetime Prior Non Technical Offenses, Dichotomized Race, Gender c Predictors: (Constant), Age At First Offense, Lifetime Prior Non Technical Offenses, Dichotomized Race, Gender, SS v Prob Dichotomized d Dependent Variable: One Year Post Non Technical Offenses
Coefficients(a)
Unstandardized Coefficients
Standardized Coefficients Correlations
Collinearity Statistics
Model B Std. Error Beta T Sig.
Zero-order Partial Part Tolerance VIF
(Constant) -1.364 .178 -7.655 .000 Lifetime Prior Non Technical Offenses
.481 .009 .681 51.824 .000 .640 .659 .659 .934 1.071
1
Age At First Offense .146 .012 .160 12.152 .000 -.015 .201 .154 .934 1.071
2 (Constant) -1.462 .188 -7.759 .000 Lifetime Prior Non Technical Offenses
.479 .009 .679 51.497 .000 .640 .656 .654 .927 1.078
Age At First Offense .147 .012 .161 12.234 .000 -.015 .202 .155 .930 1.075
Gender .134 .063 .027 2.112 .035 .084 .036 .027 .985 1.015Dichotomized Race -.091 .055 -.021 -1.667 .096 -.021 -.028 -
.021 .999 1.001
3 (Constant) -1.508 .189 -7.989 .000 Lifetime Prior Non Technical Offenses
.476 .009 .675 51.084 .000 .640 .653 .648 .920 1.087
Age At First Offense .148 .012 .162 12.306 .000 -.015 .204 .156 .930 1.075
Gender .133 .063 .027 2.106 .035 .084 .036 .027 .985 1.015Dichotomized Race -.102 .055 -.024 -1.862 .063 -.021 -.031 -
.024 .996 1.004
SS v Prob Dichotomized .159 .051 .040 3.150 .002 .097 .053 .040 .986 1.014
a Dependent Variable: One Year Post Non Technical Offenses
State Supervision 44

Question #1b- JJS Commitment Logistic Regression Predicting JJS Commitment in the Year Following Placement in State Supervision or Probation Sanction (Excluding Commitments to Detention, Observation and Assessment, and State Supervision Short-Term Placements) Dependent Variable Encoding Original Value Internal Value Never 0 At Least Once 1
Omnibus Tests of Model Coefficients Chi-square Df Sig.
Step 8.279 1 .004Block 8.279 1 .004
Step 1
Model 563.855 5 .000 Variables in the Equation B S.E. Wald df Sig. Exp(B)
SUMPRE_R .609 .050 146.111 1 .000 1.838
AGEFIR_3 -1.099 .080 186.677 1 .000 .333
GENDER 1.481 .225 43.189 1 .000 4.396ETHNIC -.030 .029 1.039 1 .308 .970GRP_D .313 .108 8.369 1 .004 1.368
Step 1(a)
Constant -2.872 .329 76.025 1 .000 .057a Variable(s) entered on step 1: GRP_D. JJS Custody * SS v Prob Dichotomized Crosstabulation
SS v Prob Dichotomized
Prob SS Total Count 2168 982 3150 % within SS v Prob Dichotomized
80.6% 77.4% 79.6%
Never
Std. Residual .6 -.9 Count 521 286 807 % within SS v Prob Dichotomized
19.4% 22.6% 20.4%
JJS Custody
At Least Once
Std. Residual -1.2 1.7 Count 2689 1268 3957 Total % within SS v Prob Dichotomized
100.0% 100.0% 100.0%
State Supervision 45

Chi-Square Tests
Value Df Asymp. Sig.
(2-sided) Exact Sig. (2-sided)
Exact Sig. (1-sided)
Pearson Chi-Square 5.367(b) 1 .021 Continuity Correction(a) 5.173 1 .023
Likelihood Ratio 5.298 1 .021 Fisher's Exact Test .022 .012 Linear-by-Linear Association 5.366 1 .021
N of Valid Cases 3957
State Supervision 46

Question #2a- Predicting Re-Offense from Contact Intensity Linear Regression Predicting Non Technical, Re-Offense Episode Rates in the Year Following Placement in State Supervision Sanction Accounting for Contact Intensity
Model Summary(d)
Change Statistics
Model R R
Square
Adjusted R
Square
Std. Error of the
Estimate
R Square Change
F Change df1 df2
Sig. F Change
1 .642(a) .412 .410 1.35760 .412 216.323 2 618 .0002 .644(b) .414 .410 1.35710 .002 1.227 2 616 .2943 .644(c) .414 .409 1.35815 .000 .054 1 615 .816a Predictors: (Constant), Age At First Offense, Lifetime Prior Non Technical Offenses b Predictors: (Constant), Age At First Offense, Lifetime Prior Non Technical Offenses, Gender, Dichotomized Race c Predictors: (Constant), Age At First Offense, Lifetime Prior Non Technical Offenses, Gender, Dichotomized Race, Intensitycontact_wk d Dependent Variable: One Year Post Non Technical Offenses
Coefficients(a) Unstandardized
Coefficients Standardized Coefficients Correlations
Collinearity Statistics
Model B Std. Error Beta t Sig.
Zero-order Partial Part Tolerance VIF
(Constant) -.989 .388 -2.551 .011 Lifetime Prior Non Technical Offenses .440 .021 .665 20.791 .000 .624 .642 .641 .930 1.076
1
Age At First Offense .129 .026 .157 4.911 .000 -.019 .194 .152 .930 1.076
2 (Constant) -.860 .410 -2.095 .037 Lifetime Prior Non Technical Offenses .441 .021 .668 20.839 .000 .624 .643 .643 .926 1.080
Age At First Offense .131 .026 .160 4.978 .000 -.019 .197 .154 .923 1.083
Gender -.220 .153 -.044 -1.438 .151 -.008 -.058 -.044 .996 1.004
Dichotomized Race .067 .116 .018 .575 .565 .027 .023 .018 .991 1.009
3 (Constant) -.849 .413 -2.057 .040 Lifetime Prior Non Technical Offenses .441 .021 .668 20.825 .000 .624 .643 .643 .926 1.080
Age At First Offense .131 .026 .160 4.968 .000 -.019 .196 .153 .923 1.084
Gender -.219 .153 -.044 -1.429 .153 -.008 -.058 -.044 .995 1.005
Dichotomized Race .066 .116 .018 .571 .568 .027 .023 .018 .991 1.009Intensitycontact_wk
-.002 .008 -.007 -.233 .816 .000 -.009 -.007 .998 1.002
a Dependent Variable: One Year Post Non Technical Offenses
State Supervision 47

Question #2b- Predicting Re-Offense from Program Intensity Linear Regression Predicting Non Technical, Re-Offense Episode Rates in the Year Following Placement in State Supervision Sanction Accounting for Program Intensity
Model Summary(d)
Change Statistics
Model R R
Square
Adjusted R
Square
Std. Error of the
Estimate
R Square Change
F Change df1 df2
Sig. F Change
1 .642(a) .412 .410 1.35760 .412 216.323 2 618 .0002 .644(b) .414 .410 1.35710 .002 1.227 2 616 .2943 .644(c) .414 .410 1.35779 .000 .380 1 615 .538a Predictors: (Constant), Age At First Offense, Lifetime Prior Non Technical Offenses b Predictors: (Constant), Age At First Offense, Lifetime Prior Non Technical Offenses, Gender, Dichotomized Race c Predictors: (Constant), Age At First Offense, Lifetime Prior Non Technical Offenses, Gender, Dichotomized Race, Intensityprogram_wk d Dependent Variable: One Year Post Non Techical Offenses
Coefficients(a) Unstandardized
Coefficients Standardized Coefficients Correlations
Collinearity Statistics
Model B Std. Error Beta t Sig.
Zero-order Partial Part Tolerance VIF
(Constant) -.989 .388 -2.551 .011 Lifetime Prior Non Technical Offenses .440 .021 .665 20.791 .000 .624 .642 .641 .930 1.076
1
Age At First Offense .129 .026 .157 4.911 .000 -.019 .194 .152 .930 1.0762 (Constant) -.860 .410 -2.095 .037
Lifetime Prior Non Technical Offenses .441 .021 .668 20.839 .000 .624 .643 .643 .926 1.080
Age At First Offense .131 .026 .160 4.978 .000 -.019 .197 .154 .923 1.083Gender -.220 .153 -.044 -1.438 .151 -.008 -.058 -
.044 .996 1.004
Dichotomized Race .067 .116 .018 .575 .565 .027 .023 .018 .991 1.009
3 (Constant) -.840 .412 -2.040 .042 Lifetime Prior Non Technical Offenses .442 .021 .668 20.837 .000 .624 .643 .643 .926 1.080
Age At First Offense .131 .026 .160 4.979 .000 -.019 .197 .154 .923 1.083Gender -.216 .153 -.044 -1.410 .159 -.008 -.057 -
.044 .994 1.006
Dichotomized Race .064 .116 .017 .553 .581 .027 .022 .017 .990 1.010Intensityprogram_wk
-.009 .014 -.019 -.617 .538 -.007 -.025 -.019 .996 1.004
a Dependent Variable: One Year Post Non Technical Offenses
State Supervision 48
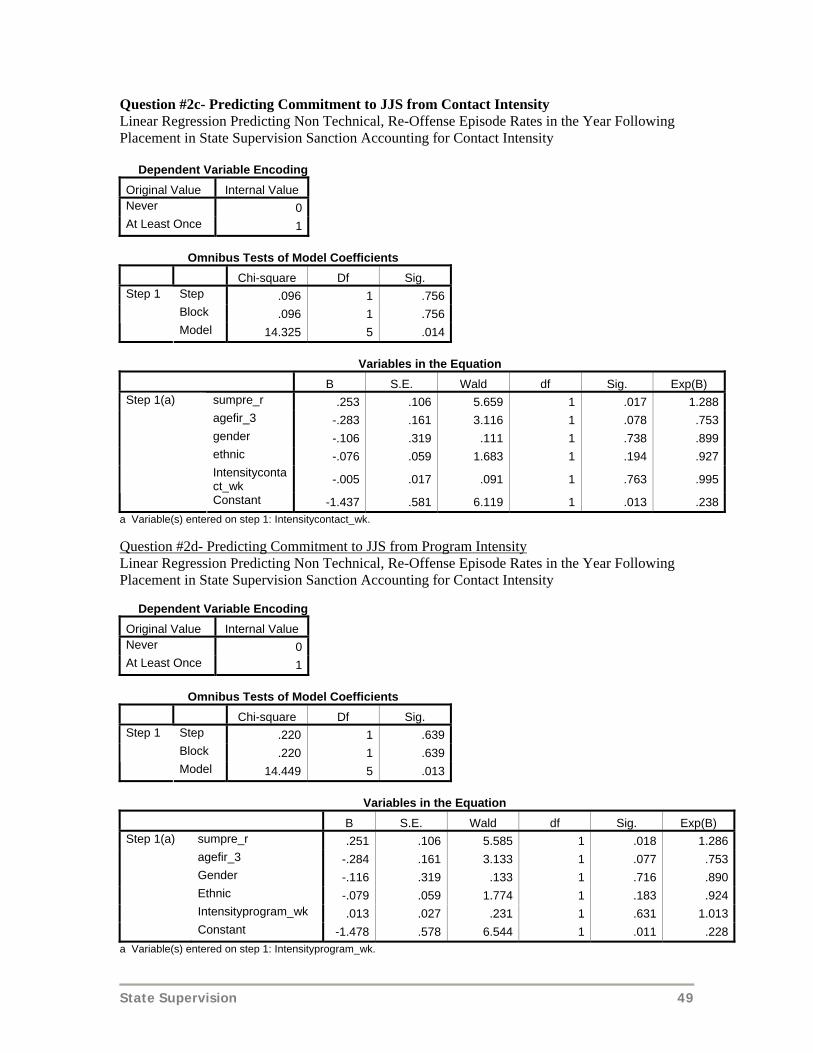
Question #2c- Predicting Commitment to JJS from Contact Intensity Linear Regression Predicting Non Technical, Re-Offense Episode Rates in the Year Following Placement in State Supervision Sanction Accounting for Contact Intensity Dependent Variable Encoding Original Value Internal Value Never 0 At Least Once 1
Omnibus Tests of Model Coefficients Chi-square Df Sig.
Step .096 1 .756Block .096 1 .756
Step 1
Model 14.325 5 .014 Variables in the Equation B S.E. Wald df Sig. Exp(B)
sumpre_r .253 .106 5.659 1 .017 1.288agefir_3 -.283 .161 3.116 1 .078 .753gender -.106 .319 .111 1 .738 .899ethnic -.076 .059 1.683 1 .194 .927Intensitycontact_wk -.005 .017 .091 1 .763 .995
Step 1(a)
Constant -1.437 .581 6.119 1 .013 .238a Variable(s) entered on step 1: Intensitycontact_wk. Question #2d- Predicting Commitment to JJS from Program Intensity Linear Regression Predicting Non Technical, Re-Offense Episode Rates in the Year Following Placement in State Supervision Sanction Accounting for Contact Intensity Dependent Variable Encoding Original Value Internal Value Never 0 At Least Once 1
Omnibus Tests of Model Coefficients Chi-square Df Sig.
Step .220 1 .639Block .220 1 .639
Step 1
Model 14.449 5 .013 Variables in the Equation B S.E. Wald df Sig. Exp(B) Step 1(a) sumpre_r .251 .106 5.585 1 .018 1.286 agefir_3 -.284 .161 3.133 1 .077 .753 Gender -.116 .319 .133 1 .716 .890 Ethnic -.079 .059 1.774 1 .183 .924 Intensityprogram_wk .013 .027 .231 1 .631 1.013 Constant -1.478 .578 6.544 1 .011 .228
a Variable(s) entered on step 1: Intensityprogram_wk.
State Supervision 49

T-Test for 1 Year Post Technical Violations Group Statistics
SS v Prob Dichotomized N Mean Std. Deviation
Std. Error Mean
.00 2689 .5649 1.05555 .02036 1 Year Post Sum Technical Violations 1.00 1268 1.0158 1.47852 .04152
Independent Samples Test
Levene's Test for Equality of
Variances t-test for Equality of Means 95%
Confidence Interval of the
Difference
F Sig. T df
Sig. (2-
tailed)Mean
DifferenceStd. Error Difference Lower Upper
Equal variances assumed
150.984 .000 -10.963 3955 .000 -.45088 .04113 -
.53151-
.37024
1 Year Post Sum Technical Violations Equal
variances not assumed
-9.750 1897.551 .000 -.45088 .04624 -.54157
-.36019
State Supervision 50

State Supervision 51

APPENDIX F- An Evaluation of the Visions Program at Davis Behavioral Health
An Outcome Evaluation of The Visions Program
Davis Behavioral Health
Bach-Harrison, LLC 757 E. South Temple Suite #120 Salt Lake City, Utah 84102 Tel. (801) 359-2064 June 10, 2004
State Supervision 52

Introduction
At the request of Davis Behavioral Health, Bach-Harrison conducted an evaluation of the juvenile offenders placed in the Visions program. This report provides the results of the evaluation. First results are presented for the survey instruments that the Visions program administers to all youth at the start and end of each program. After these results, a pilot analysis of re-offense rates of Visions offenders is presented and compared with a general State Supervision offender reference group.
Introduction Youth Outcome Questionnaire
Summary for Visions ϖϖϖϖ
This report summarizes some of the findings from Youth Outcome Questionnaires administered to youth entering Visions from 6/2003 to 6/2004. The results for offenders in the Visions program are presented as rated from the perspective of the offender and their parent or guardian at the beginning.
CONTENTS: Introduction: • Functional
Family Therapy Survey
• Youth Outcome
Questionnaire • Re-Offense and
JJS Commitment Rates
Youth Outcome Questionnaire Overview The Youth Outcome Questionnaire-Self Report (Y-OQ) is designed to measure changes in the most common behavioral and psychological problems in youth. The survey is comprised of an overall distress score and the six subscales listed in Table 1 on the next page. The YOQ provides two important types of information. It shows the level of distress for participants at program start. In addition, the questionnaire is used to evaluate the amount of change upon program completion. Response to a specific program can be measured in terms of changes on an overall distress scale or a particular sub-scale. Report Prepared by: Bach Harrison, L.L.C. 757 East South Temple, Suite 120 Salt Lake City, Utah 84102 Phone: 801-359-2064
State Supervision 53
Visions Program Davis Behavorial Health
YOQ Summary June 1, 2004

State Supervision 54
In order to read the Y-OQ Charts and Tables, it is important to understand how the results are analyzed. The YOQ has been given to large samples of youth in several western states. From this information cutpoints were developed to classify youth in terms of the level of psychological and behavioral problems they report. Youth are classified into those who report similar levels of psychological symptoms and functioning as their peers, termed the Normal Population, and those who report functioning similar to youth receiving mental health treatment, termed the Distressed Population. The cutpoints were established by finding the score that best distinguished between youth who were receiving treatment for psychological difficulties and those who were not. The results are presented for each individual sub-scale and a total distress score.
In order to read the Y-OQ Charts and Tables, it is important to understand how the results are analyzed. The YOQ has been given to large samples of youth in several western states. From this information cutpoints were developed to classify youth in terms of the level of psychological and behavioral problems they report. Youth are classified into those who report similar levels of psychological symptoms and functioning as their peers, termed the Normal Population, and those who report functioning similar to youth receiving mental health treatment, termed the Distressed Population. The cutpoints were established by finding the score that best distinguished between youth who were receiving treatment for psychological difficulties and those who were not. The results are presented for each individual sub-scale and a total distress score.
Program Change Chart Program Change Chart
The Program Change Chart presents the results for Community Connections youth as a group. From this chart program changes in the entire group of youth can be assessed. This chart shows the percentage of youth falling into the distressed population at each administration of the questionnaire. The bars represent this percentage of youth, that is, those classified into the Distressed Population on each scale.
The Program Change Chart presents the results for Community Connections youth as a group. From this chart program changes in the entire group of youth can be assessed. This chart shows the percentage of youth falling into the distressed population at each administration of the questionnaire. The bars represent this percentage of youth, that is, those classified into the Distressed Population on each scale.
Table 1 Areas measured by the Y-OQ Intrapersonal Distress
This scale measures the degree of emotional distress. Questions cover anxiety, depression, fearfulness, hopelessness, and self-harm.
Somatic This scale measures physical distress. Questions cover symptoms such as headaches, dizziness, stomachaches, nausea, bowel difficulties, and pain or weakness in joints.
Interpersonal Relations
This scale measures issues concerning interpersonal relations. Questions cover attitude towards others, interactions with family and friends, cooperativeness, aggressiveness, arguing, and defiance.
Critical Items The scale measures severe behaviors often exhibited by adolescents who are hospitalized for mental health problems. Questions cover paranoia, obsessive-complusive behaviors, hallucinations, delusions, suicide, mania, and eating disorders.
Social Problems
The scale measures problematic social behaviors. Questions cover truancy, sexual problems, running away, vandalism, and substance abuse.
Behavioral Dysfunction
This scale measures ability to organize, and complete tasks. Questions cover inattention, hyperactivity, and impulsivity.
Total Score The total score provides a measure of global distress by summing the previous scales to create a single overall distress score.
YOQ Summary

Percentage of Participants in the Distressed Population
45%
37%
61%
57%
52%
39%
52%
33% 33%
80%77%
50%
30%
57%
0%Intrapersonal Distress Somatic Interpersonal Relations Social Problems Behavioral Dysfunction Critical Items Total Score
Scale
State Supervision 55
10%
20%
30%
40%
50%
60%
70%
80%
90%
100%
Offender Report Parent Report
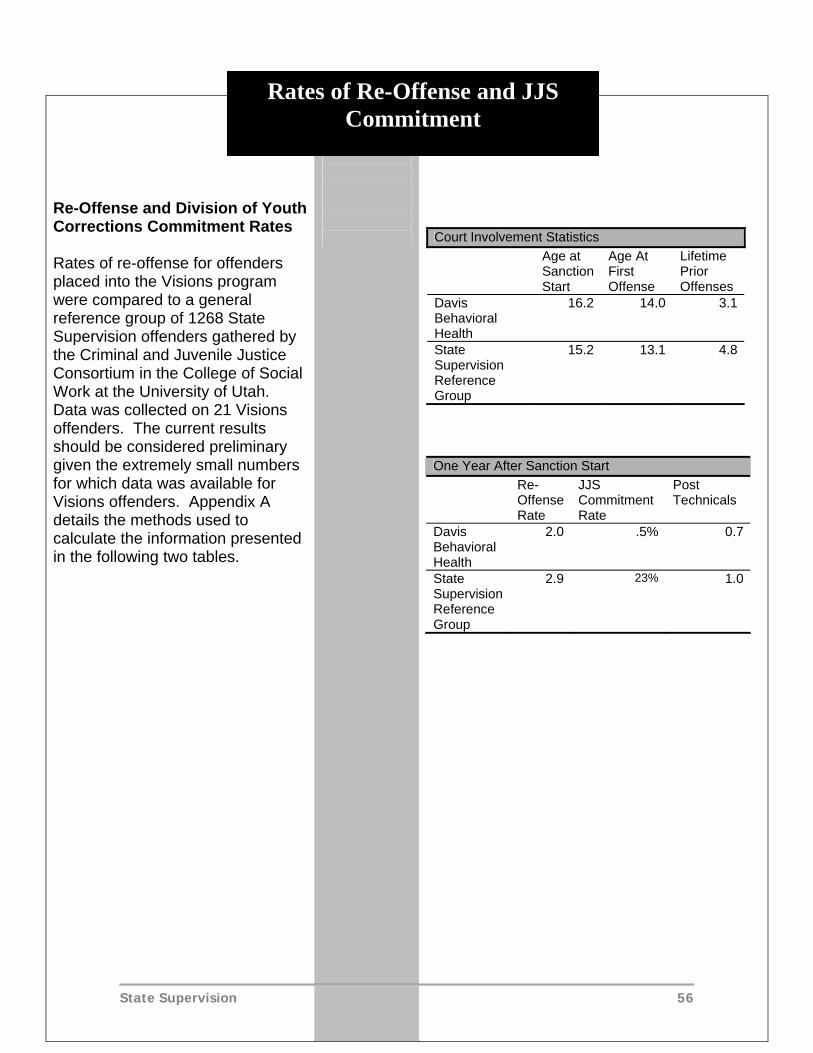
Re-Offense and Division of Youth Corrections Commitment Rates Rates of re-offense for offenders placed into the Visions program were compared to a general reference group of 1268 State Supervision offenders gathered by the Criminal and Juvenile Justice Consortium in the College of Social Work at the University of Utah. Data was collected on 21 Visions offenders. The current results should be considered preliminary given the extremely small numbers for which data was available for Visions offenders. Appendix A details the methods used to calculate the information presented in the following two tables.
Court Involvement Statistics Age at
Sanction Start
Age At First Offense
Lifetime Prior Offenses
Davis Behavioral Health
16.2 14.0 3.1
State Supervision Reference Group
15.2 13.1 4.8
One Year After Sanction Start Re-
Offense Rate
JJS Commitment Rate
Post Technicals
Davis Behavioral Health
2.0 .5% 0.7
State SupervisionReference Group
2.9 1.023%
State Supervision 56
Rates of Re-Offense and JJS Commitment

State Supervision 57

APPENDIX G- The Risk and Protective Factor Model Risk- and protective-focused prevention and intervention is based on a simple premise: To prevent a problem from happening or continuing, we need to identify the factors that increase the risk of that problem developing and then find ways to reduce the risks. Just as medical researchers have found risk factors for heart attacks such as diets high in fats, lack of exercise, and smoking; a team of researchers at the University of Washington have defined a set of risk factors for drug abuse. The research team also found that some children exposed to multiple risk factors manage to avoid behavior problems even though they were exposed to the same risks as children who exhibited behavior problems. Based on research, they identified protective factors and processes that work together to buffer children from the effects of high-risk exposure and lead to the development of healthy behaviors. Risk factors include characteristics of community, family, and school environments, and characteristics of students and their peer groups, that are known to predict increased likelihood of drug use, delinquency, and violent behaviors among youth (Hawkins, Catalano, & Miller, 1992; Hawkins, Arthur & Catalano, 1995; Brewer, Hawkins, Catalano, & Neckerman, 1995). Protective factors exert a positive influence or buffer against the negative influence of risk, thus reducing the likelihood that adolescents will engage in problem behaviors. Protective factors identified through research reviewed by the Social Development Research Group include individual characteristics; social bonding to family, school, community, and peers; and healthy beliefs and clear standards for behavior. Research on risk and protective factors has important implications for prevention and intervention efforts. The premise of this approach is that in order to promote positive youth development and prevent problem behaviors, it is necessary to address those factors that predict the problem. By measuring risk and protective factors in a population, specific risk factors that are elevated and widespread can be identified and targeted by preventive interventions that also promote related protective factors. For example, if academic failure is identified as an elevated risk factor in a community, then mentoring and tutoring interventions can be provided that will improve academic performance, and also increase opportunities and rewards for classroom participation. Risk- and protective-focused drug abuse prevention is based on the work of J. David Hawkins, Ph.D., Richard F. Catalano, Ph.D.; and a team of researchers at the University of Washington in Seattle. Beginning in the early 1980’s the group researched adolescent problem behaviors and identified risk factors for adolescent drug abuse and delinquency. Not surprisingly, they found that an interrelationship exists between adolescent drug abuse, delinquency, school
State Supervision 58
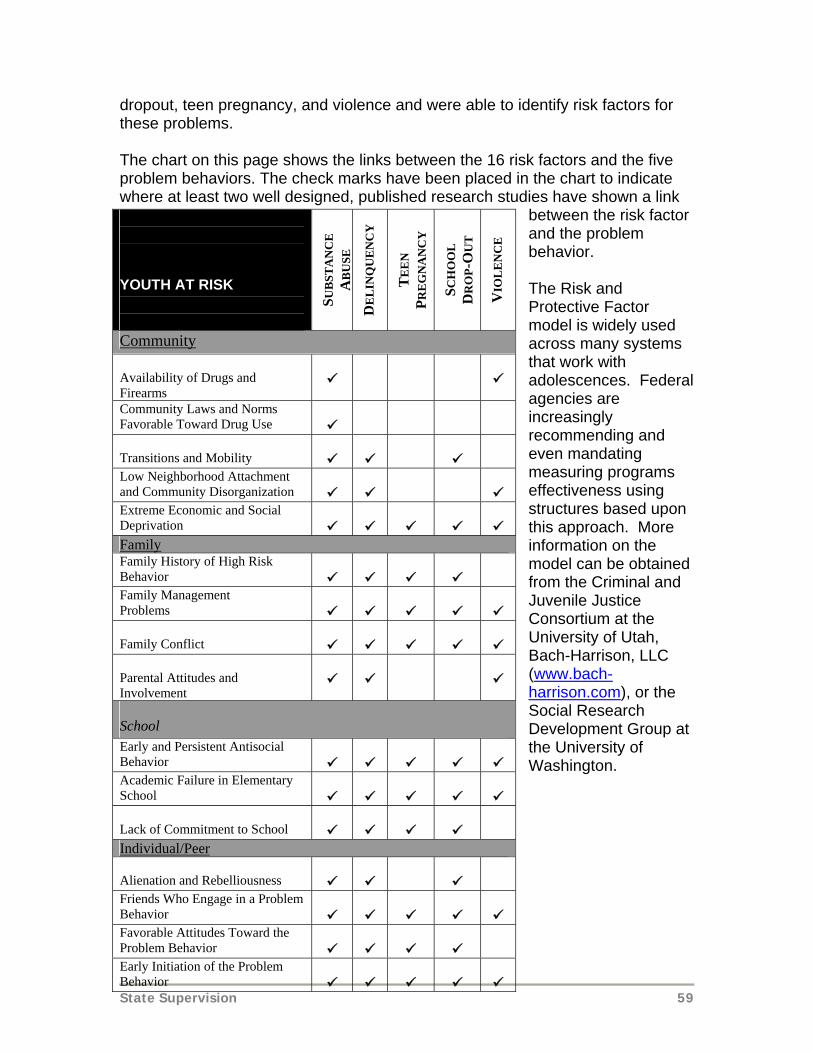
dropout, teen pregnancy, and violence and were able to identify risk factors for these problems. The chart on this page shows the links between the 16 risk factors and the five problem behaviors. The check marks have been placed in the chart to indicate where at least two well designed, published research studies have shown a link
between the risk factor and the problem behavior.
SCH
OO
L
DR
OP-
OU
T
DE
LIN
QU
EN
CY
TE
EN
PR
EG
NA
NC
Y
SUB
STA
NC
E
AB
USE
YOUTH AT RISK The Risk and Protective Factor model is widely used across many systems that work with adolescences. Federal agencies are increasingly recommending and even mandating measuring programs effectiveness using structures based upon this approach. More information on the model can be obtained from the Criminal and Juvenile Justice Consortium at the University of Utah, Bach-Harrison, LLC (
VIO
LE
NC
E
Community Availability of Drugs and Firearms
Community Laws and Norms Favorable Toward Drug Use
www.bach-harrison.com), or the Social Research Development Group at the University of Washington.
Transitions and Mobility
Low Neighborhood Attachment and Community Disorganization
Extreme Economic and Social Deprivation
Family
Family History of High Risk Behavior
Family Management Problems
Family Conflict
Parental Attitudes and Involvement
School Early and Persistent Antisocial Behavior
Academic Failure in Elementary School
Lack of Commitment to School Individual/Peer Alienation and Rebelliousness
Friends Who Engage in a Problem Behavior
Favorable Attitudes Toward the Problem Behavior Early Initiation of the Problem
State Supervision 59
Behavior