Embed Size (px)
Citation preview
Impact Evaluation Report 65
Anjini Kochar Alakh Sharma Akhilesh Sharma
Health
Impact of the Uddeepan programme on child health and nutrition in India
September 2017
About 3ie
The International Initiative for Impact Evaluation (3ie) is an international grant-making NGO promoting evidence-informed development policies and programmes. We are the global leader in funding, producing and synthesising high-quality evidence of what works, for whom, why and at what cost. We believe that high-quality and policy-relevant evidence will help make development more effective and improve people’s lives.
3ie impact evaluations
3ie-supported impact evaluations assess the difference a development intervention has made to social and economic outcomes. 3ie is committed to funding rigorous evaluations that include a theory-based design, and use the most appropriate mix of methods to capture outcomes that are useful in complex developmental contexts.
About this report
3ie accepted the final version of the report Clustered approaches to improving child health and nutrition: evidence from India, as partial fulfilment of requirements under grant CPW.02.NAC.IE awarded under Bihar Policy Window. The content has been copy-edited and formatted for publication by 3ie. All the content is the sole responsibility of the authors and does not represent the opinions of 3ie, its donors or its board of commissioners. Any errors and omissions are also the sole responsibility of the authors. All affiliations of the authors listed in the title page are those that were in effect at the time the report was accepted. Any comments or queries should be directed to the corresponding author, Anjini Kochar, at [email protected]
3ie has received funding for the Bihar Policy Window from UKaid through the Department for International Development. Suggested citation: Kochar, A, Sharma, A and Sharma, A, 2017. Impact of the Uddeepan programme on child health and nutrition in India, 3ie Impact Evaluation Report 65. New Delhi: International Initiative for Impact Evaluation (3ie).
3ie Impact Evaluation Report Series executive editors: Beryl Leach and Emmanuel Jimenez Production manager: Angel Kharya Assistant production manager: Akarsh Gupta Copy editor: Emma Dixon Proofreader: Yvette Charboneau Cover design: John F McGill and Akarsh Gupta Cover photo: UNICEF India/Dhiraj Singh
© International Initiative for Impact Evaluation (3ie), 2017
Impact of the Uddeepan programme on child health and nutrition in India
Anjini Kochar Stanford University
Alakh Sharma Institute for Human Development
Akhilesh Sharma Institute for Human Development
3ie Impact evaluation report IE 65
September 2017

i
Acknowledgements
The authors acknowledge their grateful support for funding from the International Initiative for Impact Evaluation (3ie) for this project. They would also like to acknowledge the invaluable contribution of Professor Sumit Mazumdar in early formulation of the project and its early phases, including the first set of field visits conducted in the planning stages. B-TAST personnel were incredibly helpful in providing assistance in understanding all aspects of the program and its implementation, and in providing implementation data, as were officials from ICDS Bihar. Finally, we would like to place on record our thanks to the Institute for Human Development team that undertook the data collection and coding.
ii
Summary
In delivering nutrition and health services through decentralized programs, governments of developing economies frequently face severe resource constraints reflected in high population per worker ratios and low ability levels of frontline staff. Limited resources, however, constrain their ability to provide additional workers to each local institution or to significantly enhance workers’ ability levels. In this context, policies that provide one additional worker, of higher ability, to a cluster of local institutions may provide the means of reducing resource constraints at lower cost.
This report evaluates one such pilot program, the Uddeepan program, implemented in select districts of the state of Bihar in India. The program provided one additional worker, the Uddeepika, to a cluster of Anganwadi centers (AWCs), the village-level institutions responsible for delivering nutrition and health services to pregnant women, young mothers and their children. All AWCs that fell within the jurisdiction of the lowest level of elected government in India, the Gram Panchayat (GP), were included in a cluster. Uddeepikas, hired from within the GP, were required to have higher levels of education than other AWC workers and to have a score of 60 per cent or higher in an entrance examination designed specifically for the project.
Though providing one additional worker to a cluster of local institutions reduces costs relative to an approach that provides additional resources to all institutions within a cluster, the returns to such a program may also be low. First, the change in population per worker ratios may be too small to have an impact. Second, the requirement to hire locally, when applied to poor regions with low average schooling levels, may imply that changes to the human capital of AWC staff are also limited. Indeed, implementation of the program was considerably delayed in many GPs, primarily because of difficulties in finding eligible women for the position of Uddeepika who satisfied the educational requirements of the job. In this context, an evaluation of the effectiveness of the program in enhancing the functioning of the AWC and improving child nutrition and health is important for determining whether such clustered approaches are worth scaling.
A challenge to evaluating the program is that it was initiated before the decision to evaluate it was made. Thus, the districts selected for its first phase, initiated in 2014, were not randomly chosen. Nor was a baseline survey conducted. However, the delays in implementation meant that program duration differed across GPs. Indeed, all program districts included GPs in which the program was yet to start at the time of our first survey.
Our empirical analysis exploits this variation, inferring the program’s impact by comparing outcomes across GPs where it differed in its duration. Because delays in implementation were not random, this strategy is, however, open to the criticism that estimates of the program’s impact may primarily reflect variables underlying delayed implementation, notably differences in levels of human capital across GPs.
The availability of data from two survey rounds allows us to address this concern. With this data, we control for all fixed characteristics of a GP, including levels of adult education, through the inclusion of GP ‘fixed effects’. The effect of the program is then assessed by comparing outcomes, for AWCs within a GP, across survey rounds. To

iii
allow for other factors that might cause outcomes to change over time, our regression framework allows for time trends that vary with levels of adult education in the GP and other variables that might directly influence outcomes.
Stronger identification of program benefits comes from focusing on child outcomes, because variation in these outcomes exists within a GP, in any given round, and not just over time. This is because a child’s exposure to the program, in any given GP, varies with whether they were born before or after the program commenced. We support our methodological approach by assessing the robustness of our results to alternative identification strategies and samples. Specifically, we also report estimates from an instrumental variables regression that identifies the effect of program exposure utilizing data on the primary source of implementation delay: the very small number of women in program GPs that met the cut-off score required for the position.
A major contribution of this study is its ability to decompose program returns into the benefits attributable to a reduction in population per worker ratios and those that reflect an improvement in human capital. By so doing, we are able to provide information on the relative importance of these two constraints in understanding the limited effectiveness of local nutrition and health institutions in improving maternal and child health in India. This is possible because of the availability of test score data for all applicants for the job, including the Uddeepika, and because the assignment of one additional worker to each GP introduced (unintended) variation in the effect of the program on population per worker ratios, due to the considerable variation in the number of AWCs in each GP.
We find significant effects of sustained exposure to the program on a short-run measure of child health, weight-for-age Z scores (WAZ). We suggest three reasons for this success. First, the program area is characterized by extremely poor levels of maternal and child health. Returns to investments in health facilities, specifically those that alleviate overcrowding, are likely to be higher in such regions. Second, we show that most of the returns reflect the improvements in population per worker ratios that the program enabled. These improvements increased the probability of mothers and children benefitting from the AWC’s nutritional programs, including Take Home Rations and midday meals provided through the AWC’s pre-school program, explaining the improvements in short-run measures of health.
The improvements the program effected in worker ability had less of an impact on child WAZ, both because the additions to ability were limited and also because we show that improved education primarily affected maternal knowledge and immunization rates, both of which may have larger impacts on long-run measures of health. Third, we show that the largest improvements in population per worker ratios occurred in GPs in which pre-program ratios were the highest. This positive, perhaps unintended, aspect of the program likely increased its average impact.
Our analysis highlights the difficulties in implementing policies in relatively backward regions that attempt to recruit workers of higher ability, while yet restricting employment to people from the local geography. In the case of this program, the result was only a small reduction in human capital constraints, at the cost of significant delays in program implementation and hence in exposure to the benefits of the program. Despite this, the positive effect of the program on child WAZ suggests the importance of policies that
iv
address physical labor resource constraints in local institutions responsible for the nutrition and health of mothers and their children. Our research suggests that reductions in labor constraints enhanced child nutrition through the improvements they effected in the delivery of basic services, such as the provision of Take Home Rations and midday meals. More importantly, our research shows that even relatively small changes in population per worker ratios can significantly improve child nutrition and health, suggesting that a relatively low cost approach that provides one additional worker to a cluster of AWCs may have considerable value.

v
Contents
Acknowledgements ........................................................................................................ i Summary ........................................................................................................................ ii List of figures and tables ............................................................................................. vi Abbreviations and acronyms ..................................................................................... vii 1. Introduction ............................................................................................................... 1 2. The intervention and theory of change ................................................................... 5
2.1 The intervention ..................................................................................................... 5 2.2 Theory of change ................................................................................................... 7
3. Context, program area and survey sample ........................................................... 10 3.1 Context ................................................................................................................ 10 3.2 Study region ........................................................................................................ 11 3.3 Sample size ......................................................................................................... 12 3.4 Survey instruments and secondary data .............................................................. 13 3.5 Summary statistics ............................................................................................... 14
4. Timeline ................................................................................................................... 17 5. Program implementation ........................................................................................ 18 6. Evaluation methodology ........................................................................................ 22
6.1 Challenge to identification and outline of our approach ........................................ 22 6.2 Outcome variables ............................................................................................... 23 6.3 Difference-in-differences estimates of program availability .................................. 23 6.4 Allowing for differential growth trends .................................................................. 25 6.5 Evaluating the effect of child exposure to the program ......................................... 26 6.6 An instrumental variable estimator ....................................................................... 28 6.7 Assessing heterogeneity in returns ...................................................................... 30 6.8 Decomposing returns to identify the roles of labor and human capital constraints 30 6.9 Data sources, quality and attrition ........................................................................ 34
7. Results ..................................................................................................................... 34 7.1 Fixed effect estimates of the program on child WAZ ............................................ 34 7.2 Robustness check: IV estimates .......................................................................... 36 7.3 Exploring pathways .............................................................................................. 38 7.4 Effects on maternal knowledge and interaction with AWW and VHSNDs ............. 41
8. Discussion............................................................................................................... 45 9. Conclusions and policy implications .................................................................... 52 Online appendixes ...................................................................................................... 55 References ................................................................................................................... 56
vi
List of figures and tables
Figure 1: Theory of change ............................................................................................. 9 Figure 2: Test scores of eligible Uddeepikas in Madhepura district ............................... 21 Figure 3: Relationship between mean entrance examination score and program duration
....................................................................................................................... 24 Figure 4: Program duration in rounds 1 and 2, by decile of duration in round 1 ............. 27 Figure 5: Number of eligible candidates, by early and late implementers, using 60% and
45% cut-offs .................................................................................................... 29 Figure 6: Histogram of number of AWCs in a GP .......................................................... 32 Figure 7: Correlation between 12th std. and entrance exam score ................................ 33 Figure 8: Predicted WAZ at different months of exposure ............................................. 45 Figure 9: Ability and population-per-worker differences under the program by number of
AWCs in the GP .............................................................................................. 46 Figure 10: Predicted WAZ under different assumptions regarding constraints ............... 47 Figure 11: Predicted WAZ and population change per AWC by GPs, by quintile of
number of AWCs ............................................................................................ 48 Figure 12: Predicted WAZ assuming 65% cut-off score ................................................. 49 Figure 13: Added value plots from regressions of Number of AWCs in a GP on GP
population and the number of GP habitations ................................................. 50 Figure 14: Added value plots of average AWC population per GP on GP population and
number of GP habitations ............................................................................... 51 Figure 15: Correlation between population per AWC in GP and number of AWCs in the
GP .................................................................................................................. 51 Figure 16: Predicted WAZ by GP population per AWC and program duration intensity . 52
Table 1: Summary statistics, child outcomes ................................................................. 14 Table 2: Summary statistics, mothers’ knowledge ......................................................... 16 Table 3: Implementation status, October 2014, selected Phase 1 districts .................... 18 Table 4: Implementation status, May 2015 .................................................................... 20 Table 5: Program effects on child WAZ ......................................................................... 35 Table 6: Instrumental variable regressions for robustness check................................... 37 Table 7: Pathways – OLS-GP fixed effect regressions – decomposing returns ............. 39 Table 8: Effect of program on mothers’ knowledge and interaction with AWW/VHSNDs
....................................................................................................................... 42 Table 9: Effect of program on mothers’ knowledge and interaction with AWW/VHSNDs –
pregnant women ............................................................................................. 44

vii
Abbreviations and acronyms
ANM auxiliary nurse midwife
AWC Anganwadi center
AWW Anganwadi worker
B-TAST Bihar Technical Assistance and Support Team
CDPO child development project officer
DID difference-in-differences
DPT Diphtheria, pertussis and tetanus
GP Gram Panchayat
ICDS Integrated Child Development Service
NAWC nodal Anganwadi center
NFHS National Family Health Survey
OLS ordinary least squares
OLS-FE ordinary least squares fixed effects
IV instrumental variables
IV-FE instrumental variables fixed effects
MCH maternal and child health
THRs take home rations
VHSND village health, sanitation and nutrition day
WAZ weight-for-age Z scores
SWASTH Sector Wide Approach to Strengthening Health in Bihar
1
1. Introduction
In delivering nutrition and health services, governments have generally adopted a decentralized approach, promoting local institutions that serve a village or a small group of villages and utilizing frontline workers drawn from the local community. Though this approach may enhance geographic access and the accountability of workers to the community, it may also exacerbate resource constraints, particularly in developing economies. In these economies, the relatively large number of institutions required by a decentralized approach strains already scant government resources, limiting the ability to hire the additional workers necessary to bring population per worker ratios to recommended levels. In addition, the decision to hire local workers may also adversely affect staff quality in regions characterized by relatively low levels of adult human capital. Reflecting these resource constraints, the quality of local institutions charged with delivering nutrition and health services in poor economies is widely acknowledged to be low, with this low quality in turn believed to be a primary factor underlying poor maternal and child health (MCH).
To address local labor and human capital constraints within the context of scarce resources, governments are increasingly implementing policies that provide one additional, generally more educated, worker to a group or cluster of local institutions. In schooling, for example, a relatively well-educated cluster resource person may help monitor and improve quality in the set of schools that constitute the cluster. Similar policies are also being piloted in the delivery of health and nutrition services.
Though providing one additional worker to a cluster of local institutions reduces costs relative to an approach that provides additional resources to all institutions within the cluster, the returns of such an approach may be similarly low for several reasons. First, its effect on labor and human capital constraints may be minimal. Human capital constraints, for example, caused by low levels of adult human capital within the geographical boundaries of any existing institution, may only be marginally improved by extending the area from which workers are drawn from one village to a set of neighboring villages. An additional factor limiting the potential returns to this approach is the conventional concern regarding the sensitivity of nutrition and health to supply side initiatives such as an improvement in the population to worker ratio or the education level of staff at local health institutions.
We address these issues in the context of a pilot program, the Uddeepan program, implemented in the north Indian state of Bihar. Children in rural Bihar have suffered from persistently high rates of malnutrition, with data from the latest (2015–2016) round of the National Family Health Survey (NFHS) estimating that 49 per cent of children under the age of five are stunted while 45 per cent are underweight.1 This is frequently attributed to the low quality of Anganwadi centers (AWCs), the village-level institution of the government’s flagship program charged with delivering maternal and child nutrition and health services, the Integrated Child Development Service (ICDS). Despite national norms that require one AWC per 800 population, the average population per AWC in
1 The proportion of stunted and underweight children is measured as the percentage whose height for age and weight for age, respectively, are below two standard deviations of WHO growth standards.
2
Bihar is 1,282,2 and field surveys repeatedly testify to the low quality of AWC workers.3 To address these constraints, the government has recommended a cluster approach that provides additional supervisory and managerial inputs to a cluster of AWCs. The Uddeepan program represents a pilot of such a clustered approach: the program provided one additional worker, the Uddeepika, to all the AWCs that fall within the ambit of the Gram Panchayat (GP) or village government, the lowest level of elected government in the country.
The program was piloted in 2014 with intended coverage of all GPs in a set of nine ‘Phase 1’ districts, with plans for a subsequent extension of the program to additional districts based on the success of the pilot. The decision to evaluate the program was, however, made after the program had been initiated and prior to a rigorous baseline survey. However, considerable delays in implementation generated a high degree of variation in the date in which the program was initiated across Phase 1 GPs, and, in particular, a set of GPs in which the program was yet to start at the time of our first survey. The program was subsequently ended in early 2016.
Variation in the starting date allows us to evaluate the program based on its duration (in months) in each GP, utilizing detailed implementation data that included the date in which the program was implemented in each GP and two rounds of data collection at an interval of approximately nine months. Because delays in implementation were the consequence of GP-level factors, described later in this report, we control for the endogeneity of program exposure through a set of GP ‘fixed effects’ that eliminate the effect of all time-invariant GP-level factors on outcomes. Variation in program exposure for each GP across survey rounds, as well as variation in exposure across GPs within any given survey round, enables identification even with the inclusion of GP and round fixed effects.
Identification is further strengthened by the fact that exposure to the program varied across children, in terms of their date of birth relative to the date on which the program was initiated in the GP. Because the date of program initiation varies across GPs, this child-level variation in exposure is not cohort or age specific. It instead depends on whether children were born before or after the program was started and hence amounts to an age ‘cut-off’ that varies across GPs. This is unlikely to be correlated with any unobserved determinants of health. To ensure this, our regressions include a rich set of non-parametric controls for the child’s age, as well as interactions of all age variables with an indicator variable for the second survey round. Stronger identification of child outcomes leads us to focus on these outcomes in this report, rather than on the (intermediate) effects of the program on improvements in factors such as AWC management and administration.
We validate our identification strategy by assessing the robustness of our results to alternative identification strategies and samples. Specifically, we also report estimates from an instrumental variables (IV) regression that identifies program exposure utilizing data on the primary source of implementation delay: the very small number of women in 2 This is calculated using the state’s 2011 population from the census, and the total number of AWCs in the state (80,995) from the Bihar ICDS web pages (http://www.icdsbih.gov.in/AnganwadiCenters.aspx?GL=16). 3 This is also shown in our qualitative report, which is a companion to this report.
3
program GPs that met the educational requirement of a cut-off score in entrance examinations for the job. Available implementation data provides a complete listing of all applicants and their test scores on this examination for all GPs in two of our survey districts, and we use this data as the basis for our instruments. The two identification strategies generate similar results, confirming the consistency of the more efficient ordinary least squares fixed effects (OLS-FE) estimates.
Data on the Uddeepika’s test scores in these two districts, as well as for all other applicants from the GP who were invited to take the written examination, allows us to decompose program returns into the benefits attributable to a reduction in population per worker ratios and those that reflect an improvement in human capital, and hence gauge the relative importance of these two constraints on child health. This is possible not just because of the test score data that provides an indicator of the Uddeepika’s general aptitude level, but also because the assignment of one additional worker to each GP introduced (unintended) variation in population per worker ratios, due to the considerable variation in the number of AWCs in each GP.
This decomposition represents a significant contribution of this report, one that is possible only because of the availability of measures of the ability of the Uddeepika, as well as the policy-induced variation in population per worker ratios across GPs. To support the use of entrance examination test scores to proxy worker ability, we also provide results using an alternative set of results, from the general national 12th standard board examinations. These scores are available for a larger pool of applicants that includes those who were not invited to take the written examination for the Uddeepika position because they failed other eligibility criteria, including the requirement of a 12th standard examination score of 55 per cent or higher. Our results are invariant to the test score used to proxy ability.
This report is most closely related to the literature that evaluates the effect of ‘supply side’ interventions aimed at ensuring access and strengthening the quality of local institutions responsible for the education, nutrition and health of mothers, infants and pre-school children (Lim et al. 2010; Oster 2009; Basinga et al. 2011; Berber and Gertler 2009). While early research, reviewed by Strauss and Thomas (1995), emphasized household determinants such as maternal education and income, the persistence of poor health even in regions with relatively high income and education growth rates suggests the importance of health institutions and their quality. The important role of public health institutions is voiced in research by Deaton (2006) and Preston (1980) that discusses the low explanatory power of household socio-economic variables, including income, on child health.
In seeking to improve the quality of public health and nutrition institutions, particularly in resource-constrained regions that suffer from overcrowded facilities, governments have necessarily first focused on addressing high population per institution or per worker ratios. Correspondingly, a relatively large number of studies have evaluated the effect of improvement in these ratios on outcomes such as schooling and financial inclusion, addressing endogeneity concerns by exploiting rules that determine these ratios (Angrist and Lavy 1999; Kochar 2011).
4
There is less evidence on the effect of population per worker on nutrition and health outcomes, despite the fact that similar rules govern the population served per AWC and hence per worker.4 In addition, the evidence that exists is mixed. Data from India’s NFHS shows no relation between health centers and child mortality (World Bank 1998). Similarly, Pitt, Rosenzweig and Gibbons (1993) do not find statistically significant effects of access to health centers on child health. Though there is limited research that examines the reasons for this, many argue that it reflects low institutional quality, and hence the ‘bypassing’ of government institutions in favor of private clinics (PIEDAR 1994; Akin and Hutchinson 1999).
This suggests the importance of programs that reduce resource constraints and thereby enhance AWC quality through facilitating improved delivery of services such as the monitoring of child growth and counseling to mothers through home visits. Research on early childhood interventions, including home visit programs, finds that even programs of limited duration can have an effect, provided they successfully improve early childhood environments.5 However, much of the available evidence is from regions that are significantly advantaged in comparison to the setting of our study. Moreover, whether any short-run effects sustain may depend on the availability of follow-up at later ages (Cunha and Heckman 2007). Despite the critical importance of research on the factors promoting long-term success, it is beyond the scope of this study to address this issue.
We find significant effects of sustained exposure to the program on a short-run measure of child nutrition, weight-for-age Z scores (WAZ). We suggest three reasons for this success. First, the program area is characterized by extremely poor levels of maternal and child nutrition. Returns to investments in nutrition and health facilities, specifically those that alleviate overcrowding, are likely to be higher in such regions. Second, we show that most of the returns reflect the improvements in population per worker ratios that the program enabled. These improvements increased the probability of mothers and children benefitting from the AWC’s nutritional programs, explaining the improvements in short-run measures of nutrition and health.
The improvements the program effected in worker ability had less of an impact on child WAZ, both because such improvements were limited and also because we show that improved education primarily affected maternal knowledge and immunization rates, both of which may have larger impacts on long-run measures of health. Third, we show that the largest improvements in population per worker ratios occurred in GPs in which pre-program ratios were the highest. This positive, perhaps unintended, aspect of the program likely increased its average impact.
This report focuses on evaluating the impact of the program on child nutrition, measured by WAZ, and on a set of intermediate inputs into child health, specifically maternal knowledge, immunization rates, availability of Take Home Rations (THRs) and
4 This may partly reflect the fact that such rules constitute weak instruments in states such as Bihar, where resource constraints have resulted in population per AWC ratios far higher than stipulated levels. 5 The literature that evaluates early childhood interventions is large. See, for example, Conti, Heckman and Pinto (2016); Garcia et al. (2016); Currie and Thomas (1995); Araujo et al. (2016); Attanasio et al. (2015).
5
enrollment in pre-school centers. An important aspect of the program was the improvement it hoped to effect in the management of AWCs, through supervision of the Uddeepika in aspects such as the maintenance of a set of registers (required in all AWCs) that record monthly performance, disbursements under different programs, and also the height and weight of all children in the AWC.6
Though our pre-analysis plan envisaged an evaluation of the effect of the program on register quality, this report does not include such an analysis. This is primarily because of the uniformly poor quality of registers in both program and non-program AWCs, reflected in large inconsistencies in register entries across our survey rounds. We continue to work with the data we collected on the quality of AWC registers but do not provide that analysis in this report. We do, however, document the difficulties we noted in monthly performance records in a companion report.
The rest of this report is organized as follows: section 2 describes the intervention while section 3 provides contextual information, including details of the program area and survey sample. The timeline of the program relative to the study is briefly outlined in section 4. Section 5 describes program implementation and the factors underlying phased implementation that enable our identification of the program. Section 6 describes our evaluation methodology, while results are in section 7. Section 8 discusses and interprets the results, while the last section provides conclusions.
2. The intervention and theory of change
2.1 The intervention
In the context of the urgent need to improve MCH, the Government of Bihar partnered with the UK Government in a program entitled Sector Wide Approach to Strengthening Health in Bihar (SWASTH).7 The Uddeepan program was one of several pilot programs introduced under SWASTH to improve child nutrition in high-priority districts of the state, characterized by relatively low nutrition and health outcomes. However, it was the only one aimed at strengthening AWCs.8 The program targets pregnant and lactating women, and children under the age of three.
As previously noted, AWCs are the frontline institution of the government’s flagship program for maternal and child nutritional services: the ICDS, in place since 1975. The primary objective of the ICDS is to improve the nutrition and health of children below the age of six, pregnant and lactating women, and adolescent girls aged 11–18 years. It does this through the provision of six services: supplementary nutrition programs, pre-
6 The program also envisaged improvements in the infrastructure and equipment in the nodal AWC. Our baseline report attested to the fact that nodal AWCs were characterized by better infrastructure and equipment relative to other AWCs. However, since this occurred through a one-time intervention, there is no change across survey rounds. Hence we do not evaluate this component of the program further. 7 The description in this section draws heavily on B-TAST (2015). 8 Other programs included community sanitation programs, as well as efforts to strengthen Village Health, Sanitation and Nutrition Committees and Village Health, Sanitation and Nutrition Days (VHSNDs). VHSNDs involve monthly visits by the auxiliary nurse midwife, the frontline worker of the Health Department, aided by the AWW. A VHSND currently provides the means to ensure the immunization of children, as well as the health of pregnant and lactating mothers, and infants.
6
school non-formal education, nutrition and health education, immunization, health check-ups and referral services. While each state program runs through a central office and a set of district offices, the program is primarily implemented through a clustered approach whereby a set of village-level institutions, AWCs, are organized into a ‘project’ overseen by a Child Development Project Officer (CDPO). Initially, projects operated at the level of a community development block, the intermediate unit between the district and the GP in India’s decentralized planning structure, regardless of the number of villages or population per block.
The ICDS was universalized in 2008–2009 so as to ensure coverage of all target women and children. Universalization implied a significant increase in the number of AWCs in the country, from 844,000 in 2007 to a target of 1,319,000 by 2012, with a concomitant increase in the number of Anganwadi workers (AWWs). This increase necessitated changes in the organization of the ICDS. Project areas were redefined to cover a population of approximately 100,000, so that large blocks could have two projects. And, to address the significant challenge of supervising the large number of AWCs, the government advocated a cluster approach, with one female supervisor responsible for a cluster of 17–25 AWCs (Government of India 2012). A female supervisor’s responsibilities included monthly visits to each AWC within her cluster to ensure the quality of their operations and to provide support and guidance.9 This organization of AWCs within a block into clusters for supervision and monitoring purposes, as well as for on-the-job training and skill enhancement, is a central component of the ICDS, intended to enhance its functioning.
Similarly, other initiatives implemented in the state to improve the functioning of the ICDS have also adopted a cluster approach. For example, Bihar’s Integrated Family Health Initiative brings together all frontline workers that operate within the jurisdiction of a health sub-center for monthly review, planning and learning meetings, co-facilitated by the Health Department’s auxiliary nurse midwife (ANM) and the ICDS’s female supervisor (CARE 2013). In addition to AWWs, the other frontline workers included in these meetings are accredited social health activists, the frontline workers for the Health Ministry’s national rural health mission.
The Uddeepan program is unique in that it pilots a cluster approach at the level of the GP. Identifying all AWCs within a GP as a cluster, the program intended the development of a nodal Anganwadi center (Uddeepan Kendra) and the appointment of one additional worker, the Uddeepika, for each GP. Additionally, while other programs utilize a cluster approach for the purposes of training or supervision, the Uddeepan program differs in that it provides an additional worker, located at the field level, to support all AWWs within the GP in their regular activities.
In contrast to this cluster approach, other programs that similarly seek to reduce resource constraints at the level of the AWC do so by providing additional resources to
9 High vacancy rates for supervisors in the years immediately following universalization constituted a significant problem. In 2012, 34 per cent of female supervisor positions were vacant (Government of India 2012). Vacancy rates for AWWs and Anganwadi helpers were much lower (8% for both)
7
each AWC, primarily in the form of village-level volunteers.10 And, while there are programs that attempt to strengthen the GP’s involvement in the ICDS, they generally focus on improving the awareness of members of the GP of the importance of child development, through interventions such as discussions on these topics in village-level meetings (Gram Sabhas) and the development of village resource groups that focus on child development.11
The Uddeepika is selected from amongst women in the GP through an interview process and on the basis of a written examination and is charged with coordinating the activities of the AWCs in the cluster. Specifically, she is responsible for visiting all cluster AWCs at least twice a month to provide ‘hands-on’ support to the AWW in undertaking home visits. She is also required to help the AWW maintain and update program registers at the AWC, and hence establish an effective nutrition surveillance system. This includes providing support to the AWW in undertaking growth monitoring and other health-related activities.
In addition to these activities at each AWC, the Uddeepika’s duties include organizing a monthly review meeting of AWWs at the nodal AWC intended to enhance skills. She also attends monthly meetings with associated officials from the Health Department as well as from the block level. The nodal AWC, which is upgraded as part of the program, serves as a focal point for the weekly cluster-level meetings. It also acts as a central coordination point to ensure and facilitate data collection on all AWCs, and the use of such information to improve the quality of services.
In short, the program provides the following additional inputs to the ICDS system. First, it provides an additional worker to be shared amongst the AWCs in a GP. Second, it improves the human capital of AWC staff, since the Uddeepika is required to have a higher level of schooling and provide oversight to other AWC staff.
2.2 Theory of change
The academic literature, previously discussed, that notes the effect of early childhood interventions on adult outcomes suggests that improvements in early childhood health, particularly those that occur within the first two years of a child’s life, have long-lasting effects. This suggests that even programs of relatively short duration, provided that they successfully increase the resources available to children under the age of two, can improve health outcomes.
The theory of change underlying the program reflects the research that models health outcomes, such as the incidence of stunting and underweight children, as being produced through a set of inputs that include the quality of local health institutions (Cunha, Heckman and Schennach 2010). These inputs affect outcomes directly, but also through intermediate outputs, with inputs translating into intermediate outputs
10 These programs include the Community Based Maternal and Child Health Nutrition program in Uttar Pradesh, the Dular program in Bihar and Jharkhand, and the Rachna, INHP program, implemented in 78 districts of nine high-priority states. 11 Programs intended to strengthen GPs include the Bachpan program, implemented in one block of Madhya Pradesh, and Uttar Pradesh’s Panchayat Engagement in ICDS project. These and other programs are described in World Bank (2010).
8
through a series of activities. Outcomes are affected by the level of inputs and by their effectiveness or productivity.
The Uddeepan program, through its provision of an additional educated worker, directly contributes to the labor and human capital inputs that significantly affect the quality of local health institutions and hence child health. However, the Uddeepika’s activities and responsibilities, as stipulated by the program, were also designed to enhance the productivity of existing AWC staff. These activities can broadly be classified as network activities, conducted with all AWWs within the cluster, as well as individual activities conducted on a one-on-one basis with individual AWWs during the course of bi-monthly visits to each AWC. As previously noted, Uddeepikas also undertake ‘bridge’ activities with higher level officials such as program officers at the block office, as well as health officials such as ANMs. Improved coordination with health officials, who have responsibility for immunizations and maternal care, can also enhance MCH through ensuring greater use of these services.
The desired project outputs are improved functionality of the AWC and improved quality of service delivery. These outputs will generate short-, medium- and long-term outcomes. Short-term outcomes are: improved maintenance of registers, including monthly progress reports; improved functioning of regular AWC programs such as coordination with staff from the Health Ministry in the delivery of immunizations; the running of the pre-school program; and the functioning of supplementary nutrition programs including THRs. Improved functionality will likely improve short-term measures of MCH such as WAZ. Such changes may be manifest within a period of six months or so.
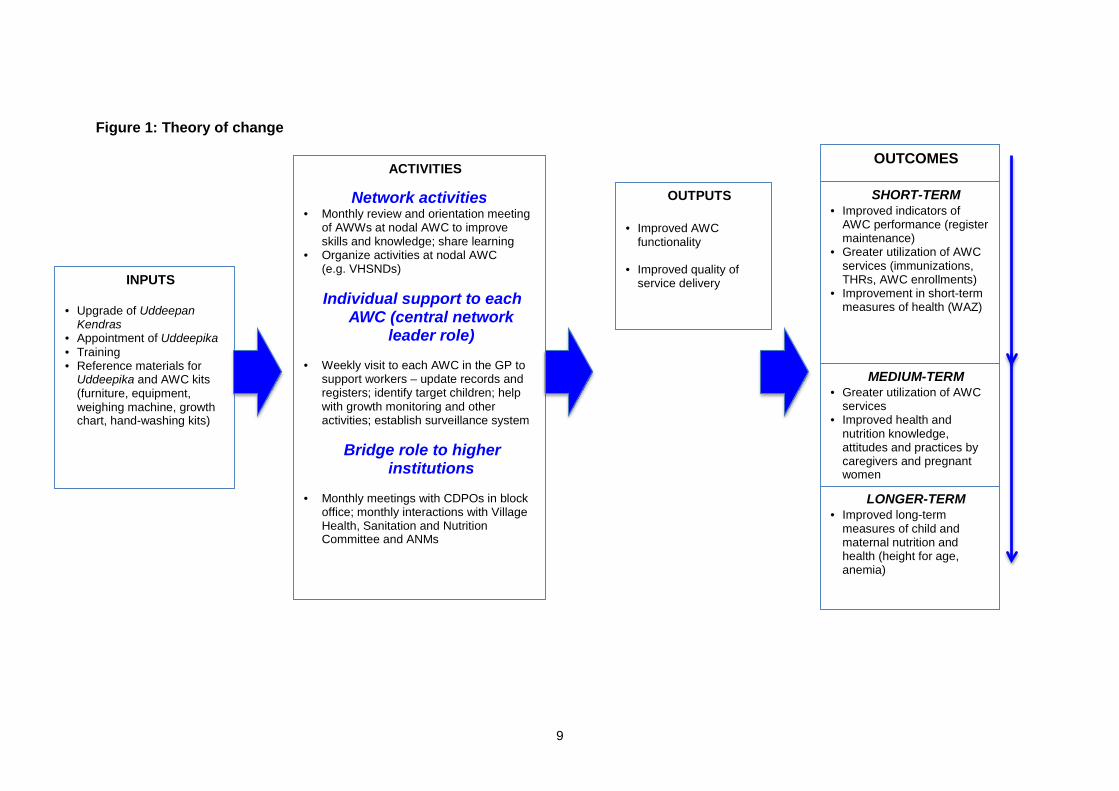
In the medium term (6–12 months), one might also see changes in the knowledge levels and understanding of AWWs regarding practices such as growth monitoring and the nutritional (and health) requirements of different targeted groups of individuals, and corresponding improvements in mothers’ knowledge, attitudes and practices. Finally, changes in long-term measures of MCH, such as height for age and anemia, will likely manifest over the long run, in programs that have been running for at least 12 months and longer. The theory of change underlying the program is graphically summarized in Figure 1.
9
Figure 1: Theory of change
INPUTS
• Upgrade of Uddeepan Kendras
• Appointment of Uddeepika • Training • Reference materials for
Uddeepika and AWC kits (furniture, equipment, weighing machine, growth chart, hand-washing kits)
OUTPUTS
• Improved AWC functionality
• Improved quality of service delivery
ACTIVITIES
Network activities • Monthly review and orientation meeting
of AWWs at nodal AWC to improve skills and knowledge; share learning
• Organize activities at nodal AWC (e.g. VHSNDs)
Individual support to each
AWC (central network leader role)
• Weekly visit to each AWC in the GP to
support workers – update records and registers; identify target children; help with growth monitoring and other activities; establish surveillance system
Bridge role to higher
institutions
• Monthly meetings with CDPOs in block office; monthly interactions with Village Health, Sanitation and Nutrition Committee and ANMs
OUTCOMES
LONGER-TERM • Improved long-term
measures of child and maternal nutrition and health (height for age, anemia)
SHORT-TERM • Improved indicators of
AWC performance (register maintenance)
• Greater utilization of AWC services (immunizations, THRs, AWC enrollments)
• Improvement in short-term measures of health (WAZ)
MEDIUM-TERM • Greater utilization of AWC
services • Improved health and
nutrition knowledge, attitudes and practices by caregivers and pregnant women
10
3. Context, program area and survey sample
3.1 Context
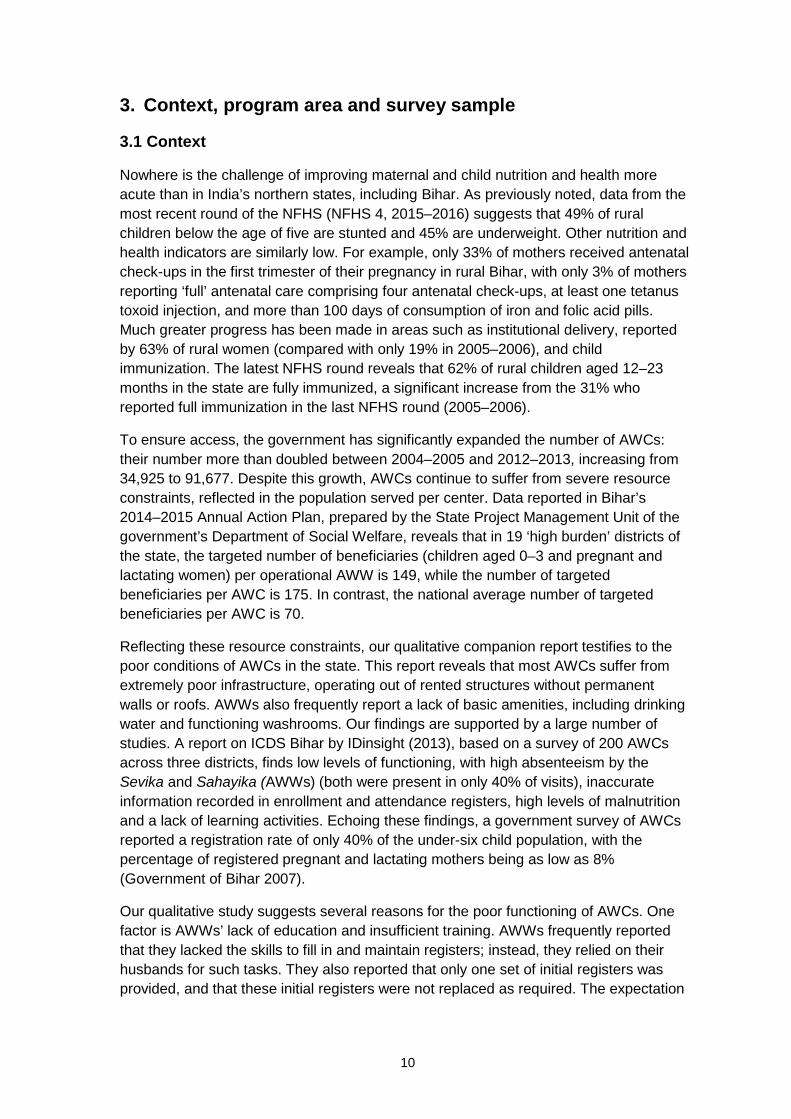
Nowhere is the challenge of improving maternal and child nutrition and health more acute than in India’s northern states, including Bihar. As previously noted, data from the most recent round of the NFHS (NFHS 4, 2015–2016) suggests that 49% of rural children below the age of five are stunted and 45% are underweight. Other nutrition and health indicators are similarly low. For example, only 33% of mothers received antenatal check-ups in the first trimester of their pregnancy in rural Bihar, with only 3% of mothers reporting ‘full’ antenatal care comprising four antenatal check-ups, at least one tetanus toxoid injection, and more than 100 days of consumption of iron and folic acid pills. Much greater progress has been made in areas such as institutional delivery, reported by 63% of rural women (compared with only 19% in 2005–2006), and child immunization. The latest NFHS round reveals that 62% of rural children aged 12–23 months in the state are fully immunized, a significant increase from the 31% who reported full immunization in the last NFHS round (2005–2006).
To ensure access, the government has significantly expanded the number of AWCs: their number more than doubled between 2004–2005 and 2012–2013, increasing from 34,925 to 91,677. Despite this growth, AWCs continue to suffer from severe resource constraints, reflected in the population served per center. Data reported in Bihar’s 2014–2015 Annual Action Plan, prepared by the State Project Management Unit of the government’s Department of Social Welfare, reveals that in 19 ‘high burden’ districts of the state, the targeted number of beneficiaries (children aged 0–3 and pregnant and lactating women) per operational AWW is 149, while the number of targeted beneficiaries per AWC is 175. In contrast, the national average number of targeted beneficiaries per AWC is 70.
Reflecting these resource constraints, our qualitative companion report testifies to the poor conditions of AWCs in the state. This report reveals that most AWCs suffer from extremely poor infrastructure, operating out of rented structures without permanent walls or roofs. AWWs also frequently report a lack of basic amenities, including drinking water and functioning washrooms. Our findings are supported by a large number of studies. A report on ICDS Bihar by IDinsight (2013), based on a survey of 200 AWCs across three districts, finds low levels of functioning, with high absenteeism by the Sevika and Sahayika (AWWs) (both were present in only 40% of visits), inaccurate information recorded in enrollment and attendance registers, high levels of malnutrition and a lack of learning activities. Echoing these findings, a government survey of AWCs reported a registration rate of only 40% of the under-six child population, with the percentage of registered pregnant and lactating mothers being as low as 8% (Government of Bihar 2007).
Our qualitative study suggests several reasons for the poor functioning of AWCs. One factor is AWWs’ lack of education and insufficient training. AWWs frequently reported that they lacked the skills to fill in and maintain registers; instead, they relied on their husbands for such tasks. They also reported that only one set of initial registers was provided, and that these initial registers were not replaced as required. The expectation
11
was that AWWs would replace registers and other necessary materials, such as hand soap, out of contingency funds. However, most AWCs lacked these funds.
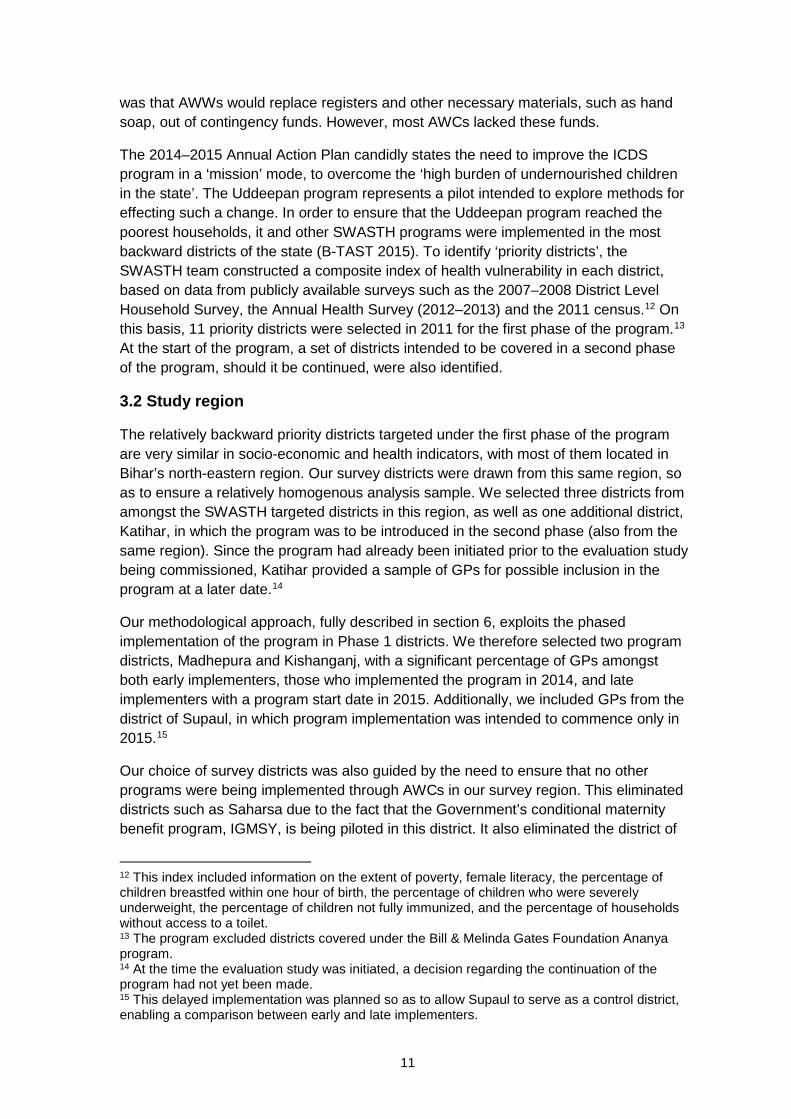
The 2014–2015 Annual Action Plan candidly states the need to improve the ICDS program in a ‘mission’ mode, to overcome the ‘high burden of undernourished children in the state’. The Uddeepan program represents a pilot intended to explore methods for effecting such a change. In order to ensure that the Uddeepan program reached the poorest households, it and other SWASTH programs were implemented in the most backward districts of the state (B-TAST 2015). To identify ‘priority districts’, the SWASTH team constructed a composite index of health vulnerability in each district, based on data from publicly available surveys such as the 2007–2008 District Level Household Survey, the Annual Health Survey (2012–2013) and the 2011 census.12 On this basis, 11 priority districts were selected in 2011 for the first phase of the program.13 At the start of the program, a set of districts intended to be covered in a second phase of the program, should it be continued, were also identified.
3.2 Study region
The relatively backward priority districts targeted under the first phase of the program are very similar in socio-economic and health indicators, with most of them located in Bihar’s north-eastern region. Our survey districts were drawn from this same region, so as to ensure a relatively homogenous analysis sample. We selected three districts from amongst the SWASTH targeted districts in this region, as well as one additional district, Katihar, in which the program was to be introduced in the second phase (also from the same region). Since the program had already been initiated prior to the evaluation study being commissioned, Katihar provided a sample of GPs for possible inclusion in the program at a later date.14
Our methodological approach, fully described in section 6, exploits the phased implementation of the program in Phase 1 districts. We therefore selected two program districts, Madhepura and Kishanganj, with a significant percentage of GPs amongst both early implementers, those who implemented the program in 2014, and late implementers with a program start date in 2015. Additionally, we included GPs from the district of Supaul, in which program implementation was intended to commence only in 2015.15
Our choice of survey districts was also guided by the need to ensure that no other programs were being implemented through AWCs in our survey region. This eliminated districts such as Saharsa due to the fact that the Government’s conditional maternity benefit program, IGMSY, is being piloted in this district. It also eliminated the district of
12 This index included information on the extent of poverty, female literacy, the percentage of children breastfed within one hour of birth, the percentage of children who were severely underweight, the percentage of children not fully immunized, and the percentage of households without access to a toilet. 13 The program excluded districts covered under the Bill & Melinda Gates Foundation Ananya program. 14 At the time the evaluation study was initiated, a decision regarding the continuation of the program had not yet been made. 15 This delayed implementation was planned so as to allow Supaul to serve as a control district, enabling a comparison between early and late implementers.
12
Khagaria, where another program focused on AWCs is being implemented by the Government and the Gates Foundation.
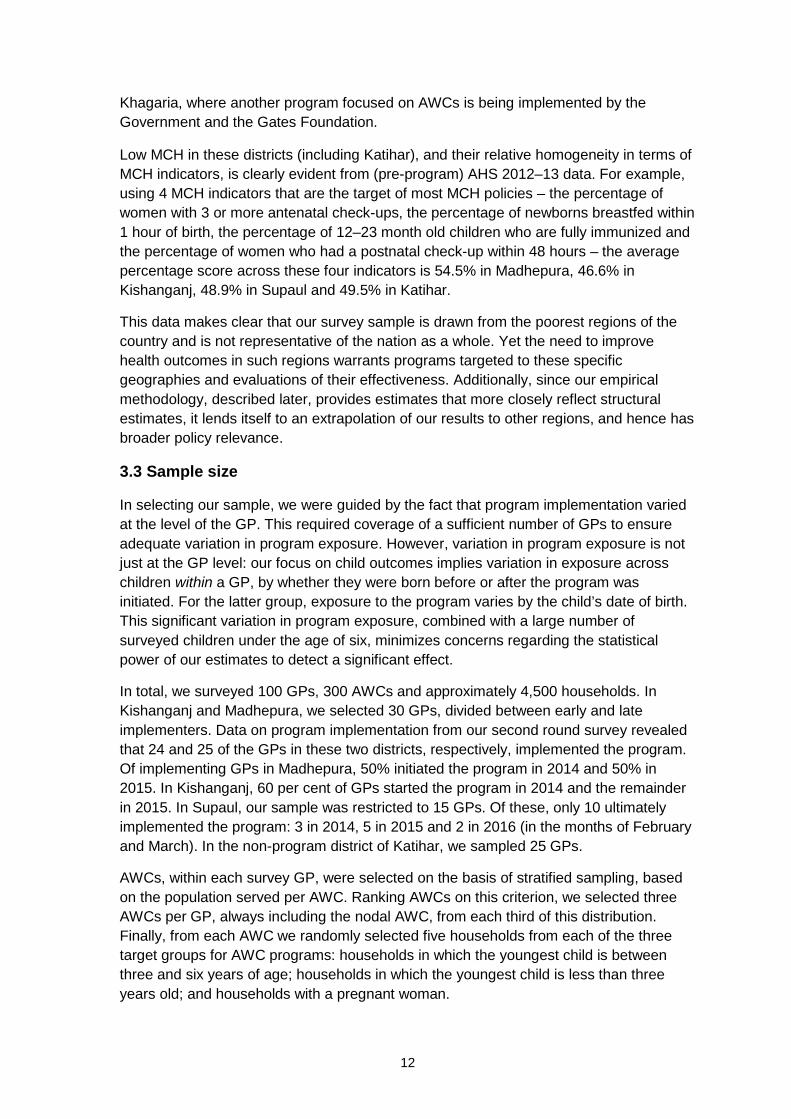
Low MCH in these districts (including Katihar), and their relative homogeneity in terms of MCH indicators, is clearly evident from (pre-program) AHS 2012–13 data. For example, using 4 MCH indicators that are the target of most MCH policies – the percentage of women with 3 or more antenatal check-ups, the percentage of newborns breastfed within 1 hour of birth, the percentage of 12–23 month old children who are fully immunized and the percentage of women who had a postnatal check-up within 48 hours – the average percentage score across these four indicators is 54.5% in Madhepura, 46.6% in Kishanganj, 48.9% in Supaul and 49.5% in Katihar.
This data makes clear that our survey sample is drawn from the poorest regions of the country and is not representative of the nation as a whole. Yet the need to improve health outcomes in such regions warrants programs targeted to these specific geographies and evaluations of their effectiveness. Additionally, since our empirical methodology, described later, provides estimates that more closely reflect structural estimates, it lends itself to an extrapolation of our results to other regions, and hence has broader policy relevance.
3.3 Sample size
In selecting our sample, we were guided by the fact that program implementation varied at the level of the GP. This required coverage of a sufficient number of GPs to ensure adequate variation in program exposure. However, variation in program exposure is not just at the GP level: our focus on child outcomes implies variation in exposure across children within a GP, by whether they were born before or after the program was initiated. For the latter group, exposure to the program varies by the child’s date of birth. This significant variation in program exposure, combined with a large number of surveyed children under the age of six, minimizes concerns regarding the statistical power of our estimates to detect a significant effect.
In total, we surveyed 100 GPs, 300 AWCs and approximately 4,500 households. In Kishanganj and Madhepura, we selected 30 GPs, divided between early and late implementers. Data on program implementation from our second round survey revealed that 24 and 25 of the GPs in these two districts, respectively, implemented the program. Of implementing GPs in Madhepura, 50% initiated the program in 2014 and 50% in 2015. In Kishanganj, 60 per cent of GPs started the program in 2014 and the remainder in 2015. In Supaul, our sample was restricted to 15 GPs. Of these, only 10 ultimately implemented the program: 3 in 2014, 5 in 2015 and 2 in 2016 (in the months of February and March). In the non-program district of Katihar, we sampled 25 GPs.
AWCs, within each survey GP, were selected on the basis of stratified sampling, based on the population served per AWC. Ranking AWCs on this criterion, we selected three AWCs per GP, always including the nodal AWC, from each third of this distribution. Finally, from each AWC we randomly selected five households from each of the three target groups for AWC programs: households in which the youngest child is between three and six years of age; households in which the youngest child is less than three years old; and households with a pregnant woman.
13
3.4 Survey instruments and secondary data
Our primary survey instrument was a household survey that, in addition to the conventional demographic details, also included detailed pregnancy histories and histories of children under the age of six, as well as a section on knowledge, attitudes and practices. This latter section provides information on mothers’ knowledge of best MCH practices and their exposure to the AWW and AWC, as well as their use of other MCH programs, such as their participation in Village Health, Sanitation and Nutrition Days (VHSNDs). Additionally, our survey included an AWC module that provided information on infrastructure and equipment at the AWC, and background on the AWC staff, including the Uddeepika.
The AWC module was also intended to collect data, from monthly progress reports and the set of registers that are required to be maintained in each AWC, on the functioning of the AWC in relation to maintenance of registers, progress in programs implemented through the AWC (such as child enrollment and attendance in AWC pre-school programs), distribution of THRs and registration of pregnant women.
Unfortunately, we found the maintenance of officially required registers in all AWCs to be dismal. Though our baseline study included some analysis of the effect of the program on record maintenance, using data from these registers, our second survey quickly revealed the low quality of this data. For example, the date of data entry in many registers in the second round was frequently earlier than the date recorded in the first round, invalidating comparisons of the regularity of data maintenance based on official data.16 We continue to work to see if this data can be corrected, enabling an analysis of the effect of the program on data entry and record-keeping at the AWC level. However, we do not report such an analysis in this report, given that the data available to us, at this moment, is questionable.
We also collected data from secondary sources, and this is an invaluable part of the study. Critical to our study is data on exact months of implementation and start dates for the program, provided by the implementing agency (B-TAST); without this data we would have to rely on data provided by Uddeepikas themselves on the date at which they commenced work, and the accuracy of this data, particularly as regards the exact month in which the program started, would be a concern. Lacking such data, all that would be possible is a comparison of outcomes across program districts relative to Supaul, the one district purposely kept aside for implementation in 2015, and non-program districts such as Katihar. With variation in program adoption then occurring only at the level of the district, identification would have been impossible.
Additionally, we obtained data on the test scores of all applicants within a GP for our two program districts of Madhepura and Kishanganj, as well as data on the scores of all applicants in national 12th standard examinations, including those who were not invited to take the written examination. Unfortunately, data on Supaul was not available, though we continue to work to try to obtain this data. This information allows us to perform a
16 For example, the date of last entry in the first round may have been specified as September 2015 and, for this same register, the date of entry in the second round specified as April 2015.
14
validity check on our methodological approach. We describe this fully in section 6 of this report.
This report also uses data from the state government’s listing of AWCs, used to calculate the number of AWCs within each GP. In turn, this information, along with the data on test scores of all applicants within a GP, allows us to decompose our estimated returns from the project to an effect that operates through the reduction of labor constraints and that affects human capital constraints. We view these results as critical for enabling a deeper understanding of program benefits, and for extrapolating our results to other regions.
Finally, our quantitative data analysis was supplemented by a detailed qualitative study based on field visits and extensive time with the implementation agency. These studies enabled a thorough understanding of the factors behind the phased implementation of the program, as well as the functioning of the ICDS system and its effect on households.
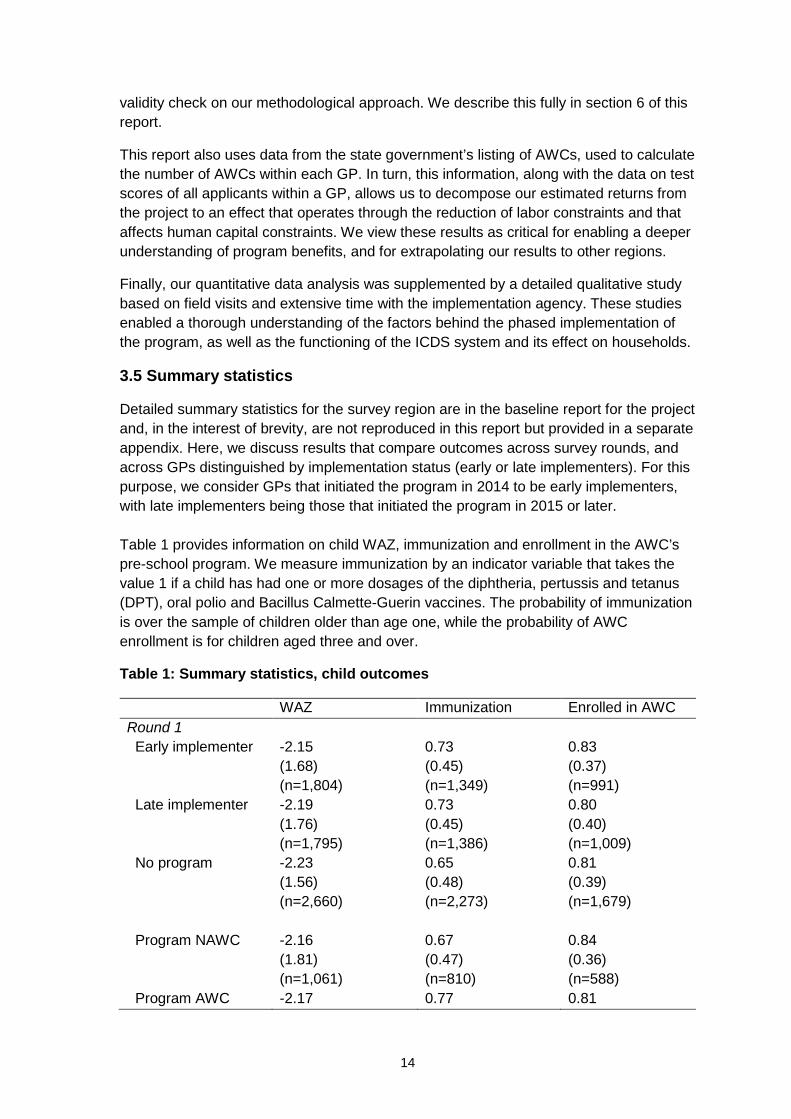
3.5 Summary statistics
Detailed summary statistics for the survey region are in the baseline report for the project and, in the interest of brevity, are not reproduced in this report but provided in a separate appendix. Here, we discuss results that compare outcomes across survey rounds, and across GPs distinguished by implementation status (early or late implementers). For this purpose, we consider GPs that initiated the program in 2014 to be early implementers, with late implementers being those that initiated the program in 2015 or later. Table 1 provides information on child WAZ, immunization and enrollment in the AWC’s pre-school program. We measure immunization by an indicator variable that takes the value 1 if a child has had one or more dosages of the diphtheria, pertussis and tetanus (DPT), oral polio and Bacillus Calmette-Guerin vaccines. The probability of immunization is over the sample of children older than age one, while the probability of AWC enrollment is for children aged three and over.
Table 1: Summary statistics, child outcomes
WAZ Immunization Enrolled in AWC Round 1 Early implementer -2.15
(1.68) (n=1,804)
0.73 (0.45) (n=1,349)
0.83 (0.37) (n=991)
Late implementer -2.19 (1.76) (n=1,795)
0.73 (0.45) (n=1,386)
0.80 (0.40) (n=1,009)
No program -2.23 (1.56) (n=2,660)
0.65 (0.48) (n=2,273)
0.81 (0.39) (n=1,679)
Program NAWC -2.16
(1.81) (n=1,061)
0.67 (0.47) (n=810)
0.84 (0.36) (n=588)
Program AWC -2.17 0.77 0.81
15
WAZ Immunization Enrolled in AWC (1.66) (n=2,147)
(0.42) (n=1,609)
(0.39) (n=1,177)
Round 2 Early implementer -1.98
(1.39) (n=2,166)
0.76 (0.43) (n=1,656)
0.70 (0.46) (n=1,397)
Late implementer -1.98 (1.41) (n=2,107)
0.76 (0.43) (n=1,634)
0.67 (0.47) (n=1,402)
No program -2.07 (1.47) (n=3,269)
0.52 (0.50) (n=2,680)
0.68 (0.47) (n=2,305)
Program NAWC -1.92
(1.47) (n=1,447)
0.75 (0.43) (n=1,069)
0.68 (0.47) (n=925)
Program AWC -2.01 (1.36) (n=2,826)
0.76 (0.43) (n=2,221)
0.68 (0.47) (n=1,874)
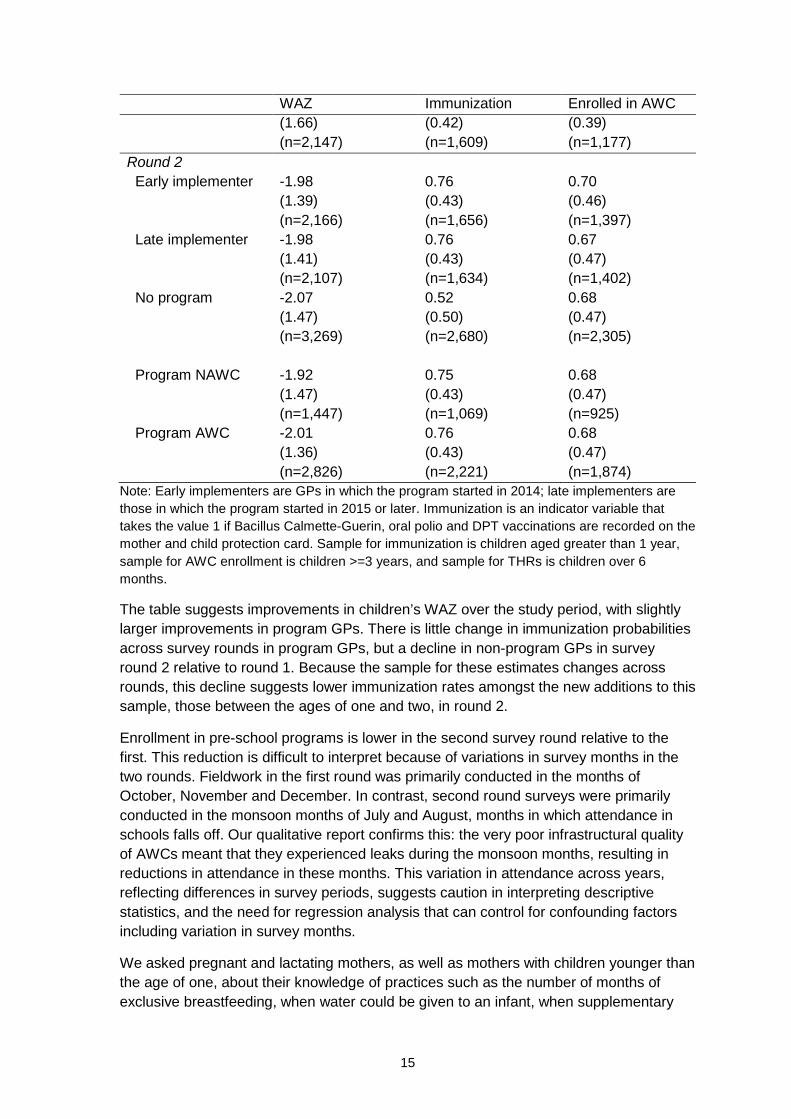
Note: Early implementers are GPs in which the program started in 2014; late implementers are those in which the program started in 2015 or later. Immunization is an indicator variable that takes the value 1 if Bacillus Calmette-Guerin, oral polio and DPT vaccinations are recorded on the mother and child protection card. Sample for immunization is children aged greater than 1 year, sample for AWC enrollment is children >=3 years, and sample for THRs is children over 6 months.
The table suggests improvements in children’s WAZ over the study period, with slightly larger improvements in program GPs. There is little change in immunization probabilities across survey rounds in program GPs, but a decline in non-program GPs in survey round 2 relative to round 1. Because the sample for these estimates changes across rounds, this decline suggests lower immunization rates amongst the new additions to this sample, those between the ages of one and two, in round 2.
Enrollment in pre-school programs is lower in the second survey round relative to the first. This reduction is difficult to interpret because of variations in survey months in the two rounds. Fieldwork in the first round was primarily conducted in the months of October, November and December. In contrast, second round surveys were primarily conducted in the monsoon months of July and August, months in which attendance in schools falls off. Our qualitative report confirms this: the very poor infrastructural quality of AWCs meant that they experienced leaks during the monsoon months, resulting in reductions in attendance in these months. This variation in attendance across years, reflecting differences in survey periods, suggests caution in interpreting descriptive statistics, and the need for regression analysis that can control for confounding factors including variation in survey months.
We asked pregnant and lactating mothers, as well as mothers with children younger than the age of one, about their knowledge of practices such as the number of months of exclusive breastfeeding, when water could be given to an infant, when supplementary
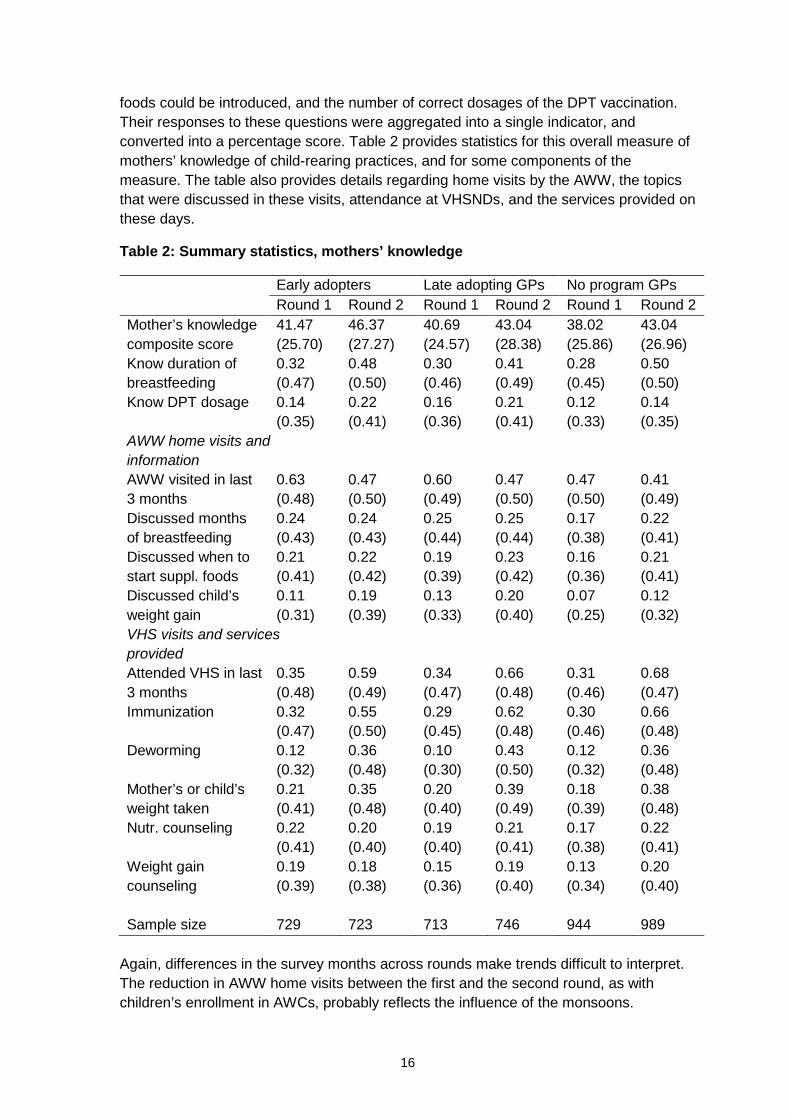
16
foods could be introduced, and the number of correct dosages of the DPT vaccination. Their responses to these questions were aggregated into a single indicator, and converted into a percentage score. Table 2 provides statistics for this overall measure of mothers’ knowledge of child-rearing practices, and for some components of the measure. The table also provides details regarding home visits by the AWW, the topics that were discussed in these visits, attendance at VHSNDs, and the services provided on these days.
Table 2: Summary statistics, mothers’ knowledge
Early adopters Late adopting GPs No program GPs Round 1 Round 2 Round 1 Round 2 Round 1 Round 2
Mother’s knowledge composite score
41.47 (25.70)
46.37 (27.27)
40.69 (24.57)
43.04 (28.38)
38.02 (25.86)
43.04 (26.96)
Know duration of breastfeeding
0.32 (0.47)
0.48 (0.50)
0.30 (0.46)
0.41 (0.49)
0.28 (0.45)
0.50 (0.50)
Know DPT dosage 0.14 (0.35)
0.22 (0.41)
0.16 (0.36)
0.21 (0.41)
0.12 (0.33)
0.14 (0.35)
AWW home visits and information
AWW visited in last 3 months
0.63 (0.48)
0.47 (0.50)
0.60 (0.49)
0.47 (0.50)
0.47 (0.50)
0.41 (0.49)
Discussed months of breastfeeding
0.24 (0.43)
0.24 (0.43)
0.25 (0.44)
0.25 (0.44)
0.17 (0.38)
0.22 (0.41)
Discussed when to start suppl. foods
0.21 (0.41)
0.22 (0.42)
0.19 (0.39)
0.23 (0.42)
0.16 (0.36)
0.21 (0.41)
Discussed child’s weight gain
0.11 (0.31)
0.19 (0.39)
0.13 (0.33)
0.20 (0.40)
0.07 (0.25)
0.12 (0.32)
VHS visits and services provided
Attended VHS in last 3 months
0.35 (0.48)
0.59 (0.49)
0.34 (0.47)
0.66 (0.48)
0.31 (0.46)
0.68 (0.47)
Immunization 0.32 (0.47)
0.55 (0.50)
0.29 (0.45)
0.62 (0.48)
0.30 (0.46)
0.66 (0.48)
Deworming 0.12 (0.32)
0.36 (0.48)
0.10 (0.30)
0.43 (0.50)
0.12 (0.32)
0.36 (0.48)
Mother’s or child’s weight taken
0.21 (0.41)
0.35 (0.48)
0.20 (0.40)
0.39 (0.49)
0.18 (0.39)
0.38 (0.48)
Nutr. counseling 0.22 (0.41)
0.20 (0.40)
0.19 (0.40)
0.21 (0.41)
0.17 (0.38)
0.22 (0.41)
Weight gain counseling
0.19 (0.39)
0.18 (0.38)
0.15 (0.36)
0.19 (0.40)
0.13 (0.34)
0.20 (0.40)
Sample size 729 723 713 746 944 989
Again, differences in the survey months across rounds make trends difficult to interpret. The reduction in AWW home visits between the first and the second round, as with children’s enrollment in AWCs, probably reflects the influence of the monsoons.
17
Similarly, differences (or lack thereof) between early and later adopters, and villages in which the program was never adopted, reflect GP characteristics that affected program adoption, discussed in section 5. An analysis of the effect of the program necessarily requires controls for the factors that affected program implementation.
The data in Table 2 does, however, allow us to better understand the context of this study. It reveals the very low levels of maternal knowledge of child-rearing best practices, even about the number of recommended DPT dosages. The percentage of women reporting such knowledge varied from 33% to 41%. Approximately half the population reported a home visit by the AWW in the last 3 months. However, a far smaller percentage reported discussing important topics such as months of exclusive breastfeeding and supplementary feeding with the AWW. And only a very small percentage of mothers discussed more complex topics, such as a child’s weight gain (approximately 10% in the first round survey, increasing to 20% by the second round in program GPs and to 12% in non-program GPs).
Attendance at VHSNDs increased substantially across survey rounds, in both program and non-program GPs. However, it still remains low, given that this information was gathered only for pregnant and lactating women and for those with children under the age of one – women who are expected to attend these sessions on a regular basis. VHSNDs appear primarily to provide immunizations. Far fewer mothers report having either their weight or their child’s weight taken during these days, and even fewer report receiving nutritional or weight gain counseling.
4. Timeline
The program was to be initiated in all project districts and GPs in 2014, with the exception of GPs in Supaul. However, delays in implementation, discussed in the next section, caused significant delays in recruitment and training. Hence, there was no single start date for the program. Instead, the timing of training varied extensively, with training dates varying from July 2014 to September 2015 in Madhepura and Kishanganj, and from August 2014 to September 2015 in Supaul. For example, in Kishanganj training occurred at three different dates: July and December 2014 and September 2015.
Following training, there was additional variation in the start date for Uddeepikas across GPs within a district. Our qualitative surveys revealed that these were primarily a function of idiosyncratic factors, both at the level of the district (relating to approval of the appointment of the Uddeepika) and at the level of the GP (relating to the date of availability of the appointed Uddeepika). Illustrating this point, Uddeepikas in the district of Kishanganj, who were trained in July 2014, had job start months that varied from July to December. Similarly, appointments in 2015 occurred in a range from February to July 2015. The same variation is present in Madhepura, with the actual start date, amongst GPs that implemented the program in 2015, varying from March to July.
Our first round of data collection was scheduled to take place within the months of August and September 2015, after the implementation of the program in some GPs of Madhepura and Kishanganj, but before the second wave of implementation following training in September 2015. Heavy rains in the second half of August caused a delay in data collection for two weeks. This was subsequently extended by an additional two
18
weeks due to sustained ill-health of two leaders of the data collection team. This one-month delay caused fieldwork to coincide with the dates of the Bihar state election, which was conducted between 15 October and 5 November. As a consequence of these delays, data collection for the first round occurred over an extended period of time, ranging from August to December 2015.
Endline surveys were conducted between June and September 2016, again reflecting delays caused by the monsoons and heavy rains. The time between surveys thus averaged 9 months, with a range from 6 to 12. Our original plan had been to survey households with a one-year gap. However, this was not possible due to the decision to close the program, which in turn required our report to be submitted by an earlier date than we had originally envisaged.
5. Program implementation
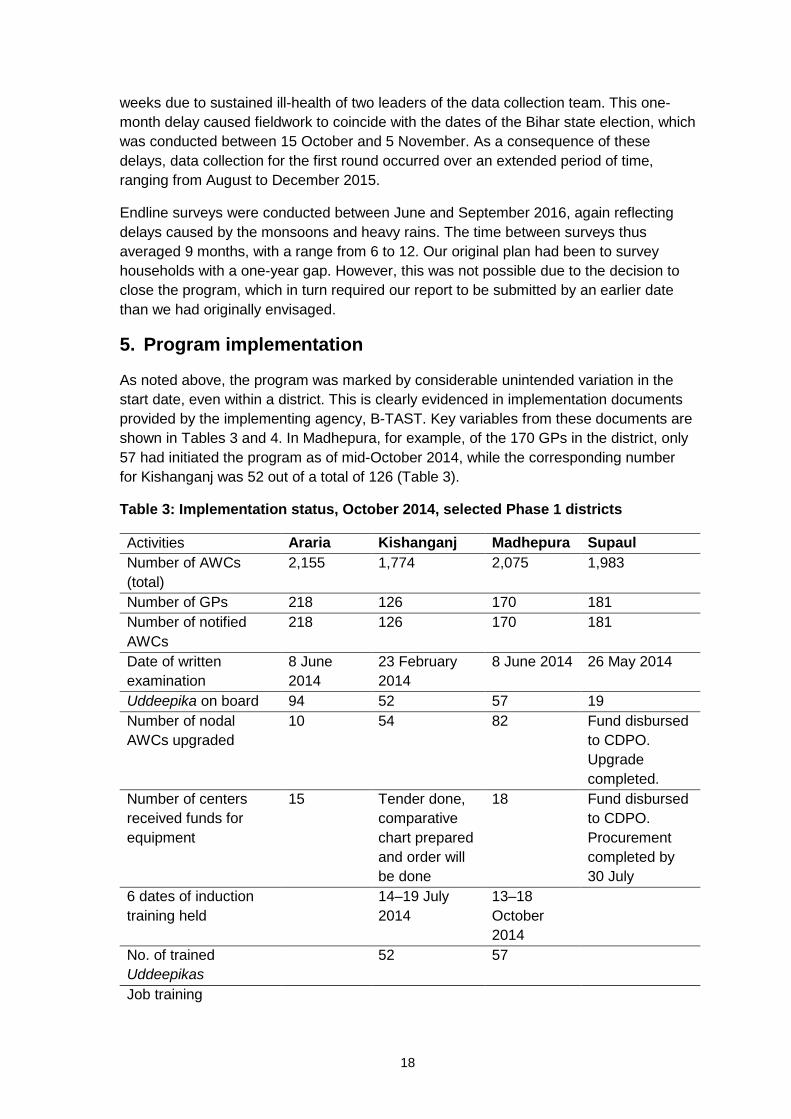
As noted above, the program was marked by considerable unintended variation in the start date, even within a district. This is clearly evidenced in implementation documents provided by the implementing agency, B-TAST. Key variables from these documents are shown in Tables 3 and 4. In Madhepura, for example, of the 170 GPs in the district, only 57 had initiated the program as of mid-October 2014, while the corresponding number for Kishanganj was 52 out of a total of 126 (Table 3).
Table 3: Implementation status, October 2014, selected Phase 1 districts
Activities Araria Kishanganj Madhepura Supaul Number of AWCs (total)
2,155 1,774 2,075 1,983
Number of GPs 218 126 170 181 Number of notified AWCs
218 126 170 181
Date of written examination
8 June 2014
23 February 2014
8 June 2014 26 May 2014
Uddeepika on board 94 52 57 19 Number of nodal AWCs upgraded
10 54 82 Fund disbursed to CDPO. Upgrade completed.
Number of centers received funds for equipment
15 Tender done, comparative chart prepared and order will be done
18 Fund disbursed to CDPO. Procurement completed by 30 July
6 dates of induction training held
14–19 July 2014
13–18 October 2014
No. of trained Uddeepikas
52 57
Job training
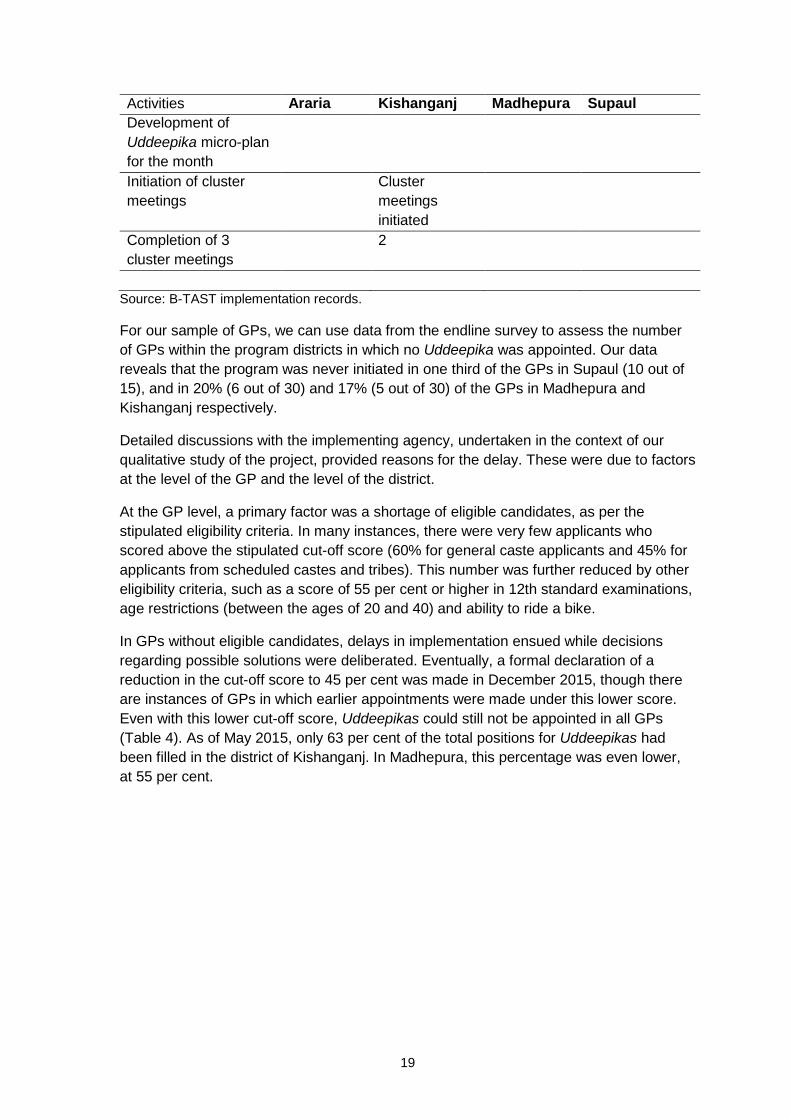
19
Activities Araria Kishanganj Madhepura Supaul Development of Uddeepika micro-plan for the month
Initiation of cluster meetings
Cluster meetings initiated
Completion of 3 cluster meetings
2
Source: B-TAST implementation records.
For our sample of GPs, we can use data from the endline survey to assess the number of GPs within the program districts in which no Uddeepika was appointed. Our data reveals that the program was never initiated in one third of the GPs in Supaul (10 out of 15), and in 20% (6 out of 30) and 17% (5 out of 30) of the GPs in Madhepura and Kishanganj respectively.
Detailed discussions with the implementing agency, undertaken in the context of our qualitative study of the project, provided reasons for the delay. These were due to factors at the level of the GP and the level of the district.
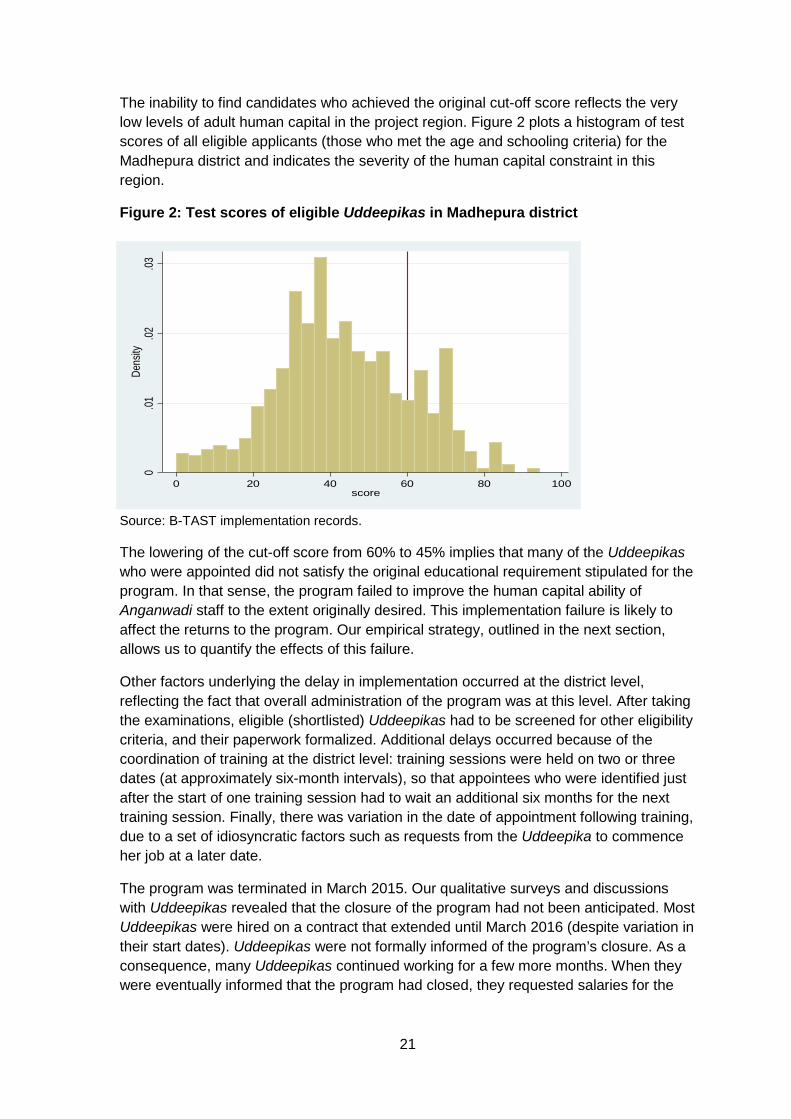
At the GP level, a primary factor was a shortage of eligible candidates, as per the stipulated eligibility criteria. In many instances, there were very few applicants who scored above the stipulated cut-off score (60% for general caste applicants and 45% for applicants from scheduled castes and tribes). This number was further reduced by other eligibility criteria, such as a score of 55 per cent or higher in 12th standard examinations, age restrictions (between the ages of 20 and 40) and ability to ride a bike.
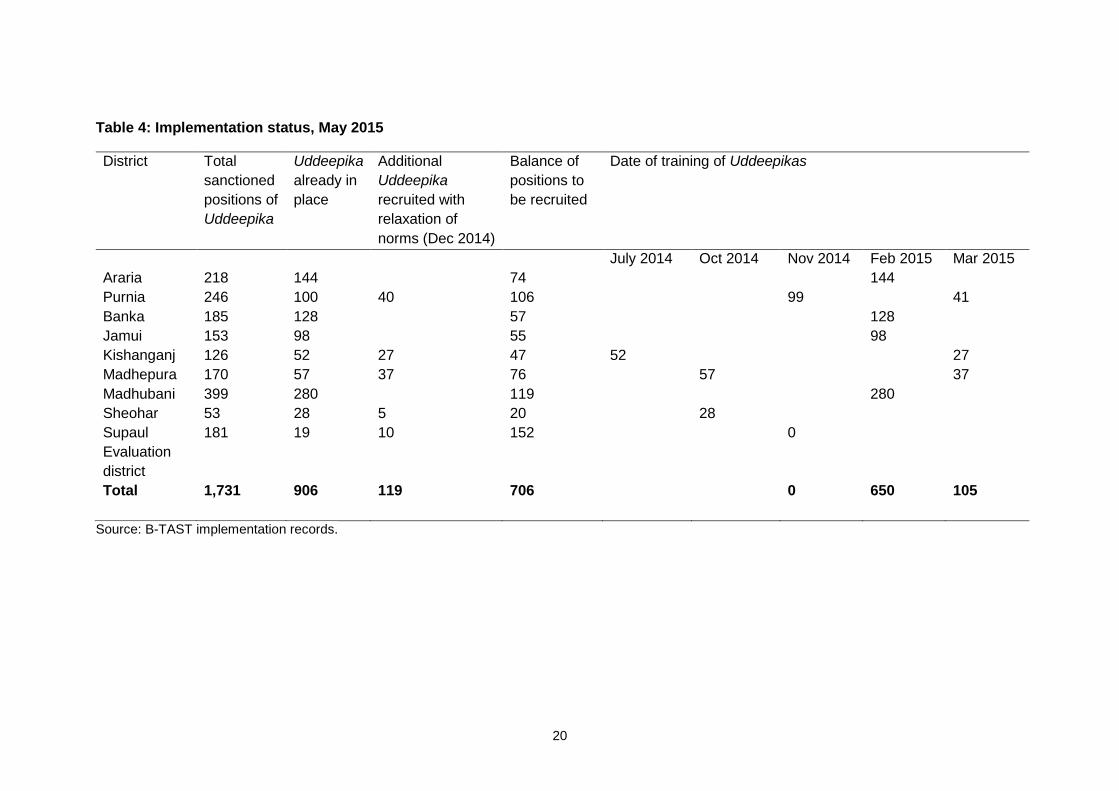
In GPs without eligible candidates, delays in implementation ensued while decisions regarding possible solutions were deliberated. Eventually, a formal declaration of a reduction in the cut-off score to 45 per cent was made in December 2015, though there are instances of GPs in which earlier appointments were made under this lower score. Even with this lower cut-off score, Uddeepikas could still not be appointed in all GPs (Table 4). As of May 2015, only 63 per cent of the total positions for Uddeepikas had been filled in the district of Kishanganj. In Madhepura, this percentage was even lower, at 55 per cent.
20
Table 4: Implementation status, May 2015
District Total sanctioned positions of Uddeepika
Uddeepika already in place
Additional Uddeepika recruited with relaxation of norms (Dec 2014)
Balance of positions to be recruited
Date of training of Uddeepikas
July 2014 Oct 2014 Nov 2014 Feb 2015 Mar 2015 Araria 218 144 74 144 Purnia 246 100 40 106 99 41 Banka 185 128 57 128 Jamui 153 98 55 98 Kishanganj 126 52 27 47 52 27 Madhepura 170 57 37 76 57 37 Madhubani 399 280 119 280 Sheohar 53 28 5 20 28 Supaul Evaluation district
181 19 10 152 0
Total 1,731 906 119 706 0 650 105
Source: B-TAST implementation records.
21
The inability to find candidates who achieved the original cut-off score reflects the very low levels of adult human capital in the project region. Figure 2 plots a histogram of test scores of all eligible applicants (those who met the age and schooling criteria) for the Madhepura district and indicates the severity of the human capital constraint in this region.
Figure 2: Test scores of eligible Uddeepikas in Madhepura district
Source: B-TAST implementation records.
The lowering of the cut-off score from 60% to 45% implies that many of the Uddeepikas who were appointed did not satisfy the original educational requirement stipulated for the program. In that sense, the program failed to improve the human capital ability of Anganwadi staff to the extent originally desired. This implementation failure is likely to affect the returns to the program. Our empirical strategy, outlined in the next section, allows us to quantify the effects of this failure.
Other factors underlying the delay in implementation occurred at the district level, reflecting the fact that overall administration of the program was at this level. After taking the examinations, eligible (shortlisted) Uddeepikas had to be screened for other eligibility criteria, and their paperwork formalized. Additional delays occurred because of the coordination of training at the district level: training sessions were held on two or three dates (at approximately six-month intervals), so that appointees who were identified just after the start of one training session had to wait an additional six months for the next training session. Finally, there was variation in the date of appointment following training, due to a set of idiosyncratic factors such as requests from the Uddeepika to commence her job at a later date.
The program was terminated in March 2015. Our qualitative surveys and discussions with Uddeepikas revealed that the closure of the program had not been anticipated. Most Uddeepikas were hired on a contract that extended until March 2016 (despite variation in their start dates). Uddeepikas were not formally informed of the program’s closure. As a consequence, many Uddeepikas continued working for a few more months. When they were eventually informed that the program had closed, they requested salaries for the
0.01
.02.03
Dens
ity
0 20 40 60 80 100score
22
additional months they had worked, and the state honored this request.17 This generated variability in the month of closure of the program. Most of the programs (96%) closed between the months of March and May 2016, with 36% closing in March, 31% in May and 29% in June.
Our qualitative investigation also provides some explanations for the closure of the program by the Bihar Government. One factor appears to be the lack of full integration of the Uddeepika into the existing system. As noted in our qualitative report, higher level functionaries in the ICDS system, notably female supervisors who are supposed to oversee AWWs, sometimes resented the presence of an Uddeepika. The exact role of the Uddeepika, and how it differed from a female supervisor, had not been fully explained to ICDS staff. AWWs, most of whom are older than the Uddeepikas, also appeared to resent oversight by someone younger than them. These same opinions were voiced during our policy dissemination workshop with ICDS officials. They expressed the view that resentment of the Uddeepika by other ICDS workers suggested the need to explore alternative means of improving the quality of AWCs.
6. Evaluation methodology
6.1 Challenge to identification and outline of our approach
Lacking a randomized controlled sample, we identify the benefits of the program primarily by comparing GPs that differ in program duration. The simplest estimator compares GPs in which the program was initiated (referred to as ‘treatment’ GPs) with those in which it was never implemented (‘control’ GPs). As subsequently described, our preferred estimates utilize a continuous measure of program exposure based on months of program duration in the GP.
The primary challenge to identification is that implementing GPs were not randomly selected. Instead, they are GPs with eligible candidates for the Uddeepika position, and thus likely to have higher levels of education. And, comparing early and late implementers, early implementing GPs, with more months of program exposure, are also GPs in which Uddeepikas had to satisfy the higher cut-off score. This suggests differences in the Uddeepika’s human capital across early and late implementing GPs that could bias estimates of the effect of program duration on outcomes.
We address this concern through a difference-in-differences (DID) methodology, described in section 6.2. This methodology assumes that growth rates across survey periods in the outcomes we consider would have been identical between treatment and control samples in the absence of the program. Differences in education levels between treatment and control GPs suggest, however, that these growth rates, in the absence of the program, could also differ.
We therefore extend the simple models in several ways. First, we allow for differences in growth rates by education levels in the GP, by including interactions of the round 2 indicator with levels of female education, as well as other interactions. This is described in section 6.3 below. Second, we focus our attention on explaining child outcomes, using
17 This was verified in conversations with the Principal Secretary for the Ministry of Women and Child Development in the state.
23
the child’s exposure to the program as the measure of treatment. As described in section 6.4, children’s exposure to the program varies within a GP, and so is not equivalent to a round by GP interaction (as is commonly the case in DID models).
While we cannot use pre-program growth rates to test the model, we provide an alternative test based on an IV strategy, in which exposure is instrumented by variables that determine the GP’s eligibility for the program (based on test score results). This is equivalent to identification using a propensity score to control for endogenous selection into treatment (Heckman and Robb 1985). We implement a test for our methodological approach by comparing efficient but possibly inconsistent estimates from the DID methodology with consistent but less efficient IV estimates, using a standard Hausman test (section 6.5).
Finally, we also identify the labor-augmenting effect of the program, separate from its effect on human capital constraints (section 6.7). In so doing, we again condition our regression on interactions of the round 2 indicator with measures of the human capital of the Uddeepika (test scores in entrance examinations). This explicitly controls for differences in growth rates due to differences in the Uddeepika’s ability level.
6.2 Outcome variables
Because the primary objective of the program was an improvement in maternal and child nutrition and health, our main outcome variable is a measure of short-term child health, WAZ, which measures the child’s weight relative to WHO age and gender-specific standards.18 We do not assess the effect of the program on maternal health, as reflected in markers such as anemia levels and blood pressure, since collecting data on these outcomes was beyond the resources available to this study.
In addition to child health, we present a set of results that help identify pathways, considering the effect of the program on the following child outcomes: immunization probability, probability of enrollment in the AWC, and probability of receiving THRs. We also look at a series of maternal outcomes, including measures of mothers’ knowledge of child-rearing practices, attendance at VHSNDs when immunizations, maternal counseling and maternal check-ups are generally conducted, and whether the AWW had been to a mother’s home in the last three months.
6.3 Difference-in-differences estimates of program availability
Our evaluation methodology utilizes the phased rollout of the program across GPs. However, as described in section 5, the phasing of the program amongst Phase 1 districts was not random. Nor was it a targeted phasing, as in some national programs which initially target backward districts and then progressively extend to other more advanced districts. Instead, the phasing of the Uddeepan program across Phase 1 GPs reflected implementation failures, particularly the lack of eligible candidates who also satisfied the 60% entrance examination cut-off score requirement. A correlation between program implementation (and hence program availability) and test scores on the
18 The relatively short duration of the program makes an impact on long-term measures of child health, specifically height, unlikely. This is a testable assumption. We collected data on height but found no discernible effect of the program.
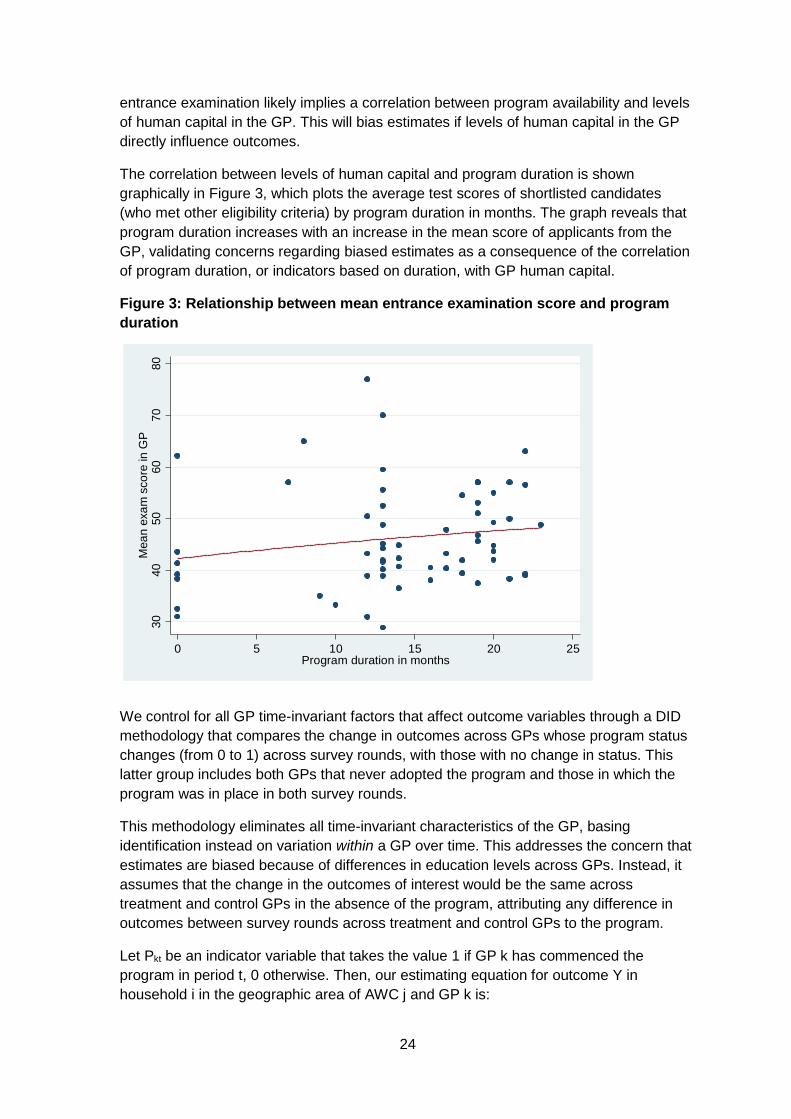
24
entrance examination likely implies a correlation between program availability and levels of human capital in the GP. This will bias estimates if levels of human capital in the GP directly influence outcomes.
The correlation between levels of human capital and program duration is shown graphically in Figure 3, which plots the average test scores of shortlisted candidates (who met other eligibility criteria) by program duration in months. The graph reveals that program duration increases with an increase in the mean score of applicants from the GP, validating concerns regarding biased estimates as a consequence of the correlation of program duration, or indicators based on duration, with GP human capital.
Figure 3: Relationship between mean entrance examination score and program duration
We control for all GP time-invariant factors that affect outcome variables through a DID methodology that compares the change in outcomes across GPs whose program status changes (from 0 to 1) across survey rounds, with those with no change in status. This latter group includes both GPs that never adopted the program and those in which the program was in place in both survey rounds.
This methodology eliminates all time-invariant characteristics of the GP, basing identification instead on variation within a GP over time. This addresses the concern that estimates are biased because of differences in education levels across GPs. Instead, it assumes that the change in the outcomes of interest would be the same across treatment and control GPs in the absence of the program, attributing any difference in outcomes between survey rounds across treatment and control GPs to the program.
Let Pkt be an indicator variable that takes the value 1 if GP k has commenced the program in period t, 0 otherwise. Then, our estimating equation for outcome Y in household i in the geographic area of AWC j and GP k is:
3040
5060
7080
Mea
n ex
am s
core
in G
P
0 5 10 15 20 25Program duration in months
25
(1) 𝑌𝑌𝑖𝑖𝑖𝑖𝑖𝑖𝑖𝑖 = 𝛼𝛼0 + 𝛼𝛼1𝑃𝑃𝑖𝑖𝑖𝑖 + 𝛼𝛼2𝛿𝛿𝑖𝑖 + 𝛼𝛼3𝑅𝑅2 + 𝛼𝛼4𝑋𝑋𝑖𝑖𝑖𝑖𝑖𝑖 + 𝛼𝛼5𝑍𝑍𝑖𝑖𝑖𝑖𝑖𝑖𝑖𝑖 + 𝑢𝑢𝑖𝑖𝑖𝑖𝑖𝑖𝑖𝑖
In this regression, δk represents a set of GP dummy variables and R2 is an indicator variable for observations in the second survey round. X are additional AWC control variables and Z are a set of child and household characteristics that directly influence outcome Y. The coefficient α1 represents the parameter of interest. The set of X variables includes AWC population and the proportion of this population that is from a scheduled caste or tribe. Child and household regressors include the child’s age, gender and caste, as well as the mother’s and father’s ages, and the mother’s and father’s years of schooling.
Our pre-analysis plan also suggested a series of regressions using a set of indicator variables to capture the variation in program duration across GPs. We omit regressions based on that specification, primarily because of the redundancy of these regressions given that we also report regressions based on a continuous measure of program duration in months (described in section 6.4 below). This allows more time for our discussion of results relating to the effect of the program on labor and human capital constraints.
6.4 Allowing for differential growth trends
The assumption underlying the DiD model is that growth rates, in the absence of the program, would have been the same across treatment and control GPs. This is a much weaker assumption than assuming that the level of outcome variables would have been identical in treatment and control GPs in the absence of the program. Nonetheless, it is a strong assumption. Unfortunately, there are no GP-level statistics (from other household surveys or from government data sets such as the NFHS or the District Level Household Survey) available for the pre-program period that allow us to test this assumption.
However, the relative homogeneity of the survey districts, all neighboring districts from the same geographical and socio-economic region of Bihar (the north-east alluvial belt), suggests the plausibility of the DID assumption. At the district level, as previously noted, we used data from the SWASTH scorecard, based on data from the District Level Household Survey and the census, to select districts that were comparable in terms of health outcomes in 2012–2013.
The assumption of similarity in growth rates across treatment and control samples assumes that unobserved macro-economic factors (θ) that generate growth in outcomes over time change in the same way for treatment and control samples. As in matching models, it is possible to relax this assumption to the weaker assumption that growth rates are similar, conditional on a set of covariates that explain differential growth (Blundell and Costa Dias 2000). Indexing variables for the control sample by c and, as before, letting the indicator for treatment be given by P, this requires a set of covariates, 𝑋𝑋� , such that for two time periods, t1 and t0, the following condition holds:
(2) 𝜃𝜃𝑖𝑖1𝑐𝑐 − 𝜃𝜃𝑖𝑖0
𝑐𝑐 ⊥ 𝑃𝑃 | 𝑋𝑋�
This is the condition used in matching estimators, which states that growth rates in the control sample are conditionally independent of the treatment decision, in that growth rates between the control and treatment sample would be identical, in the absence of the
26
program, after conditioning on 𝑋𝑋�. Applications of a matched DID methodology conventionally include the propensity score as a covariate (Aker 2010) or a parametrization of this score (Heckman and Robb 1985) that specifies it as a function of covariates. As noted by Heckman and Robb, this yields results equivalent to instrumenting the treatment indicator (P) by covariates that determine the eligibility rule. Our IV estimator does precisely this, and so generates results that are similar to matching by propensity score.
We also, however, implement a simplified version of the matched DID method by including a set of GP-level (baseline) covariates interacted with the round 2 indicator (R2). This assumes that, conditional on these interactions, growth rates are equivalent across treatment and control samples. This is equivalent to matching (growth rates) on observables. As previously mentioned, we also report results from an IV methodology that uses determinants of eligibility as instruments.
Our discussion of program implementation in section 5 notes that a primary factor explaining variation in the duration of the program across GPs was the availability of an eligible Uddeepika who met educational and examination cut-off score requirements. This suggests that the difference between early and later implementers and, correspondingly, the difference in outcome growth rates across these two samples, may be a function of differences in education levels across GPs. To allow for this, we include an interaction of R2 with the mean level of education of mothers in the GP amongst the covariates, using our baseline data to calculate this mean. This is therefore a time-invariant characteristic of the GP that is unaffected by the program. Additional covariates used to form interactions with R2 are GP population and the number of AWCs in the GP.
Including these interactions and denoting them by the vector R2_GPkt, equation (1) can be rewritten as follows:
𝑌𝑌𝑖𝑖𝑖𝑖𝑖𝑖𝑖𝑖 = 𝛼𝛼0 + 𝛼𝛼1𝑃𝑃𝑖𝑖𝑖𝑖 + 𝛼𝛼2𝛿𝛿𝑖𝑖 + 𝛼𝛼3𝑅𝑅2 + 𝛼𝛼4𝑋𝑋𝑖𝑖𝑖𝑖𝑖𝑖 + 𝛼𝛼5𝑍𝑍𝑖𝑖𝑖𝑖𝑖𝑖𝑖𝑖 + 𝛼𝛼6𝑅𝑅2_𝐺𝐺𝑃𝑃𝑖𝑖𝑖𝑖 + 𝑢𝑢𝑖𝑖𝑖𝑖𝑖𝑖𝑖𝑖
6.5 Evaluating the effect of child exposure to the program
The binary indicator of program availability evaluates a local average treatment effect, averaged across GPs that implemented the program only after the completion of our first survey. This is an average across GPs that differ in the duration of the program, and so reflects delays in implementation. Because program duration is relatively shorter for these GPs, a low estimate may primarily reflect a short period of exposure, and may not apply to programs implemented for longer periods. Utilizing months of program duration instead of a binary indicator of availability allows us to estimate the marginal effect of an additional month of exposure, and hence provides a more informative estimate. In regressions that include GP fixed effects, identification, however, is only possible if the number of months of exposure in each round varies across GPs. For example, if all GPs initiated the program in different months, but before our first survey round, program duration would only vary across GPs in the first survey round. This would make second round program duration indistinguishable from the round 2 indicator variable.
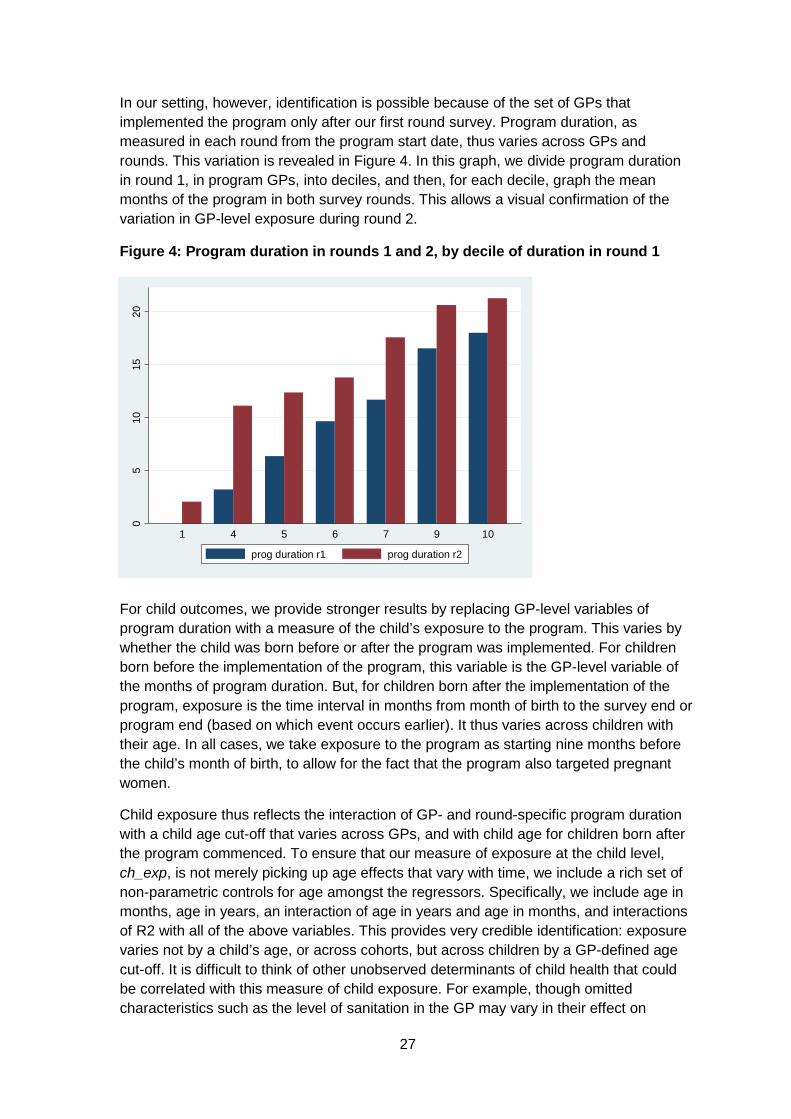
27
In our setting, however, identification is possible because of the set of GPs that implemented the program only after our first round survey. Program duration, as measured in each round from the program start date, thus varies across GPs and rounds. This variation is revealed in Figure 4. In this graph, we divide program duration in round 1, in program GPs, into deciles, and then, for each decile, graph the mean months of the program in both survey rounds. This allows a visual confirmation of the variation in GP-level exposure during round 2.
Figure 4: Program duration in rounds 1 and 2, by decile of duration in round 1
For child outcomes, we provide stronger results by replacing GP-level variables of program duration with a measure of the child’s exposure to the program. This varies by whether the child was born before or after the program was implemented. For children born before the implementation of the program, this variable is the GP-level variable of the months of program duration. But, for children born after the implementation of the program, exposure is the time interval in months from month of birth to the survey end or program end (based on which event occurs earlier). It thus varies across children with their age. In all cases, we take exposure to the program as starting nine months before the child’s month of birth, to allow for the fact that the program also targeted pregnant women.
Child exposure thus reflects the interaction of GP- and round-specific program duration with a child age cut-off that varies across GPs, and with child age for children born after the program commenced. To ensure that our measure of exposure at the child level, ch_exp, is not merely picking up age effects that vary with time, we include a rich set of non-parametric controls for age amongst the regressors. Specifically, we include age in months, age in years, an interaction of age in years and age in months, and interactions of R2 with all of the above variables. This provides very credible identification: exposure varies not by a child’s age, or across cohorts, but across children by a GP-defined age cut-off. It is difficult to think of other unobserved determinants of child health that could be correlated with this measure of child exposure. For example, though omitted characteristics such as the level of sanitation in the GP may vary in their effect on
05
1015
20
1 4 5 6 7 9 10
prog duration r1 prog duration r2
28
outcomes with a child’s age, it is unlikely that they will do so across children of the same age, distinguished by their month of birth relative to the program start date in the GP in which they reside.
By moving from an indicator of program availability to this continuous measure of a child’s exposure to the program, identification now comes not just from within GP variation across time, but from within GP variation across children, in any given survey round. The possibility that this measure of exposure confounds the benefits of program duration with measures such as differences in the ability of the Uddeepika across GPs is thus further reduced: our estimates derive from differences in outcomes across children from the same GP, and thus covered by the same Uddeepika, who vary in exposure because of differences in their birth date relative to the date of initiation of the program.
In regressions in which the outcome variable is specific to the mother (for example, attendance at VHSNDs), we similarly develop a measure specific to the mother in question. For this, we assume that the mother’s exposure to the program is the maximum number of months of exposure of any of her children. If she has only one newborn child, then her months of exposure to the program are equivalent to the child’s exposure. However, if she also has an older child who has been exposed to the program since its start, then her months of exposure are taken to be the maximum over all her children.
6.6 An instrumental variable estimator
To support our results, we also present estimates based on an IV estimator that exploits the GP-level factors responsible for delayed implementation, specifically the lack of women in the GP who satisfied the 60 per cent cut-off score on the entrance examination.19 This is enabled by data provided by the implementation agency on entrance examination scores for all applicants in two of our survey districts, Madhepura and Kishanganj. Unfortunately, the sample size is restricted because of the inability to get this data for the Supaul district, despite our best efforts.
Specifically, we use the number of candidates in each GP with a score of 60 or over in the entrance examination for the Uddeepika position as the basis for a set of instrumental variables to identify the effect of duration of exposure to the program on our outcome variables. This is a very credible instrument. It is unlikely that the number of women in the GP satisfying the eligibility cut-off directly influences outcomes for children in our sample, particularly in regressions that control for the mother’s education as well as the mean years of education of mothers in the GP. However, this same variable is a strong indicator of the availability of eligible candidates (as we subsequently verify through first stage regressions, reported in section 7). As discussed in Heckman and Robb (1985), instrumenting our treatment variable with measures of program eligibility produces results that are similar to matched regressions that include the propensity score amongst regressors.
19 Our pre-analysis plan stated that we would do the same, but with a control function estimator, using the same set of instruments. We use the IV estimator in this study, primarily because the IV estimator is preferred in regressions that also include interaction effects. Additionally, standard errors reported are correct and do not need to be corrected for the use of estimated variables.
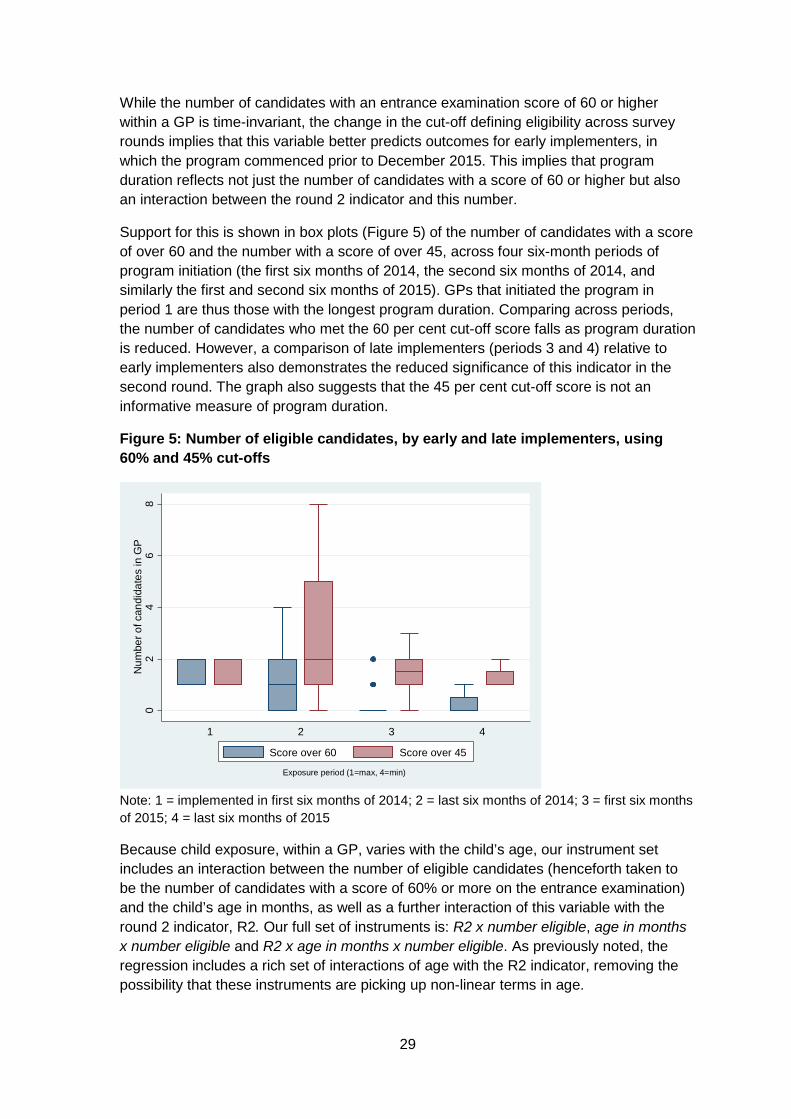
29
While the number of candidates with an entrance examination score of 60 or higher within a GP is time-invariant, the change in the cut-off defining eligibility across survey rounds implies that this variable better predicts outcomes for early implementers, in which the program commenced prior to December 2015. This implies that program duration reflects not just the number of candidates with a score of 60 or higher but also an interaction between the round 2 indicator and this number.
Support for this is shown in box plots (Figure 5) of the number of candidates with a score of over 60 and the number with a score of over 45, across four six-month periods of program initiation (the first six months of 2014, the second six months of 2014, and similarly the first and second six months of 2015). GPs that initiated the program in period 1 are thus those with the longest program duration. Comparing across periods, the number of candidates who met the 60 per cent cut-off score falls as program duration is reduced. However, a comparison of late implementers (periods 3 and 4) relative to early implementers also demonstrates the reduced significance of this indicator in the second round. The graph also suggests that the 45 per cent cut-off score is not an informative measure of program duration.
Figure 5: Number of eligible candidates, by early and late implementers, using 60% and 45% cut-offs
Note: 1 = implemented in first six months of 2014; 2 = last six months of 2014; 3 = first six months of 2015; 4 = last six months of 2015
Because child exposure, within a GP, varies with the child’s age, our instrument set includes an interaction between the number of eligible candidates (henceforth taken to be the number of candidates with a score of 60% or more on the entrance examination) and the child’s age in months, as well as a further interaction of this variable with the round 2 indicator, R2. Our full set of instruments is: R2 x number eligible, age in months x number eligible and R2 x age in months x number eligible. As previously noted, the regression includes a rich set of interactions of age with the R2 indicator, removing the possibility that these instruments are picking up non-linear terms in age.
02
46
8N
umbe
r of c
andi
date
s in
GP
1 2 3 4
Exposure period (1=max, 4=min)
Score over 60 Score over 45
30
Our IV regressions provide a set of consistent but inefficient estimates. We use them to validate the OLS-FE estimates of the effect of child exposure using a standard Hausman test based on an auxiliary regression. For this, we assess the significance of the effect of predicted exposure, based on a first stage regression of child exposure on our set of instruments, in regressions on child WAZ that also include (unpredicted) child exposure. If OLS-FE estimates are consistent, then the coefficient on predicted child exposure should be statistically insignificant.
6.7 Assessing heterogeneity in returns
As stated in the Introduction, the innovation of the program is the use of a cluster approach that provides resources to a cluster, rather than to each AWC within the cluster. This has the clear advantage of reducing costs. However, the reduction in costs may also come with a significant reduction in benefits, relative to a program that provides additional resources to each AWC, if the availability of an Uddeepika only provides benefits to the nodal AWC and not to other AWCs. And, if non-nodal AWCs are those situated in smaller habitations and smaller villages, serving a generally poorer clientele, then the adoption of a cluster approach may also exacerbate inequalities within the GP: the provision of one additional worker may primarily benefit better-off households residing near the nodal AWC. Such distributional benefits may also result if the Uddeepika, given her relatively high level of schooling, favors the provision of AWC services to women from a similar background. To address these concerns, we assess whether the program differentially benefits the nodal AWC relative to others in the GP by allowing the effects of program exposure to vary across nodal and other AWCs. We also test if the program differentially benefits the poor, through interactions of exposure with the mother’s years of education and with an indicator variable for whether the household belongs to a scheduled caste or tribe.
We also report additional results from regressions that test whether the effect of exposure to the program varies across children by their age at the start of the program. We construct three indicator variables: the first taking the value 1 if the child was born after the program started, the second reflecting whether the child was three years old or younger at the start of the program, and the third taking the value 1 if the child was older than three when the program commenced. We include interactions of these three variables with our measure of the child’s months of exposure to the program amongst regression covariates to test for age effects.
6.8 Decomposing returns to identify the roles of labor and human capital constraints
Of greater interest, however, is the question of whether any positive impact of the program is a consequence of its effect on labor or human capital constraints. Answers to this question might help explain the persistence of poor child health in regions such as Bihar and the inability of policies to effect health improvements.
This decomposition of program returns is an important contribution of this study. It requires variation in the number of workers per AWC and in their human capital, variation that is rarely available, particularly in settings such as the Indian economy, where the number of workers per local institution is fixed by policy. In such instances, variation in
31
population per worker or per institution merely reflects variation in the size of the local population, a variable that undoubtedly affects health and other outcomes in numerous ways, not just through its effect on the quality of local health institutions. Similarly, in the absence of data on test scores or other measures of worker ability, the only indicator of the human capital of AWWs is years of education. Since a minimum number of years of education is stipulated for each position, this measure does not vary significantly across AWCs.
Our empirical approach to identifying the role of labor and human capital constraints derives from a standard health production function which allows health to be a function of a set of inputs including the quality of the AWC, Q. Quality in turn is a function of the population per AWC, apop, and the highest level of education amongst workers, aeduc:
(3) 𝐻𝐻 = 𝑓𝑓(𝑄𝑄(𝑎𝑎𝑎𝑎𝑎𝑎𝑎𝑎,𝑎𝑎𝑎𝑎𝑎𝑎𝑢𝑢𝑎𝑎),𝑋𝑋,𝑍𝑍)
In (4), X and Z are, as previously stated, additional characteristics of the community, child and household that determine child health.
For program GPs, population per AWC and the educational levels of its staff are increased for the period in which the program is in place. Let m be the months of program duration, apop_old and aeduc_old be the population per AWC and the maximum education level of its staff in the absence of the program, and apop_new and aeduc_new be the same variables with the program. Then:
(4) 𝑎𝑎𝑎𝑎𝑎𝑎𝑎𝑎 = (1 −𝑚𝑚)𝑎𝑎𝑎𝑎𝑎𝑎𝑎𝑎_𝑎𝑎𝑜𝑜𝑎𝑎 + 𝑚𝑚 ∗ 𝑎𝑎𝑎𝑎𝑎𝑎𝑎𝑎_𝑛𝑛𝑎𝑎𝑛𝑛 = 𝑎𝑎𝑎𝑎𝑎𝑎𝑎𝑎_𝑎𝑎𝑜𝑜𝑎𝑎 −𝑚𝑚 ∗ (𝑎𝑎𝑎𝑎𝑎𝑎𝑎𝑎_𝑎𝑎𝑜𝑜𝑎𝑎 − 𝑎𝑎𝑎𝑎𝑎𝑎𝑎𝑎_𝑛𝑛𝑎𝑎𝑛𝑛) (5) 𝑎𝑎𝑎𝑎𝑎𝑎𝑢𝑢𝑎𝑎 = 𝑎𝑎𝑎𝑎𝑎𝑎𝑢𝑢𝑎𝑎_𝑎𝑎𝑜𝑜𝑎𝑎 − 𝑚𝑚 ∗ (𝑎𝑎𝑎𝑎𝑎𝑎𝑢𝑢𝑎𝑎_𝑎𝑎𝑜𝑜𝑎𝑎 − 𝑎𝑎𝑎𝑎𝑎𝑎𝑢𝑢𝑎𝑎_𝑛𝑛𝑎𝑎𝑛𝑛)
This implies that, with a linear formulation of the health production function (4), child health is a function of the interaction of program duration with the change in Anganwadi population per worker and the ability of its staff, or the extent to which they reduce population per worker or increase human capital, relative to pre-existing levels.
Identification of the change in population per AWC under the program is possible because only one Uddeepika was assigned to each GP, and because she was required to divide her time between all AWCs in the GP. The number of AWCs in a GP varies significantly, from a minimum of 3 to a maximum of 17, with the mean value being 11 (Figure 6). This considerable variation caused the additional labor input provided under the program to vary across GPs.20 To operationalize this, we weight each worker in the AWC in proportion to her salary, with the main Anganwadi worker, the Sevika, getting a weight of 1, her helper a weight of 0.5, and the Uddeepika a weight of 1.67. Let Pk be an indicator variable for a program GP.
20 Program rules stipulated that the Uddeepika visit all AWCs in the GP at least twice a month. In GPs with few AWCs, more visits to each AWC were therefore possible. In others, the requirement that all AWCs be visited implies less time spent in each AWC during each visit.
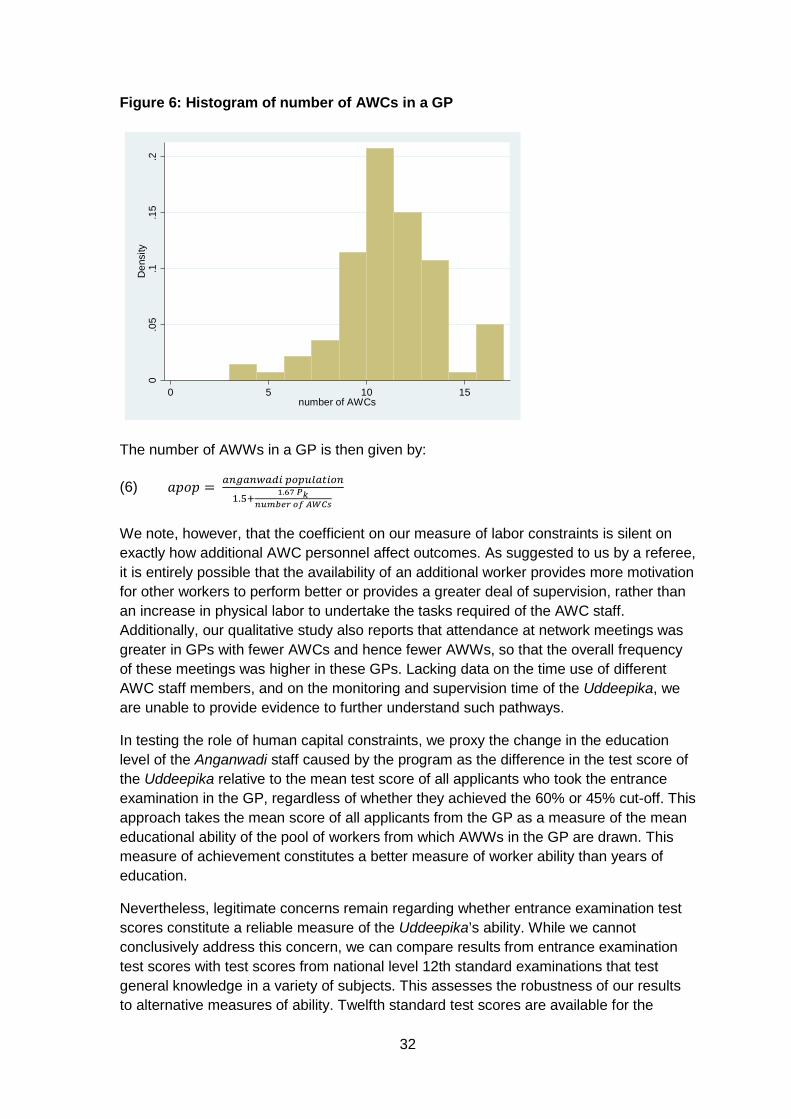
32
Figure 6: Histogram of number of AWCs in a GP
The number of AWWs in a GP is then given by:
(6) 𝑎𝑎𝑎𝑎𝑎𝑎𝑎𝑎 = 𝑎𝑎𝑎𝑎𝑎𝑎𝑎𝑎𝑎𝑎𝑎𝑎𝑎𝑎𝑎𝑎𝑖𝑖 𝑝𝑝𝑝𝑝𝑝𝑝𝑝𝑝𝑝𝑝𝑎𝑎𝑖𝑖𝑖𝑖𝑝𝑝𝑎𝑎1.5+ 1.67 𝑃𝑃𝑘𝑘
𝑛𝑛𝑛𝑛𝑛𝑛𝑛𝑛𝑛𝑛𝑛𝑛 𝑜𝑜𝑜𝑜 𝐴𝐴𝐴𝐴𝐴𝐴𝐴𝐴
We note, however, that the coefficient on our measure of labor constraints is silent on exactly how additional AWC personnel affect outcomes. As suggested to us by a referee, it is entirely possible that the availability of an additional worker provides more motivation for other workers to perform better or provides a greater deal of supervision, rather than an increase in physical labor to undertake the tasks required of the AWC staff. Additionally, our qualitative study also reports that attendance at network meetings was greater in GPs with fewer AWCs and hence fewer AWWs, so that the overall frequency of these meetings was higher in these GPs. Lacking data on the time use of different AWC staff members, and on the monitoring and supervision time of the Uddeepika, we are unable to provide evidence to further understand such pathways.
In testing the role of human capital constraints, we proxy the change in the education level of the Anganwadi staff caused by the program as the difference in the test score of the Uddeepika relative to the mean test score of all applicants who took the entrance examination in the GP, regardless of whether they achieved the 60% or 45% cut-off. This approach takes the mean score of all applicants from the GP as a measure of the mean educational ability of the pool of workers from which AWWs in the GP are drawn. This measure of achievement constitutes a better measure of worker ability than years of education.
Nevertheless, legitimate concerns remain regarding whether entrance examination test scores constitute a reliable measure of the Uddeepika’s ability. While we cannot conclusively address this concern, we can compare results from entrance examination test scores with test scores from national level 12th standard examinations that test general knowledge in a variety of subjects. This assesses the robustness of our results to alternative measures of ability. Twelfth standard test scores are available for the
0.0
5.1
.15
.2D
ensi
ty
0 5 10 15number of AWCs
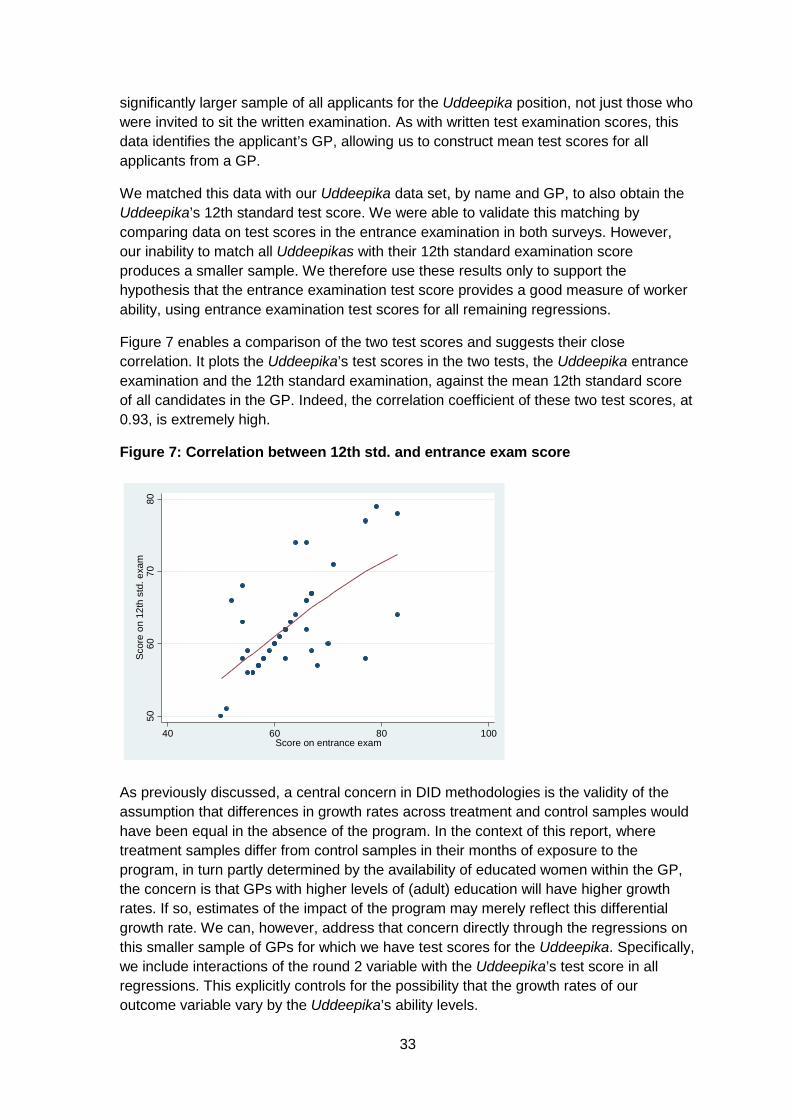
33
significantly larger sample of all applicants for the Uddeepika position, not just those who were invited to sit the written examination. As with written test examination scores, this data identifies the applicant’s GP, allowing us to construct mean test scores for all applicants from a GP.
We matched this data with our Uddeepika data set, by name and GP, to also obtain the Uddeepika’s 12th standard test score. We were able to validate this matching by comparing data on test scores in the entrance examination in both surveys. However, our inability to match all Uddeepikas with their 12th standard examination score produces a smaller sample. We therefore use these results only to support the hypothesis that the entrance examination test score provides a good measure of worker ability, using entrance examination test scores for all remaining regressions.
Figure 7 enables a comparison of the two test scores and suggests their close correlation. It plots the Uddeepika’s test scores in the two tests, the Uddeepika entrance examination and the 12th standard examination, against the mean 12th standard score of all candidates in the GP. Indeed, the correlation coefficient of these two test scores, at 0.93, is extremely high.
Figure 7: Correlation between 12th std. and entrance exam score
As previously discussed, a central concern in DID methodologies is the validity of the assumption that differences in growth rates across treatment and control samples would have been equal in the absence of the program. In the context of this report, where treatment samples differ from control samples in their months of exposure to the program, in turn partly determined by the availability of educated women within the GP, the concern is that GPs with higher levels of (adult) education will have higher growth rates. If so, estimates of the impact of the program may merely reflect this differential growth rate. We can, however, address that concern directly through the regressions on this smaller sample of GPs for which we have test scores for the Uddeepika. Specifically, we include interactions of the round 2 variable with the Uddeepika’s test score in all regressions. This explicitly controls for the possibility that the growth rates of our outcome variable vary by the Uddeepika’s ability levels.
5060
7080
Scor
e on
12t
h st
d. e
xam
40 60 80 100Score on entrance exam
34
6.9 Data sources, quality and attrition
The data for our empirical analysis comes primarily from our household survey but also from secondary data sources. Data on the Anganwadi population is from the Government of Bihar’s data set on AWCs, cross-checked against Anganwadi population figures that we collected from each AWC through our AWC survey. Similarly, Uddeepika test scores were collected directly from Uddeepikas but also cross-checked against data provided by the Bihar Government’s ICDS program (through the Ministry of Women and Child Welfare). When data from both sources was available, we were able to confirm the validity of our data. In a few cases, where data on Uddeepika test scores was not part of the government data, we used the survey data we collected.
Because of the relatively short time lag between the first and second rounds of the survey, attrition rates were extremely low. This was also because our survey team devoted a number of days to each village, so as to ensure coverage of all first round households. There were only 75 households out of 4,687 first round households that were not interviewed in the second round. However, there is a higher attrition rate for child weight data, since, despite an extended stay in the village, it was not possible to get weight information for all children surveyed in the first round. Out of a total sample of 5,162 children, weight observations in both rounds of the survey data are available for a sample of 4,555 children, a response rate of higher than 88 per cent.
7. Results
7.1 Fixed effect estimates of the program on child WAZ
The first column in Table 5 provides results from a standard DID estimator of child WAZ on a dummy variable that takes the value 1 if the program was in place in the GP during the survey round in question. This regression is based on the full sample of households, from all four survey districts. It yields a statistically significant effect of program availability on child WAZ. This estimate represents the improvement in WAZ in GPs in which the program was in place for an average of seven months. Assuming a linear effect of program exposure on child WAZ, the estimate suggests that a one-month program would increase WAZ by 0.07 standard deviations.
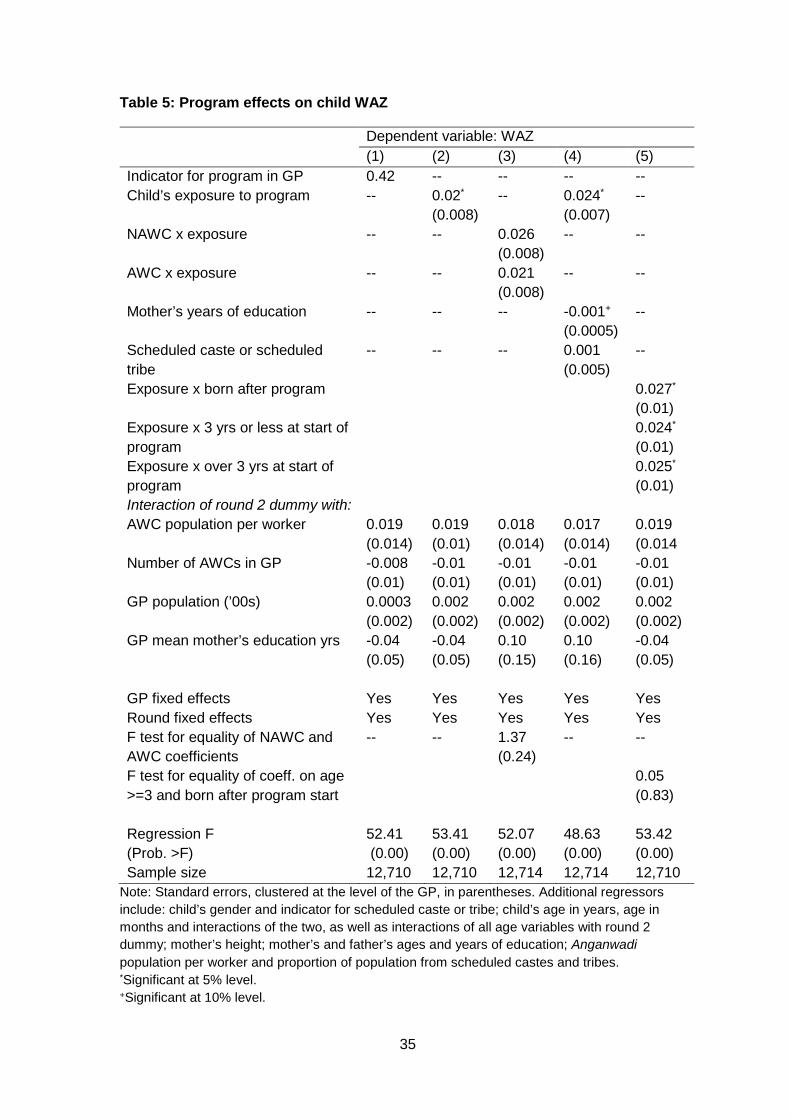
35
Table 5: Program effects on child WAZ
Dependent variable: WAZ (1) (2) (3) (4) (5)
Indicator for program in GP 0.42 -- -- -- -- Child’s exposure to program -- 0.02*
(0.008) -- 0.024*
(0.007) --
NAWC x exposure -- -- 0.026 (0.008)
-- --
AWC x exposure -- -- 0.021 (0.008)
-- --
Mother’s years of education -- -- -- -0.001+
(0.0005) --
Scheduled caste or scheduled tribe
-- -- -- 0.001 (0.005)
--
Exposure x born after program 0.027*
(0.01) Exposure x 3 yrs or less at start of program
0.024*
(0.01) Exposure x over 3 yrs at start of program
0.025*
(0.01) Interaction of round 2 dummy with: AWC population per worker 0.019
(0.014) 0.019 (0.01)
0.018 (0.014)
0.017 (0.014)
0.019 (0.014
Number of AWCs in GP -0.008 (0.01)
-0.01 (0.01)
-0.01 (0.01)
-0.01 (0.01)
-0.01 (0.01)
GP population (’00s) 0.0003 (0.002)
0.002 (0.002)
0.002 (0.002)
0.002 (0.002)
0.002 (0.002)
GP mean mother’s education yrs -0.04 (0.05)
-0.04 (0.05)
0.10 (0.15)
0.10 (0.16)
-0.04 (0.05)
GP fixed effects Yes Yes Yes Yes Yes Round fixed effects Yes Yes Yes Yes Yes F test for equality of NAWC and AWC coefficients
-- -- 1.37 (0.24)
-- --
F test for equality of coeff. on age >=3 and born after program start
0.05 (0.83)
Regression F (Prob. >F)
52.41 (0.00)
53.41 (0.00)
52.07 (0.00)
48.63 (0.00)
53.42 (0.00)
Sample size 12,710 12,710 12,714 12,714 12,710 Note: Standard errors, clustered at the level of the GP, in parentheses. Additional regressors include: child’s gender and indicator for scheduled caste or tribe; child’s age in years, age in months and interactions of the two, as well as interactions of all age variables with round 2 dummy; mother’s height; mother’s and father’s ages and years of education; Anganwadi population per worker and proportion of population from scheduled castes and tribes. *Significant at 5% level. +Significant at 10% level.
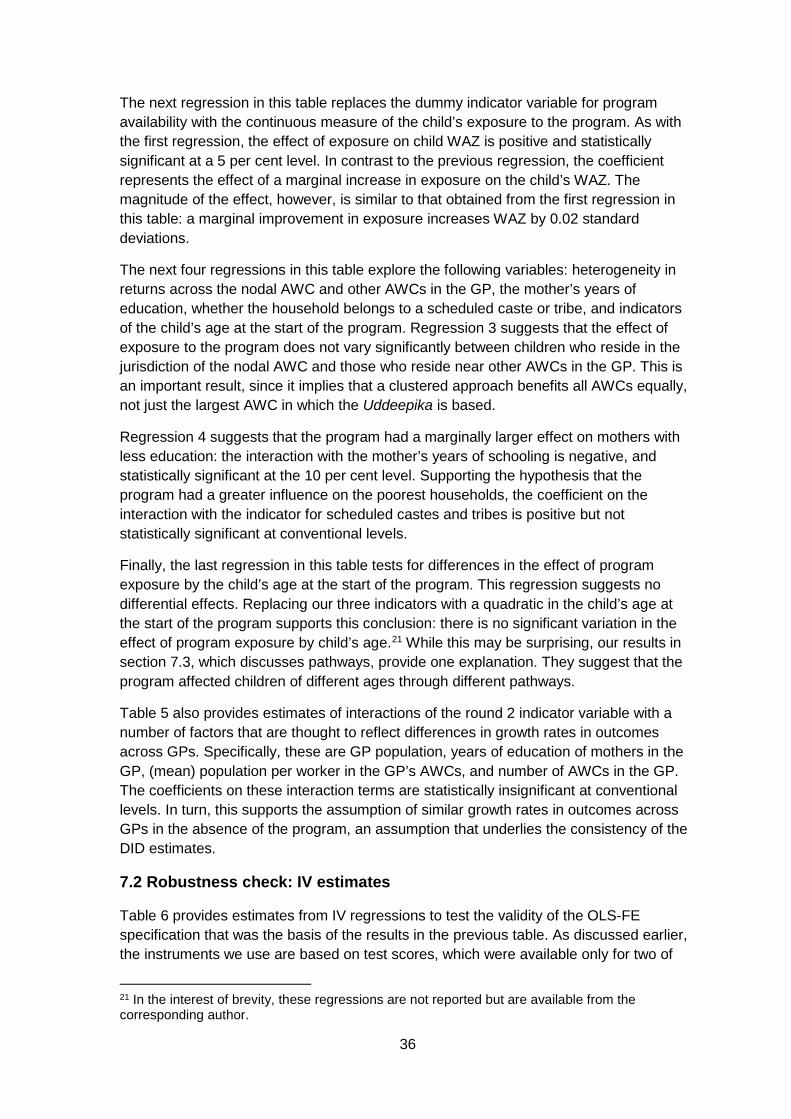
36
The next regression in this table replaces the dummy indicator variable for program availability with the continuous measure of the child’s exposure to the program. As with the first regression, the effect of exposure on child WAZ is positive and statistically significant at a 5 per cent level. In contrast to the previous regression, the coefficient represents the effect of a marginal increase in exposure on the child’s WAZ. The magnitude of the effect, however, is similar to that obtained from the first regression in this table: a marginal improvement in exposure increases WAZ by 0.02 standard deviations.
The next four regressions in this table explore the following variables: heterogeneity in returns across the nodal AWC and other AWCs in the GP, the mother’s years of education, whether the household belongs to a scheduled caste or tribe, and indicators of the child’s age at the start of the program. Regression 3 suggests that the effect of exposure to the program does not vary significantly between children who reside in the jurisdiction of the nodal AWC and those who reside near other AWCs in the GP. This is an important result, since it implies that a clustered approach benefits all AWCs equally, not just the largest AWC in which the Uddeepika is based.
Regression 4 suggests that the program had a marginally larger effect on mothers with less education: the interaction with the mother’s years of schooling is negative, and statistically significant at the 10 per cent level. Supporting the hypothesis that the program had a greater influence on the poorest households, the coefficient on the interaction with the indicator for scheduled castes and tribes is positive but not statistically significant at conventional levels.
Finally, the last regression in this table tests for differences in the effect of program exposure by the child’s age at the start of the program. This regression suggests no differential effects. Replacing our three indicators with a quadratic in the child’s age at the start of the program supports this conclusion: there is no significant variation in the effect of program exposure by child’s age.21 While this may be surprising, our results in section 7.3, which discusses pathways, provide one explanation. They suggest that the program affected children of different ages through different pathways.
Table 5 also provides estimates of interactions of the round 2 indicator variable with a number of factors that are thought to reflect differences in growth rates in outcomes across GPs. Specifically, these are GP population, years of education of mothers in the GP, (mean) population per worker in the GP’s AWCs, and number of AWCs in the GP. The coefficients on these interaction terms are statistically insignificant at conventional levels. In turn, this supports the assumption of similar growth rates in outcomes across GPs in the absence of the program, an assumption that underlies the consistency of the DID estimates.
7.2 Robustness check: IV estimates
Table 6 provides estimates from IV regressions to test the validity of the OLS-FE specification that was the basis of the results in the previous table. As discussed earlier, the instruments we use are based on test scores, which were available only for two of
21 In the interest of brevity, these regressions are not reported but are available from the corresponding author.
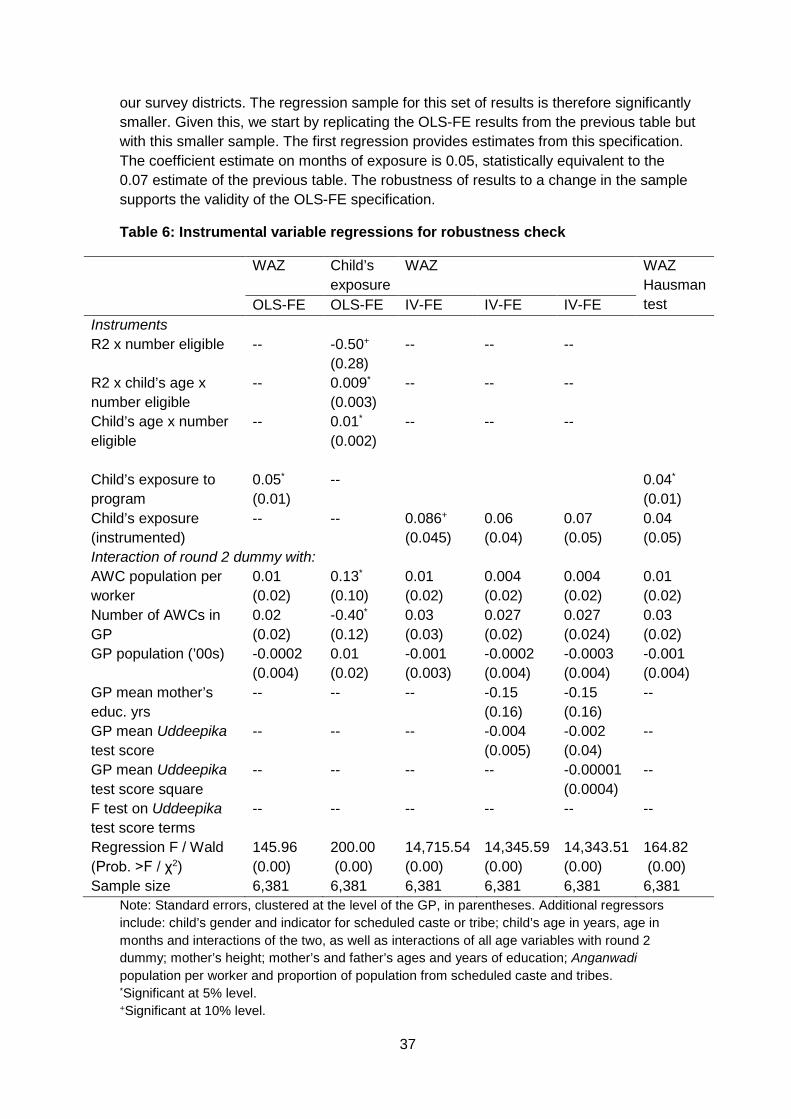
37
our survey districts. The regression sample for this set of results is therefore significantly smaller. Given this, we start by replicating the OLS-FE results from the previous table but with this smaller sample. The first regression provides estimates from this specification. The coefficient estimate on months of exposure is 0.05, statistically equivalent to the 0.07 estimate of the previous table. The robustness of results to a change in the sample supports the validity of the OLS-FE specification.
Table 6: Instrumental variable regressions for robustness check
WAZ Child’s exposure
WAZ WAZ Hausman test OLS-FE OLS-FE IV-FE IV-FE IV-FE
Instruments R2 x number eligible -- -0.50+
(0.28) -- -- --
R2 x child’s age x number eligible
-- 0.009*
(0.003) -- -- --
Child’s age x number eligible
-- 0.01*
(0.002) -- -- --
Child’s exposure to program
0.05*
(0.01) -- 0.04*
(0.01) Child’s exposure (instrumented)
-- -- 0.086+ (0.045)
0.06 (0.04)
0.07 (0.05)
0.04 (0.05)
Interaction of round 2 dummy with: AWC population per worker
0.01 (0.02)
0.13*
(0.10) 0.01 (0.02)
0.004 (0.02)
0.004 (0.02)
0.01 (0.02)
Number of AWCs in GP
0.02 (0.02)
-0.40*
(0.12) 0.03 (0.03)
0.027 (0.02)
0.027 (0.024)
0.03 (0.02)
GP population (’00s) -0.0002 (0.004)
0.01 (0.02)
-0.001 (0.003)
-0.0002 (0.004)
-0.0003 (0.004)
-0.001 (0.004)
GP mean mother’s educ. yrs
-- -- -- -0.15 (0.16)
-0.15 (0.16)
--
GP mean Uddeepika test score
-- -- -- -0.004 (0.005)
-0.002 (0.04)
--
GP mean Uddeepika test score square
-- -- -- -- -0.00001 (0.0004)
--
F test on Uddeepika test score terms
-- -- -- -- -- --
Regression F / Wald (Prob. >F / χ2)
145.96 (0.00)
200.00 (0.00)
14,715.54 (0.00)
14,345.59 (0.00)
14,343.51 (0.00)
164.82 (0.00)
Sample size 6,381 6,381 6,381 6,381 6,381 6,381 Note: Standard errors, clustered at the level of the GP, in parentheses. Additional regressors include: child’s gender and indicator for scheduled caste or tribe; child’s age in years, age in months and interactions of the two, as well as interactions of all age variables with round 2 dummy; mother’s height; mother’s and father’s ages and years of education; Anganwadi population per worker and proportion of population from scheduled caste and tribes. *Significant at 5% level. +Significant at 10% level.
38
The second regression reported in this table is the first stage regression of the child’s exposure to the program on the set of instruments, based on the number of candidates in the GP who received a score of 60 per cent or higher. An F test on this instrument set confirms its high explanatory power (F(3,48)=5.95, p=0.002). These results support the explanations provided to us by the implementing agency for the variation in the program start date across GPs: delayed implementation was significantly related to the lack of eligible applicants in the GP.
The remaining regressions in this table report results from an IV-FE specification. Regression 3 replicates the basic estimating equation of the previous table, exploring the effect of a child’s exposure to the program on his or her WAZ. The coefficient estimate is 0.086, again statistically equivalent to the coefficient estimate of 0.05 from the OLS-IV specification in the first regression of this table. The fourth regression explores the sensitivity of the results to including interactions of the round 2 indicator with the mean years of schooling of mothers in the GP, as well as the mean score in the entrance examination of all applicants in the GP. The next regression adds a squared term in the GP mean test result. These terms have no statistically significant effect on child WAZ. Additionally, the coefficient on child exposure remains similar across specifications, though there is a loss in explanatory power.
The last regression in this table explores the validity of the OLS-FE specification through a Hausman test based on an auxiliary regression. This (OLS-FE) regression includes both child exposure and its predicted value in the set of regressors. The coefficient on the predicted value is statistically insignificant, supporting the hypothesis that the estimate from the OLS-FE specification is consistent.
7.3 Exploring pathways
The first set of results reported in Table 7 decompose the effect of program exposure on child WAZ into an effect that operates through reductions in the labor constraint – measured as the difference in population per worker ratios with and without the program – and a component that reflects its effect on human capital constraints, the difference between the Uddeepika’s test score and the mean score of all applicants in the GP. Because these regressions utilize data on test scores, the sample is restricted to the two districts for which we have this data.
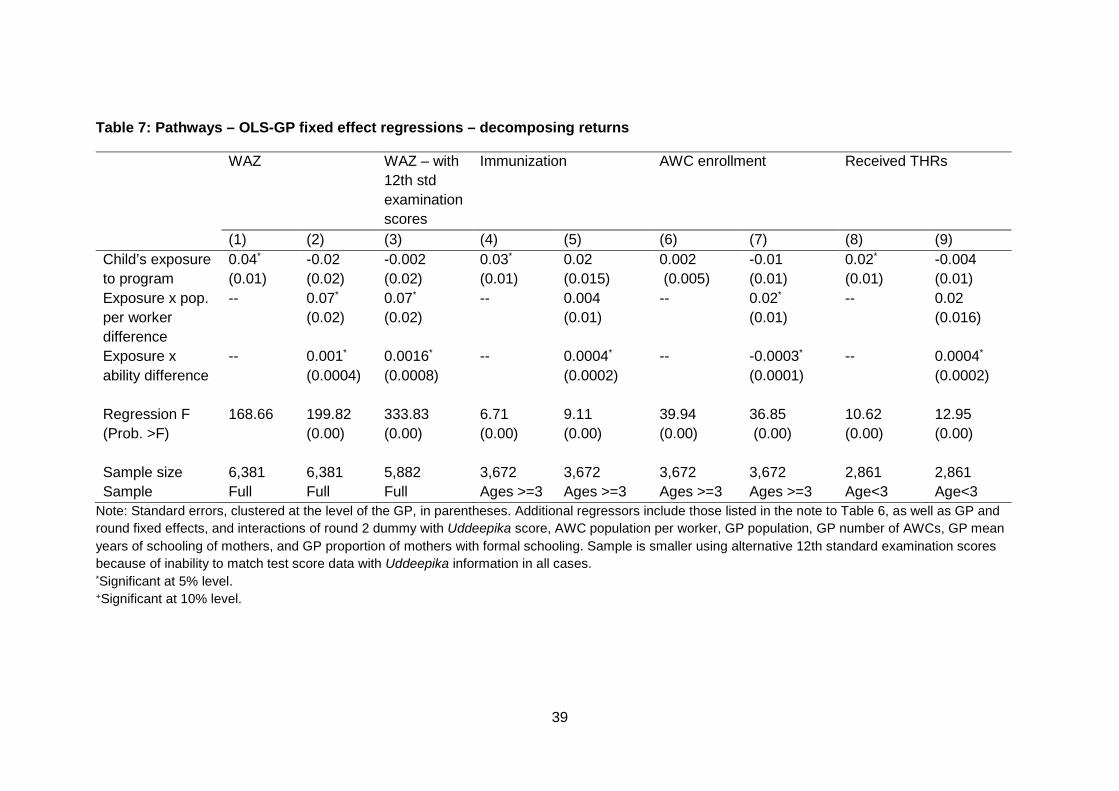
39
Table 7: Pathways – OLS-GP fixed effect regressions – decomposing returns
WAZ WAZ – with 12th std examination scores
Immunization AWC enrollment Received THRs
(1) (2) (3) (4) (5) (6) (7) (8) (9) Child’s exposure to program
0.04*
(0.01) -0.02 (0.02)
-0.002 (0.02)
0.03*
(0.01) 0.02
(0.015) 0.002 (0.005)
-0.01
(0.01) 0.02*
(0.01) -0.004 (0.01)
Exposure x pop. per worker difference
-- 0.07*
(0.02) 0.07*
(0.02) -- 0.004
(0.01) -- 0.02*
(0.01) -- 0.02
(0.016)
Exposure x ability difference
-- 0.001*
(0.0004) 0.0016*
(0.0008) -- 0.0004*
(0.0002) -- -0.0003*
(0.0001) -- 0.0004*
(0.0002) Regression F (Prob. >F)
168.66 199.82 (0.00)
333.83 (0.00)
6.71 (0.00)
9.11 (0.00)
39.94 (0.00)
36.85 (0.00)
10.62 (0.00)
12.95 (0.00)
Sample size 6,381 6,381 5,882 3,672 3,672 3,672 3,672 2,861 2,861 Sample Full Full Full Ages >=3 Ages >=3 Ages >=3 Ages >=3 Age<3 Age<3
Note: Standard errors, clustered at the level of the GP, in parentheses. Additional regressors include those listed in the note to Table 6, as well as GP and round fixed effects, and interactions of round 2 dummy with Uddeepika score, AWC population per worker, GP population, GP number of AWCs, GP mean years of schooling of mothers, and GP proportion of mothers with formal schooling. Sample is smaller using alternative 12th standard examination scores because of inability to match test score data with Uddeepika information in all cases. *Significant at 5% level. +Significant at 10% level.
40
Since our measure of the human capital constraint varies with the Uddeepika’s test score, we expand the set of regressors to include an interaction of the round 2 dummy variable with this test score, allowing this to affect outcomes directly. In addition, we include an interaction of the round 2 indicator with child exposure, along with its (previously included) interactions with the (pre-program) AWC population per worker and the total number of AWCs in the GP. The inclusion of this variable thus explicitly tests whether growth rates across GPs vary with the Uddeepika’s test score. We report the coefficient from this interacted term in Table 7: it has no significant effect on outcomes, supporting the validity of our estimates.
The first regression reproduces our earlier results to facilitate comparisons, restricting attention to the average effect of child exposure on child WAZ.22 The second column reports results from the interaction of exposure with the difference in population per worker and the education difference. These results suggest that the program effectively addressed both labor and human capital constraints: the program was most effective in GPs in which the reduction in AWC population per worker was the largest, and in GPs with a greater difference in the Uddeepika’s test score relative to the mean test score of all applicants. We delay an exploration of the magnitude of these results until the next section.
Column (3) provides supporting evidence of the validity of our ability measure, replacing written examination test scores with scores from national 12th standard examinations. Using an alternative test score does not alter results: program returns accrue because of the effect of the program on both labor and ability constraints.
The next three sets of results in this table explore intermediate outcomes that affect child health, specifically immunization, enrollment in the AWC, and the provision of THRs to children.23 AWCs provide pre-school education for children over the age of three. Enrollment is measured by responses from the mother as to whether her child attended the AWC. Our immunization measure is an indicator variable that takes the value 1 if the mother and child protection card, provided to all mothers by the AWC at the time of registration of their pregnancy, indicated at least one dose of DPT, oral polio and Bacillus Calmette-Guerin vaccines. It is therefore not a measure of full immunization. Regressions on immunizations and AWC enrollment are for children three years of age or older, while regressions on THRs are for children under the age of three.
A primary method by which enrollment in the AWC improves child health is likely to be through the midday meal provided in these centers to students in attendance. However, other pathways are also possible. For example, AWC staff are supposed to teach enrolled children health-improving practices, such as the washing of hands. If improvements in child health occur through this pathway, it suggests that the program,
22 The marginal difference in the coefficient on exposure is a result of the expansion of the set of explanatory variables to include the interaction of the second round indicator with the mean test score of all applicants in the GP. 23 While India’s National Food Security Act (2013) requires universal provision of THRs to all pregnant and lactating women, as well as to all children, resource constraints in Bihar have prevented universal coverage in the state (at least as at the time of the survey). Consequently, there is still considerable discretion at the AWC level regarding who receives these THRs. We elaborate on this point in our discussion of results in section 8.
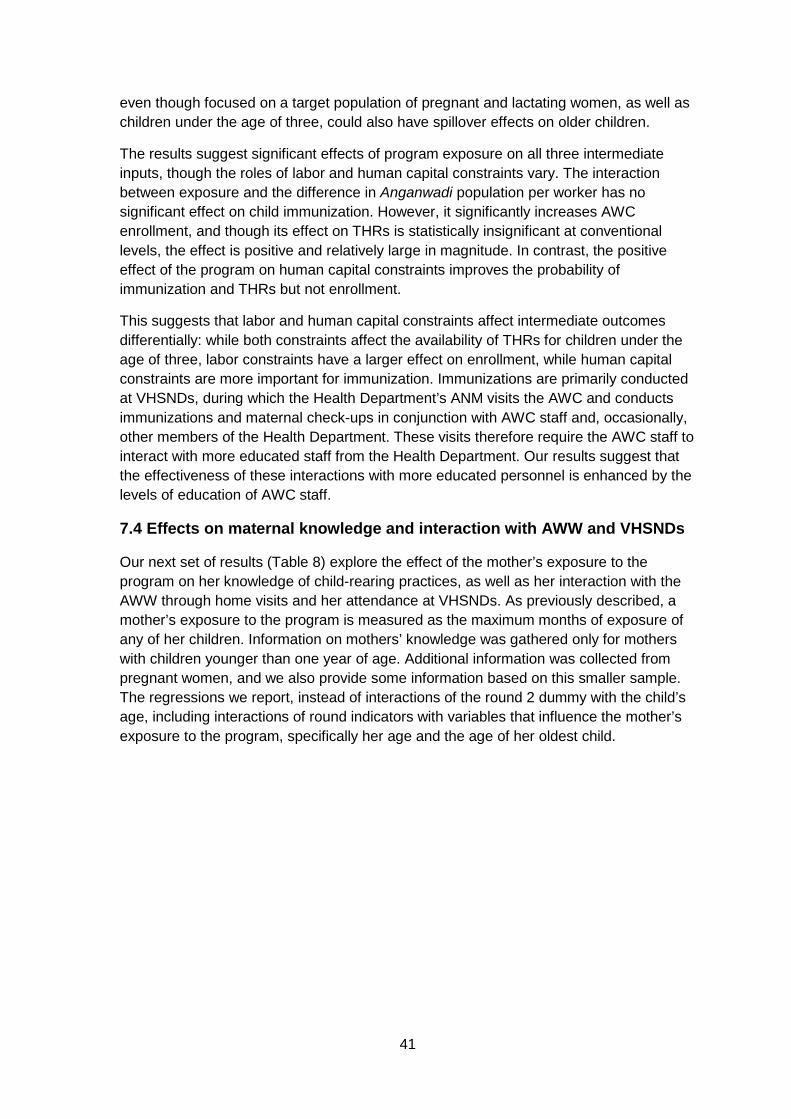
41
even though focused on a target population of pregnant and lactating women, as well as children under the age of three, could also have spillover effects on older children.
The results suggest significant effects of program exposure on all three intermediate inputs, though the roles of labor and human capital constraints vary. The interaction between exposure and the difference in Anganwadi population per worker has no significant effect on child immunization. However, it significantly increases AWC enrollment, and though its effect on THRs is statistically insignificant at conventional levels, the effect is positive and relatively large in magnitude. In contrast, the positive effect of the program on human capital constraints improves the probability of immunization and THRs but not enrollment.
This suggests that labor and human capital constraints affect intermediate outcomes differentially: while both constraints affect the availability of THRs for children under the age of three, labor constraints have a larger effect on enrollment, while human capital constraints are more important for immunization. Immunizations are primarily conducted at VHSNDs, during which the Health Department’s ANM visits the AWC and conducts immunizations and maternal check-ups in conjunction with AWC staff and, occasionally, other members of the Health Department. These visits therefore require the AWC staff to interact with more educated staff from the Health Department. Our results suggest that the effectiveness of these interactions with more educated personnel is enhanced by the levels of education of AWC staff.
7.4 Effects on maternal knowledge and interaction with AWW and VHSNDs
Our next set of results (Table 8) explore the effect of the mother’s exposure to the program on her knowledge of child-rearing practices, as well as her interaction with the AWW through home visits and her attendance at VHSNDs. As previously described, a mother’s exposure to the program is measured as the maximum months of exposure of any of her children. Information on mothers’ knowledge was gathered only for mothers with children younger than one year of age. Additional information was collected from pregnant women, and we also provide some information based on this smaller sample. The regressions we report, instead of interactions of the round 2 dummy with the child’s age, including interactions of round indicators with variables that influence the mother’s exposure to the program, specifically her age and the age of her oldest child.
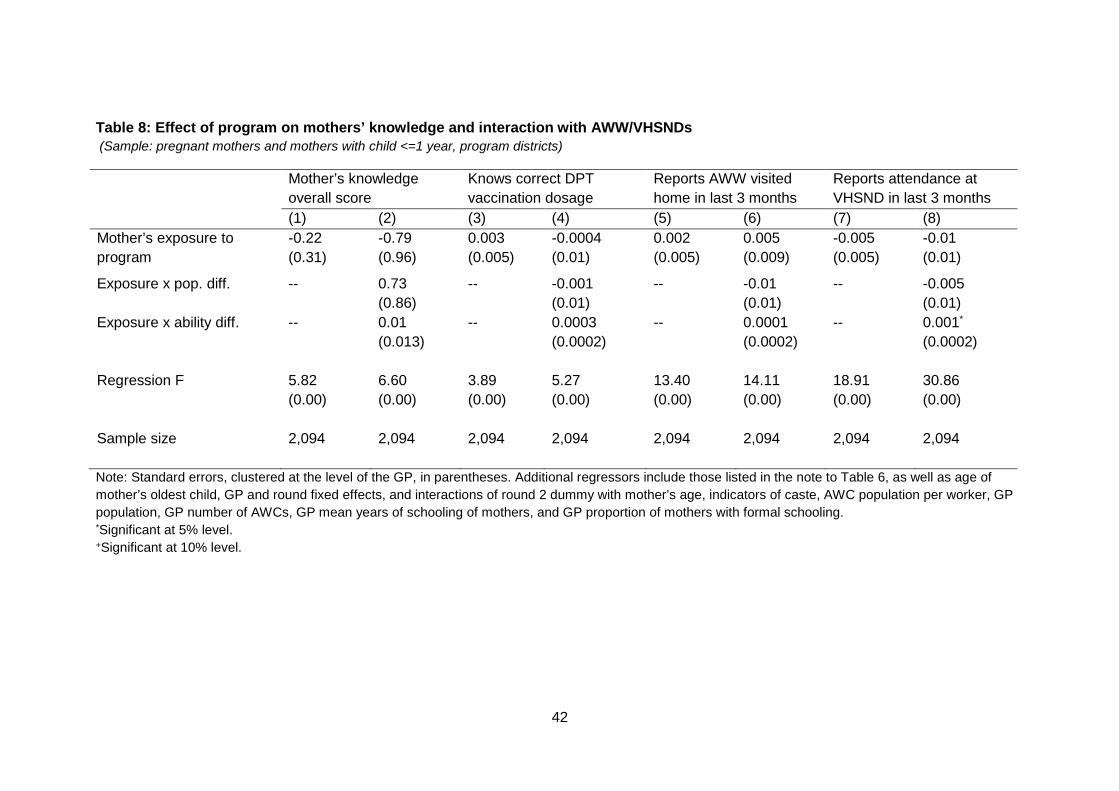
42
Table 8: Effect of program on mothers’ knowledge and interaction with AWW/VHSNDs (Sample: pregnant mothers and mothers with child <=1 year, program districts)
Mother’s knowledge overall score
Knows correct DPT vaccination dosage
Reports AWW visited home in last 3 months
Reports attendance at VHSND in last 3 months
(1) (2) (3) (4) (5) (6) (7) (8) Mother’s exposure to program
-0.22 (0.31)
-0.79 (0.96)
0.003 (0.005)
-0.0004 (0.01)
0.002 (0.005)
0.005 (0.009)
-0.005 (0.005)
-0.01 (0.01)
Exposure x pop. diff. -- 0.73 (0.86)
-- -0.001 (0.01)
-- -0.01 (0.01)
-- -0.005 (0.01)
Exposure x ability diff. -- 0.01
(0.013) -- 0.0003
(0.0002) -- 0.0001
(0.0002) -- 0.001*
(0.0002) Regression F 5.82
(0.00) 6.60 (0.00)
3.89 (0.00)
5.27 (0.00)
13.40 (0.00)
14.11 (0.00)
18.91 (0.00)
30.86 (0.00)
Sample size 2,094 2,094 2,094 2,094 2,094 2,094 2,094 2,094 Note: Standard errors, clustered at the level of the GP, in parentheses. Additional regressors include those listed in the note to Table 6, as well as age of mother’s oldest child, GP and round fixed effects, and interactions of round 2 dummy with mother’s age, indicators of caste, AWC population per worker, GP population, GP number of AWCs, GP mean years of schooling of mothers, and GP proportion of mothers with formal schooling. *Significant at 5% level. +Significant at 10% level.
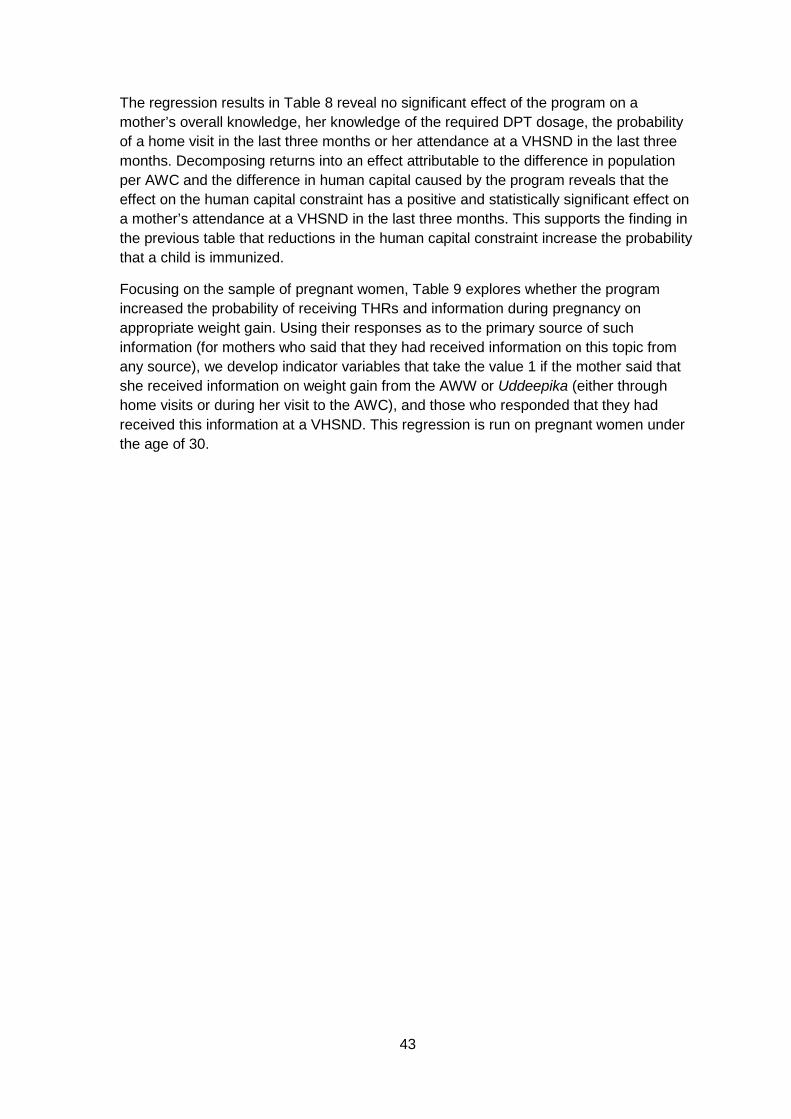
43
The regression results in Table 8 reveal no significant effect of the program on a mother’s overall knowledge, her knowledge of the required DPT dosage, the probability of a home visit in the last three months or her attendance at a VHSND in the last three months. Decomposing returns into an effect attributable to the difference in population per AWC and the difference in human capital caused by the program reveals that the effect on the human capital constraint has a positive and statistically significant effect on a mother’s attendance at a VHSND in the last three months. This supports the finding in the previous table that reductions in the human capital constraint increase the probability that a child is immunized.
Focusing on the sample of pregnant women, Table 9 explores whether the program increased the probability of receiving THRs and information during pregnancy on appropriate weight gain. Using their responses as to the primary source of such information (for mothers who said that they had received information on this topic from any source), we develop indicator variables that take the value 1 if the mother said that she received information on weight gain from the AWW or Uddeepika (either through home visits or during her visit to the AWC), and those who responded that they had received this information at a VHSND. This regression is run on pregnant women under the age of 30.
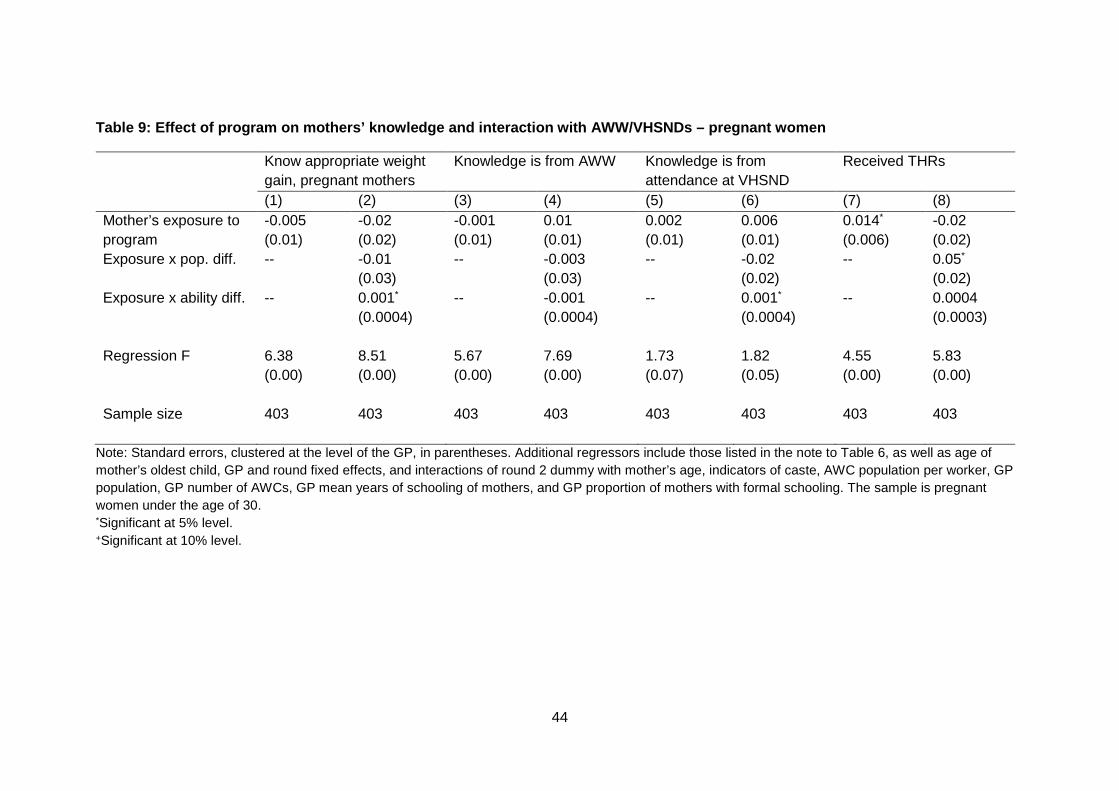
44
Table 9: Effect of program on mothers’ knowledge and interaction with AWW/VHSNDs – pregnant women
Know appropriate weight gain, pregnant mothers
Knowledge is from AWW Knowledge is from attendance at VHSND
Received THRs
(1) (2) (3) (4) (5) (6) (7) (8) Mother’s exposure to program
-0.005 (0.01)
-0.02 (0.02)
-0.001 (0.01)
0.01 (0.01)
0.002 (0.01)
0.006 (0.01)
0.014*
(0.006) -0.02 (0.02)
Exposure x pop. diff. -- -0.01 (0.03)
-- -0.003 (0.03)
-- -0.02 (0.02)
-- 0.05*
(0.02) Exposure x ability diff. -- 0.001*
(0.0004) -- -0.001
(0.0004) -- 0.001*
(0.0004) -- 0.0004
(0.0003) Regression F 6.38
(0.00) 8.51 (0.00)
5.67 (0.00)
7.69 (0.00)
1.73 (0.07)
1.82 (0.05)
4.55 (0.00)
5.83 (0.00)
Sample size 403 403 403 403 403 403 403 403
Note: Standard errors, clustered at the level of the GP, in parentheses. Additional regressors include those listed in the note to Table 6, as well as age of mother’s oldest child, GP and round fixed effects, and interactions of round 2 dummy with mother’s age, indicators of caste, AWC population per worker, GP population, GP number of AWCs, GP mean years of schooling of mothers, and GP proportion of mothers with formal schooling. The sample is pregnant women under the age of 30. *Significant at 5% level. +Significant at 10% level.
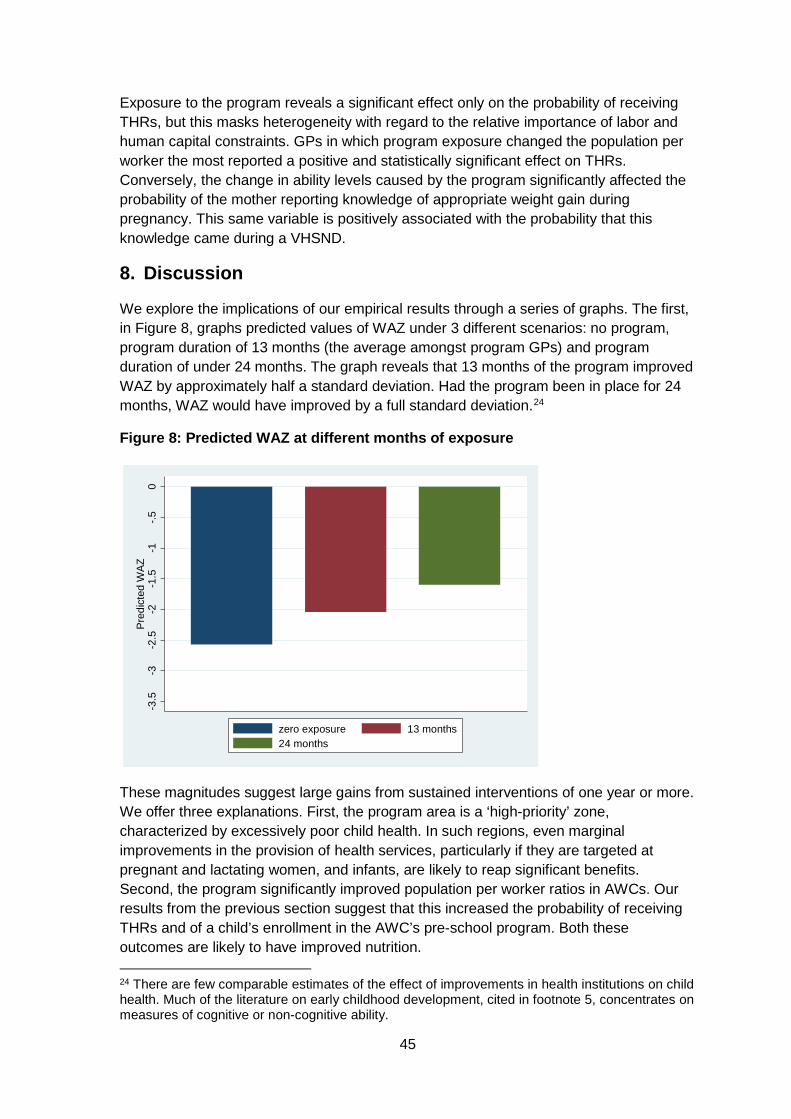
45
Exposure to the program reveals a significant effect only on the probability of receiving THRs, but this masks heterogeneity with regard to the relative importance of labor and human capital constraints. GPs in which program exposure changed the population per worker the most reported a positive and statistically significant effect on THRs. Conversely, the change in ability levels caused by the program significantly affected the probability of the mother reporting knowledge of appropriate weight gain during pregnancy. This same variable is positively associated with the probability that this knowledge came during a VHSND.
8. Discussion
We explore the implications of our empirical results through a series of graphs. The first, in Figure 8, graphs predicted values of WAZ under 3 different scenarios: no program, program duration of 13 months (the average amongst program GPs) and program duration of under 24 months. The graph reveals that 13 months of the program improved WAZ by approximately half a standard deviation. Had the program been in place for 24 months, WAZ would have improved by a full standard deviation.24
Figure 8: Predicted WAZ at different months of exposure
These magnitudes suggest large gains from sustained interventions of one year or more. We offer three explanations. First, the program area is a ‘high-priority’ zone, characterized by excessively poor child health. In such regions, even marginal improvements in the provision of health services, particularly if they are targeted at pregnant and lactating women, and infants, are likely to reap significant benefits. Second, the program significantly improved population per worker ratios in AWCs. Our results from the previous section suggest that this increased the probability of receiving THRs and of a child’s enrollment in the AWC’s pre-school program. Both these outcomes are likely to have improved nutrition. 24 There are few comparable estimates of the effect of improvements in health institutions on child health. Much of the literature on early childhood development, cited in footnote 5, concentrates on measures of cognitive or non-cognitive ability.
-3.5
-3-2
.5-2
-1.5
-1-.5
0Pr
edic
ted
WAZ
zero exposure 13 months24 months
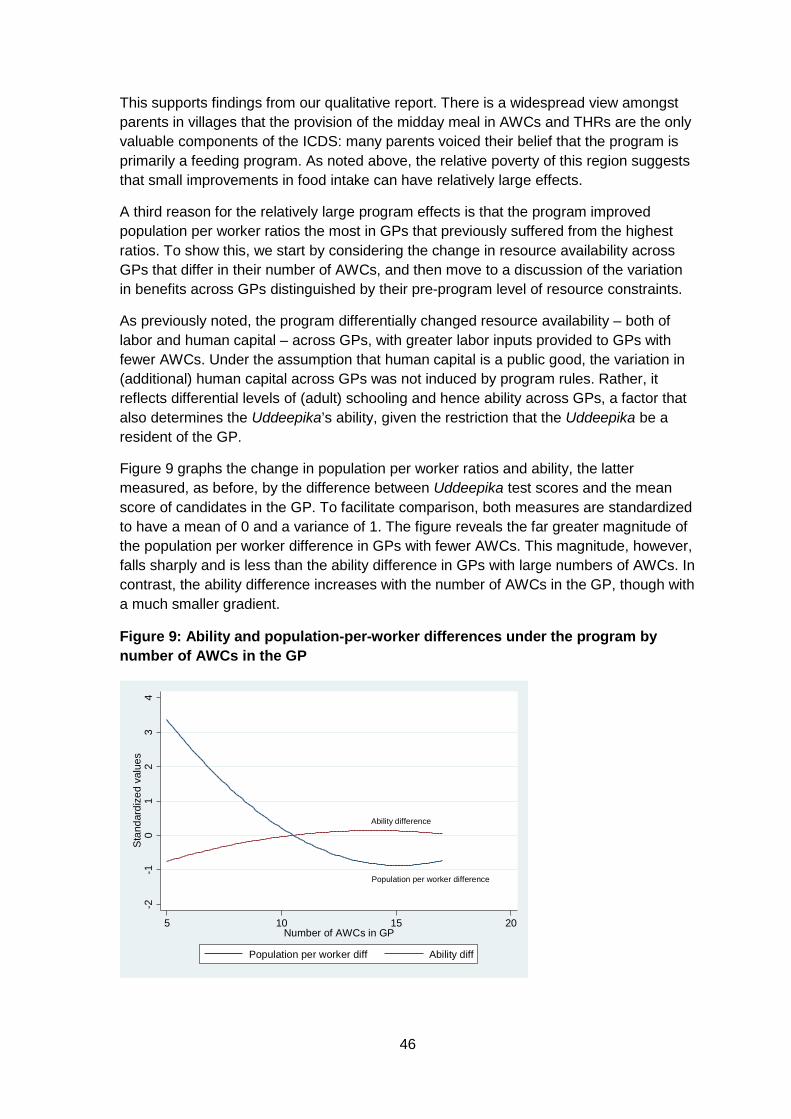
46
This supports findings from our qualitative report. There is a widespread view amongst parents in villages that the provision of the midday meal in AWCs and THRs are the only valuable components of the ICDS: many parents voiced their belief that the program is primarily a feeding program. As noted above, the relative poverty of this region suggests that small improvements in food intake can have relatively large effects.
A third reason for the relatively large program effects is that the program improved population per worker ratios the most in GPs that previously suffered from the highest ratios. To show this, we start by considering the change in resource availability across GPs that differ in their number of AWCs, and then move to a discussion of the variation in benefits across GPs distinguished by their pre-program level of resource constraints.
As previously noted, the program differentially changed resource availability – both of labor and human capital – across GPs, with greater labor inputs provided to GPs with fewer AWCs. Under the assumption that human capital is a public good, the variation in (additional) human capital across GPs was not induced by program rules. Rather, it reflects differential levels of (adult) schooling and hence ability across GPs, a factor that also determines the Uddeepika’s ability, given the restriction that the Uddeepika be a resident of the GP.
Figure 9 graphs the change in population per worker ratios and ability, the latter measured, as before, by the difference between Uddeepika test scores and the mean score of candidates in the GP. To facilitate comparison, both measures are standardized to have a mean of 0 and a variance of 1. The figure reveals the far greater magnitude of the population per worker difference in GPs with fewer AWCs. This magnitude, however, falls sharply and is less than the ability difference in GPs with large numbers of AWCs. In contrast, the ability difference increases with the number of AWCs in the GP, though with a much smaller gradient.
Figure 9: Ability and population-per-worker differences under the program by number of AWCs in the GP
Ability difference
Population per worker difference
-2-1
01
23
4St
anda
rdiz
ed v
alue
s
5 10 15 20Number of AWCs in GP
Population per worker diff Ability diff
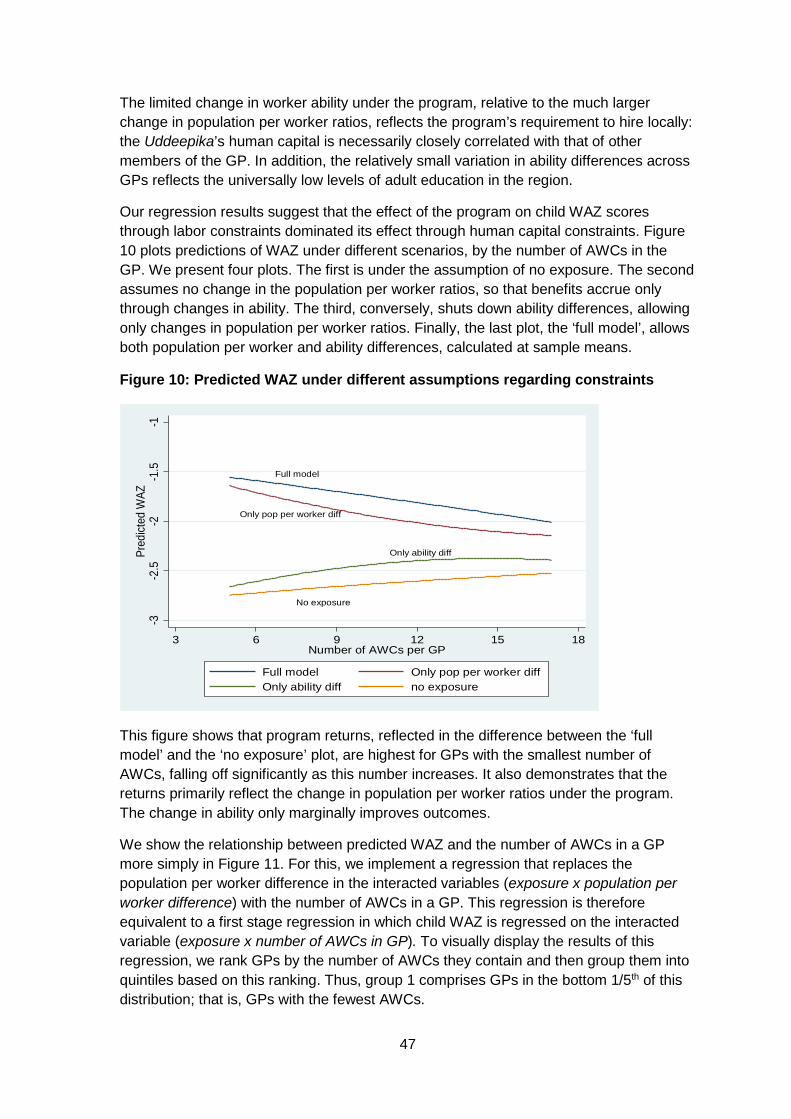
47
The limited change in worker ability under the program, relative to the much larger change in population per worker ratios, reflects the program’s requirement to hire locally: the Uddeepika’s human capital is necessarily closely correlated with that of other members of the GP. In addition, the relatively small variation in ability differences across GPs reflects the universally low levels of adult education in the region.
Our regression results suggest that the effect of the program on child WAZ scores through labor constraints dominated its effect through human capital constraints. Figure 10 plots predictions of WAZ under different scenarios, by the number of AWCs in the GP. We present four plots. The first is under the assumption of no exposure. The second assumes no change in the population per worker ratios, so that benefits accrue only through changes in ability. The third, conversely, shuts down ability differences, allowing only changes in population per worker ratios. Finally, the last plot, the ‘full model’, allows both population per worker and ability differences, calculated at sample means.
Figure 10: Predicted WAZ under different assumptions regarding constraints
This figure shows that program returns, reflected in the difference between the ‘full model’ and the ‘no exposure’ plot, are highest for GPs with the smallest number of AWCs, falling off significantly as this number increases. It also demonstrates that the returns primarily reflect the change in population per worker ratios under the program. The change in ability only marginally improves outcomes.
We show the relationship between predicted WAZ and the number of AWCs in a GP more simply in Figure 11. For this, we implement a regression that replaces the population per worker difference in the interacted variables (exposure x population per worker difference) with the number of AWCs in a GP. This regression is therefore equivalent to a first stage regression in which child WAZ is regressed on the interacted variable (exposure x number of AWCs in GP). To visually display the results of this regression, we rank GPs by the number of AWCs they contain and then group them into quintiles based on this ranking. Thus, group 1 comprises GPs in the bottom 1/5th of this distribution; that is, GPs with the fewest AWCs.
Full model
Only pop per worker diff
Only ability diff
No exposure
-3-2
.5-2
-1.5
-1Pr
edict
ed W
AZ
3 6 9 12 15 18Number of AWCs per GP
Full model Only pop per worker diffOnly ability diff no exposure
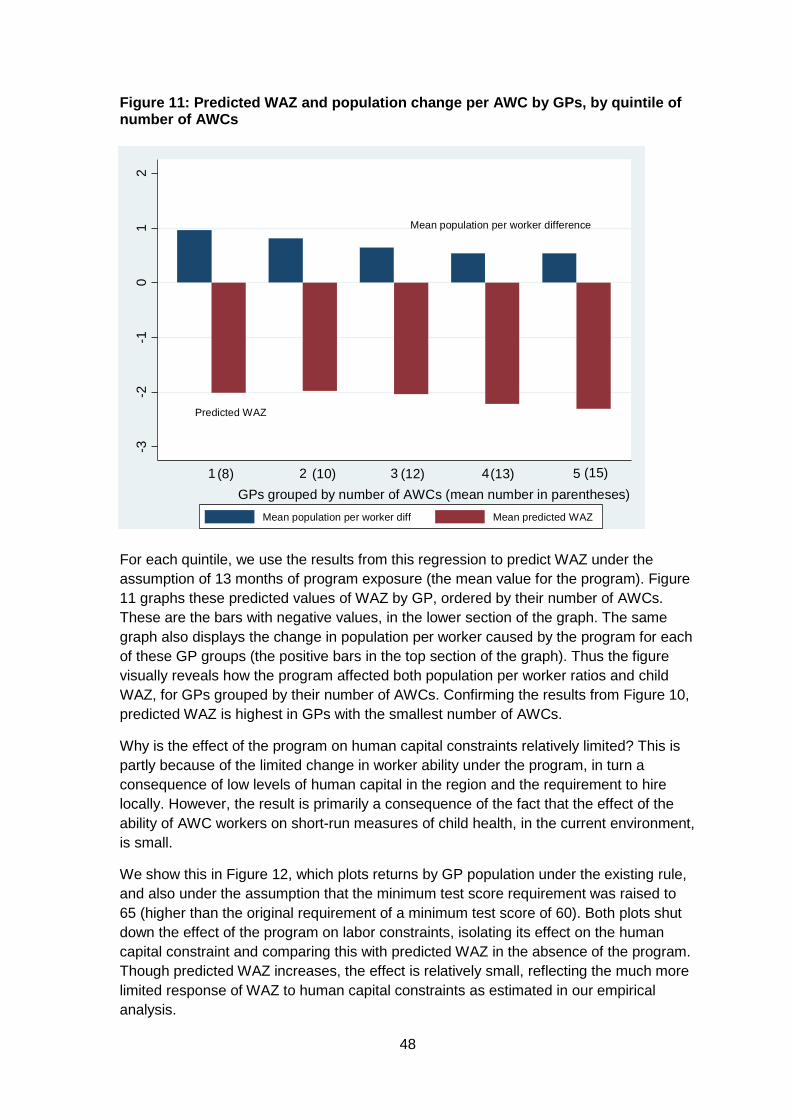
48
Figure 11: Predicted WAZ and population change per AWC by GPs, by quintile of number of AWCs
For each quintile, we use the results from this regression to predict WAZ under the assumption of 13 months of program exposure (the mean value for the program). Figure 11 graphs these predicted values of WAZ by GP, ordered by their number of AWCs. These are the bars with negative values, in the lower section of the graph. The same graph also displays the change in population per worker caused by the program for each of these GP groups (the positive bars in the top section of the graph). Thus the figure visually reveals how the program affected both population per worker ratios and child WAZ, for GPs grouped by their number of AWCs. Confirming the results from Figure 10, predicted WAZ is highest in GPs with the smallest number of AWCs.
Why is the effect of the program on human capital constraints relatively limited? This is partly because of the limited change in worker ability under the program, in turn a consequence of low levels of human capital in the region and the requirement to hire locally. However, the result is primarily a consequence of the fact that the effect of the ability of AWC workers on short-run measures of child health, in the current environment, is small.
We show this in Figure 12, which plots returns by GP population under the existing rule, and also under the assumption that the minimum test score requirement was raised to 65 (higher than the original requirement of a minimum test score of 60). Both plots shut down the effect of the program on labor constraints, isolating its effect on the human capital constraint and comparing this with predicted WAZ in the absence of the program. Though predicted WAZ increases, the effect is relatively small, reflecting the much more limited response of WAZ to human capital constraints as estimated in our empirical analysis.
Mean population per worker difference
Predicted WAZ
-3-2
-10
12
1 2 3 4 5
Mean population per worker diff Mean predicted WAZ
GPs grouped by number of AWCs (mean number in parentheses)(8) (10) (12) (13) (15)
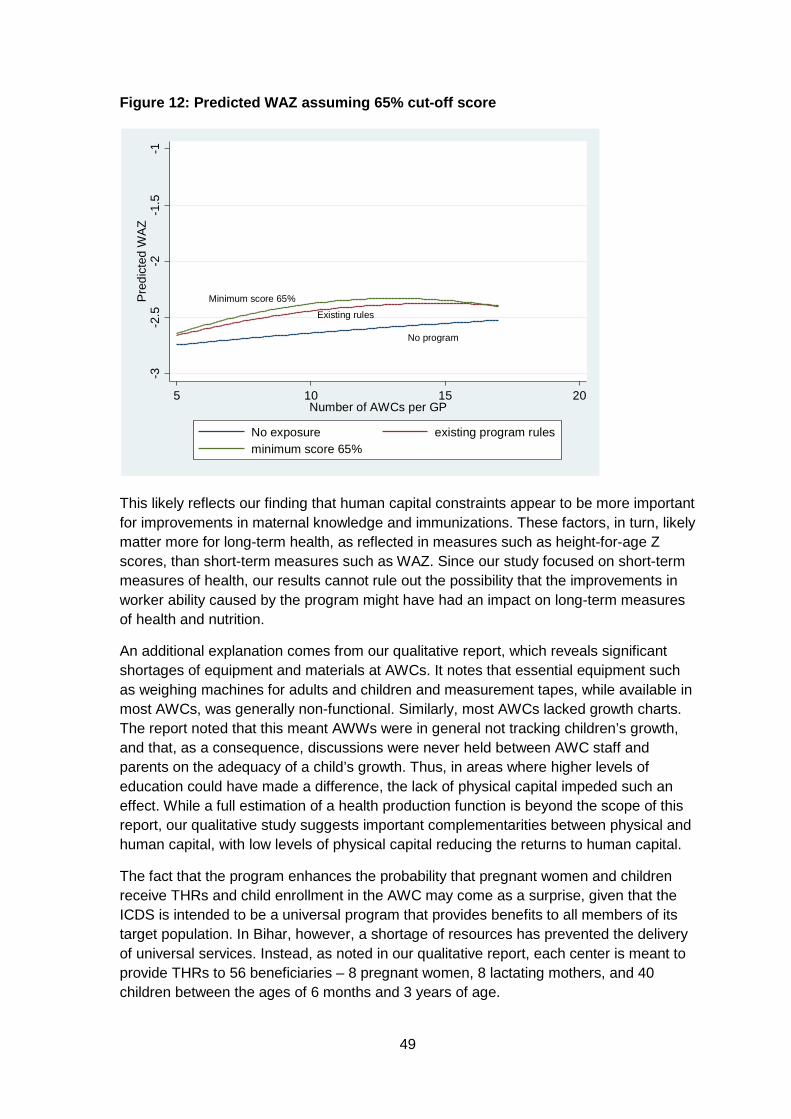
49
Figure 12: Predicted WAZ assuming 65% cut-off score
This likely reflects our finding that human capital constraints appear to be more important for improvements in maternal knowledge and immunizations. These factors, in turn, likely matter more for long-term health, as reflected in measures such as height-for-age Z scores, than short-term measures such as WAZ. Since our study focused on short-term measures of health, our results cannot rule out the possibility that the improvements in worker ability caused by the program might have had an impact on long-term measures of health and nutrition.
An additional explanation comes from our qualitative report, which reveals significant shortages of equipment and materials at AWCs. It notes that essential equipment such as weighing machines for adults and children and measurement tapes, while available in most AWCs, was generally non-functional. Similarly, most AWCs lacked growth charts. The report noted that this meant AWWs were in general not tracking children’s growth, and that, as a consequence, discussions were never held between AWC staff and parents on the adequacy of a child’s growth. Thus, in areas where higher levels of education could have made a difference, the lack of physical capital impeded such an effect. While a full estimation of a health production function is beyond the scope of this report, our qualitative study suggests important complementarities between physical and human capital, with low levels of physical capital reducing the returns to human capital.
The fact that the program enhances the probability that pregnant women and children receive THRs and child enrollment in the AWC may come as a surprise, given that the ICDS is intended to be a universal program that provides benefits to all members of its target population. In Bihar, however, a shortage of resources has prevented the delivery of universal services. Instead, as noted in our qualitative report, each center is meant to provide THRs to 56 beneficiaries – 8 pregnant women, 8 lactating mothers, and 40 children between the ages of 6 months and 3 years of age.
No program
Minimum score 65%Existing rules
-3-2
.5-2
-1.5
-1Pr
edic
ted
WAZ
5 10 15 20Number of AWCs per GP
No exposure existing program rulesminimum score 65%
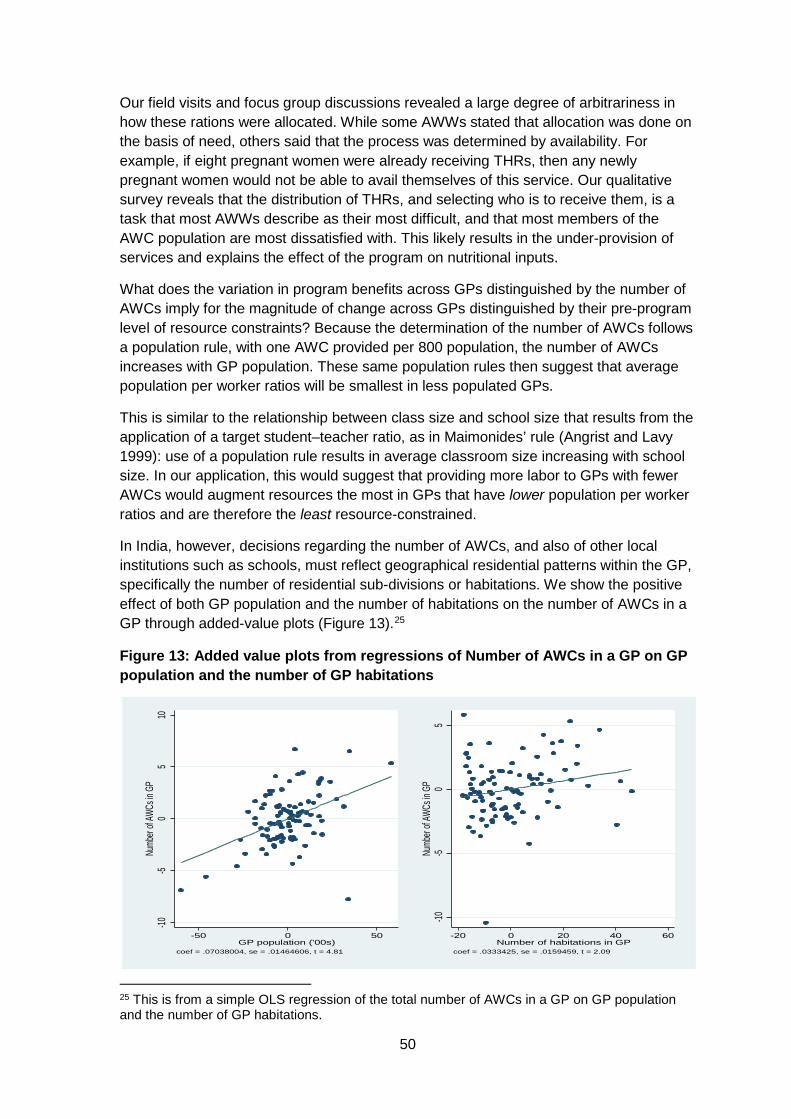
50
Our field visits and focus group discussions revealed a large degree of arbitrariness in how these rations were allocated. While some AWWs stated that allocation was done on the basis of need, others said that the process was determined by availability. For example, if eight pregnant women were already receiving THRs, then any newly pregnant women would not be able to avail themselves of this service. Our qualitative survey reveals that the distribution of THRs, and selecting who is to receive them, is a task that most AWWs describe as their most difficult, and that most members of the AWC population are most dissatisfied with. This likely results in the under-provision of services and explains the effect of the program on nutritional inputs.
What does the variation in program benefits across GPs distinguished by the number of AWCs imply for the magnitude of change across GPs distinguished by their pre-program level of resource constraints? Because the determination of the number of AWCs follows a population rule, with one AWC provided per 800 population, the number of AWCs increases with GP population. These same population rules then suggest that average population per worker ratios will be smallest in less populated GPs.
This is similar to the relationship between class size and school size that results from the application of a target student–teacher ratio, as in Maimonides’ rule (Angrist and Lavy 1999): use of a population rule results in average classroom size increasing with school size. In our application, this would suggest that providing more labor to GPs with fewer AWCs would augment resources the most in GPs that have lower population per worker ratios and are therefore the least resource-constrained.
In India, however, decisions regarding the number of AWCs, and also of other local institutions such as schools, must reflect geographical residential patterns within the GP, specifically the number of residential sub-divisions or habitations. We show the positive effect of both GP population and the number of habitations on the number of AWCs in a GP through added-value plots (Figure 13).25
Figure 13: Added value plots from regressions of Number of AWCs in a GP on GP population and the number of GP habitations
25 This is from a simple OLS regression of the total number of AWCs in a GP on GP population and the number of GP habitations.
-10-5
05
10Nu
mber
of AW
Cs in
GP
-50 0 50GP population ('00s)
coef = .07038004, se = .01464606, t = 4.81
-10-5
05
Numb
er of
AWCs
in G
P
-20 0 20 40 60Number of habitations in GP
coef = .0333425, se = .0159459, t = 2.09
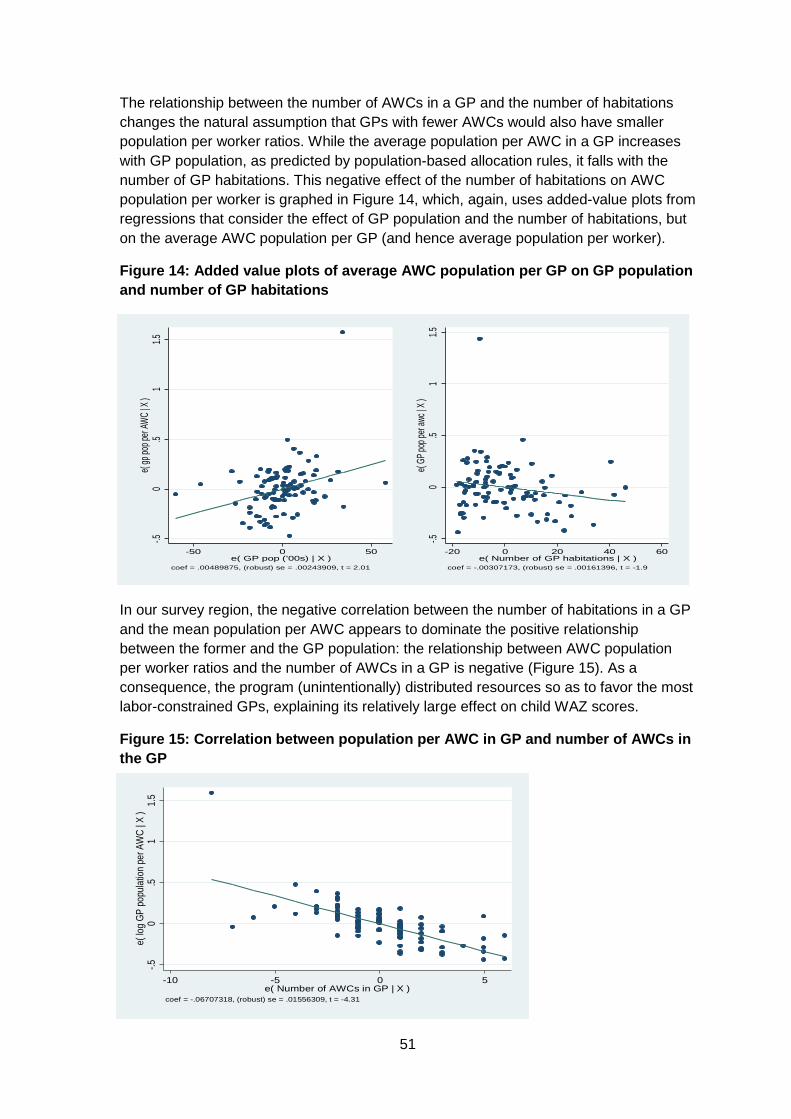
51
The relationship between the number of AWCs in a GP and the number of habitations changes the natural assumption that GPs with fewer AWCs would also have smaller population per worker ratios. While the average population per AWC in a GP increases with GP population, as predicted by population-based allocation rules, it falls with the number of GP habitations. This negative effect of the number of habitations on AWC population per worker is graphed in Figure 14, which, again, uses added-value plots from regressions that consider the effect of GP population and the number of habitations, but on the average AWC population per GP (and hence average population per worker).
Figure 14: Added value plots of average AWC population per GP on GP population and number of GP habitations
In our survey region, the negative correlation between the number of habitations in a GP and the mean population per AWC appears to dominate the positive relationship between the former and the GP population: the relationship between AWC population per worker ratios and the number of AWCs in a GP is negative (Figure 15). As a consequence, the program (unintentionally) distributed resources so as to favor the most labor-constrained GPs, explaining its relatively large effect on child WAZ scores.
Figure 15: Correlation between population per AWC in GP and number of AWCs in the GP
-.50
.51
1.5e(
gp po
p per
AWC |
X )
-50 0 50e( GP pop ('00s) | X )
coef = .00489875, (robust) se = .00243909, t = 2.01
-.50
.51
1.5e(
GP po
p per
awc |
X )
-20 0 20 40 60e( Number of GP habitations | X )
coef = -.00307173, (robust) se = .00161396, t = -1.9
-.50
.51
1.5e(
log G
P po
pulat
ion pe
r AW
C | X
)
-10 -5 0 5e( Number of AWCs in GP | X )
coef = -.06707318, (robust) se = .01556309, t = -4.31
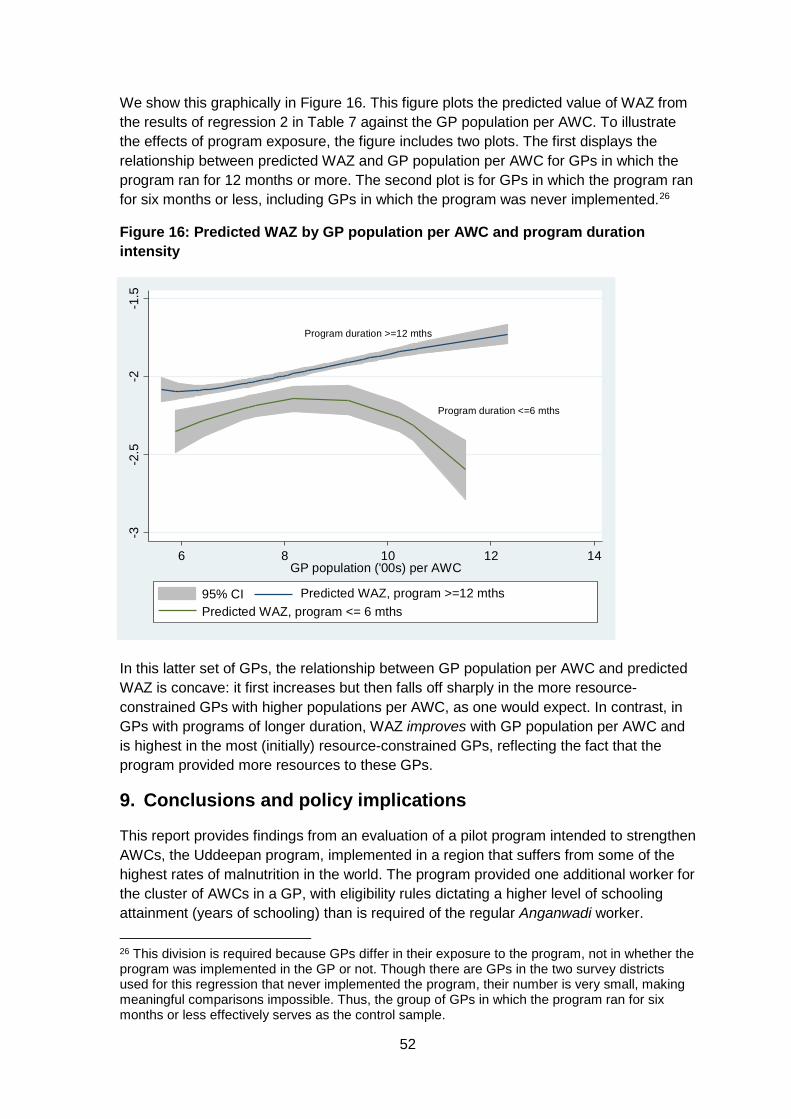
52
We show this graphically in Figure 16. This figure plots the predicted value of WAZ from the results of regression 2 in Table 7 against the GP population per AWC. To illustrate the effects of program exposure, the figure includes two plots. The first displays the relationship between predicted WAZ and GP population per AWC for GPs in which the program ran for 12 months or more. The second plot is for GPs in which the program ran for six months or less, including GPs in which the program was never implemented.26
Figure 16: Predicted WAZ by GP population per AWC and program duration intensity
In this latter set of GPs, the relationship between GP population per AWC and predicted WAZ is concave: it first increases but then falls off sharply in the more resource-constrained GPs with higher populations per AWC, as one would expect. In contrast, in GPs with programs of longer duration, WAZ improves with GP population per AWC and is highest in the most (initially) resource-constrained GPs, reflecting the fact that the program provided more resources to these GPs.
9. Conclusions and policy implications
This report provides findings from an evaluation of a pilot program intended to strengthen AWCs, the Uddeepan program, implemented in a region that suffers from some of the highest rates of malnutrition in the world. The program provided one additional worker for the cluster of AWCs in a GP, with eligibility rules dictating a higher level of schooling attainment (years of schooling) than is required of the regular Anganwadi worker. 26 This division is required because GPs differ in their exposure to the program, not in whether the program was implemented in the GP or not. Though there are GPs in the two survey districts used for this regression that never implemented the program, their number is very small, making meaningful comparisons impossible. Thus, the group of GPs in which the program ran for six months or less effectively serves as the control sample.
Program duration >=12 mths
Program duration <=6 mths
-3-2
.5-2
-1.5
6 8 10 12 14GP population ('00s) per AWC
95% CI Predicted WAZ, program >=12 mthsPredicted WAZ, program <= 6 mths
53
Exploiting variation in the months of exposure to the program, across GPs, over time, and across children in any given GP, we find that the program had a significant effect on child health, measured by WAZ scores.
An important contribution of our research is our decomposition of project returns into a change in population per worker ratios and a change in the ability level of AWC staff. This was possible because of data on test scores for all applicants from a GP for the Uddeepika position and because of program-induced variation in the number of workers provided to a GP due to differences in the number of AWCs in a GP. We find that, on average, the program had a greater effect on population per worker ratios than on worker ability. Correspondingly, we find that though program-induced reductions in both labor and ability constraints played a role in improving child WAZ scores, the reduction in labor constraints was more important in this regard.
Differences in the impact of labor and ability constraints on intermediate inputs may also help explain the greater effect of labor constraints on child WAZ scores. Our detailed analysis of intermediate health inputs – such as immunizations, maternal knowledge, enrollment in the pre-school program, and the provision of THRs – suggests that labor constraints primarily affect the day-to-day functioning of AWCs as reflected in child enrollment in their pre-school program and the effective provision of THRs, with much less of an effect on inputs such as maternal knowledge. Since THRs and enrollment in the pre-school program affect current food availability, labor constraints are likely to have a strong effect on measures of current health, such as WAZ scores.
Conversely, we find that human capital constraints have a larger effect on maternal knowledge and on outcomes that require coordination with other agencies, such as immunizations. These are inputs that are more likely to matter for long-run nutrition and health improvements. Thus our finding of a relatively limited role of worker ability on child WAZ may still be consistent with a larger effect on long-run measures of health. Unfortunately, it is beyond the scope of this study to evaluate long-term effects of the program.
Our analysis has several important implications for the design of successful MCH policies. First, it shows that a cluster approach can be effective; but it also notes that, unless properly designed, such an approach can cause (unintended) variation in program benefits across GPs. We showed that program benefits were larger in the smallest GPs, with relatively few AWCs. The large average effects of the program likely reflect the fact that these same GPs are those with initially higher resource constraints. However, they were also GPs with smaller populations: returns were smaller in large GPs that account for a major share of the region’s population.
Second, and more importantly, it highlights the difficulties faced by programs that seek to improve the human capital of health personnel but attempt to do so through decentralized programs that restrict appointments to local residents. This requirement importantly constrained the implementation of the program and reduced program duration, limiting its effectiveness. The subsequent weakening of the eligibility requirement of a test score of 60 per cent or higher in the program’s entrance examination, though required for the execution of the program, reduced its ability to address human capital constraints.
54
Our analysis suggests, however, that considerable improvements in children’s WAZ scores can be achieved by focusing on improving population per worker ratios. This does not mean that the ability of frontline health workers should be ignored. But the results of our study suggest that these improvements could perhaps target health personnel such as the ANM, who runs VHSNDs and is responsible for areas that do require a higher level of ability, such as maternal counseling and immunizations. The recruitment of ANMs is not restricted to the local population, and there is much greater scope for improving their ability levels.
Third, both our qualitative and our quantitative studies note the inability of this program, and the ICDS system more generally, to improve maternal knowledge through home visits. Perhaps reflecting the low ability of frontline workers, home visits appear primarily to be an opportunity to debate the allocation of THRs, reflecting the common view amongst households in the region that the primary objective of the ICDS system is to provide food rations. However, numerous studies from other countries suggest that home visits significantly improve the health, cognitive and non-cognitive abilities of young children. This evidence primarily comes from countries with greater levels of adult schooling. This suggests that programs of home visits in India, if they are to be successful, need to overcome the human capital constraint, perhaps through the use of technology.27
Fourth, our research quantifies the effect of implementation failures in the form of delays in the commencement of the program in some GPs, and the inability to implement it at all in other GPs. The significant effects of program exposure provide estimates of the magnitude of costs, in terms of child health, associated with these implementation failures.
Relatedly, while we use the implementation of the program to identify its effects, we note that features of the program’s design affected outcomes. Given the centrality of GPs to India, the program followed the widespread practice of utilizing the GP as the basis for operations. This meant, however, that variation across GPs in the number of AWCs and in levels of human capital resulted in corresponding variation in the benefits provided by the program. Such differences could have been minimized, even while retaining the GP as the unit of planning, by providing additional workers based on the number of AWCs in the GP, or by giving additional training to Uddeepikas with lower test scores.
These findings also suggest that formative research that provides information on the factors that constrain MCH outcomes, and that can be used to inform the design of policies, can be as valuable, if not more so, than impact evaluations.
27 For example, tablet-based interventions to enhance mothers’ understanding of the importance of growth monitoring and nutrition, currently being piloted, may have far greater returns.
55
Online appendixes
Note to the reader: These online appendixes are published as they have been received from the authors. These have not been copy-edited or formatted by 3ie.
Online Appendix A: Additional descriptive statistics from baseline survey
This appendix is only available online and can be accessed from http://www.3ieimpact.org/media/filer_public/2017/09/19/cpw02-appendix-a.pdf
Online Appendix B: Qualitative report
This appendix is only available online and can be accessed from http://www.3ieimpact.org/media/filer_public/2017/09/19/cpw02-appendix-b.pdf
Online Appendix C: Analysis of quality of monthly progress report data
This appendix is only available online and can be accessed from http://www.3ieimpact.org/media/filer_public/2017/09/19/cpw02-appendix-c.pdf
Online Appendix D: Monitoring plan
This appendix is only available online and can be accessed from http://www.3ieimpact.org/media/filer_public/2017/09/19/cpw02-appendix-d.pdf
Online Appendix E: Baseline report
This appendix is only available online and can be accessed from http://www.3ieimpact.org/media/filer_public/2017/09/19/cpw02-appendix-e.pdf
Online Appendix F: Household survey
This appendix is only available online and can be accessed from http://www.3ieimpact.org/media/filer_public/2017/09/19/cpw02-appendix-f.pdf
Online Appendix G: Uddeepan AWC questionnaire- end line 2016
This appendix is only available online and can be accessed from http://www.3ieimpact.org/media/filer_public/2017/09/19/cpw02-appendix-g.pdf
Online Appendix H: SAS program to create mother files
This appendix is only available online and can be accessed from http://www.3ieimpact.org/media/filer_public/2017/09/19/cpw02-appendix-h.pdf
Online Appendix I: Stata .do file for child regressions
This appendix is only available online and can be accessed from http://www.3ieimpact.org/media/filer_public/2017/09/19/cpw02-appendix-i.pdf
56
References
Aker, JC, 2010. Information from markets near and far: mobile phones and agricultural markets in Niger. American Economic Journal: Applied Economics, 2(3), pp.46–59.
Akin, JS and Hutchinson, P, 1999. Health-care facility choice and the phenomenon of bypassing. Health Policy and Planning, 14(2), pp.135–51.
Alderman, H, 2007. Improving nutrition through community growth promotion: longitudinal study of the Nutrition and Early Child Development Program in Uganda. World Development, 35(8), pp.1376–89.
Angrist, J and Lavy, V, 1999. Using Maimonides’ rule to estimate the effect of class size on scholastic achievement. Quarterly Journal of Economics, 114(2), pp.533–75.
Araujo, C, Lazarte, F, Rubio-Codina, M and Schady, N, 2016. Home visiting at scale: the evaluation of Cuna Mas. (Unpublished manuscript).
Armecin, G, Behrman, JR, Duazo, P, Ghuman, S, Gultiano, S, King, EM and Lee, N, 2006. Early childhood development programs through an integrated program: evidence from the Philippines. Policy Research Working Paper 3922. Washington, DC: World Bank.
Attanasio, O, Cattan, S, Fitzsimons, E, Meghir, C and Rubio-Codina, M. 2015. Estimating the production function for human capital: results from a randomized control trial in Colombia. NBER Working Paper 20965. Available at: <http://www.nber.org/papers/w20965> [Accessed 2 August 2017].
Banerjee, A, Deaton, A and Duflo, E, 2004. Health care delivery in rural Rajasthan. Economic and Political Weekly, 39(9), pp.944–49.
Basinga, P, Gertler, P, Binangwaho, A, Soucat, ALB, Sturdy, J and Vermeersch, CMJ, 2011. Effect of maternal and child health services in Rwanda of payment to primary health-care providers for performance: an impact evaluation. The Lancet, 377(9775), pp.1421–28.
Behrman, JR, Cheng, Y and Todd, PE, 2004. Evaluating preschool programs when length of exposure to the program varies: a nonparametric approach. Review of Economics and Statistics, 86(1), pp.108–32.
Berber, SL and Gertler, PJ, 2009. Health Workers, Quality of Care, and Child Health: Simulating the Relationships between Increases in Health Staffing and Child Length. Health Policy, 91(2):148-155.
Bihar Technical Assistance Support Team (B-TAST), 2015. Scorecard for SWASTH project.
Blundell, R and Costa Dias, M, 2000. Evaluation methods for non-experimental data. Fiscal Studies, 21(4), pp.427–468.
CARE, 2013. Integrated Family Health Initiative: catalyzing change for health communities.
57
Conti, G, Heckman, JJ and Pinto, R, 2016. The effects of two influential early childhood interventions on health and healthy behaviour. The Economic Journal, 126(596), pp.F28–65.
Cunha, F and Heckman, JJ, 2007. The technology of skill formation. American Economic Review, 97(2), pp.31–47.
Cunha, F, Heckman, JJ and Schennach, SM, 2010. Estimating the technology of cognitive and noncognitive skill formation. Econometrica, 78(3), pp.889–93.
Currie, J and Thomas, D, 1995. Does Head Start make a difference? American Economic Review, 85(3), pp.341–64.
Deaton, A. 2006. Global patterns of income and health: facts, interpretations and policies. NBER Working Paper 12735. Available at: <http://www.nber.org/papers/w12735> [Accessed 2 August 2017].
Filmer, D, Hammer, JS and Pritchett, LH, 2000. Weak links in the chain: a diagnosis of health policy in poor countries. The World Bank Research Observer, 15(2), pp.199–224.
Garcia, JL, Heckman, JJ, Ermini Leaf, D and Prados, MJ. 2016. The life cycle benefits of an influential childhood program. University of Chicago Working Paper.
Government of Bihar, Department of Social Welfare and UNICEF. 2007. Rapid assessment of ICDS project in Bihar: executive summary report.
Government of Bihar, Department of Social Welfare, State Project Management Unit and Directorate of ICDS. 2014. Annual Action Plan 2014–15.
Government of India, 2012. Ministry of Women and Child Development. ICDS Mission: The Broad Framework for Implementation.
Heckman, JJ and Robb, R Jr, 1985. Alternative methods for evaluating the impact of interventions. In: JJ Heckman and B Singer, eds. 1985. Longitudinal analysis of labor market data. New York: Cambridge University Press.
IDinsight, 2013. Quantitative Assessment: Beneficiary Nutritional Status and Performance of ICDS Supplementary Nutrition Programme in Bihar. IGS Working Paper #S-34114-INB-1.
Kochar, A, 2011. The distributional consequences of social banking: a micro-empirical analysis of the Indian experience. Economic Development and Cultural Change, 59(2), pp.251–80.
Lim, SS, Dandona, L, Hoisington, JA, James, SL, Hogan, MC and Gakidou, E, 2010. India’s Janani Suraksha Yojana, a conditional cash transfer programme to increase births in health facilities: an impact evaluation. The Lancet, 375(9730), pp.2009–23.
Oster, E, 2009. Does increased access increase equality? Gender and child health investments in India. Journal of Development Economics, 89(1), pp.62–76.

58
Pakistan Institute for Environment-Development Action (PIEDAR) and Project Management Team. 1994. The state of the public sector primary health care services, district Sheikhupura, Punjab, Pakistan. New York: Bamako Initiative Management Unit, United Nations Children’s Fund.
Pitt, M, Rosenzweig, M and Gibbons, D, 1993. The determinants and consequences of the placement of government programs in Indonesia. The World Bank Economic Review, 7(3), pp.319–48.
Preston, SH, 1980. Causes and consequences of mortality in less developed countries during the twentieth century. In: R Easterlin, ed. 1980. Population and economic change in developing countries. Chicago: University of Chicago Press for the National Bureau of Economic Research.
Rosenzweig, M and Wolpin, K, 1982. Government interventions and household behavior in a developing country: anticipating the unanticipated consequences of social programs. Journal of Development Economics, 10(2), pp.209–25.
Strauss, J and Thomas, D, 1995. Human resources: household decisions and markets. In: J Behrman and TN Srinivasan, eds. 1995. Handbook of development economics. Volume 3. Amsterdam: North-Holland.
World Bank, 1998. Reducing poverty in India: options for more effective public services. Washington, DC: World Bank
World Bank, 2010. What can we learn from nutrition impact evaluations? Lessons from a review of interventions to reduce child malnutrition in developing countries. Washington, DC: World Bank.
59
Other publications in the 3ie Impact Evaluation Report Series
The following reports are available from http://www.3ieimpact.org/en/publications/3ie- impact-evaluation-reports/3ie-impact-evaluations/
Evaluating oral HIV self-testing to increase HIV testing uptake among truck drivers in Kenya, 3ie Impact Evaluation Report 64. Kelvin, EA, Mwai, E, Romo, ML, George, G, Govender, K, Mantell, JE, Strauss, M, Nyaga, EN and Odhiambo, JO, 2017.
Integration of EPI and paediatric HIV services for improved ART initiation in Zimbabwe, 3ie Impact Evaluation Report 63. Prescott, M, Boeke, C, Gotora, T, Mafaune, HW, Motsi, W, Graves, J, Mangwiro, A and McCarthy, E, 2017.
Increasing male partner HIV testing using self-test kits in Kenya, 3ie Impact Evaluation Report 62. Gichangi, A, Korte, JE, Wambua, J, Vrana, C and Stevens, D, 2017.
Evaluating the impact of community health worker integration into prevention of mother-to-child transmission of HIV services in Tanzania, 3ie Impact Evaluation Report 61. Nance, N, McCoy, S, Ngilangwa, D, Masanja, J, Njau, P and Noronha, R, 2017.
Using HIV self-testing to promote male partner and couples testing in Kenya, 3ie Impact Evaluation Report 60. Thirumurthy, H, Omanga, E, Obonyo, B, Masters, S and Agot, K, 2017.
Increasing male partner HIV self-testing at antenatal care clinics in Kenya, 3ie Impact Evaluation Report 59. Gichangi, A, Korte, JE, Wambua, J, Vrana, C and Stevens, D, 2017.
Impact of free availability of public childcare on labour supply and child development in Brazil, 3ie Impact Evaluation Report 58. Attanasio, O, Paes de Barros, R, Carneiro, P, Evans, D, Lima, L, Olinto, P and Schady, N, 2017.
Estimating the effects of a low-cost early stimulation and parenting education programme in Mexico, 3ie Impact Evaluation Report 57. Cardenas, S, Evans, D and Holland, P, 2017.
The Better Obstetrics in Rural Nigeria study: an impact evaluation of the Nigerian Midwives Service Scheme, 3ie Impact Evaluation Report 56. Okeke, E, Glick, P, Abubakar, IS, Chari, AV, Pitchforth, E, Exley, J, Bashir, U, Setodji, C, Gu, K and Onwujekwe, O, 2017.
The Productive Safety Net Programme in Ethiopia: impacts on children’s schooling, labour and nutritional status, 3ie Impact Evaluation Report 55. Berhane, G, Hoddinott, J, Kumar, N and Margolies, A, 2016.
The impact of youth skills training on the financial behaviour, employability and educational choice in Morocco, 3ie Impact Evaluation Report 54. Bausch, J, Dyer, P, Gardiner, D, Kluve, J and Mizrokhi, E, 2016.
60
Using advertisements to create demand for voluntary medical male circumcision in South Africa, 3ie Impact Evaluation Report 53. Frade, S, Friedman, W, Rech, D and Wilson, N, 2016.
The use of peer referral incentives to increase demand for voluntary medical male circumcision in Zambia, 3ie Impact Evaluation Report 52. Zanolini, A, Bolton, C, Lyabola, LL, Phiri, G, Samona, A, Kaonga, A and Harsha Thirumurthy, H, 2016.
Using smartphone raffles to increase demand for voluntary medical male circumcision in Tanzania, 3ie Impact Evaluation Report 51. Mahler, H and Bazant, E, 2016.
Voluntary medical male circumcision uptake through soccer in Zimbabwe, 3ie Impact Evaluation Report 50. DeCelles, J, Kaufman, Z, Bhauti, K, Hershow, R, Weiss, H, Chaibva, C, Moyo, N, Braunschweig, E, Mantula, F, Hatzold, K and Ross, D, 2016.
Measuring the impact of SMS-based interventions on uptake of voluntary medical male circumcision in Zambia, 3ie Impact Evaluation Report 49. Leiby, K, Connor, A, Tsague, L, Sapele, C, Koanga, A, Kakaire, J and Wang, P, 2016.
Assessing the impact of delivering messages through intimate partners to create demand for voluntary medical male circumcision in Uganda, 3ie Impact Evaluation Report 48. Semeere, AS, Bbaale, DS, Castelnuovo, B, Kiragga, A, Kigozi, J, Muganzi, A, Kambugu, A and Coutinho, AG, 2016.
Optimising the use of economic interventions to increase demand for voluntary medical male circumcision in Kenya, 3ie Impact Evaluation Report 47. Thirumurthy, H, Omanga, E, Rao, SO, Murray, K, Masters, S and Agot, K, 2016.
The impact of earned and windfall cash transfers on livelihoods and conservation in Sierra Leone, 3ie Impact Evaluation Report 46. Bulte, E, Conteh, B, Kontoleon, A, List, J, Mokuwa, E, Richards, P, Turley, T and Voors, M, 2016.
Property tax experiment in Pakistan: Incentivising tax collection and improving performance, 3ie Impact Evaluation Report 45. Khan, A, Khwaja, A and Olken, B, 2016.
Impact of mobile message reminders on tuberculosis treatment outcomes in Pakistan, 3ie Impact Evaluation Report 44. Mohammed, S, Glennerster, R and Khan, A, 2016.
Making networks work for policy: Evidence from agricultural technology adoption in Malawi, 3ie Impact Evaluation Report 43. Beaman, L, BenYishay, A, Fatch, P, Magruder, J and Mobarak, AM, 2016.
Estimating the impact and cost-effectiveness of expanding access to secondary education in Ghana, 3ie Impact Evaluation Report 42. Dupas, P, Duflo, E and Kremer, M, 2016.
Evaluating the effectiveness of computers as tutors in China, 3ie Impact Evaluation Report 41. Mo, D, Bai, Y, Boswell, M and Rozelle, S, 2016.
Micro entrepreneurship support programme in Chile, 3ie Impact Evaluation Report 40. Martínez, CA, Puentes, EE and Ruiz-Tagle, JV, 2016.

61
Thirty-five years later: evaluating the impacts of a child health and family planning programme in Bangladesh, 3ie Impact Evaluation Report 39. Barham, T, Kuhn, R, Menken, J and Razzaque, A, 2016.
Effectiveness of a rural sanitation programme on diarrhoea, soil-transmitted helminth infection and malnutrition in India, 3ie Impact Evaluation Report 38. Clasen, T, Boisson, S, Routray, P, Torondel, B, Bell, M, Cumming, O, Ensink, J, Freeman, M and Jenkins, M, 2016.
Evaluating the impact of vocational education vouchers on out-of-school youth in Kenya, 3ie Impact Evaluation Report 37. Hicks, JH, Kremer, M, Mbiti, I and Miguel, E, 2016.
Removing barriers to higher education in Chile: evaluation of peer effects and scholarships for test preparation, 3ie Impact Evaluation Report 36. Banerjee, A, Duflo E and Gallego, F, 2016.
Sustainability of impact: dimensions of decline and persistence in adopting a biofortified crop in Uganda, 3ie Impact Evaluation Report 35. McNiven, S, Gilligan, DO and Hotz, C 2016.
A triple win? The impact of Tanzania’s Joint Forest Management programme on livelihoods, governance and forests, 3ie Impact Evaluation Report 34. Persha, L and Meshack, C, 2016.
The effect of conditional transfers on intimate partner violence: evidence from Northern Ecuador, 3ie Impact Evaluation Report 33. Hidrobo, M, Peterman, A and Heise, L, 2016.
The effect of transfers and preschool on children’s cognitive development in Uganda, 3ie Impact Evaluation Report 32. Gillian, DO and Roy, S, 2016.
Can egovernance reduce capture of public programmes? Experimental evidence from India’s employment guarantee, 3ie Impact Evaluation Report 31. Banerjee, A, Duflo, E, Imbert, C, Mathew, S and Pande, R, 2015.
Improving maternal and child health in India: evaluating demand and supply strategies, 3ie Impact Evaluation Report 30. Mohanan, M, Miller, G, Forgia, GL, Shekhar, S and Singh, K, 2016.
Smallholder access to weather securities in India: demand and impact on production decisions, 3ie Impact Evaluation Report 28. Ceballos, F, Manuel, I, Robles, M and Butler, A, 2015.
What happens once the intervention ends? The medium-term impacts of a cash transfer programme in Malawi, 3ie Impact Evaluation Report 27. Baird, S, Chirwa, E, McIntosh, C and Özler, B, 2015.
Validation of hearing screening procedures in Ecuadorian schools, 3ie Impact Evaluation Report 26. Muñoz, K, White, K, Callow-Heusser, C and Ortiz, E, 2015.
Assessing the impact of farmer field schools on fertilizer use in China, 3ie Impact Evaluation Report 25. Burger, N, Fu, M, Gu, K, Jia, X, Kumar, KB and Mingliang, G, 2015.

62
The SASA! study: a cluster randomised trial to assess the impact of a violence and HIV prevention programme in Kampala, Uganda, 3ie Impact Evaluation Report 24. Watts, C, Devries, K, Kiss, L, Abramsky, T, Kyegombe, N and Michau, L, 2014.
Enhancing food production and food security through improved inputs: an evaluation of Tanzania’s National Agricultural Input Voucher Scheme with a focus on gender impacts, 3ie Impact Evaluation Report 23. Gine, X, Patel, S, Cuellar-Martinez, C, McCoy, S and Lauren, R, 2015.
A wide angle view of learning: evaluation of the CCE and LEP programmes in Haryana, 3ie Impact Evaluation Report 22. Duflo, E, Berry, J, Mukerji, S and Shotland, M, 2015.
Shelter from the storm: upgrading housing infrastructure in Latin American slums, 3ie Impact Evaluation Report 21. Galiani, S, Gertler, P, Cooper, R, Martinez, S, Ross, A and Undurraga, R, 2015.
Environmental and socioeconomic impacts of Mexico’s payments for ecosystem services programme, 3ie Impact Evaluation Report 20. Alix-Garcia, J, Aronson, G, Radeloff, V, Ramirez-Reyes, C, Shapiro, E, Sims, K and Yañez-Pagans, P, 2015.
A randomised evaluation of the effects of an agricultural insurance programme on rural households’ behaviour: evidence from China, 3ie Impact Evaluation Report 19. Cai, J, de Janvry, A and Sadoulet, E, 2014.
Impact of malaria control and enhanced literacy instruction on educational outcomes among school children in Kenya: a multi-sectoral, prospective, randomised evaluation, 3ie Impact Evaluation Report 18. Brooker, S and Halliday, K, 2015.
Assessing long-term impacts of conditional cash transfers on children and young adults in rural Nicaragua, 3ie Impact Evaluation Report 17. Barham, T, Macours, K, Maluccio, JA, Regalia, F, Aguilera, V and Moncada, ME, 2014.
The impact of mother literacy and participation programmes on child learning: evidence from a randomised evaluation in India, 3ie Impact Evaluation Report 16. Banerji, R, Berry, J and Shortland, M, 2014.
A youth wage subsidy experiment for South Africa, 3ie Impact Evaluation Report 15. Levinsohn, J, Rankin, N, Roberts, G and Schöer, V, 2014.
Providing collateral and improving product market access for smallholder farmers: a randomised evaluation of inventory credit in Sierra Leone, 3ie Impact Evaluation Report 14. Casaburi, L, Glennerster, R, Suri, T and Kamara, S, 2014.
Scaling up male circumcision service provision: results from a randomised evaluation in Malawi, 3ie Impact Evaluation Report 13. Thornton, R, Chinkhumba, J, Godlonton, S and Pierotti, R, 2014.
Targeting the poor: evidence from a field experiment in Indonesia, 3ie Impact Evaluation Report 12. Atlas, V, Banerjee, A, Hanna, R, Olken, B, Wai-poi, M and Purnamasari, R, 2014.
63
An impact evaluation of information disclosure on elected representatives’ performance: evidence from rural and urban India, 3ie Impact Evaluation Report 11. Banerjee, A, Duflo, E, Imbert, C, Pande, R, Walton, M and Mahapatra, B, 2014.
Truth-telling by third-party audits and the response of polluting firms: Experimental evidence from India, 3ie Impact Evaluation Report 10. Duflo, E, Greenstone, M, Pande, R and Ryan, N, 2013.
No margin, no mission? Evaluating the role of incentives in the distribution of public goods in Zambia, 3ie Impact Evaluation Report 9. Ashraf, N, Bandiera, O and Jack, K, 2013.
Paying for performance in China’s battle against anaemia, 3ie Impact Evaluation Report 8. Zhang, L, Rozelle, S and Shi, Y, 2013.
Social and economic impacts of Tuungane: final report on the effects of a community-driven reconstruction programme in the Democratic Republic of Congo, 3ie Impact Evaluation Report 7. Humphreys, M, Sanchez de la Sierra, R and van der Windt, P, 2013.
The impact of daycare on maternal labour supply and child development in Mexico, 3ie Impact Evaluation Report 6. Angeles, G, Gadsden, P, Galiani, S, Gertler, P, Herrera, A, Kariger, P and Seira, E, 2014.
Impact evaluation of the non-contributory social pension programme 70 y más in Mexico, 3ie Impact Evaluation Report 5. Rodríguez, A, Espinoza, B, Tamayo, K, Pereda, P, Góngora, V, Tagliaferro, G and Solís, M, 2014.
Does marginal cost pricing of electricity affect groundwater pumping behaviour of farmers? Evidence from India, 3ie Impact Evaluation Report 4. Meenakshi, JV, Banerji, A, Mukherji, A and Gupta, A, 2013.
The GoBifo project evaluation report: Assessing the impacts of community-driven development in Sierra Leone, 3ie Impact Evaluation Report 3. Casey, K, Glennerster, R and Miguel, E, 2013.
A rapid assessment randomised-controlled trial of improved cookstoves in rural Ghana, 3ie Impact Evaluation Report 2. Burwen, J and Levine, DI, 2012.
The promise of preschool in Africa: A randomised impact evaluation of early childhood development in rural Mozambique, 3ie Impact Evaluation Report 1. Martinez, S, Naudeau, S and Pereira, V, 2012.
Impact Evaluation Series
International Initiative for Impact Evaluation 202-203, Rectangle One D-4, Saket District Centre New Delhi – 110017 India
[email protected] Tel: +91 11 4989 4444
In delivering health and other social services through decentralised programmes, governments of developing economies frequently face severe resource constraints reflected in high population-per-worker ratios and low ability levels of frontline staff. In this context, policies that provide one additional worker of higher ability to a cluster of local institutions may provide the means of reducing resource constraints at lower cost. This study evaluates if the Uddeepan programme in Bihar relaxes labour constraints and improves workers’ abilities, and leads to better maternal knowledge, immunisation rates, availability of take-home rations, enrolment in pre-school centres, and weight-for-age Z scores, a key outcome. The impact evaluation found significant effects of sustained exposure to the programme on weight, a short-run measure of child health.
www.3ieimpact.org