Embed Size (px)
Citation preview

1 | P a g e
Prepared by
Consiglieri Private Limited
House#360 (first Floor), Lane#5, Baridhara DOHS Dhaka, Bangladesh
Website: www.consiglieri.com.bd Email: [email protected]
Phone: +88028418708
Prepared for
Solidaridad Network,
Dhaka Bangladesh
Report on
An in-depth study on Farmer’s Behavior Change,
Drivers and Barriers as well as ‘Spontaneous’
Impact on Family and Neighbors of SaFaL
December, 2016
ANNEX B- Study on Farmer’s Behavior Change

2 | P a g e
ACKNOWLEDGEMENT
Firstly, we are thankful to Solidaridad Network for commissioning us this study. I would like to
convey thanks to my research team - Aslam Parvez, Sheikh Farid Uddin Ahmed, Syed Mizanur
Rahman, Shahnaz Shahidullah and Sayeda Fatema Tuz Zohora for their outstanding efforts.
Without their hard work, it would not have been possible to complete this assignment.
We would like to thank the SaFaL production group members who provided their valuable time
and information for the study. We also would like to thank the field team of SaFaL, specially the
field staff of CJF and Uttaran for their support in data collection.
We are grateful to Selim Reza Hasan, Country Manager, Subrata Kumar Chakrabarty, Senior
Programme Manager, Indu Bhusan Roy, SaFaL Programme Coordinator, Sattyanarayan Roy, and
SaFaL Assistant Programme Coordinator of Solidaridad Network for their technical guidance and
cordial assistance throughout this assignment. We also thank Abir Ahmed, M&E Specialist and
Maksudur Rahaman, Social and Institutional Development Specialist of Solidaridad Network for
their valuable feedback on the tools and draft report.
Along the way, we got assistance from many people, whose names we cannot mention but to
thank. We are grateful for their help.
It has been a pleasure and a privilege to work with Solidaridad Network, Bangladesh.
Abdullah Al Shakib Study Team Leader & Director, Research Consiglieri Private Limited December, 2016

3 | P a g e
ACRONYM/ GLOSSARY
AI Artificial Insemination
BDT Bangladeshi Taka
CPL Consiglieri Private Limited
CLSP Community Livestock Service Provider
CNV Community Nutrition Volunteer
DAE Department of Agriculture Extension
DAP Di Ammonium Phosphate
DCP Di-calcium Phosphate
FGD Focused Group Discussion
HYV High Yield Variety
IDI In-Depth Interview
IGA Income Generating Activities
LF Lead Farmer
LSP Local Service Providers
MOP Muriate of Potash
NGO Non-Government Organization
OHOF One House One Farm
PG Producer Group
PH Power of Hydrogen
SaFal Sustainable Agriculture, Food Security and Linkages
TSP Triple Super Phosphate

4 | P a g e
Table of Contents
ACKNOWLEDGEMENT ............................................................................................................ 2
ACRONYM/ GLOSSARY .......................................................................................................... 3
LIST OF TABLES ...................................................................................................................... 6
LIST OF FIGURES .................................................................................................................... 7
Executive Summery ............................................................................................................. 10
Chapter One: Background and Introduction ......................................................................... 14 1.1 Background and Objective of this Study .................................................................................. 14 1.2 Geographic Scope & Subsectors .............................................................................................. 15 1.3 Sampling Design ..................................................................................................................... 16 1.4 Data Collection Method .......................................................................................................... 18 1.5 Study Limitations ................................................................................................................... 19
Chapter Two: Effectiveness, Adoption, and Adaptation of new Technologies and Services ... 20 2.1 Technology Adoption and Adaptation in Horticulture Subsector .............................................. 20
2.1.2 Use of Composts ....................................................................................................................... 21 2.1.3 Use of Micronutrients ............................................................................................................... 22 2.1.4 Soil testing ................................................................................................................................. 23 2.1.5 Use of lime ................................................................................................................................. 24 2.1.6 Usage of Improved Seed varieties ............................................................................................. 25 2.1.7 Irrigation/ Water management ................................................................................................. 26 2.1.8 Pest management ..................................................................................................................... 26 2.1.9 Post-harvest Management ........................................................................................................ 27 2.1.10 Production cost ....................................................................................................................... 30 2.1.11 Household Involvement in Agricultural production ................................................................ 31 2.1.12 Other Findings ......................................................................................................................... 31
2.2 Technology Adoption and Adaptation in Aquaculture Subsector .............................................. 32 2.2.1 Behavioral Changes in Pond / “Gher” preparation ................................................................. 32 2.2.2 Behavioral Changes in Fish Seed Purchase/ Sourcing ............................................................... 33 2.2.3 Behavioral Changes in Improved Feeding Practice ................................................................... 35 2.2.4 Behavioral Change in Using Other Technologies ...................................................................... 36 2.2.5 Work distribution in an Aquaculture producing household ..................................................... 39 2.2.6 Production Cost Decrease ......................................................................................................... 40
2.3 Technology Adoption and Adaptation in Dairy Subsector ........................................................ 41 2.3.1 Number and Type of Cows ........................................................................................................ 41 2.3.2 Behavioral changes in adopting cultivation of improved grass ................................................ 41 2.3.3 Behavioral changes in perception of homemade feed ............................................................. 42 2.3.4 Behavioral Changes in Improved Shed Management ............................................................... 43 2.3.5 Behavioral changes in disease management ............................................................................ 43 2.3.6 Behavioral changes in taking Artificial Insemination (AI) service ............................................. 45 2.3.7 Hygienic Milking Process ........................................................................................................... 46

5 | P a g e
2.3.8 Changes in Milk Production Amount ........................................................................................ 46 2.3.9 Work distribution in Dairy Farming Households ....................................................................... 47 2.3.10 Other Findings ......................................................................................................................... 47
2.4 Technology Adoption vs Adaptation Measures ........................................................................ 48
Chapter Three: Household level social and behavioral practices related to food security ...... 50 3.1 Consumption Behavior of Women .......................................................................................... 50 3.2 Consumption Behavior of Children .......................................................................................... 52 3.3 Change in Hygiene Practice ..................................................................................................... 52 3.4 Impact of SaFal’s Health and Nutrition program with Children ................................................. 54
Chapter Four: Status of women in agricultural production and their empowerment in
household and society level ................................................................................................. 55 4.1 Qualitative Research (FGD and IDI) Findings ............................................................................ 55 4.2 Survey Findings ...................................................................................................................... 56
4.2.1 Women Involvement and Decision Making Capabilities in Horticulture .................................. 56 4.2.2 Women Involvement and Decision Making Capabilities in Aquaculture .................................. 58 4.2.3 Women Involvement and Decision Making Capabilities in Dairy ............................................. 58
Chapter Five: Sales, Finance and Saving Situation ................................................................ 60 5.1 Sales Situation ........................................................................................................................ 60
5.1.1 Sales Situation in Horticulture Subsector .................................................................................. 60 5.1.2 Sales Situation in Aquaculture Subsector ................................................................................. 61 5.1.3 Sales Situation in Dairy Subsector ............................................................................................. 63
.................................................................................................................................................... 64 5.2 Finance and Savings Situation ................................................................................................. 64
Chapter Six: ......................................................................................................................... 68
Local Service Producers: Agents for Community Level Behavioral Change ............................ 68 6.1 Lead farmer ............................................................................................................................ 69 6.2 CLSP (Community Livestock Service Provider) .......................................................................... 71 6.3 Vegetable Collector or Seller ................................................................................................... 72 6.4 Community Nutrition Volunteer (CNV) .................................................................................... 73
Chapter Seven: ‘Spontaneous’ Impact on ............................................................................. 76
Family and Neighbors of SaFaL ............................................................................................ 76 7.1 Observational learning and its theory ..................................................................................... 76 7.2 Service Providers: Major Drivers behind Community Level Behavior Change ............................ 77 7.3 Survey Findings ...................................................................................................................... 78
7.3.1 Impact on Neighboring Horticulture Producers and their Households .................................... 78 7.3.2 Impact on Neighboring Aquaculture Producers and their Households .................................... 79 7.3.3 Impact on Neighboring Dairy Producers and their Households................................................ 80
Chapter 8: Conclusion and Recommendations ..................................................................... 82

6 | P a g e
LIST OF TABLES
Table 2.1.9.1: Percentage of farmers reporting practicing different post-harvest activities
Table 2.1.9.2: Benefits of harvesting at maturing age
Table 3.2.1: Percentage of Households whose children have eaten milk/ fish/ meat/ chicken in
last 24 hours
Table 5.2.4.1: Percentage of Farmers whose assets increased
Table 6.1: Types of entrepreneurs and skill labor developed by SaFal
Table 6.1.1: Type of Service received by producers from Lead Farmers
Table 6.1.2: Benefits of LF services to farmers
7 | P a g e
LIST OF FIGURES
Figure 2.1.1.1: Farmers reporting different chemical fertilizers
Figure 2.1.1.2: Benefits of Using Different Chemical Fertilizers
Figure 2.1.2.1: Vermicompost production
Figure 2.1.2.2: Benefits of using different bio-fertilizers
Figure 2.1.3.1: percentage of farmers using different types of micronutrients
Figure 2.1.3.2: Benefits of Using Different Micronutrients
Figure 2.1.4.1: Percentage of respondents tested their soil in last season
Figure 2.1.4.2: Reasons of not testing soil
Figure 2.1.6.1: Percentage of farmers using variety of seeds
Figure 2.1.6.2: Percentage of farmers reporting different benefits of using different types of seeds
Figure 2.1.8.1: Percentage of farmers using different types of pest management techniques
Figure 2.1.8.2: Percentage of Farmers Reporting Various Benefits for using traps
Figure 2.1.9.1: Benefits of washing, sorting, and packaging
Figure 2.1.9.2: Use of Crates
Figure 2.1.9.3: Benefits of using crates
Figure 2.1.10.1: Percentage of Farmers Reporting Reduced Production Costs
Figure 2.1.10.2: Household Involvement in Agricultural production
Figure 2.2.1 Percentage of people prepare pond for fish culture
Figure 2.2.2: Benefits farmers get from pond preparation activities
Figure 2.2.3: Practices while purchasing/ sourcing quality fish seeds (%)
Figure 2.2.4: Benefits of purchasing quality fish seeds
Figure 2.2.5: Benefits of stocking with appropriate density
Figure 2.2.6 - Percentage of farmers adopted different types of Improved Feeding Practices
Figure 2.2.7: Benefits farmers get from feeding homemade feed
Figure 2.2.8: Usage of different technologies in fish farming
Figure 2.2.9: Benefits from using technologies/ processes farmers usually get
Figure 2.2.10: HH member engagement in different activities
Figure 2.2.11: Areas where production cost decreased by 1 - 30%
Figure 2.2.12: Areas where production cost decreased by 31 - 70%

8 | P a g e
Figure 2.3.1.1: Number of cows: hybrid/crossbreed farmers (%) have
Figure 2.3.2.1 – Percentage of HHs produce improved grass varieties
Figure 2.3.2.2 – Benefits farmers get from green grass usage
Figure 2.3.3.1 - Ingredients HHs (%) use to make homemade feed
Figure 2.3.3.2 - Benefits farmers (%) get by feeding homemade feed
Figure 2.3.4.1 - Practices/ Technologies farmers (%) use
Figure 2.3.5.1 - Medical services for animals farmers (%) now take
Figure 2.3.6.1 - Percentage of farmers reporting different benefits of hybrid cattle
Figure 2.3.8.1 - How much has the milk production increase?
Figure 2.3.8.2 - Reasons for increased amount of milk
Figure 2.3.9.1 - Household involvement in activities
Figure 3.1.1: Current consumption behavior of women
Figure 3.1.2: Outcome of improved consumption Behavior
Figure 3.2.1: Current consumption behavior of children
Figure 3.2.2: Current Complementary food habit of children
Figure 3.3.1 Percentage of respondents adopted personal hygiene practices
Figure 3.3.2: Percentages of respondents adopted improved cooking practices
Figure 3.4.1: Percentage of HHs whose children participated in SaFaL's health & nutrition program
Figure 3.4.2: Impact of health & nutrition program on families
Figure 4.2.1.1: Women involvement in different horticulture production processes
Figure: 4.2.1.2: Decision Making Areas For Women in Horticulture PG
Figure 4.2.2.1: HH member engagement in different activities of aquaculture sector
Figure: 4.2.2.2: Decision Making Areas For Women in Aquaculture PG
Figure 4.2.3.1: Women involvement in different dairy production processes
Figure 5.1.1.1: Sales ratio
Figure 5.1.1.2: Sales channel
Figure 5.1.1.3: Benefits of using different channels
Figure 5.1.1.4: Collective sales behavior
Figure 5.1.2.1 - Amount of fish farming HHs (%) sell and consume
Figure 5.1.2.2 - Sales channel

9 | P a g e
Figure 5.1.2.3 - benefits of using different channels
Figure 5.1.3.1: percentage of farmers selling milk
Figure 5.1.3.2: Milk sales channels
Figure 5.1.3.3: Benefits of using different channels
Figure 5.2.1: % of Respondents have access to appropriate financial services
Figure 5.2.2: Categories of financial services sources
Figure 5.2.1.1: Saving patterns in HHs
Figure 5.2.3.1: Saving places
Figure 5.2.4.1: % of HH have increased assets
Figure 6.1.1: Profile of a Successful Lead Farmer
Figure 6.2.1: Profile of a Successful CLSP
Figure 6.3.1: Profile of a Successful Vegetable seller
Figure 6.4.1: % of HHs received CNV service
Figure 6.4.2: Satisfaction level of the HHs received CNV service
Figure 7.3.1: Percentage of horticulture farmers reporting whether neighboring farmers copied from them or not
Figure 7.3.2.1: Percentage of aquaculture farmers reporting whether neighboring farmers copied from them or not
Figure 7.3.3.1: Percentage of dairy farmers reporting whether neighboring farmers copied from them or not

10 | P a g e
Executive Summery
Background & Introduction
Solidaridad with the support from the Embassy of the Kingdom of Netherlands in Bangladesh has been implementing the Sustainable Agriculture, Food Security and Linkages (SaFaL) project from November 2102. The purposes are improving food and nutrition security for 50,000 farm households (project target), disadvantaged landless workers, and women in the southwest Bangladesh. Their intervention emphasizes on improved farming practices, market accessibility, access to technologies, certification to sustainability standards, access to inputs and financial services.
Solidaridad assigned Consiglieri Private Limited (CPL) to conduct an in-depth study on farmer’s behavior change, drivers, and barriers as well as ‘spontaneous’ impact on family and neighbors. The specific objectives of the study are to assess the effectiveness of the adoption and adaptation of new technologies, analyzing the household level diversification of food behavior, and assess ‘spontaneous’ impact on family and neighbors. The study was conducted in the five districts of South-West Bangladesh (Khulna, Satkhira, Bagerhat, Jessore, and Narail) and on the three subsectors this project has been working with (horticulture, dairy, and aquaculture). Effectiveness, Adoption, and Adaptation of new Technologies and Services
Horticulture: There has been significant changes that took place in usage of chemical fertilizers. Vegetables producers stated, that due to increased usage of organic fertilizers and knowledge on proper usage, their expenditure on chemical fertilizers have decreased. Farmers are also using micro-nutrient contained fertilizers where there is deficiency in the soil for all appropriate places. Instead of raw cow dung, farmers now use vermi compost (76%), compost (62%) or quick compost (9%). In case of seeds, 49% respondents have claimed that producers have been increasingly using HYV seeds because of their experience of increased productivity and increased market price.
After project inception, there has been increased adoption of safe and environmentally friendly pest management technologies, for example, sex pheromone trap. It has significantly reduced their cost and increased product market price.
We have observed substantial changes in the post-harvest management practices among the horticulture producers. Most of the producers (97%) currently harvest vegetables as per buyer’s demand, wash (74%), sort and grade (97%), keep on plastic mat in shaded place, and then pack them safely (47%) for transportation. We have also observed the use of plastic crates while transporting the crops in collection center based sales areas. In case of work distribution in a horticulture household, adult male members were found to be heavily involved in seed and input purchase (80% and 95% respectively) and sales and marketing (86%). On the other hand, female members are found to be moderately involved in weeding (36%), harvesting (35%), sowing/seeding (36%), and post-harvest processes (30%).

11 | P a g e
Aquaculture We have found noteworthy changes in case of pond preparation. After the intervention took place, they drain out the pond, apply lime, compost, urea, potash and other necessary project prescribed materials in the pond before the cultivation of fish. Most of the respondents (96%) claimed they now have a better knowledge about the source or have access to fish seeds. Consequently, they purchase better quality fish seeds (fries/fingerlings/PL). We have found substantial changes in producers’ practice related to fish feeding. Now almost all fish farmers purchase fish feed now (basic concentrated feed or ready feed). Around 60% of the respondents are now mixing basic fish feeds (following project promoted prescriptions) at their home before applying those in their ponds. We also found that more than 90% of the fish producers are using probiotics since they help improve the overall health status of marine stock which in turn helps ensure higher yields and higher profits. More producers are testing pH level (76%, during pond preparation), water temperature (65%) and phyto and zoo plankton amount in water (58%) now. There also been change in reduced chemical use, cleanliness and pond hygiene maintenance. Many of them use fine meshed synthetic nets which protect the ponds/ghers against snakes, frogs and other harmful animals and insects.
In case of work distribution in a fish producing household, except for feed purchase, sales, and pond preparation, women are contributing almost equally to their male counterparts. In our qualitative findings, we have found out significant contribution in feeding (38% reported of female contribution in this activity), homemade feed preparation (38%), applying the medicines (26%), and fishing (34%).
Dairy There has been notable change in the ownership of hybrid/ cross-bred cows in producer groups. While 72% of the respondents own at least one cross-bred/ hybrid cow, 54% own at least one local cow. 45% of the surveyed farmers were found to cultivate improved verity green grass for their cows. There has also been noteworthy change in homemade feed preparation. Almost all the farmers (98%) reported that after project inception their cows are producing more milks. Another noteworthy area where we found behavioral change is cow shed management (install well-pit and drainage system, use of lime and soda to clean their cowsheds, etc.).
After project facilitated relevant awareness building sessions, CLSP services and linkage development with local veterinary services, now significantly more producers are taking regular medication and regular health care services fort their cows (vaccination, deworming, regular check-up, etc.). We have also observed significant change in milking process among dairy producers.. In our field visits we have witnessed that farmers now clean the mammary gland area with towels and wash hands properly before and after milking.
In case of household level work distribution, male members are predominantly involved only in cow purchase, cow sales, and cross breeding. On the other hand, women are mostly involved in all other production steps, including feed preparation, feeding, shed management, milk sales, and so on.

12 | P a g e
Household level social and behavioral practices related to food security
The findings from the study show quite promising results in terms food consumption behavior, cooking and hygiene practice. Most of the households were found to consume items from more than four food groups which denotes more than acceptable household dietary diversity in program groups. Additionally, we have found positive changes in women’s food consumption behavior. More than 50% of the respondents stated that women now eat vitamin A rich food (55%), eggs (62%), and dairy products (56%) regularly. Also, more women eat iron rich foods, legume and nuts on regular basis.
It was found that children are also increasingly consuming fresh food, eggs, and dairy products on a regular basis. 50% of the children had eaten protein at least twice in last 24 hours of the interviews. Also, as complementary food, children mostly eat boiled eggs (26%), khichuri (19%) and fruits (12%). Few respondents reported that their children drink milk though.
While further analysis was conducted, result presents that 63% of the respondents now wash their hands with soap after coming from toilet. Additionally, almost two-thirds of the respondents (69%) now wash their hands with soap before eating. It was also interesting to see, that around two-thirds of the respondents reported of women washing their hands before cooking (62%) and before cutting vegetables (74%). Status of women in agricultural production and their empowerment in household and society level
In horticulture, women are now more involved in in post-harvest activities (88%) and harvesting (70%). We also found that women’s contribution in making decisions have increased, including decisions about food purchase for household members and children (89%), measures on taking care of herself and her children (97%) and savings (amount and frequency) (93%).
In aquaculture subsector, women are comparatively less influential in the PGs and also comparatively less involved different fish production activities. Women are moderately involved in home-based feed preparation (16%) and feeding (15%). Except these two activities, women were not found to be significantly involved in any other activities.
Dairy PGs were formed mainly with female members they showed remarkable performance over the project cycle. The result significantly indicated that women are actively involving in milk sales (85%; but that is because they mostly sell milk to neighbors or collectors who come at farmgate to purchase milk), feeding (82%), milking (74%), and feed preparation (70%). Sales, Finance and Saving Situation
Sales Situation In horticulture, 70% of the respondents sell fish to local arotdars. Another 53% reported that they sell through collection points, while 46% respondents said that they sell their produce to distant traders. Producers who sell through collection points said that better price (85%), cash sales option (73%), guaranteed sales (65%) and less transaction time (60%) are the major benefits that they get from using this channel.

13 | P a g e
In aquaculture, around 90% of the respondents claimed that they sell more than 90% of their fish that they produce. 39% of them sell their fish to local arotdars, while 36% sell fish to distant arotders. Producers who sell through distant traders said that better price (70%), cash sales option (70%) and guaranteed sales (79%) are the major benefits that they get from using this channel.
In the dairy subsector, 67% of the respondents claimed that they sell more than 70% of the milk they produce daily. From the survey we have found that 44% sell milk to milk collectors and retailers and 21% to sweetshops and local buyers.
Finance and Savings Situation 50% of the respondents reported that they have access to MFIs, but not to the appropriate financial products they need. 62% of the loan receivers said that they take loan from MFIs and NGOs, while 24% reported to take loan from banks and government projects. However, regardless of the promotion of these financial institutions, 66% of the sample beneficiaries said they opt out for personal savings. Local Service Producers: Agents for Community Level Behavioral Change
Among all the actors that SaFal project introduced, Lead farmers (LFs) were found to be the most influential catalyst for group mobilization, technology adaptation and resulting behavioral changes. They are accessible and provide quality services on production related information, output and input market linkage, etc. CLSP (Community Livestock Service Provider) has been an important change maker in dairy subsector. They are accessible and provide cheap and quality services on deworming, regular health checkup, vaccination, preventive and corrective measures. Vegetable Collectors have been instrumental in bringing positive changes in vegetable production and management related behaviors, their business modalities with different market actors and promoting copying-in phenomenon among neighboring farmers. They have been disseminating market information to both PG members and other community members. Community Nutrition Volunteer (CNV) are the major actors in promoting health and nutrition in targeted communities. Most prominent services that producer households regularly take from CNVs include knowledge on improved food and consumption pattern (100%), and information on hygiene, nutrition and feeding practice (98%). Respondents also stated that CNVs regularly pay customary visits their homes and ask whereabouts (84% reported that) which they found really beneficial for their well-being and that created a strong bond in between. Chapter Seven: ‘Spontaneous’ Impact on Family and Neighbors of SaFaL
In both our quantitative and qualitative analysis, we have found that there have been impressive changes in neighboring (non-program) producers’ and households’ production and consumption related behavior. This can be attributed largely to the program interventions. Neighboring households realized that the products and food they produce and consume, affect their own wellbeing and livelihood. We have found that while neighboring producers have been copying practices related to inputs usage, cultivation method, post-harvest management and sales, in the household level there has been change in consumption behavior.

14 | P a g e
Chapter One: Background and Introduction
1.1 Background and Objective of this Study With the focus of eradicating the hostile environment from these people’s lives, Solidaridad with
support from the Embassy of the Kingdom of Netherlands in Bangladesh has been implementing
the Sustainable Agriculture, Food Security and Linkages (SaFaL) project from November 2102 for
improving food and nutrition security for 50,000 farm households (project target), disadvantaged
landless workers and women in the southwest Bangladesh. Their intervention emphasizes on
improved farming practices, market accessibility, access to technologies, certification to
sustainability standards, access to inputs and financial services. Additionally, their focus in
ensuring gender equitable access to food and safe drinking water along with promoting hygiene
practices. The keys to achieve these goals are improved and sustainable farming systems,
sustainable farming value chain for crops and live stocks, nurturing the private sector and
creating mass awareness of food security and safety. The program has been working work in rural
communities of Bagherhat, Khulna, Jessore, Satkhira and Narial districts in the southwest
Bangladesh targeting 250,000 smallholder farmers and landless workers, unable to curve out a
decent livelihood from agriculture due to salinity of land, unsustainable agricultural practices and
lack of access to markets. Here are some key facts about the SaFal project:
Geographic coverage: Five districts in the Southwest Bangladesh (Satkhira, Khulna, Bagerhat, Jessore and Narail).
Horticulture: Supporting 11,361 farmers with an annual production volume of 15,450 metric tons fruits and vegetables.
Dairy: Supporting 17,406 farmers with an annual production volume of 1,44,82,314 liters milk.
Aquaculture: Supporting 28,699 farmers with an annual production volume of 8,520 metric tons of fish.
Solidaridad assigned Consiglieri Private Limited (CPL) to conduct an in-depth study on farmer’s
behavior change, drivers and barriers as well as ‘spontaneous’ impact on family and neighbors.
The purpose of the study is to examine the determinants of farmers’ behavioral change with
regard to agricultural practices, selection of crop varieties and adoption of technologies towards
having self-organized impact on their food security and livelihoods. Solidaridad and EKN wants
the consulting firm to critically analyze factors such as technical knowledge and capacity, gender
differentiated choice, access to inputs and affordability of farming, market of produces,
availability of land and water, including geographic isolation and climate change issues.
Solidaridad also wants the study team to take into consideration of the dietary diversification for
household nutritional outcomes.

15 | P a g e
Solidaridad wants the consulting firm to take opinions of producer groups and stakeholders and
analyze how the project interventions are contributing to change the farmers behavior in terms
of different factors including farming practices, nutritional food habits or food diversification,
women involvement in productive agriculture, backward and forward market linkages, market
barriers and challenges, farmers’ collective and also others social phenomenon. The specific
objectives of the study are:
Assessing the effectiveness of the adoption and adaptation of new technologies Analyzing the household level diversification of food behavior and its impact Assessing the status of women in agricultural production and status of their
empowerment in household and society Identifying the present state and need for backward and forward market linkages Assessing the household level social and behavioral practices related to food security
The following figure shows the key areas that this study intends to explore.
1.2 Geographic Scope & Subsectors The study was conducted in the five districts of South-West Bangladesh (Khulna, Satkhira, Bagerhat, Jessore and Narail). And because this project is working with horticulture, dairy and aquaculture subsectors, stakeholders of all three subsectors were targeted.
Drivers that mobilized the
farmers in changing their
behaviour
Resesons of change of food
habits/diversification
Factors afecting the position of
men and women in value chain
and HH
Dynamics and factors affecting
backward and forward market
linkage
Drivers behind/ Factors
influencing farmers'
collective works in PGs
Farmers’ contribution in
improving different social phenomenona
Figure: Key Areas that this Study will intend to Explore

16 | P a g e
1.3 Sampling Design
Sample size and distribution for Survey
As per the ToR, SaFal project reached 57,466 direct beneficiaries so far under three subsectors, i.e., aquaculture, horticulture and dairy (which is the population for sample survey in this study). Here, this number is taken as the finite population size (10,000+). Considering this population size the sample size (i.e. the number of farmers to be covered by the questionnaire survey) was calculated using the following formula (a few references against the sample size calculation formula used here are given in the foot-note)1. SS = [Z2*(p) * (1-p)]/ c2 Where,
SS = Initial Sample Size; Z = Z value, which varies with the confidence level; p = a dichotomous probability variable, for p = 50% the formula results in highest sample size; C = Level of Precision.
1 a) Glenn D. Israel, 2008, Determination of Sample Size, The Institute of Food and Agricultural Sciences (IFAS) Publication, University of Florida(https://edis.ifas.ufl.edu/pdffiles/PD/PD00600.pdf); b) Yamane, Taro. 1967. Statistics: An Introductory Analysis, 2nd Ed., New York: Harper and Row (http://www.gbv.de/dms/zbw/252560191.pdf); c) Cochran, W. G. 1963. Sampling Techniques, 2nd Ed., New York: John Wiley and Sons, Inc (http://onlinelibrary.wiley.com/doi/10.1002/bimj.19650070312/abstract)
Satkhira
Khulna
SaFal ProjectImplementationZone
Jessore
Narail
Bagerhat

17 | P a g e
Considering 95% of Confidence level and 5% Level of Precision, the initial sample size SS stands equal to 385. For calculating the sample size for a finite population (57,466), the following formula was used: n = SS/ [1 + {SS-1}/Pop] Where,
n = New sample size for finite sample; SS = Initial sample size for infinite sample; Pop = population size, which is assumed as 57,466 farmers.
Considering 95% of Confidence level and 5% Level of Precision, the new sample size against 57,466 farmers stands equal to 384.
The table below shows distribution of sample (384) across the three subsectors based on PG member concentration (or percentage) in those subsectors.
Aquaculture Dairy Horticulture Total Number of PG members involved 28699 17406 11361 57466
% of Involvement 50% 30% 20% 100%
Sample distribution (out of 384) 191.77 116.31 75.92 384
Now by distributing these samples between male and female members, we got the figures presented in the table below.
Aquaculture Dairy Horticulture
Male Female Male Female Male Female
% of male/ female involvement 82% 18% 11% 89% 40% 60%
Sample Distribution (M/F) 157.25 34.52 12.79 103.51 30.37 45.55
Sample distribution (out of 384) 191.77 116.31 75.92
The project is operating in 13 upazilas in five districts in the south-west region of Bangladesh. CPL wanted to collect primary data from one representative upazila from each of the five project districts (therefore, five upazilas in total). The following table shows the five districts that we selected for primary data collection and also sample distribution across those upazilas and different subsectors. During upazilas selection, we tried to prioritize the areas where PG groups working with different subsectors are present. For convenience, approximate figures were set; and the total survey sample stands to 400.
Upazila/ District Name
Aquaculture Dairy Horticulture Total
Male Female Male Female Male Female
Chitolmari (Bagerhat) 30 10 5 20 5 10 80
Dumuria (Khulna) 30 10 5 20 5 10 80
Kalaroa (Satkhira) 30 10 5 20 5 10 80
Manirampur (Jessore) 30 10 5 20 5 10 80
Narail Sadar 30 10 5 20 5 10 80
Total Survey Sample 200 125 75 400

18 | P a g e
Sample size and distribution for FGDs and KIIs
CPL conducted one FGD with the PG members of each subsector in each of the five selected upazilas (therefore, 3 FGDs with 3 PG groups of 3 subsectors in each upazila). Besides, the team conducted one FGD with the neighbors at each upazilas. Thus, the total number of FGDs is conducted is given in the table below. Approximately 10 farmers participated in each FGD.
Aquaculture Dairy Horticulture Neighboring farmers
Number of PG members reached
Chitolmari (Bagerhat)
1 1 1 1 40
Dumuria (Khulna) 1 1 1 1 40
Kalaroa (Satkhira) 1 1 1 1 40
Manirampur (Jessore)
1 1 1 1 40
Narail Sadar 1 1 1 1 40
Total number 5 5 5 5 200
Study team also collected insights, perceptions and in-depth information from PG members, other relevant stakeholders and project staffs. Number of KIIs in different upazilas is tabulated below.
Aquaculture Farmers
Dairy Farmers
Horticulture Farmers
Other Stakeholders1
Project staffs1
Chitolmari (Bagerhat) 1 1 1
5 5
Dumuria (Khulna) 1 1 1
Kalaroa (Satkhira) 1 1 1
Manirampur (Jessore) 1 1 1
Narail Sadar 1 1 1
Total number 5 5 5
1.4 Data Collection Method While the semi-structured survey was conducted by a team of surveyors and field investigators, a team of consultants and research associates used tools like FGD, IDI and observation methods for qualitative data collection.
QuestionnaireSurvey(QS)BySurveyteam
(StructuredQuestionnaire)
PrimaryDataCollection
QualitativedatacollectionbyConsultants&ResearchAssociates(FGD,KeyInformantInterview(KII)&
Observation)

19 | P a g e
1.5 Study Limitations
Understanding the factors that motivate farmer behavior is complex. Behavioral patter
depends on so many psychological factors (objectives and goals in farming, social values
and norms, attitude towards the traditional/ethical approach to farming, stress and the
ability to cope with stress, satisfaction with and optimism about farming, attitudes to
legislation, risk-taking, autonomy, management attitudes, risk perceptions, time
preference, market conditions, quality and quantity of information, who is involved in the
decision-making process, individual’s ability to solve problems, aspects of their
personality, “education” level of the farmer, etc.) and socio-economic factors (income,
farm size (e.g., modern, large-scale, commercially- oriented farm businesses are likely to
display characteristics that differ from small-scale, family run farm businesses, production
system, etc.). It is difficult and to capture enough insights on behavioral patterns and
underlying causes by talking to a farmer for sixty to ninety minutes.
Analyzing behavioral change analysis has intrinsic anthropometric component in it which
demands deep observation and open ended discussion with the study respondents. But
in most cases, we had to limit ourselves with semi-structured interviews and group
discussions.
Although this study had both survey and qualitative data collection parts, but it was
comparatively heavier on the survey part (400 samples) and a bit weaker on qualitative
data collection part. We believe that in such behavioral analysis more prioritization should
be given to qualitative data collection and analysis in future.

20 | P a g e
Chapter Two: Effectiveness, Adoption, and Adaptation of new
Technologies and Services
2.1 Technology Adoption and Adaptation in Horticulture Subsector 2.1.1 Use of Chemical fertilizers
SaFal project tried to reduce the usage of chemical
fertilizers among the users. The most used kinds of chemical
ones are Urea, MOP, TSP, and DAP. According to Figure
2.1.1.1, there is significant use of different chemical
fertilizers including urea (96%), MOP (97%), TSP (96%) and
DAP (84%). However, FGDs and IDIs have revealed that the
change has mostly been in the right usage and dosage of
different chemical fertilizers. Before, they had a
misconception that the more they would use, the better the
yield would be. But, after the PG trainings now they try to
follow the recommended doses in their crops. Therefore,
their cost for chemical fertilizers has significantly
decreased.
We have tried to identify what benefits they had received from appropriate usage of chemical
fertilizers. Here in the graph in Figure 2.1.1.2, we have calculated the percentage of farmers
reporting different benefits of using different chemical fertilizers. For example, 49% of the MOP
users said that using it has improved their soil nutrient. In case of Urea, TSP, and DAP, respectively
29%, 49% and 44% have accounted for this benefit. Likewise, in relation to increasing production
/productivity, 59% of the urea users said that it helped them. Similarly, 50% of the MOP and DAP
users claimed the same benefit and 51% accounted for TSP. Additionally, 14% of urea users
claimed that the fertilizers helped their crop grow faster. In case of increasing product quality,
most farmers said that urea helped (25%). It should be noted that, the responses have been taken
in multiple choice-multiple answers format. This format allowed respondents to choose multiple
options as part of their answer.
96%
97%
96%
84%
UREA
MOP
TSP
DAP
Figure 2.1.1.1: Farmers reporting different chemical fertilizers
21 | P a g e
2.1.2 Use of Composts
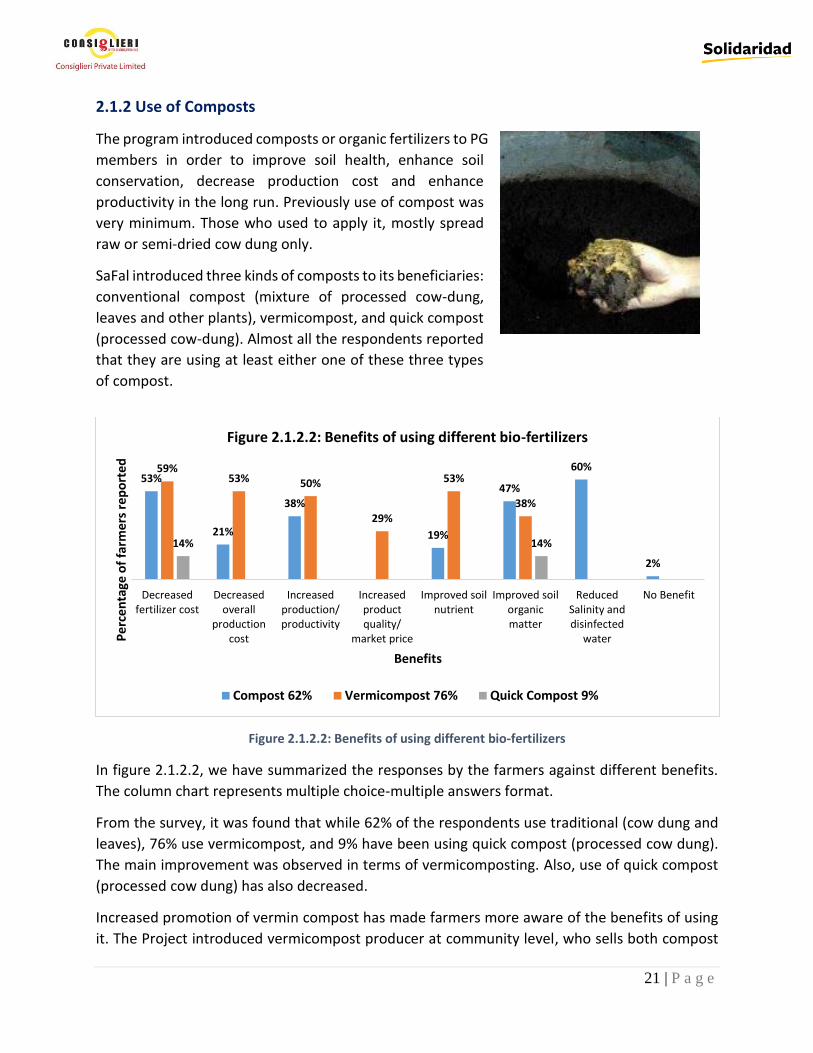
The program introduced composts or organic fertilizers to PG
members in order to improve soil health, enhance soil
conservation, decrease production cost and enhance
productivity in the long run. Previously use of compost was
very minimum. Those who used to apply it, mostly spread
raw or semi-dried cow dung only.
SaFal introduced three kinds of composts to its beneficiaries:
conventional compost (mixture of processed cow-dung,
leaves and other plants), vermicompost, and quick compost
(processed cow-dung). Almost all the respondents reported
that they are using at least either one of these three types
of compost.
Figure 2.1.2.2: Benefits of using different bio-fertilizers
In figure 2.1.2.2, we have summarized the responses by the farmers against different benefits.
The column chart represents multiple choice-multiple answers format.
From the survey, it was found that while 62% of the respondents use traditional (cow dung and
leaves), 76% use vermicompost, and 9% have been using quick compost (processed cow dung).
The main improvement was observed in terms of vermicomposting. Also, use of quick compost
(processed cow dung) has also decreased.
Increased promotion of vermin compost has made farmers more aware of the benefits of using
it. The Project introduced vermicompost producer at community level, who sells both compost
53%
21%
38%
19%
47%
60%
2%
59%53% 50%
29%
53%
38%
14% 14%
Decreasedfertilizer cost
Decreasedoverall
productioncost
Increasedproduction/productivity
Increasedproductquality/
market price
Improved soilnutrient
Improved soilorganicmatter
ReducedSalinity anddisinfected
water
No Benefit
Pe
rce
nta
ge o
f fa
rme
rs r
epo
rte
d
Benefits
Figure 2.1.2.2: Benefits of using different bio-fertilizers
Compost 62% Vermicompost 76% Quick Compost 9%

22 | P a g e
and worms to producers. This way, producers can produce compost by themselves at household
level. From our FGDs and IDIs, we have also found that many producers are either purchasing
vermicompost from local vermicompost producer or producing it themselves.
Additionally, we have tried to identify what benefits they had received from the appropriate
usage of organic fertilizers. As we can see in the figure above (Figure 2.1.2.2), vermicompost
usage has decreased 59% farmers’ fertilizer cost. In addition, 53% of the respondents have
reported that their overall production cost came down because of using it. Increased productivity
was also identified as one of the major drivers for using vermicompost by 50% of the
respondents. Behind the increased use of other types of compost, 53% have reported that
decreased expenses for fertilization was identified as the major cause. Traditional compost (that
is homme made processed cow dung) is capable of neutralizing water salinity. Since salinity has
been a major problem in a large part of the project areas, 60% of the respondents reported that
they use traditional compost as it neutralizes salinity in water.
2.1.3 Use of Micronutrients
Micronutrients are essential for plant growth and play an
important role in balanced crop nutrition. They are
important to plant nutrition though plants do not require
them much. A lack of any one of the micronutrients in the
soil can limit growth, even when all other nutrients are
present in adequate amounts.
However, micro-nutrient is only required if there is any
deficiency; otherwise it is not necessary. SaFal project
introduced knowledge on the usage and benefits of
different micronutrients (gypsum, boron, magnesium, and
sulfur) to its PG members.
We have found moderate level of spread in micronutrient use among farmers. Before the project
started, use of micronutrients was quite small. As we can see in Figure 2.1.3.1, more than half of
the respondents said that they have been using different types of micronutrients including
gypsum, Sulphur and Boron.
In addition, we have tried to identify why users have been using micronutrients for vegetable
cultivation. The graph in Figure 2.1.3.2 illustrates the percentages of farmers accounting for
different benefits. As we can see below (Figure 2.1.3.2), that magnesium serves good purpose in
terms of increasing production and improving soil nutrients. 33% of the respondents have
accounted for this micronutrient regarding these benefits. Sulfur gives the most increased
production than any other micronutrients. 35% of the respondents said that sulfur helped them
the most in escalating their production. Additionally, 26% of the informers said that sulfur also
improved their soil’s organic matter the most.
78%
49%
36%
57%
GYPSUM
BORON
MAGNESIUM
SULFAR
Figure 2.1.3.1: percentage of farmers using different types of micronutrients

23 | P a g e
Although nutrient deficiency is the only reason for using micronutrients, out FGD and IDI findings
denote that farmers are using it without testing their soil. They have a misconception that usage
of additional micronutrients might give them additional yield. Better access to soil testing service
might improve regarding practice in this case.
2.1.4 Soil testing
The first step for an ideal vegetable producer is to test
the soil before planting the seeds or saplings. The
analysis consists of checking the nutrients in the soil,
level of acidity (pH level), and evaluating potential
deficiencies.
However, soil testing has not been a usual practice
among farmers in Bangladesh (alike other practices
like fertilization) and this project recently has started
their work on bringing changes regarding this
behavior. Till date, the project has demonstrated the
impact of soil testing in productivity to some PG members.
In our survey, 20% of the sample beneficiaries were found to have had their soil tested (figure
2.1.4.1). So, there is a lot of potential for the SaFal program to spread this practice such way that
the farmers adopt this technology more.
Respondents identified different reasons for not adopting this technology yet. From our
qualitative part (FGD and IDI) we have found that it was not a very familiar or known technology
for the producers. DAE (Department of Agricultural Extension) is still the major service provider
in this regard and they do not have this facility in every upazilas. Besides, the soil submitted in
the upazilas agricultural office has to be sent to district laboratory for testing. This is a quiet time
14%
31%
12%
24%
12%
27%
2%5%
11% 19%24%
24%
5% 5%
3%
5%4%
33%
15%
33%
19%
9%
35%
9%
28% 26%
12%
2%
Decreasedoverall
productioncost
Increasedproduction/productivity
Increasedproductquality/
market price
Improvedsoil nutrient
Improvedsoil organic
matter
ReducedSalinity anddisinfected
water
No Benefit Cleared outweeds
Fastergrowth ofproduce
Pe
rce
nta
ge o
f fa
rme
rs r
ep
ort
ed
Benefits
Figure 2.1.3.2: Benefits of Using Different Micronutrients
Gypsum Boron Magnesium Sulfar
20%
80%
Figure 2.1.4.1: Percentage of respondents tested their soil in last
season

24 | P a g e
consuming process. Consequentially, the producers’ service experience was not found very
pleasant.
Besides, the program did not train and promote relevant local service providers (LSP) for
providing soil-testing service like they did for other value chain processes (e.g., vegetable seller
or collector, vermicompost producer, etc.).
In some places, even though the soil testing facilities were available, farmers did not test their
soil. We tried to figure out the reasons behind this. When asked why they (non-users) have not
tested their soil, major reasons they stated include non-availability of the service in nearby
locality (21%), lack of knowledge about procedure (22%), and lack of access to existing service
providers (16%) (Figure 2.1.4.2). There is an opportunity for the program to train these actors, so
that the beneficiaries practice it more.
The project, in general, promotes use of recommended fertilizers based on Union wise Fertilizer
Recommendation Guideline developed by SRDI. In addition, project also initiated a piloting with
Grameen Intel to create easier and affordable access to soil testing facilities for the farmers. The
project plans to work further on improving farmer behavior regarding soil testing in coming days.
2.1.5 Use of lime
Lime is commonly used as a pH-regulating agent and acid neutralizer in soil and water. This allows
for faster growth of crops by aiding the intake of nutrients and nitrogen by vegetation growing
in the soil. It helps preserve stored fruits and vegetables when placed nearby in bags. The bags
21%22%
2%
7%
16%
1%
6%
2%
Figure 2.1.4.2: Reasons of not testing soil
No availability in the area Lack of knowledge about usage Time consuming
Extra work Lack of opportunity Lack of need
Lack of awareness No assistance from the project

25 | P a g e
absorb carbon dioxide emitted by the fruits and vegetables, regulating oxygen levels which
prolongs their freshness.
We have found that farmers mostly use Calcium Oxide or Calcium Carbonate (Pathure Chune) as
the pH regulating agent. Our FGD and IDI findings show that the horticulture PG members are
aware of the importance of using lime. Nevertheless, they cannot deduce how much lime they
have to apply in their lands, since they do not have access to soil testing facilities. The lime dosage
amount depends on the pH and other acid amount in the soil.
2.1.6 Usage of Improved Seed varieties
The key to produce high quality crops is to use
high quality seeds. Interestingly, it was found in
the FGDs and IDIs that, even though SaFal
introduced the usage of high quality seeds to its
beneficiaries, more that 50% the farmers opt
out for using the seeds they save from last
season. Figure 2.1.6.1 signifies the percentage
of horticulture farmers responding
affirmatively of using each type of seeds. It
should be noted that, the responses have been
taken in multiple choice-multiple answers
format. This format allowed respondents to
choose multiple options as part of their answer.
Altogether, majority of our respondents claimed they still use their own produced seeds (66%)
or local seeds (26%) for production. Farmers claimed that according to them, these seeds are
more resilient and have delivered good yield. Nonetheless, they have increased the usage of HYV
seeds. 49% of the respondents claimed that they have used HYV seeds in their fields.
We have found that producers have been increasingly using HYV seeds because of their
experience of increased productivity (73%) and increased market price (Figure 2.1.6.2). Users of
local/ own seeds claimed that they use this seed type because of its low cost, resilience against
salinity and other climatic impacts, coupled with moderate yield level (Figure 2.1.6.2).
Lack of trust on present open market retailers and seed companies has been one of the major
reasons behind slow adoption of HYV seeds. There remains scope of improving this trust
component in coming months.
66%
26%49%
Farmer'sseed
Open seed(from local
market)
High yieldingvarieties
(HYV)
Figure 2.1.6.1: Percentage of farmers using variety of seeds

26 | P a g e
2.1.7 Irrigation/ Water management
Irrigation is one of the most crucial steps in cultivation process. It was found in the survey that
almost all of the PG respondent (99%) irrigates their vegetable beds for cultivation. From FGDs
and IDIs, we have found that there has been a significant
change in the quality of water that they use currently for
irrigation. Previously, they had a misconception that
rotten water or water from closed bodies (like marsh or
swamp), is better for irrigation as it might contain micro-
organisms. However, from the project they have learned
about the disadvantages of using such water. Now they
mostly use underground water or open surface water.
2.1.8 Pest management
There have been significant changes in pest management practices and relevant costs across all
the project districts. Previously, most of the PG members heavily used chemical agents as
pesticides and it comprised the largest chunk in input expenses. From our qualitative data, it was
revealed that usage of pesticides was so high that producers often did not use vegetables of their
own land for household consumption.
After project inception, there has been increased adoption of safe and natural pest management
technologies, for example, sex pheromone trap and different types of bio pesticides.
Sex pheromone trap: Use of sex pheromone trap was very limited in the project area before.
After the inception, as we can see in figure 2.1.8.1, 82% of the respondents now have been using
sex pheromone traps. Figure 2.1.8.2 describes different benefits that producers enjoyed from
using different kinds of pest management technologies. As it is illustrated in the figure, decreased
pest pesticide and overall production cost, and decreased
health risks (as they are consuming a part of the produce)
90%
5% 5%6% 5%2%
22%8%
24%
44% 45%
73%
14% 20%
43%
14%5%
Farmer's seed Open seed (from local market) High yielding varieties (HYV)
Per
cen
tage
of
farm
ers
rep
ort
ed
Benefits
Figure: 2.1.6.2: Benefits of using different typed of seeds
Decreased seed cost % Decreased irrigation cost %Decreased fertilizer cost % Decreased weeding/ labor cost %Increased production % Increased product market price %No damaged seeds %
n %
Pheromone traps 62 82
Light traps 9 12
Bio-pesticide 38 50
Other 5 7
Technology nameYes
Table 2.1.8.1: Percentage of farmers using different types of pest management techniques

27 | P a g e
are the major benefits they have observed so far. PG members have access to these technologies,
which are affordable to them.
Bio pesticide/natural pesticide: SaFal also introduced the use of different types of environment
friendly pest management techniques to the PG groups. These include mahogany cake or oil,
neem extract and other local plants, using a mixture of detergent powder and molasses, etc. for
pest control. FGDs and IDIs suggest that respondents are quite impressed by the cost-
effectiveness of these natural pesticides. Survey data suggests similar findings. As we can see in
figure 2.1.8.1, 50% of the sample beneficiaries currently use natural pesticides. As major benefits
they have identified decreased cost (more than 60% response), decreased health risks (47%), and
increased productivity and/ or product quality (55%). These solutions are cheap and easily
available by PG members.
2.1.9 Post-harvest Management
The study team has observed significant changes in post-harvest management practices among
the respondents. We have found that previously they undertook minimum measures in between
harvesting and sales. They usually used to harvest all the vegetables together (or when they
needed cash), and dumped those on their soil-yard under bare sunlight. After keeping the
vegetables there for several hours, they used to take those to nearby haats using basket, van, or
sacks for sales.
After project inception, major changes in post-harvest processes include harvesting at mature
stage. 97% of the respondents said that they have been doing that. IN case of sorting, washing,
and using crates for carrying amount to respectively 97%, 74%, and 67% of the respondents.
28 | P a g e
Besides the program facilitated
knowledge building initiatives,
service providers like Vegetable
Sellers or Collectors (promoted by
SaFal) played an instrumental role in
bringing rapid behavioral change
among farmers. Vegetable sellers
who are linked with different large or
institutional traders and retailers,
have been disseminating buyer side
information to farmers. These information include what to produce; what is the desired quality;
when to produce; what should be the post-harvest measures; and so on. This market information
pushed the farmers to adopt improved practices in a more cost-efficient way, because of a direct
price incentive for relevant behavioral change. Change dynamics behind different practices are
briefly described below.
Harvesting at the right time: Before the project inception, farmers used to harvest vegetables
either all together or whenever they needed cash. 97% of the respondents in this survey reported
that they harvest now as per buyer demand. Receiving higher market price was identified as the
major reason behind this behavioral change with 80% of the respondents’ opinion (Table 2.1.9.2).
Activities Increased
production amount
Increased product quality/ market
price
Decreased transportation
cost
Increased product
longevity
Fair selling price
Harvesting at maturing stage
46% 80% 11% 1% 1%
Table 1.1.9.2: Benefits of harvesting at maturing age
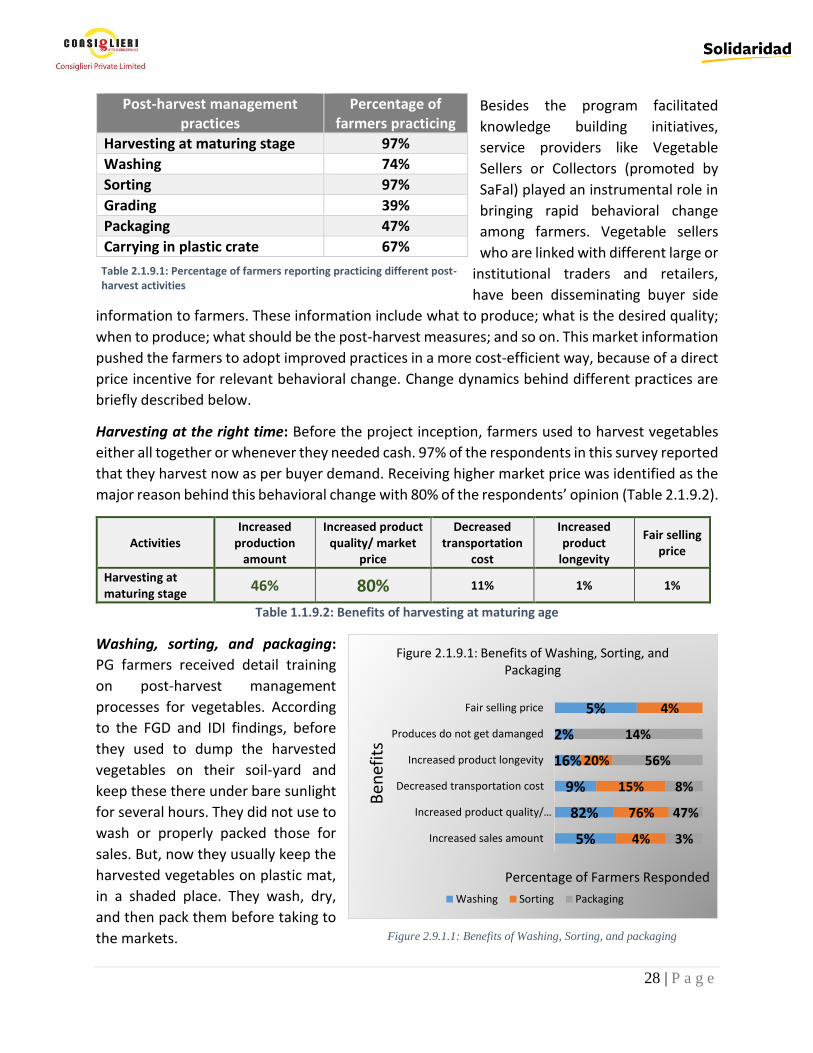
Washing, sorting, and packaging:
PG farmers received detail training
on post-harvest management
processes for vegetables. According
to the FGD and IDI findings, before
they used to dump the harvested
vegetables on their soil-yard and
keep these there under bare sunlight
for several hours. They did not use to
wash or properly packed those for
sales. But, now they usually keep the
harvested vegetables on plastic mat,
in a shaded place. They wash, dry,
and then pack them before taking to
the markets.
Post-harvest management practices
Percentage of farmers practicing
Harvesting at maturing stage 97%
Washing 74%
Sorting 97%
Grading 39%
Packaging 47%
Carrying in plastic crate 67%
Table 2.1.9.1: Percentage of farmers reporting practicing different post-harvest activities
5%
82%
9%
16%
2%
5%
4%
76%
15%
20%
4%
3%
47%
8%
56%
14%
Increased sales amount
Increased product quality/…
Decreased transportation cost
Increased product longevity
Produces do not get damanged
Fair selling price
Percentage of Farmers Responded
Ben
efit
s
Figure 2.1.9.1: Benefits of Washing, Sorting, and Packaging
Washing Sorting Packaging
Figure 2.9.1.1: Benefits of Washing, Sorting, and packaging

29 | P a g e
Figure 2.1.9.1 illustrates the scenario of the survey where portions of respondents replied in
affirmative for going through washing, sorting, and packaging stages reported different benefits
of these stages. As illustrated, enjoying benefits like increased product quality was the major
reason that farmers adopted these practices.
Grading: Grading is very important step in post-harvest processing since different quality types
buyers or traders set different market prices. The overall market price decreases if a lot has mixed
quality products in it. Before the project launch, we have found that most of the PG members did
not use to grade their harvests on regular basis. Rather, they were accustomed to sell all quality
types all together. Around 40% (Table 2.1.9.1) of the respondents stated that they now grade
their products before marketing and thus they receive better market price. However, most of the
respondents said, that they do not have to grade (around 60%) their products as quality does not
vary that much.
Crate usage: SaFal has provided collection
points with crates to load the vegetables from
farmers’ fields so that they remain clean and
spotless. Both farmers and collection point
committee members said that using crates has
increased product price as vegetables remain
spotless and fresh. Producers also put paper in
between vegetables (figure 2.1.9.2). These
papers reduce the friction between vegetables
and thus keep those spotless.
We tried to identify why users have been
enthusiastic about using plastic crates
for transportation. Figure 2.9.1.3
demonstrates percentages of farmers
claiming different benefits. As the bar
chart illustrates, decreased
transportation cost was identified as the
major reason behind this.
However, as stated above, most of the
crates were provided by the project and
managed by the collection point
committee. SaFal distributed some
crates to the Collection Centers as a hand
holding support and to demonstrate the
effectiveness of using these in reducing
post-harvest loss. Some market actors
Figure 2.1.9.2: Use of Crates
Figure 2.1.9.3: Benefits of using crates
6%
18%
57%
14%
2%
4%
10%
2%
INCREASED PRODUCTION AMOUNT
INCREASED PRODUCT QUALITY/ …
DECREASED TRANSPORTATION COST
INCREASED PRODUCT LONGEVITY
PRODUCES DO NOT GET DAMAGED
NO BENEFIT
FAST MARKETING
FAIR SELLING PRICE
Be
ne
fits
Percentage of respondents
Figure 2.1.9.3: Benefits of Using Crates
Figure 2.1.9.3: Benefits of Using Crates

30 | P a g e
(Faria, Arotdar) were found to be using crates in the entire process from harvesting to retailing.
However, all the producers did not get this facility and we did not find any relevant business plan
to promote this technology.
2.1.10 Production cost
The CPL team also ran an assessment for all the sectors regarding how much new technologies
have helped them reducing their expenses in different agricultural steps. Figure 2.1.10.1
illustrates the percentages of farmers reporting reduced costs in terms of different steps of
agricultural production. In the horizontal axis, different production steps are summarized. In the
vertical axis, the percentage of farmers responding to different production steps are depicted.
The legends denote the different percentages of cost decrease. For instance, if we take the first
column as an example, it means 28% of the 75 horticulture respondents told us that there
seed/seedling costs have decreased by 0%. Meaning, there costs did not decrease at all. Here,
the responses have been taken in multiple choice-multiple answers format.
In the horticulture sector, as illustrated in figure 2.1.10.1, about 40% of the respondents
experienced up to 40% cost reduction in fertilizers, while another 38% experienced up to 80%
cost reduction in terms of pesticide use. Up to 40% cost decrease was also experienced by 71%
respondents in terms of labor use, 78% cost decrease in terms of extension services, around 60%
cost decrease in transportation and irrigation, and 57% cost decrease in pest management.
On the other hand, 30-40% respondents reported that they did not experience major cost
decrease in areas like irrigation, harvesting, transportation, seed, etc. cost decrease was less in
terms of harvesting. Cost decrease was also less in terms of harvesting.
28% 29%
41%49%
39%36% 36%
22%
72%
100%
57%
71%
59%
50% 49%
58% 58%
78%
38%
1%
12%7% 7%
Seed/ seedlingcost
Fertilizer cost Pestmanagement
cost
Labor cost Irrigation cost Harvesting cost Selling cost (arotfee, broker
charge, etc.)
Transportationcost for selling
Technologyusage cost
Technology andextension
services cost
Figure 2.1.10.1: Percentage of Farmers Reporting Reduced Production Costs
0% cost decrease 1-40% cost decrease 41-80% cost decrease 81-100% cost decrease
31 | P a g e
2.1.11 Household Involvement in Agricultural production
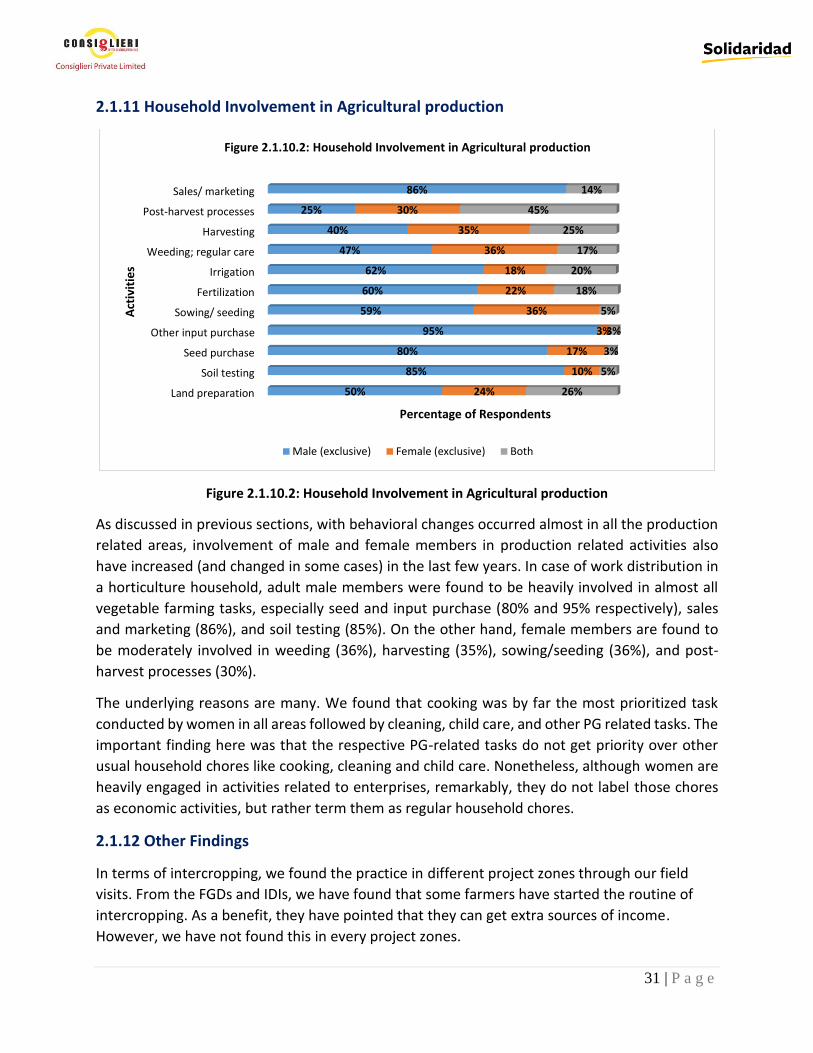
Figure 2.1.10.2: Household Involvement in Agricultural production
As discussed in previous sections, with behavioral changes occurred almost in all the production
related areas, involvement of male and female members in production related activities also
have increased (and changed in some cases) in the last few years. In case of work distribution in
a horticulture household, adult male members were found to be heavily involved in almost all
vegetable farming tasks, especially seed and input purchase (80% and 95% respectively), sales
and marketing (86%), and soil testing (85%). On the other hand, female members are found to
be moderately involved in weeding (36%), harvesting (35%), sowing/seeding (36%), and post-
harvest processes (30%).
The underlying reasons are many. We found that cooking was by far the most prioritized task
conducted by women in all areas followed by cleaning, child care, and other PG related tasks. The
important finding here was that the respective PG-related tasks do not get priority over other
usual household chores like cooking, cleaning and child care. Nonetheless, although women are
heavily engaged in activities related to enterprises, remarkably, they do not label those chores
as economic activities, but rather term them as regular household chores.
2.1.12 Other Findings
In terms of intercropping, we found the practice in different project zones through our field
visits. From the FGDs and IDIs, we have found that some farmers have started the routine of
intercropping. As a benefit, they have pointed that they can get extra sources of income.
However, we have not found this in every project zones.
Land preparation
Soil testing
Seed purchase
Other input purchase
Sowing/ seeding
Fertilization
Irrigation
Weeding; regular care
Harvesting
Post-harvest processes
Sales/ marketing
50%
85%
80%
95%
59%
60%
62%
47%
40%
25%
86%
24%
10%
17%
3%
36%
22%
18%
36%
35%
30%
26%
5%
3%
3%
5%
18%
20%
17%
25%
45%
14%
Percentage of Respondents
Act
ivit
ies
Figure 2.1.10.2: Household Involvement in Agricultural production
Male (exclusive) Female (exclusive) Both

32 | P a g e
2.2 Technology Adoption and Adaptation in Aquaculture Subsector 2.2.1 Behavioral Changes in Pond / “Gher” preparation
Preparing the pond
consists of learning
about it and taking
adequate steps in order
to make it perfect for fish
cultivation. We found
remarkable change in
case of pond
preparation. Before the
project inception, few
farmers used to know
about the importance of
pond preparation and
what implications it
might have on overall production and profitability. Now, they drain out the pond, apply necessary
project prescribed materials in the pond before the cultivation of fish.
The column chart above (Figure 2.2.1) describes what percentage of sample beneficiaries
responded in affirmative in terms of adopting different new practices regarding pond
preparation. At least 73% of the sample beneficiaries (in most cases it was more than 90%)
reported adopting some sort of new activities or practices regarding pond preparation before
stocking fish seed in their ponds.
CPL tried to explore the underlying reasons behind this behavioral change. The figure above
(Figure 2.2.2) describes the portion of sample beneficiaries claiming benefits for each newly
32% 35%22% 24%
33%22%
15%
58% 60%
30%
46%
74%66% 65%
55% 53%47% 46% 44% 39%
26%
53%
Removepredatory
fishes
Fertilizing Digging Weedcontrolling
Pond drying Bottomplaining
Watering PH Testing Dikerepairing
Per
cen
tage
of
Farm
ers
Res
po
nd
ed
Pond Preparation Activities
Figure 2.2.2: Percentage of farmers reporting different benefits of pond preparation activities
Feed cost decrease Decreased fish mortality Better stocking density
Less prone to disease Increased production Other
95% 90% 96% 96% 99%
73%81% 76%
91%
Dik
e r
epai
rin
g
Bo
tto
m p
lain
ing
Rem
ove
pre
dat
ory
fis
he
s
Po
nd
dry
ing
Wee
d c
on
tro
llin
g
Wat
erin
g
Fe
rtili
zin
g
PH
Tes
tin
g
Dig
gin
g
Per
cen
tage
of
Farm
ers
Res
po
nd
ed
Benefits
Figure 2.2.1 Percentage of people prepare pond for fish culture

33 | P a g e
adopted practice regarding pond preparation. It has pond preparation activities in horizontal axis,
and percentage of farmers reporting benefits against different activities are illustrated on the
vertical axis. Different colored columns signify different benefits which are elaborated in the
legend area of the chat. Like all the other charts, the data reflect multiple choice- multiple
answers response format.
As it is shown here, about 74% of the respondents said that their production has increased due
to the removal of predatory fish form the ponds. Before, the predatory fishes ate many
fingerlings and thus farmers used to have decreased fish production. Practices like fertilizing,
digging, weed controlling, bottom plaining, watering, PH testing, and so on have resulted in
increased fish production, reduced fish mortality and less disease. From the qualitative findings,
we have figured out that the respondents additionally apply lime twice or thrice annually and
after drying up the pond.
Some of the farmers used to use poisoned oil before SaFal was launched, but they stopped that
after the project trained them about the harmful impacts of such practice. They also started
drying up the pond before cultivation. From there, 60% of the farmers reported of increased
production and 53% of them reported of less diseases. Additionally, they started to clean the
weeds around pond and make sure that the pond gets adequate amount of sunlight throughout
the day. 45% claimed that this practice gave them increased production.
2.2.2 Behavioral Changes in Fish Seed Purchase/ Sourcing
Previously the aqua farmers did not have any proper access to input market, especially to quality
fish seeds (fries/fingerlings/PL). They did not know from where to get the better breed of fish
seeds. After the project started, most of the respondents claimed that, they currently have a
better knowledge about the source or access to fish seeds and purchase better quality fish seeds
(96%). While 83% of the respondents said that now they use stocking with appropriate density,
around 90% claimed that they provide nursing before stocking. Besides, 83% of the respondents
reported that they
currently avoid the
purchase or collect
inbreeded fish seeds.
They said that at
present, they buy fish
seeds after careful
checking; they make
sure that those are
moving and lively. They
also now make sure that
the brood stock of the
fish seeds are large in
47%
96%78% 83% 89%
Pu
rch
ase
fro
mre
com
men
ded
sou
rces
Pu
rch
ase
qu
alit
yfi
nge
rlin
gs
Avo
id in
bre
edin
g
Sto
ckin
g w
ith
app
rop
riat
e d
en
sity
Nu
rsin
g b
efo
rest
ock
ing
Pe
rce
nta
ge o
f Fa
rme
rs R
esp
on
de
d
Practices while purchasing/sourcing quality fish seeds
Figure 2.2.3: Portion of respondents adopting to Practices while purchasing/ sourcing quality fish seeds (%)

34 | P a g e
size and healthy. In some areas, it was found that the farmers consult with the NGO workers
before buying fish seeds. They even sometimes go to distant hatcheries or nurseries or sources
to purchase quality fish seeds.
Figure 2.2.3 depicts the portions of aquaculture respondents adhering to sopting different
practices while purchasing/sourcing quality fish seeds. The responded have been taken in
multiple choice-multiple answers format. The line chart shows that increased production
happened from purchasing quality fish seeds from recommended sources (71% and 75%).
Benefits of Purchasing Quality Fish Seeds:
Figure 2.2.4 shows the data of the percentage
of aquaculture farmers reporting for different
benefits of purchasing quality fish seeds.
Increased production amount (75%) and low
mortality rate (50%) were identified as the
major benefits the aquaculture farmers have
been experiencing after they started to
attribute to their improved fish seed purchase
behavior. According to them, these impacts
have been significant and therefore, they wish
to continue this practice in the coming days.
However, their fish seed (fries/fingerlings/PL) purchase cost has increased a bit which is
ultimately traded-off by increased production.
Benefits of Stocking fish seeds with appropriate Stocking Density:
After the project launch, PG members started
cultivating fish in two seasons in a year
(previously which was one) depending on
species. Moreover, farmers also practice nursery
for fries/fingerlings/PL and culture them for
marketable sizes. There is a certain level for
stocking density which they abide by now. As said
before, 83% of the respondents said that now
they use stocking with project prescribed density
(Figure: 2.2.3). In addition, they use a special kind
of fine synthetic net for protection, so that frogs,
snakes, and predatory fish cannot go near them.
3%
49%
8%
45%
75%
1%
Feed
co
stre
du
ctio
n
Low
mo
rtal
ity
Stan
dar
dfi
nge
rlin
gst
ock
ing
Dec
reas
ed
isea
ses
Incr
eas
edp
rod
uct
ion
Oth
er
Pe
rce
nta
ge o
f fa
rme
rs r
esp
on
de
d
Benefits
Figure 2.2.4: Benefits of purchasing quality fish seeds
7%
22%
49%
25%
55%
2%
0%
20%
40%
60%
Feed
co
st r
ed
uct
ion
Low
mo
rtal
ity
rate
Stan
dar
d f
inge
rlin
gst
ock
ing
den
sity
Dec
reas
e d
ise
ases
Incr
eas
ed p
rod
uct
ion
Oth
er
Figure 2.2.5: Benefits of stocking with appropriate density

35 | P a g e
In some areas, it was found that the farmers did not use to nurse the fries in net before. But,
after project inception, they have started nursing them in net. After stocking for three to four
months, they put the fish seeds in the original pond. The farmers then use a floating net and put
fish seeds in the net for seven to eight days. Knowing the density is very crucial because it makes
sure the fish seeds are comfortable enough to move around. Figure 2.2.5 shows the data of the
percentage of aquaculture farmers reporting for different benefits of stocking with appropriate
density. 55% of the surveyed fish farmers stated that because of stocking in appropriate density
their fish production has increased (Figure 2.2.5).
Benefits of Acclimatization before stocking: The producer groups now start acclimatization 30
minutes after stocking the fish seeds. They mostly used flour as fingerling/fry/PL feed. In some
places, the farmers used to feed flour before, now the farmers use feed. It was found that some
farmers have acclimatization ponds in which they keep the fish seeds for nursing. More than 50%
of the surveyed respondents stated that this practice has reduced the mortality rate and
therefore resulting in increased their fish production (Figure: 2.2.5).
2.2.3 Behavioral Changes in Improved Feeding Practice
Appropriate usage and dosage of different kinds of fish feed is very important. Both excessive
and short feeding is harmful for fish health because fish is quite sensitive to food. In addition, it
could change the ecosystem under the water and might have long-term impact. Before the
project launch, most of the fish farmers did not know about the appropriate usage and dosage
of different types of fish feed. They mostly relied on conventional knowledge and experience in
this regard. They did not have any set rules for it.
Figure 2.2.6 pictures the scenario of how many respondents have adopted various new feeding
practices. After project inception, as the figure above (Figure 2.2.6) suggests, almost all fish
farmers purchase fish feed now (basic concentrated feed or ready feed). More than 90% of the
100%91%
7%
59%
16%
Purchased feed Improved feedingpractice
Feeding molases &mahgoni oil
Home made feed Other (Boiled paddy,oil cake, rice polish)P
erce
nta
ge o
f Fa
rmer
s R
epo
rted
Improved Feeding Practices
Figure 2.2.6: Percentage of farmers Adopted Different Types of Improved Feeding Practices

36 | P a g e
farmers have adopted improved feeding practice (e.g., now they provide feed at a particular time
in a day; feed dosage has been changed; they have also changed fish seeds feed from flour to
boiled snails; etc.). Also, around 60% respondents are using home-made feeds. However,
magnitude of these changes varies from farmer to farmer, based on their financial capability and
access to finance.
It is to be noted that behavioral change across feeding molasses, mahogany oil, boiled paddy or
oil cake have been quite limited. Our FGD and IDI findings suggested that using these components
to fish have been quite new to them and it might take additional time for the beneficiaries to
adopt those.
The bar chart in figure 2.2.7
indicates how many respondents
have reported towards different
benefits from feeding homemade
feed. As figure 2.2.7 indicates, fish
farmers have been enjoying major
benefits due to adopting improved
feeding practice. These benefits
include increased production
amount (more than 50% of the
respondents reported it) and
reduced feed cost (around one-third
reported it).
2.2.4 Behavioral Change in Using Other Technologies
65%58%
91%84%
25%
98%
2%
Testing watertemperature
Testing phyto &zoo plankton
Using probioticsto purify water
Using Blue net Cultivatingmonosex (14)
Tilapia fish
Maintaininghygiene of the
farmers and thepond
Other (usinglime, cleaning
net)Pe
rce
nta
ge o
f fa
rme
rs r
esp
on
de
d
Technologies
Figure 2.2.8: Percentage of farmers adopting different technologies in aquaculture farming
82%
49%
13%
10%
7%
2%
Increased production
Decrease feed cost
Reduce diseases
Other
Dcrease mortality rate
Standard fingerling stockingB
en
efi
ts
Percentage of Respondents
Figure 2.2.7: Percentage of aquaculture farmers claiming various Benefits from feeding homemade feed

37 | P a g e
As figure 2.2.8 suggests, there has been significant behavioral changes in different areas. 98%
have claimed that they currently maintain hygiene of the farmers and the ponds. Additionally,
91% use probiotics to maintain good water quality. 84% claimed to be using synthetic net for
fencing. Furthermore, 65% regularly test the water temperature and 58% said they periodically
test the phyto and zoo plankton.
Usage of Probiotics: More than 90% of the surveyed aquaculture PG members were found to be
using probiotics since it helps improving the overall health status of marine stock. This practice
in turn helps ensure higher yields and higher profits. Aquaculture probiotics are basically just
beneficial bacteria, that when consumed, occupy the space that would otherwise be occupied by
harmful bacteria. This results in a reduced incidence of disease and infection in aquaculture,
higher yields, and more returns on the investment. The good bacteria protects fish stocks from
the harmful actions of bad bacteria through competitive exclusion, which means that they
prevent the breeding of bad bacteria by increasing their own population.
Figure 2.2.9 demonstrates a picture where aquaculture respondents have claimed different
benefits towards using various technologies. The responses have been taken in multiple choice-
multiple answers format. The major benefits that farmers have been enjoying after using
probiotics were found as reduced fish disease (63% of the relevant beneficiary reported this),
increased production (50%) and decreased fish mortality (44%) (Figure 2.2.9).
Water and soil testing: Testing the water and soil is very crucial because it tells the farmer what
kind of nutrients and deficiencies his pond water and soil have. This information narrows down
his choice about food and medicine to put in the pond. Ponds with a pH less than the required
amount may result in stunted and reduced fish populations.
30%44%
25%
29%
63%
83%
26%
36%
50%
32%
24%
59%
37%
Testing watertemperature
Testing planktonamountUsing probioticsUsing Blue net
Cultivatingmonosex Tilapia
Maintaininghygiene of pond
Pe
rce
nta
ge o
f fa
rme
rs r
ep
ort
ed
Technologies
Figure 2.2.9: Benefits from using technologies/ processes farmers usually get
Feed cost decrease Decreased fish mortality Better stocking density
Reduced fish disease Increased production Protection from snake/ frog

38 | P a g e
As we can see in Figure 2.2.1 and Figure 2.2.8, a significant number of farmers have been testing
the pH level (76%, during pond preparation), water temperature (65%), and phyto and zoo
plankton amount in water (58%). Major benefits that they have been enjoying include increased
production and decreased fish mortality.
Interestingly, we have found that Lead Farmers play an important role in farmer behavioral
change. We have observed that in places where lead farmers are more active, influential, and
supportive to the farmers. In those areas, farmers had adopted better technologies and practices
more heavily and rapidly than in the other places. Please see chapter 5 where we have tried to
provide profile of a successful Lead Farmer.
Reduced usage of Chemicals: Modern technology comes with a package of good and bad impacts
or side effects. Inappropriate or unplanned use of chemicals is considered quite harmful and
hazardous in aquaculture subsector. One of the key purposes of the SaFal project was to reduce
the use of chemicals in the pond. In order to do that, they introduced many natural and eco-
friendly alternatives to those chemicals. It was found that due to usage of probiotics and
water/soil testing technologies, the farmers already had an idea of what agents and chemicals
their soil or pond water actually needed. This knowledge in turn reduced the use of different
chemicals in fish cultivation. In many places, now they have stopped using chicken waste, cow
dung and some other agents that they had used before.
Keeping the pond clean and maintaining pond hygiene: As mentioned before, almost all of the
respondents (98%) stated that due to project interventions, there have been changes in their
pond hygiene maintenance related behaviors (Figure 2.2.8). These behaviors have significantly
decreased fish diseases and relevant costs (83% and 59% respectively) (Figure 2.2.9). From our
FGDs and IDIs we have found that many PG members are now fencing the fish culture area with
synthetic net. This way the frogs, snakes, and predatory fishes, harmful animals and insects stay
out of that part of the pond.
Fish harvesting and marketing: The study team has observed significant changes in fish
harvesting behavior. Before the project inception, in most cases, farmers used to catch all the
fish in a pond at one go where all the big and small/ young fishes were extracted and sold
together. But, now farmers harvest the fish after a certain period regularly and only catch the
matured ones (throw back the small ones in the pond). Because they now sell only matured fish,
their overall production and sales volume have increased significantly. Additionally, they have
started to use trays for marketing, which ensures that the fish would not be physically damage.
In case of white fish, the PG members who have easier access to collection points or output
markets were found enjoying comparatively higher profit (due to less transportation cost and
increased accessibility). For shrimps, traders usually come to Farmgate (gher owners) and
purchase shrimp from there. These traders are linked with distant large traders and exporters.
SaFaL has been assisting the local fish farmers by linking them with potential buyers from regional
and national markets. The buyers were invited to visit the farms of SaFaL fish farmers. Some
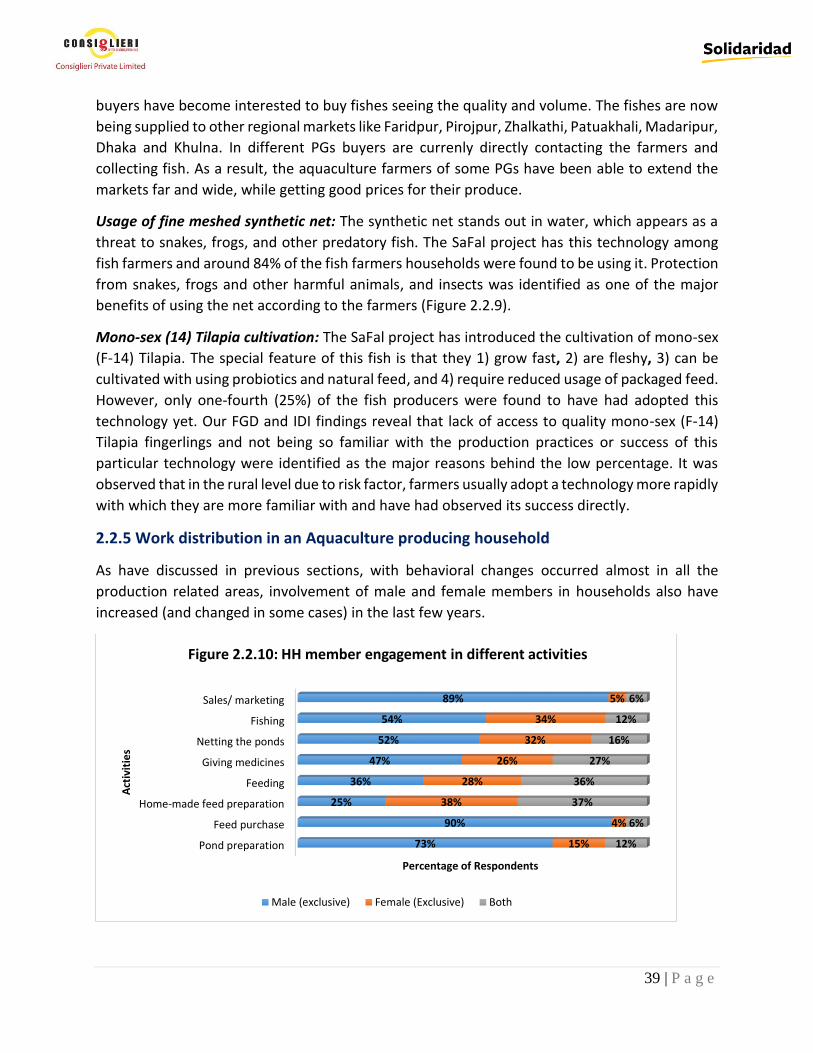
39 | P a g e
buyers have become interested to buy fishes seeing the quality and volume. The fishes are now
being supplied to other regional markets like Faridpur, Pirojpur, Zhalkathi, Patuakhali, Madaripur,
Dhaka and Khulna. In different PGs buyers are currenly directly contacting the farmers and
collecting fish. As a result, the aquaculture farmers of some PGs have been able to extend the
markets far and wide, while getting good prices for their produce.
Usage of fine meshed synthetic net: The synthetic net stands out in water, which appears as a
threat to snakes, frogs, and other predatory fish. The SaFal project has this technology among
fish farmers and around 84% of the fish farmers households were found to be using it. Protection
from snakes, frogs and other harmful animals, and insects was identified as one of the major
benefits of using the net according to the farmers (Figure 2.2.9).
Mono-sex (14) Tilapia cultivation: The SaFal project has introduced the cultivation of mono-sex
(F-14) Tilapia. The special feature of this fish is that they 1) grow fast, 2) are fleshy, 3) can be
cultivated with using probiotics and natural feed, and 4) require reduced usage of packaged feed.
However, only one-fourth (25%) of the fish producers were found to have had adopted this
technology yet. Our FGD and IDI findings reveal that lack of access to quality mono-sex (F-14)
Tilapia fingerlings and not being so familiar with the production practices or success of this
particular technology were identified as the major reasons behind the low percentage. It was
observed that in the rural level due to risk factor, farmers usually adopt a technology more rapidly
with which they are more familiar with and have had observed its success directly.
2.2.5 Work distribution in an Aquaculture producing household
As have discussed in previous sections, with behavioral changes occurred almost in all the
production related areas, involvement of male and female members in households also have
increased (and changed in some cases) in the last few years.
Pond preparation
Feed purchase
Home-made feed preparation
Feeding
Giving medicines
Netting the ponds
Fishing
Sales/ marketing
73%
90%
25%
36%
47%
52%
54%
89%
15%
4%
38%
28%
26%
32%
34%
5%
12%
6%
37%
36%
27%
16%
12%
6%
Percentage of Respondents
Act
ivit
ies
Figure 2.2.10: HH member engagement in different activities
Male (exclusive) Female (Exclusive) Both

40 | P a g e
Figure 2.2.10 depicts a scenario where value chain activity distribution of an aquaculture
household is provided. The three main groups are: male (exclusive), female (exclusive), and both.
The responses have been taken in multiple choice-multiple answers format. As we can see here,
most of the activities are predominantly done by the males of the household. However, we can
see increased percentages of female involvement as well. Except for feed purchase, sales, and
pond preparation, women are contributing almost equally to their male counterparts. In our
qualitative findings, we have found out significant contribution in feeding (38% reported of
female contribution in this activity), homemade feed preparation (38%), applying the medicines
(26%), and fishing (34%).
2.2.6 Production Cost Decrease
Figures 2.2.11 and 2.2.12 illustrate two ranges of cost reduction across various aquaculture
production steps. 2.2.11 shows decreased cost up to 30% and 2.2.12 shows decreased cost from
31-70%. The vertical axis with the percentage signs denote the percentage of farmers responding.
The one without the signs denote the percentage of cost decrease. The columns signify
percentage of cost reduction and the line denote average cost decrease.
In Figures 2.2.11 and 2.2.12, it is apparent that there has been significant cost reduction in areas
including disease management (around half of the respondents reported around 47% cost
reduction), water and soil testing (around 80% of the respondents reported more than 50% cost
decease), and technology use and technical services (almost 50% cost decrease in both cases).
However, few respondents reported cost decrease in areas like feed purchase, fingerling/fry/PL
cost, pond preparation, and fishing. In fact, due to behavioral change and adoption of new
technologies and practices, in most cases farmers now spend more in those areas.
0
10
20
30
40
50
60
H2
O &
so
il te
st
Dis
ease
mgt
.
Tech
. use
Tech
. se
rvic
e
Tran
spo
rt
Lab
or
Har
vest
ing
Fry
cost
Po
nd
pre
p.
Mar
keti
ng
0%10%20%30%40%50%60%70%80%90%
Pe
rce
nta
ge o
f co
st d
ecr
eas
e
Activities
Pe
rce
nta
ge o
f R
esp
on
de
nts
Figure 2.2.12: Areas where production cost decreased by 31 - 70%
Cost reduction (31-70%) (%)
Cost reduction (31-70%) (Average)
0
5
10
15
20
25
30
0%
20%
40%
60%
80%
100%
Feed
co
st
Fry
cost
Po
nd
pre
p.
Mar
keti
ng
Har
vest
ing
Tran
spo
rt
Lab
or
cost
Tech
. se
rvic
e
Tech
no
logy
Dis
ease
mgt
H2
O &
so
il te
st Pe
rce
nta
ge o
f co
st d
ecr
eas
e
Pe
rce
nta
ge o
f R
esp
on
de
nts
Activities
Figure 2.2.11: Areas where production cost decreased by 1 - 30%
Cost reduction (1 - 30%) (%)
Cost reduction (1 - 30%) (Average)

41 | P a g e
2.3 Technology Adoption and Adaptation in Dairy Subsector 2.3.1 Number and Type of Cows
There has been a notable change in
the ownership of hybrid/ cross-
bred cows in producer groups.
Figure 2.3.1.1 illustrates, the
number of hybrid/crossbreed and
local cow that are owned by
farmers. The orange bars illustrate
the percentage of respondents
reporting having
hybrid/crossbreed cows. Likewise,
the blue bars indicate percentage
of respondents reported having
local cows. The result shows that
while 72% of the respondents own at least one cross-bred/ hybrid cow, 54% own at least one
local cow. Very small number of HHs (15%) have 3 or more hybrid/ cross-bred cows. If a farmer
owns 3 or more cows, the data also implies that at least one of the cows of those are
hybrid/crossbred cows.
The result also indicates that a percentage of the respondents might be close to poverty line as
a large number (28%) of them reported of having no hybrid cows. It is also noticeable that hybrid
cows are becoming more acceptable than the local ones among the PG members.
2.3.2 Behavioral changes in adopting cultivation of improved grass
The figure below (2.3.2.1) illustrates what kind of improved green grass they are producing after
project inception. 45% of the surveyed farmers were found to becultivating improved variety of
green grass for their cows. No farmer was found to be producing the Alfa Alfa variety.
Although, more than 50% are not producing green grass, the picture still looks promising,
because previously fewer producers were involved with improved grass production. Previously,
they mostly fed their cows straw and green grass from open fields or common resource pool, as
roughage.
28%
34%
23%
8%
4%
2%
1%
44%
34%
16%
6%
1%
No cow
1 cow
2 cow
3 cow
4 cow
5 cow
6 cow
Percentage of farmersN
um
be
r o
f co
ws
Figure 2.3.1.1: Percentage of respondents reporting number and type of cows they own
Local % of HHs Hybrid/crossbreed % of HHs
>50%
Nepier89%
Jambo11%
Produce improved grass
variety, 45%
Do not produce,
55%
Figure 2.3.2.1 – Percentage of HHs produce improved grass verities
>50%
Figure 2.3.2.1 – Percentage of HHs produce improved grass verities
>50%
Figure 2.3.2.1 – Percentage of HHs produce improved grass varieties

42 | P a g e
Also, there is alsways the scope that non-producers will purchase the surplus grass from the
producers. Farmers are mostly producing Napier (predominant; 89%) and Jambo (11%) varieties.
Improved grass producers have identified a number of benefits and advantages of green grass
production. From FGDs and IDIs we have found that the farmers are quite enthusiastic about
continuing and expanding green grass production in coming days. The following graph (figure
2.3.2.2) shows producers’ experience of green grass production.
Increased availability of green grass
for feeding their cows (88% response)
and increased pregnancy rate (47%)
were identified as the major benefits
they enjoyed.
In FGDs, the participants said that
according to their experience,
improved green grass significantly
increased milk production amount
and fat content. They also said that
from project facilitated training
sessions they became more aware of
the bacteria and diseases that are contained in local field grass. This is another reason that many
of them nowadays are preferring improved grass as their cow feed.
2.3.3 Behavioral changes in perception of homemade feed
There has also been a noteworthy change in homemade feed preparation. Farmers did not use
to know the nutrient amount of different feed ingredients and the proportions for making a
notorious mix for their cows. Project facilitated training sessions have helped them gaining that
knowledge. Currently, almost all the producers are making that at home.
As Figure 2.3.3.1 suggests, most preferred ingredient in preparing homemade feed are oilcake,
molasses, rice bran, and wheat bran. Other ingredients are used infrequently and in small
amounts.
And as figure 2.3.3.2 illustrates, decreased feed costs (73%), ability to feed cow at appropriate
times (67%), decreased disease rate (64%), and decreased transportation cost (31%) were
identified as the major benefits that they enjoyed. They were also found to be the major reasons
for wanting to continue with this practice in future.
Increasedavailabilityfor feedingown cows
Increasedincome
Use ofbaren field
Increasedpregnancy
rate
Improvedhealth
88%
11% 16%
47%
9%
Pe
rce
nta
ge o
f fa
rme
rs
Benefits
Figure 2.3.2.2 – Perentage of farmers reporting benefits from green grass

43 | P a g e
2.3.4 Behavioral Changes in Improved Shed Management
The project also intervened on
improving producers’ cow shed
management practice to sustain cow
health and improve productivity. The
diagram at the right side (Figure
2.3.4.1) is showing the change in
practices among dairy producers
regarding shed management. As we
can see in the diagram, more than two
third of the respondents (71%)
claimed that they have installed well
pit and drainage system for their
cows. Near about half of the survey farmers (47%) now use lime and soda to clean their
cowsheds, while 40% have their sheds open at north and south both sides. Other changes on
shed management like improved and sloped floor (37%), bricked floor, use of mosquito spray,
bleaching powder and so on were also reported by many respondents.
2.3.5 Behavioral changes in disease management
Deworming: Worm attack used to be a major problem for the dairy producers before the project
inception. As they reported, their cows used to be malnourished and sick. They used to produce
low amount of milk before because of frequent attacks. They did not know about the importance
or significance of taking deworming service regularly before. They also did not have the access to
73%
31%
67%
64%
33%
Decreased feed cost
Decreased transport cost
Right time feeding
Decreased disease rate
Increased pregnancy rate
Percentage of Farmers Reported
Be
ne
fits
Figure 2.3.3.2 - Benefits farmers (%) get by feeding homemade feed
47%
27%37%
71%
40%
6%
Lime orsoda
Fire ash Improved& sloped
floor
Pit & welldrainagesystem
Opennorth andsouth side
Other
Pe
rce
nta
ge o
f Fa
rme
rs
Figure 2.3.4.1 - Practices/ Techenologies farmers (%) use
69%
54%41%
21%21%8% 6% 3% 3% 1% 1% 1%
Oil
cake
Mo
lass
es
Ric
e b
ran
Wh
eat
bra
n
DC
P
Min
eral
sal
t
Soyb
ean
oil
Co
con
ut
oil
Mai
ze p
ow
de
r
Smal
l par
ticl
e…
Stra
w
Len
til
Pe
rce
nta
ge o
f R
esp
on
de
nts
Ingredients Used
Figure 2.3.3.1 - Ingredients HHs (%) use to make homemade feed
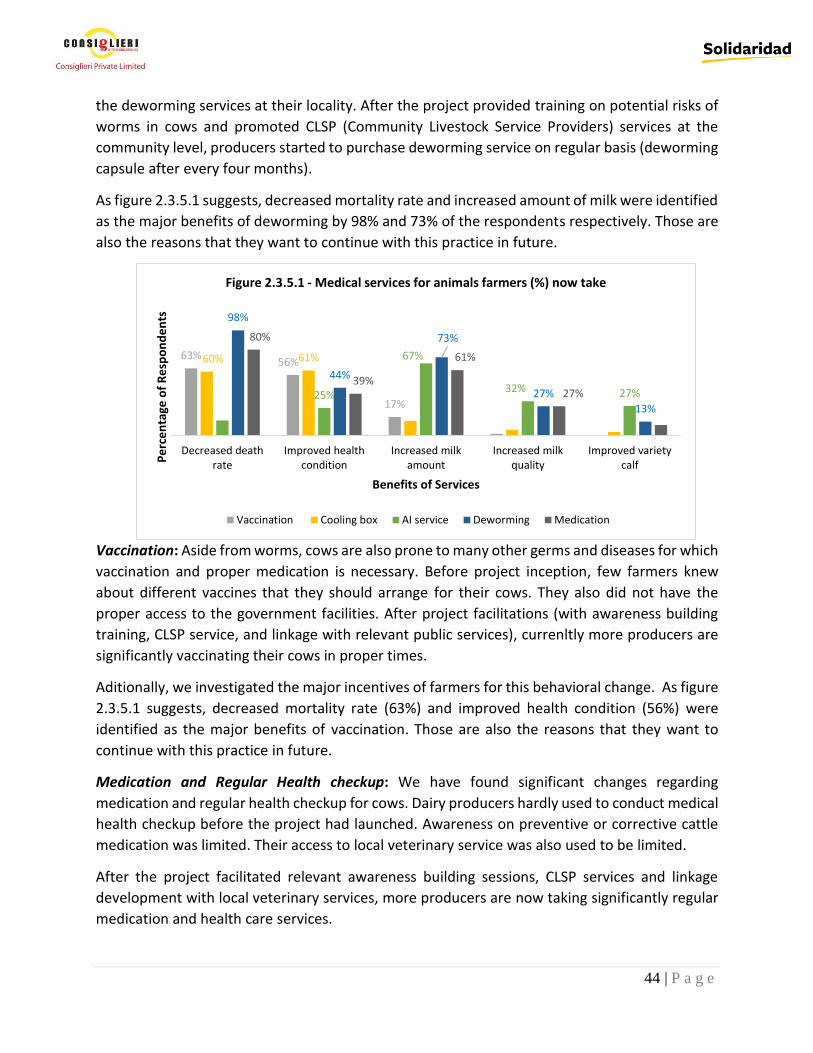
44 | P a g e
the deworming services at their locality. After the project provided training on potential risks of
worms in cows and promoted CLSP (Community Livestock Service Providers) services at the
community level, producers started to purchase deworming service on regular basis (deworming
capsule after every four months).
As figure 2.3.5.1 suggests, decreased mortality rate and increased amount of milk were identified
as the major benefits of deworming by 98% and 73% of the respondents respectively. Those are
also the reasons that they want to continue with this practice in future.
Vaccination: Aside from worms, cows are also prone to many other germs and diseases for which
vaccination and proper medication is necessary. Before project inception, few farmers knew
about different vaccines that they should arrange for their cows. They also did not have the
proper access to the government facilities. After project facilitations (with awareness building
training, CLSP service, and linkage with relevant public services), currenltly more producers are
significantly vaccinating their cows in proper times.
Aditionally, we investigated the major incentives of farmers for this behavioral change. As figure
2.3.5.1 suggests, decreased mortality rate (63%) and improved health condition (56%) were
identified as the major benefits of vaccination. Those are also the reasons that they want to
continue with this practice in future.
Medication and Regular Health checkup: We have found significant changes regarding
medication and regular health checkup for cows. Dairy producers hardly used to conduct medical
health checkup before the project had launched. Awareness on preventive or corrective cattle
medication was limited. Their access to local veterinary service was also used to be limited.
After the project facilitated relevant awareness building sessions, CLSP services and linkage
development with local veterinary services, more producers are now taking significantly regular
medication and health care services.
63%56%
17%
60% 61%
25%
67%
32% 27%
98%
44%
73%
27%
13%
80%
39%
61%
27%
Decreased deathrate
Improved healthcondition
Increased milkamount
Increased milkquality
Improved varietycalf
Pe
rce
nta
ge o
f R
esp
on
de
nts
Benefits of Services
Figure 2.3.5.1 - Medical services for animals farmers (%) now take
Vaccination Cooling box AI service Deworming Medication

45 | P a g e
Promoting the CLSPs has been one of the major driving forces behind this change. From FGDs
and IDIs we have found that they are accessible and cheap and provide quality services.
2.3.6 Behavioral changes in taking Artificial Insemination (AI) service
A cross-bred cow produce more milk and has increased lactation period than that of a local cow.
But, most of the producers previously used to rear local cows. They had limited knowledge on
cross breeding process and limited access to relevant service providers. Therefore, to increase
milk production, Safal promoted artificial insemination technology among PG members. PG
members mostly take this service now from respective upazila’s Department of Livestock [DLS]
office.
However, from FGDs and IDIs, we have found that most of the producers are not satisfied with
existing public cross breeding service (from DLS). They have stated that the DLS do not supply
quality semen as they promise. Additionally, according to them, these cows produce more milk
than local cows, but not as much as a proper cross-bred should produce. Some respondents also
said that this is one of the major reasons for many of them not taking this service yet.
But instead of these constraints, as we saw in figure 2.3.1.1, at present more than 70% of the
producers has at least one cross-bred cow, which has been a significant achievement. Some of
them have purchased cross-bred cow, but most of them used cross breeding service to have
these.
As we can see in Figure2.3.6.1, almost all the respondents have reported increased milk
production and regular milk production as the major benefits they experienced from their cross-
bred cows. Almost 60% respondents also said that the lactation period of their cross-bred cow is
comparatively higher than that of local cows. These are also the reasons that they want to
continue with this practice in future.
59%
80%
32%
15%
2%
12%
3%
1%
1%
7%
2%
Increased lactating time
Regular milk production
Increased milk quality
Increased breeding capability
No benefit
Large sized calves
Increased meat production
Increased birth rate
Increased growth rate
Increased calf quality
Increased selling price
Percentage of Farmers Reported
Be
ne
fits
Figure 2.3.6.1 - Percentage of farmers reporting different benenits of hybrid cattle
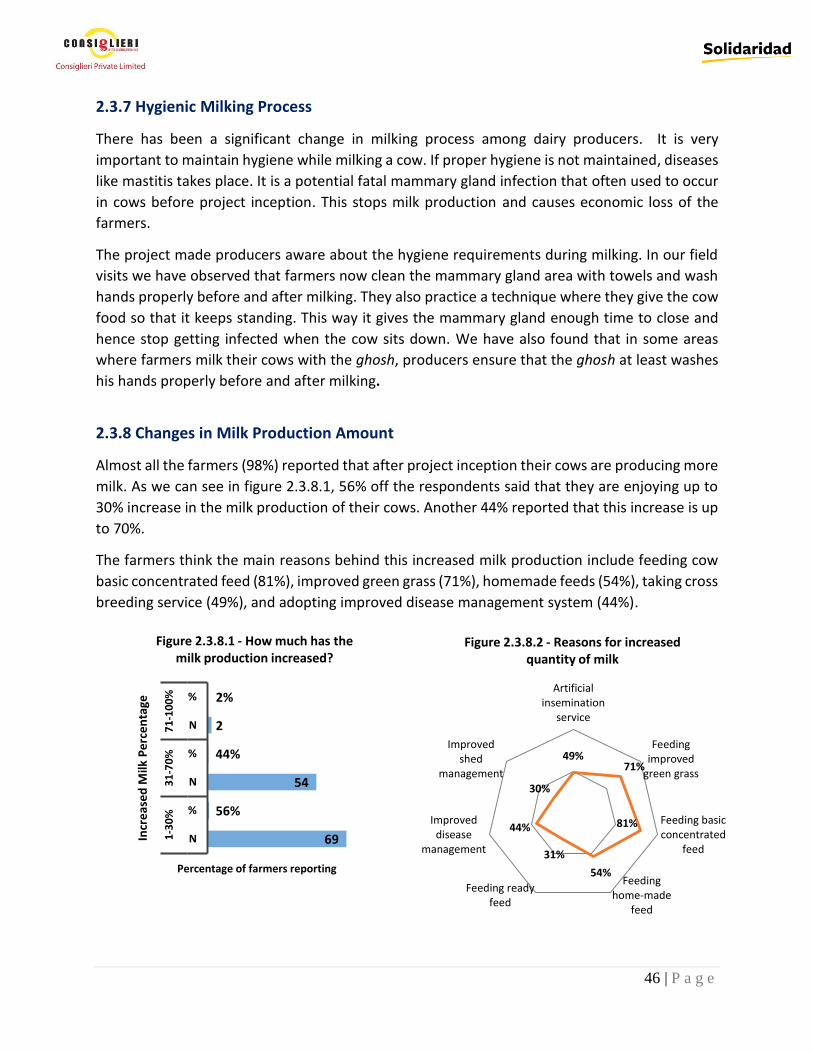
46 | P a g e
2.3.7 Hygienic Milking Process
There has been a significant change in milking process among dairy producers. It is very
important to maintain hygiene while milking a cow. If proper hygiene is not maintained, diseases
like mastitis takes place. It is a potential fatal mammary gland infection that often used to occur
in cows before project inception. This stops milk production and causes economic loss of the
farmers.
The project made producers aware about the hygiene requirements during milking. In our field
visits we have observed that farmers now clean the mammary gland area with towels and wash
hands properly before and after milking. They also practice a technique where they give the cow
food so that it keeps standing. This way it gives the mammary gland enough time to close and
hence stop getting infected when the cow sits down. We have also found that in some areas
where farmers milk their cows with the ghosh, producers ensure that the ghosh at least washes
his hands properly before and after milking.
2.3.8 Changes in Milk Production Amount
Almost all the farmers (98%) reported that after project inception their cows are producing more
milk. As we can see in figure 2.3.8.1, 56% off the respondents said that they are enjoying up to
30% increase in the milk production of their cows. Another 44% reported that this increase is up
to 70%.
The farmers think the main reasons behind this increased milk production include feeding cow
basic concentrated feed (81%), improved green grass (71%), homemade feeds (54%), taking cross
breeding service (49%), and adopting improved disease management system (44%).
69
56%
54
44%
2
2%
N
%
N
%
N
%
1-3
0%
31
-70
%7
1-1
00
%
Percentage of farmers reporting
Incr
eas
ed
Milk
Pe
rce
nta
ge
Figure 2.3.8.1 - How much has the milk production increased?
49%71%
81%
54%
31%
44%
30%
Artificialinsemination
service
Feedingimproved
green grass
Feeding basicconcentrated
feed
Feedinghome-made
feed
Feeding readyfeed
Improveddisease
management
Improvedshed
management
Figure 2.3.8.2 - Reasons for increased quantity of milk

47 | P a g e
2.3.9 Work distribution in Dairy Farming Households
We found that in dairy subsector the female members are more involved in different production
steps than women involvement in other subsectors (horticulture and aquaculture). Figure 2.3.9.1
depicts a scenario where value chain activity distribution of a dairy household is provided. The
three main groups are: male (exclusive), female (exclusive), and both. The responses have been
taken in multiple choice-multiple answers format. As we can see in the bar chart, male members
are predominantly involved only in cow purchase, cow sales, and artificial insemination. On the
other hand, women are mostly involved in all other production steps, including feed preparation,
feeding, shed management, milk sales, and so on.
2.3.10 Other Findings
From our field visits we have also found some practices like use of silage & hay, diversified food,
use of UMS where grass is not available, as cattle feed. Additionally, Manger for 24 hours water
availability, taking care about pregnant & lactating cows to reduce milk fever, using chopping
straw after half an hour wetting in the water for easy digestion were also found in dairy farmers
in the assessment.
Cow purchase
Artificial insemination
Feed preparation
Feeding
Shed management
Disease management
Milking
Selling milk
Cow sale
87%
58%
33%
25%
31%
48%
11%
22%
77%
6%
25%
62%
60%
59%
40%
75%
67%
12%
6%
17%
5%
15%
10%
12%
14%
10%
11%
Percentage of Farmers
Act
ivit
y
Figure 2.3.9.1 - Household involvement in activities
Male (exclusive) Female (exclusive) Both

48 | P a g e
2.4 Technology Adoption vs Adaptation Measures Adapt means to change for a new situation. Adopt usually means to take something legally as your own. Adopt is taking something and accepting it as one’s own. Adoption means choosing and following; as of technologies, new ideas, policies, strategies or plans. On the other hand, adapt is taking something and changing it to suit one’s requirements. Adaptation also refers to the act of altering something to make it suitable for some new practices or behavior. For example, households can adapt their food consumption to the available food resources. We have observed both adoption and adaptation around different project promoted technologies among project beneficiaries and community households or neighbors. We have found that adoption of different technologies by project stakeholders demanded adaptation in different on-farm and off-farm areas. The producers have been enthusiastically taking up those adaptation measures (which at the end paid off their adoption measures). The figure on the right describes this process. Therefore, adoption and adaptation are two sides of a coin. Adoption took places as farmers and other stakeholders adapted to their conventional practices. Some major areas that we have observed are tabulated below.
Adoption of technologies Adaptation Measures
Ho
rtic
ult
ure
- Better use of chemical fertilizers (dosage and usage) - Use of high yielding seed varieties - Use of micronutrients (in cases where there is any deficiency) - Use of bio-fertilizers (vermin compost; conventional compost; quick compost) - Use of improved seed varieties - Better pest management (reduced use of chemical pests; increased use of natural pest management technologies; improved dosage)
- Change in expenditure pattern in chemical fertilizers, bio-fertilizers and pest management technologies - Shifting from own seed varieties (local varieties) to HYV or hybrid seed varieties - Shifting from overwhelming chemical pest usage to natural pest management practices - Using fresh ground or surface water instead of water from closed sources - Using/ managing cow-dung and other biodegradable materials for producing compost

49 | P a g e
Adoption of technologies Adaptation Measures - Better irrigation practice - Improved post-harvest management practice (harvesting; grading; washing; sorting; packaging; transportation; crate usage) - Sales practice (as per buyers’ demand)
- Increased involvement and work-hour allocation in post-harvest processes (especially of women) - Increased expenditure in post-harvest activities, packaging and transportation
Aq
uac
ult
ure
- Better pond/gher preparation practices (dike repairing; bottom plaining; removing predatory fishes; pond drying; weed controlling; etc.) - Use of good quality fish seeds - Improved stocking density - Improved feeding practice - Increased use of probiotics - Water and soil testing - Reduced usage of chemical agents - Usage of fine mesh synthetic net - Improved pond hygiene management practice
- Increased expenditure in pond preparation - Increased expenditure in fish feeds, probiotics, soil/ water testing, synthetic nets - Increased involvement and work-hour allocation in homemade feed preparation, feeding and pond hygiene management (especially of women) - Increased collaboration with the Lead Farmer for access to information and technologies
Dai
ry
- Production of improved green grass - Improved feeding practice (roughage and concentrated feeds) - Improved disease management practices (deworming; vaccination; preventive and curative measures) - Improved use of AI services - Improved shed management practices - Improved milking practices - Improved sales practices (selling according to fat content)
- Increased expenditure on improved green grass production - Increased expenditure on feeding - Increased expenditure in disease management Increased expenditure in shed management - Increased involvement and work-hour allocation in green grass production, homemade feed preparation, feeding, disease management and shed management (especially of women)

50 | P a g e
Chapter Three: Household level social and behavioral
practices related to food security
The findings from the study show quite promising results in terms food consumption behavior,
cooking and hygiene practice. Most of the households were found to be consuming items from
more than four food groups which denotes more than acceptable household dietary diversity in
program groups. Higher proportion of children is consuming four or more food groups which is
an achievement of SaFaL program. Mothers are following recommended feeding practices of
young children, and accessing pregnancy care services which in turn contributing towards
improved nutritional status. Most of the mothers are feeding their children by themselves. In
addition responsive feeding is practiced by majority mothers to adopt optimal feeding behaviors.
Hand washing with soap has become a popular practice among the respondents during five
critical times but physical availability of soap and water at designated hand washing place was
found to be comparatively low. CNVs have been playing a pivotal role in this success.
However, girls and women are still consuming less than the males. This might need to be explored
to address any cultural or social norms related to feeding pattern by female children in the
program.
This section represents a discourse of whether the SaFal project were successful in their
respective zones in terms of nutrition and health.
3.1 Consumption Behavior of Women In terms of nutrition and health, the
project has been more focused on
women, pregnant and lactating women,
adolescent girls, and children. The idea
about focusing on women and children
is that because of our patriarchal
norms. Women generally consume
comparatively the least (if not equal)
amount of food in a household.
Therefore, if it is found that women are
healthy and consuming nutritious food
daily, it suggests that the other
household members are consuming at
least that amount if not more.
Therefore, CPL has looked into the food consumption patterns of women (especially pregnant
and lactating women) to figure out whether there has been any change, especially in terms of
37%
37%
56%
76%
62%
55%
Grains, roots andtubers
Legumes andnuts
Dairy products
Fresh foods
Eggs
Vitamin- a richfoods
Figure: 3.1.1: Percentage of beneficiaries reporting increased/more regular consumption of food

51 | P a g e
consumption pattern of high quality protein and iron rich food every day. Because women go
through certain transitions through their pregnancy period, protein is very crucial for healthy
growth of their babies.
In our survey, all the respondents stated that there has been change in their food consumption
behavior. Figure 3.1.1 illustrates the percentage of beneficiaries reporting increased amount of
a particular food or more regular intake of a particular food. Therefore, in figure 3.1.1 we can see
that more than 50% of the respondents stated that women now eat vitamin A rich food (55%),
eggs (62%), and dairy products (56%) more regularly or in an increased amount.
Previously women used to eat stale food. SaFal has provided them training on harms of
consuming stale food and benefits of fresh food consumption. From the assessment it has
appeared that 76% women now consume fresh food more regularly or in an increased amount.
Also, more women eat iron rich foods, legume and nuts on regular basis or in an increased
amount.
All the respondents have said that they are really happy with their changed consumption
behavior and are happy to continue this.
We explored the reasons behind this change and whether these changes are sustainable. The
study team has found that respondents are happy with this change and keen on keeping on
practicing improved consumption behavior. As most of the households consume food from six
dietary groups, the issue of access and availability to food and their consumption were not found
as serious problems. From out quantitative findings, we have summarized them in the figure
below (figure 3.1.2).
Since eating nutritious food
ensures a healthy mother,
the baby of a well-fed
pregnant and a lactating
woman will automatically
become healthy.
Additionally, since the
mother is healthy, chances
are that the baby will not
be born as malnourished,
which in turn reduces the
possibility of child
mortality. One mixed signal from this graph is, even if it says more than 50% of women believe
this new food behavior has changed improved mothers’ health, only 17% think that it ensures a
healthy family. Therefore, even if the findings provide a clear idea about the reasons regarding
mother and child health, it clearly has some varied indications which implies contradiction.
63%
55%
33%
24%
17%
15%
3%
0%
Improved child health
Improved mother health
Decreased malnourished child birth rate
Decrease child mortality rate
Healthy family
Decreased mother mortality rate
Increased breast milk amount
Makes children more intelligent
Percentage of Respondents
Be
ne
fits
Figure 3.1.2: Outcome of improved consumption Behavior

52 | P a g e
3.2 Consumption Behavior of Children Besides women, SaFal also targeted on improving
health situation of children. Findings on children
consumption behavior are pretty similar with the
one regarding women. It was found that children
are also increasingly consuming fresh food, eggs,
and dairy products on a regular basis. The least
percentage went into grains, roots, and tubers
(Figure 3.2.1). These similar findings between the
mother and children health actually resonates
with the logic that if the mother is healthy, she
tends to feed her kids healthy meals. And as we
will see in the women empowerment section,
females now can make better expenditure
decisions about health of her family now, which is clearly depicted in this picture.
Also, we can interpret from the following table and figure (Figure 3.2.2) that more than 50% of
the children had eaten protein at least twice in the last 24 hours prior to the interviews. Also, as
complementary food, children mostly eat boiled eggs (26%), khichuri (19%), and fruits (12%). Few
respondents reported that their children drink milk though.
3.3 Change in Hygiene Practice Hand washing with soap is an essential individual behavior to protect children from the two
biggest pediatric killers: diarrhea and lower respiratory infection. These diseases kill more than
3.5 million children globally every year. The promoters for hand washing are societal norms,
availability of water, soap, reminders of hand washing during critical time, knowledge and
Percentage of HHs whose children have eaten milk/
fish/ meat/ chicken in last 24 hours
Frequency of Eating
% of HH
0 19%
1 5%
2 32%
3 20%
1 2 3 4 5 6
19%
12%
2%8%
26%
3%
Pe
rce
nta
ge o
f h
ou
seh
old
s re
po
rte
d
Frequency of Eating in last 24 hours
Figure 3.2.2: Complementary food habit of children at present
20% 31%
47%
55%53%
37%
24%
Grains, rootsand tubers
Legumes andnuts
Dairyproducts
Fresh foodsEggs
Vitamin- arich foods
Iron richffoods
Figure: 3.2.1: Current Eating habit of children

53 | P a g e
awareness. These are considered as promoters while absence of any of those might interrupt the
desired behavior on time.
While further analysis was conducted, result presents that 63% of the respondents now wash
their hands with soap after coming from toilet (Figure 3.3.1). Additionally, almost two-thirds of
the respondents (69%) now wash their hands with soap before eating. It was also interesting to
see, that around two-thirds of the respondents reported of women washing their hands before
cooking (62%) and before cutting vegetables (74%). It is visible that change in hygiene behavior
is more apparent among women. CNVs and their awareness sessions played a pivotal role in this
success. This plays a crucial role in terms of setting the premise of a healthy household, because
cleanliness after releasing waste prevents diseases.
We also wanted to know whether there has been any change among households regarding safe
cooking practices. The project trained its beneficiaries about the pre-cooking and post-cooking
measures, to-do’s, and not-to-do’s so that they can follow healthy life choices. We have found
that 66% of the respondents are now washing vegetables, fish, and meat before cooking (which
they did not use do regularly o appropriately before). Another 61% reported that now they cover
the cooking pot during cooking. Almost 50% of the respondents also said that now they use
54%
66%
30%
49%
24%
61%
15%
36%
2%
Cuttingvegetable inlarge pieces
Washingbeforecutting
Cookingfood on lowtemperature
Cookingfood using
properamount ofoil/ spices
Cookingfood beforemeal time
Covering thecooking pot
duringcooking
Half boiling Use more oilin veg
cooking
Putting saltat the endof cooking
Pe
rce
nta
ge o
f R
esp
on
de
nts
Improved Cooking Practices
Figure 3.3.2: Percentages of respondents adopted improved cooking practices
62%
69%
74%
63%
Washing hands with soap before cooking
Washing hands with soap before eating & serving foods
Washing hands with soap before cutting vegetables
Washing hands with soap after defecation
Percentage of Beneficiaries Responded
Figure 3.3.1: Percentage of Beneficiaries Practicing Different Hygeinic Routine

54 | P a g e
proper amount of oil and spices in their food (which was usually comparatively less before). Now
they cut vegetables in large pieces (54%) and use more oil during cooking vegetables (36%).
Around one-third of the respondents also reported that now they cook in lower temperature and
before meal time. Before, they usually used to cook once in a day which used to become stale
during the second or third meal).
3.4 Impact of SaFal’s Health and Nutrition program with Children SaFal introduced a health and nutrition
program for the children which teaches
them about different aspects of
personal hygiene, cleanliness, and food
consumption behavior. This program
ensures that the next generation knows
about nutrition and hygiene
requirements and how to take care of
themselves. As we can see in Figure
3.4.1, only 29% took part in the program
until the survey was conducted. Since
the participation rate is not that high by
to date, the impact of this program against the indicators is not that high either (Figure 3.4.2).
However, interestingly, some respondents stated that children who participated in those
sessions are now more aware and keen about regular health checkups (17%) and washing hands
(16%). Therefore, if SaFal can engage more children in this program, there is a great potential for
the next generation to be more aware of health, nutrition, and cleanliness.
29%
57%
14%
Figure 3.4.1: Percentage of HHs whose children participated in SaFaL's health & nutrition program
Participated in Did not participate in No children
9%
9%
11%
16%
10%
4%
17%
5%
5%
11%
4%
9%
0%
Eating vitamin rich food
Increased awareness about health
Eating nutritious food
Washing hand with soap
Eating vegetables
Eating iodine/protein rich food
Regular health check up
Cooking vegetables while not destroying vitamins
Using sanitary latrine
Increased awareness against child marriage
Taking extra care on children food
Decrease disease
Don’t know
Percentage of Respondents
Figure 3.4.2: Impact of health & nutrition program on families

55 | P a g e
Chapter Four: Status of women in agricultural production and
their empowerment in household and society level
4.1 Qualitative Research (FGD and IDI) Findings Assessing women’s empowerment and intra-household and intra-PG gender dynamics has been
an important objective of this study. This section discusses different aspects in these areas.
We have found that cooking was by far the most prioritized task conducted by women in all areas
followed by cleaning, child care, and other PG related tasks. The important finding here is that
the respective PG-related tasks do not get priority over other usual household chores like
cooking, cleaning and child care. Nonetheless, women are heavily engaged in activities related to
enterprises. Remarkably, they do not label them as economic activities, but rather term them as
regular household chores.
Decision Making and Women’s Empowerment
In the qualitative study part, we have assessed different aspects of women’s empowerment, e.g.,
decision making authority, getting help, respect, and support from the family members, control
of savings, and so forth. We have found that most of the women reported to have the decision-
making authorities regarding daily cooking, children’s education and rearing. In case of taking
decision about children’s education most of them consult with their husbands. However, in most
of the households both husband and wife can discuss on the serious family issues with women.
Decision Influencing Capability
Reasons behind these positive changes can be attributed to the participation in the SaFaL project
which in turn has brought money to the household and the women and made noteworthy
differences. They can give money to their children to buy some food while in the school. They
can also buy simple necessities of the households when husbands are away.
Though their income and overall decision-making authority and mobility have increased and that
increase has been attributed to SaFaL, the land and property ownership of women has not
increased that much. Ownership of properties or land is a big issue and it would take quite some
time to see any impact in this regard.
Women were found quite comfortable going to the local markets but most of them have to take
permission before going to these places. This is an aspect which cannot be changed overnight. In
the patriarchal society, it is a norm that the women take permission before going to other places.
Nevertheless, changes are happening and the women in program areas have been progressing
slowly but steadily. In most program areas, women can go alone to local market, upazila sadar
market, and Upazila Health Complex on their own.

56 | P a g e
PG Involvements
In our qualitative part of the study, it was found that dairy PG respondents are more satisfied
with their participation in the PG activities. Not surprisingly, women were found to be more
influential members than the males in most dairy PGs, whereas few aquaculture PGs had them.
The cause behind this less number of female members in the aquaculture PGs as stated by
different stakeholders is that the aquaculture enterprises (ponds/ghers) are far away from the
households. It is not suitable for women to take care of fishes on regular basis (except preparing
home-made fish feed). But, this assertion might not be true as we observed that many women
were working in fish ponds. Another reason for such low participation of women in aquaculture
PGs is that these PGs consist of those farmers who own at least 10 decimal of the land.
On the other hand, horticulture PGs have got almost equal participation from male and female.
Also, since women are mainly engaged in household activities majority of them are directly
involved in livestock of the households. Therefore, the dairy PGs are mainly composed of female
members.
Also, in different PG activities (e.g., group meetings) women showed remarkable performance.
Female members are very regular in those group meeting and sessions.
Though in some areas it was found that both male and female were active participants in PG
meetings the male members had major role in decision making in the PG in most cases. However,
as women members are most in number in dairy and horticulture PGs, women’s contributions
are observed most in these PGs. Women’s participation in supply chain is very low though. In
dairy PG households, women are more involved in sales but that is because they can sell their
products from their household/farm. They do not have to go to the market places to sell the
products.
4.2 Survey Findings
4.2.1 Women Involvement and Decision Making Capabilities in Horticulture
As we can see in figure 4.2.1.1, women in horticulture PGs are now more involved in post-harvest
activities (88%) and harvesting (70%). The qualitative data also suggests that women are
extensively involved in shading, washing, grading, and packing the produces after they are
harvested from the farm land. 68% of the respondents said that women involvement in sales is
growing, which is a crucial factor in terms of female empowerment. Other areas where
involvement increased include weeding (70%), irrigation (62%), and fertilization (63%). In case of
harvesting, weeding, irrigation, and fertilization, women involvement is more apparent in
comparatively smaller farms and less in commercial farms.
However, increased women involvement does not always indicate increased women
empowerment always, as there might be an overall increase of farm activities due to project

57 | P a g e
interventions which might have also increased women involvement (alike male involvement in
parallel) in different production processes.
Figure 4.2.1.2 describes the percentage of women being able to make decisions on their own in
certain areas in the horticulture value chain. We can see that in most of the areas, women’s
contribution in making decisions have increased, including decisions about food purchase for
household members and children (89%), measures on taking care of herself and her children
(97%), and savings (amount and frequency) (93%).
The reason for change in both aspects is pretty apparent. As we have found in our qualitative
study part, increased money gave women more to spend on those areas and also a stronger voice
in relevant family issues.
However, some not-so-improved areas for women’s decision making capability include input
purchase, output sales, input usage, and decisions on fish cultivation technologies. As we have
found in our FGDs and IDIs, although women are quite comfortable going to the local markets,
most of them have to take permission before going to these places. This is an aspect which cannot
be changed overnight.
78%
79%
67%
66%
93%
71%
97%
89%
22%21%
33%
33%7%29%
3%
11%
Investment decisions
Input purchase
Production technologies
Inputs usage and dosage
Saving decisions
Sales
Personal and Childrens take care
Bought food for memebers and children
Figure: 4.2.1.2: Decision Making Areas For Women in Horticulture PG
Increased contribution Same as before

58 | P a g e
4.2.2 Women Involvement and Decision Making Capabilities in Aquaculture
As Figure 4.2.2.2 suggests, women’s decision taking capability increased in some areas like
decisions about food purchase for household members and children (85%), measures on taking
care of herself and her children (89%) and savings (amount and frequency) (82%).
4.2.3 Women Involvement and Decision Making Capabilities in Dairy
Since women are mainly engaged in household activities, majority of them are directly involved
in maintaining livestock of the households. Therefore, dairy PGs were formed mainly with female
members. Their involvement and contribution were found to be increased in PG groups in the
last few years after project inception.
0%
20%
40%
60%
80%
100%Investment decisions
Input purchase
Production technologies
Inputs usage and dosage
Saving decisions
Sales
Taking care of family
Buying food for family
Figure: 4.2.2.2: Decision Making Areas For Women in Aquaculture PG
Increased involvement Same as before
0%20%40%60%
80%100%
Figure 4.2.3.1: Women involvement in different dairy production processes
Increased involvement % Same as before/Never got involved %

59 | P a g e
The above figure depicts the active involvement area of women as an influence of project. The
team asked the beneficiaries directly if they thought women involvement has increased,
decreased, or remained same as before across different activities of dairy farming. The result
shows that in every area women involvement has increased in varied ways based on districts
features, dynamics, and characteristics. The data shows that women involvement in dairy PGs
has increased more than in other sub sectoral groups. The result significantly indicates that
women are actively involved in milk sales (85%), but that is because they can sell their products
from their household/farm; they do not have to go to the market places to sell the products).
Areas like feeding (82%), milking (74%), and feed preparation (70%) also have respondents who
think women involvement has increased.
However, our qualitative (IDIs and FGDs) and survey findings conflict here in case of feed
purchase, cow purchase, and artificial insemination (AI). In our FGDs and IDIs we have found that
these activities are still mostly handled by male household members. We have also found that
women participation is highly concentrated in household areas. When it comes to Activities like
cross breeding or cow purchase, they require mobility-which is still is difficult thing to manage
for women. Arguably, each community has its own character and feature, which might influence
the involvement of women in this area.
Reasons behind these positive changes can be attributed to increased money flow from milk sales
which is mostly controlled by women (unlike other subsectors where male members mostly
control the sales). In terms of financial decision, now they can spend some of their income on
their children’s education. They can also buy simple necessities of the households when the
husbands are away.

60 | P a g e
Chapter Five: Sales, Finance and Saving Situation
5.1 Sales Situation 5.1.1 Sales Situation in Horticulture Subsector
Selling and Consumption Behavior of Vegetable Farmers
We have assessed how much the horticulture
farmers consume by themselves and how much they
sell. As figure 5.1.1.1 illustrates, 46% of the
respondents claimed that they sell more than 80% of
their produce.
Major vegetables Sales Channels
As figure 5.1.1.2 suggests, 70% of the respondents
sell to local arotdars. Another 53% reported that they
sell through collection points. From FGDs and IDIs,
we have learned that producers can sell through
collection points only in the communities where
Safal established collection centers.
46% respondents said that they sell their produce to
distant traders. From qualitative study part, we have
learned that in bazaar days many distant traders
come to the moderately big and large haats.
Producers try to sell their vegetables to them on
those days as they get comparatively higher price.
Only 21% stated that they sell directly to Farias (who
come to farm-gate), which, according to them, were quite high even before project inception,
when they had limited linkage with forward market channels.
Producers who sell through collection points said that better price (85%), cash sales option (73%),
guaranteed sales (65%), and less transaction time (60%) are the major benefits that they get from
using this channel. Producers who sell to local traders are usually the ones who cannot sell their
produce through collection centers (as no collection centers has been established in those areas
yet) and therefore sell produce to local traders at nearby haats/ bazaars instead. Low transaction
time and cash sales were the major benefits identified by the respondents.
37%
21%
70%
46%
53%
Neighbor
Foria/middleme
n
Localarotders
Distantarotders/
traders
Collectioncenter
Figure 5.1.1.2: Sales channel
11%
46% 43%
70-80% 81-90% 91-100%Pe
rce
nta
ge o
f H
ort
i Fa
rme
rs
Sales Percentage
Figure 5.1.1.1: Sales ratio

61 | P a g e
Collective Sales Practice of Vegetable farmers
Only 25% of the respondents told that they sell vegetables
collectively. Better price was identified the major reason
(100% response rate) behind collective sales practice.
Because many producers sell their produce through project
promoted collection center or vegetables sellers, they do not
have to sell collectively for better price. Collective sales
practice was observed mostly in areas where these facilities/
services were not that active.
5.1.2 Sales Situation in Aquaculture Subsector
Selling and Consumption behavior of Fish farmers
67%
24%
4% 3% 3%4%
24%
67%
9790 85 80
20 1510
3 0
20
40
60
80
100
120
0%
10%
20%
30%
40%
50%
60%
70%
80%
95-99% 90-94% 85-89% 80-84% 16-20% 11-15% 5-10% 1-5%
Sold Consumed
Pe
rce
nta
ge o
f R
esp
on
de
nts
Pe
rce
nta
ge o
f R
esp
on
de
nts
Figure 5.1.2.1 - Amound of fish farming HHs(%) sell and consume
% of HHs Average amount
%25%
%75%
Figure 5.1.1.4: Colletive Sales Behavior
57%
54%
29%
7%
7%
11%
4%
44%
56%
25%
25%
31%
19%
6%
45%
21%
42%
40%
45%
6%
17%
71%
54%
43%
6%
60%
5%
85%
65%
73%
13%
3%
Less transaction time and cost
More convenient for HH members/women
Better price
Guaranteed sales
Cash sales
Other benefits
NO BENEFITS
Percentage of Farmers Reported
Neighbor
Foria/ middlemen
Local arotders
Distant arotders/ traders
Collection center
Figure 5.1.1.3: Benefits of using different channels

62 | P a g e
We have also assessed how much of aquaculture farmers consume by themselves and how much
they sell. As illustrated in the figure 5.1.2.1, around 90% of the respondents have claimed that
they sell more than 90% of their fish that they produce. The orange - yellow line in the above
diagram shows the average portion farmers sell and consume. It is important to note that
farmer’s consumption portion includes their self-family consumption, gifting to neighbors and
relatives, rotten fish etc.
Major Fish Sales Channels
As figure 5.1.2.2 suggests, while 39% of the respondents sell their fish to local arotdars, 36% sell
fish to distant arotders. From IDIs and FGDs we have found that shrimps are usually sold to the
distant arotders who come to the local haats or at farm-gate to purchase fish directly from gher.
White fish (fin fishes) is usually sold to the local arotders. Only 10% of the respondents reported
that they sell fish through collection centers. Like vegetables sales, popularizing fish sales through
collection centers is another area where the project should work on in future.
Producers who sell through distant traders said that better price (70%), cash sales option (70%),
and guaranteed sales (79%) are the major benefits that they get from using this channel. On the
other hand, producers who sell to local traders said that guaranteed sales (64%), cash sales (51%),
and less transaction time and cost (45%) are the major incentives for selling fish local arotders.
45%36%
45%
24%
68%
36%
51%
70%
39%
52%
64%
79%
42%
30%39%
70%
47%
63%
37%
0%
Neighbor Faria LocalArotdar/retailer
Distantarotdar
SAFALcollection
centerPe
rce
nta
ge o
f R
esp
on
de
nts
Figure 5.1.2.3 - benefits of using different channels
Reduced transaction time & cost Convenient for female membersBetter price Guaranteed saleCash sale Use of digital machineAppropriate sorting & grading
Neighbor, 6%
Faria, 9%
Local Arotdar/ retailer, 39%
Distant arotdar36%
SAFAL collection
center, 10%
Figure 5.1.2.2 - Sales channel

63 | P a g e
5.1.3 Sales Situation in Dairy Subsector
Selling and Consumption behavior of dairy farmers
We have assessed how much milk the dairy farmers consume
by themselves (and their families) and how much they sell. As
illustrated in figure 5.1.3.1, 67% of the respondents claimed
that they sell more than 70% of the milk they produce daily.
Around one-third of the respondents said that they consume
on an average of 36% to 70%.
Usually, the cross-bred cows produce more milk as compared
to that of local ones. Therefore, producers with cross-bred
cows usually can spare comparatively more share for self/
household consumption.
Milk Sales Channels
From our FGDs and IDIs, we got the impression that they mostly sell their milk to local sweet
shops or to collectors (there was multiple response option).
From the survey we have found that 44% sell milk
to collectors and retailers and 21% to sweetshops
and local bazaars. Only 2% have the access to the
collection points where they sold milk. From
FGDs and IDIs we have found that number of
chilling points is small and few community
members have access to those, although they
provide the best market price.
We wanted to know why they are selling milk to
any particular output market channel. We have
found that most of the respondents (61%) are
selling milk to their neighbors because it is
convenient for them and saves their
transportation time and cost. As we saw in
section 2.3.9, it is women who are mostly
involved in milk sales. But because they have
limited scope of mobility in this social context, that might be a reason that most of the milk they
are selling is to their neighbors, although the market price is comparatively low there (Figure
5.1.3.3).
2%
30%
67%
0-35% 36-70% 71-100%
Pe
rce
nta
ge o
f R
esp
on
de
nts
Sales Percentage
Figure 5.1.3.1: percentage of farmers selling milk
16%
13%
44%
21%
2%
1%
21%
Neighbor
Foria/ middlemen
Collector/retailer
Local bazaar/ sweetshop
Collection Centre
Van driver
Chilling point
Other
Figure 5.1.3.2: Milk sales channels

64 | P a g e
Those who are selling milk to collectors said that better price, guaranteed sales, and cash sales
are the major benefits they have enjoyed from their transaction with them. In case of selling to
the sweetshops, they said that it reduces their transportation time and cost. Also this option is
more convenient for the women as ghosh (agents of sweetshops) come to their home for milking
and milk collection (Figure 5.1.3.3).
Figure 5.1.3.3: Benefits of using different channels reported by the aquaculture farmers
5.2 Finance and Savings Situation Investment is the key to grow any business or farm. In order to
invest money in any business, a producer either needs to have that
amount of money or should have access to appropriate financial
services which offer appropriate financial product according to
his/ her needs (amount; interest rate; collateral conditions;
payment period and other modalities). Advantages like better
knowledge of production practices, access to agro services, access
to output market can be counter-balanced if there is lack of access
to financial services. Since
inception, SaFal has been trying
to establish a linkage between
its PG members and different
financial service providers.
We have found that almost 50%
of the respondents reported
that they have access to MFIs,
but do not have access to the
appropriate financial product
that they need (that offers the right interest rate and installment system) (Figure 5.4.1). Figure
Yes52%
No48%
Yes No
Figure 5.2.1: % of Respondents have access to appropriate financial services
55%65%
23%9% 5% 3%
38%
63%
31% 31% 31%
64%
65%
25%47%
15%4%
33% 33%
37%
26%41%
7%
100% 100% 100% 100% 100%
65%
88%
4%
35%
8% 4%
Less transactiontime and cost
More convenientfor HH members/
women
Better price Guaranteed sales Cash sales Other benefits
Pe
rce
nta
ge o
f R
esp
on
de
nts
Benefits
Neighbor Foria/ middlemen Collector/retailer Local bazaar/ sweetshop
Collection Centre Chilling point Other
24%
62%
13%5%
13%8% 11%
Banks, govt.project/
dept.
MFIs andNGOs
Chilling mill Localarotdar,traders
Localmoneylenders
Local inputsellers
Don nottake any
loanPe
rce
nta
ge o
f re
spo
nd
en
ts
Sources
Figure 5.2.2: Categories of financial servics sources

65 | P a g e
5.4.2 illustrates different categories of financial services that the respondents presently have
access to. As we can see, altogether almost 90% of the respondents take loans from MFIs (62%)
and public and commercial banks (24%).
The CPL team has also tried to categorize the sources of the credit or loan in terms of most usage.
According to the respondents who said yes to the availability of financial assistance, 62% of them
said that MFIs and NGOs help them the most in terms of it. 11% of them said they do not take
any loans from anyone. The second most use resource in terms of financial aid is banks and
government projects (24%).
5.2.1 How much do they save?
In any economy, individuals have two ways to use income: spending or saving. Saving is the
setting aside of income for future use and is undertaken by both individuals and institutions.
Investment, therefore, is primarily the activity of businesses and is a way of using the money that
comes from saving. The act of investing uses resources that have been freed from current
consumption to develop goods or assets that will produce earnings or add to production in the
future.
Savings theories traditionally predict that current consumption is related not to current income,
but to a longer-term estimate of income. The life-cycle hypothesis (Modigliani 1966)2 predicts
that individuals hold their consumption constant over their lifetime; they save during their
working years and draw down their savings during retirement. One implication of the life-cycle
hypothesis is that a program such as social security, which supplements income for retirement,
will reduce saving by workers since they no longer need to save as much for retirement. The
permanent income hypothesis (Friedman 1954)3 argues that consumption is proportional to a
consumer’s estimate of permanent income. The permanent-income theory implies that
consumers do not respond equally to all income changes. If a particular change in income appears
to be permanent, people are likely to consume a large fraction of the increase in income and
hence, save less.
We have also investigated how much our respondents saved last year and this year. We believe
that this comparison will help the client understand about change in producers’ savings behavior.
As we can see from the figure 5.2.2.1, most of the people saved around BDT 21000-50000 last
year and this year. However, the rate of saving this amount have decreased to 37% from 40% last
year. 10% more respondents saved BDT 55,000 to BDT 100,000 this year. Also, while 11% of the
respondents said that BDT 100,000 to BDT 500,000 this year, only 6% respondents saved that
amount last year.
2 http://www.ppge.ufrgs.br/giacomo/arquivos/eco02273/The_life.pdf 3 http://www.ifs.org.uk/wps/wp0401.pdf

66 | P a g e
5.2.3 Where do they save?
Recently lots of financial institutions have been established so that the farmers can save and get
loan without any hassle. There are many organizations which assist the farmers in saving their
cash or assets. Regardless of the promotion of these financial institutions, 66% of the sample
beneficiaries said they opt out for personal savings.
The second most used infrastructure in case of saving money was found to be the banks. 33% of
them now save money in the bank most because of the interest they accumulate over their
deposits over the years.
Ekti Bari Ekti Khamar (One House One Farm (OHOF)) has been a widely popular poverty
alleviation program in rural areas run by the government of Bangladesh. The goal of the project
is poverty alleviation through e-financial inclusion (i.e. fund mobilization) followed by family
farming livelihood and income generation of the under privileged and smallholders of the
country. Only 1% of the sample beneficiaries were found saving in this e-financial platform.
9%
11%
14%
8%
17%
10%
40%
37%
13%
23%
6%
11%
% o
f HH
s, last year%
of H
Hs, th
is year
Figure 5.2.1.1: Saving Patterns in HHs
500,000 -1500,000 100,000 -500,000 55,000 -100,000 21,000 -50,000 11,000 -20,000 1000 -10,000 0

67 | P a g e
5.2.4 Has there been any increase in their assets?
Table: Percentage of Farmers whose assets increased
Percentage of HHs who have increased assets
Yes No
90% 10%
The savings patterns have reflected on their assets as well. It turns out that 90% of the sample
beneficiaries have increased their assets. Out of them 30% stated that they have purchased more
livestock (cattle and poultry). By investing in cow and poultry purchase, they have also increased
their regular earnings (with milk and egg supply). Second largest kind of asset is cash, which
accounts for 29% of the sample beneficiaries. As we found in our qualitative data, most of the
transactions are held in cash, and therefore, it is normal to have a large amount of cash as savings.
For example, in aquaculture PG groups, most of the fish farmers purchase fish seeds and fish
feeds and sell fish in cash.
Land, 16%
House, 16%
Livestock -Cattle/
Poultry, 30%
Production tools, 6%Cash, 29%
Gold, 2%
Furniture 1%
Figure 5..2.4.1: % of HH have increased assets

68 | P a g e
Chapter Six:
Local Service Producers: Agents for Community Level
Behavioral Change
SaFal project developed small entrepreneurs and skill laborers in the targeted sectors in order to
trigger change across households and communities. These service providers include Lead farmers
(LF), Community Nutrition Volunteer (CNV), Vegetables Collector or Seller, Community Livestock
Service Provider (CLSP), milk transportation van, fish feed processor, vermi-compost producer,
agro-input shops, agro-machinery maintenance service provider, vegetable transporter, mobile
input seller, and so forth. A list of project promoted service providers and skilled laborers are
tabulated below.
Table 6.1: Types of entrepreneurs and skill labor developed by SaFaL
Type of Entrepreneurs/ Enterprises/ Skill laborers
Lead Farmer (LF)
Cool Vans for transportation (Fish)
Milk Transportation Van (Dairy)
Collectors and Sellers (Horticulture)
Organic Fertilizer/ Vermi-compost producer
Homemade fish feed production/ producer
Agro Input shop
Fodder and silage preparation
Development of Mobile Agro-Inputs Sellers
Small input sellers in Hat bazar
Nursery development (Horticulture)
Vegetables production van for horticulture
Community Livestock Service Provider (CLSP)
Agro-machinery maintenance
Fish Processing (post-harvest handling, grading, packaging)
Skill development as agricultural labor
It was found in this study that these service providers have been instrumental in bringing positive
changes in farmer’s behavior, private sector transactions, business modalities, market
governance, and most importantly, spreading or disseminating good practices among
neighboring farmers. We have found that PG members who have access to different relevant
service providers, have better market information, and better knowledge about market demand
and price. Also, they are producing according to market requirements and are getting
comparatively better price for their products.
Key contributions and characteristics of some major service providers are discussed below.

69 | P a g e
6.1 Lead farmer The beneficiaries were found to get different types of services from the lead farmers depending
on the sectors. The table below shows which types of services producers have taken the most
and the least from LFs. We found that producers mostly received services from lead farmers in
areas like updating record books (91%), access to quality inputs (81%), technical support on farm
management (81%), developing business plans (68%) and assistance on conducting EC meeting
(67%).
Table 6.1.1: Type of Service received by producers from Lead Farmers
Service Type Received Services Have not received
services
Supporting in demo plotting/piloting 23% 77%
Updating record book 91% 9%
Assisting in developing business plan 68% 32%
Water & soil testing service 33% 67%
Linkage with private & public bodies 51% 49%
Access to quality inputs 81% 19%
Technical support on farm management 81% 19%
Sales intermediary service 21% 79%
Assistance on conducting EC meeting in PG 67% 33%
In case of benefits that producers enjoyed from LF services, most of the producers stated that
they received improved information from lead farmers on different aspects including production
and farm management technologies and practices, output and input market linkage, access to
quality inputs, and so on.
Table 6.1.2: Benefits of LF services to farmers
Activities
Production cost
decreased due to LF services
Received information
service
Increased production due to LF services
Improved crop/ cow/ fish health due to LF services
Enhanced linkage service (input
and output market)
Supporting in demo plotting/piloting
33% 86% 5% 5% 2%
Updating record book 7% 20% 7% 4% 10%
Assisting in developing business plan
51% 71% 28% 7% 10%
Water & soil testing service 16% 100% 31% 16% 11%
Linkage with private & public bodies
12% 57% 20% 14% 13%

70 | P a g e
Ensuring availability of quality inputs
25% 76% 25% 11% 13%
Technical support on farm management
45% 100% 31% 15% 4%
Sales intermediary service 23% 21% 21% 5% 13%
Assisting for conducting EC meeting in PG
17% 43% 22% 10% 7%
Among all the actors that SaFal project introduced, Lear farmers (LFs) were found to be the most
influential catalyst for group mobilization, technology adaptation and the resulting behavioral
changes. Each producer group has a lead farmer who manages the group, receives capacity
building training from the projects, organizes learning sessions, and disseminates the knowledge
to PG members. He also provides relevant services, links local service providers with PG
members, provides information service when needed, and overall works as a change agent in the
community. The group members elect one of them as their own lead farmer.
From our qualitative analysis in the project area, we have observed some interesting phenomena
which make some LFs successful (as per project objectives) and some not. In the following
Lead farmer
Seeks social respect and/
or power
Socially Respected
(Has social credibility)
People's person
(Neighborly; approchable;
communicative)
A Leader
(Has qualities like integrity,
confidence and transparency)
Moderately solvent
Has business incentives
(has own business or plan for future
business venture and wants to leverage
benefits from social relations)
Knowledgeable on
production practices
Figure 6.1.1: Profile of a Successful Lead Farmer

71 | P a g e
paragraphs, we have reasoned some qualities that a lead farmer should have to be a change
maker in the PG or community. Figure 6.1.1 shows some essential characteristics of a successful
LF. Not necessarily a LF should possess all these qualities, but according to our observation, in
most cases we have found that prominent lead farmers have at least several of these
characteristics, if not all.
As the diagram above illustrates (Figure 6.1.1), effective LFs are usually socially respected and
have social credibility. Community people usually like them and they are quite neighborly or
friendly, approachable and communicative in their nature. We have also found leadership as a
common quality in many LFs. In many cases LFs are driven by social incentives where they seek
out for social respect and/ or power (some also have political incentives, like want to become a
part of the local government in near future). We similarly found that LFs who have input or similar
business are working enthusiastically with farmers so that their customer or client base increase
(direct incentive to their business). Also, lead farmers are usually more knowledgeable on
production practices and have better linkage to service and regulatory market actors. Moreover,
most of the lead farmers we interviewed or observed were moderately solvent. In most cases,
they do not have to invest all their time in their own business/ production and thus can spend
those extra hours for producer group development purpose.
Existence of these qualities has made the lead farmers more credible, approachable and
accessible to farmers. These attributes have made him/ her a better leader, effective information
service provider, community/ group mobilizer and more importantly, an important change maker
in the project design.
LFs who can leverage their popularity and access to community farmers in their own businesses
in coming days, or have enough incentives to continue their services, would undoubtedly be
more sustainable actors in the market system.
6.2 CLSP (Community Livestock Service Provider) A CLSP (Community Livestock Service Provider) is a project trained vet who provides different
sorts of vet services to dairy producers including vaccination, deworming, preventive medication,
corrective/ restorative medication, and so on. Project trained them to provide the necessary
veterinary services to dairy producers so that farm productivity and producer income increases.
Simultaneously, CLSPs will enjoy enough monetary incentives from their services so that they
continue and expand their business in coming days.
From our qualitative analysis in the project area, we have found that while some CLSPs have been
doing quite well (moderate to high monthly income; increasing business coverage and customer
number), some have been suffering from lower income and low client number. In the following
diagram, we have reasoned some qualities that a CLSP should have to be successful and
sustainable in the project promoted market and social system. Not necessarily a CLSP should

72 | P a g e
possess all these qualities, but according to our observation, in most cases we found that
promising CLSPs have at least several of these characteristics, if not all.
As the diagram beside illustrates (Figure 6.2.1), promising CLSPs usually are well-trained (received
training with integrity), literate (at least up to HSC level), neighborly, approachable and
communicative, and spontaneously
goes door to door (dairy producers’
households) for customary visits.
Most importantly, they charge for
their services and have a plan or
strategy to expand their business.
On the other hand, CLSPs who
lacked business incentives or a
proper strategy for their business
and had not started taking
appropriate charge for their
services yet, are not supposed to
sustain in the market system and be
a change maker.
6.3 Vegetable Collector or Seller Vegetable collectors or sellers purchase the produce from the farmers and then sell those to the
next actor in the value chain (big or distant traders, large or institutional buyers). They enjoy a
commission from their sales. SaFal created this intermediary in order to link horticulture farmers
with the output market so that their income increases.
It was found in this study that vegetable collectors have been instrumental in bringing positive
changes in horticulture production and management related behaviors, their business modalities
with different market actors and promoting copying-in phenomenon among neighboring
farmers.
For example, from our FGDs and IDIs we have found that between two similar horticulture PG
groups (in both cases members of these two groups received same training, have energetic lead
farmers, have access to quality inputs, pest management and post-harvest services), PG
members who have access to a functioning vegetable seller who is linked with large or
CLSP
Has a strategy for
business expansion
Properly charges for
service
Neighborly, approchable & communicative
Sponteniously goes door to
door for customary
visits
Literate
Well-trained
Figure 6.2.1: Profile of a Successful CLSP

73 | P a g e
institutional buyers(s), are showing significantly better performance in case of inputs and
pesticide use, post-harvest practices, yield/ production and product price. It was found that these
collectors have been disseminating
market information to both PG
members and other community
members (what to produce; what is
desired quality; when to produce; what
should be the post-harvest measures;
etc.). And this demand and price
information pushed the farmers to
adopt project promoted production
practices in a more effective way.
From our FGDs and IDIs, we identified
some qualities or characteristics that
we think a profitable and successful
vegetable sellers or collectors should
have for their business or service
sustainability. Not necessarily a seller or
collector should possess all these
qualities, but according to our
observation, in most cases we found
that promising sellers or collectors have at least
several of these characteristics, if not all. The diagram below (Fig 6.3.1) shows those usual
characteristics of a successful vegetable seller.
6.4 Community Nutrition Volunteer (CNV)
The Community Nutrition Volunteers (CNVs) are the major actors in promoting health and
nutrition in targeted communities. However, the study reveals that the program areas also have
frontline health and nutrition workers from both NGOs and government who also work in health
and nutrition promotion activities. These field workers disseminate similar kinds of information
and provide similar kinds of services to the communities. The presence of similar services in both
program and comparison areas makes it difficult to identify project’s attribution by comparing
the CNV related results received from comparison and program areas. Nonetheless, the research
revealed that SaFaL CNVs provide door-to-door services more frequently than that of other
health and nutrition workers. The quality of SaFaL CNV services was also found better than their
counterparts in comparison areas.
Regarding food security, change in consumption pattern and nutrition behavior, we found
Community Nutrition Volunteers (CNVs) as one of the most significant change makers in SaFal
market system. We found them instrumental in food consumption related behavior change. This
Veg Seller
Knowledgeable on production
related matters
Has businessness
incentives and takes service commission
Linked with large or
institutional buyers
Disseminate demand side information to suppliers
Have plan or strategy
for business
expansion
Provides market
competitive price to
producers
Figure 6.3.1: Profile of a Successful Vegetable seller

74 | P a g e
is reflected in the previous sections where we saw that women and children’s food consumption
behavior has improved drastically because of SaFal project.
As illustrated in the figure above (Figure 6.4.1), project households received different kinds of
services from Community Nutrition Volunteers (CNVs). Most prominent services that producer
households regularly take from CNVs include knowledge on improved food and consumption
pattern (100%), and information on hygiene, nutrition and feeding practice (98%). Respondents
also stated that CNVs regularly pay customary visits their homes and ask whereabouts (84%
reported that) which they found really beneficial for their well-being and that created a strong
bond in between as often household women do not get time to travel and visit CNVs. Besides,
85% of the respondents also stated that CNVs often link them with government hospitals for
major illness.
100%
57%
28%
86%98%
84% 85%
17%
Knowledgeonfood
consumption
BPmeasurement
Blood sugarmeasurement
Training onnutrition &
hygiene
Informationon hygiene,nutrition &
feeding
Individual HHvisit
Linkage withgovt. hospitals
OtherPe
rce
nta
ge o
f R
esp
on
de
nts
Services
Figure 6.4.1: % of HHs received CNV service
0%
1% 1%
0% 0%
2%2%
0%
0 1 2 3 4 5 6 7 8 9-1%
0%
1%
1%
2%
2%
3%
3%
0%
20%
40%
60%
80%
100%
Knowledgeonfood
consumption
BPmeasurement
Blood sugarmeasurement
Training onnutrition &
hygiene
Information onhygiene,
nutrition &feeding
Individual HHvisit
Linkage withgovt. hospitals
Other
CNV services
Pe
rce
nta
ge o
f R
esp
od
en
ts
Pe
rce
nta
ge o
f R
esp
on
de
nts
Figure 6.4.2: Satisfaction level of the HHs received CNV service
Moderatly satisfied Highly satisfied Lowly satisfied

75 | P a g e
Household members’ overall satisfaction level over CNV services was also found quite high.
Respondents said that they are quite happy with different services provided by CNVs, including
knowledge on improved food and consumption pattern (92% said that they are satisfied with this
service), information on hygiene, child nutrition, care for pregnant women, and breastfeeding
practice (84%) and CNV’s door-to-door service provision (63%).
From our FGDs and IDIs, we found similar results. We found that household members are quite
impressed about the changes in the last few years, Households members have observed
significant changes regarding food consumption behavior (especially of children, pregnant
mother and adult women), pregnant mother and neonatal care and medication.
Nonetheless, the qualitative results also reveal that elderly women of the community hold on to
traditional beliefs and affect behavior changes adversely. Awareness among this group of people
is also necessary.
However, we observed another interesting change that took place which to some extent can be
attributed to the works CNVs in the project areas. Previously, before project inception, household
members did not eat enough vegetables, although they were producing vegetables on
commercial basis. One reason was the lack of knowledge about nutritional importance of eating
vegetables, but another reason was because they were using lots of chemical pesticides in their
crops and they want to eat those by themselves. However, after getting aware about the benefits
of adding vegetables in their diet chart (in training sessions from CNVs), and simultaneous
capacity building on vegetable production techniques with using natural pesticides, they are now
producing vegetables using natural pests and eating more vegetables.
However, we did not find a sustainable exit plan for CNVs. Although CNVs conducted many
sessions on nutrition and health (as per project mandate), their incentives lie on the service
charge they take for their services like blood sugar and diabetes measurement. But as we can see
in figure 6.4.2, households haven’t yet started taking these services intensively from them (28%
and 57% respectively), and therefore, their relevant income from these two services have not
been that high. Nevertheless, CNVs reported that those awareness building trainings worked as
good breeding ground which increased their accessibility and credibility as CNVs in their
communities, and they are expecting an increasing income in the coming years. They also said
that the big billboards that the project mounted in their homes with their names and service list
on it has helped them to become more credible as CNVs in the community.

76 | P a g e
Chapter Seven: ‘Spontaneous’ Impact on
Family and Neighbors of SaFaL
One of the main motivations for this behavioral analysis was to see if the neighboring farmers
have been affected by the project, i.e., whether there have been changes in their production and
food consumption behavior also due to project interventions. The objective of this project was
to spread the use of modern technologies and good practices in farm management (dairy;
aquaculture and horticulture) and in food consumption behavior. Even though the capacity
building, group mobilization and linkage initiatives were primarily targeted for PG members, the
project also intended to spread the good practices and change among the entire community.
In both our quantitative and qualitative analysis, we found that there has been impressive change
in neighboring (non-program) producers’ and households’
production and consumption related behavior which can
be attributed largely to program interventions.
Neighboring households realized that the products and
foods they produce and consume affect their own
wellbeing and livelihood. The direct relationship between
these two levels made the neighboring farmers realize the
potential of adopting new technologies in their day-to-day
lives. We found that while neighboring producers have
been copying practices related to inputs usage, cultivation
method, post-harvest management and sales, in the
household level there has been change in consumption
behavior.
Our major findings are described in the following sections.
7.1 Observational learning and its theory
If we want to dive deep into how the project affected the neighboring farmers, it is important to
understand the drivers behind the group member sharing the knowledge and the neighboring
farmer acquiring the knowledge. Serguey Braguinsky, a professor in department of social and
decision sciences from Carnegie Mellon University and David C. Rose, a professor in department
of economics at University of Missouri-St Louis came up with a theory, that describes why and
how the farmers share information about a new technology with their neighboring farmers. The
theory is called the neighboring farmer effect4. According to their model, cooperation stirs up
competition. That is, in a competitive market where everyone is a price taker, if farmer A learns
and uses a new technology, he benefits from sharing it with another farmer B. By adopting a new
technology, a farmer can reduce his own cost of producing a product. Therefore, the difference
4 http://isiarticles.com/bundles/Article/pre/pdf/49146.pdf
Increased use of new technology improves their consumption behavior
Improved consumption behavior automatically drives them to produce by using new technology

77 | P a g e
between average cost and market price increases, which in turn increases his benefits. However,
he also knows the price will remain unchanged even if he shares the new technology with farmer
B, and in turn can increase farmer B’s profits at no cost from farmer A. In this theory, they share
the technology and the information about how to use it.
For example, by adopting a new technology, a PG farmer can reduce his own cost of producing a
product. Therefore, the difference between average cost and market price increases, which in
turn increases his benefits. However, he also knows the price will remain unchanged even if he
shares the new technology with any neighboring farmer, and in turn can increase the neighboring
farmer profits at no cost. Besides, by sharing information, there will be stronger social bond
between these two and a level of social indebtedness for the selfless service by PG farmer. Thus,
they share modern technology and information between them.
On the other hand, Braguinsky and Rose also ran a discourse about what would be the benefits
of concealing the information. There is only one benefit, and that is he will be able to increase
his profits by reducing his costs. However, there are costs associated with concealment as well.
Firstly, if farmer A conceals information from farmer B, A will expect to get the same behavior
from B in the future in case of reverse situation. Sharing the technology in this case guarantees
that B will also be cooperative in the future. Secondly, B can always hire A’s workers and thus
acquire information about new technology and trained up employees. Consequently, A will end
up increasing his costs.
Braguinsky and Rose got the inspiration for their model from the development history of Japan’s
first example of successful industrial development- its cotton spinning industry in the beginning
of 1880s.
7.2 Service Providers: Major Drivers behind Community Level
Behavior Change SaFal project developed lead farmers, small entrepreneurs and skill laborers in the targeted
sectors including Community Nutrition Volunteer (CNV), Vegetables Collector or Seller,
Community Livestock Service Provider (CLSP), milk transportation van, fish feed processor, vermi-
compost producer, agro-input shops, agro-machinery maintenance service provider, vegetable
transporter, mobile input seller, etc. It was found in this study that these service providers have
been instrumental in bringing positive changes in farmer behavior, private sector transactions,
business modalities, market governance, and most importantly, spreading or disseminating good
practices among neighboring farmers.
From our FGDs and IDIs with other community members, we actually did not find major
difference in knowledge or production practices between program beneficiaries and community
members. Other community members admitted that they have learn a lot from program
beneficiaries and project promoted service providers in the last few years and there have been

78 | P a g e
significant changes in their production behavior. They saw the success of program beneficiaries
and also wanted to decrease their cost and maximize their profitability. So, they started copying-
in instructions and advice of the service providers and PG members, and have started enjoying
benefits similarly.
For example, from our IDIs with some vegetable sellers who are connected to high end buyers
and retailers like Agora, we found that they have been influential in spreading demand side
requirements among all the neighboring producers and maximizing profitability of not just
program beneficiaries, but of all the community producers who are linked with them. We found
that community producers who are linked with these vegetable sellers, have better performance
in case of inputs usage, pesticide use, post-harvest practices, yield/ production and product price.
Vegetable sellers have been disseminating market information (what to produce; what is desired
quality; when to produce; what should be the post-harvest measures; etc.) to farmers (both PG
members and other community members) and this information pushed farmers to adopt
improved practices in a more effective way.
Similarly, other LSPs also have been working as influential catalyst in bringing behavioral level
changes among community producers and other market actors.
7.3 Survey Findings
7.3.1 Impact on Neighboring Horticulture Producers and their Households
82
17
76 84
6175
38
66
20 21
64 5768 66
34
18
83
24 16
3925
62
34
80 79
36 4332 34
66
Pe
rce
nta
ge o
f H
ort
i Far
me
rs
Figure 7.3.1: Percentage of horticulture farmers reporting whether neighboring farmers copied from them or not
Yes % No/Don't Know %

79 | P a g e
As illustrated in the diagram above (Figure 6.3.1), PG members reported that major areas which
they observed neighboring farmers to copy from them include improved inputs usage (84% of
the respondents reported that) (especially organic and inorganic fertilizers), quality seed sources
(82%), land/ bed preparation techniques (76%), disease management (especially use of naturals
pesticides) (75%), foods and nutrition related knowledge (68%) and empowerment or improved
decision making capacity in enterprise and household level (66%).
The Neighboring Farmer Effect theory discussed above tell us that cooperation triggers
competition.
7.3.2 Impact on Neighboring Aquaculture Producers and their Households
Figure 7.3.2.1: Percentage of aquaculture farmers reporting whether neighboring farmers copied from
them or not
In terms of the Braguinsky and Rose model, the cooperation and competition also reflects in the
fish farmer groups. The graph generally poses with affirmative responses in terms of adopting
almost all technologies and practices. With them, 72% of PG members reported their neighboring
farmers copying new practices about choosing better fish seeds and preparing ponds. Other
practices that their neighbors copied include pond preparation (72%), pH testing (60%), better
feeding practice (69%) and use of probiotics (66%). It was also found that neighbors also benefit
from increased access to inputs (62%) and finance (63%). These finding also resonate with the
qualitative data.
72
%
60
% 72
%
69
%
66
%
56
%
62
%
63
%
37
% 52
%
17
%
16
%
47
%
50
% 59
%
57
%
30
%
28
%
40
% 28
%
31
%
34
%
44
%
38
%
37
%
63
% 48
%
83
%
84
%
53
%
50
% 41
%
43
%
70
%
Pe
rce
nta
ge o
f A
qu
a Fa
rme
rs
Yes No or Don't know
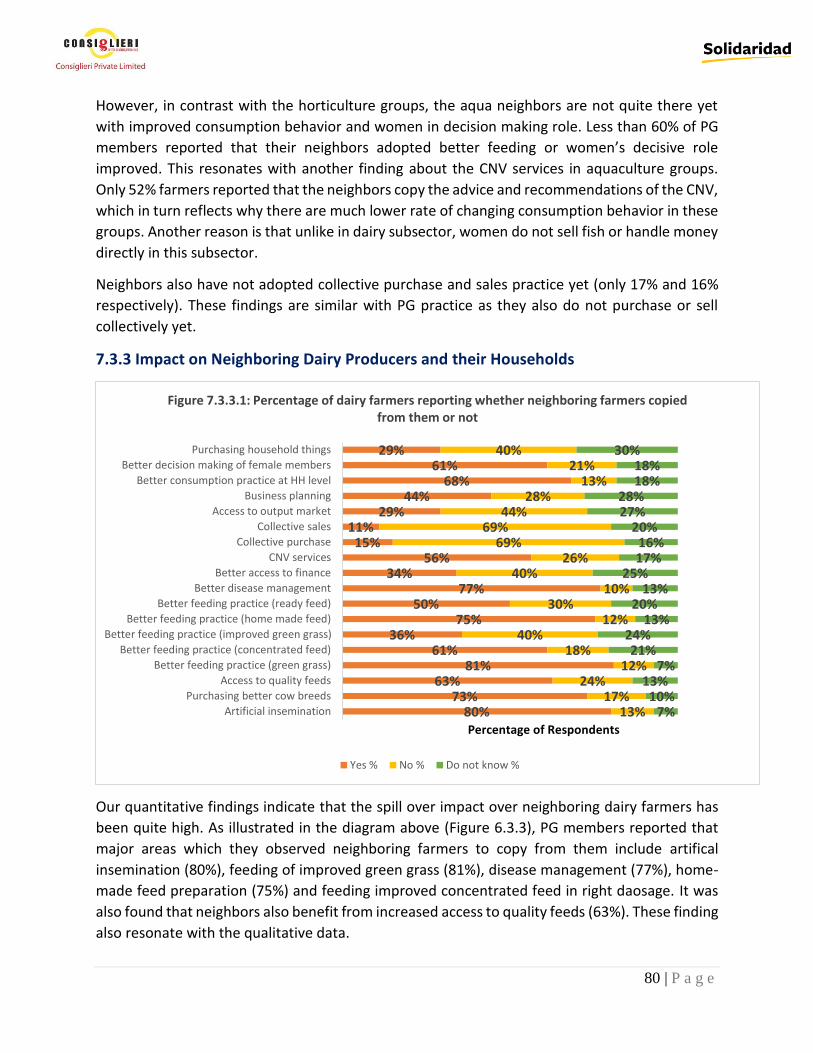
80 | P a g e
However, in contrast with the horticulture groups, the aqua neighbors are not quite there yet
with improved consumption behavior and women in decision making role. Less than 60% of PG
members reported that their neighbors adopted better feeding or women’s decisive role
improved. This resonates with another finding about the CNV services in aquaculture groups.
Only 52% farmers reported that the neighbors copy the advice and recommendations of the CNV,
which in turn reflects why there are much lower rate of changing consumption behavior in these
groups. Another reason is that unlike in dairy subsector, women do not sell fish or handle money
directly in this subsector.
Neighbors also have not adopted collective purchase and sales practice yet (only 17% and 16%
respectively). These findings are similar with PG practice as they also do not purchase or sell
collectively yet.
7.3.3 Impact on Neighboring Dairy Producers and their Households
Our quantitative findings indicate that the spill over impact over neighboring dairy farmers has
been quite high. As illustrated in the diagram above (Figure 6.3.3), PG members reported that
major areas which they observed neighboring farmers to copy from them include artifical
insemination (80%), feeding of improved green grass (81%), disease management (77%), home-
made feed preparation (75%) and feeding improved concentrated feed in right daosage. It was
also found that neighbors also benefit from increased access to quality feeds (63%). These finding
also resonate with the qualitative data.
80%73%
63%81%
61%36%
75%50%
77%34%
56%15%
11%29%
44%68%
61%29%
13%17%
24%12%
18%40%
12%30%
10%40%
26%69%
69%44%
28%13%
21%40%
7%10%
13%7%
21%24%
13%20%
13%25%
17%16%
20%27%28%
18%18%
30%
Artificial insemination
Purchasing better cow breeds
Access to quality feeds
Better feeding practice (green grass)
Better feeding practice (concentrated feed)
Better feeding practice (improved green grass)
Better feeding practice (home made feed)
Better feeding practice (ready feed)
Better disease management
Better access to finance
CNV services
Collective purchase
Collective sales
Access to output market
Business planning
Better consumption practice at HH level
Better decision making of female members
Purchasing household things
Percentage of Respondents
Figure 7.3.3.1: Percentage of dairy farmers reporting whether neighboring farmers copied from them or not
Yes % No % Do not know %
81 | P a g e
In terms of consumption behavior at household level and women’s decision taking capabilities,
68% of our respondents stated that they observed their neighboing households had adopted
improved consumption practice. They also reported that they observed increased decision
making capacity in neighboring women (61%).
Noticible there are several areas where this trickle down theory did not achieve as expected . As
for group purchase (15%), group sales (11%), access to input market (29%), and bussiness
planning (44%), neighboring farmers had shown comparatively less interests so far. Same goes
for participation of women in different value chain processes (29%) which reflects the same issue
(social barrier) which is faced by the women respondents mentioned earlier. It is apparent that
in these instances neighboring farmer effect theory contradicts with ‘the benefits of concealing
information’ as neighboring farmers did not adopt these practices. There might be several
reasons behind this mixed result.
First, each districs has its own feature,character,culture and beliefs which might have affected
the fermers chice. Secondly, the neighboring farmer might have been relactunt/not interested
to adopt the new technology. Thirdly, the neighbors do not know about details (functionality;
benefits; sources) of relevant technologies or practices yet.

82 | P a g e
Chapter 8: Conclusion and Recommendations
We found SaFal as a remarkable project to bring positive behavioral changes not only among
farmers, but also among neighbors and other relevant market actors. In contrast to other similar
market system development projects, their apprach and interventions have been throughgoing,
innovative and extensive. We found farmers and community members reporting significant
behavioral change in their technology use, production practices and consumption behavior and
really happy about these changes and adaptations.
In case of horticulture, there have been noteworthy changes among farmers in case of chemical
and organic fertilizer use, pest management, post-harvest processes and sales practice. Fish
farmers adopopted improved technologies and practices including pond preparation, use of
quality fish seeds and feeds, use of homemade fish feeds, water and temperature testing, use of
probiotics, pond hygiene management, etc. In case of dairy farmers, significant behavioral
changes were observed in areas including use of green and concentrated feeds, use of
homemade feeds, disease management, shed management, use of artificial insemination service,
milking process and milk sales. Women’s dicision making power increased due to increased
inome and involevment in incomegenerating activities. Also there has been promising results in
terms food consumption behavior, cooking and hygiene practice. Increased income in targeted
enterprises, increased knowledge and awareness and access to relevant services like CNVs have
brought these changes.
One important difference between SaFaL PGs and other conventional NGO groups is the size and
membership of the group. While most groups limit to 20 to 25 members, SaFaL PGs have on an
average of 50 to 60 members. At the same time, while most NGO groups include only poor and
extreme poor households, the SaFaL group membership is open to all farmers of the respective
sub-sectors within the community. This design has a great potential to result in all inclusive
sectoral development in a specific region. In conventional groups as the non-poor are excluded
from membership, these groups lack enough bargaining power to negotiate with the local power-
holders and elites. At the same time, as elites are kept outside of the groups, they do not have
any avenue for effective engagement with the group for attaining its development objective. But,
as the SaFaL groups include all willing farmers of the community, there is a very good opportunity
for the all community members to contribute to positive sectoral development.
Lead farmer (LF) has been a major influential actor in Safal model for group mobilization,
technology transfer and resulting behavioral changes. Their inclusion and successful deployment
have given SaFal an additional edge as these LFs are accessible by community members and
provide quality services on production related information, output and input market linkage, etc.

83 | P a g e
Unlike conventional development projects, SaFal prioritized on developing small entrepreneurs
and skill laborers in the targeted sectors. These service providers have been instrumental in
bringing positive changes in farmer behavior, private sector transactions, business modalities,
and most importantly, spreading or disseminating good practices among neighboring farmers.
For capacity development of different market actors and stakeholders, Safal partnered with
proven public and private training providers and alloted sufficient time for training (along with
periodic refresher trainings). These considerations have given SaFal a certain edge that other
development projects usually do not have. Lead Farmers, CLSP, CNV and other small
entrepreneurs were found skilled enough to provide quality services to others and enjoy
sufficient monetary incentives from their services.
Safal’s initiatives like establishing collection point/ center and linking producers with local,
regional, national and niche market actors have been crucial factors behind project success.
However, some recommendations are briefed below that this project can take out from ths study
for further consideration in their future plan.
Horticulture Subsector related Recommendations
Explore possibilities of introducing low-cost mobile soil testing facilities.
Identify and create linkage with large/ institutional buyers (like Agora; Shopno; etc.) as
they provide better price for horticulture products. This will provide farmers with demand
side specifications and requirements and push them to further improve their production
practices.
Identify and create linkages with potential agro-processing entrepreneurs who would be
interested in establishing vegetable processing (frozen and canned) plants to ensure
steady market for horticulture products.
Establish more collection points
Aquaculture Subsector related Recommendations
Establish more collection points for aquaculture products in the intervention areas.
Strengthen the initiative of certification and branding of fishes that use safe farming
methods and feeds so that these farmers receive higher prices for their produces.
Increase the number of local entrepreneurs who will engage in preparing and selling
locally made fish feed.
Explore possibilities of introducing low-cost water, pH and temperature testing facilities.
Explore piloting other fish farming along with shrimp, prawn and pangash.

84 | P a g e
Dairy Subsector related Recommendations
Linking farmers with milk chilling centers/ collection points that are linked with chilling
centers. Because chilling centers pay according to fat content and milk amount, this will
push farmers to achieve higher milk production and fat content and therefore, to improve
their production practices accordingly.
Link farmers with AI services from where they will get better and trusted insemination
service.
Generic Recommendations
Design new business plan for CNVs adding other health/ nutrition related services which
will give them propoer incentives to become sustainable market actor.
Select Lead Farmers (LFs) who are socially respected, people’s person, knowledgeable on
production practices, has business incentives of their services, and have leadership
quality.
Link farmers with appropriate formal saving scemes.
Link farmers with appropriate financial products that are suitable for their value chain


![DOCTORAT DE L'UNIVERSITÉ DE TOULOUSE · Figure 1-1 : Venn diagram to represent the different factors contributing in the IGSCC of material [25]. ·············· 6 Figure](https://img.pdfslide.net/doc/110x75/5ed308b8aa20077a240680a1/doctorat-de-luniversit-de-toulouse-figure-1-1-venn-diagram-to-represent-the.jpg)