Embed Size (px)
Citation preview
TAX CUTS AND JOBS ACT4/26/2018
IMPACT ON TAXES FOR MARYLAND RESIDENTS
Office of the Comptroller
State of Maryland
Andrew Schaufele: Director, Bureau of Revenue Estimates
Disclaimer
•I represent myself today
•Not the Comptroller, not the Board
of Revenue Estimates
•These are my estimates, use at
your own risk/peril ☺
Estimate Mechanism
• Bureau of Revenue Estimates maintains a comprehensive database of taxpayer records, federal & State• Data is cleansed and deeply tested
• Able to simulate the full population of Maryland residents for almost every provision• Other provisions estimated outside of database
• Data availability lags – use TY2014 data to simulate; relatively “normal” base year
• Have estimates at provision level, but must beware, almost every taxpayer wins and loses across various provisions
• Descriptions here and in paper are general, meant to cover majority of situations
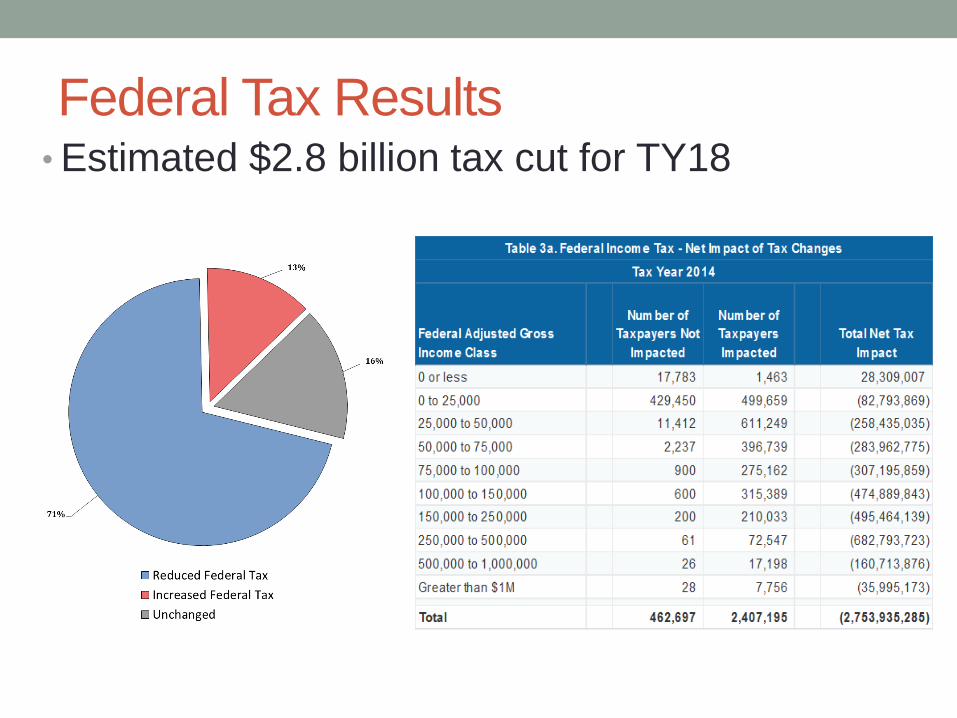
Federal Tax Results• Estimated $2.8 billion tax cut for TY18
Key Federal Provisions
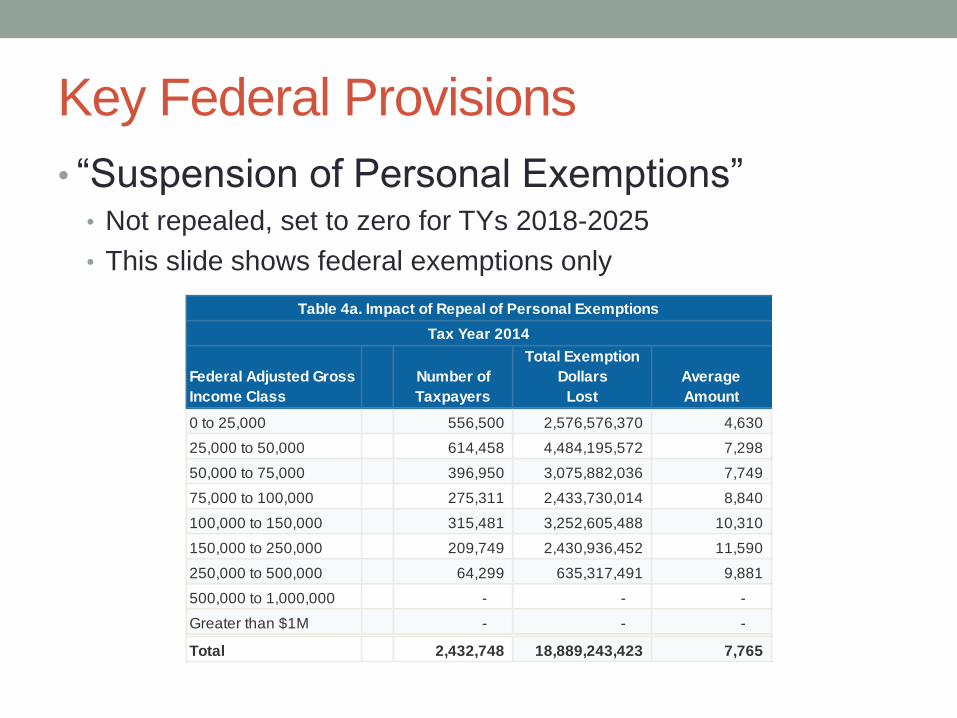
• “Suspension of Personal Exemptions”• Not repealed, set to zero for TYs 2018-2025
• This slide shows federal exemptions only
Table 4a. Impact of Repeal of Personal Exemptions
Tax Year 2014
Federal Adjusted Gross
Income Class
Number of
Taxpayers
Total Exemption
Dollars
Lost
Average
Amount
0 to 25,000 556,500 2,576,576,370 4,630
25,000 to 50,000 614,458 4,484,195,572 7,298
50,000 to 75,000 396,950 3,075,882,036 7,749
75,000 to 100,000 275,311 2,433,730,014 8,840
100,000 to 150,000 315,481 3,252,605,488 10,310
150,000 to 250,000 209,749 2,430,936,452 11,590
250,000 to 500,000 64,299 635,317,491 9,881
500,000 to 1,000,000 - - -
Greater than $1M - - -
Total 2,432,748 18,889,243,423 7,765
Key Federal Provisions
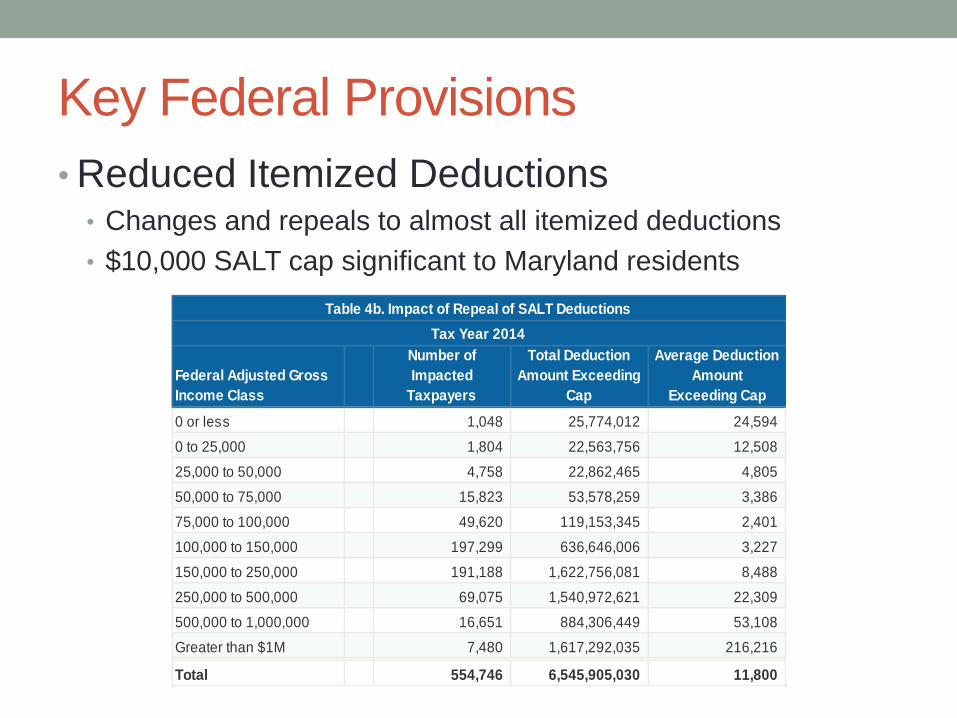
• Reduced Itemized Deductions• Changes and repeals to almost all itemized deductions
• $10,000 SALT cap significant to Maryland residents
Table 4b. Impact of Repeal of SALT Deductions
Tax Year 2014
Federal Adjusted Gross
Income Class
Number of
Impacted
Taxpayers
Total Deduction
Amount Exceeding
Cap
Average Deduction
Amount
Exceeding Cap
0 or less 1,048 25,774,012 24,594
0 to 25,000 1,804 22,563,756 12,508
25,000 to 50,000 4,758 22,862,465 4,805
50,000 to 75,000 15,823 53,578,259 3,386
75,000 to 100,000 49,620 119,153,345 2,401
100,000 to 150,000 197,299 636,646,006 3,227
150,000 to 250,000 191,188 1,622,756,081 8,488
250,000 to 500,000 69,075 1,540,972,621 22,309
500,000 to 1,000,000 16,651 884,306,449 53,108
Greater than $1M 7,480 1,617,292,035 216,216
Total 554,746 6,545,905,030 11,800
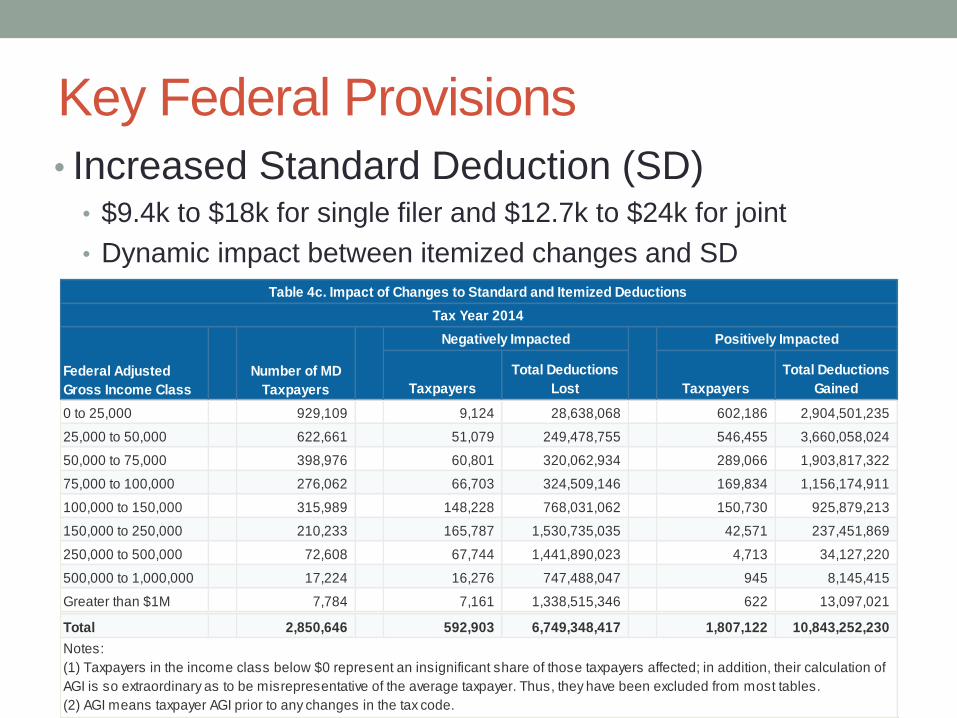
Key Federal Provisions
• Increased Standard Deduction (SD)• $9.4k to $18k for single filer and $12.7k to $24k for joint
• Dynamic impact between itemized changes and SD
Table 4c. Impact of Changes to Standard and Itemized Deductions
Impact of
Changes to
Tax Year 2014 Tax Year 2014
Negatively Impacted Positively Impacted
Taxpayers
Total Deductions
Lost Taxpayers
Total Deductions
Gained
0 to 25,000 929,109 9,124 28,638,068 602,186 2,904,501,235
25,000 to 50,000 622,661 51,079 249,478,755 546,455 3,660,058,024
50,000 to 75,000 398,976 60,801 320,062,934 289,066 1,903,817,322
75,000 to 100,000 276,062 66,703 324,509,146 169,834 1,156,174,911
100,000 to 150,000 315,989 148,228 768,031,062 150,730 925,879,213
150,000 to 250,000 210,233 165,787 1,530,735,035 42,571 237,451,869
250,000 to 500,000 72,608 67,744 1,441,890,023 4,713 34,127,220
500,000 to 1,000,000 17,224 16,276 747,488,047 945 8,145,415
Greater than $1M 7,784 7,161 1,338,515,346 622 13,097,021
Total 2,850,646 592,903 6,749,348,417 1,807,122 10,843,252,230
Notes:
(1) Taxpayers in the income class below $0 represent an insignificant share of those taxpayers affected; in addition, their calculation of
AGI is so extraordinary as to be misrepresentative of the average taxpayer. Thus, they have been excluded from most tables.
(2) AGI means taxpayer AGI prior to any changes in the tax code.
Federal Adjusted
Gross Income Class
Number of MD
Taxpayers
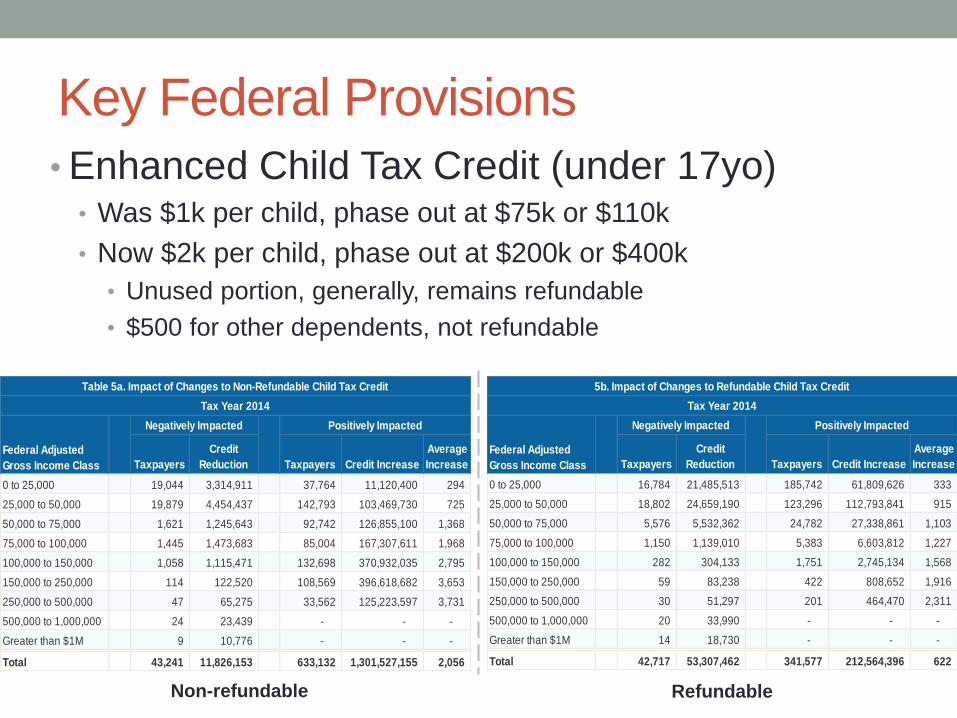
Key Federal Provisions
• Enhanced Child Tax Credit (under 17yo)• Was $1k per child, phase out at $75k or $110k
• Now $2k per child, phase out at $200k or $400k
• Unused portion, generally, remains refundable
• $500 for other dependents, not refundable
Table 5a. Impact of Changes to Non-Refundable Child Tax Credit
Tax Year 2014
Negatively Impacted Positively Impacted
Taxpayers
Credit
Reduction Taxpayers Credit Increase
Average
Increase
0 to 25,000 19,044 3,314,911 37,764 11,120,400 294
25,000 to 50,000 19,879 4,454,437 142,793 103,469,730 725
50,000 to 75,000 1,621 1,245,643 92,742 126,855,100 1,368
75,000 to 100,000 1,445 1,473,683 85,004 167,307,611 1,968
100,000 to 150,000 1,058 1,115,471 132,698 370,932,035 2,795
150,000 to 250,000 114 122,520 108,569 396,618,682 3,653
250,000 to 500,000 47 65,275 33,562 125,223,597 3,731
500,000 to 1,000,000 24 23,439 - - -
Greater than $1M 9 10,776 - - -
Total 43,241 11,826,153 633,132 1,301,527,155 2,056
Federal Adjusted
Gross Income Class
5b. Impact of Changes to Refundable Child Tax Credit
Tax Year 2014
Negatively Impacted Positively Impacted
Taxpayers
Credit
Reduction Taxpayers Credit Increase
Average
Increase
0 to 25,000 16,784 21,485,513 185,742 61,809,626 333
25,000 to 50,000 18,802 24,659,190 123,296 112,793,841 915
50,000 to 75,000 5,576 5,532,362 24,782 27,338,861 1,103
75,000 to 100,000 1,150 1,139,010 5,383 6,603,812 1,227
100,000 to 150,000 282 304,133 1,751 2,745,134 1,568
150,000 to 250,000 59 83,238 422 808,652 1,916
250,000 to 500,000 30 51,297 201 464,470 2,311
500,000 to 1,000,000 20 33,990 - - -
Greater than $1M 14 18,730 - - -
Total 42,717 53,307,462 341,577 212,564,396 622
Federal Adjusted
Gross Income Class
Non-refundable Refundable
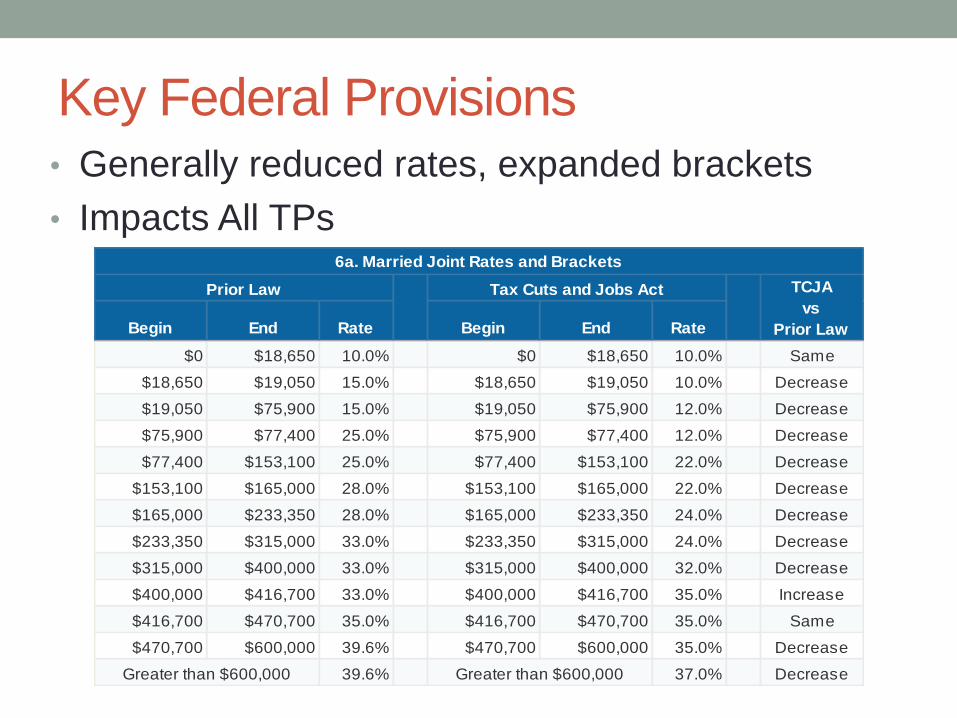
Key Federal Provisions• Generally reduced rates, expanded brackets
• Impacts All TPs6a. Married Joint Rates and Brackets
Begin End Rate Begin End Rate
$0 $18,650 10.0% $0 $18,650 10.0% Same
$18,650 $19,050 15.0% $18,650 $19,050 10.0% Decrease
$19,050 $75,900 15.0% $19,050 $75,900 12.0% Decrease
$75,900 $77,400 25.0% $75,900 $77,400 12.0% Decrease
$77,400 $153,100 25.0% $77,400 $153,100 22.0% Decrease
$153,100 $165,000 28.0% $153,100 $165,000 22.0% Decrease
$165,000 $233,350 28.0% $165,000 $233,350 24.0% Decrease
$233,350 $315,000 33.0% $233,350 $315,000 24.0% Decrease
$315,000 $400,000 33.0% $315,000 $400,000 32.0% Decrease
$400,000 $416,700 33.0% $400,000 $416,700 35.0% Increase
$416,700 $470,700 35.0% $416,700 $470,700 35.0% Same
$470,700 $600,000 39.6% $470,700 $600,000 35.0% Decrease
39.6% 37.0% Decrease
Prior Law Tax Cuts and Jobs Act TCJA
vs
Prior Law
Greater than $600,000 Greater than $600,000
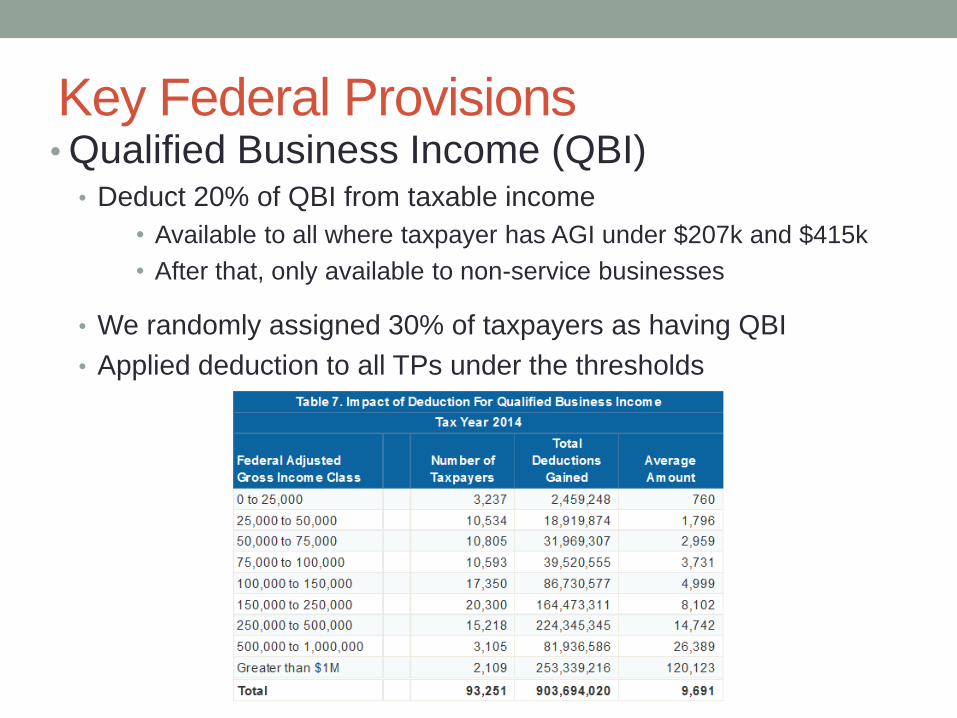
Key Federal Provisions• Qualified Business Income (QBI)
• Deduct 20% of QBI from taxable income
• Available to all where taxpayer has AGI under $207k and $415k
• After that, only available to non-service businesses
• We randomly assigned 30% of taxpayers as having QBI
• Applied deduction to all TPs under the thresholds
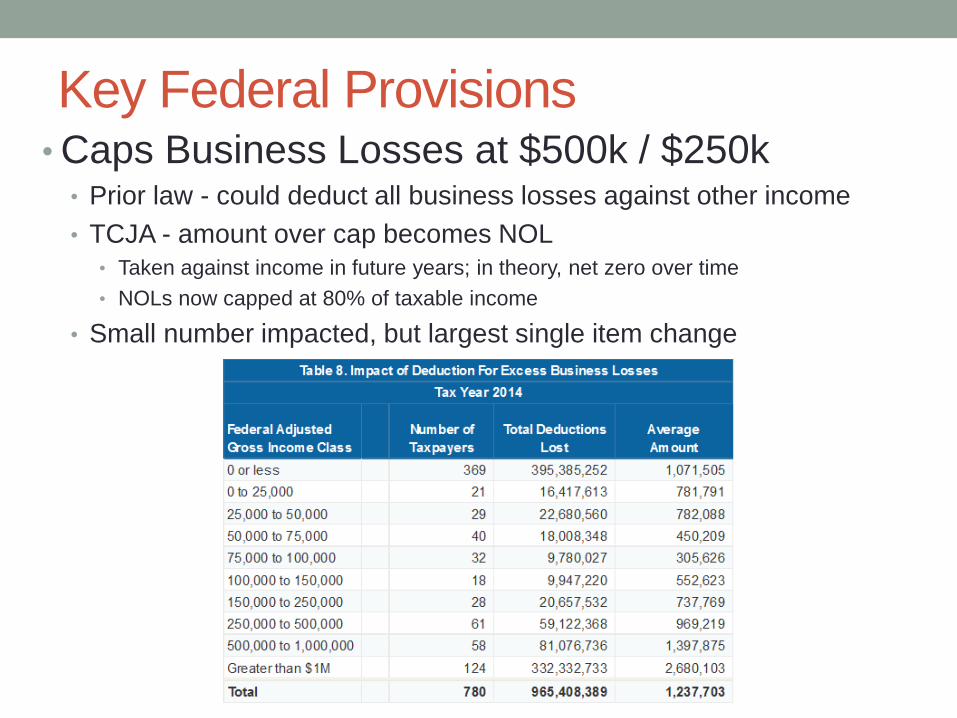
Key Federal Provisions• Caps Business Losses at $500k / $250k
• Prior law - could deduct all business losses against other income
• TCJA - amount over cap becomes NOL
• Taken against income in future years; in theory, net zero over time
• NOLs now capped at 80% of taxable income
• Small number impacted, but largest single item change
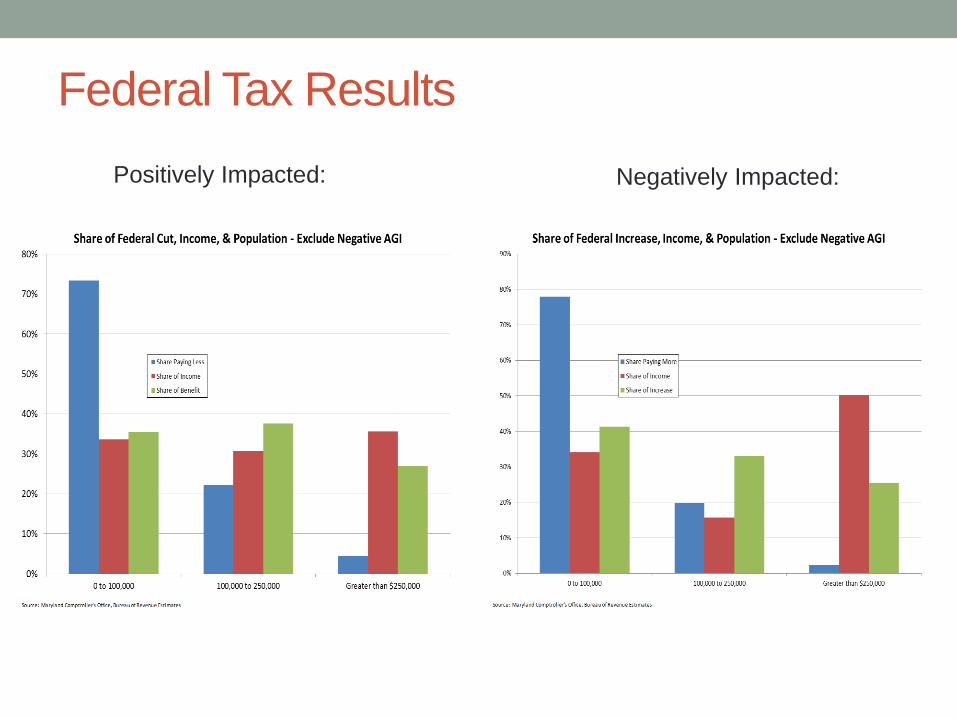
Federal Tax Results
Positively Impacted: Negatively Impacted:
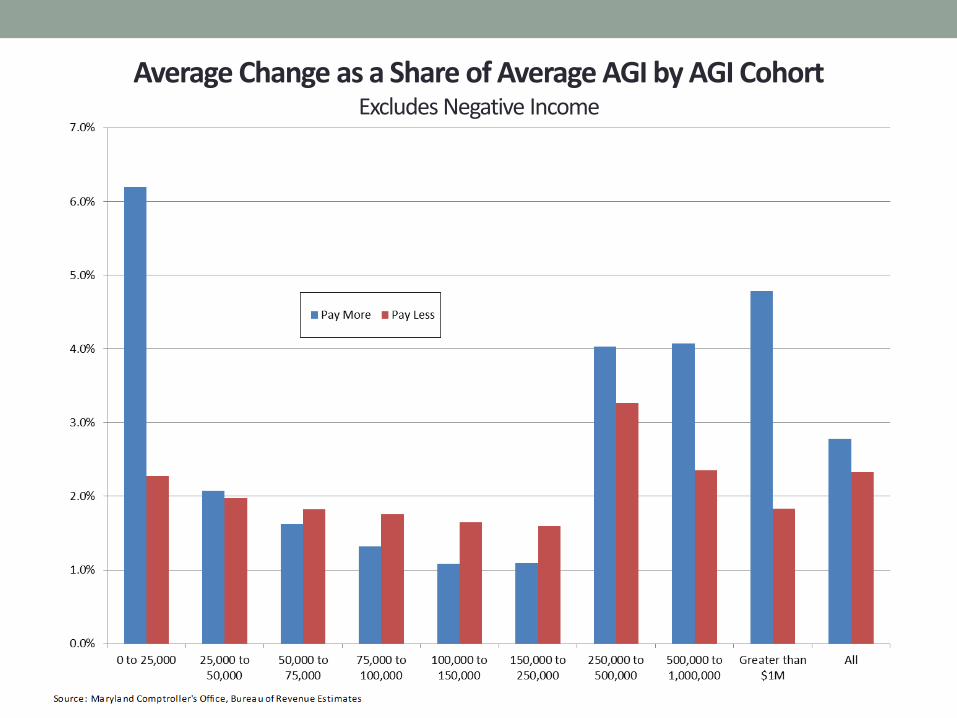
Average Change as a Share of Average AGI by AGI Cohort Excludes Negative Income
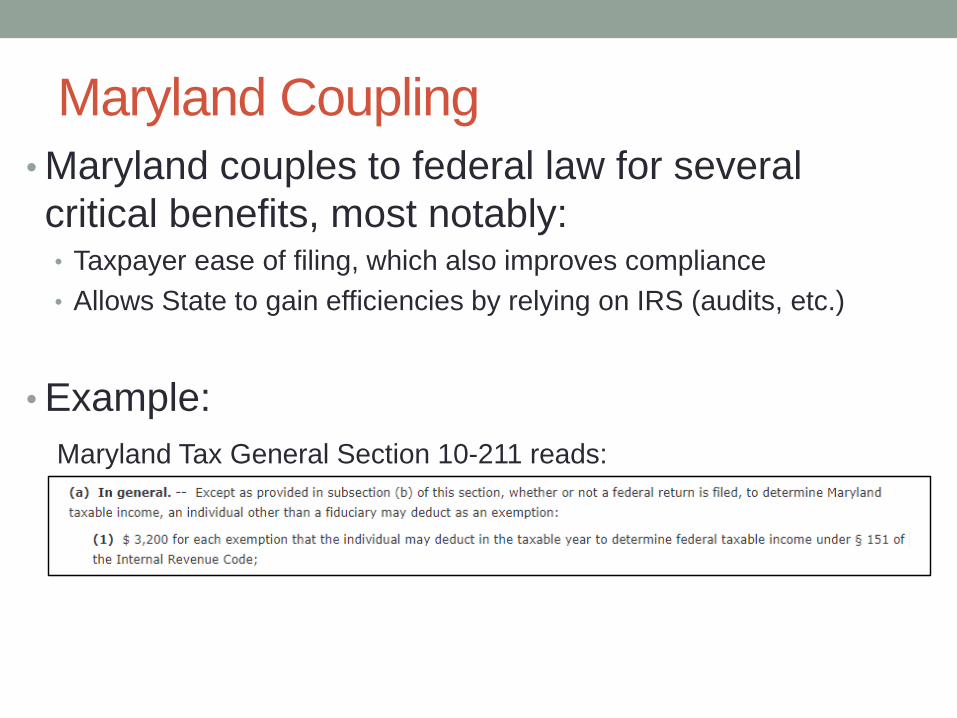
Maryland Coupling
• Maryland couples to federal law for several
critical benefits, most notably:• Taxpayer ease of filing, which also improves compliance
• Allows State to gain efficiencies by relying on IRS (audits, etc.)
• Example:
Maryland Tax General Section 10-211 reads:Maryland Tax General Section 10-211 reads:
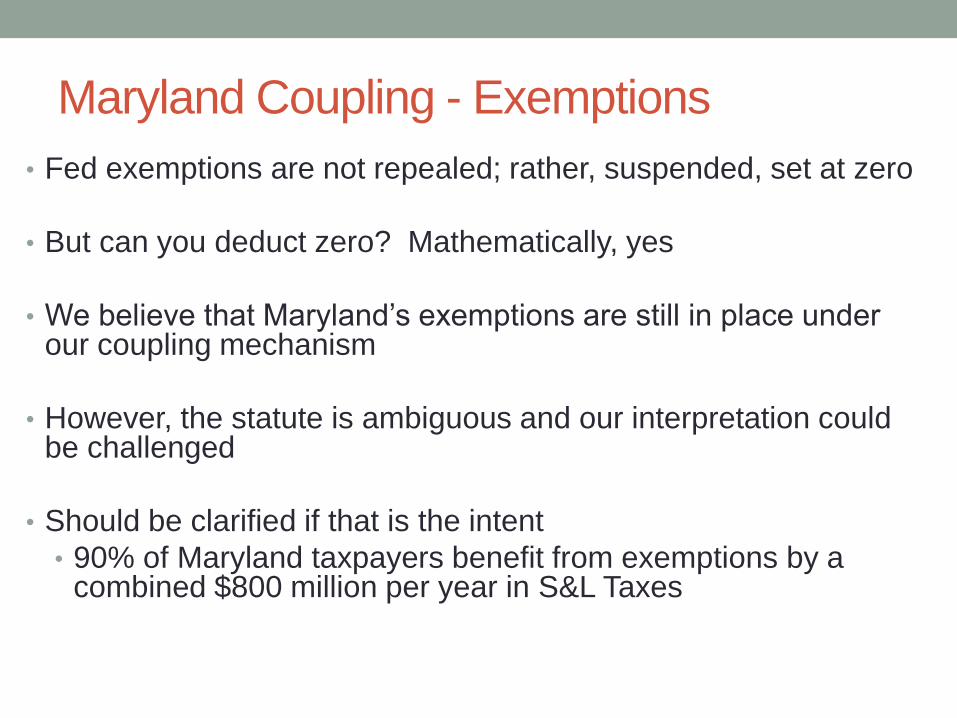
Maryland Coupling - Exemptions
• Fed exemptions are not repealed; rather, suspended, set at zero
• But can you deduct zero? Mathematically, yes
• We believe that Maryland’s exemptions are still in place under our coupling mechanism
• However, the statute is ambiguous and our interpretation could be challenged
• Should be clarified if that is the intent
• 90% of Maryland taxpayers benefit from exemptions by a combined $800 million per year in S&L Taxes
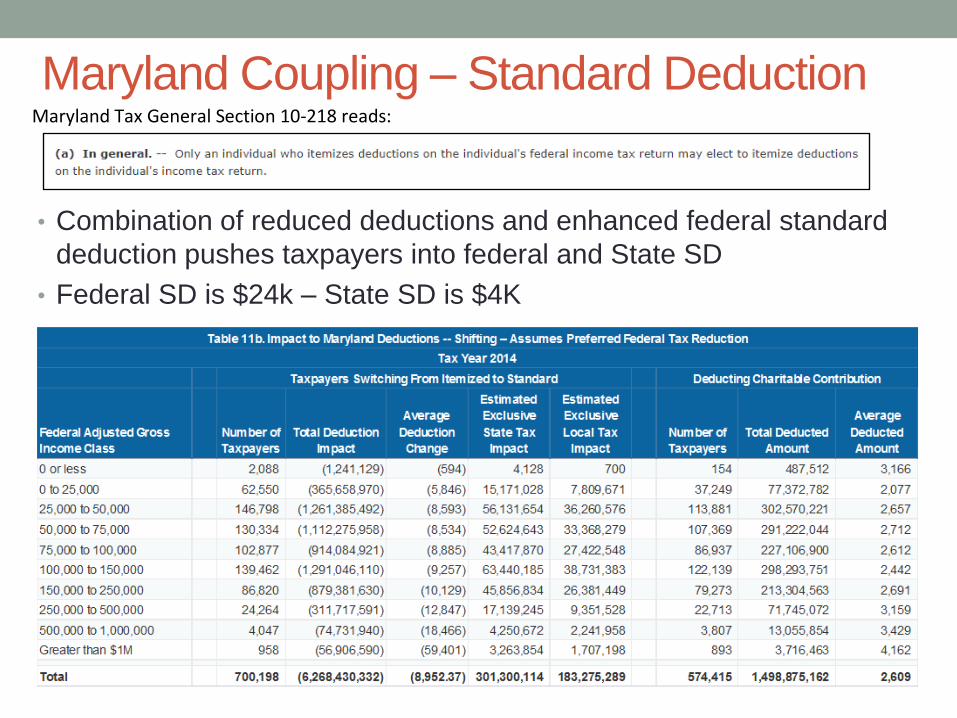
Maryland Coupling – Standard Deduction
• Combination of reduced deductions and enhanced federal standard
deduction pushes taxpayers into federal and State SD
• Federal SD is $24k – State SD is $4K
Maryland Tax General Section 10-218 reads:
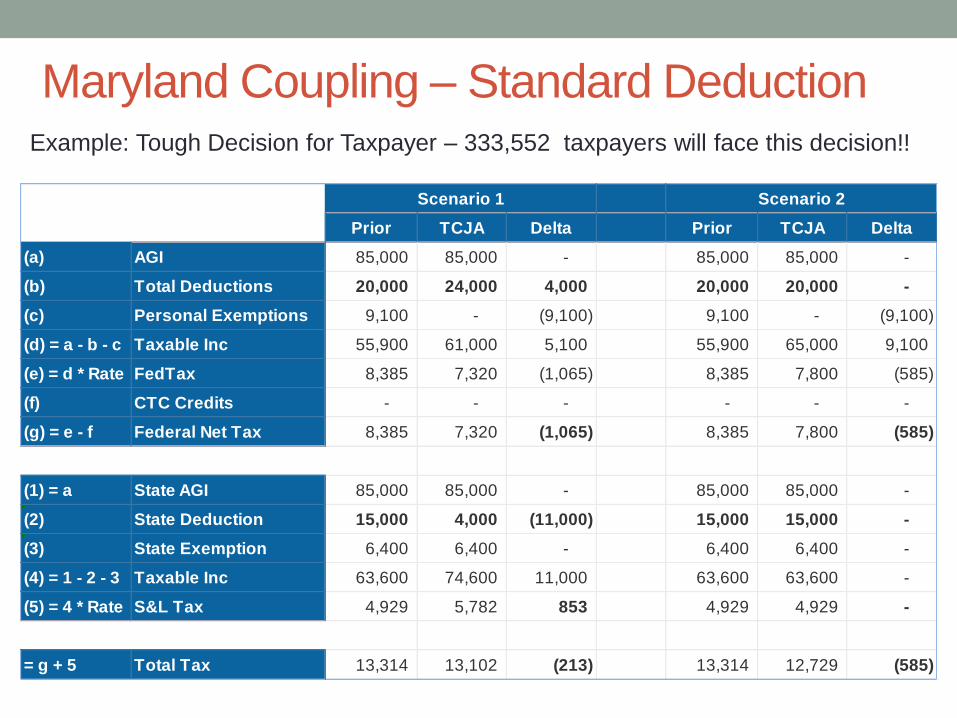
Maryland Coupling – Standard Deduction
Prior TCJA Delta Prior TCJA Delta
(a) AGI 85,000 85,000 - 85,000 85,000 -
(b) Total Deductions 20,000 24,000 4,000 20,000 20,000 -
(c) Personal Exemptions 9,100 - (9,100) 9,100 - (9,100)
(d) = a - b - c Taxable Inc 55,900 61,000 5,100 55,900 65,000 9,100
(e) = d * Rate FedTax 8,385 7,320 (1,065) 8,385 7,800 (585)
(f) CTC Credits - - - - - -
(g) = e - f Federal Net Tax 8,385 7,320 (1,065) 8,385 7,800 (585)
(1) = a State AGI 85,000 85,000 - 85,000 85,000 -
(2) State Deduction 15,000 4,000 (11,000) 15,000 15,000 -
(3) State Exemption 6,400 6,400 - 6,400 6,400 -
(4) = 1 - 2 - 3 Taxable Inc 63,600 74,600 11,000 63,600 63,600 -
(5) = 4 * Rate S&L Tax 4,929 5,782 853 4,929 4,929 -
= g + 5 Total Tax 13,314 13,102 (213) 13,314 12,729 (585)
Scenario 1 Scenario 2
Example: Tough Decision for Taxpayer – 333,552 taxpayers will face this decision!!
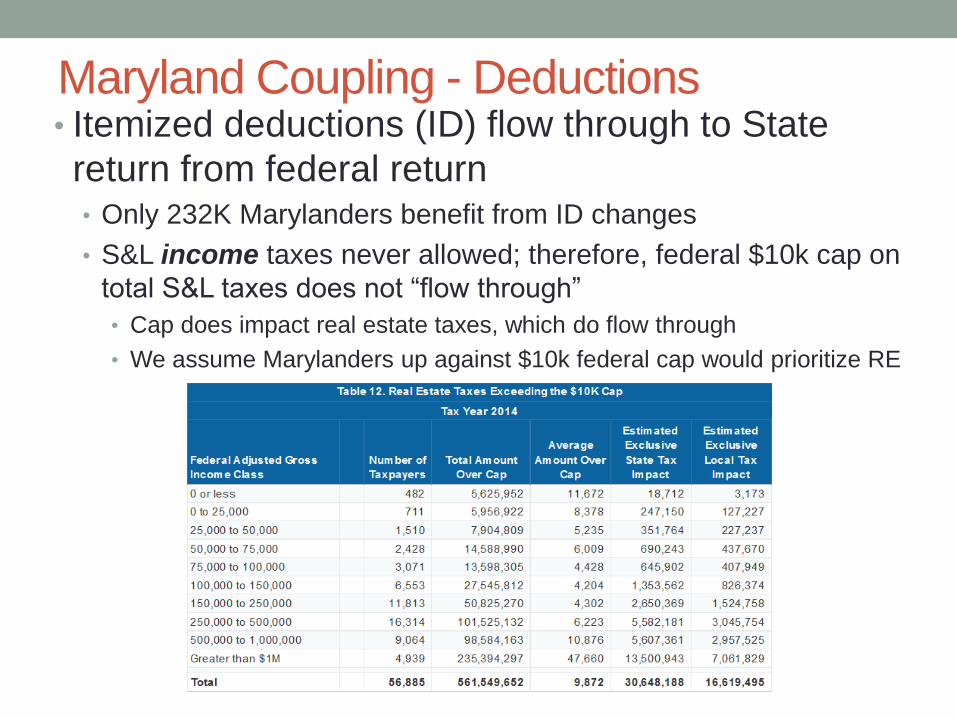
Maryland Coupling - Deductions• Itemized deductions (ID) flow through to State
return from federal return• Only 232K Marylanders benefit from ID changes
• S&L income taxes never allowed; therefore, federal $10k cap on
total S&L taxes does not “flow through”
• Cap does impact real estate taxes, which do flow through
• We assume Marylanders up against $10k federal cap would prioritize RE
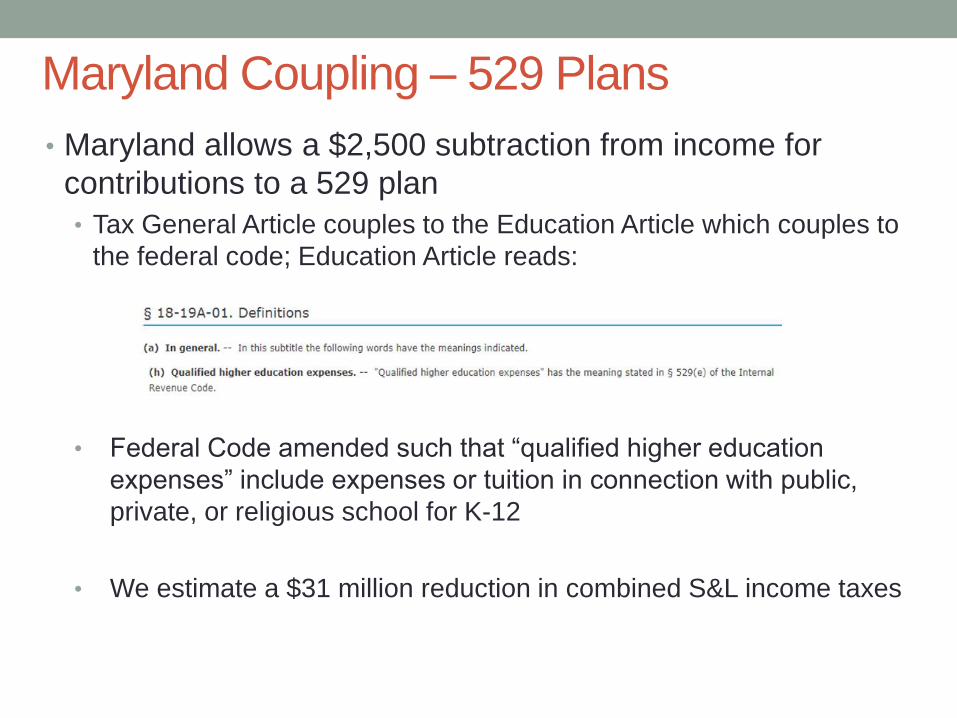
Maryland Coupling – 529 Plans
• Maryland allows a $2,500 subtraction from income for
contributions to a 529 plan
• Tax General Article couples to the Education Article which couples to
the federal code; Education Article reads:
• Federal Code amended such that “qualified higher education
expenses” include expenses or tuition in connection with public,
private, or religious school for K-12
• We estimate a $31 million reduction in combined S&L income taxes
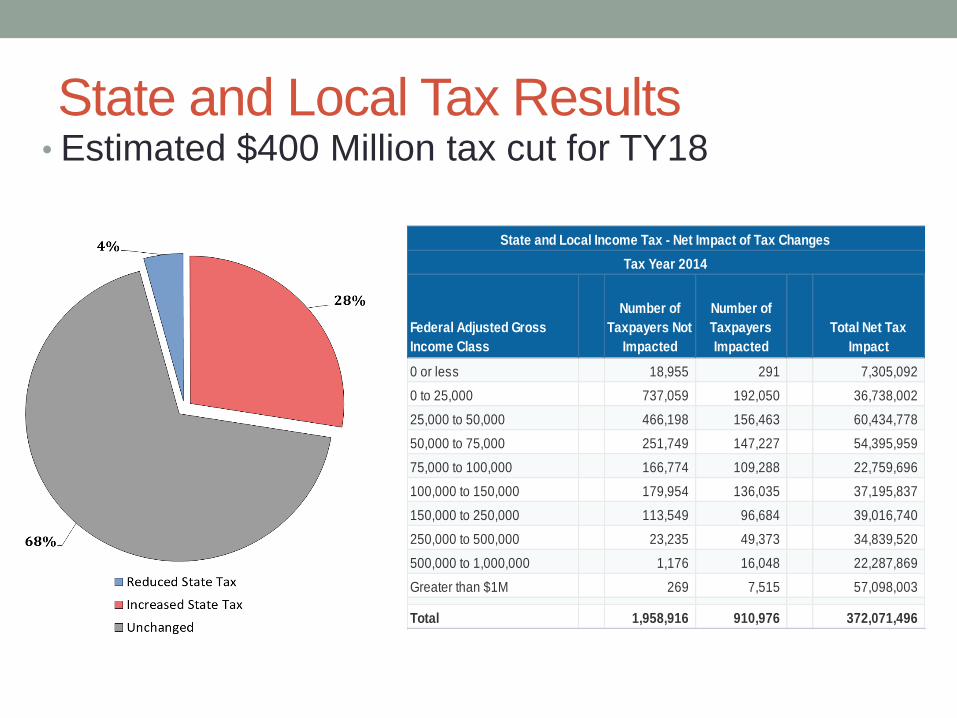
State and Local Tax Results• Estimated $400 Million tax cut for TY18
Federal Adjusted Gross
Income Class
Number of
Taxpayers Not
Impacted
Number of
Taxpayers
Impacted
Total Net Tax
Impact
0 or less 18,955 291 7,305,092
0 to 25,000 737,059 192,050 36,738,002
25,000 to 50,000 466,198 156,463 60,434,778
50,000 to 75,000 251,749 147,227 54,395,959
75,000 to 100,000 166,774 109,288 22,759,696
100,000 to 150,000 179,954 136,035 37,195,837
150,000 to 250,000 113,549 96,684 39,016,740
250,000 to 500,000 23,235 49,373 34,839,520
500,000 to 1,000,000 1,176 16,048 22,287,869
Greater than $1M 269 7,515 57,098,003
Total 1,958,916 910,976 372,071,496
State and Local Income Tax - Net Impact of Tax Changes
Tax Year 2014
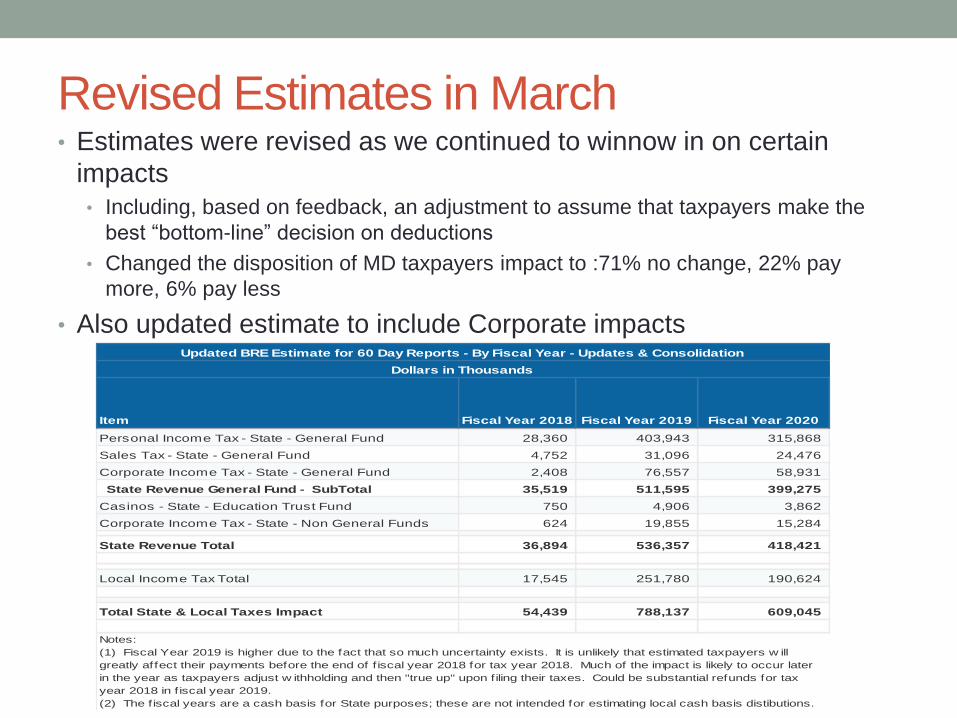
Revised Estimates in March• Estimates were revised as we continued to winnow in on certain
impacts
• Including, based on feedback, an adjustment to assume that taxpayers make the
best “bottom-line” decision on deductions
• Changed the disposition of MD taxpayers impact to :71% no change, 22% pay
more, 6% pay less
• Also updated estimate to include Corporate impacts
Item Fiscal Year 2018 Fiscal Year 2019 Fiscal Year 2020
Personal Income Tax - State - General Fund 28,360 403,943 315,868
Sales Tax - State - General Fund 4,752 31,096 24,476
Corporate Income Tax - State - General Fund 2,408 76,557 58,931
State Revenue General Fund - SubTotal 35,519 511,595 399,275
Casinos - State - Education Trust Fund 750 4,906 3,862
Corporate Income Tax - State - Non General Funds 624 19,855 15,284
State Revenue Total 36,894 536,357 418,421
- -
Local Income Tax Total 17,545 251,780 190,624
Total State & Local Taxes Impact 54,439 788,137 609,045
Updated BRE Estimate for 60 Day Reports - By Fiscal Year - Updates & Consolidation
Dollars in Thousands
Notes:
(1) Fiscal Year 2019 is higher due to the fact that so much uncertainty exists. It is unlikely that estimated taxpayers w ill
greatly affect their payments before the end of f iscal year 2018 for tax year 2018. Much of the impact is likely to occur later
in the year as taxpayers adjust w ithholding and then "true up" upon filing their taxes. Could be substantial refunds for tax
year 2018 in f iscal year 2019.
(2) The fiscal years are a cash basis for State purposes; these are not intended for estimating local cash basis distibutions.
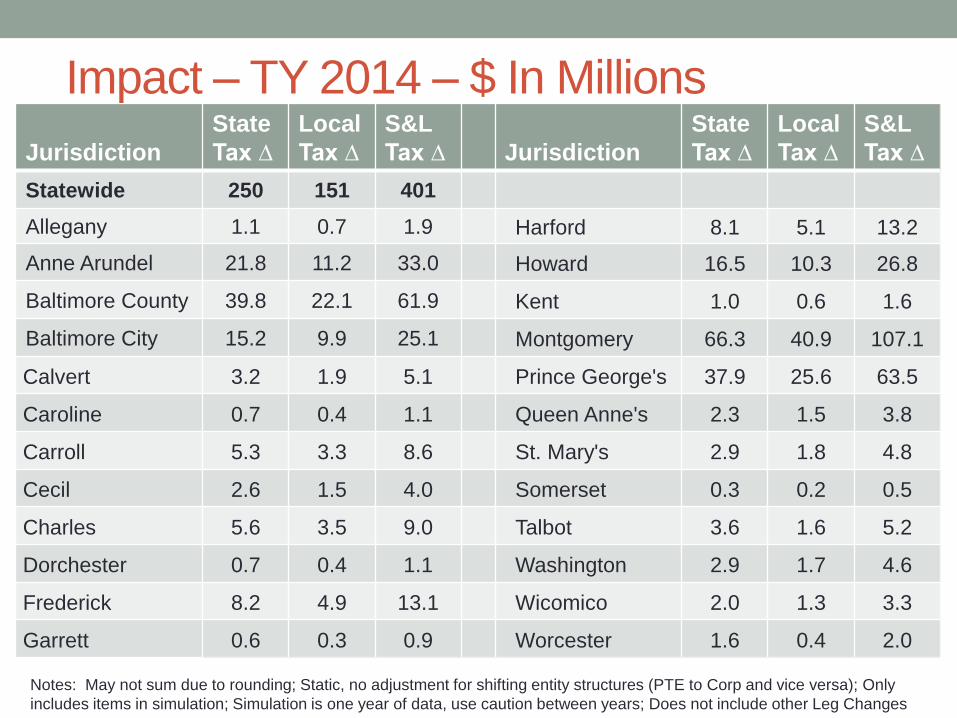
Impact – TY 2014 – $ In Millions
Jurisdiction
State
Tax ∆
Local
Tax ∆
S&L
Tax ∆ Jurisdiction
State
Tax ∆
Local
Tax ∆
S&L
Tax ∆
Statewide 250 151 401
Allegany 1.1 0.7 1.9 Harford 8.1 5.1 13.2
Anne Arundel 21.8 11.2 33.0 Howard 16.5 10.3 26.8
Baltimore County 39.8 22.1 61.9 Kent 1.0 0.6 1.6
Baltimore City 15.2 9.9 25.1 Montgomery 66.3 40.9 107.1
Calvert 3.2 1.9 5.1 Prince George's 37.9 25.6 63.5
Caroline 0.7 0.4 1.1 Queen Anne's 2.3 1.5 3.8
Carroll 5.3 3.3 8.6 St. Mary's 2.9 1.8 4.8
Cecil 2.6 1.5 4.0 Somerset 0.3 0.2 0.5
Charles 5.6 3.5 9.0 Talbot 3.6 1.6 5.2
Dorchester 0.7 0.4 1.1 Washington 2.9 1.7 4.6
Frederick 8.2 4.9 13.1 Wicomico 2.0 1.3 3.3
Garrett 0.6 0.3 0.9 Worcester 1.6 0.4 2.0
Notes: May not sum due to rounding; Static, no adjustment for shifting entity structures (PTE to Corp and vice versa); Only
includes items in simulation; Simulation is one year of data, use caution between years; Does not include other Leg Changes
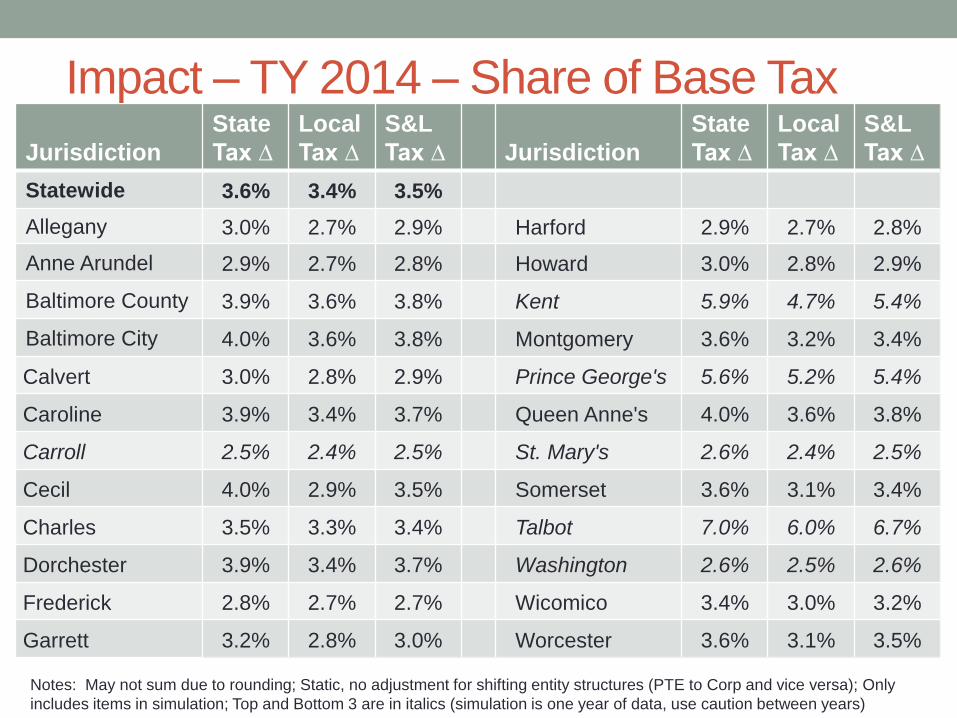
Impact – TY 2014 – Share of Base Tax
Jurisdiction
State
Tax ∆
Local
Tax ∆
S&L
Tax ∆ Jurisdiction
State
Tax ∆
Local
Tax ∆
S&L
Tax ∆
Statewide 3.6% 3.4% 3.5%
Allegany 3.0% 2.7% 2.9% Harford 2.9% 2.7% 2.8%
Anne Arundel 2.9% 2.7% 2.8% Howard 3.0% 2.8% 2.9%
Baltimore County 3.9% 3.6% 3.8% Kent 5.9% 4.7% 5.4%
Baltimore City 4.0% 3.6% 3.8% Montgomery 3.6% 3.2% 3.4%
Calvert 3.0% 2.8% 2.9% Prince George's 5.6% 5.2% 5.4%
Caroline 3.9% 3.4% 3.7% Queen Anne's 4.0% 3.6% 3.8%
Carroll 2.5% 2.4% 2.5% St. Mary's 2.6% 2.4% 2.5%
Cecil 4.0% 2.9% 3.5% Somerset 3.6% 3.1% 3.4%
Charles 3.5% 3.3% 3.4% Talbot 7.0% 6.0% 6.7%
Dorchester 3.9% 3.4% 3.7% Washington 2.6% 2.5% 2.6%
Frederick 2.8% 2.7% 2.7% Wicomico 3.4% 3.0% 3.2%
Garrett 3.2% 2.8% 3.0% Worcester 3.6% 3.1% 3.5%
Notes: May not sum due to rounding; Static, no adjustment for shifting entity structures (PTE to Corp and vice versa); Only
includes items in simulation; Top and Bottom 3 are in italics (simulation is one year of data, use caution between years)
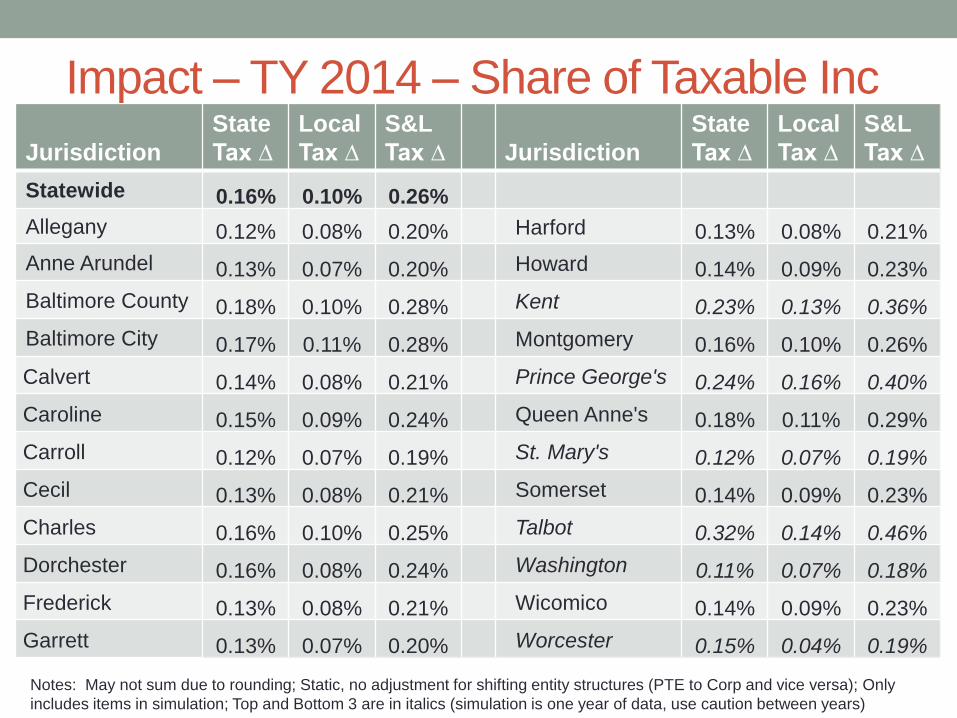
Impact – TY 2014 – Share of Taxable Inc
Jurisdiction
State
Tax ∆
Local
Tax ∆
S&L
Tax ∆ Jurisdiction
State
Tax ∆
Local
Tax ∆
S&L
Tax ∆
Statewide 0.16% 0.10% 0.26%
Allegany 0.12% 0.08% 0.20% Harford 0.13% 0.08% 0.21%
Anne Arundel 0.13% 0.07% 0.20% Howard 0.14% 0.09% 0.23%
Baltimore County 0.18% 0.10% 0.28% Kent 0.23% 0.13% 0.36%
Baltimore City 0.17% 0.11% 0.28% Montgomery 0.16% 0.10% 0.26%
Calvert 0.14% 0.08% 0.21% Prince George's 0.24% 0.16% 0.40%
Caroline 0.15% 0.09% 0.24% Queen Anne's 0.18% 0.11% 0.29%
Carroll 0.12% 0.07% 0.19% St. Mary's 0.12% 0.07% 0.19%
Cecil 0.13% 0.08% 0.21% Somerset 0.14% 0.09% 0.23%
Charles 0.16% 0.10% 0.25% Talbot 0.32% 0.14% 0.46%
Dorchester 0.16% 0.08% 0.24% Washington 0.11% 0.07% 0.18%
Frederick 0.13% 0.08% 0.21% Wicomico 0.14% 0.09% 0.23%
Garrett 0.13% 0.07% 0.20% Worcester 0.15% 0.04% 0.19%
Notes: May not sum due to rounding; Static, no adjustment for shifting entity structures (PTE to Corp and vice versa); Only
includes items in simulation; Top and Bottom 3 are in italics (simulation is one year of data, use caution between years)
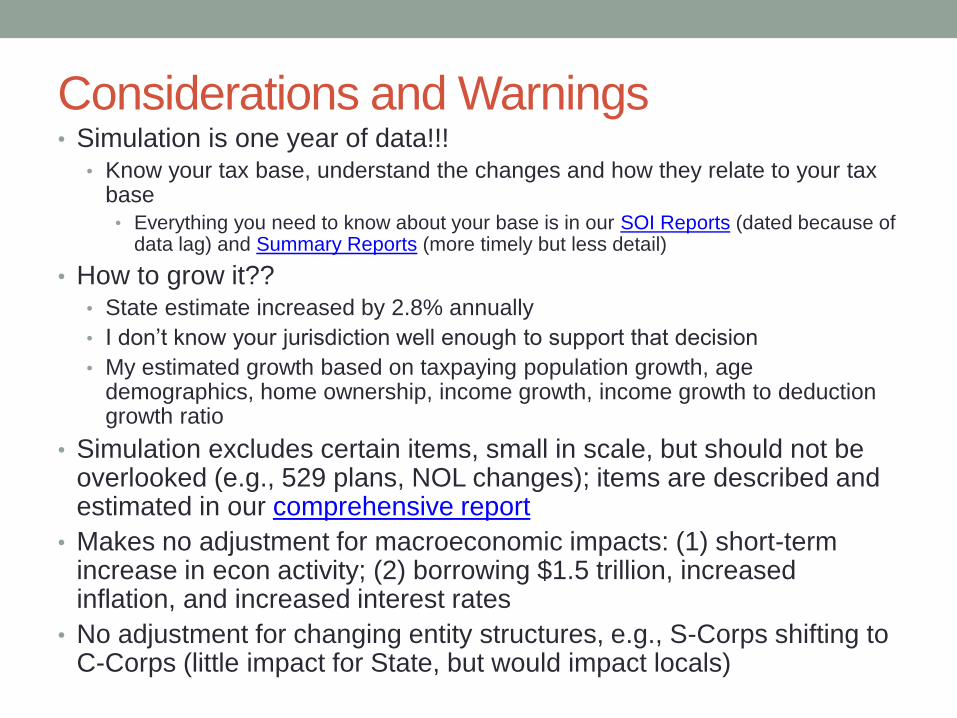
Considerations and Warnings• Simulation is one year of data!!!
• Know your tax base, understand the changes and how they relate to your tax base
• Everything you need to know about your base is in our SOI Reports (dated because of data lag) and Summary Reports (more timely but less detail)
• How to grow it??• State estimate increased by 2.8% annually
• I don’t know your jurisdiction well enough to support that decision
• My estimated growth based on taxpaying population growth, age demographics, home ownership, income growth, income growth to deduction growth ratio
• Simulation excludes certain items, small in scale, but should not be overlooked (e.g., 529 plans, NOL changes); items are described and estimated in our comprehensive report
• Makes no adjustment for macroeconomic impacts: (1) short-term increase in econ activity; (2) borrowing $1.5 trillion, increased inflation, and increased interest rates
• No adjustment for changing entity structures, e.g., S-Corps shifting to C-Corps (little impact for State, but would impact locals)
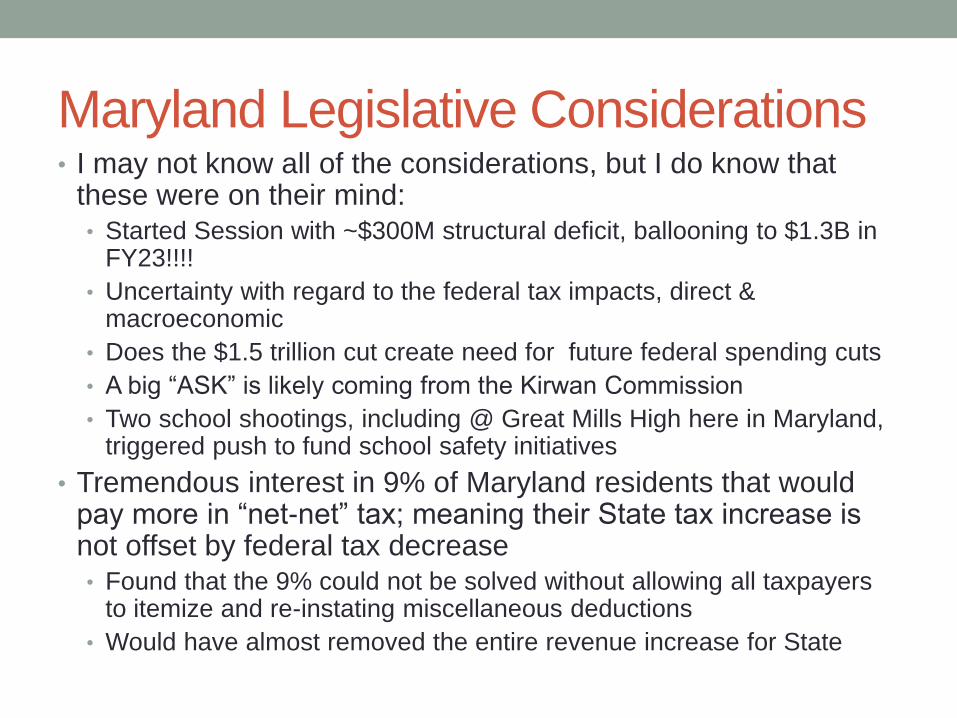
Maryland Legislative Considerations• I may not know all of the considerations, but I do know that
these were on their mind:
• Started Session with ~$300M structural deficit, ballooning to $1.3B in FY23!!!!
• Uncertainty with regard to the federal tax impacts, direct & macroeconomic
• Does the $1.5 trillion cut create need for future federal spending cuts
• A big “ASK” is likely coming from the Kirwan Commission
• Two school shootings, including @ Great Mills High here in Maryland, triggered push to fund school safety initiatives
• Tremendous interest in 9% of Maryland residents that would pay more in “net-net” tax; meaning their State tax increase is not offset by federal tax decrease
• Found that the 9% could not be solved without allowing all taxpayers to itemize and re-instating miscellaneous deductions
• Would have almost removed the entire revenue increase for State
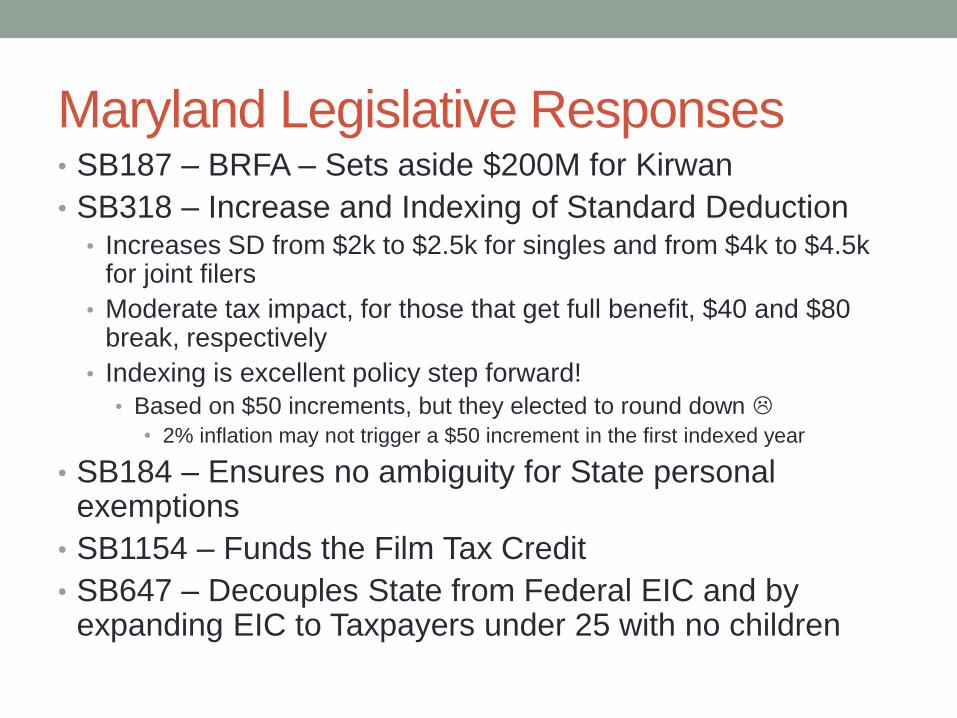
Maryland Legislative Responses• SB187 – BRFA – Sets aside $200M for Kirwan
• SB318 – Increase and Indexing of Standard Deduction• Increases SD from $2k to $2.5k for singles and from $4k to $4.5k
for joint filers
• Moderate tax impact, for those that get full benefit, $40 and $80 break, respectively
• Indexing is excellent policy step forward!
• Based on $50 increments, but they elected to round down
• 2% inflation may not trigger a $50 increment in the first indexed year
• SB184 – Ensures no ambiguity for State personal exemptions
• SB1154 – Funds the Film Tax Credit
• SB647 – Decouples State from Federal EIC and by expanding EIC to Taxpayers under 25 with no children
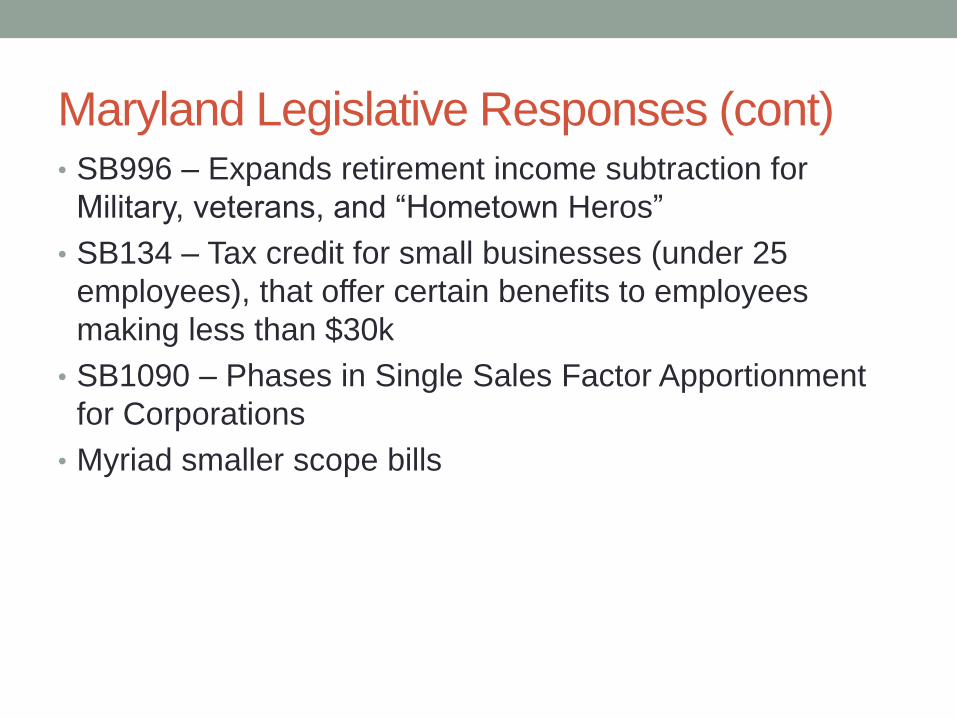
Maryland Legislative Responses (cont)• SB996 – Expands retirement income subtraction for
Military, veterans, and “Hometown Heros”
• SB134 – Tax credit for small businesses (under 25
employees), that offer certain benefits to employees
making less than $30k
• SB1090 – Phases in Single Sales Factor Apportionment
for Corporations
• Myriad smaller scope bills
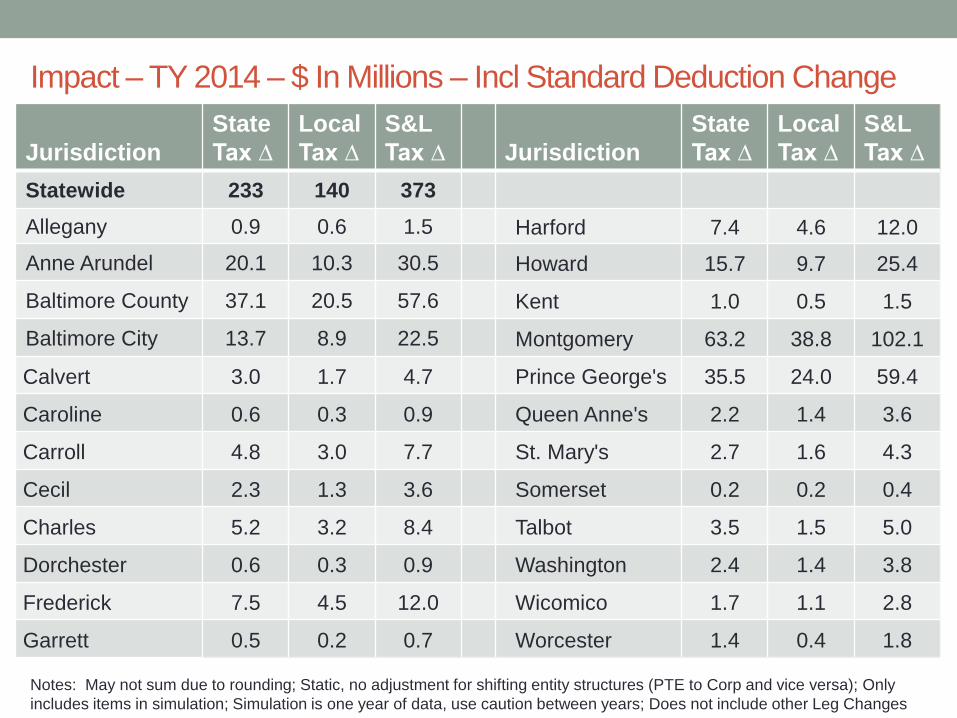
Impact – TY 2014 – $ In Millions – Incl Standard Deduction Change
Jurisdiction
State
Tax ∆
Local
Tax ∆
S&L
Tax ∆ Jurisdiction
State
Tax ∆
Local
Tax ∆
S&L
Tax ∆
Statewide 233 140 373
Allegany 0.9 0.6 1.5 Harford 7.4 4.6 12.0
Anne Arundel 20.1 10.3 30.5 Howard 15.7 9.7 25.4
Baltimore County 37.1 20.5 57.6 Kent 1.0 0.5 1.5
Baltimore City 13.7 8.9 22.5 Montgomery 63.2 38.8 102.1
Calvert 3.0 1.7 4.7 Prince George's 35.5 24.0 59.4
Caroline 0.6 0.3 0.9 Queen Anne's 2.2 1.4 3.6
Carroll 4.8 3.0 7.7 St. Mary's 2.7 1.6 4.3
Cecil 2.3 1.3 3.6 Somerset 0.2 0.2 0.4
Charles 5.2 3.2 8.4 Talbot 3.5 1.5 5.0
Dorchester 0.6 0.3 0.9 Washington 2.4 1.4 3.8
Frederick 7.5 4.5 12.0 Wicomico 1.7 1.1 2.8
Garrett 0.5 0.2 0.7 Worcester 1.4 0.4 1.8
Notes: May not sum due to rounding; Static, no adjustment for shifting entity structures (PTE to Corp and vice versa); Only
includes items in simulation; Simulation is one year of data, use caution between years; Does not include other Leg Changes
Thank You
• Link to Detailed Reports
• Simulation Results by County – PreSession
• Simulation Results by County – With SD Incr
Andrew Schaufele
Comptroller of Maryland
Director, Bureau of Revenue Estimates
410.260.7450