Embed Size (px)
Citation preview

Impact on the fuzzy modeling in operation
of electric distribution systems
GHEORGHE GRIGORAS, GHEORGHE CARTINA
Department of Power Systems
Technical University “Gheorghe Asachi” of Iasi
Bd. D. Mangeron, No. 51 - 53
ROMANIA
[email protected], [email protected]
Abstract: - Estimation of the load, particularly of the peak load, is basis for the system state estimation, and
for technical, and economic calculations. This makes possible improvement in economic operation,
maintenance of electrical equipment, and optimal planning and operating of electrical distribution systems. In
the paper, starting from a fuzzy correlation model of the loads, a power flow analysis from an electric
distribution system with the 20 kV voltage level is presented. The results showed that using a fuzzy correlation
model for the loads from the 20 kV nodes puts a new quality into the electric distribution system analysis in
uncertain conditions.
Key-Words: - fuzzy model, correlation loads, peak load, electric distribution system, power flow analysis.
1 Introduction Information plays a very important role in electric
distribution systems. Thus, estimation of the loads
represents basis for the system state estimation for
technical and economic calculations, [1]–[5].
The limited sources and the growing request of
electric energy, together with the impact of power
generation, transportation, distribution and usage on
the environment and the eco-system, motivates the
research on techniques to optimize the energy
utilization in cyber-physical energy systems, [6],
[7]. Cyber-physical systems (CPS) represent an
emerging technology that aims to integrate
embedded processing devices to monitor and control
physical processes, [6]–[10]. Cyber-Physical Energy
Systems (CPES) are a dedicated case of CPS
dealing with electric power systems. In Cyber-
Physical Energy Systems, the “physical” process is
made by a network of electric devices that are
controlled by a complex set of interconnected
embedded systems. In these systems, embedded
computing is integrated within the electric power
system to gather information about the most
relevant parameters, such as voltage, current,
phases, consumed energy and power, [6], [7].
Acquired data are then combined and processed to
generate suitable control commands to achieve the
desired application goal. Typical goal is the
estimation of the state corresponding to the electric
power system.
But the problem of generating a coherent
information set is critical in electric distribution
systems, because, except the usual measurements
from substations, there are few information about
the state of network, [1]. The continuous
measurement of the loading of network elements is
only carried out in particular places. In the
remaining part of the network load conditions are
only measured infrequently. With load modeling
based on power system elements it is possible to get
detailed information of the development of the loads
on elements such as transformers, lines, cable links
and this is used to support the planning and
operation of distribution systems, [11]-[13]. As a
result, there is at any moment a generalized
uncertainty about the power demand conditions and
therefore about the network loading, voltage level
and power losses. The effects of the load
uncertainties will propagate to calculation results,
affecting the state estimation and the optimal
solutions of the various problems concerning the
operation control and development planning, [1].
The complexity of the problem increased with
the size of the electric distribution system. In this
situation, different technologies such as fuzzy logic,
neural networks, and expert systems have been
developed to manage the large amount of data
available and to best utilize the information
provided in the data. One of immediate challenges is
what type of technology is suitable for us to
appropriately process the information to improve
our applications, [1]–[3], [5], [11], [20], [21].
In this paper, starting from a fuzzy correlation
model for the loads from 20 kV nodes of the electric
WSEAS TRANSACTIONS on CIRCUITS and SYSTEMS Gheorghe Grigoras, Gheorghe Cartina
E-ISSN: 2224-266X 105 Issue 4, Volume 11, April 2012
distribution system, a power flow analysis is made.
The obtained results are compared with values from
real case. The analysis revealed that the use of these
fuzzy models leads to satisfactory results regarding
to the state estimation of the electric distribution
system at the peak load.
2 Aspects about Fuzzy Modeling The notion of modeling is essential to modern
techniques of process control. Developing a control
process in fact means developing a model that
allows one to predict the action and reduce the
amount of feedback required. An important point
that needs to be made is that the model does not
represent reality, but is a projection of it in a
simplified space, whose dimensions were chosen
depending on the problem to be solved. The model
cannot be good or bad as such, but only adapted or
not to the prediction requirements of the process.
Modeling can be performed in numerous ways.
Not long ago, modeling meant systems of
differential equations, transfer functions, and so on.
The introduction of computers was perceived as a
powerful means of computation and of pushing the
limits of model complexity and process control.
Since its first presentation in 1965 by L. A.
Zadeh, the Fuzzy Techniques (FT) had an
unexpected growth and success. The broad
development of mathematical theory especially in
areas of Fuzzy Control, Neural Networks, and
Pattern Recognition provided the basis for different
applications. They finally became the driving force
of Fuzzy Techniques that today is reflected in many
different software and hardware products, [26].
The basic idea of FT is to model and to be able to
calculate with uncertainty. Mathematical models
and algorithms in electric power system theory aim
to be as close to reality as possible. The required
human observations, descriptions, and abstractions
during the modeling process are always a source of
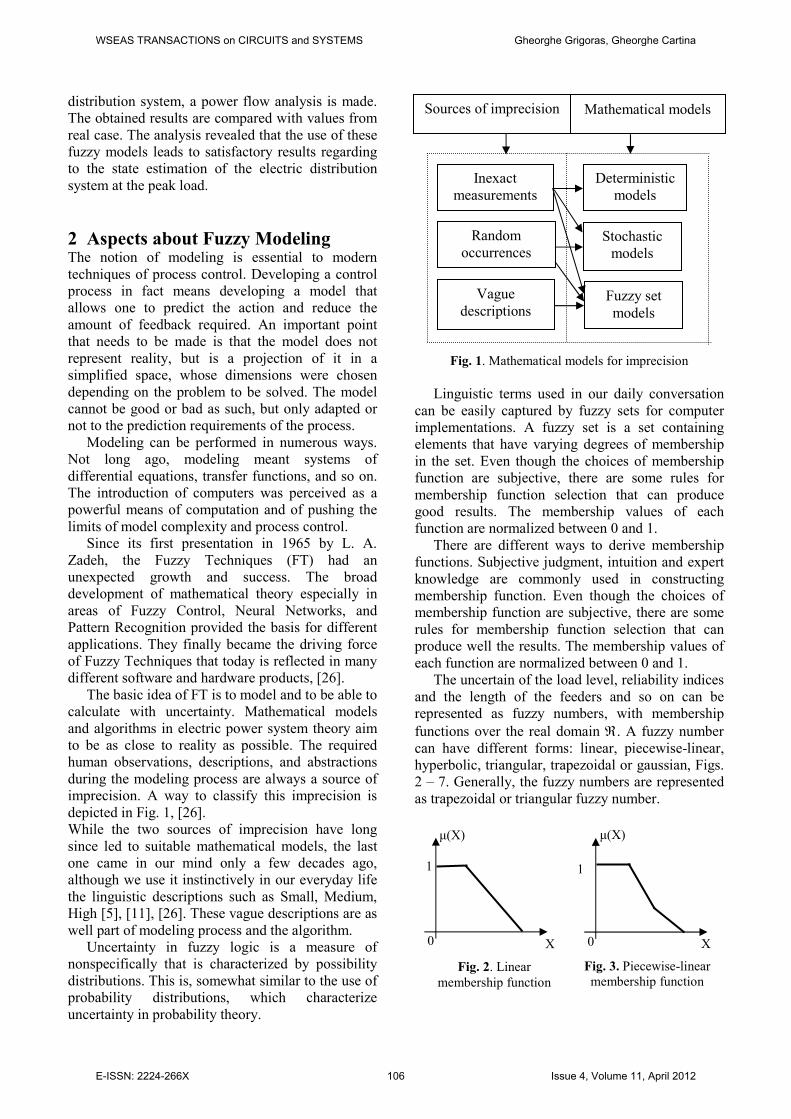
imprecision. A way to classify this imprecision is
depicted in Fig. 1, [26].
While the two sources of imprecision have long
since led to suitable mathematical models, the last
one came in our mind only a few decades ago,
although we use it instinctively in our everyday life
the linguistic descriptions such as Small, Medium,
High [5], [11], [26]. These vague descriptions are as
well part of modeling process and the algorithm.
Uncertainty in fuzzy logic is a measure of
nonspecifically that is characterized by possibility
distributions. This is, somewhat similar to the use of
probability distributions, which characterize
uncertainty in probability theory.
Fig. 1. Mathematical models for imprecision
Linguistic terms used in our daily conversation
can be easily captured by fuzzy sets for computer
implementations. A fuzzy set is a set containing
elements that have varying degrees of membership
in the set. Even though the choices of membership
function are subjective, there are some rules for
membership function selection that can produce
good results. The membership values of each
function are normalized between 0 and 1.
There are different ways to derive membership
functions. Subjective judgment, intuition and expert
knowledge are commonly used in constructing
membership function. Even though the choices of
membership function are subjective, there are some
rules for membership function selection that can
produce well the results. The membership values of
each function are normalized between 0 and 1.
The uncertain of the load level, reliability indices
and the length of the feeders and so on can be
represented as fuzzy numbers, with membership
functions over the real domain ℜ. A fuzzy number can have different forms: linear, piecewise-linear,
hyperbolic, triangular, trapezoidal or gaussian, Figs.
2 – 7. Generally, the fuzzy numbers are represented
as trapezoidal or triangular fuzzy number.
Sources of imprecision Mathematical models
Vague
descriptions
Random
occurrences
Inexact
measurements
Deterministic
models
Stochastic
models
Fuzzy set
models
Fig. 2. Linear
membership function
X 0
1
µ(X)
Fig. 3. Piecewise-linear
membership function
1
X 0
µ(X)
WSEAS TRANSACTIONS on CIRCUITS and SYSTEMS Gheorghe Grigoras, Gheorghe Cartina
E-ISSN: 2224-266X 106 Issue 4, Volume 11, April 2012

In the case of triangular and trapezoidal
representations, a fuzzy number A~ is usually
represented by its breaking points, Fig. 5, Fig. 6:
],,[),,(~
321 bamxxxA =⇔
(1)
],,,[),,,(
~4321 banmxxxxA =⇔
(2)
3 Fuzzy Modeling of the Nodal Loads
Using Correlation Theory The knowledge of loads at system buses is one of
the most important requirements, for efficient
operation of power systems. Estimation of the load,
particularly of peak loads, allows improvement in
operation and maintenance of electrical equipment
and in planning of network operating configuration,
[1], [12]. The main difficulties in modeling of peak
loads at receiving buses in distribution systems
result from the random nature of loads,
diversification of load shapes on different parts of
the systems, the deficiency of measured data and the
fragmentary and uncertain character of information
on loads and customers, [3]-[5].
The basic constraints of the general model are:
• It must represent flows at given time, compatible with the Kirchhoff laws.
• It must present coherency between estimated loads and measurements.
• The load allocation must be independent of the network topology under operation.
The last point is important: it would be
unacceptable, from an operator point of view that
the established load for a given node would
“magically” chance, if he performed some switching
or load transfer simulation.
Many factor such loads and voltages at system
buses, energy consumption, and parameters of
equivalent circuits are included in power
distribution calculations. These data is loaded with
different errors arising from the inaccuracy of
measuring instruments and deficiency of
measurements, [3]-[5], [13]. The theory, which enables efficient description on unreliable and
inaccurate data, and relationship between them, is
fuzzy set theory. This theory was introduced to
various engineering problems in which uncertainties
were represented as intrinsic ambiguities. In this
paper, the fuzzy numbers associated to a trapezoidal
membership function, Fig. 8, are used to represent a
vague knowledge about the load behavior, [2]-[5].
x
x 4
1
x1 x2 x3
µx
Fig. 8. Trapezoidal fuzzy load
This kind of models can be used to represent the
uncertain knowledge about load behavior either for
active and reactive powers.
Thus, if for some substations there are sufficient
database, for a good forecasting of the load, for the
other substations of the power system, the
forecasting of the load can be make using the
correlation study. Fig. 9 presents an uncorrelated
fuzzy load characterized by its active and reactive
membership functions expressed by trapezoidal
fuzzy numbers, [2].
Q [ kVAr]
P [kW] µ Q
1
1 µ P
Fig. 9. Uncorrelated P, Q fuzzy loads
Fig. 5. Triangular
membership function
0
Fig. 4. Hyperbolic
membership function
1
µ(X)
X m
1
b a
X 0
µ(X)
Fig. 6. Trapezoidal
membership function
µ(X)
n m
b a
0 X
1
0
1
µ(X)
X
Fig. 7. Gaussian
membership function
WSEAS TRANSACTIONS on CIRCUITS and SYSTEMS Gheorghe Grigoras, Gheorghe Cartina
E-ISSN: 2224-266X 107 Issue 4, Volume 11, April 2012

This representation allows concluding that,
assuming such a model, all possible combinations of
active and reactive powers values are possible.
Therefore, this model will certainly be far from
reality and another can be used, Fig. 10.
1
Q[ kVAr]
P [kW] µ Q
1
µ P
Fig. 10. Correlated P, Q fuzzy loads
Based on the correlation theory, the fuzzy models
of the loads can be obtained using the algorithm
presented below. The starting point of the algorithm
is statistical analysis of the active and reactive
curves of the substations and utilization of a linear
regression model. This can be made for different
time windows (window 24h, window 7h etc). The
window 24h can be used successfully to estimate the
hourly load on any substation. The other time
windows 7h can be used in the peak load estimation
of the substations, using the maximum value of the
active power recorded in a reference substation.
The steps of the algorithm [11], [13]:
• Select of a reference for the correlation study. The reference is chosen the active power curve
of the main injection point (usually the
connecting power station to a higher voltage
level grid);
• Calculation of the kPrPi and kP:
r
i
irir
P
P
PPPPkσ
σρ ⋅= ; (3)
hrjPPij
h
j
P LPkPkir
/)(1
⋅−=∑=
(4)
where:
Pr - the reference active power;
Pi – the active power on the i substation (i = 1, 2,
…, n, n is total number of the 20 kV substations
from the analysis system);
ρPrPi – the correlation coefficient between the
active powers of the substation i and reference r;
σPi, σPi – the standard deviations for Pi(t), Pr(t);
Lh – analysis window dimension (24, 7, etc);
h – hours number of the analysis windows.
• Determination the active powers of substations at the peak load hour of the system with the linear
regression model:
PrPPi kPkPir
+⋅= (5)
• Determination the fuzzy models for active powers of substations at the peak load hour.
Thus, for the maximum values of the reference, a
fuzzy trapezoidal model can be chosen, Fig. 8.
If the type reactive power curves from the 20 kV
distribution substations are known, for
determination of the relationship between the active
and reactive powers, same algorithm is used.
In this situation, the reference for the correlation
study is same, so the reactive powers could be
determined:
QrQPi kPkQir
+⋅= (6)
where coefficients kPrQi and kQ are same purport with
the coefficients kPrPi and kP.
In contrary case, for estimation of the fuzzy
reactive powers from the distribution substations the
following fuzzy variables are used: the fuzzy active
powers determined with the fuzzy model above
described and power factor cosϕ, considered as fuzzy variable with the trapezoidal membership
function having the following breaking points:
x1=0.85; x2=0.88; x3=0.92; x4=0.95.
The fuzzy model used for the cosϕ corresponds to urban residential loads. Also, fuzzy variables P
and cosϕ must be correlated as it is shown in Fig. 11.
Fig. 11. Correlation between fuzzy variables P and cosϕ
Finally, reactive powers result from relation:
ϕtan⋅= PQ (7)
x4
x3
x2
x1
x4 x3 x2 x1
P [kW]
cos ϕ
WSEAS TRANSACTIONS on CIRCUITS and SYSTEMS Gheorghe Grigoras, Gheorghe Cartina
E-ISSN: 2224-266X 108 Issue 4, Volume 11, April 2012

14
NOD 0
34
33
32
31
30
29
28
27
13
12
11
10
26
25
24
23
22
21
6
5
4
3
2
1
19
20
9
8
7
18
17
16
15
Fig. 12. The 20 kV test electric distribution system
4 Study Case A study case based on a 20 kV test electric
distribution system (34 substations) is used to
illustrate fuzzy power flow models, Fig. 12. The
distribution substations are equipped with one
transformer with the nominal power by 400 kVA,
630 kVA and 1000 kVA. The results of study are
obtained for the loading system at the peak load.
4.1 Estimation of the nodal loads The starting point for the proposed method based on
fuzzy modeling of the nodal load is statistical
analysis of the active and reactive power curves.
For example, in the Figs. 13 – 16, four analysis
windows for variation of active powers from the
substation no. 28 are represented: window 24h,
window 7h (tPL ± 3h), 7h (tPL-3h; tPL+3h), 7h (tPL-
4h; tPL+2h) and 7h (tPL-5h; tPL+1h) (where tPL
represents the hour when it registered the system
peak load).
In the Table 1, the estimated values of the active
powers from the all electric substations, at the peak
load, for the different time windows are presented.
For a better interpretation of the results, the
estimation errors are shown in the Fig. 17. The
lowest estimation errors were obtained for the time
window 7h (tPL-5; tPL+1).
P28(Pr) = 0,056⋅ Pr - 180
Pr [KW]
P28 [KW]
800
700
600
500
400
300
200
100
16000 14000 12000 10000 8000 6000
Fig. 13. The variation P28 (Pr), window 24 h
P28(Pr) = 0,054⋅ Pr - 150
P28 [kW]
Pr [kW]
700
660
620
580
540
15500 14500 13500 12500
Fig. 14. The variation P28(Pr), window 7h
(tPL–3h; tPL+3h)
WSEAS TRANSACTIONS on CIRCUITS and SYSTEMS Gheorghe Grigoras, Gheorghe Cartina
E-ISSN: 2224-266X 109 Issue 4, Volume 11, April 2012

P28(Pr) = 0,061⋅ Pr - 250
Pr [kW]
P28 [kW]
700
650
600
550
500
450
15500 14500 13500 12500 11500
Fig.15. The variation P28(Pr), window 7h
(tPL–4h; tPL+2h)
P28(Pr) = 0,06⋅ Pr - 240
P28 [kW]
Pr [kW]
700
600
500
400
15500 15000 14000 13000 12000 11000
Fig.16. The variation P28(Pr), window 7h
(tPL–5h; tPL+1h)
Table 1. The obtained results with the statistical model at the peak load hour of the distribution system
Window 24h Window 7h
(tPL -3; tPL+3)
Window 7h
(tPL-5; tPL+1) DS
Pm
[kW]
Pe
[kW]
ErrP [%]
Pe [kW]
ErrP [%]
Pe [kW]
Errp [%]
1 240.50 239.87 -0.25 242.91 1.00 239.18 -0.54
2 216.30 224.75 3.90 221.72 2.50 214.72 -0.73
3 311.10 346.66 11.43 325.90 4.75 315.86 1.53
4 436.00 397.62 -8.80 448.77 2.92 430.60 -1.23
5 410.70 381.80 -7.03 404.67 -1.46 422.27 2.81
6 420.30 422.38 0.49 415.96 -1.03 407.03 -3.15
7 600.60 614.11 2.24 597.28 -0.55 610.54 1.65
8 617.70 609.06 -1.39 605.77 -1.93 622.15 0.72
9 561.20 560.48 -0.12 553.07 -1.44 567.94 1.20
10 208.70 213.18 2.15 211.44 1.31 200.76 -3.80
11 617.00 607.32 -1.56 598.10 -3.06 626.26 1.50
12 588.10 562.06 -4.42 593.15 0.86 586.35 -0.29
13 404.90 408.13 0.79 378.81 -6.44 406.06 0.28
14 357.20 397.83 11.37 362.83 1.57 359.61 0.67
15 360.40 384.70 6.74 354.75 -1.56 363.06 0.73
16 365.60 371.42 1.59 388.43 6.24 356.33 -2.53
17 545.70 596.06 9.22 596.63 9.33 543.04 -0.48
18 254.90 257.03 0.83 257.09 0.86 260.77 2.30
19 191.30 213.61 11.66 202.63 5.92 191.78 0.25
20 168.10 196.46 16.87 183.60 9.22 162.46 -3.35
21 667.50 622.26 -6.77 618.86 -7.28 662.08 -0.81
22 421.40 409.54 -2.81 414.28 -1.68 428.87 1.77
23 440.40 388.90 -11.69 411.62 -6.53 436.36 -0.91
24 637.00 642.21 0.81 633.43 -0.56 619.42 -2.75
25 452.30 444.02 -1.82 459.63 1.62 448.10 -0.92
26 623.70 534.84 -14.24 615.64 -1.29 616.91 -1.08
27 402.20 392.49 -2.41 394.50 -1.91 408.35 1.53
28 671.80 677.40 0.83 686.71 2.21 679.72 1.18
29 634.10 643.68 1.51 640.00 0.93 628.87 -0.82
30 594.20 569.71 -4.12 613.92 3.32 594.83 0.10
31 388.10 437.63 12.76 386.38 -0.44 399.55 2.95
32 329.80 341.49 3.54 332.31 0.76 330.87 0.32
33 571.00 568.94 -0.36 563.85 -1.25 549.30 -3.80
34 635.40 667.39 5.03 630.39 -0.78 655.06 3.09
WSEAS TRANSACTIONS on CIRCUITS and SYSTEMS Gheorghe Grigoras, Gheorghe Cartina
E-ISSN: 2224-266X 110 Issue 4, Volume 11, April 2012

The errors were calculated with the relation:
(%)100⋅−
=im
imie
P
PPErr (8)
where:
Pmi – real value for active power from electric
substation i;
Pei – estimated values for active power from
electric substation i.
But, because of the difficulties in the modeling
of peak load from the electric distribution system, in
the following fuzzy techniques are used.
The uncertain of the peak load was represented
as fuzzy number with a trapezoidal membership
function. The breaking points (x1, x2, x3 and x4) of
the fuzzy trapezoidal numbers, corresponding to the
active and reactive powers from substations at the
peak load of analyzed electric distribution system,
window 7h(tPL-5; tPL+1), are presented in Table 2.
0
2
4
6
8
10
12
14
16
18
1 2 3 4 5 6 7 8 9 10 11 12 13 14 15 16 17 18 19 20 21 22 23 24 25 26 27 28 29 30 31 32 33 34
No. substation
Error [%]
Window 24 h
Window 7h (tPL-5;tPL+1)
Window 7h (tPL-4;tPL+2)
Fig. 17. The estimation errors obtained with the statistical
model for different time windows
Table 2. Breaking points for the fuzzy trapezoidal models, window 7h (tPL-5h; tPL+1h) Active Power Reactive Power
DS x1 [kW]
x2
[kW]
x3
[kW]
x3
[kW]
CrispP [kW]
x1 [kVAr]
x2 [kVAr]
x3
[kVAr]
x4 [kVAr]
CrispQ [kVAr]
1 203.97 221.57 239.18 256.78 230.37 126.41 119.59 101.89 84.40 108.07
2 181.20 197.96 214.72 231.47 206.34 112.30 106.85 91.47 76.08 96.68
3 262.84 289.35 315.86 342.37 302.61 162.90 156.18 134.56 112.53 141.54
4 331.89 381.24 430.60 479.95 405.92 205.69 205.78 183.44 157.75 188.16
5 396.70 409.48 422.27 435.05 415.88 245.85 221.02 179.89 143.00 197.44
6 364.66 385.85 407.03 428.22 396.44 226.00 208.26 173.40 140.75 187.10
7 563.46 587.00 610.54 634.07 598.77 349.21 316.83 260.09 208.41 283.63
8 553.52 587.83 622.15 656.46 604.99 343.04 317.28 265.03 215.77 285.28
9 521.49 544.71 567.94 591.16 556.32 323.19 294.01 241.94 194.31 263.36
10 162.19 181.47 200.76 220.05 191.12 100.52 97.95 85.53 72.33 89.08
11 570.93 598.59 626.26 653.93 612.43 353.83 323.09 266.79 214.94 289.66
12 532.85 559.60 586.35 613.10 572.98 330.23 302.04 249.79 201.52 270.90
13 411.23 408.65 406.06 403.48 407.35 254.86 220.57 172.98 132.62 195.26
14 316.62 338.11 359.61 381.10 348.86 196.23 182.50 153.19 125.26 164.30
15 334.89 348.97 363.06 377.14 356.01 207.55 188.36 154.66 123.96 168.63
16 301.29 328.81 356.33 383.84 342.57 186.73 177.48 151.80 126.16 160.54
17 439.03 491.04 543.04 595.04 517.04 272.09 265.04 231.34 195.58 241.01
18 216.96 238.86 260.77 282.67 249.82 134.46 128.93 111.09 92.91 116.85
19 169.93 180.85 191.78 202.70 186.32 105.32 97.62 81.70 66.63 87.82
20 145.98 154.22 162.46 170.70 158.34 90.47 83.24 69.21 56.11 74.76
21 626.18 644.13 662.08 680.03 653.11 388.08 347.67 282.05 223.52 310.33
22 419.03 423.95 428.87 433.79 426.41 259.69 228.83 182.70 142.58 203.45
23 390.01 413.19 436.36 459.54 424.77 241.71 223.02 185.89 151.04 200.42
24 549.63 584.52 619.42 654.31 601.97 340.63 315.50 263.87 215.06 283.77
25 395.52 421.81 448.10 474.39 434.96 245.13 227.67 190.89 155.92 204.90
26 544.85 580.88 616.91 652.94 598.90 337.67 313.53 262.81 214.61 282.16
27 401.53 404.94 408.35 411.76 406.65 248.85 218.57 173.96 135.34 194.18
28 587.35 633.54 679.72 725.91 656.63 364.01 341.95 289.56 238.60 308.53
29 590.84 609.85 628.87 647.89 619.36 366.17 329.17 267.90 212.95 294.05
30 518.79 556.81 594.83 632.85 575.82 321.52 300.54 253.40 208.01 270.87
31 391.53 395.54 399.55 403.56 397.55 242.65 213.49 170.21 132.64 189.75
32 306.86 318.86 330.87 342.87 324.87 190.18 172.11 140.95 112.70 153.98
33 480.38 514.84 549.30 583.75 532.07 297.72 277.88 234.00 191.87 250.37
34 626.36 640.71 655.06 669.41 647.89 388.19 345.82 279.06 220.03 308.27
WSEAS TRANSACTIONS on CIRCUITS and SYSTEMS Gheorghe Grigoras, Gheorghe Cartina
E-ISSN: 2224-266X 111 Issue 4, Volume 11, April 2012
The values for active powers were obtained
using the correlation/linear regression model (5), for
which the fuzzy model of the reference has the
following values of the breaking points: x1=0.9⋅Pr;
x2=0.95⋅Pr; x3 = Pr and x4 = 1.05⋅Pr. The results for
the reactive powers were obtained using model (6),
using same reference.
The crisp values (CrispP and CrispQ) from the
Table 2 represent values obtained from
defuzzification process using the centroid method.
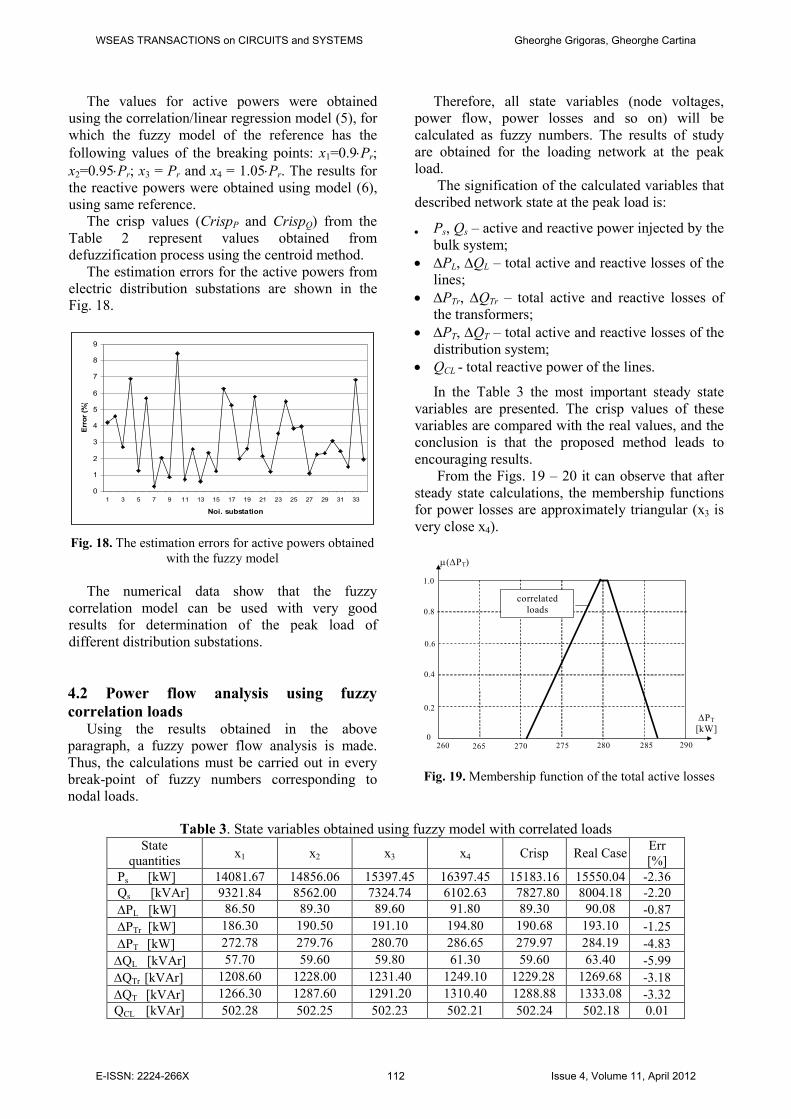
The estimation errors for the active powers from
electric distribution substations are shown in the
Fig. 18.
0
1
2
3
4
5
6
7
8
9
1 3 5 7 9 11 13 15 17 19 21 23 25 27 29 31 33
Noi. substation
Error (%)
Fig. 18. The estimation errors for active powers obtained
with the fuzzy model
The numerical data show that the fuzzy
correlation model can be used with very good
results for determination of the peak load of
different distribution substations.
4.2 Power flow analysis using fuzzy
correlation loads Using the results obtained in the above
paragraph, a fuzzy power flow analysis is made.
Thus, the calculations must be carried out in every
break-point of fuzzy numbers corresponding to
nodal loads.
Therefore, all state variables (node voltages,
power flow, power losses and so on) will be
calculated as fuzzy numbers. The results of study
are obtained for the loading network at the peak
load.
The signification of the calculated variables that
described network state at the peak load is:
• Ps, Qs – active and reactive power injected by the
bulk system; • ∆PL, ∆QL – total active and reactive losses of the
lines;
• ∆PTr, ∆QTr – total active and reactive losses of
the transformers;
• ∆PT, ∆QT – total active and reactive losses of the
distribution system;
• QCL - total reactive power of the lines.
In the Table 3 the most important steady state
variables are presented. The crisp values of these
variables are compared with the real values, and the
conclusion is that the proposed method leads to
encouraging results.
From the Figs. 19 – 20 it can observe that after
steady state calculations, the membership functions
for power losses are approximately triangular (x3 is
very close x4).
Fig. 19. Membership function of the total active losses
Table 3. State variables obtained using fuzzy model with correlated loads State
quantities x1 x2 x3 x4 Crisp Real Case
Err
[%]
Ps [kW] 14081.67 14856.06 15397.45 16397.45 15183.16 15550.04 -2.36
Qs [kVAr] 9321.84 8562.00 7324.74 6102.63 7827.80 8004.18 -2.20
∆PL [kW] 86.50 89.30 89.60 91.80 89.30 90.08 -0.87
∆PTr [kW] 186.30 190.50 191.10 194.80 190.68 193.10 -1.25
∆PT [kW] 272.78 279.76 280.70 286.65 279.97 284.19 -4.83
∆QL [kVAr] 57.70 59.60 59.80 61.30 59.60 63.40 -5.99
∆QTr [kVAr] 1208.60 1228.00 1231.40 1249.10 1229.28 1269.68 -3.18
∆QT [kVAr] 1266.30 1287.60 1291.20 1310.40 1288.88 1333.08 -3.32
QCL [kVAr] 502.28 502.25 502.23 502.21 502.24 502.18 0.01
µ(∆PT)
1.0
0.8
0.6
0.4
0.2
0 290 285 280 275 270 265260
∆PT [kW]
correlated
loads
WSEAS TRANSACTIONS on CIRCUITS and SYSTEMS Gheorghe Grigoras, Gheorghe Cartina
E-ISSN: 2224-266X 112 Issue 4, Volume 11, April 2012

Fig. 20. Membership function of the total reactive losses
5 Conclusions Starting from the statistical analysis, a method based
on the fuzzy modeling of active and reactive powers
from the substations corresponding to an electric
distribution system is proposed. The numerical
results show that the fuzzy correlation models can
be used with very good results for determination of
the peak load corresponding distribution substations,
and further with the state estimation of the system.
Generally, if the time window is less and
correlated with the overall loads then, the obtained
results are better.
Combination of the fuzzy approach with the
expert systems leads to an efficient and robust tools.
References:
[1] V. Miranda, J. Pereira, J. T. Saraiava, Load Allocation in DMS with a Fuzzy State
Estimator, IEEE Transaction on Power
Systems, vol. 15, no. 2, pp. 329 – 534, 2000.
[2] J. T. Saraiava, F. Duarte, Enhanced Fuzzy
Power Flow Models Integrating Correlation
Between Nodal Injections, Proceedings of
Mediterranean Electrotechnical Conference,
1996, pp. 885 – 889.
[3] J. Nazarko, W. Zalewski, The Fuzzy
Regression Approach to Peak Load Estimation
in Power Distribution Systems, IEEE
Transaction on Power Systems, vol. 14, no. 3,
1999, pp. 809 – 814,.
[4] G. Cartina, V. Alexandrescu, G. Grigoras, M. Moshe, Peak Load Estimation in Distribution
Networks by Fuzzy Regression Approach,
Proceedings of Mediterranean Electrotechnical
Conference, MELECON 2000, Nicosia,
Cyprus, vol.III, 2000, pp.907-910.
[5] J. T. Saraiava., V. Miranda, L. Pinto, Impact on some planning decisions from a fuzzy
modeling of power systems, IEEE Transaction
on Power Systems, vol. 9, no. 2, 1994, pp. 819-
825.
[6] T. Facchinetti, E. Bini, M. Bertogna, Reducing the Peak Power through Real-Time Scheduling
Techniques in Cyber-Physical Energy Systems,
Proceedings of 1st International Workshop on
Energy Aware Design and Analysis of Cyber
Physical Systems Stockholm, Sweden, 2010.
http://retis.sssup.it /~marko/ papers/ WEA10.
[7] T. Facchinetti, M. Della Vedora, Real-Time Modeling for Direct Load Control in Cyber-
Physical Power Systems, IEEE Transactions on
Industrial Informatics, vol. 7, no. 4, 2011, pp.
689 – 698.
[8] M. Li, W. Zhao, Asymptotic identity in min-plus algebra: a report on CPNS, Computational
and Mathematical Methods in Medicine, vol.
2012, 2012.
[9] M. Li, W. Zhao, Visiting Power Laws in Cyber-Physical Networking Systems,
Mathematical Problems in Engineering, vol.
2012, 2012.
[10] C. Tricaud, Y.Q. Chen, Optimal Mobile Sensing and Actuation Policies in Cyber-
Physical Systems, Springer, 2012.
[11] G. Cartina, G. Grigoras, Artificial Intelligence.
Optimizations in Power System, VENUS
Publishing House, Iasi, Romania, 2001.
[12] G. Grigoras, G. Cartina, V. Alexandrescu, Using Fuzzy Logic in Distribution Network
Power Loss Estimation, Bulletin of the
Polytechnic Institute of Iasi, vol L(LIV), no.
5A, pp.157 – 162, 2004.
[13] G. Grigoras, C. Barbulescu, Fl. Rotaru, G. Cartina, Using of the fuzzy correlation
estimation of power stations, Proceeding of the
8th International Conference on Industrial
Power Engineering, 2011, pp. 31 – 35.
[14] V. Alexandrescu, Gh. Cartina, Gh. Grigoras, On Power Flow Problem of Distribution
Networks Under Condition of Lack Of
Information, Bulletin of the Polytechnic
Institute of Iasi, no. 2, , 2010, pp. 77 – 87.
[15] E.C. Bobric, G. Cartina, G. Grigoras Fuzzy Techniques used for Energy Losses
Determination in Medium and Low Voltage
Networks, Journal of Electronics and
Electrical Engineering, vol. 10, no. 2, 2009, pp.
95 – 98.
[16] G. Cartina, G. Grigoras, E.C. Bobric, D. Comanescu, Improved Fuzzy Load Models by
∆QT
[kVAr] 0
1.0
0.8
0.6
0.4
0.2
µ(∆QT)
1310 1300 1290 1280 1250 1260 1270 1320
correlated
loads
WSEAS TRANSACTIONS on CIRCUITS and SYSTEMS Gheorghe Grigoras, Gheorghe Cartina
E-ISSN: 2224-266X 113 Issue 4, Volume 11, April 2012

Clustering Techniques in Optimal Planning of
Distribution Networks, Proceedings of IEEE
Bucharest Power Tech Conference, Bucharest,
Romania, 2009, pp.1-6.
[17] G. Grigoras, G. Cartina, M. Gavrilas, Using of Clustering Techniques in Optimal Placement of
Phasor Measurements Units, Proceedings of
the 9th WSEAS/IASME International
Conference on Electric Power Systems, High
Voltage, Electric Machines, 2009, Genoa, Italy,
pp. 104 – 108.
[18] G. Grigoras, G. Cartina, Fl. Rotaru, Using K-Means Clustering Method in Determination of
the Energy Losses Levels from Electric
Distribution Systems, Proceedings of the 12th
WSEAS International Conference on
Mathematical Methods and Computational
Techniques in Electrical Engineering,
Timisoara, Romania, 2010, pp. 52 – 56.
[19] G. Grigoras, G. Cartina, M. Istrate, Fl. Rotaru, The Efficiency of the Clustering Techniques in
the Energy Losses Evaluation from
Distribution Networks, International Journal of
Mathematical Models and Methods in Applied
Sciences, vol. 5, no. 1, 2011, pp. 133 – 140.
[20] M. Gandomkar, Application of Genetic
Algorithm to Distribution Network Expansion
Planning with Distributed Generation,
Proceedings of the 8th WSEAS/IASME
International Conference on Electric Power
Systems, High Voltage, Electric Machines,
Venice, Italy, 2008, pp. 15–20.
[21] M. R. Farooqi, P.K.Agarwal, K. R. Niazi, Multi-objective Distribution Feeder
Reconfiguration, Proceedings of the 7th
WSEAS/IASME International Conference on
Electric Power Systems, High Voltage, Electric
Machines, 2007, pp. 131–138.
[22] W. Zhao, X. Fang, X. Dong, Y. Bi, Y. Wu, An implementation of parallel power flow
calculation based on graph partitioning
algorithm, WSEAS Transactions on Circuits
and Systems, vol. 9, no. 4, 2010, pp. 258 – 272.
[23] M. Hanmandlu, B. K. Chauhan, Load Forecasting Using Hybrid Models, IEEE
Transaction on Power Systems, vol. 26, no. 1,
2011, pp. 20 – 29.
[24] C.N. Elias, N. D. Hatziargyriou, An Annual Midterm Energy Forecasting Model Using
Fuzzy Logic, IEEE Transaction on Power
Systems, vol. 24, no. 1, 2009, pp. 469 – 478.
[25] D. Thukaram, H. M. Wijekoon Banda, J. Jerome, A Robust Three Phase Power Flow
Algorithm for Radial Distribution System.
International Journal of Electric Power
Systems Research, vol. 50, 1999, pp. 227-236.
[26] Ph. Seitz, H.J. Hubrich, A. Bovy, Reliability Evaluation Of Power Distribution Systems
With Local Generation Using Fuzzy Sets ,
Proceeding of the 11the
PSCC, vol. I, pp. 39 –
45, 1993.
WSEAS TRANSACTIONS on CIRCUITS and SYSTEMS Gheorghe Grigoras, Gheorghe Cartina
E-ISSN: 2224-266X 114 Issue 4, Volume 11, April 2012