Embed Size (px)
Citation preview

Impact Theories: Trends in Off-site Shelving Facility Use
Zack Lane and Colleen Major
Columbia University
12/5/2008

Contents
• This handout presents staff research, contextual data related to ReCAP collection use and current conclusions– Part 1 is an introduction to ReCAP at CUL and
Electronic Document Delivery– Part 2 provides context about collection use and
related data– Part 3 explores the idea of “high-use”– Part 4 describes the research and conclusions about
the EDD impact theories– Part 5 offers ideas and plans for both action and
future research

Part 1: Introduction
• What is ReCAP?
• What is the current trend of Electronic Document Delivery requests from ReCAP?
• What are the theories to explain the decline?
• What other topics does this handout explore?

ReCAP
• Research Collections and Preservation Consortium (ReCAP) is a high-density shelving facility
• It is operated by partners Columbia University, New York Public Library and Princeton University
• ReCAP currently has accessioned 7.1 million volumes since opening in January 2002

ReCAP Websites
• Princeton/ReCAP Facility: http://recap1.princeton.edu/about/general.html
• CUL ReCAP (staff): https://www1.columbia.edu/sec/cu/libraries/bts/recap/index.html
• CUL ReCAP (public): http://www.columbia.edu/cu/lweb/indiv/offsite/index.html
• NYPL: http://www.nypl.org/research/services/offsite.html
Access to ReCAP Collections
• Speed and convenient access to off-site collections are high priorities for Columbia University
• Physical requests are normally delivered in one business day
• Patrons may also request Electronic Document Delivery (EDD)
• EDD: ReCAP staff scan and deliver articles/book chapters by email

Total Volume of EDD Requests by Financial Year
0
500
1,000
1,500
2,000
2,500
3,000
FY02 FY03 FY04 FY05 FY06 FY07 FY08

Decline Trend for EDD Requests
• Staff noticed an unexpected downturn in total number of EDD requests
• Several impact theories may explain the downturn:– Increased online availability of full-text
electronic journals– Local initiative Science Fast-Track– Patron preference/use patterns

Part 2: Collection Use at ReCAP
• What is the purpose of ReCAP?
• How is data gathered?
• What is the contextual data for overall collection use?
• How are individual trends identified?
• How will data and findings be used?

What is the purpose of ReCAP?
1. Provide quick, accurate access to low-use materials (shelving)
2. Accommodate under-processed archive and print collections (storage)
3. Alleviate over-crowding of onsite collections (shelving/storage)

Goals of Data Gathering/Analysis• Outline of ReCAP-related data: general
collection use and high-use titles• Data given context and have been examined for
validity• Opportunity to evaluate the effectiveness and
efficiency of off-site transfer• Data analysis helps staff ask insightful questions
about collection use and management• Provide raw material for data-driven decision
making

Current Metrics
• ReCAP is CUL’s largest collection
• CUL has 3.1 million volumes shelved at ReCAP (out of 7.1 million total)
• 61,115 retrievals in FY08
• 258,060 new accessions in FY08
• New accessions for FY09 will be even larger, possibly 400,000-500,000 volumes

Retrieval Rate
• Retrieval rate is primary measure of collection use
• CUL targets low-use material for transfer
• Target retrieval rate is 2.0% per year
• Target retrieval rate was set in cooperation with ReCAP partners to calculate staffing costs
• Original target rate was 4.0% per year

Retrieval Data
• Data are collected by both ReCAP and CUL• CUL measures requests; ReCAP measures
retrievals• Request: patron or staff submission for access.
Requests may fail or not be tallied for several, known reasons.
• Retrieval: when ReCAP staff physically retrieve a volume from the shelves.
• Total requests/retrievals:– CUL : 222,526– ReCAP : 232,235

Requests (CUL) vs. Retrievals (ReCAP)
Request Data: CUL vs. ReCAP
0
1,000
2,000
3,000
4,000
5,000
6,000
7,000
8,000
Date
Volu
me
ReCAP Retrievals CUL Requests

Volume Increase
• Request volume has consistently increased
• Accession volume has consistently increased
• ReCAP data sets are used to calculate retrieval rate
• (NB: Law Library uses a separate ILS from the rest of CUL; data sets are also separate)

CUL Accessions at ReCAPTotal Accessions: ReCAP
3,071,233
2,867,299
159,431
0
500,000
1,000,000
1,500,000
2,000,000
2,500,000
3,000,000
3,500,000
CUL and Law
CUL only
Law Library

Retrieval RateRetrieval Rate: ReCAP (including Law Library)
0.00%
0.50%
1.00%
1.50%
2.00%
2.50%
3.00%
3.50%

Retrieval Rate by Financial Year
1.63% 1.63%
1.87%1.95% 2.00% 2.01%
2.14%
1.91%
0.00%
0.50%
1.00%
1.50%
2.00%
2.50%
FY02 FY03 FY04 FY05 FY06 FY07 FY08 OVERALL
Retrieval Rate per Financial Year

Collection Use Analysis
• Data collected by CUL • Two sources
– Voyager Circulation Data– Request Data
• Both data sets are very large and contain many elements
• Circulation patterns show collection use by patron group
• Key to chart legends: GRD=Grad Students, REG=Undergraduates, OFF=Faculty and VIS=Vistors

Butler Circulation ONSITE Collection Charges
0
2000
4000
6000
8000
10000
12000
14000
16000
18000
GRD OFF REG VIS
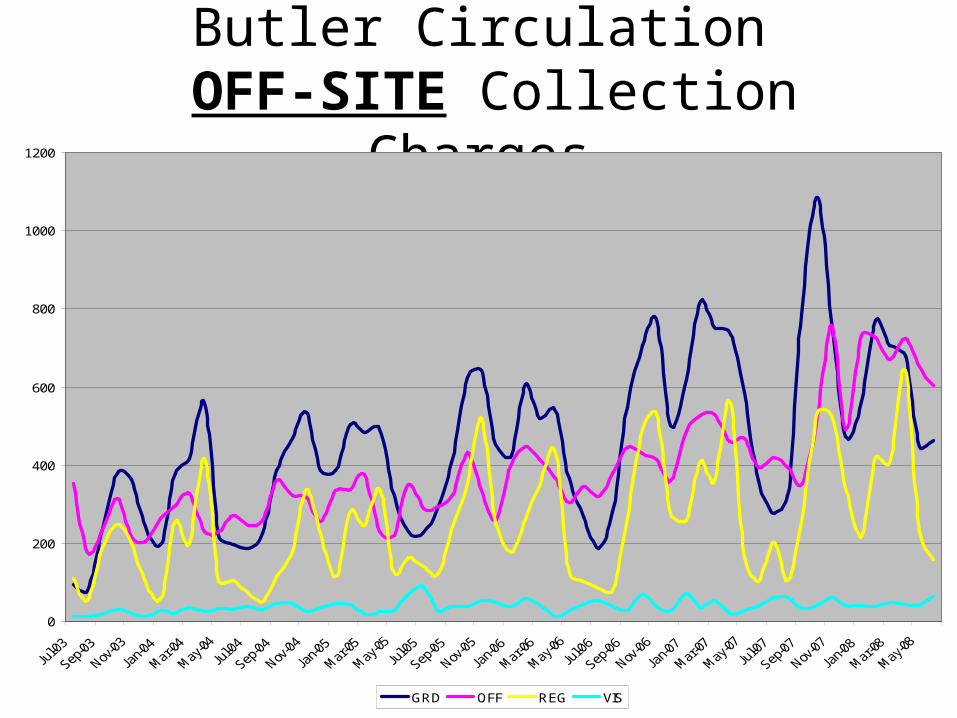
Butler Circulation OFF-SITE Collection Charges
0
200
400
600
800
1000
1200
GRD OFF REG VIS

Collection Use Data
• Only circulation data for main library circulation desk was analyzed
• Charges apply to only physical access to library material
• Peaks and valleys of data describe trend of academic calendar
• Proportionally higher use of offsite material by faculty and grad students

Part 3: High-use material at ReCAP
• What does “high-use” mean?
• Why is use rate important?
• How is high-use reflected in data?
• How can staff respond to high-use?

High-Use vs. Low-Use
• CUL targets low-use material for transfer
• Selectors consult circulation history data to identify low-use material
• Data may come from Voyager (CUL’s ILS) or from date stamps in the physical volume
• Use data may be ignored with multiple copies

Importance of Use Rate
• Maintaining onsite access to in-demand resources
• Accurately calculate operating costs of large-scale operations
• Assure high quality preservation environment for scholarly resources
• Continued support and effectiveness of ReCAP depends in great part on reliability

High-Use vs. Low-Use
• Collection use data is relevant over a statistically significant timeframe
• Sometimes collection use data is not available; non-circulating collections, new acquisitions, etc.
• High- vs. low-use is relative• Total number of requests can inform title-
by-title; retrieval rate informs collection as a whole (object level vs. system level)

Use Analysis
• Request data collected by CUL is split by delivery mode: Physical Delivery and EDD
• Request data has granular information: date, format, patron group, barcode
• Granular information may be used to extract bibliographic data from Voyager: publication date, title, enum/chron, etc.

High Use EDD
• High Use EDD title defined as 5 or more requests for same title (not necessarily same volume)
• List includes both serials and monographs
• See list of high use titles…

• Granular data is available for all requests, including: owning department, date, format, request citation, patron group and hashed user identifier
• Lists and data may used by CUL staff and committees to make collection management decisions

Other High-Use
• “High-use” for physical delivery is currently defined as 4+ requests since arrival at ReCAP
• Automatic flagging and de-accession of “high-use” volumes is problematic
• Data suggest that new acquisitions (books published since 2000) have a higher use rate
• There is currently no formal policy for returning materials to onsite shelving

Part 4: EDD Trends: Hypotheses and Research
• What is the overall EDD trend?• How does use of science subject and non-
science collections differ?• Is there a correlation to online full-text
availability?• Is there a correlation to Science Fast-
Track?• Are there correlations among user
preference?

Total Volume of EDD Requests
• Data show that total requests for Physical Delivery continuously increase along with accession
• Data show that total EDD requests have been dropping over the last two years
• Staff pursued research to determine the causes of the decline
• Research focus is on EDD requests for print serials

Total Volume of EDD Requests by Financial Year
0
500
1,000
1,500
2,000
2,500
3,000
FY02 FY03 FY04 FY05 FY06 FY07 FY08

Metric Breakdown of Total EDD Requests
• 11,648 total EDD requests from FY02 to FY08
• 86% print serials; 14% other (mainly monographs)
• 4,604 total titles requested; 3,085 titles are print serials
• High-use title defined as 5 or more requests for same title (not necessarily same volume)

EDD Volume
86%
14%
Serial
Non-Serial
Total EDD Requests:Print serial vs. Other

Distribution by Title and User
• Of 3,085 print serial titles, 499 are considered high-use
• Use per title averages:– Print serials: 3.24– High-use print serials: 11.55– Other: 1.09
• Following chart illustrates distribution of use per print serial title…

0
10
20
30
40
50
60
70
80
90
100
Drop Page Fields Here
Count of FORMAT
TITLE
FORMAT
Frequency Distribution by Title of EDD Print Serial
EDD Request Trend
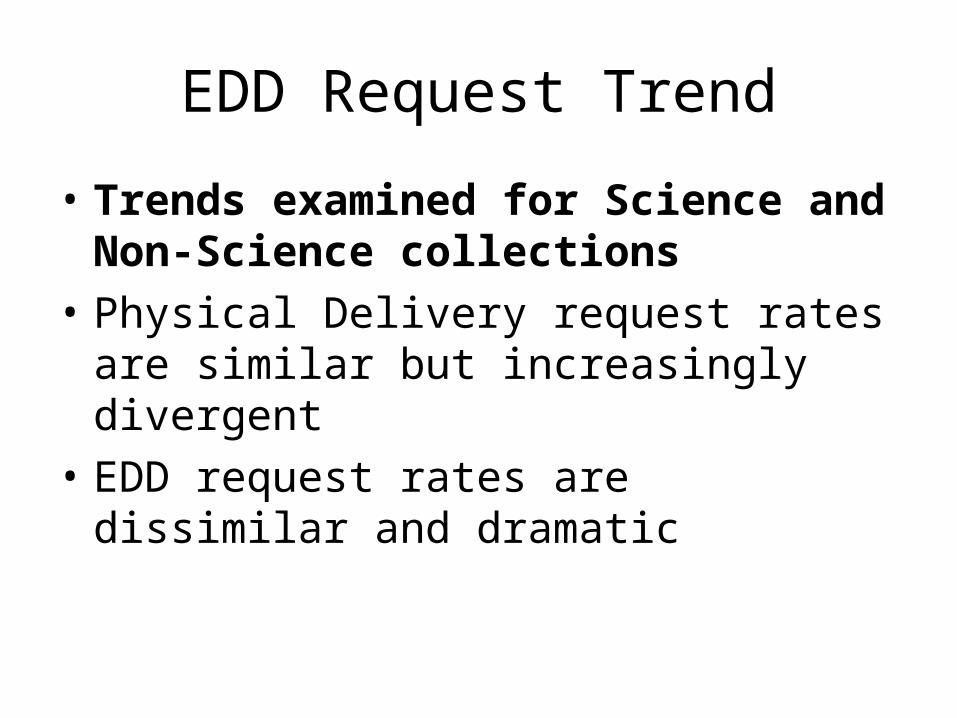
• Trends examined for Science and Non-Science collections
• Physical Delivery request rates are similar but increasingly divergent
• EDD request rates are dissimilar and dramatic

Phys. Del. Request RatePHYS Requests Per Volumes Accessioned
0.00%
0.50%
1.00%
1.50%
2.00%
2.50%
3.00%
3.50%
4.00%
Science Non-Science

EDD Request RateEDD Requests Per Volumes Accessioned
0.00%
0.10%
0.20%
0.30%
0.40%
0.50%
0.60%
0.70%
0.80%
0.90%
Science Non-Science
Correlation to Online Full-Text
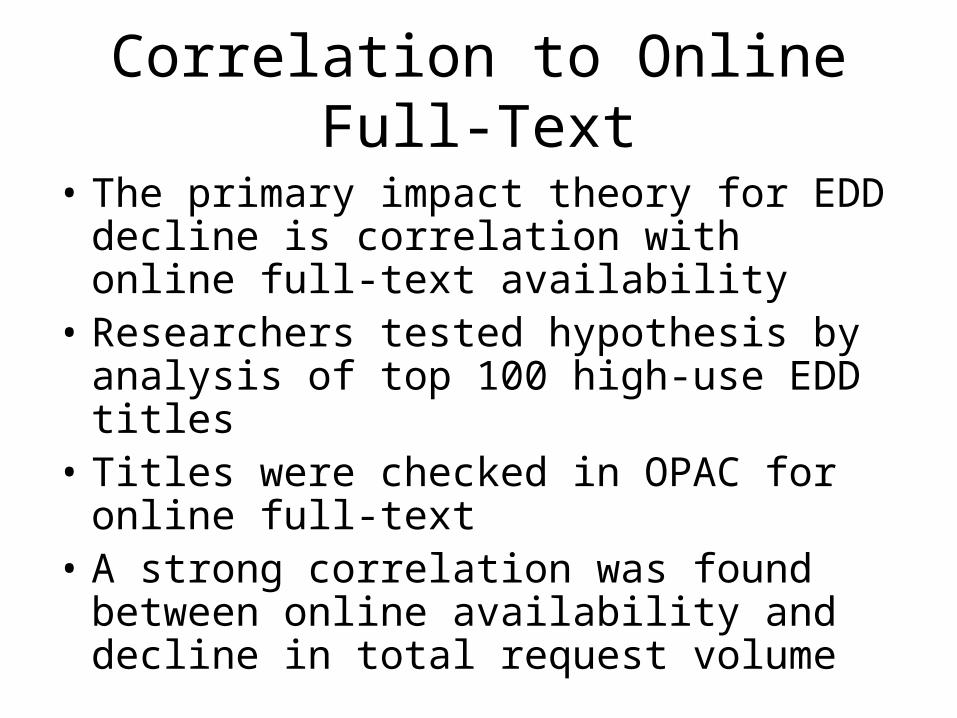
• The primary impact theory for EDD decline is correlation with online full-text availability
• Researchers tested hypothesis by analysis of top 100 high-use EDD titles
• Titles were checked in OPAC for online full-text
• A strong correlation was found between online availability and decline in total request volume

Top 100 High-Use EDD Sorted by Online Availability
• 38 titles had online archival full-text
• 62 had only print copy or online current full-text

Top 100 High-Use EDD Titles:Total Requests/Online Availability
0
50
100
150
200
250
300
350
400
FY02 FY03 FY04 FY05 FY06 FY07 FY08
Online Full Text Print Only/Current Online

Impact of Local Initiative:Science Fast-Track
• Science Fast-Track is a service provided to library users by science library staff: http://www.columbia.edu/cu/lweb/requestit/science_fast_track.html
• When a patron can’t find an article in CUL resources, library staff follow up with mediated ILL
• Science Fast-Track is only used for material not in CUL collections
• Science staff EDD requests were plotted over time; no relationship to EDD decline is apparent

Distribution of Science Staff Requests
0
2
4
6
8
10
12
14
16
Mar-
02
May-
02
Jul-02
Sep-0
2
Nov-
02
Jan-0
3
Mar-
03
May-
03
Jul-03
Sep-0
3
Nov-
03
Jan-0
4
Mar-
04
May-
04
Jul-04
Sep-0
4
Nov-
04
Jan-0
5
Mar-
05
May-
05
Jul-05
Sep-0
5
Nov-
05
Jan-0
6
Mar-
06
May-
06
Jul-06
Sep-0
6
Nov-
06
Jan-0
7
Mar-
07
May-
07
Jul-07
Sep-0
7
Nov-
07
Jan-0
8
Mar-
08
May-
08

Collection Use by Patron Group
• Researchers looked at collection use data by three patron groups– Undergraduates– Graduate Students– Faculty
• Accurate data for EDD requests is only available for FY08

Comparison of Circulation Data:Main Library Circulation Desk
0
2000
4000
6000
8000
10000
12000
Grad Students Faculty Undergrads
0
200
400
600
800
1000
1200
Grad Students Faculty Undergrads
Circulation of onsite collections from CUL Voyager data. Onsite collections include all CLIO locations shelved on campus.
Circulation of off-site collections from CUL Voyager data. Off-site collections include all CLIO locations shelved at ReCAP.

Comparison of EDD Request Data
0
20
40
60
80
100
120
140
Grad Students Faculty Undergrads
0
5
10
15
20
25
30
35
40
45
50
Grad Students Faculty Undergrads
Request volume for all EDD requests in FY08.Data is collected from CUL request mechanism. Outliers have been excluded.
Request volume for top 100 High Use EDD titles in FY08.Data is collected from CUL request mechanism. Outliers have been excluded.

Patron Group Conclusions
• There is not sufficient evidence that collection use trends by patron group correlate to the EDD decline trend
• Data analysis by patron group does not inform EDD decline trend
• Object level analysis may lead to different avenues of research

Patron Group Analysis
• Two trends emerge from the data sets:– Charge volume follows the academic
calendar; peaks during Fall and Spring Terms, valleys in between
– Use of off-site material is proportionally higher for Graduate Students and Faculty
• Patron group trends for EDD request are not apparent from these data

Part 5: Conclusions: Future Plans for Action and Research
• What data is missing?
• What is the next course of research?
• Can action be taken currently?

More Data Needed
• Further data sets needed– History of print serial accession at ReCAP
(tracked by accession of MARC format “as”)– ReCAP ILL request data: ILL EDD requests
are no longer handled internally and are missing from current data set
– User data from alternate discovery mechanisms
– Patron group populations; unstable, changes over time

Research
• Further work must be done to establish validity of data sets
• New hypotheses necessary for decline of EDD requests without online archival full-text
• Object level study of citations and titles
Action Plan
• Expansion and presentation of High Use print serial title list to appropriate CUL committees
• Use to make online archival full-text acquisition decisions
• Confirm titles in contents of SFX Knowledge Base
• Pursue research of high-use material to inform policy decisions for return of ReCAP material onsite