Embed Size (px)
Citation preview
ISSN: 0852-0682, EISSN: 2460-3945
Impacts of Climate Change (El Nino, La Nina, and Sea Level) on the Coastal Area of Cilacap Regency
Lilik S. Supriatin* and MartonoCentre of Atmospheric Science and Technology (LAPAN)
Jl. Dr. Djundjunan 133 Bandung, West Java *)Corresponding author (e-mail: [email protected])
Abstract. This research was conducted to determine the impact of El Nino and La Nina on rainfall
Keywords:
Abstrak.
Kata kunci: .
1. IntroductionClimate change becomes a phenomenon
endured by humankind in this era including in Indonesia. In fact, high intensity of rainfall occurred in most of regions in Indonesia in August when it should have been a month of dry season. Moreover, hazards took place in
al. (2008) suggested that climate change has
bottom layer of the atmosphere. They were high rainfall and sea level rise.
Some indicators of climate change were increased incidence of extreme climate (ENSO and La Nina) and the rise in sea level
to rising sea levels) (Ashok and Saji, 2007; Ratnaningayu, 2009; Sahu et al., 2010).
as well as the impact of El Nino, La Nina, and sea level on coastal flooding in Cilacap Regency. The methods used in this study were statistical analysis and simulation. The results of this study were El Nino caused diminished rainfall in Cilacap regency between 295 to 1665 mm. Meanwhile, La Nina caused surplus rainfall between 189 - 691 mm/year in compared with annual climatological rainfall. When ENSO phenomenon (El Nino) occurred, it caused sea level anomaly to fall, including in 1994, 1997, and 2002 of -11.63 cm, -11.5 cm, and -4.95 cm, respectively. Meanwhile, in La Nina years in 1999 and 2000, the sea level anomaly enhanced by 2.55 cm and 5.03 cm, respectively. The result of sea level projection by employing simulation model in this study was compared with the simulation results of the IPCC that obtained a correlation coefficient r of 0.99. Based on the simulation results, the 8 (eight) sub-districts in Cilacap Regency located in the coastal area potentially endure flood due to the impacts of global warming and La Nina with a diverse predicted year of occurrence depending on the altitude of each sub-district.

107
that climate change characterized by extreme weather, rise of sea level and temperature, shifting seasons, and high rainfall intensity, has affected the coastal ecosystem and human life. Intergovernmental Panel on Climate Change (IPCC, 2007) explained that the global mean precipitation increased by 2% in the last decade. Lansigan et al. (2000) also explicated that El Nino Southern oscillation (ENSO) causes late onset and early termination the rainy season.
Indonesia as the largest archipelago country in the world as well as other countries located on the edge of the ocean and coastal zone are highly vulnerable to the impacts of climate change (Joseph, 2010). The impacts of climate change affected the entire production
Moreover, cultivation activities situated on the
and salt marshes.Constant sea level rise will likely disrupt
the physical processes, economic activities, and social system in the coastal areas (Li, et al., 2009). Extreme natural phenomenon, i.e., La Nina, also has an effect on sea level rise that can lead to a rise by 15 cm. However, it was predicted that La Nina phenomenon would be
future. In addition to sea level rise and high intensity of rainfall, La Nina also increases the wave height. The higher intensity of rainfall
and the loss of agricultural land in the coastal area. Contradictory, El Nino is a phenomenon that causes diminished rainfall and declined sea level in Indonesia.
Cilacap Regency is one of regencies in Central Java Province which borders the sea (the Indian Ocean). Eight sub-districts in Cilacap Regency covering Kampung Laut, South Cilacap, Central Cilacap, South Cilacap, Adipala, Binangun, Nusawungu, and Kesugihan are located in and directly adjacent to the Indian Ocean (coastal areas). The topography of sub-districts in Cilacap Regency was used as the background to determine the study site. This study aimed to determine the increase and decrease of rainfall during La Nina and El Nino, to determine the sea level during El Nino and La Nina and the projected sea level for the next few years in the coast of
the coastal area (sub-districts) as the impact of sea level rise.
Several studies had been conducted to partially assess the effect of ENSO on rainfall, but this study incorporated the impacts of climate change (El Nino and La Nina) on rainfall and sea levels, as well as the impacts of sea level rise on coastal area. In addition, this research was initial research that employed simulation method for the projection by using Powersim Constructor 2.5 software.
2. Research MethodsThis study analyzed the monthly rainfall
data of Cilacap Regency from 1984 to 2013), which was obtained from BMKG Cilacap. In addition, monthly sea level data from 1993 to 2014 derived from NOAA Oceanwatch (http://pifsc-oceanwatch.irc.noaa.gov/las/servlets/dataset) was also examined. It was supported by topographic data of altitude in the 8 (eight) sub-districts. The methods were statistical analysis) and simulation method for projection by using Powersim Constructor 2.5 software.
3. Results and DiscussionsFigure 1 illustrates the annual
climatological rainfall from 1984 to 2013 (30 years) of Cilacap Regency. Based on Figure 1, the annual mean rainfall could be determined,
Figure 1. Annual rainfall in 1984-2013 in Cilacap Regency.
This study compared the annual mean rainfall and the annual climatological rainfall when El Nino and La Nina occurred. It found out the rainfall during El Nino years was lower while it was higher in La Nina years. Nevertheless, not all the annual rainfall of those years was higher than the annual

108
ISSN: 0852-0682, EISSN: 2460-3945
climatological rainfall. It was recorded that in 1984 – 2013, there were four time occurrences of El Nino (1991, 1994, 1997, and 2002) and four time occurrences of La Nina (1989, 1999, 2000, and 2007). Figure 2 presents the annual rainfall as El Nino and La Nina occurred.
Figure 2. Annual rainfall in the years of El Nino and La Nina phenomenon.
Based on Figure 2, it can be seen that when El Nino occurred, annual rainfall was less than the year of La Nina’s occurrence. Furthermore, the comparison between annual rainfall in El Nino years and annual climatological rainfall
results of this study was similar to Estiningtyas et al. (2007) which demonstrated during El Nino phenomenon, annual rainfall of Cilacap Regency was diminished approximately 923 mm. When El Nino took place in 1997 and 2002, annual rainfall was diminished every month, whereas in 1991 and 1994, annual rainfall was decreased merely in the dry months (from May to September).
occurred, there was surplus rainfall ranging
with annual climatological rainfall. The results
Surmaini (2007) that concluded surplus rainfall during La Nina of approximately 40 mm/month or 480 mm/year, which was in the range
Figure 3 presents the monthly mean sea level of South Java Sea in the observation period of 1993-2014. Cilacap is situated in and directly adjacent to the South Java Sea. Based on Figure 3, then the annual mean sea level of
South Java Sea, evaluation on those averages was carried out. Figure 4 presents the sea level
anomaly of South Java Sea in compared with the annual mean sea level.
Figure 3. Monthly mean sea level of Java South Sea.
Figure 4 demonstrates when the ENSO phenomenon (El Nino) occurred, sea level
cm, -11.5 cm, and -4.95 cm, respectively. Meanwhile, during La Nina, sea level anomaly in 1999 and 2000 were +2.55 cm and +5.03 cm, respectively. So it can be concluded when El Nino occurred, the sea level anomaly of South Java Sea was less than the annual mean sea level. It was contrast with La Nina that caused upwelling. It was caused by the weather during El Nino, warm water that should be in the region of Indonesia moves to the East, thereby it reduces the volume of the ocean and sea level, whereas in La Nina, warm water would move into the territorial water of Indonesia thereby increasing the volume of ocean and sea level.
et al. (2007) that suggested the sea level rise during La Nina was caused by
the mass of water vapor (warm water) from the
water of Indonesia, including the South Sea Java.
Figure 4. Sea level anomaly of South Java Sea.
109
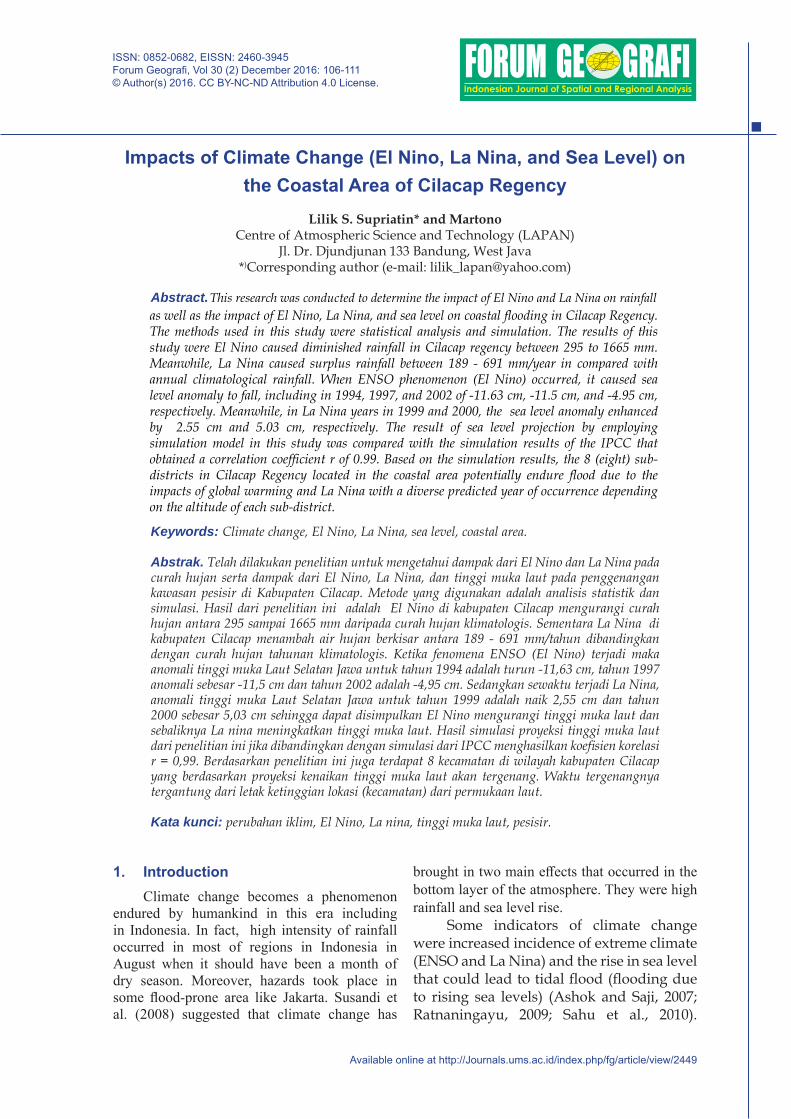
Sea level rise generated from La Nina phenomenon, in fact, led to various adverse impacts such as erosion, abrasion, and a pool of sea water. Furthermore, to determine the projected sea level for the next few years and
level and coastal cultivated areas, simulation was performed. In prior to the simulation, causal loop diagrams (causal diagrams) was established. Figure 5 presents the causal loop diagram that was established by employing Powersim Constructor 2.5 software.
Figure 5. Causal loop diagram in Powersim
Based on Figure 5, it can be explained that sea level rise was an impact of La Nina and would be reduced by powerful El Nino. The phenomenon of El Nino reduced rainfall, while La Nina increased rainfall. Sea level
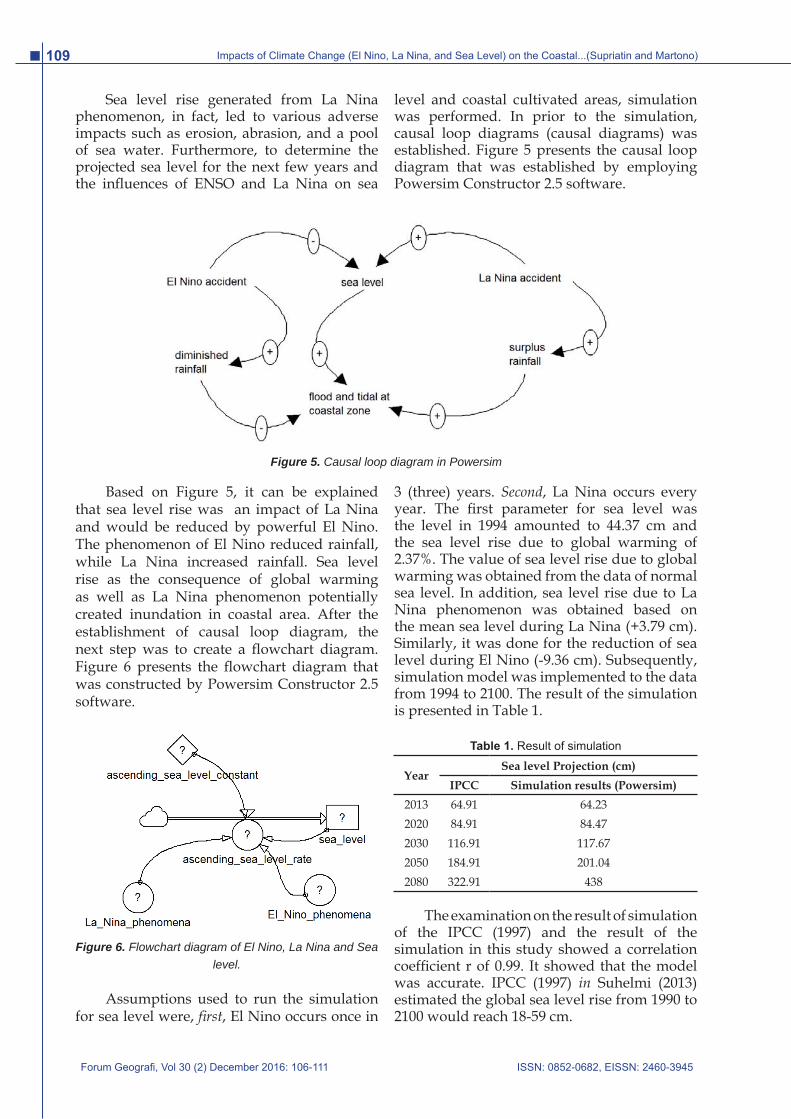
as well as La Nina phenomenon potentially created inundation in coastal area. After the establishment of causal loop diagram, the
was constructed by Powersim Constructor 2.5 software.
Figure 6. Flowchart diagram of El Nino, La Nina and Sea level.
Assumptions used to run the simulation for sea level were, , El Nino occurs once in
3 (three) years. , La Nina occurs every
the level in 1994 amounted to 44.37 cm and the sea level rise due to global warming of 2.37%. The value of sea level rise due to global warming was obtained from the data of normal sea level. In addition, sea level rise due to La Nina phenomenon was obtained based on the mean sea level during La Nina (+3.79 cm). Similarly, it was done for the reduction of sea
simulation model was implemented to the data from 1994 to 2100. The result of the simulation is presented in Table 1.
Table 1.
YearSea level Projection (cm)
IPCC Simulation results (Powersim)20132020 84.91 84.4720302050 184.91 201.042080 322.91 438
The examination on the result of simulation of the IPCC (1997) and the result of the simulation in this study showed a correlation
was accurate. IPCC (1997) in Suhelmi (2013) estimated the global sea level rise from 1990 to 2100 would reach 18-59 cm.

110
ISSN: 0852-0682, EISSN: 2460-3945
The result of simulation can be used to forecast the coastal areas (sub-district) in Cilacap Regency that are potential to suffer
La Nina, and sea level rise). Table 2 presents
the projection when the districts located in the coastal area of Cilacap Regency are inundated by examining the topography of the altitude above mean sea level (AMSL).
Table 2.
No. District Altitude above sea level (m)
Flood occurrence Projection (Year)
Sea level (m)
1. Kampung Laut 1 1.0172. Kesugihan 8 2105 8.1913. Adipala 8 2105 8.1914. Binangun 8 2105 8.1915. Nusawungu 10 2114 10.199
South Cilacap 20937. Central Cilacap 5 5.0988. North Cilacap 2093
Based on Table 2, it can be seen that Kampung Laut sub-districts with an altitude of 1 meter amsl was predicted to suffer
situated at an altitude of 5 meters amsl will be
Cilacap sub-district, both of them are at an
of Binangun, Adipala, and Kesugihan, which are located at the altitude of 8 meters amsl
Nusawungu sub-district was estimated to be inundated in 2114.
4. Conclusions and RecommendationsBased on this study, El Nino reduces the
climatological rainfall of Cilacap Regency
La Nina phenomenon causes surplus rainfall
compared with the annual climatological rainfall. In addition to diminished rainfall, another impact of ENSO phenomenon was the lowered sea level. When ENSO phenomenon
(El Nino) occurred in South Java Sea, the sea level anomaly in 1994, 1997, and 2002 were,
Meanwhile, La Nina phenomenon in 1999 and 2000 altered the sea level anomaly of 2.55 cm and 5.03, respectively. Hence it can be concluded that the sea level anomaly generated by El Nino decreased the annual sea level of South Java Sea. On the contrary, La Nina brings positive sea level anomaly in which it causes upwelling. The results of sea level projections by using simulation model in this study was compared to the simulation results of IPCC
Based on the simulation, the eight sub-districts in Cilacap Regency that are located in coastal
impacts of global warming and La Nina with various estimated year depending on the altitude of each sub-district.
5. Acknowledgements The author thanks to Centre of
Atmospheric Science and Technology for the
6. References
no. 1, July, pp. 34-44.
Ashok, K. and Saji N. H. (2007) On Impact of ENSO and Indian Ocean Dipole events on the sub regional Indian Summer monsoon rainfall, , vol. 42, no. 2, pp. 273-285.
Estiningtyas, W., F. Ramadhani., E. Aldrian. (2007) Analisis Korelasi Curah Hujan dan Suhu Permukaan Laut Wilayah Indonesia.

111
IPCC. (2007). – The Physical Science Basis, Cambridge University Press, Cambridge.
Lansigan, F.P., W.L. Santos., J. O. Coladilla. (2000) Agronomic impacts of climate variability on rice production in the Philippines. . vol. 82. pp: 129-137.
Ratnaningayu. (2009) Dari Timor ke Krui: Bagaimana petani dan nelayan menghadapi dampak perubahan iklim?, Saresehan iklim, Jakarta, November 2009. Pelangi Indonesia.
Sahu, N., Y. Yamashiki and K. Takara. (2010) Impact Assessment of IOD/ENSO in the Asian Region. Annual Disaster. Prev.Res. Inst., Kyoto University., No. 53B, 2010, 97-103.
vol. 13. no. 2. pp: 1-14.
Subagyono, K and E. Surmaini. (2007) Pengelolaan Sumber Daya Iklim dan Air Untuk Antisipasi Perubahan Iklim. vol. 8. no. 1, Juli. pp: 27-41.
Suhelmi, I. R. (2013) Pemetaan Kapasitas Adaptif Wilayah Pesisir Semarang dalam Menghadapi
vol. 27., no. 1. Pp. 81-92.
Susandi, A., I. Herlianti., M. Tamamadin, I. Nurlela. (2008) Dampak Perubahan Iklim Terhadap Ketinggian Muka Laut Di Wilayah Banjarmasin. vol.12, no.2. pp.1-8.
7. Appendix`
Appendix 1. Monthly sea level.