Embed Size (px)
Citation preview

Impact Evaluation Report 97
Rani ParkerEric ColemanJacob ManyindoEmmanuel MukuruBill Schultz
Governance
Impacts of community stakeholder engagement interventions in Ugandan oil extractives April 2019

About 3ie
The International Initiative for Impact Evaluation (3ie) promotes evidence-informed equitable, inclusive and sustainable development. We support the generation and effective use of high-quality evidence to inform decision-making and improve the lives of people living in poverty in low- and middle-income countries. We provide guidance and support to produce, synthesise and quality-assure evidence of what works, for whom, how, why and at what cost.
3ie impact evaluations
3ie-supported impact evaluations assess the difference a development intervention has made to social and economic outcomes. 3ie is committed to funding rigorous evaluations that include a theory-based design, use the most appropriate mix of methods to capture outcomes and are useful in complex development contexts.
About this report
3ie accepted the final version of the report Impacts of community stakeholder engagement interventions in Ugandan oil extractives as partial fulfilment of requirements under grant TW8R2.1015, awarded under Thematic Window 8, Transparency and Accountability in Natural Resource Governance. The content has been copy-edited and formatted for publication by 3ie. Despite best efforts in working with the authors, some figures and tables could not be improved. We have copy-edited the content to the extent possible.
The 3ie technical quality assurance team comprises Francis Rathinam, Kanika Jha Kingra, an anonymous external impact evaluation design expert reviewer and an anonymous external sector expert reviewer, with overall technical supervision by Marie Gaarder. The 3ie editorial production team for this report comprises Sahib Singh and Akarsh Gupta, with Beryl Leach providing overall editorial supervision.
All of the content is the sole responsibility of the authors and does not represent the opinions of 3ie, its donors or its board of commissioners. Any errors and omissions are also the sole responsibility of the authors. All affiliations of the authors listed on the title page are those that were in effect at the time the report was accepted. Please direct any comments or queries to the corresponding author, Rani Parker, at [email protected].
Funding for this impact evaluation was provided by 3ie’s donor, UK aid through the Department for International Development.
Suggested citation: Parker, R, Coleman, E, Manyindo, J, Schultz, B and Mukuru, E, 2019. Impacts of community stakeholder engagement interventions in Ugandan oil extractives, 3ie Impact Evaluation Report 97. New Delhi: International Initiative for Impact Evaluation (3ie). Available at: https://doi.org/10.23846/TW8IE97
Cover photo: Maendeleo ya Jamii
© International Initiative for Impact Evaluation (3ie), 2019

Impacts of community stakeholder engagement interventions in Ugandan oil extractives
Rani Parker Business-Community Synergies (BCS)
Eric Coleman Florida State University
Jacob Manyindo Maendeleo ya Jamii
Emmanuel Mukuru Maendeleo ya Jamii
Bill Schultz Florida State University
Impact Evaluation Report 97
April 2019

i
Acknowledgements
Business-Community Synergies (BCS) wishes to acknowledge and thank the many individuals who made this study possible. In particular, we are grateful to the many levels of Ugandan government and the operating companies, without whom the intervention would not be possible. Specifically, we would like to thank the Directorate of Petroleum in the Ministry of Energy and Mineral Development; the Office of the President; the Uganda National Council of Science and Technology; Mildmay Uganda Research Ethics Committee; and the community, district and sub-county leaders in Arua, Buliisa, Hoima, Moyo, Nebbi, Ntoroko, Nwoya and Yumbe for their support with this study.
We are especially grateful to Maendeleo ya Jamii (MYJ) for the enormous amount of work they contributed in managing the implementation of this study. In addition to oversight, MYJ’s core team (Jacob Manyindo, Emmanuel Mukuru, Christine Nantongo, Martin Karamagi, Herbert Banobi and Beatrice Rukanyanga) provided invaluable contextual input from survey design to the final analysis. The intervention was funded by Deutsche Forschungsgemeinshaft, a German research foundation.
A special thanks to our team of enumerators who collected and coded the qualitative data, helped translate the informed consent and study protocol, and guided the field route plans.
We also wish to acknowledge and thank Florida State University’s doctoral student, Bill Schultz, our statistics whiz, whose contributions have significantly strengthened the findings in this report.
BCS would further like to thank the administrative team and logistics teams, especially Martin Karamagi and Silver Karamagi of MYJ and Ruth Evans of BCS, for ensuring the most effective use of our financial resources.
This study would not have been possible without funding from the International Initiative for Impact Evaluation and our donors, DFID and the Hewlett Foundation.
ii
Summary
Many international organisations urge companies in the extractives sector to engage with local stakeholders, and issue ‘best practice’ guidelines for doing so. Corporations in the business of natural resource extraction also believe such engagement reduces their operational risks. These corporations have created standards for community engagement that they believe will help them obtain and maintain a social licence to operate.
However, reliable information about the impact of stakeholder engagement on participant communities is limited. In fact, we know of no rigorous experimental investigation – public or private – of the utility of such engagement for communities. Are governments and corporations more accountable when there is proper engagement with community-based stakeholders? And, are communities likely to seek more accountability as a result of useful engagement with governments and corporations?
Business-Community Synergies has worked collaboratively with Maendeleo ya Jamii (MYJ) for nearly 10 years. The two organisations have used a methodology that emphasises face-to-face interaction and inductive data gathering to build relationships of trust. MYJ developed this methodology into a structured engagement process called multi-stakeholder forums (MSFs). MSFs are designed to provide information, facilitate discussion and address concerns amongst communities (which are villages, the lowest administrative unit in Uganda), governments and corporate representatives in oil development areas of the Albertine Graben in Uganda.
Our study evaluates the effectiveness of the MSF intervention to improve accountability to communities in western Uganda. Our measured outcomes of interest are responses to issues that households care most about (issue satisfaction), land management, access to social services, local economic development, and attribution of blame and credit amongst decision makers. Our purpose is to provide rigorous experimental evidence on the effectiveness of stakeholder engagement from the perspective of communities affected by the extractives industry.
The study design is a randomised controlled trial, in which villages are randomly assigned to a treatment group (participating in MSFs) or a control group (not participating in MSFs). Villages in treatment groups and control groups were also given general information about oil and gas development. We supplement our quantitative measurement of outcomes with a limited qualitative component. The project involved baseline and endline data collection in 107 villages in the Albertine Graben. We conducted the endline analysis just three months after the intervention. Nevertheless, our analysis in this report finds the following immediate impacts:
• For those exposed to the MSFs, there is an overall increase in several measures of transparency, such as reported pursuit of independent information about oil development. However, MSFs did not increase actual knowledge of the oil and gas sector relative to the control group.
• Civic actions increase significantly at the household and community levels as a result of MSFs. This includes greater participation in village meetings and oil sector meetings. Qualitatively, we find strategic changes such as increases in lobbying and protests.

iii
• Our satisfaction index shows that satisfaction increases in response to the treatment for issue areas that respondents care the most about.
• We do not notice any treatment effects related to land management, such as increased rates of demarcation or registration of land. We also find that only around 37 per cent of villages continued to consider land the highest-priority issue at endline in both treatment groups, compared to approximately 50 per cent in the baseline survey. The majority of treatment villages committed to actions related to social services and local economic development. Qualitative data indicate that respondents’ land conflicts were resolved locally and amicably.
• For the two other issues studied, social services and local economic development, our statistical analyses indicate no significant impact associated with the MSFs. Qualitative data indicates that respondents placed high importance on health centres, schools and jobs. We believe more time is required to determine whether MSFs make a difference in these areas.
Our study finds that attribution of blame and allocation of credit were widely dispersed amongst village, sub-county and district leaders, as well as civil society organisations, oil companies and central government, and that this was the case whether the respondent was male or female. Our qualitative data indicate that blame was primarily due to neglect and credit was primarily given for good leadership.
Discussion of data, results and our interpretation of the results was conducted jointly with all three principal investigators and MYJ’s core implementing team in Kampala. The report represents our shared views. In preparing this report, we focused on the obvious and key findings of impact. There remain several unanswered questions that we plan to pursue as we study the data in greater depth in the future.

iv
Contents
Acknowledgements ......................................................................................................... i Summary .......................................................................................................................... ii List of figures and tables ............................................................................................... vi Abbreviations and acronyms ....................................................................................... vii 1. Introduction ................................................................................................................. 1
1.1 Oil and gas in Uganda ............................................................................................. 1 1.2 Purpose of this study ............................................................................................... 5
2. Theory of change ........................................................................................................ 6 2.1 Access to information .............................................................................................. 7 2.2 Stakeholder engagement increases transparency .................................................. 7 2.3 Transparency increases accountability ................................................................... 8
3. Research design ....................................................................................................... 10 3.1 Description of the intervention ............................................................................... 10 3.2 Identification strategy ............................................................................................ 11 3.3 Data collection ....................................................................................................... 11 3.4 Covariate balance ................................................................................................. 16 3.5 Hypotheses ........................................................................................................... 16
4. Descriptive information on respondents ................................................................ 18 5. Estimates of programme impacts ........................................................................... 20
5.1 Transparency ........................................................................................................ 22 5.2 Civic actions .......................................................................................................... 25 5.3 Satisfaction index .................................................................................................. 26 5.4 Land management ................................................................................................ 28 5.5 Social services ...................................................................................................... 30 5.6 Local economic development ................................................................................ 31 5.7 Attribution of responsibility .................................................................................... 33 5.8 Summary table of results ...................................................................................... 35
6. Qualitative results ..................................................................................................... 38 6.1 Issue satisfaction ................................................................................................... 38 6.2 Land management ................................................................................................ 39 6.3 Social services ...................................................................................................... 40 6.4 Local economic development ................................................................................ 41 6.5 Attribution of blame and credit .............................................................................. 42 6.6 More detail on civic activities ................................................................................. 45
7. Robustness checks .................................................................................................. 47 7.1 Spillovers: distance between villages .................................................................... 47 7.2 Spillovers: interaction in forums ............................................................................ 49 7.3 District fixed effects ............................................................................................... 50 7.4 Sub-county fixed effects ........................................................................................ 50 7.5 Refugee camps ..................................................................................................... 50
8. Limitations ................................................................................................................. 50 8.1 Short period between treatment and endline ........................................................ 50 8.2 Translation and language issues .......................................................................... 51 8.3 Preparation of treatment village representatives ................................................... 51 8.4 Exposure to only one MSF .................................................................................... 51 8.5 Exclusion of sub-county and district leaders in the MSF ....................................... 51

v
9. Conclusion ................................................................................................................. 51 9.1 Summary of quantitative findings .......................................................................... 51 9.2 Qualitative findings and other important takeaways .............................................. 53 9.3 Unanswered questions .......................................................................................... 54 9.4 Next steps ............................................................................................................. 54
10. Recommendations .................................................................................................. 55 10.1 Government ........................................................................................................ 55 10.2 Communities ....................................................................................................... 55 10.3 Companies .......................................................................................................... 56 10.4 Non-governmental organisations, CSOs and other organisations ...................... 56 10.5 Researchers and donors ..................................................................................... 57
Online appendixes ........................................................................................................ 58 References ..................................................................................................................... 59

vi
List of figures and tables
Figure 1: Status of exploration and appraisal drilling in the Albertine Graben .................. 2 Figure 2: Analysis of 15 major categories of barriers in Uganda’s petroleum sector ........ 5 Figure 3: Theory of change ............................................................................................... 7 Figure 4: CONSORT flow chart for the sampling design and allocation to treatment ..... 13 Figure 5: Map of sampled communities .......................................................................... 14 Figure 6: Quasi-random household survey in a village from the baseline data .............. 15 Figure 7: Number of endline respondents in different districts ........................................ 19 Figure 8: Gender balance ............................................................................................... 19 Figure 9: Change in household civic activity ................................................................... 21 Figure 10: Change in community civic activity ................................................................ 21 Figure 11: Transparency indicators ................................................................................. 24 Figure 12: Effects of transparency by gender ................................................................. 24 Figure 13: Civic actions ................................................................................................... 25 Figure 14: Civic actions by gender .................................................................................. 26 Figure 15: Satisfaction index ........................................................................................... 27 Figure 16: Land issues .................................................................................................... 29 Figure 17: Land management by gender ........................................................................ 29 Figure 18: Access to social services ............................................................................... 30 Figure 19: Access to social services by gender .............................................................. 31 Figure 20: Local economic development ........................................................................ 32 Figure 21: Local economic development by gender ....................................................... 32 Figure 22: Herfindahl index of attribution ........................................................................ 33 Figure 23: Attribution of responsibility ............................................................................. 34 Figure 24: Attribution of responsibility by gender ............................................................ 35 Figure 25: Qualitative responses on issue satisfaction ................................................... 38 Figure 26: Qualitative responses on attribution of blame ................................................ 43 Figure 27: Qualitative responses on attribution of credit ................................................. 45 Figure 28: Attending oil sector meetings, community level ............................................. 46 Figure 29: Attending village leader meetings, community level ...................................... 46 Figure 30: Proportion indicating frequent visits with other villages ................................. 48 Table 1: Uganda’s National Oil and Gas Policy (2008), legal and institutional framework 3 Table 2: Categories of barriers in Uganda’s petroleum sector and their definitions .......... 4 Table 3: Hypotheses and operationalisation ................................................................... 16 Table 4: Mean values and differences of outcomes across time and treatment group ... 36 Table 5: Reported action at the household level ............................................................. 45 Table 6: Reported action at the community level ............................................................ 45 Table 7: Frequency of nearby treatment villages within __ km ....................................... 49

vii
Abbreviations and acronyms
CSO Civil society organisation
DID Difference-in-difference
EDP Exploration, development and production
GIS Geographic information system
LC1 Village leader
LC3 Sub-county leader
LC5 District leader
MSF Multi-stakeholder forum
MYJ Maendeleo ya Jamii
RCT Randomised controlled trial
RCTMS Petroleum refining, conversion, transmission and midstream storage
SE Standard error

1
1. Introduction
This project assesses whether collaboration amongst stakeholders in the oil and gas sectors will improve community-level development outcomes. Policy decisions in the extractives sector affect a wide variety of actors, such as private companies, different levels of government and communities near a venture’s area of operations. Decision-making in this sector often fails to adequately involve communities beyond one-time public meetings (IFC 2007), whilst prioritising private and government interests. To assess the efficacy of one approach to expanding stakeholder engagement and collaboration, we report on an impact assessment of the activities of Maendeleo ya Jamii (MYJ). Maendeleo ya Jamii (which means community development in Swahili) is a Ugandan civil society organisation (CSO).
Companies in the extractives sector often attempt to gain a social licence to operate because conflict with local communities can decrease the value of specific ventures, and even overall corporate value. In Proceedings of the National Academy of Sciences, Franks and colleagues (2014) report that most companies believe stakeholder engagement strategies can help them avoid conflict with communities. Evidence we present speaks directly to whether such engagement improves business-community relations, mitigates the problems faced by affected communities and reduces conflict.
More broadly, the global policy community is grappling with problems of ensuring transparency and accountability in the extractives industry. Transparency and accountability surrounding extractives are especially difficult to maintain in environments where formal institutions are not able to stave off rent-seeking and corruption (Kolstad and Søreide 2009; Kolstad and Wiig 2009; Arezki and Brückner 2011). International programmes such as the Extractive Industries Transparency Initiative have been attempting to confront this challenge, and our study suggests that there is a larger role that civil society–led initiatives could play in the future.
To support engagement, MYJ has been conducting multi-stakeholder forums (MSFs) in the extractives industry for many years. People living in affected communities often express satisfaction with the forums, and based on their experience MYJ believes the forums truly benefit the residents of the Albertine Graben. In 2015, MYJ became interested in more systematic evidence on the effectiveness of these forums.
1.1 Oil and gas in Uganda
The Albertine Graben covers approximately 25 per cent (68,000 square kilometres) of Uganda’s land. It is inhabited by 25 per cent of Uganda’s population, and the southern portion is one of the most densely populated rural areas on the African continent. It hosts at least 14 major ethnic groups with varied cultural and economic systems, the majority of which are agricultural and produce 30 per cent of Uganda’s food crops. It is the most species-rich eco-region for vertebrates in Africa and accounts for more than 70 per cent of Uganda’s tourism revenue.
Petroleum exploration has taken place intermittently in the Albertine Graben region for almost 100 years. Since 2002, 121 wells (39 exploration wells and 82 appraisal wells) have been drilled in the Albertine Graben. Of these, 106 have revealed 21 oil and gas

2
discoveries, representing a drilling success rate of more than 88 per cent (Figure 1). Commercial quantities of oil were discovered in 2006, and preparations for the development of these discoveries are underway as exploration continues.
Figure 1: Status of exploration and appraisal drilling in the Albertine Graben
Source: Ministry of Energy and Mineral Development (2016).
Two documents from the Ministry of Energy and Mineral Development (2016; 2017) explain the major developments in Uganda’s policy, legal and institutional framework for the petroleum sector over the last 10 years. The National Oil and Gas Policy, developed in 2008 to guide the sector, has been followed by new legislation and the creation and involvement of new institutions in the sector (Table 1).
The National Oil and Gas Policy identifies key challenges in the sector and offers 7 guiding principles, as well as 10 key objectives with strategies and actions to meet them. It offers guidance on the roles and responsibilities of key stakeholders, such as government ministries, departments and agencies; civil society; and the private sector. A public version of the policy has been developed and translated to 11 languages, and its implementation progress is documented and published annually.
The legal framework covers the upstream, midstream and downstream areas of the petroleum value chain. The institutional structure is organised to address policy and licensing (Directorate of Petroleum), commercial and business interests (National Oil Company), monitoring and regulation (Petroleum Authority), environment (National Environment Management Authority), biodiversity (Uganda Wildlife Authority), physical planning (Ministry of Land, Housing and Urban Development) and revenue (Uganda Revenue Authority and Bank of Uganda), amongst other issues.
1 1 1 0
5 4
13
8
11 12
17
24
4 4
1
2
22
5
2
0
5
10
15
20
25
30
2002 2003 2004 2005 2006 2007 2008 2009 2010 2011 2012 2013 2014 2015
Num
ber o
f Wel
ls
YEAR
Discovery Dry hole
88%
12% Success
Failure

3
Table 1: Uganda’s National Oil and Gas Policy (2008), legal and institutional framework
Legislation Institutions
• Petroleum Exploration, Development and Production (EDP) Act, 2013
• Petroleum Refining, Conversion, Transmission and Midstream Storage (RCTMS) Act, 2013
• Petroleum Supply Act, 2003 • Public Finance Management Act, 2015 • Petroleum EDP Regulations, 2015 • Petroleum EDP Health, Safety and Environment
Regulations, 2016 • Petroleum EDP National Content Regulations,
2016 • Petroleum EDP Metering Regulations, 2016 • Petroleum RCTMS Regulations, 2016 • Petroleum RCTMS National Content Regulations,
2016 • Petroleum RCTMS Health, Safety and
Environment Regulations, 2016 • Petroleum Supply General Regulations, 2009 • Petroleum Marking and Quality Control
Regulations, 2009 • Model Production Sharing Agreement and Joint
Operation Agreement
• Directorate of Petroleum • National Oil Company • Petroleum Authority • Supporting ministries, departments
and agencies, such as: → Ministry of Water and Environment → Ministry of Finance, Planning and
Economic Development → Ministry of Tourism, Wildlife and
Antiquities → Ministry of Lands, Housing and
Urban Development → National Environment
Management Authority → Uganda Wildlife Authority → Uganda Revenue Authority → National Planning Authority → Auditor General → District and sub-county local
governments
Source: Ministry of Energy and Mineral Development (2017).
In spite of these efforts, earlier research by MYJ revealed 15 major categories of barriers associated with the petroleum sector in Uganda (Manyindo et al. 2014): community support, corporate social responsibility, corruption, displacement and compensation, education and training, employment, environment, information and communication, infrastructure, local economic development, policy and legal frameworks, public health, social, security and stakeholder engagement (Table 2).
The Manyindo and colleagues (2014) study was gathered from focus group discussions with participants from 29 villages, local governments in 7 districts and 2 companies in the Albertine Graben. When the authors asked these stakeholders what barriers they were experiencing in Uganda’s petroleum sector, their responses created 15 categories (Table 2). Stakeholder engagement is the only category for which all respondents expressed concerns (Figure 2), closely followed by information and communication, with 96 per cent of all respondents expressing concerns in this category. These earlier findings motivate the current research.

4
Table 2: Categories of barriers in Uganda’s petroleum sector and their definitions
Category Definition
Community support Barriers related to community and local government limitations and their unmet desires and expectations
Corporate social responsibility
Limitations related to the design and impact of corporate social responsibility
Corruption Barriers concerning favouritism, nepotism, exploitation, bribery and fraud
Displacement and compensation
Actual and potential loss of property, rights, income and/or access that have a direct impact on livelihoods
Education and training Barriers related to literacy, limited education, training and teacher welfare
Employment Barriers related to job opportunities and employment practices (recruitment, terms, rights and affirmative action)
Environment Barriers related to the management of waste, environmental degradation, noise and air pollution, perceived ecological instability and environmental compliance monitoring
Information and communication
Barriers related to information sharing in terms of access (supply and demand), regularity, transparency, reliability, timeliness, frequency, relevance, truthfulness, accuracy and clarity amongst all stakeholders
Infrastructure Barriers related to inadequate roads, road maintenance and access to electricity
Local economic development
Barriers related to real and potential loss of economic opportunities, increased cost of living, reduced production, delayed income, exclusive tendering practices and limited community preparedness to take advantage of economic opportunities
Policy and legal frameworks
Barriers related to an inadequate and unfair policy and legal framework and its unsatisfactory implementation
Public health Barriers related to access to adequate healthcare, clean water, medical staff and disease control
Security Barriers related to human–wildlife conflict, inter-/intra-community conflict, community safety and theft of property
Social Barriers related to local behavioural, cultural and moral standards
Stakeholder engagement
Barriers related to deficient inter-/intra-stakeholder interaction, flow of information, participation, benefit, trust and a sense of helplessness by communities and local government; unfriendly, disrespectful, fearful and hostile relations and unfulfilled commitments by companies

5
Figure 2: Analysis of 15 major categories of barriers in Uganda’s petroleum sector
At the beginning of this study, Uganda was anticipating major expansion of oil and gas activity throughout the region. However, the price of oil fell by more than 50 per cent and negotiations between government and the oil companies on production licences were protracted; this slowed the development of oil and gas in the region. However, production licences have been issued, the construction phase is about to begin (e.g. central processing facilities, pipelines and a refinery) and people in the region are still anticipating development.
1.2 Purpose of this study
As noted above, people in the Albertine Graben region identified stakeholder engagement as their single largest concern (100% of respondents), followed by information and communication. Thus, the need for better understanding about how to facilitate engagement and make information available in an accessible format is a real and current challenge for the Albertine Graben.
A growing academic literature explores the benefits stakeholder engagement may provide to communities, companies and governments. Such work is necessarily diverse, drawing together scholars who study the private sector (economics and business management), the public sector (political science and public administration) and civil society (public management). Work by political scientists focuses on institutional characteristics (Balla and Gormley 2017) or the complex networks of actors who participate in these decisions (Lubell 2004a, 2004b; Mewhirter et al. [in press]).
The work from business management treats collaborative governance as a form of corporate social responsibility (Jamali and Karam 2016). These scholars treat collaborative governance as a business investment, which is then evaluated in terms of the effects on profit. For example, using observational data on investments in stakeholder engagement, Henisz and colleagues (2014) find that such investments substantially improve the profitability of gold mine ventures.

6
Despite growing interest in stakeholder engagement, the empirical evidence for these studies tends to be weak. This is largely driven by research designs that cannot adequately identify causal effects. Many studies are anecdotal, examining one or very few cases (Donahue 2004). Even if there are explicit comparisons amongst multiple cases – which allows for more reliable inferences – these studies are still likely to suffer from selection bias (Ansell and Gash 2008). If stakeholder engagement has only been tried in ‘easy’ cases, then the purported effects may be overstated; on the other hand, if stakeholder engagement happens only in areas where problems are severe, then the true effects may be understated.
Based on the limitations of current research, our study is worthwhile for several reasons. First, we conduct a randomised controlled trial (RCT) amongst a population whose lives have been significantly affected by nascent oil development and whose lives will be altered even further as production begins in earnest. Thus, our study of the Albertine Graben is not an easy case. Second, the districts in our study region are experiencing varied stages of the oil development process. Thus, finding robust average treatment effects across our entire sample indicates that MSFs are effective in a variety of circumstances. Third, as with all RCTs, through careful selection of treatment and control villages, we can be highly confident that any differences in various outcome measures are caused by the treatment itself (in our case, the added value of holding MSFs rather than simply sharing information packets).
We added a qualitative component to some sections to gain a deeper understanding of how people think about these topics. The qualitative responses supplement summaries of large amounts of quantitative data with rich descriptive details that provide the respondents’ viewpoints and place quantitative results in their social and cultural contexts.
2. Theory of change
The intervention occurs in the form of access to information (treatment and control group) and participation in MSFs (treatment group only). The control communities represent a transparency-only group, whereas the treatment communities represent a transparency-plus-engagement group. Thus, the design is meant to assess the added value of MSFs above transparency. Figure 3 is a graphical depiction of the theory of change.

7
Figure 3: Theory of change
On the far left of the figure are the two components of the interventions: access to information and stakeholder engagement. Note that the control group (shaded in blue) receives access only to information, while the treatment group receives access to information and participation with stakeholder engagement through MSFs. The proximate outcome of interest is increased transparency (the yellow circle), and the more distal outcome of interest is accountability (the blue circle).
The theory of change illustrates the causal pathways and highlights the assumptions needed for these pathways to hold, as we discuss in the following sub-sections.
2.1 Access to information
Communities often have intermittent access to (and sometimes inaccurate) information about oil and gas development, apart from the work done by MYJ. We therefore did not feel it was possible to have a pure control group with no access to information. Instead, we opted to ensure that every community would at least have access to accurate information about the sector. MYJ delivered standardised information packets (online appendix A) to both treatment and control villages. Improved access to information alone could catalyse some communities to begin demanding more accountability.
We assumed the information packets would inform people and they would better understand the oil sector in the region. Because community actions are often directed to the wrong decision maker, however, access to information could lead to some measure of increased transparency and accountability in control villages. Nonetheless, we expect the largest impacts in treatment villages that could identify and had access to the appropriate decision makers for their specific concerns.
2.2 Stakeholder engagement increases transparency
In addition to the information provided to all villages, the intervention for the treatment group directly facilitates stakeholder engagement. For transparency to follow, the appropriate decision makers must be identified, and they must consider and respond to community priorities.

8
First, each village identifies three community representatives to the MSFs to increase the probability that community interests will be voiced and addressed. The elected village leader who is the official government representative at the village level (LC1) has an electoral mandate to represent these interests. Each village selects an additional two representatives from the village, because strong empirical evidence in Uganda suggests that elected officials are responsive to monitoring (Carlson 2015). At least one of the two representatives is female to ensure equal representation from the villagers. Furthermore, a unified voice from both elected and non-elected community members increases the power of the delegation in the meetings.
Second, stakeholder engagement leads to increased empathy and trust. The process of creating empathy is facilitated through the face-to-face interaction during the MSFs (Ostrom et al. 1994). Theories of conditional cooperation posit that most people will cooperate with others if they trust that others will reciprocate (Frey and Meier 2004). The assumption here is that treatment villages will establish greater empathy and trust than control villages.
Third, we assume decision makers are more likely to make commitments and coordinate their plans with villages represented in the MSFs. For example, companies might share a more detailed schedule of their planned activities or seek out more consultation if communities raise an unexpected issue. We do not necessarily assume decision makers will make grand concessions during these forums, only that they will be more likely to make commitments and implement them based on interactions with communities that participate than with those that do not.
Fourth, following the MSFs, we assume the community representatives will spread the information they have learnt to others in their home village – that they will inform others of the commitments made by decision makers and their communities and relate information about the perceived empathy and trustworthiness of others.
Fifth, we expect community representatives to the MSFs to lead the implementation of commitments they have made and to follow up on commitments made by decision makers in the MSFs. Part of MYJ’s intervention is to facilitate communities to develop action plans to keep decision makers accountable.
2.3 Transparency increases accountability
Improved accountability follows when decision makers and community representatives account to each other for the commitments they have made and the actions they have taken. In this section, we outline the rationale that leads us to believe the intervention can improve accountability through increased transparency.
2.3.1 Civic action The treatment improves the capacity of the households and communities to act collectively and undertake civic activity1 in order to influence decisions or seek remediation. Stakeholder engagement helps communities identify the actors responsible
1 These include attending oil sector meetings, participating with civil society organisations, protesting, voting, meeting with leaders at different levels of local government, calling police, writing a letter of petition, using the courts or mediation, and lobbying for issues to be included in government plans.

9
for the various aspects surrounding petroleum, and then learn from other communities’ attempts to influence this process. For example, MYJ-facilitated MSFs have previously empowered communities to write letters of petition to government officials about a problem they were experiencing. These actions have resulted in government officials addressing the problems that communities presented.
Other communities have met personally with government officials or with oil company community liaison officers. MYJ believes past stakeholder engagement activities have increased community awareness of the potential for policy influence and remediation and clarified the appropriate civic actions to take for specific concerns. Community actions can begin immediately after the intervention.
2.3.2 Decision makers’ performance Conceptually, we think about accountability in terms of the performance of decision makers; if decision makers provide the services communities demand, then they are accountable. Decision makers must understand the preferences of the communities and then direct policy choices to address those preferences. Stakeholder engagement clarifies the roles, responsibilities and duties of different decision makers. If communities clarify the actors to whom they must relay their preferences and then act collectively to express those preferences, then the decision makers are more likely to respond.
However, in this setting, preferences over service prioritisation varies between households and between communities. This poses a difficult problem in research design: it is not possible, conceptually, to assess the provision of goods and services uniformly across the study population. Some communities may prioritise land management decisions, while others are concerned with social service provision. It is not the absolute improvement in these issues that is important; rather, accountability demands that decision makers address those issues of importance to the relevant communities.
Our pilot work identified three main issue areas of concern to people in the region: land management, social services and local economic development. Different decision makers in the region have authority to provide services in each dimension; however, the community must be aware of which decision maker is responsible for what area, and the official in that area must then direct resources to address those concerns. The MSFs help direct communities to the appropriate decision maker and enable communities to form action plans to hold those decision makers accountable for their actions.
Perceptions about the performance of each of these sectors can be changed relatively quickly. Communities interact with decision makers, who either commit or fail to commit to direct resources towards addressing the communities’ concerns. Communities can then see whether those decision makers are starting the process of directing resources towards those priorities. However, it may take much longer to see actual changes in service delivery; it takes time to build schools and hospitals, and it takes time to resolve land management conflicts. Thus we expect stronger immediate effects on perceptions about performance but anticipate actual service delivery to take more time.
2.3.3 Attribution of responsibility A necessary condition for accountability is that citizens attribute blame or credit to the actors responsible for the state of their concerns (Przeworski et al. 1999; Gomez and

10
Wilson 2006). For complex policy problems, such attributions are difficult to make. The process of stakeholder engagement simplifies this process: if stakeholders commit to performing certain actions, then others can observe whether they executed those actions and seek remediation from the appropriate actor if the actions are not followed. With greater clarity of responsibility, communities are more willing and able to hold the appropriate decision makers accountable for their performance.
Communities are also willing to undertake actions that complement decision makers’ commitments in order to address concerns in a comprehensive manner. If decision makers anticipate that people can more clearly identify poor performance, then they have greater incentive to improve.
Attributed responsibility of blame and credit among the various decision makers is also a long-term outcome. Communities must see the responses of decision makers and then use that information to change their opinions about the decision makers’ performance.
3. Research design
3.1 Description of the intervention
The research team considered that there was already considerable dissemination of information by players inside and outside the project area. Therefore, as part of the intervention, we ensured that treatment and control villages had access to the same publicly available information. Only the treatment villages were allowed to participate in the MSFs.
The intervention was carried out as follows. In both control and treatment villages (107 project villages total), MYJ staff delivered two hard copies of an information packet (online appendix A) during meetings convened by each village chairperson. Each village was responsible for holding a meeting and disseminating this information. The information packet is a compilation of questions and answers, based on community and local government concerns about Uganda’s oil and gas activities in the Albertine Graben. These concerns were captured by CSOs and central government agencies during various interactions with communities and local governments over time. The village chairperson was the custodian of the information packets.
At those same meetings, residents of the 52 treatment villages each selected three representatives to participate in one MSF. These representatives comprised the LC1 chairperson and two others chosen by the community (one had to be female). Selections were based on three criteria: ability to communicate in English, confidence that they would effectively represent their villages and present concerns to the forum, and trust that they would provide feedback to the village after the engagement.
The treatment villages each experienced MYJ-facilitated stakeholder engagement for the first time. Three MSFs were planned for the treatment, each having no more than 60 participants. The treatment villages were clustered by district, with Buliisa, Hoima and Ntoroko as one group; Arua, Moyo, Nebbi and Nwoya as a second group; and Yumbe as the third. This rigorous, two-day engagement process involved the following interactions:
• Day 1: interacting with community representatives from other oil-bearing districts to share their experiences; interacting with the Association of Uganda Oil and

11
Gas Service Providers and learning about private sector experiences in Uganda’s petroleum sector; and interacting with the Ministry of Energy and Mineral Development to learn about the status of Uganda’s petroleum sector, and with the Ministry of Lands, Housing and Urban Development to present the Albertine Graben Physical Plan; and
• Day 2: developing village action plans based on the priority concerns of their communities, identifying what roles each community representative should play in executing these plans and agreeing on a reasonable time frame by which each action would be completed.
At the end of the two-day MSF, each team of village representatives left with a folder containing a copy of all the information presented to the forum, the information generated by the participants during group sessions (their respective village action plans), and the names and contact of the government and private sector presenters. The representatives were encouraged to share the information with their community members and to fulfil the commitments they had made in their action plans.
We would like to explicitly note here that standardising the intervention for the sake of the impact evaluation necessitated some simplification of the MSF. For this intervention, MYJ fast-tracked its typical MSF process to accommodate the project’s time frame. For instance, the capacity building interactions that are designed to prepare communities to effectively engage with other stakeholders before the MSFs had to be incorporated into the first day of the treatment.
3.2 Identification strategy
The research design is a pre-post design with village-clustered random assignment to treatment and control groups. Estimation of treatment effects through the difference-in-difference (DID) estimator is described in Section 5. Treatment assignment was randomised at the village level and blocked on district. Approximately half of the communities in each district were in the treatment (52 communities) and control (55 communities) groups.
MYJ identified 107 new villages in the area where they would begin operations.2 The intervention in these new villages took place between the baseline and endline data collection in the summer of 2017.
Below, we discuss survey design and then our sampling strategy at the village and household level in more detail.
3.3 Data collection
The baseline and endline surveys were designed to capture the different elements of our theory of change (Section 2) as clearly and distinctly as possible. For the quantitative portion, it was important that questions be worded to limit varied interpretation by different respondents and for comparability across languages. This portion constituted the majority of our survey. These data were recorded through a smartphone survey
2 The study started with identifying 109 villages. However, one village refused to participate at baseline and a second refused to participate at endline.

12
application that was uploaded to a secure server at the end of each day. We also added qualitative questions in key areas to better understand the reasons for the responses. All enumerators received training on the qualitative and the quantitative parts of the survey.
Qualitative data were limited to the primary focus of the survey – the importance of and satisfaction with the three issues (land, social services and local economic development) – as well as attributions of blame and credit to various decision makers in the oil development process. Particular attention was given to the issues or entities that a respondent ranked the highest. A qualitative coding structure for each of the four questions was created (online appendix B), and this coding structure was included in a data collection tool that the enumerators were required to use in the field.
The qualitative responses to issue importance, issue satisfaction, blame and credit were captured via the qualitative data collection tool and coded by the enumerator. At the end of each day, field supervisors convened their teams of enumerators and validated all the coded responses for that day as a team. The data were then scanned and forwarded, via email or WhatsApp, to the data entry supervisor in Kampala, who acknowledged receipt and assigned the data to a team of specialists, who typed the data into a Microsoft Excel spreadsheet.3 Then, the data were cleaned for errors and submitted for analysis. The coded responses were aggregated and analysed for explanation of the quantitative findings.
The overall sampling design is reported in the CONSORT flow chart (Figure 4), which shows the broad issues related to sampling. The sampling design has four distinct stages:
• During the enrolment phase, we identified a list of all eligible villages in the region of the study;
• At baseline, we conducted household surveys with 30 households per village and assessed balance statistics across treatment and control groups;
• During the intervention phase, we delivered information packets to all villages and held MSFs in treatment villages; and
• At endline, we resampled 30 households per village. We discuss major issues by category below.
3.3.1 Village sampling The sampling strategy for the study started by identifying the districts most affected by oil operations in western Uganda: Arua, Buliisa, Hoima, Moyo, Nebbi, Ntoroko, Nwoya and Yumbe. Next, we limited the study to communities with populations between 200 and 2,000, according to the most recent census. We did so to ensure we could obtain adequate community coverage with the household survey. We then eliminated all communities where MYJ had previously worked. Based on this sampling frame, we identified 391 communities for potential inclusion in the study.
3 MYJ and Business-Community Synergies jointly agreed that Microsoft Excel was a better choice than other qualitative data software, such as NVivo, because Excel is accessible to more people, making the data more accessible. The critical and time-consuming component is the coding process, which, regardless of the software, must be done manually to ensure proper representation of the meaning of what each respondent said.

13
Figure 4: CONSORT flow chart for the sampling design and allocation to treatment
Our baseline power analysis suggested that we needed more than 100 communities for the study. Many of the 391 potential communities identified for the sampling frame lie geographically close to one another. Thus, we opted against pure random sampling and instead sampled 107 communities in these districts, under the constraint that each sampled community must be at least 3 kilometres from any other sampled community.
Received intervention (54 villages)
Received intervention (53 villages) One village excluded from study
after refusing to participate
Analysed (54 villages) Endline (1,620 households, resampled)
Analysed (53 villages) Endline (1,590 households, resampled)
Intervention
Endline survey
Allocated to control (55 villages) Baseline survey (1,618 households)
Allocated to treatment (54 villages) Baseline survey (1,612 households)
Baseline survey
Villages assessed for eligibility (391 villages)
• In districts most effected by oil operations • Population between 200 and 2,000 • No previous MYJ activities
Randomly excluded (283 villages)
• Power analysis requires sample >100
• Should be at least 3 km from another village
• Even distribution of treatment within districts
Randomised (109 villages) ~30 households sampled per village
Enrolment

14
Figure 5 shows all the communities identified by the population constraint (hollow circles) as well as the final communities that were randomly selected under the distance constraint (crosses).4 A high-resolution image of this map is available in the online appendix C.
Figure 5: Map of sampled communities
Random sampling under the constraints outlined above ensures that communities selected into the study are not systematically different from other communities. Although the sampled communities might be more isolated than a typical community, we do not believe this poses a serious threat to external validity, especially considering the important advantage of mitigating spillover effects (we discuss efforts to account for spillovers as a robustness check in Section 6). It is true that the intervention could be more effective amongst communities that are densely clustered. However, MYJ works in more isolated communities, so capturing spillover effects in our analysis does not provide a helpful lesson for them on the effectiveness of MSFs. More generally, we feel it is important to establish a precise estimate of the treatment effect on individual villages that is not confounded by interference between study units, before exploring the utilitarian benefits of spillovers in future research.
Thus, strictly speaking, external validity is limited to isolated villages in the region. Anecdotally, however, we do not believe the communities we selected for the study to be atypical of other communities throughout the region.
4 As we discuss in Section 7, it simply was not possible to entirely avoid choosing villages within 3 kilometres of each other. However, the number of villages this close to each other in our sample is small.

15
3.3.2 Household sampling We used a quasi-random sampling technique (random walk) to survey approximately 30 households per community. We used a quasi-random technique because no village lists exist from which we could randomly sample. To give a reader an idea of the quasi-random nature whereby we selected households, Figure 6 shows the geographic path for each of eight enumerators in a random village that was conducted in the baseline. This path was taken by the global positioning system locations where the enumerator filled in each survey in a village. The figure shows the order of each household an enumerator interviewed, with a histogram of the number of household surveys we conducted across communities.
We conducted 30 household surveys in most communities. In sum, the survey team conducted 6,440 total (baseline/endline, treatment/control) household surveys across 107 communities. At both endline and baseline, we chose 30 household surveys per village to ensure we had adequate coverage of the community. We emphasise that the sample is not a panel of respondents, but rather separate random samples at endline and baseline.
Enumerator training emphasised an equal number of male and female respondents. The enumerators asked to speak to an adult household member knowledgeable about the household. In practice, the survey often drew interest from many people in the household. This was assessed on a daily basis using an enumerator activity log. The final baseline data comprised 48.8 per cent men and 51.2 per cent women.
The procedures to ensure a quasi-random sample of households in each community; the large, quasi-random household sample sizes; and the strong gender balance provide assurance that the information we obtained from the household sample is broadly representative of people in the region. We give details on the household survey in online appendix D.
Figure 6: Quasi-random household survey in a village from the baseline data

16
3.4 Covariate balance
We report extensive tests on pre-treatment covariate balance across a variety of continuous and binary variables in the baseline report. Instead of repeating that information here, we refer the reader to figures from the baseline survey in online appendix E.
3.5 Hypotheses
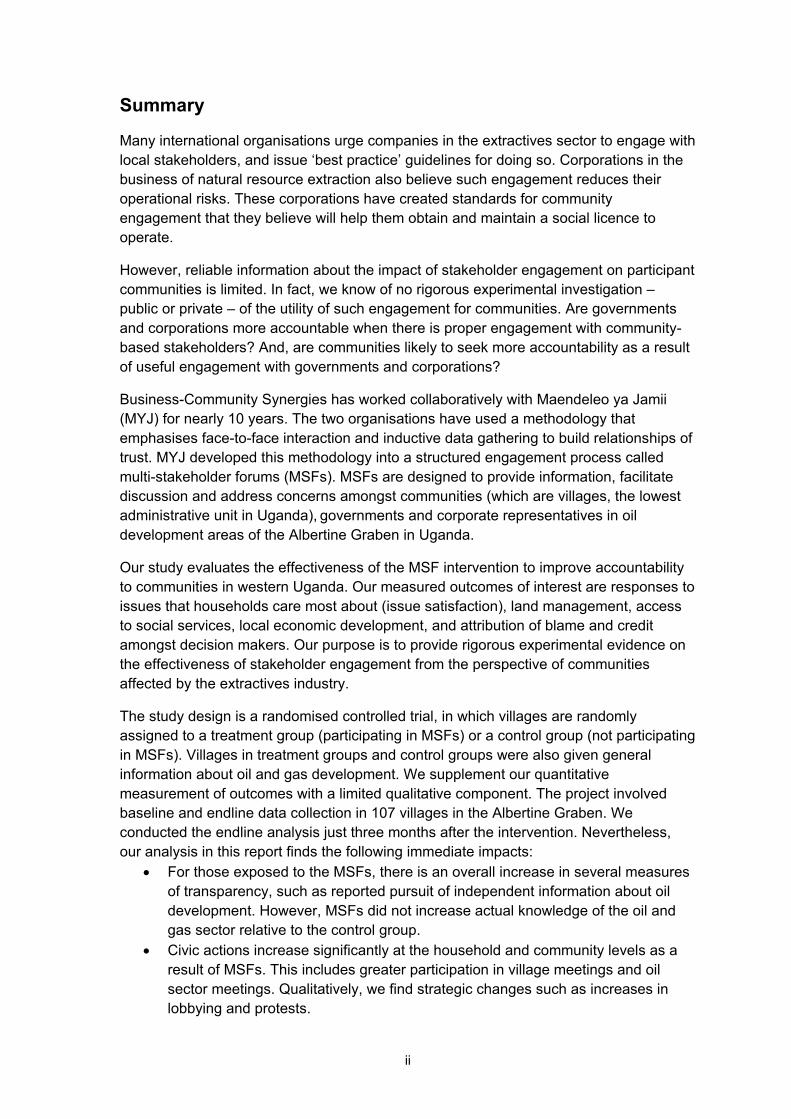
We now formally present our hypotheses and measures of the outcome variables. We summarise the hypotheses and their operationalisation in Table 3. We divide this into five types of hypotheses reflective of the theory of change: transparency, civic actions, overall satisfaction, specific question about issue areas and attribution of responsibility. The table also reports an intuitive description of the measured outcome and more specific summaries of each measure.
Table 3: Hypotheses and operationalisation
Hypotheses Outcome Measure
Transparency
1. Stakeholder engagement increases political knowledge
Respondent’s knowledge of oil sector
% of nine true/false questions about local oil development answered correctly
2. Stakeholder engagement encourages respondents to pursue more information
Respondent’s pursuit of information about oil development
Y/N question: has the respondent tried to get more information from sources they know of?
3. Stakeholder engagement increases awareness of local issues
Self-reported degree of awareness of oil sector activities
Scale question: do respondents feel very, somewhat or not at all aware of oil sector activities?
4. Stakeholder engagement makes communities more confident in their ability to obtain information
Self-reported degree of confidence in one’s ability to obtain information
Scale question: do respondents feel very, somewhat or not at all confident?
5. Stakeholder engagement helps respondents trust decision makers to share important information
Do respondents feel that oil sector decision makers share important information?
Scale question: do decision makers share information with communities always, sometimes or never?
6. Stakeholder engagement makes respondents perceive decision makers as more transparent
Self-reported perception of transparency of oil sector decision makers
Scale question: do respondents feel these figures are very, somewhat or not at all transparent?
17
Hypotheses Outcome Measure
Civic actions
1. Stakeholder engagement encourages civic participation
Reported household participation in civic activities related to oil development
Y/N question: has anyone in your household taken action to address their concerns about the oil sector?5
Reported community participation in civic activities related to oil development
Y/N question: has anyone in your community taken action to address their concerns about the oil sector?
Satisfaction
1. Stakeholder engagement increases satisfaction with the handling of issues one deems important
Net satisfaction with three issue areas, weighted by how important a respondent perceived it to be (land management, social service provision, local economic development)
Satisfaction with these issue areas and perceived importance are based on respondents’ allocation of stickers; see Section 5.3.
Issue areas
1. Stakeholder engagement improves land management
Land ownership Y/N question: does your household own this land?
Land demarcation Y/N question: is this land demarcated?
Land registration Y/N question: is this land registered or in the process of registration?
Outside claims Y/N question: has someone outside your household tried to make a claim on this land?
2. Stakeholder engagement improves access to social services
Secondary school access
Y/N question: does your household have access to a secondary school?
Health centre access Y/N question: does your household have access to a health centre?
Safe water access Y/N question: does your household have access to safe water?
5 Respondents were also able to specify what specific actions were engaged in, from the following: attending oil sector meetings, voting, participating with CSOs, meeting with village leaders, meeting with sub-county leaders, meeting with district leaders, calling police, writing a petition, using courts or mediation, and lobbying. This is also true for the question on community-level civic activity.

18
Hypotheses Outcome Measure
Roads and bridges access
Y/N question: does your household have access to roads and bridges?
Electricity access Y/N question: does your household have access to electricity?
3. Stakeholder engagement improves local economic outcomes
Business association membership
Y/N question: is anyone in your household a member of a business association?
Participation in skills training
Y/N question: has anyone in your household participated in a skills training programme?
Oil sector employment Y/N question: has anyone in your household been directly or indirectly employed in the oil sector?
Market access Y/N question: do you have access to markets?
Blame/Credit attribution
1. Stakeholder engagement should increase the concentration of blame and credit for policy outcomes on the actors who are actually responsible
Relative concentration of blame and credit for oil sector outcomes across different possible figures6
Blame and credit scores are based on allocations of stickers across seven key figures; see Section 5.7
4. Descriptive information on respondents
In online appendix F, we provide descriptive figures that show change in many of our outcome measures. We direct interested readers to a descriptive overview of our results there. Here, we provide some background information garnered from the baseline and endline surveys, before discussing our estimation strategy and observed treatment effects in the next section.
Figure 7 shows the number of endline respondents in different districts. By virtue of how villages were chosen, some districts (Arua, Buliisa and Yumbe) are more represented than others. The pattern in the baseline survey is the same, so that figure is omitted. Additionally, it is clear from this figure that the number of treatment and control respondents is virtually the same in each district.
Figure 8 shows the gender balance amongst respondents in different districts. The emphasis in enumerator training on sampling both men and women was clearly highly effective.
6 Community members, village leaders, sub-county leaders, district leaders, oil companies, central government, and CSOs.

19
Figure 7: Number of endline respondents in different districts
Figure 8: Gender balance
Most respondents were relatively long-term residents of their current home; only approximately 4 per cent of respondents in both the baseline and the endline had moved from another home or community within the past year. This suggests that most respondents in our survey should be at least somewhat invested in the communities in which they live; they are not itinerants who happen to be passing through. Additionally, most respondents were between the ages of 18 and 45 (approximately 68%), indicating that our study draws primarily on working-age adults who should be concerned with caring for their families and the extent of local economic opportunities.
On the subject of household size, approximately 33 per cent of respondents in both the baseline and the endline indicated that their households included nine or more people in both survey rounds. The next most common category was 5 or 6 people (approximately 22–25%), followed by 7 people (approximately 12%). Very few respondents indicated a household size of fewer than four people (approximately 8–9%). The fact that extended families in this region often live together or are highly involved in each other’s lives may account for these responses.

20
These responses may also be picking up large numbers of children in most families; only 10 per cent of respondents in the baseline and endline reported not having any school-aged children. Of those with school-aged children, approximately 81 per cent of respondents indicated that the children were attending primary school. Given the more limited availability of secondary schools (online appendix F), this could indicate that primary school is the highest level of formal education to which many respondents have access.
5. Estimates of programme impacts
Throughout the results section we report DID estimates of all treatment effects. We calculate these estimates for a dependent (outcome) variable, as follows:
• We first calculate the average values of an outcome in the endline and baseline for all respondents in the treatment group. We then subtract the average in the baseline from the average in the endline, which gives us the treatment difference;
• We next calculate the average values of an outcome in the endline and baseline for all respondents in the control group. Once again, we then subtract the average in the baseline from the average in the endline, which gives us the control difference; and
• Finally, we subtract the control difference from the treatment difference. This is our DID estimate.
The intuition for our study is that DID estimates compare (1) the change in some outcome amongst treatment village residents between baseline and endline surveys with (2) the change in some outcome among control village residents between the same surveys. A positive effect, for example, means there is a greater increase between surveys in the treatment group than in the control group.
Figure 9 illustrates this more concretely, plotting the proportion of respondents in different groups who report that someone in their household has engaged in any type of civic activity related to the oil and gas sector. At baseline, about 6 per cent of respondents from control (circle) and treatment (triangle) communities report that a member of their household engaged in civic activities. By the endline, this number doubles in treatment communities (about 13% reporting engaging in civic activities), compared to a decrease in the control group (about 5%).
The DID estimate is the difference in the trends between these groups (the difference in the slopes of the lines). We calculate the DID as (0.13 − .06) − (.05 − .06) = .08. The substantive interpretation is that the treatment causes an 8 percentage point increase in the amount of household civic engagement in the oil and gas sector.
DID treatment effect – formal definition
Let 𝒚𝒚� represent the arithmetic average of some outcome measure, 𝒚𝒚, within a subset of sampled respondents. This estimator compares averages within different subsets:
�𝒚𝒚�𝒆𝒆𝒆𝒆𝒆𝒆𝒆𝒆𝒆𝒆𝒆𝒆𝒆𝒆|𝒕𝒕𝒕𝒕𝒆𝒆𝒕𝒕𝒕𝒕𝒕𝒕𝒆𝒆𝒆𝒆𝒕𝒕 − 𝒚𝒚�𝒃𝒃𝒕𝒕𝒃𝒃𝒆𝒆𝒆𝒆𝒆𝒆𝒆𝒆𝒆𝒆|𝒕𝒕𝒕𝒕𝒆𝒆𝒕𝒕𝒕𝒕𝒕𝒕𝒆𝒆𝒆𝒆𝒕𝒕� − �𝒚𝒚�𝒆𝒆𝒆𝒆𝒆𝒆𝒆𝒆𝒆𝒆𝒆𝒆𝒆𝒆|𝒄𝒄𝒄𝒄𝒆𝒆𝒕𝒕𝒕𝒕𝒄𝒄𝒆𝒆 − 𝒚𝒚�𝒃𝒃𝒕𝒕𝒃𝒃𝒆𝒆𝒆𝒆𝒆𝒆𝒆𝒆𝒆𝒆|𝒄𝒄𝒄𝒄𝒆𝒆𝒕𝒕𝒕𝒕𝒄𝒄𝒆𝒆 �

21
Figure 9: Change in household civic activity
We find a similar pattern for respondents who report someone from their community engaging in civic activities (Figure 10): 10 per cent of those from treatment villages report this at baseline, a figure that increases to 28 per cent at endline. In contrast, the control group’s reporting of community civic engagement is 9 per cent at baseline and 11 per cent at endline.
Figure 10: Change in community civic activity
We calculate the DID for community action as (0.28 − .10) − (.09 − .11) = .16. The substantive interpretation is that the treatment causes a 16 percentage point increase in the amount of community civic engagement in the oil and gas sector.

22
The formal estimation of the treatment effects comes from a linear regression model:
𝑦𝑦𝑖𝑖𝑖𝑖𝑖𝑖 = 𝛼𝛼 + 𝛽𝛽𝑇𝑇𝑇𝑇𝑇𝑇𝑇𝑇𝑇𝑇𝑖𝑖𝑖𝑖𝑖𝑖 + 𝛾𝛾𝐸𝐸𝐸𝐸𝐸𝐸𝐸𝐸𝐸𝐸𝐸𝐸𝑇𝑇𝑖𝑖𝑖𝑖𝑖𝑖 + 𝜏𝜏𝑇𝑇𝑇𝑇𝑇𝑇𝑇𝑇𝑇𝑇𝑖𝑖𝑖𝑖𝑖𝑖 × 𝐸𝐸𝐸𝐸𝐸𝐸𝐸𝐸𝐸𝐸𝐸𝐸𝑇𝑇𝑖𝑖𝑖𝑖𝑖𝑖 + 𝜀𝜀𝑖𝑖𝑖𝑖𝑖𝑖.
In this model, i indexes individual, j indexes villages and t indexes time (baseline or endline). The estimate of the DID is the parameter 𝜏𝜏. We adjust all estimates in this report with robust standard errors, clustered by village to adjust for cluster randomisation (all households in a village are assigned to treatment or control group). For subgroup analysis, we estimate this equation for only the subgroups indicated. (Most of the subgroup analysis is by gender; therefore, we would estimate separate treatment effects for both men and women.) In principle, this equation can be modified to allow for a set of additional covariates. However, none of the results presented in this section include controls. In Section 7, we relax this assumption and include some types of controls.
Below, we report the DID estimates for our study outcomes of interest. To reiterate, these capture the amount of change that can be attributed to the intervention. Readers interested in comparing the absolute levels of different variables for treatment and control groups across surveys (as in Figure 9 and Figure 10) should turn to online appendix F. We also disaggregate our results by respondents’ gender. Although estimating treatment effects over only half the sample does decrease statistical power (i.e. how fine-grained an effect our tests can identify), this is only an issue in certain transparency indicators and the satisfaction index.
Having laid out our strategy for estimating treatment effects, we now turn to presenting evidence on programme impacts, using proximate outcomes (e.g. measures of transparency) and distal outcomes (e.g. measures of accountability) identified in the theory of change.
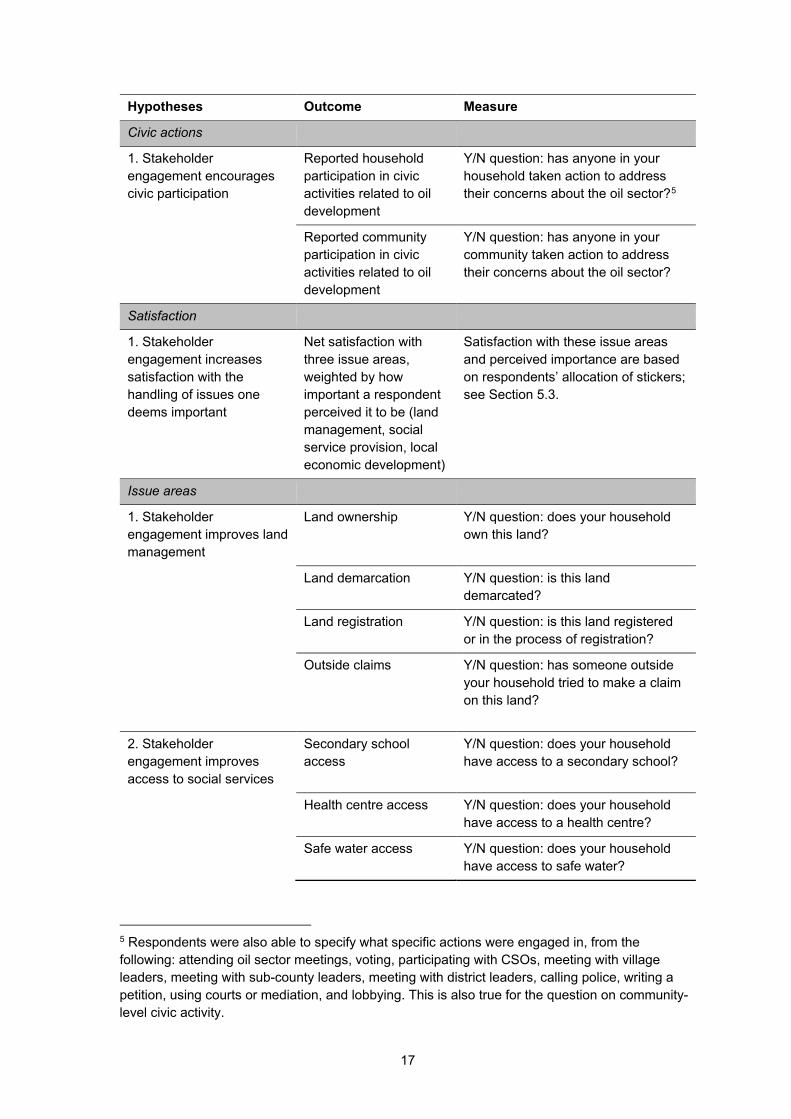
5.1 Transparency
Summary: Overall, the programme moderately increased transparency. This increase appears for perceptions of transparency, as well as measures that may capture a more objective existence of transparency. However, the programme does not appear to have increased actual knowledge of the oil and gas sector in the area.
Because both treatment and control groups received an information packet (thus, our design did not allow for a true control group), there is reason to expect there may be no significant difference between treatment and control – insofar as transparency is defined simply as access to information.
However, in our theory of change, we use the concept of transparency to refer to a culture of information sharing between citizens and oil sector decision makers and an increased pursuit of information by citizens (spurred by the mandate for participants to share information after the MSFs). We therefore expect perceptions of transparency or confidence in being informed to emerge in response to the MSFs and enable treated communities to demand greater accountability from oil companies and local government officials.

23
Indeed, we find significant increases in different measures of transparency due to the programme. We report these findings in Figure 11, which shows estimated treatment effects for several variables:
• True-False (T/F) per cent correct (the per cent of questions answered correctly on a true-or-false quiz about the oil sector in the region);
• Pursue information (have respondents tried to get more information about the oil and gas sector?);
• Awareness (on a 3-point scale, do respondents feel aware of oil and gas activities?);
• Information confidence (on a 3-point scale, do respondents feel confident in their ability to get information about oil and gas?);
• Information outreach (on a 3-point scale, how often do respondents think decision makers provide the public with information about oil and gas?); and
• Transparency perception (on a 3-point scale, do respondents believe decision makers in the oil and gas sector are open and transparent?).
As the graph of DID estimates shows, the treatment had significant effects on pursue information, information outreach and transparency perception. Respondents in the treatment group were more likely to report pursuing information on oil and gas independently, more likely to report decision makers’ giving them information directly and more likely to broadly perceive oil sector decision makers as at least somewhat transparent. Awareness is borderline significant.
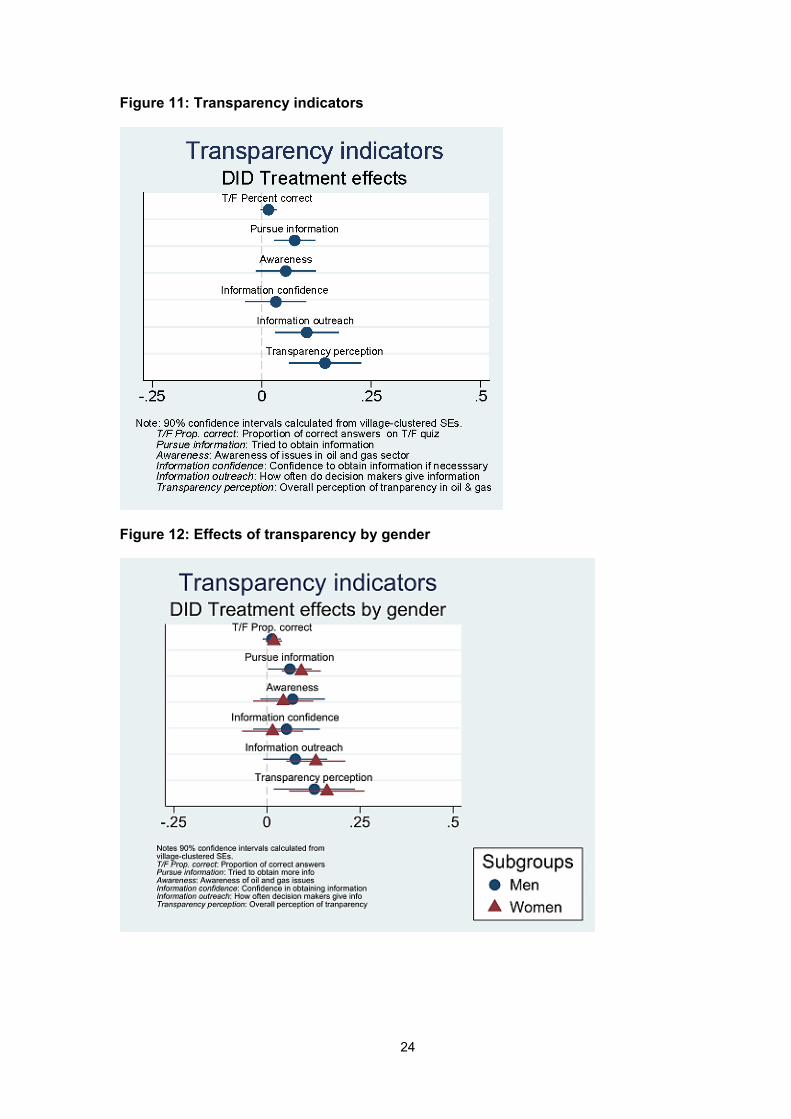
Analysing by gender (Figure 12) shows that the programme seems to increase transparency for both men and women by a similar magnitude. In this case, some of the treatment effects are significant for women and not men. However, we expect that this is because of decreased statistical power in samples for individual genders and that the true effects are similar for both genders.
It is possible that the increase in transparency perceptions is linked to increased female and male participation in village and oil sector meetings. Those increases are significant, as we discuss in the section on civic activity (Section 5.2). Thus, the MSFs increase access to decision makers and lead villages to hold subsequent public meetings that are accessible to a wider group of residents. At these village meetings, information may be discussed and clarified, resulting in better informational outreach and a stronger perception of transparent decision-making.
24
Figure 11: Transparency indicators
Figure 12: Effects of transparency by gender

25
5.2 Civic actions
Summary: The intervention increases civic activity by households and communities. Much of this civic activity involves communication with decision makers at this early stage of the oil extraction process (in particular, village meetings and meetings with oil sector representatives). We also report increases in strategic actions (e.g. protests and lobbying efforts) in treatment villages, although these events are infrequent enough in the sample that we do not include them in our statistical analysis.
We asked each respondent about two types of civic actions related to the oil and gas sector: those taken by the household and those taken by their community. To gather data on the quality of civic activity, we also asked which of 15 types of civic actions they took. Many of these types were reported infrequently. We therefore limit our statistical analysis to (1) whether there was any activity taken, (2) meetings with decision makers in oil and gas, (3) participation with civil society groups7 and (4) village meetings. We plot the effect of the programme on these civic activities in the region in Figure 13.
In Figure 13, circles indicate a positive treatment effect on any activity (oil meetings, civil society participation and meeting with village leaders) at the household level, and triangles indicate positive effects at the community level. Analysing by gender (Figure 14) indicates that the magnitude of these effects is very similar for men and women.
Figure 13: Civic actions
7 CSOs include women, youth, farmers, religious, elderly, persons with disabilities, credit and savings, and other groups.

26
Figure 14: Civic actions by gender
5.3 Satisfaction index
Summary: The programme improves overall satisfaction for the issues households care most about. However, there is no evidence that overall satisfaction with any particular issue improves. These results could indicate that responses to the intervention are already targeting household preferences with regard to land management, social services and local economic development.
We wanted to ensure communities and households could identify improvement in the issues they deemed more important. Our piloting and MYJ’s previous work suggested that land management, social service provision and local economic development (including employment) were the most salient issues. To examine which issues people cared most about, we asked each survey respondent to rank the relative importance of the three issues.
We presented survey respondents with three notecards, each labelled with one of the three issue areas. We asked respondents to allocate 10 stickers across the notecards, in proportion to how important they thought each issue was. We then asked each respondent why they chose a particular issue as most important. After this task was completed, we placed three more cards in front of them and asked them to place zero to 10 stickers, in proportion to how satisfied they were with the handling of each issue by the relevant decision makers. We asked them to explain reasons for their satisfaction.
From these two tasks, the issue importance ranking and the issue satisfaction ranking, we calculated a satisfaction index. We formed the index by using issue importance scores to weight, up or down, respondents’ reported satisfaction with each issue area.

27
We then summed the weighted satisfaction scores across issue areas.8 This method is based on the idea that increased satisfaction with a policy area the respondent cares little about is less meaningful than increased satisfaction with a policy area the respondent cares about highly.
Figure 15 shows the estimated DID treatment effects on this outcome for all respondents, as well as subgroups of men and women. The figure shows a positive, significant effect of the intervention on the index. For all households, the intervention improves the satisfaction index by approximately 0.25 on a 10-point scale. Substantively, this means the intervention led to a moderate increase in respondents’ reported satisfaction with issue areas they prioritised. The other estimates show that the magnitude of this effect is similar for men and women.
Figure 15: Satisfaction index
We note here, and show below, that we do not observe significant effects of the treatment on (1) the net importance respondents assigned, on average, to particular issue areas, or (2) the net satisfaction respondents reported with any particular issue.9 We did not have a priori hypothesis about changes in satisfaction for particular issue areas; our only hypothesis was that the intervention is likely to increase satisfaction with issue areas respondents prioritised most, whatever those issue areas happened to be. 8 The summative index is formed as follows: 𝑆𝑆𝑇𝑇𝑇𝑇𝐸𝐸𝑆𝑆𝑆𝑆𝑇𝑇𝑆𝑆𝑇𝑇𝐸𝐸𝑆𝑆𝐸𝐸 𝐼𝐼𝐸𝐸𝐸𝐸𝑇𝑇𝐼𝐼𝑖𝑖𝑖𝑖𝑖𝑖 = 1
10∑ (𝑤𝑤𝑖𝑖𝑖𝑖𝑖𝑖,𝑚𝑚3𝑚𝑚=1 × 𝑆𝑆𝑖𝑖𝑖𝑖𝑖𝑖,𝑚𝑚),
where m indexes one of the three issue areas, w is the self-identified importance weight of an issue, and S is the self-reported satisfaction with issue m. The fraction 1
10 is simply used to scale
the index so the minimum and maximum values reflect the same minimum and maximum values for each issue area (where each issue can receive zero to 10 stickers for both importance and satisfaction). The satisfaction index thus also ranges from zero to 10; the value is zero if the respondent is unsatisfied with each issue area. 9 Although this is true when looking at the sample as a whole, as we show in Section 5.7, the intervention does affect how women ranked the issues in importance. The intervention causes women to rank land as less important and social services as more important.

28
Treatment group respondents are better prepared to demand targeted change from decision makers on the issues they care most about.
Finally, the magnitude of the treatment effect is similar for men and women, although insignificant for women at the 0.10 level. Despite this, the treatment effect for women is not substantively different, and the insignificance is probably due to dividing the sample in half. In sum, as predicted, the intervention appears to align satisfaction with issues a household thinks are most important.
At baseline and endline, we found that the most important issue was land management. We thus devote the next section of this report to examining the effects of the intervention on land management. Smaller sections follow with data regarding the other two issues we covered in our survey: social services and local economic development.
5.4 Land management
Summary: The programme does not appear to significantly improve outcomes in land management (e.g. increased rates of registration and demarcation). However, such impacts could take more time to observe or be overwhelmed by larger secular trends in land demarcation and registration.
The previous analysis of the satisfaction index found that the programme causes people to be more satisfied with the issues they care about. However, improvement in satisfaction is not evidence of actual improvements in outcomes (i.e. respondents could simply be feeling more satisfied with the status quo). In this section, we examine precise programme impacts for land management–specific outcomes.
Figure 16 shows no significant difference in land ownership, rates of land registration or rates of outside claims being made on respondents’ land. However, we do estimate a significant and negative treatment effect for land demarcation, implying that the MSFs cause people to demarcate their land at slower rates. This does not mean the MSFs discourage people from demarcating their land, only that the rate of land demarcation is lower in treatment villages than in control villages.
Notes from our qualitative data and process monitoring indicate that this could be due to one of three reasons. First, those who participated in the MSFs might have prioritised other strategies over demarcation after participating in the MSFs. Second, because development of oil and gas was somewhat stultified during the study period, some areas of the study might have had yet to feel the full pressure of land conflict that may emerge later in the project cycle. Third, there is a larger secular trend of land demarcation and registration; both treatment and control villages have increased activity in land during the period. These larger trends, driven by other government programmes, could simply overwhelm the effects of the programme, especially in control villages, where people may be unaware of other strategies for coping with changes in the oil and gas sector.
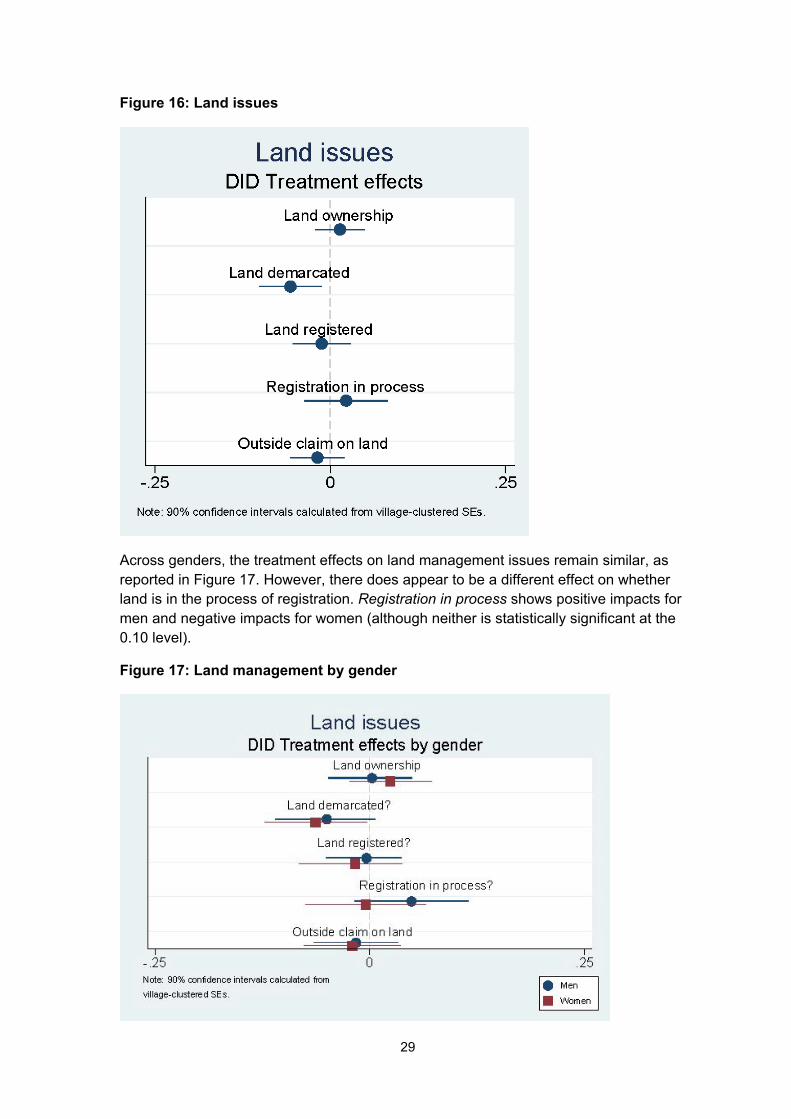
29
Figure 16: Land issues
Across genders, the treatment effects on land management issues remain similar, as reported in Figure 17. However, there does appear to be a different effect on whether land is in the process of registration. Registration in process shows positive impacts for men and negative impacts for women (although neither is statistically significant at the 0.10 level).
Figure 17: Land management by gender

30
5.5 Social services
Summary: The programme does not appear to significantly improve outcomes that measure access to different social services. However, such impacts will likely take more time to appear and therefore would not be picked up in the endline survey, due to our accelerated timeline.
Respondents were asked, at baseline and endline, whether they had access to a number of different social services. Treatment village respondents, being better prepared to demand accountability from various levels of local government, could, over time, gain improved access to some or all of these services. DID estimates in Figure 18, however, suggest this has not yet occurred (at least between the baseline and endline surveys).
This result is likely not due to a ceiling effect. Hypothetically, it is true that a treatment effect might not be observed because access to these social services is already as high as it could plausibly go. As can be seen in more detail in the descriptive figures in online appendix F, however, that is almost certainly not true for this study. For example, only approximately 50 per cent of respondents in the baseline and endline have access to secondary schools, only approximately 5 per cent have access to electricity and only approximately 65 per cent have access to safe drinking water.
Figure 18: Access to social services
Figure 19 shows that similar null effects are seen when analysing by gender. The only possible exception is that men were almost significantly less likely to have access to roads and bridges. This is probably a result of random error; there is no clear theoretical explanation why only men would lose access to roads or how roads and bridges in general might disappear over a short period.

31
Figure 19: Access to social services by gender
5.6 Local economic development
Summary: We do not find strong evidence for programme impacts on most measures of access to the benefits of local economic development. Again, such impacts will likely take more time to appear and therefore would not be picked up in the endline survey, due to our accelerated timeline. One exception is that we do find evidence of significant programme impacts that increase access to markets.
Respondents were asked several questions about their participation in the local economy and different benefits (particularly employment and skills training) they might have received due to oil development in the region. For this analysis, we focus on the following questions:
• Is someone in your household a member of a business association for farmer cooperative?
• Has someone from your household participated in a skills training programme (e.g. welding, cooking)?
• Has someone from your household been directly employed by an oil company? • Has someone from your household been employed in a job that supports oil
development in the region? • Do you have access to markets?
Figure 20 shows that the only significant change resulting from the treatment is in reported access to markets, and Figure 21 indicates that this result holds for male and female respondents.

32
Figure 20: Local economic development
Figure 21: Local economic development by gender
This result is worth considering more deeply. It appears that in the baseline, 83 per cent of control respondents indicated having access to markets, compared to only 74 per cent of treatment respondents. In the endline survey, this number changes to approximately 83 per cent for respondents in both groups. In other words, the treatment appears to have caused a difference arising from random selection in the baseline to be equalised away by the time of the endline survey. This could be a result of treatment group respondents’ sharing more information at a community level. This suggests that limited benefits from local economic development might arise not only because those benefits do not exist, but also because people are not aware of them.

33
5.7 Attribution of responsibility
Summary: There is no significant evidence that the treatment concentrates blame and credit on fewer actors. However, these effects may take some time to change as people interact and observe the actions of the various actors in response to their preferences.
We are also interested in how people attribute responsibility to different political actors. Similar to the issue importance ranking task, we asked respondents to place stickers among cards labelled with seven key decision makers – the community, village leaders (LC1s), sub-county leaders (LC3s), district leaders (LC5s), national leaders, oil companies or CSOs. We asked them to place 10 red stickers amongst cards labelled with these leaders, in proportion to the amount of blame they placed on each one. We then had them place 10 green stickers on the cards in proportion to the credit they gave each decision maker. Finally, we asked why they had attributed blame or credit to a particular source.
We hypothesise in the project proposal that people who attended the MSFs would learn about the roles different decision makers have in the oil and gas sector. We argue that this would provide a clarifying force to propel respondents to allocate credit and blame among those actors most responsible for the issues they care about. Thus, we argue, attribution of credit and blame would be less diffuse after exposure to the intervention.
Figure 22: Herfindahl index of attribution
To calculate the diffusion of credit and blame, we formed a Herfindahl index across the seven actors for each individual. The Herfindahl index (e.g. Kwoka 1985; Rhoades 1993) is a measure of dispersion ranging from zero to 1 (where 1 means complete concentration of credit or blame on one actor and zero means perfectly equal concentration across all actors). Using this measure of dispersion, we then assessed whether the treatment decreases the diffusion of blame (thus, blame and credit would be concentrated on fewer individuals). Figure 22 shows these results.

34
There are no significant impacts of blame or credit diffusion due to treatment. Both Herfindahl indexes for blame and credit increase due to treatment, thus implying more concentration; however, these effects are not statistically significant at the 0.10 level.
Although we did not have an a priori hypothesis about how blame and credit would shift between actors, we also investigated whether there was a systematic shift amongst actors due to the treatment. We report these results in Figure 23. There is some modest evidence that LC3s receive less blame and central government leaders receive less credit due to the treatment, but there is no strong theoretical reason to expect these shifts.
Finally, we examine the DID of the allocation of blame and credit to different actors by gender. Figure 24 presents these results. There is some difference between genders. The treatment causes men to increase blame to LC5s, directing it away from the central government. Meanwhile, the intervention causes women to decrease blame to LC3s and give less credit to the central government. During our baseline analysis, we found that women tended to blame local actors and credit central actors, while men did the opposite (see Section 4). The intervention appears to remove those differences, so that blame is allocated similarly for men and women at endline (again, see Section 4).
Figure 23: Attribution of responsibility

35
Figure 24: Attribution of responsibility by gender
5.8 Summary table of results
Some readers prefer a formal table of results. We summarise the mean baseline and endline, treatment and control, and DID estimates, estimated with robust standard errors, in Table 4. These are identical to the figures above but provide precise numeric values for the quantities used to make the preceding figures.

36
Table 4: Mean values and differences of outcomes across time and treatment group
Baseline Endline DID
Mean control
Mean treatment Difference
Mean control
Mean treatment Difference
Composite index of issues 3.883 3.742 –0.141* 3.970 4.064 0.095 0.236** [n=1581] [n=1566] (0.08) [n=1609] [n=1579] (0.10) (0.11) Issue ranking: managing land rights 4.122 4.019 –0.103 4.867 4.900 0.033 0.136 [n=1618] [n=1583] (0.16) [n=1620] [n=1590] (0.16) (0.14) Issue ranking: receiving access to 3.680 3.631 –0.049 3.349 3.308 –0.041 0.008
social services [n=1618] [n=1583] (0.12) [n=1620] [n=1590] (0.13) (0.12) Issue ranking: improving household 2.198 2.350 0.152 1.784 1.792 0.008 –0.144
access to local economic development [n=1618] [n=1583] (0.10) [n=1620] [n=1590] (0.10) (0.11) Satisfaction: managing land rights 3.960 4.128 0.168 4.485 4.839 0.354* 0.186 [n=1581] [n=1566] (0.19) [n=1609] [n=1579] (0.21) (0.18) Satisfaction: receiving access to 3.966 3.660 –0.307* 4.175 3.702 –0.474*** –0.167
social services [n=1581] [n=1566] (0.16) [n=1609] [n=1579] (0.18) (0.16) Satisfaction: improving household 1.822 1.998 0.176 1.324 1.435 0.111 –0.065
access to local economic development [n=1581] [n=1566] (0.11) [n=1609] [n=1579] (0.10) (0.15) Prop correct T/F transparency 0.272 0.268 –0.003 0.340 0.352 0.012 0.016
questions [n=1454] [n=1406] (0.02) [n=1591] [n=1557] (0.02) (0.01) Have you tried to get information 0.196 0.184 –0.012 0.173 0.237 0.064*** 0.075***
from that source? [n=1570] [n=1536] (0.03) [n=1592] [n=1566] (0.02) (0.03) Aware of the activities going on in 1.662 1.691 0.028 1.751 1.834 0.083 0.055
the oil sector that affect you? [n=1616] [n=1580] (0.04) [n=1619] [n=1589] (0.05) (0.04) Confident that you can get 1.854 1.889 0.034 1.932 1.999 0.067 0.032
information you might need? [n=1598] [n=1562] (0.04) [n=1614] [n=1586] (0.04) (0.04) How often do decision makers give 1.500 1.540 0.041 1.603 1.746 0.143*** 0.103**
your community information? [n=1443] [n=1392] (0.04) [n=1549] [n=1542] (0.04) (0.04) Are these decisions generally open 1.842 1.864 0.023 1.804 1.972 0.167*** 0.145***
and transparent? [n=1306] [n=1259] (0.05) [n=1414] [n=1441] (0.06) (0.05) Household – any actions 0.059 0.055 –0.004 0.052 0.126 0.074*** 0.078***

37
Baseline Endline DID
Mean control
Mean treatment Difference
Mean control
Mean treatment Difference
[n=1518] [n=1499] (0.01) [n=1579] [n=1549] (0.02) (0.02) Household – oil sector meetings 0.032 0.031 –0.001 0.032 0.081 0.050*** 0.051*** [n=1518] [n=1499] (0.01) [n=1579] [n=1549] (0.01) (0.01) Household – protests 0.005 0.005 –0.001 0.003 0.011 0.008* 0.008 [n=1518] [n=1499] (0.00) [n=1579] [n=1549] (0.00) (0.01) Household – participate with CSOs 0.022 0.016 –0.006 0.013 0.023 0.011 0.016* [n=1518] [n=1499] (0.01) [n=1579] [n=1549] (0.01) (0.01) Household – village meetings 0.038 0.029 –0.008 0.031 0.094 0.063*** 0.071*** [n=1518] [n=1499] (0.01) [n=1579] [n=1549] (0.02) (0.02) Community – any actions 0.096 0.091 –0.005 0.112 0.275 0.164*** 0.169*** [n=1314] [n=1304] (0.02) [n=1426] [n=1427] (0.03) (0.03) Community – oil sector meetings 0.066 0.069 0.003 0.081 0.174 0.094*** 0.091*** [n=1314] [n=1304] (0.02) [n=1426] [n=1427] (0.02) (0.02) Community – protests 0.008 0.003 –0.005* 0.009 0.015 0.006 0.011* [n=1314] [n=1304] (0.00) [n=1426] [n=1427] (0.01) (0.01) Community – participate with CSOs 0.042 0.028 –0.014 0.032 0.071 0.039*** 0.053*** [n=1314] [n=1304] (0.01) [n=1426] [n=1427] (0.02) (0.01) Community – village meetings 0.059 0.052 –0.006 0.072 0.203 0.131*** 0.137*** [n=1314] [n=1304] (0.02) [n=1426] [n=1427] (0.03) (0.03) Land ownership 0.847 0.868 0.021 0.848 0.884 0.035 0.014 [n=1608] [n=1578] (0.02) [n=1616] [n=1589] (0.02) (0.02) Land demarcated 0.744 0.761 0.017 0.831 0.792 –0.040 –0.057** [n=1499] [n=1506] (0.03) [n=1546] [n=1536] (0.03) (0.02) Land registered 0.160 0.141 –0.019 0.125 0.094 –0.031* –0.012 [n=1331] [n=1323] (0.02) [n=1432] [n=1412] (0.02) (0.02) Land registered or in process 0.348 0.344 –0.004 0.328 0.334 0.007 0.011 [n=1331] [n=1323] (0.04) [n=1432] [n=1412] (0.03) (0.03) Claim on land 0.156 0.188 0.032 0.153 0.167 0.014 -0.018 [n=1553] [n=1528] (0.02) [n=1591] [n=1561] (0.02) (0.02)
Notes: Two-tailed hypothesis tests: *** p < 0.01, ** p < 0.05, *p < 0.10. Village-clustered standard errors in parentheses. Sample size in brackets.

38
6. Qualitative results
This section provides information drawn from the qualitative data we gathered in the baseline and endline surveys. Due to the sheer amount of data, we are unable to include it all in this report. However, we report here the most salient findings that add context to the quantitative results reported above.
As we have noted, the study is primarily an impact assessment based on an RCT. However, we also probed for qualitative data to help explain the respondents’ reasons and rationale for their responses and to illuminate their experience in oil and gas and with the MSFs. In the context of the household survey, we asked open-ended questions about the issues they cared most about (land management, social services or local economic development), why they attributed blame or credit to different actors and the nature of their household’s civic activities. We summarise the results from these questions below.
6.1 Issue satisfaction
Reasons respondents gave for why they indicated they were most satisfied with different issues are grouped into categories along the x-axis in Figure 25. Clearly, respondents were most satisfied with land more frequently than other issue areas – generally due to their perceptions of secure land tenure. Respondents typically indicated that they were most satisfied with social services because of access to health or education (for descriptive data on rates of access to these, see online appendix F). The few respondents who indicated they were most satisfied with local economic development were most likely to link this to their access to stable jobs and different sources of income.
Figure 25: Qualitative responses on issue satisfaction
Note: In the horizontal axis, LAND refers to land management, SS to social services and LED to local economic development.

39
6.2 Land management
Summary: Land is of highest importance, regardless of time and treatment. Land is important for both its intrinsic and its utilitarian values.
In addition to residents’ high rating of the importance of land, our concern about this issue area rises from MYJ’s previous work. They found that residents in areas where oil development had begun faced land grabbing, as well as conflicts arising from practices (e.g. communal use of land) that did not easily permit formal claims of ownership. At the start of the study in 2015, we expected more intense oil development, not anticipating the impacts of low oil prices and the generally slow pace of development in the Albertine Graben. Thus, many communities in our sample (treatment and control) have not yet experienced true oil development. We extract quotes below based on our coding structure (online appendix B) and the frequency of different themes and language.
The intrinsic value placed on land was striking when we asked respondents why they prioritised land issues. This was the most common response in our qualitative data. Men and women expressed equally strong sentiments and used similar language to describe why land is most important to them. Commonly used phrases included ‘land is my life’, ‘everything I do is on land’ and ‘life depends on land’.
The following are some direct quotes that are typical of respondents’ expression of the value of land:
Without land I am nothing; everything is from land.
Without land you are nobody even if you are educated.
Land is important. Without land there is no life.
Land is the foundation of everything.
If it was not that I live on land, I would have no importance.
The second most important reason given for valuing land was its utilitarian value, as stated widely and across genders in responses – e.g. ‘grow crops for food’, ‘sell for cash’, ‘earn a living’, ‘keep my children’, ‘building roads’, ‘main livelihood source’, ‘feed my children’, ‘to have a settlement to live’, ‘to bury [a] family member’.
Land is the only inheritable resource I can leave for my children.
I grow my food crops, like maize, sweet potatoes, cassava, on land and I also can lease it out to any businessman and I can keep earning money.
Land is everything. Even roads, schools, health centres are constructed on land.
Without land, you cannot be able to carry out any activity.
When companies get oil in my land they will pay me a lot of money, which I will use for my family. I have not witnessed any conflict over this land here.

40
The reasons for land’s importance at baseline, particularly its intrinsic value, were similar to those at endline and similar for those villages exposed to the programme and those who were not. Thus, the central importance of land remains high, independent of time and treatment.
Despite this, our data also show that only approximately 34 per cent of respondents at baseline and endline indicated that their land was formally registered. Meanwhile, as we noted when reviewing DID estimates, land demarcation appears to have decreased slightly in response to the treatment. We can provide only a speculative explanation for this. It could be that many residents in the study area did not feel their land was threatened. A figure in online appendix F, for example, shows that outside claims on land were reported by only approximately 15 per cent of respondents in most districts.10 If this is the case, it remains an open question how communities will react to future claims, and whether treatment and control villages from this study might respond to such claims differently.
6.3 Social services
Among social services, health and education were discussed the most, with no significant difference between genders. Health centres were identified as important.
Social services like health centres are important because life depends on health centres in case of sickness.
… when my child is sick I can get treatment from the hospital.
… without social services like hospitals or health centres there will be no treatment of the sick and actually we all die.
… health centres are near, we easily access drugs and even these young ones easily go alone.
… if we have better health facilities people will be healthy and all the people will be strong to work, and they will be economically stable.
… things like health centres which helps people to get drugs to reduce the high rate of death.
… health centres if it is to be near it would help our ladies for antenatal cases so I choose it to be of great importance.
Education was often mentioned alongside health for a combination of reasons, such as finding a pathway to better jobs, and better livelihoods and obtaining knowledge.
10 An exception is amongst respondents in Nwoya District. Around 50 per cent of respondents there indicated outside claims. However, this district included only four study villages and represents a small fraction of our sample.

41
Education as a means to better livelihoods:
Social services are most important like schools make our children to get educated and get employed at the end of their education.
When schools are built, it can open the eyes of the following children and can, in future, bring other development in the area.
Education helps to provide skills and knowledge to our children, which will help them to get better jobs in future.
We want our place to develop in terms of education, and this will increase employment opportunities because our place has been behind.
Without services like schools, our children will not get well-paid jobs.
Education for knowledge:
Having a school is the most important thing to me, because it is where our children get knowledge from.
Education opens mind[s] and it clears [the] future for our children.
Although the oil sector is not active in most of our study areas, refugee camps are now present in the north, housing refugees from the conflict in South Sudan. An interesting qualitative finding is that, according to respondents, nearby camps appear to have an impact on social services and local economic development through increased access to jobs and healthcare. We discuss a robustness test based on this finding in Section 7.
6.4 Local economic development
Qualitative data indicate that those who expressed high importance of local economic development were largely concerned about jobs, although income, access to markets and other benefits were also mentioned. Respondents’ comments relating to why jobs are important cover some expected reasons, largely their interest in being able to care for their families.
When I am employed, it can change my family and also my community and people around.
Opportunities for local economic development are important most because when you get jobs, you will be able to care for your family.
Improved standard of living:
This improves the standard of life. That is, when employed, we can change the way he lives – eating well, living a happy life and enjoying all the positive benefits.
Local economic development is more important for me because when the refugees were brought, my daughter [got a] job with World Vision, which has improved [the] well-being of my family.

42
The idea of creating jobs will be the most important thing because when you are employed, everything becomes almost possible.
Ability to pay for education:
Opportunities for local economic development are important because when people get jobs, they pay [to send] their children to high-quality schools.
I have a job I can do everything I want, like constructing houses, buying land and even paying school fees.
There are a lot of children in this area who have attained various levels of education. Having jobs would make them self-reliant, getting their needs from their own pockets.
Help in old age:
Improving my household job opportunities is most important to me because when my children get jobs, they will use this to help me in future when [I] am old.
Meeting basic needs:
I consider local economic development of great importance, because my job helps me to get money to support my family with food, materials, shelter in form of house, etc.
If people are employed, there will be no poverty at the household levels.
6.5 Attribution of blame and credit
Qualitative data indicate that most blame in the endline survey, regardless of gender, is placed on neglect, and that most credit is due to good leadership. The attribution of these traits is dispersed across different decision makers, consistent with findings from the quantitative data. This is a slight change from the baseline, where the primary reasons for blame are the benefit gap (inadequate social benefits) and corruption for both men and women. In Figure 26 we provide more detail on how respondents described neglect and good leadership.

43
Figure 26: Qualitative responses on attribution of blame
6.5.1 Blame due to neglect Respondents citing neglect as the reason for allocating the most blame to a given actor tended to focus on more distant actors, e.g. the central government, the district government, CSOs and oil companies. However, it was also relatively common for accusations of neglect to be levelled at local governing authorities. In explaining accusations of neglect, some argued that decision makers gave priority to their home areas or their own families or ethnic group, whilst ignoring others. Others emphasised that their elected leaders (often members of Parliament) lost interest in local opinions the second an election was over. There was also concern about decision makers not providing benefits other villages had, about unfulfilled promises made to shore up support in an election, and about decision makers not listening to the public or fulfilling duties such as maintaining social services and delivering information to the public.
There does not appear to be any striking pattern across treatment groups or gender regarding claims of neglect. From a gender perspective, women in the control group stated that they blamed government authorities for the lack of social benefits (consistent with the baseline), whereas women in the treatment group placed most blame on neglect. Post-treatment, men and women both placed far more blame on neglect than on corruption, as they had in the baseline.
Our LC5 does not know about people in Abunia since he is from Ajiru; he develops his own place, hence leaving us abandoned from government programmes.
The MP [member of Parliament] has not come to us in the village or the school since he was elected. But we hear he is going to other places.
… blame the district leader most because he favours other sub-counties and village[s] when it comes to allocation of things like boreholes; that’s why we don’t have safe water.
LC5: because he is not monitoring the activities of the people employed to work in social services, like the teachers in the schools, nurses in the health centres,
0200400600800
100012001400
Reasons for blaming district, sub-county and village leaders: endline

44
they are not performing. He does not come to listen to us for our needs since he was elected in office.
LC1: Village leader cannot call the village in time and he cannot deliver us with some information from the higher offices; that is why I blame him the most.
6.5.2 Credit due to good leadership Good leadership and social benefits stand out as the main reasons for attribution of credit. Respondents provided a complex picture of good leadership, characterised by a broad and impressive set of traits:
Fairness:
When we report any issue or problems, our LC1 knows very well how to solve them and he is very just.
The ability to maintain peace:
Central government carries the most credit because we stay in peace without war in Uganda.
Welcoming oil companies:
I thank LC3 for welcoming people of oil companies to do development in this area.
Helping to maintain a moral standard:
Our LC3 is fairly doing okay: he [has] stopped discos at night; he also stopped market which people used to attend at night.
Hosting refugees:
Our county is nowadays hosting refugees and we are benefiting from the activities in refugee camps; all these are because of food security.
Safety:
I give the most credit to LC1 because he always calls us for meetings. He even sometimes registers new members/visitors in the village for our safety, since we are far from police station.
Respondents shared a host of other reasons, e.g. sharing information, calling meetings and unifying people. Comments on social benefits largely focused on increased access to schools that are free and health centres that are well equipped and where service is respectful.
Although blame and credit were widely dispersed, responses reflected a wide range of considerations that show considerable sophistication amongst respondents about wanting a just society that is transparent, accountable and equitable.

45
Figure 27: Qualitative responses on attribution of credit
6.6 More detail on civic activities
In addition to asking respondents about their household or community’s participation in civic activities in general, we asked whether they engaged in civic actions and, if so, what action. There appear to be noteworthy differences between treatment and control groups in activities that were not frequent enough to include in our DID estimation. We report data on these actions in Table 5 and Table 6.
Table 5: Reported action at the household level
Men Women Treatment Control Treatment Control Protest (endline) 7 3 10 2 Protest (baseline) 5 4 1 4 Vote (endline) 13 5 14 8 Vote (baseline) 12 6 11 14 Meet LC3 (endline) 9 5 6 5 Meet LC3 (baseline) 9 9 8 10 Meet LC5 (endline) 1 2 1 3 Meet LC5 (baseline) 3 3 3 5
Note: LC3 is the head of the sub-county government. LC5 is the head of the district government.
Table 6: Reported action at the community level
Men Women Treatment Control Treatment Control Protest (endline) 10 7 11 6 Protest (baseline) 2 7 2 4 Vote (endline) 21 8 24 10 Vote (baseline) 15 19 11 11 Meet LC3 (endline) 18 10 13 9 Meet LC3 (baseline) 14 24 6 12 Meet LC5 (endline) 5 6 3 5 Meet LC5 (baseline) 5 12 2 7 Lobbying (endline) 9 0 8 1 Lobbying (baseline) 3 4 0 3
Note: LC3 is the head of the sub-county government. LC5 is the head of the district government.
0 200 400 600 800 1000 1200 1400
No corruptionGood leadership
CompetenceCommunity cohesion
Good engagementSufficient Information
Social benefitEconomic benefit
Laws & policies
Attribution of credit

46
Below, we explore additional information about civic activity in these villages that can be fleshed out through the descriptive and qualitative data.
6.6.1 Attendance at oil sector and village meetings Most of the change in civic activity can be attributed to increases in community-level attendance at oil sector meetings in treatment villages. This increase was statistically significant for male respondents (55–133, a 142% increase) and female respondents (35–116, a 231% increase), as shown in Figure 28. A similar pattern is seen for attendance at meetings with village leaders (Figure 29).
Figure 28: Attending oil sector meetings, community level
Figure 29: Attending village leader meetings, community level
6.6.2 Lobbying frequency At the community level, respondents in treatment villages were more likely to report lobbying efforts11 (from 3 to 17 between baseline and endline), whereas reports of lobbying efforts decreased in the control group (from 7 to 1 between baseline and endline). The increase in lobbying is important because district plans are the primary means through which local development priorities and budget allocations are made for localities. It is also a goal of the MSFs to make government officials and other authorities – from village to district levels – aware of community priorities and to incorporate them
11 By lobbying, we mean writing letters of petition or meeting with decision makers to make a particular request or demand.

47
into official plans. Ideally, community consensus around an issue would be brought to the attention of these officials via a letter of request from the LC1 to the sub-county level, and finally to the district level.
Through MYJ’s monitoring process, we are able to confirm many instances in which communities took the information they learnt at the MSF and formed action plans to influence decision makers. Monitoring revealed that during the three-month measurement period, 43 of 52 villages in the treatment group held oil sector meetings post-MSF, and those meetings generated consensus around 43 action plans.
For example, in some instances, treatment villages sent official letters about their priority concerns through their LC1s, and there is evidence that such letters, signed by village residents, were moved to sub-county authorities for incorporation into official sub-county development plans. With time, we expect those priorities to be adopted by district authorities in the district development plan.
There is also at least one example of a treatment village that set out to lobby for access to safe water as a village priority in its action plan. This priority was brought to the attention of sub-county authorities through a letter by the LC1 and, within a few weeks, the sub-county authorities had repaired the borehole in that village.
7. Robustness checks
7.1 Spillovers: distance between villages
Interference between study units is an important threat to statistical inference. If assignment of the treatment to one village somehow influences outcomes in another village, then our estimates of the treatment effect are biased. To be certain our results are trustworthy, we need to account for this threat of spillover effects.
A natural reason to expect spillover effects in this study is social interaction between respondents. Figure 30 shows the proportion of respondents in different districts indicating frequent (daily or weekly) visits to or from other villages. Because of the frequency of visits between villages, it is quite possible that study participants in one village interacted with study participants in another.
Residents of a treatment village also could have discussed what they learnt and accomplished through MSFs with friends or relatives in a nearby control village – in effect, encouraging residents of that control village to take similar actions. Thus, civic activity in a control village could increase because they are close to a treatment village. On the other hand, seeing nearby villages receive benefits and resources through an MSF that one’s own village does not receive could spur feelings of frustration or jealousy that influence patterns of public opinion and decrease civic action.12 We are agnostic about the net impact of spillovers and are mainly interested in ensuring our results are robust to account for them.
12 There is evidence from the qualitative data that such cross-village comparisons of benefits received from external actors (e.g. non-governmental organisations) do occur, and that there were residents of control villages in the study who were confused about why they did not receive the MSF treatment that other villages did.

48
Figure 30: Proportion indicating frequent visits with other villages
Gerber and Green (2012) provide a method for generating unbiased estimates of the treatment effect from RCTs in the presence of spillovers. Their approach requires a theoretical presumption about how spillovers are transmitted. In our case, we argue that distances between villages should proxy for the relative strength of potential spillovers. We presume that the severity of interference between units is primarily a function of how far each village is from at least one separate treatment village. Communication between residents of the study area is often face-to-face, so respondents from one village are likely to interact most with respondents in other nearby villages.13
Rather than attempting to divine the precise distance between villages that accounts for most regular social interaction, we show that our results are robust to presuming multiple arbitrary distances – treatment villages 1 kilometre, 3 kilometres, 5 kilometres and 10 kilometres away. We describe the estimation procedure below, and then give an overview of the results in a table in online appendix G
Presume we are interested in spillovers for distances of 5 kilometres. First, we create a circle for each village, centred on the village. The edge of this circle shows every point exactly 5 kilometres away. In geographic information system (GIS) parlance, this is called a buffer. We then determine whether there is a treatment village within the buffer,14 do this for every village and assign a two-way categorisation over the entire set of villages: spillover versus no spillover and treatment versus control.
Second, the random selection of treatment and control villages was repeated 5,000 times. We apply the above categorisation to each of the simulated data sets and record the number of times each village falls into each category. Third, we average over these
13 Only 405 respondents in the baseline and 488 in the endline reported that someone in their household used social networking services such as WhatsApp, Facebook or Twitter. Thus, online communication is unlikely to lead to noteworthy spillover effects in this sample. 14 Distances are calculated in the R statistical environment using the spDists() function, written by Bivand and Pebesma (authors of Bivand et al. 2008). This function estimates distance in kilometres using the common ‘great-circle’ approach (see, e.g.: Berry et al. 2010; Nastro and Tancredi, 2010; Kifana and Abdurohman 2012). Distances estimated this way are similar to distances calculated via QGIS software on a data set of villages projected in Universal Transverse Mercator (UTM) zone 36N (a projection with a base unit of metres that draws on the standard WGS84 reference coordinate system).

49
5,000 simulated data sets, yielding an estimate of the probability each village would be a treatment village with spillovers, a treatment village with no spillovers and so on. Finally, we keep only the probability of the observed outcome – e.g. a control village facing a spillover in the true data set keeps only the 5 kilometre probability weight that it would be in the category control spillovers. This process is repeated for buffers of 1 kilometre, 3 kilometres and 10 kilometres. Summary data is in Table 7.
With these probabilities in hand, we modify our DID estimator to resemble the weighted difference-in-means estimator outlined in Gerber and Green (2012). To estimate the average treatment effect without bias, those authors exclude units that see spillovers. In the interest of not dropping important data, we elect to use the probabilities explained above in a weighted least-squares estimation of our DID model.15
Table 7: Frequency of nearby treatment villages within __ km
Category Treatment
no spillovers Treatment spillovers
Control no spillovers
Control spillovers
Within 10 km 5 49 5 49 Within 5 km 17 37 20 34 Within 3 km 44 10 38 16 Within 1 km 54 0 51 3
The first table in online appendix G compares the DID estimates when not accounting for spillovers to the estimates presuming spillovers are 1 kilometre, 3 kilometres, 5 kilometres and 10 kilometres. All previously significant variables retain their statistical significance across buffers, and their magnitudes fluctuate little. In sum, we take this as evidence that the size of the effects documented in our main results represent a direct effect of the treatment, not an indirect effect biased by interference between units.
7.2 Spillovers: interaction in forums
As mentioned in our description of the treatment in Section 3, representatives from some villages interacted with each other and shared experiences while participating in the MSFs. This arguably constitutes another spillover effect. Could our main results be driven somehow by social interaction that took place in these forums?
Treatment villages were brought into forums by district, as follows: • Group 1: Buliisa, Hoima and Ntoroko • Group 2: Arua, Moyo, Nebbi and Nwoya • Group 3: Yumbe
To account for this, we create separate binary variables indicating whether each respondent is in a Group 1 or Group 2 village (Group 3 respondents are thus the residual category) and rerun our main analysis while accounting for those binary variables. A table in online appendix G shows the DID estimates based on this robustness check. They are not significantly different from our main results.
15 As noted previously in Section 5, this model is given by 𝑦𝑦𝑖𝑖𝑖𝑖𝑖𝑖 = 𝛼𝛼 + 𝛽𝛽𝑇𝑇𝑇𝑇𝑇𝑇𝑇𝑇𝑇𝑇𝑖𝑖𝑖𝑖𝑖𝑖 + 𝛾𝛾𝐸𝐸𝐸𝐸𝐸𝐸𝐸𝐸𝐸𝐸𝐸𝐸𝑇𝑇𝑖𝑖𝑖𝑖𝑖𝑖 + 𝜏𝜏𝑇𝑇𝑇𝑇𝑇𝑇𝑇𝑇𝑇𝑇𝑖𝑖𝑖𝑖𝑖𝑖 × 𝐸𝐸𝐸𝐸𝐸𝐸𝐸𝐸𝐸𝐸𝐸𝐸𝑇𝑇𝑖𝑖𝑖𝑖𝑖𝑖 + 𝜀𝜀𝑖𝑖𝑖𝑖𝑖𝑖.

50
7.3 District fixed effects
Another potential concern is that the average treatment effects could be driven by a subset of districts. We thus replicate our analysis, including district-level fixed effects. A table in online appendix G shows this result, comparing differences in treatment and control groups at baseline and endline as well as DID effects. These estimates are very similar to the treatment effects without controlling for district fixed effects and can be found in online appendix G.
7.4 Sub-county fixed effects
Similarly, unobserved differences between the 22 sub-counties in our data set could also be skewing results. For example, some sub-counties could be hosts to refugee camps or be facing different degrees of exposure to the oil development process. We explore the inclusion of sub-county fixed effects below. A table in online appendix G shows this result. Once again, these DID estimates are very similar to the main findings reported in Section 5.
7.5 Refugee camps
Qualitative data indicate a noteworthy potential confounder that our study design did not consider: some refugees from the ongoing conflict in South Sudan are being housed in the Albertine Graben, and the number of refugees increased during our study (Robinson 2017). Several respondents discussed improved access to social services with enumerators, which they attribute to the creation of nearby refugee camps. There is reason to wonder if our results are somehow influenced by household proximity to these camps.
The final table in online appendix G assuages such concerns. The United Nations Refugee Agency was kind enough to provide us with geographic coordinates of all refugee camps in Uganda. Using QGIS software and a UTM 36N projection (a map projection with metres as its base unit), we calculated the distance between each household and the closest refugee camp. We then converted this distance to kilometres and reran our DID estimate, whilst controlling for household proximity to the closest camp. Our results are not significantly altered.
8. Limitations
In this section, we outline some of the study’s limitations.
8.1 Short period between treatment and endline
The impacts MYJ sought from their intervention are strategic and occur over the long term. In our initial proposal, we planned to wait a year between the treatment and the endline. However, realities on the ground, including donor requirements, and the tight schedule imposed a much shorter period of just three months for the treatment to take effect. This is too short a time for the strategic changes MYJ expects to achieve through the MSFs. Yet we have seen significant impacts on civic action in just three months. Given the current results, we fully expect to see much more impact, and more significant

51
impact, in an endline conducted one or two years from now, assuming MYJ continues to receive funding to implement the MSFs.
8.2 Translation and language issues
Execution of the study (data collection, analysis and stakeholder engagement) required some consistency in meaning, yet residents in the study area spoke 10 indigenous languages and had limited use of English. The study protocol was developed in English and had to be translated for respondents in 10 languages, and enumerators had to record responses in English. It is possible that this limitation may have had a negative impact on meaning. To mitigate this, the informed consent and study protocol were translated in advance and multilingual enumerators were hired.
8.3 Preparation of treatment village representatives
MYJ typically invests a significant amount of time and resources to prepare MSF village representatives before their first engagement with other stakeholders. At minimum, this preparation involves making sure they have a clear understanding of their roles and responsibilities, identification of village priorities, and capacity building to support effective engagement amongst themselves and with other stakeholder groups. Due to the accelerated project timeline and limited financial resources, this preparation did not occur amongst treatment village representatives. To mitigate this limitation, some time was set aside at the beginning of the MSF for preparation for the treatment village representatives.
8.4 Exposure to only one MSF
It is MYJ’s experience that village action usually occurs after more than one MSF. Having only one MSF limited community action, facilitator mentoring, multidirectional accountability and community uptake of information.
8.5 Exclusion of sub-county and district leaders in the MSF
Management of potential spillover effects necessitated the exclusion of local government leadership from the treatment. This resulted in a lost opportunity for village representatives to interact with their sub-county and district leaders to foster joint action and clarify attribution of responsibility.
9. Conclusion
9.1 Summary of quantitative findings
In our theory of change, providing opportunities for stakeholder engagement in addition to information provision in the control villages should contribute to the development of transparency. We understand transparency as not only access to information (our control treatment), but also as a culture that fosters the sharing and pursuit of information.
Our DID estimates above show that the MSF treatment increased respondents’ inclination to independently pursue information about oil development, caused respondents to be more trusting that key decision makers would share information with the public and encouraged respondents to see key decision makers as more

52
transparent. Although we did not see significant treatment effects on all related outcome measures,16 we take our findings as general evidence that stakeholder engagement does help foster transparency.
Our theory of change further holds that these increases in transparency leave communities better able to use civic activities to address their oil development concerns and demand accountability from oil-sector decision makers. We find evidence that this is the case. There are increases in reported civic activities at the household and community levels in treatment villages between the baseline and endline. The biggest change appears to be increases in the numbers of meetings with village leaders and other meetings related to oil sector and social service provision issues.
Those increases in civic activity also appear to coincide with increased satisfaction with the handling of issues respondents feel are important. This implies that treatment respondents are not only more likely to attempt to demand accountability, but also (on average) are more likely to feel their demands are being heard. Unfortunately, these increases in transparency and demands for accountability do not, so far, appear to have translated into meaningful change in policy outcomes.
Measures of change in land management, social service provision and local economic development do not appear to be significantly different in treatment and control villages in the endline survey.17 However, given the short period between the baseline and endline surveys, the lack of a significant effect is not very surprising. It could take many months or even a few years of mounting pressure for accountability demands to transform into tangible policy changes. It would be illuminating to observe future developments in treatment and control villages over time in regard to land tenure issues and the provision of various public services.
Additionally, contrary to our prediction, respondents in treatment villages do not appear to concentrate their allocations of blame and credit across different important decision makers as a result of the MSFs.18
In sum, the type of stakeholder engagement employed in our study does appear to increase a culture of transparency, encourage more demands for accountability and lead to increased satisfaction with the policy outcomes an individual cares most about. We cannot provide evidence of tangible policy changes in response to the increased accountability demands of treatment villages between the intervention and the endline survey, but it is possible that such changes could still accumulate over time.
16 There were insignificant effects on a measure of actual oil sector knowledge, respondents’ perceptions of their own awareness and self-reported feelings of confidence in their ability to obtain information. 17 An exception is statistically significant increases in reported access to markets. It is important to be cautious when interpreting this finding, given the insignificance of the other outcome measures. 18 When conducting MSFs unrelated to this study, MYJ notes that sub-county and district government figures tend to receive the most blame. These officials did not participate in the study MSFs, so it is unclear how this outcome would have changed in their presence.

53
9.2 Qualitative findings and other important takeaways
The qualitative portion of our study followed up on four impact areas: land, satisfaction with different issue areas, allocation of blame and attribution of credit to different oil sector stakeholders, and gender differences.
9.2.1 Land Ugandans in our study areas are deeply committed to their land. This commitment extends beyond any practical considerations and is a core part of their identity. Any arrangements about land must consider the fact that land means a great deal more than its market value to residents in the Albertine Graben.
The importance of land does not change, regardless of the influences of oil or refugee presence, both of which are perceived to increase economic development opportunities. Although economic development and social services are important, land is consistently more important and links families inter-generationally.
9.2.2 Satisfaction When respondents reported being most satisfied with land, this was typically tied to their perceptions of secure land tenure.
Satisfaction with social service provision was typically based on respondents’ perceptions of their access to healthcare and education services. Near refugee areas, social services set up for refugees were cited as being accessible to study communities. Refugees’ presence also enhanced economic development opportunities and access to goods.
Respondents who were satisfied with economic development were primarily concerned with access to jobs and sources of income. However, land was the highest-priority issue for most respondents.
9.2.3 Blame and credit Most endline respondents indicated in the qualitative data that they were allocating blame due to perceived neglect, whereas in the baseline, blame was typically attributed to benefit gaps and perceptions of corruption. However, this difference may be largely the result of qualitative coding changes between baseline and endline. Substantively, many allegations of neglect in the endline data focus on unfair distribution of resources and a lack of responsiveness to local concerns.
In both baseline and endline surveys, most credit was attributed to different actors because of respondent perceptions of good leadership.
9.2.4 Gender differences Men and women responded similarly to the MSFs on most of the quantitative and qualitative outcome measures above. This could mean the MSFs do not have a significantly different effect on transparency and accountability when comparing men and women in this context. We believe, based on initial monitoring reports of participation, that MYJ’s insistence on female representation and the presence of many women in the MSFs enables women’s input and inclusion in priority setting and planning. Whether these results can be sustained will require follow-up at a later point.

54
Notably, this does not imply that gender inequalities were absent in the study areas. Such inequalities – especially their impacts on men’s and women’s relative ability to demand accountability in regard to their differing political interests – are indeed worth exploring in future research. It could also be that a more gendered design would find significantly different treatment effects by gender. A more comprehensive gender analysis requires addressing practical and strategic gender needs and interests, and exploring the gender division of labour and intra-household decision-making. This is difficult to accomplish in an RCT in which the unit of analysis is the household.
9.3 Unanswered questions
Methodological issues and questions about how to best combine qualitative data with an RCT are worth pursuing more thoroughly in the future. A design that incorporates gender analysis in an RCT framework would be challenging, but relevant and worthwhile in the context of a different study question.
9.4 Next steps
We identify some key next steps to improve the relevance of future evaluations as well as recommendations to assess the longer-term impacts of these interventions.
• A more gendered study that prioritises gender, rather than the RCT model, in its design, whilst still being rigorous, to determine whether there really is gender equality in civic participation in the Albertine Graben;
• More comprehensive and complete analysis of the qualitative data; • Fundraising for additional treatments and endline surveys to assess the impacts
of the MSFs over time; and • Funding to enable MYJ to continue the MSFs, at least until they can be properly
evaluated. Their potential impact is significant but will never be known without a proper endline and a long-term view, with the right timing. Much of DFID and the Hewlett Foundation’s significant investment in the current project will be wasted if we do not follow up with a proper endline at the right time.
We are excited and motivated by the strong results, given this very short timeline between the treatment and endline. We strongly recommend another survey after at least one year, a more realistic timeline, when we can expect to see the results of this initiative.
Business-Community Synergies, which envisioned this project (largely based on MYJ’s interest in truly learning about the impact of their work and subjecting the work to external scrutiny), and our quantitative specialists at Florida State University are interested in exploring whether the significant results we have seen in such a short period can be sustained, and what additional impacts we will see. Our expectation is that the changes occurring from MYJ’s MSFs are significant and worth documenting for their international potential and for policy challenges within Uganda.
We believe some of the early compromises we made on time enriched the study substantially and built the capacities of all three principal investigators (and our teams) to carry out mixed-methods research projects in the future. However, additional delays caused by circumstances beyond our control (reduction in oil prices, changes in operating companies and national elections) imposed further time challenges.
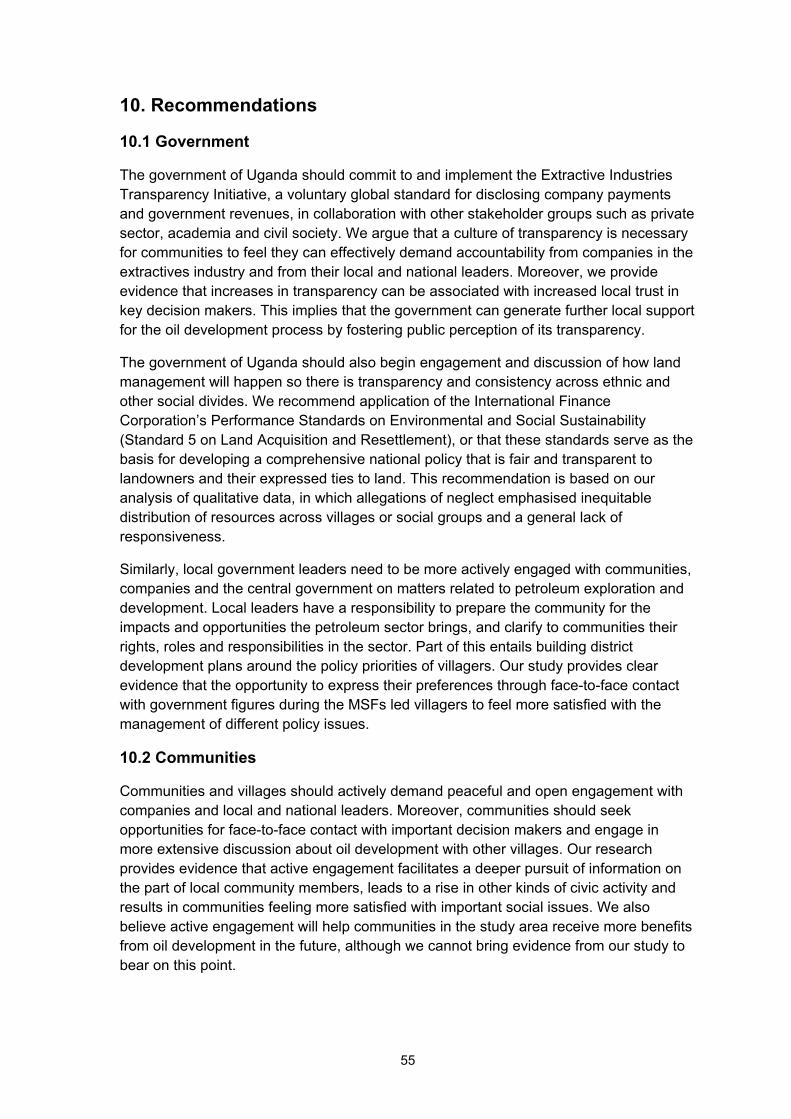
55
10. Recommendations
10.1 Government
The government of Uganda should commit to and implement the Extractive Industries Transparency Initiative, a voluntary global standard for disclosing company payments and government revenues, in collaboration with other stakeholder groups such as private sector, academia and civil society. We argue that a culture of transparency is necessary for communities to feel they can effectively demand accountability from companies in the extractives industry and from their local and national leaders. Moreover, we provide evidence that increases in transparency can be associated with increased local trust in key decision makers. This implies that the government can generate further local support for the oil development process by fostering public perception of its transparency.
The government of Uganda should also begin engagement and discussion of how land management will happen so there is transparency and consistency across ethnic and other social divides. We recommend application of the International Finance Corporation’s Performance Standards on Environmental and Social Sustainability (Standard 5 on Land Acquisition and Resettlement), or that these standards serve as the basis for developing a comprehensive national policy that is fair and transparent to landowners and their expressed ties to land. This recommendation is based on our analysis of qualitative data, in which allegations of neglect emphasised inequitable distribution of resources across villages or social groups and a general lack of responsiveness.
Similarly, local government leaders need to be more actively engaged with communities, companies and the central government on matters related to petroleum exploration and development. Local leaders have a responsibility to prepare the community for the impacts and opportunities the petroleum sector brings, and clarify to communities their rights, roles and responsibilities in the sector. Part of this entails building district development plans around the policy priorities of villagers. Our study provides clear evidence that the opportunity to express their preferences through face-to-face contact with government figures during the MSFs led villagers to feel more satisfied with the management of different policy issues.
10.2 Communities
Communities and villages should actively demand peaceful and open engagement with companies and local and national leaders. Moreover, communities should seek opportunities for face-to-face contact with important decision makers and engage in more extensive discussion about oil development with other villages. Our research provides evidence that active engagement facilitates a deeper pursuit of information on the part of local community members, leads to a rise in other kinds of civic activity and results in communities feeling more satisfied with important social issues. We also believe active engagement will help communities in the study area receive more benefits from oil development in the future, although we cannot bring evidence from our study to bear on this point.

56
10.3 Companies
Often, substantive engagement between companies and communities does not begin until the extractive industries projects cycle is well underway. Uganda is in a different situation, where engagement and education efforts began early on. All the same, data generated by our study and the experiences of MYJ provide reason to believe these efforts may not have been sufficient; available information about oil development is low in some villages, and fears of land theft persist in some cases.
Companies should engage with communities before commencing exploration activities in order to better understand community needs and expectations. Companies need to develop strategies in cooperation with government and civil society on early stakeholder engagement processes in order to lay the foundations for mutual respect and trust (Eftimie et al. 2013). Our study provides evidence that stakeholder engagement has that exact result. This point is particularly important in the Albertine Graben, where communities across the region are experiencing various stages of the project cycle. Communities inevitably interact with each other, and resentment can build if local engagement exists but is uneven across the region.
10.4 Non-governmental organisations, CSOs and other organisations
Our data suggest that the primary concerns of most respondents in the study area are land (for its connection to their cultural identity and utilitarian value), sources of jobs and income, and the provision of better education and healthcare services. When respondents expressed resentment for various actors in the endline survey, this was often tied to accusations of neglect: respondents assigned blame to decision makers they felt had distributed benefits and public services unevenly and had not fulfilled their commitments to communities. Organisations wishing to support communities in the study area as they demand accountability during the oil development process should bear in mind that these are the most salient issues and challenges communities hope to confront.
Non-governmental organisations, civil society groups and other organisations should use this research to carry out evidence-based stakeholder engagement interventions that help communities manage their expectations, reduce the risks and enhance the benefits of development projects, and clarify attributions of responsibility amongst members of the public. Our research provides evidence that such strategies support a community’s ability to demand accountability and a better representation of their interests in development projects.
Organisations that fall into this category are the actors that should support the sustainability of stakeholder engagement initiatives. Civil society groups and other kinds of public interest organisations – such as MYJ – are a natural choice to organise face-to-face discussion and action planning amongst local citizens, government officials and companies, all of whom have different, and at times competing, interests in the outcome of extractive development projects. CSOs that have no predetermined agenda or priority are best positioned to facilitate such forums to ensure there is no bias on the part of the facilitator about which priorities the communities pursue.

57
10.5 Researchers and donors
Our findings suggest that more research attention needs to be devoted to linking demands for accountability to changes in public spending and public services over different time frames. Additionally, the diverse pattern of significance we see across our many measures of a culture of transparency indicates that the very concept merits more careful analysis. Many researchers oversimplify as a simple transmission of information what is really a complex concept with many moving parts.
Additionally, researchers need to consider the real-world risks to implementing agencies when they agree to participate in such studies. Researchers should share methodology, methods, data, types of analysis and other capacities, so the field team and study participants can understand what is being studied and why, what the results are and what they mean. There are time and cost implications associated with this.
Researchers and donors should recognise that the bulk of time required for analysis of qualitative data is after the data are collected. The opposite is true for the quantitative data. Coding of qualitative data is time consuming and cannot be reliably computerised. For example, each qualitative question in this study required that 3,200 responses be coded manually.
Finally, donors should consider expanding their categories of funding to incorporate innovations like the MSFs. They should build in funding support for baseline surveys and data collection for ease of monitoring and evaluation. Donors need flexibility when a study like this one occurs in the context of unforeseeable factors that could have an impact on the study.

58
Online appendixes
Online appendix A: Information packet
http://www.3ieimpact.org/sites/default/files/2019-04/tw8.1015-Online-appendix-a-Information-Packet.pdf
Online appendix B: Coding of qualitative data
http://www.3ieimpact.org/sites/default/files/2019-04/tw8.1015-Online-appendix-b-Coding-Qualitative-Data.pdf
Online appendix C: Map of sampled communities
http://www.3ieimpact.org/sites/default/files/2019-04/tw8.1015-Online-appendix-c-Map-sampled-communities.pdf
Online appendix D: Endline household survey
http://www.3ieimpact.org/sites/default/files/2019-04/tw8.1015-Online-appendix-d-Endline-household-survey_0.pdf
Online appendix E: Balance figures from baseline
http://www.3ieimpact.org/sites/default/files/2019-04/tw8.1015-Online-appendix-e-Balance-figures-baseline_0.pdf
Online appendix F: Descriptive figures
http://www.3ieimpact.org/sites/default/files/2019-04/tw8.1015-Online-appendix-f-Descriptive-figures_0.pdf
Online appendix G: Tables of robustness checks
http://www.3ieimpact.org/sites/default/files/2019-04/tw8.1015-Online-appendix-g-Tables-robustness-checks_0.pdf
Online appendix H: Treatment effects by gender
http://www.3ieimpact.org/sites/default/files/2019-04/tw8.1015-Online-appendix-h-Treatment-effects-gender.pdf

59
References
Ansell, C and Gash, A, 2008. Collaborative governance in theory and practice. Journal of Public Administration Research and Theory, 18(4), pp.543–71.
Arezki, R and Brückner, M, 2011. Oil rents, corruption, and state stability: evidence from panel data regressions. European Economic Review, 55(7), pp.955–63.
Balla, SJ and Gormley Jr, WT, 2017. Bureaucracy and democracy: Accountability and performance. Washington, DC: CQ Press.
Berry, H, Guillén, MF and Zhou, N, 2010. An institutional approach to cross-national distance. Journal of International Business Studies, 41(9), 1,460-80.
Bivand, RS, Pebesma, EJ and Gómez-Rubio, V, 2008. Applied spatial data analysis with R. New York: Springer.
Carlson, E, 2015. Ethnic voting and accountability in Africa: a choice experiment in Uganda. World Politics, 67(2), pp.353–85.
Donahue, J, 2004. On collaborative governance. Cambridge: John F. Kennedy School of Government, Harvard University.
Eftimie, A, Darling, R, Pollett, T and Taval, P, 2013. A strategic approach to early stakeholder engagement: good practice handbook for junior companies in the extractive industries. Washington, DC: International Finance Corporation. Available at: <https://commdev.org/wp-content/uploads/2015/06/A-Strategic-Approach-to-Early-Stakeholder-Engagement.pdf> [Accessed 26 March 2019].
Franks, DM, Davis, R, Bebbington, AJ, Ali, SH, Kemp, D and Scurrah, M, 2014. Conflict translates environmental and social risk into business costs. Proceedings of the National Academy of Sciences, 111(21), pp.7,576–81.
Frey, BS and Meier, S, 2004. Social comparisons and pro-social behavior: testing ‘conditional cooperation’ in a field experiment. The American Economic Review, 94(5), pp.1,717–22.
Gerber, AS and Green, DP, 2012. Field experiments: design, analysis, and interpretation. New York: WW Norton & Company, Inc.
Gomez, BT and Wilson, JM, 2006. Cognitive heterogeneity and economic voting: a comparative analysis of four democratic electorates. American Journal of Political Science, 50(1), pp.127–45.
Henisz, WJ, Dorobantu, S and Nartey, LJ, 2014. Spinning gold: The financial returns to stakeholder engagement. Strategic Management Journal, 35(12), pp.1,727–48.
International Finance Corporation (IFC), 2007. Stakeholder engagement: a good practice handbook for companies doing business in emerging markets. Washington, DC: IFC. Available at: <http://www.ifc.org/wps/wcm/connect/topics_ext_content/ifc_external_corporate_site/sustainability-at-

60
ifc/publications/publications_handbook_stakeholderengagement__wci__1319577185063> [Accessed 26 March 2019].
Jamali, D and Karam, C, 2016. Corporate social responsibility in developing countries as an emerging field of study. International Journal of Management Reviews, 20(1), pp.32-61.
Kifana, BD and Abdurohman, M, 2012. Great circle distance method for improving operational control system based on GPS tracking system. International Journal on Computer Science and Engineering, 4(4), p.647.
Kolstad, I and Søreide, T, 2009. Corruption in natural resource management: implications for policy makers. Resources Policy, 34(4), pp.214–26.
Kolstad, I and Wiig, A, 2009. Is transparency the key to reducing corruption in resource-rich countries? World Development, 37(3), pp.521–32.
Kwoka Jr, JE, 1985. The Herfindahl index in theory and practice. Antitrust Bulletin, 30, p.915.
Lubell, M, 2004a. Collaborative environmental institutions: all talk and no action? Journal of Policy Analysis and Management, 23(3), pp.549–73.
Lubell, M, 2004b. Resolving conflict and building cooperation in the National Estuary Program. Environmental Management, 33(5), pp.677–91.
Manyindo, J, Van Alstine, J, AmanigaRuhanga, I, Mukuru, E, Smith, L, Nantongo, C and Dyer, J, 2014. The Governance of Hydrocarbons in Uganda: Creating Opportunities for Multi-Stakeholder Engagement. Maendeleo ya Jamii, Kampala, Uganda. Available at: <http://eprints.whiterose.ac.uk/81272/1/Uganda%20Report_2014.pdf> [Accessed 26 March 2019].
Mewhirter, J, Coleman, EA and Berardo, R, 2017. Participation and political influence in complex governance systems. Policy Studies Journal, 0(0), pp.1–24.
Ministry of Energy and Mineral Development. (2016) Politics and legal framework in extractive industries to ensure sustainable growth: Uganda’s experience in oil and gas. Kampala, Uganda. [PowerPoint presentation]. Available at: <http://www.wgei.org/wp-content/uploads/2016/08/Presentation-2-Policies-and-Legal-Framework-in-EI-Ernest_Uganda.pdf> [Accessed 26 March 2019].
Ministry of Energy and Mineral Development, 2017. Progress of Implementation of the National Oil and Gas Policy for Uganda. Kampala, Uganda. Available at: <http://petroleum.go.ug/uploads/resources/Status_of_Policy_2017_dl.pdf> [Accessed 26 March 2019].
Nastro, V and Tancredi, U, 2010. Great circle navigation with vectorial methods. The Journal of Navigation, 63(3), pp.557–63.
Ostrom, E, 2015. Governing the commons. Cambridge: Cambridge University Press.

61
Ostrom, E, Gardner, R and Walker, J, 1994. Rules, games, and common-pool resources. Ann Arbor: University of Michigan Press.
Przeworski, A, Stokes, SC and Manin, B eds., 1999. Democracy, accountability, and representation (Vol. 2). Cambridge: Cambridge University Press.
Rhoades, SA, 1993. The Herfindahl-Hirschman Index. Federal Reserve Bulletin, 79, p.188.
Robinson, C, 2017. South Sudanese refugees in Uganda now exceed 1 million, United Nations Refugee Agency (UNHCR). Available at: <http://www.unhcr.org/en-us/news/stories/2017/8/59915f604/south-sudanese-refugees-uganda-exceed-1-million.html> [Accessed 26 March 2019].
World Bank, 2015. Uganda country economic memorandum: economic diversification and growth in an era of oil and volatility, Kampala, Uganda: World Bank. Available at: <https://openknowledge.worldbank.org/handle/10986/24789> [Accessed 26 March 2019].

62
Other publications in the 3ie Impact Evaluation Report Series
The following reports are available from http://3ieimpact.org/evidence-hub/publications/impact-evaluations
The impacts of formal registration of businesses in Malawi, 3ie Impact Evaluation Report 96. Campos, F, Goldstein, M and McKenzie, D, 2019.
Unpacking the determinants of entrepreneurship development and economic empowerment for women in Kenya, 3ie Impact Evaluation Report 95. McKenzie, D, Puerto, S and Odhiambo, F, 2019.
Impacts of key provisions in Ghana’s Petroleum Revenue Management Act, 3ie Impact Evaluation Report 94. Edjekumhene, I, Voors, M, Lujala, P, Brunnschweiler, C, Owusu, CK and Nyamekye, A, 2019.
Using information to break the political resource curse in natural gas management in Mozambique, 3ie Impact Evaluation Report 93. Armand, A, Costa, AI, Coutts, A, Vicente, P and Vilela, I, 2019.
Harnessing transparency initiatives to improve India's environmental clearance process for the mineral mining sector, 3ie Impact Evaluation Report 92. Pande, R and Sudarshan, A, 2019.
Impacts of removing user fees for maternal health services on universal health coverage in Kenya, 3ie Impact Evaluation Report 91. Abuya, T, Dennis, M, Matanda, D, Obare, F and Bellows, B, 2018.
Impact of voice reminders to reinforce harvest aggregation services training for farmers in Mali, 3ie Impact Evaluation Report 90. Osei, RD, Dzanku, FM, Osei-Akoto, I, Asante, F, Hodey, LS, Adu, PN, Adu-Ababio, K and Coulibaly, M, 2018.
Impacts of Breakthrough’s school-based gender attitude change programme in Haryana, India, 3ie Impact Evaluation Report 89. Jayachandran, S, Jain, T and Dhar, D, 2018.
Hotspot interventions at scale: the effects of policing and city services on crime in Bogotá, Colombia, 3ie Impact Evaluation Report 88. Blattman, C, Green, D, Ortega, D and Tobón, S, 2018.
Impact evaluation of the Philippine Special Program for Employment of Students, 3ie Impact Evaluation Report 87. Beam, E, Linden, L, Quimbo, S and Richmond, H, 2018.
Community-based distribution of oral HIV self-testing kits: experimental evidence from Zambia, 3ie Impact Evaluation Report 86. Hensen, B, Ayles, H, Mulubwa, C, Floyd, S, Schaap, A, Chiti, B, Phiri, M, Mwenge, L, Simwinga, M, Fidler S, Hayes, R, Bond, V and Mwinga, A, 2018.
Evaluating the economic impacts of rural banking: experimental evidence from southern India, 3ie Impact Evaluation Report 85. Field, E and Pande, R, 2018.

63
Direct provision versus facility collection of HIV tests: impacts of self-testing among female sex workers in Uganda. 3ie Impact Evaluation Report 84. Ortblad, K, Musoke, DK, Ngabirano, T, Oldenburg, C and Bärnighausen, T, 2018.
Increasing female sex worker HIV testing: effects of peer educators and HIV self-tests in Zambia, 3ie Impact Evaluation Report 83. Chanda, MM, Ortblad, KF, Mwale, M, Chongo, S, Kanchele, C, Kamungoma, N, Fullem, A, Bärnighausen, T and Oldenburg, CE, 2018.
Community delivery of antiretroviral drugs: a non-inferiority matched-pair pragmatic cluster-randomized trial in Dar es Salaam, Tanzania, 3ie Impact Evaluation Report 82. Francis, JM, Geldsetzer, P, Asmus, G, Ulenga, N, Ambikapathi, R, Sando, D, Fawzi, W and Bärnighausen, T, 2018.
Nourishing the future: targeting infants and their caregivers to reduce undernutrition in rural China, 3ie Impact Evaluation Report 81. Cai, J, Luo, R, Li, H, Lien, J, Medina, A, Zhou, H and Zhang, L, 2018.
Impacts of the World Food Programme’s interventions to treat malnutrition in Niger. 3ie Impact Evaluation Report 80. Brück, T, Ferguson, NTN, Ouédraogo, J and Ziegelhöfer, Z, 2018.
Impact evaluation of the World Food Programme’s moderate acute malnutrition treatment and prevention programmes in Sudan. 3ie Impact Evaluation Report 79. Guevarra, E, Mandalazi, E, Balegamire, S, Albrektsen, K, Sadler, K, Abdelsalam, K, Urrea, G and Alawad, S, 2018.
Impact evaluation of WFP’s programs targeting moderate acute malnutrition in humanitarian situations in Chad. 3ie Impact Evaluation Report 78. Saboya, M, Rudiger, J, Frize, J, Ruegenberg, D, Rodríguez Seco, A and McMillon, C, 2018.
Improving midday meal delivery and encouraging micronutrient fortification among children in India, 3ie Impact Evaluation Report 77. Shastry, GK, Berry, J, Mukherjee, P, Mehta, S and Ruebeck, H, 2018.
Evaluation of infant development centres: an early years intervention in Colombia, 3ie Impact Evaluation Report 76. Andrew, A, Attanasio, O, Bernal, R, Cordona, L, Krutikova, S, Heredia, DM, Medina, C, Peña, X, Rubio-Codina, M and Vera-Hernandez, M, 2018.
Can the wounds of war be healed? Experimental evidence on reconciliation in Sierra Leone. 3ie Impact Evaluation Report 75. Cilliers, J, Dube, O and Siddiqi, B, 2018.
Impact evaluation of the Menabe and Melaky development programme in Madagascar, 3ie Impact Evaluation Report 74. Ring, H, Morey, M, Kavanagh, E, Kamto, K, McCarthy, N, Brubaker, J and Rakotondrafara, C, 2018.
Impact evaluation of the Smallholder Dairy Commercialization Programme in Kenya, 3ie Impact Evaluation Report 73. Bonilla, J, McCarthy, N, Mugatha, S, Rai, N, Coombes, A and Brubaker, J, 2018.

64
Impact and adoption of risk-reducing drought-tolerant rice in India, 3ie Impact Evaluation Report 72. Yamano, T, Dar, MH, Panda, A, Gupta, I, Malabayabas, ML and Kelly, E, 2018.
Poverty and empowerment impacts of the Bihar Rural Livelihoods Project in India, 3ie Impact Evaluation Report 71. Hoffmann, V, Rao, V, Datta, U, Sanyal, P, Surendra, V and Majumdar, S 2018.
How should Tanzania use its natural gas? Citizens’ views from a nationwide Deliberative Poll, 3ie Impact Evaluation Report 70. Birdsall, N, Fishkin, J, Haqqi, F, Kinyondo, A, Moyo, M, Richmond, J and Sandefur, J, 2018.
Impact evaluation of the conditional cash transfer program for secondary school attendance in Macedonia, 3ie Impact Evaluation Report 69. Armand, A and Carneiro, P, 2018.
Age at marriage, women’s education, and mother and child outcomes in Bangladesh, 3ie Impact Evaluation Report 68. Field, E, Glennerster, R, Nazneen, S, Pimkina, S, Sen, I and Buchmann, N, 2018.
Evaluating agricultural information dissemination in western Kenya, 3ie Impact Evaluation Report 67. Fabregas, R, Kremer, M, Robinson, J and Schilbach, F, 2017.
General equilibrium impact assessment of the Productive Safety Net Program in Ethiopia, 3ie Impact Evaluation Report 66. Filipski, M, Taylor, JE, Abegaz, GA, Ferede, T, Taffesse, AS and Diao, X, 2017.
Impact of the Uddeepan programme on child health and nutrition in India, 3ie Impact Evaluation Report 65. Kochar, A, Sharma, A and Sharma, A, 2017.
Evaluating oral HIV self-testing to increase HIV testing uptake among truck drivers in Kenya, 3ie Impact Evaluation Report 64. Kelvin, EA, Mwai, E, Romo, ML, George, G, Govender, K, Mantell, JE, Strauss, M, Nyaga, EN and Odhiambo, JO, 2017.
Integration of EPI and paediatric HIV services for improved ART initiation in Zimbabwe, 3ie Impact Evaluation Report 63. Prescott, M, Boeke, C, Gotora, T, Mafaune, HW, Motsi, W, Graves, J, Mangwiro, A and McCarthy, E, 2017.
Increasing male partner HIV testing using self-test kits in Kenya, 3ie Impact Evaluation Report 62. Gichangi, A, Korte, JE, Wambua, J, Vrana, C and Stevens, D, 2017.
Evaluating the impact of community health worker integration into prevention of mother-to-child transmission of HIV services in Tanzania, 3ie Impact Evaluation Report 61. Nance, N, McCoy, S, Ngilangwa, D, Masanja, J, Njau, P and Noronha, R, 2017.
Using HIV self-testing to promote male partner and couples testing in Kenya, 3ie Impact Evaluation Report 60. Thirumurthy, H, Omanga, E, Obonyo, B, Masters, S and Agot, K, 2017.
Increasing male partner HIV self-testing at antenatal care clinics in Kenya, 3ie Impact Evaluation Report 59. Gichangi, A, Korte, JE, Wambua, J, Vrana, C and Stevens, D, 2017.

65
Impact of free availability of public childcare on labour supply and child development in Brazil, 3ie Impact Evaluation Report 58. Attanasio, O, Paes de Barros, R, Carneiro, P, Evans, D, Lima, L, Olinto, P and Schady, N, 2017.
Estimating the effects of a low-cost early stimulation and parenting education programme in Mexico, 3ie Impact Evaluation Report 57. Cardenas, S, Evans, D and Holland, P, 2017.
The Better Obstetrics in Rural Nigeria study: an impact evaluation of the Nigerian Midwives Service Scheme, 3ie Impact Evaluation Report 56. Okeke, E, Glick, P, Abubakar, IS, Chari, AV, Pitchforth, E, Exley, J, Bashir, U, Setodji, C, Gu, K and Onwujekwe, O, 2017.
The Productive Safety Net Programme in Ethiopia: impacts on children’s schooling, labour and nutritional status, 3ie Impact Evaluation Report 55. Berhane, G, Hoddinott, J, Kumar, N and Margolies, A, 2016.
The impact of youth skills training on the financial behaviour, employability and educational choice in Morocco, 3ie Impact Evaluation Report 54. Bausch, J, Dyer, P, Gardiner, D, Kluve, J and Mizrokhi, E, 2016.
Using advertisements to create demand for voluntary medical male circumcision in South Africa, 3ie Impact Evaluation Report 53. Frade, S, Friedman, W, Rech, D and Wilson, N, 2016.
The use of peer referral incentives to increase demand for voluntary medical male circumcision in Zambia, 3ie Impact Evaluation Report 52. Zanolini, A, Bolton, C, Lyabola, LL, Phiri, G, Samona, A, Kaonga, A and Harsha Thirumurthy, H, 2016.
Using smartphone raffles to increase demand for voluntary medical male circumcision in Tanzania, 3ie Impact Evaluation Report 51. Mahler, H and Bazant, E, 2016.
Voluntary medical male circumcision uptake through soccer in Zimbabwe, 3ie Impact Evaluation Report 50. DeCelles, J, Kaufman, Z, Bhauti, K, Hershow, R, Weiss, H, Chaibva, C, Moyo, N, Braunschweig, E, Mantula, F, Hatzold, K and Ross, D, 2016.
Measuring the impact of SMS-based interventions on uptake of voluntary medical male circumcision in Zambia, 3ie Impact Evaluation Report 49. Leiby, K, Connor, A, Tsague, L, Sapele, C, Koanga, A, Kakaire, J and Wang, P, 2016.
Assessing the impact of delivering messages through intimate partners to create demand for voluntary medical male circumcision in Uganda, 3ie Impact Evaluation Report 48. Semeere, AS, Bbaale, DS, Castelnuovo, B, Kiragga, A, Kigozi, J, Muganzi, A, Kambugu, A and Coutinho, AG, 2016.
Optimising the use of economic interventions to increase demand for voluntary medical male circumcision in Kenya, 3ie Impact Evaluation Report 47. Thirumurthy, H, Omanga, E, Rao, SO, Murray, K, Masters, S and Agot, K, 2016.

66
The impact of earned and windfall cash transfers on livelihoods and conservation in Sierra Leone, 3ie Impact Evaluation Report 46. Bulte, E, Conteh, B, Kontoleon, A, List, J, Mokuwa, E, Richards, P, Turley, T and Voors, M, 2016.
Property tax experiment in Pakistan: Incentivising tax collection and improving performance, 3ie Impact Evaluation Report 45. Khan, A, Khwaja, A and Olken, B, 2016.
Impact of mobile message reminders on tuberculosis treatment outcomes in Pakistan, 3ie Impact Evaluation Report 44. Mohammed, S, Glennerster, R and Khan, A, 2016.
Making networks work for policy: Evidence from agricultural technology adoption in Malawi, 3ie Impact Evaluation Report 43. Beaman, L, BenYishay, A, Fatch, P, Magruder, J and Mobarak, AM, 2016.
Estimating the impact and cost-effectiveness of expanding access to secondary education in Ghana, 3ie Impact Evaluation Report 42. Dupas, P, Duflo, E and Kremer, M, 2016.
Evaluating the effectiveness of computers as tutors in China, 3ie Impact Evaluation Report 41. Mo, D, Bai, Y, Boswell, M and Rozelle, S, 2016.
Micro entrepreneurship support programme in Chile, 3ie Impact Evaluation Report 40. Martínez, CA, Puentes, EE and Ruiz-Tagle, JV, 2016.
Thirty-five years later: evaluating the impacts of a child health and family planning programme in Bangladesh, 3ie Impact Evaluation Report 39. Barham, T, Kuhn, R, Menken, J and Razzaque, A, 2016.
Effectiveness of a rural sanitation programme on diarrhoea, soil-transmitted helminth infection and malnutrition in India, 3ie Impact Evaluation Report 38. Clasen, T, Boisson, S, Routray, P, Torondel, B, Bell, M, Cumming, O, Ensink, J, Freeman, M and Jenkins, M, 2016.
Evaluating the impact of vocational education vouchers on out-of-school youth in Kenya, 3ie Impact Evaluation Report 37. Hicks, JH, Kremer, M, Mbiti, I and Miguel, E, 2016.
Removing barriers to higher education in Chile: evaluation of peer effects and scholarships for test preparation, 3ie Impact Evaluation Report 36. Banerjee, A, Duflo E and Gallego, F, 2016.
Sustainability of impact: dimensions of decline and persistence in adopting a biofortified crop in Uganda, 3ie Impact Evaluation Report 35. McNiven, S, Gilligan, DO and Hotz, C 2016.
A triple win? The impact of Tanzania’s Joint Forest Management programme on livelihoods, governance and forests, 3ie Impact Evaluation Report 34. Persha, L and Meshack, C, 2016.
The effect of conditional transfers on intimate partner violence: evidence from Northern Ecuador, 3ie Impact Evaluation Report 33. Hidrobo, M, Peterman, A and Heise, L, 2016.

67
The effect of transfers and preschool on children’s cognitive development in Uganda, 3ie Impact Evaluation Report 32. Gillian, DO and Roy, S, 2016.
Can egovernance reduce capture of public programmes? Experimental evidence from India’s employment guarantee, 3ie Impact Evaluation Report 31. Banerjee, A, Duflo, E, Imbert, C, Mathew, S and Pande, R, 2015.
Improving maternal and child health in India: evaluating demand and supply strategies, 3ie Impact Evaluation Report 30. Mohanan, M, Miller, G, Forgia, GL, Shekhar, S and Singh, K, 2016.
Smallholder access to weather securities in India: demand and impact on production decisions, 3ie Impact Evaluation Report 28. Ceballos, F, Manuel, I, Robles, M and Butler, A, 2015.
What happens once the intervention ends? The medium-term impacts of a cash transfer programme in Malawi, 3ie Impact Evaluation Report 27. Baird, S, Chirwa, E, McIntosh, C and Özler, B, 2015.
Validation of hearing screening procedures in Ecuadorian schools, 3ie Impact Evaluation Report 26. Muñoz, K, White, K, Callow-Heusser, C and Ortiz, E, 2015.
Assessing the impact of farmer field schools on fertilizer use in China, 3ie Impact Evaluation Report 25. Burger, N, Fu, M, Gu, K, Jia, X, Kumar, KB and Mingliang, G, 2015.
The SASA! study: a cluster randomised trial to assess the impact of a violence and HIV prevention programme in Kampala, Uganda, 3ie Impact Evaluation Report 24. Watts, C, Devries, K, Kiss, L, Abramsky, T, Kyegombe, N and Michau, L, 2014.
Enhancing food production and food security through improved inputs: an evaluation of Tanzania’s National Agricultural Input Voucher Scheme with a focus on gender impacts, 3ie Impact Evaluation Report 23. Gine, X, Patel, S, Cuellar-Martinez, C, McCoy, S and Lauren, R, 2015.
A wide angle view of learning: evaluation of the CCE and LEP programmes in Haryana, 3ie Impact Evaluation Report 22. Duflo, E, Berry, J, Mukerji, S and Shotland, M, 2015.
Shelter from the storm: upgrading housing infrastructure in Latin American slums, 3ie Impact Evaluation Report 21. Galiani, S, Gertler, P, Cooper, R, Martinez, S, Ross, A and Undurraga, R, 2015.
Environmental and socioeconomic impacts of Mexico’s payments for ecosystem services programme, 3ie Impact Evaluation Report 20. Alix-Garcia, J, Aronson, G, Radeloff, V, Ramirez-Reyes, C, Shapiro, E, Sims, K and Yañez-Pagans, P, 2015.
A randomised evaluation of the effects of an agricultural insurance programme on rural households’ behaviour: evidence from China, 3ie Impact Evaluation Report 19. Cai, J, de Janvry, A and Sadoulet, E, 2014.

68
Impact of malaria control and enhanced literacy instruction on educational outcomes among school children in Kenya: a multi-sectoral, prospective, randomised evaluation, 3ie Impact Evaluation Report 18. Brooker, S and Halliday, K, 2015.
Assessing long-term impacts of conditional cash transfers on children and young adults in rural Nicaragua, 3ie Impact Evaluation Report 17. Barham, T, Macours, K, Maluccio, JA, Regalia, F, Aguilera, V and Moncada, ME, 2014.
The impact of mother literacy and participation programmes on child learning: evidence from a randomised evaluation in India, 3ie Impact Evaluation Report 16. Banerji, R, Berry, J and Shortland, M, 2014.
A youth wage subsidy experiment for South Africa, 3ie Impact Evaluation Report 15. Levinsohn, J, Rankin, N, Roberts, G and Schöer, V, 2014.
Providing collateral and improving product market access for smallholder farmers: a randomised evaluation of inventory credit in Sierra Leone, 3ie Impact Evaluation Report 14. Casaburi, L, Glennerster, R, Suri, T and Kamara, S, 2014.
Scaling up male circumcision service provision: results from a randomised evaluation in Malawi, 3ie Impact Evaluation Report 13. Thornton, R, Chinkhumba, J, Godlonton, S and Pierotti, R, 2014.
Targeting the poor: evidence from a field experiment in Indonesia, 3ie Impact Evaluation Report 12. Atlas, V, Banerjee, A, Hanna, R, Olken, B, Wai-poi, M and Purnamasari, R, 2014.
An impact evaluation of information disclosure on elected representatives’ performance: evidence from rural and urban India, 3ie Impact Evaluation Report 11. Banerjee, A, Duflo, E, Imbert, C, Pande, R, Walton, M and Mahapatra, B, 2014.
Truth-telling by third-party audits and the response of polluting firms: Experimental evidence from India, 3ie Impact Evaluation Report 10. Duflo, E, Greenstone, M, Pande, R and Ryan, N, 2013.
No margin, no mission? Evaluating the role of incentives in the distribution of public goods in Zambia, 3ie Impact Evaluation Report 9. Ashraf, N, Bandiera, O and Jack, K, 2013.
Paying for performance in China’s battle against anaemia, 3ie Impact Evaluation Report 8. Zhang, L, Rozelle, S and Shi, Y, 2013.
Social and economic impacts of Tuungane: final report on the effects of a community-driven reconstruction programme in the Democratic Republic of Congo, 3ie Impact Evaluation Report 7. Humphreys, M, Sanchez de la Sierra, R and van der Windt, P, 2013.
The impact of daycare on maternal labour supply and child development in Mexico, 3ie Impact Evaluation Report 6. Angeles, G, Gadsden, P, Galiani, S, Gertler, P, Herrera, A, Kariger, P and Seira, E, 2014.

69
Impact evaluation of the non-contributory social pension programme 70 y más in Mexico, 3ie Impact Evaluation Report 5. Rodríguez, A, Espinoza, B, Tamayo, K, Pereda, P, Góngora, V, Tagliaferro, G and Solís, M, 2014.
Does marginal cost pricing of electricity affect groundwater pumping behaviour of farmers? Evidence from India, 3ie Impact Evaluation Report 4. Meenakshi, JV, Banerji, A, Mukherji, A and Gupta, A, 2013.
The GoBifo project evaluation report: Assessing the impacts of community-driven development in Sierra Leone, 3ie Impact Evaluation Report 3. Casey, K, Glennerster, R and Miguel, E, 2013.
A rapid assessment randomised-controlled trial of improved cookstoves in rural Ghana, 3ie Impact Evaluation Report 2. Burwen, J and Levine, DI, 2012.
The promise of preschool in Africa: A randomised impact evaluation of early childhood development in rural Mozambique, 3ie Impact Evaluation Report 1. Martinez, S, Naudeau, S and Pereira, V, 2012.

Are governments and corporations in the extractives sector more accountable when there is organised engagement with community stakeholders? Maendeleo ya Jamii, a civil society organisation, organised multistakeholder forums to provide information, facilitate discussion and address concerns amongst communities, government and corporate representatives in the oil development areas in western Uganda. Authors evaluated the forums’ effectiveness in improving accountability to communities affected by the extractives industry. People exposed to the forums experienced an overall increase in several measures of transparency, including reported pursuit of independent information about oil development. The forums did not have any significant impacts on land management, provision of social services or local economic development. Civic actions increased significantly at the household and community levels.
Impact Evaluation Series
International Initiative for Impact Evaluation 202-203, Rectangle One D-4, Saket District Centre New Delhi – 110017 India
[email protected] Tel: +91 11 4989 4444
www.3ieimpact.org