Embed Size (px)
Citation preview

Asia-Pacific Integrated Modelhttp://www-iam.nies.go.jp/aim/index.html
Impacts of Economic Development and Urbanization in South/Southeast ASIA
for Estimating Future GHGs Emissions- CH4 Emissions from Landfill -
0
Land Cover/Land Use Change SARI International Regional Science Meeting in South/Southeast Asia Chaing Mai, Thailand
17-19 July 2017
Tatsuya HANAOKA
Center for Social and Environmental SystemsNational Institute for Environmental Studies
Japan
MOEJ-S12: Promotion of climate policies by assessing environmental impacts of SLCP and seeking LLGHG emission pathways (FY2014 – FY2018)
1
Goal: To develop an integrated evaluation system for LLGHG and SLCP mitigation policy, by interconnecting emission inventory, integrated assessment models, and climate models.
Theme 1: Air quality change event analysis・Analysis on regional AQ change・Development of emission inventory ・Inversion algorithms of emission
estimation
Theme 2: Integrated model and future scenarios・Global socio-economic scenarios・National & regional emissions
scenarios・Urban & household emissions AQ
assessment
Theme 3: SLCP impacts on climate& environment・Impact assessment of aerosols & GHG・Assessment of health, agriculture,
water cycle, sea level rise
SLCP emissions scenariosImproved emission inventory
Feedback of impactsAssessment of activities/policies
Regional EmissionInventories and
Chemical Transfer Model
Integrated Assessment Model (AIM)
Climate and Environment
Model
Chemical transfer model and emission inventory in Asia
AIM/Enduse modelSocio-economical & emissions scenario
Climate model, earth system model Climate change impact & adaptation
Theme 4: Integrated operation system (Toolkits, data archive)
MDG・SDG・Future Earth
StakeholdersPolicy makers
Society
Information transmissionSystem utilization
CCAC, UNFCC, IPCC, EANETProposal and assessment of climate and
air pollution policies
Regional strategy
⇅Global
strategy
Science
Experiment setupDatabase development
Metric definitions
Model improvement
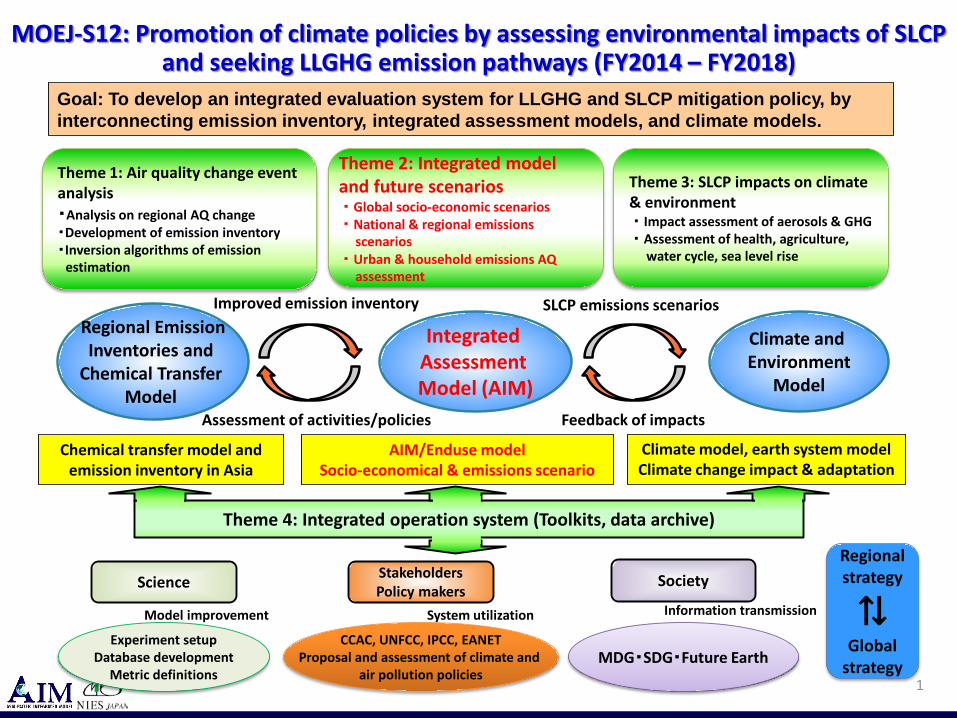
Overview of Key Research Topics
2
Urbanization
ElectrificationIndustrializationFuel Energy
Consumption
Electricity Consumption
IndustrialProduction
Dietary HabitChange
EconomicDevelopment
BehavioralChange
AgriculturalProduction
CH4, N2OCO2
IndustrialWastewater
Discharge
IndustrialSolid Waste
Disposal
DomesticSolid Waste
Disposal
DomesticWastewater
Discharge
PassengerTransport
Volume
Residential Service
Demand
Commercial Service
Demand
FreightTransport
Volume
CH4, N2O
CO2, PM, BC, SO2, NOx, etc

Research Motivations- how to achieve emissions pathways of the 2℃ target? -
3
Source)UNEP (2011), Figure ES-2
How about air pollutants reductions and their benefits and trade-offs, when achieving 2 degree?
What kinds of SLCP measures can be? How drastic it should be?
If SLCPs reductions are fully implemented by 2030, it reduces global warming between 2010 to 2040 by about 0.4 – 0.5 ℃
Source) IPCC AR5 Synthesis Report (2015) Figure SPM.5
This study aim to seek for balanced emissions scenarios of LLGHGs, SLCPs, air pollutants and evaluate cobenefits and tradeoffs of mitigation measures
Remaining cumulative CO2 emissions (i.e. carbon budgets) staying below 2℃ are around 1000 GtCO2
Remaining around1000 GtCO2
additional 1℃
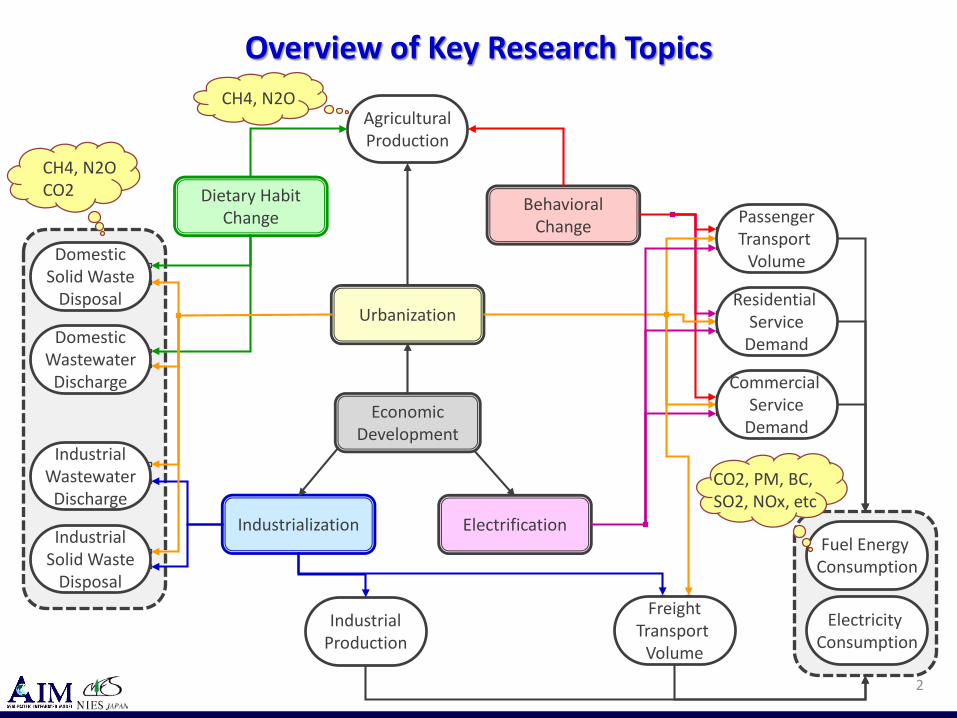
Short-Lived Climate Pollutants- How much can we reduce SLCPs? -
4
Source) Climate and Clean Air Coalition http://www.ccacoalition.org/en/science-resources
Today’s topic

Backgrounds- Sources of CH4 emission from Asia
5
Source) EDGER4.2
25%
5%
17%
47%
1%5%
2005 Asia140.9 TgCH4
Power
Mining
Industry
Transport
Buildings
Waste
Agriculture
Agriculture waste burning
Savannah burning etc
relation with economic development
relation with lifestyle
relation with landuse (i.e. landfill)
We have mitigation measure for waste.We can reduce landfill waste. But how?
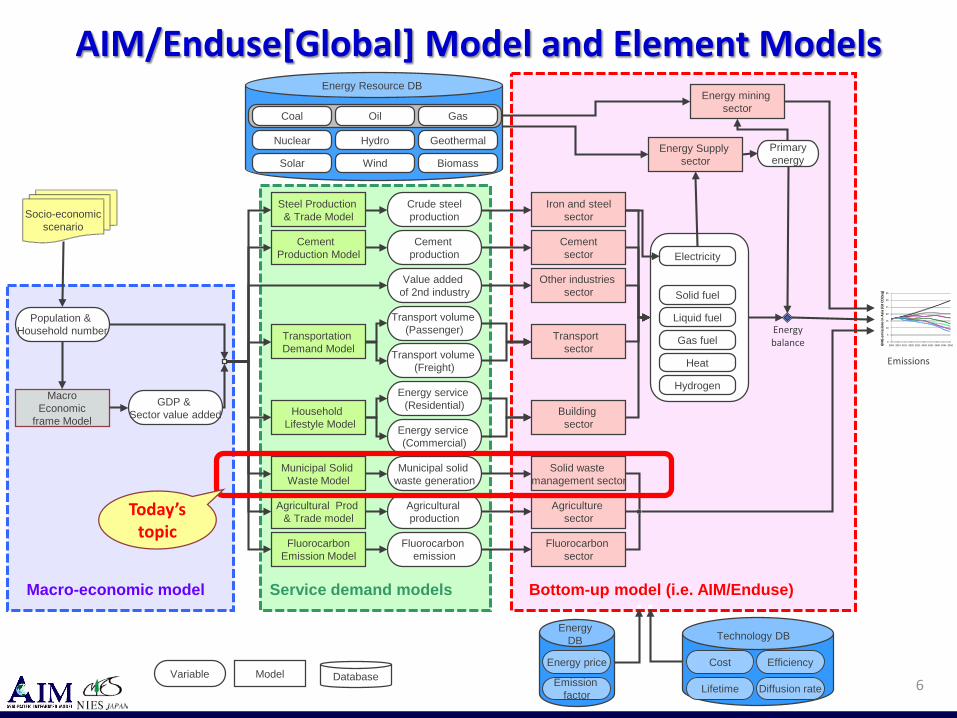
AIM/Enduse[Global] Model and Element Models
6
0
5
10
15
20
25
30
35
2005 2010 2015 2020 2025 2030 2035 2040 2045 2050GH
G e
mis
sion
s in
Asia
(Gt C
O2e
q)
Cement production
Value added of 2nd industry
Agricultural production
Fluorocarbon emission
Transport volume (Freight)
Energy service (Residential)
Municipal solid waste generation
Energy service (Commercial)
Transportation Demand Model
Household Lifestyle Model
Municipal Solid Waste Model
Cement Production Model
Building sector
Energy Supply sector
Socio-economicscenario
Agricultural Prod & Trade model
FluorocarbonEmission Model
Agriculture sector
Model DatabaseVariable
Solid waste management sector
Transport volume (Passenger)
Crude steelproduction
Steel Production & Trade Model
Gas fuel
Heat
Liquid fuel
Solid fuel
Hydrogen
Energy balance
Primaryenergy
Energy price
Emission factor
EnergyDB
Nuclear Hydro Geothermal
Solar Wind Biomass
Emissions
Energy mining sector
GasCoal Oil
Bottom-up model (i.e. AIM/Enduse)
Macro Economic
frame Model
Population & Household number
GDP & Sector value added
Macro-economic model
Iron and steelsector
Cementsector
Other industries sector
Transport sector
Fluorocarbon sector
Energy Resource DB
Cost
Lifetime
Technology DB
Efficiency
Diffusion rate
Service demand models
Electricity
Today’s topic
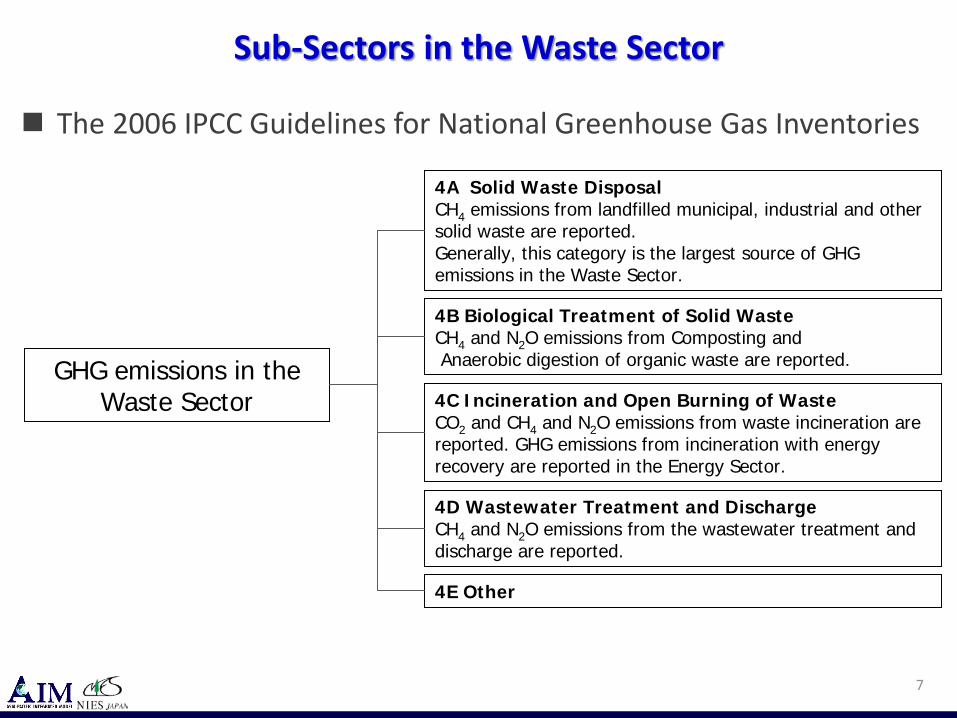
Sub-Sectors in the Waste Sector
7
GHG emissions in the Waste Sector
4A Solid Waste DisposalCH4 emissions from landfilled municipal, industrial and other solid waste are reported. Generally, this category is the largest source of GHG emissions in the Waste Sector.
4B Biological Treatment of Solid WasteCH4 and N2O emissions from Composting andAnaerobic digestion of organic waste are reported.
4C Incineration and Open Burning of WasteCO2 and CH4 and N2O emissions from waste incineration are reported. GHG emissions from incineration with energy recovery are reported in the Energy Sector.
4D Wastewater Treatment and DischargeCH4 and N2O emissions from the wastewater treatment and discharge are reported.
4E Other
The 2006 IPCC Guidelines for National Greenhouse Gas Inventories
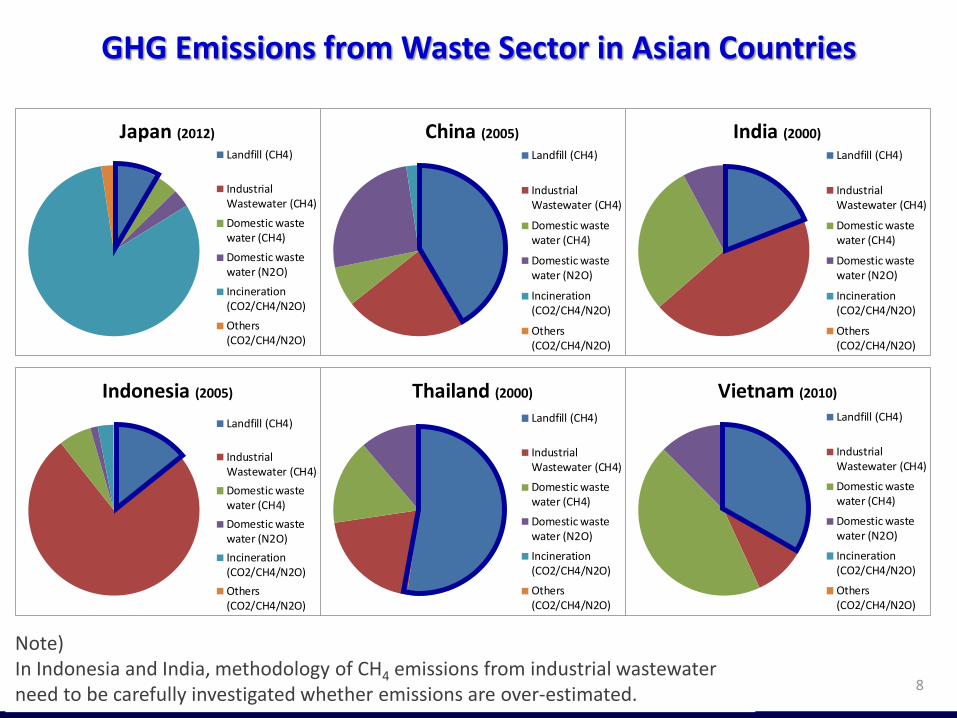
GHG Emissions from Waste Sector in Asian Countries
8
Japan (2012)Landfill (CH4)
IndustrialWastewater (CH4)Domestic wastewater (CH4)Domestic wastewater (N2O)Incineration(CO2/CH4/N2O)Others(CO2/CH4/N2O)
China (2005)Landfill (CH4)
IndustrialWastewater (CH4)
Domestic wastewater (CH4)
Domestic wastewater (N2O)
Incineration(CO2/CH4/N2O)
Others(CO2/CH4/N2O)
India (2000)Landfill (CH4)
IndustrialWastewater (CH4)
Domestic wastewater (CH4)
Domestic wastewater (N2O)
Incineration(CO2/CH4/N2O)
Others(CO2/CH4/N2O)
Indonesia (2005)
Landfill (CH4)
IndustrialWastewater (CH4)Domestic wastewater (CH4)Domestic wastewater (N2O)Incineration(CO2/CH4/N2O)Others(CO2/CH4/N2O)
Thailand (2000)
Landfill (CH4)
IndustrialWastewater (CH4)
Domestic wastewater (CH4)
Domestic wastewater (N2O)
Incineration(CO2/CH4/N2O)
Others(CO2/CH4/N2O)
Vietnam (2010)
Landfill (CH4)
IndustrialWastewater (CH4)
Domestic wastewater (CH4)
Domestic wastewater (N2O)
Incineration(CO2/CH4/N2O)
Others(CO2/CH4/N2O)
Note) In Indonesia and India, methodology of CH4 emissions from industrial wastewater need to be carefully investigated whether emissions are over-estimated.
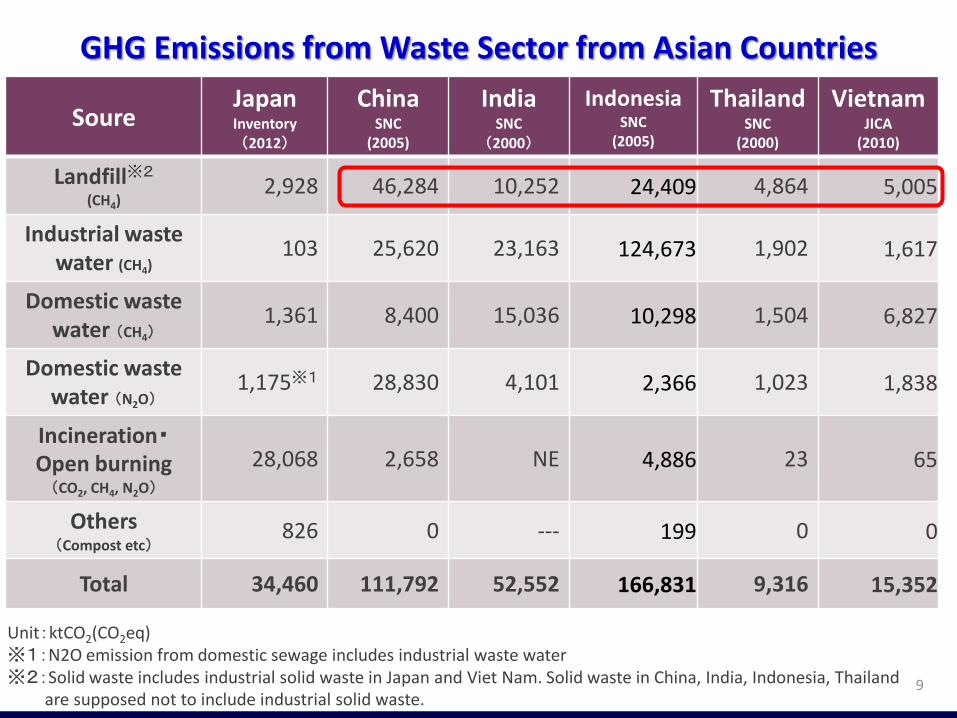
GHG Emissions from Waste Sector from Asian Countries
9
SoureJapanInventory(2012)
ChinaSNC
(2005)
IndiaSNC
(2000)
IndonesiaSNC
(2005)
ThailandSNC
(2000)
VietnamJICA
(2010)
Landfill※2
(CH4)2,928 46,284 10,252 24,409 4,864 5,005
Industrial waste water (CH4)
103 25,620 23,163 124,673 1,902 1,617
Domestic waste water (CH4)
1,361 8,400 15,036 10,298 1,504 6,827
Domestic waste water (N2O)
1,175※1 28,830 4,101 2,366 1,023 1,838
Incineration・Open burning(CO2, CH4, N2O)
28,068 2,658 NE 4,886 23 65
Others(Compost etc)
826 0 --- 199 0 0
Total 34,460 111,792 52,552 166,831 9,316 15,352
Unit:ktCO2(CO2eq)※1:N2O emission from domestic sewage includes industrial waste water※2:Solid waste includes industrial solid waste in Japan and Viet Nam. Solid waste in China, India, Indonesia, Thailand
are supposed not to include industrial solid waste.
Methodology in the IPCC Guideline- how to estimate CH4 from solid waste in landfill -
10
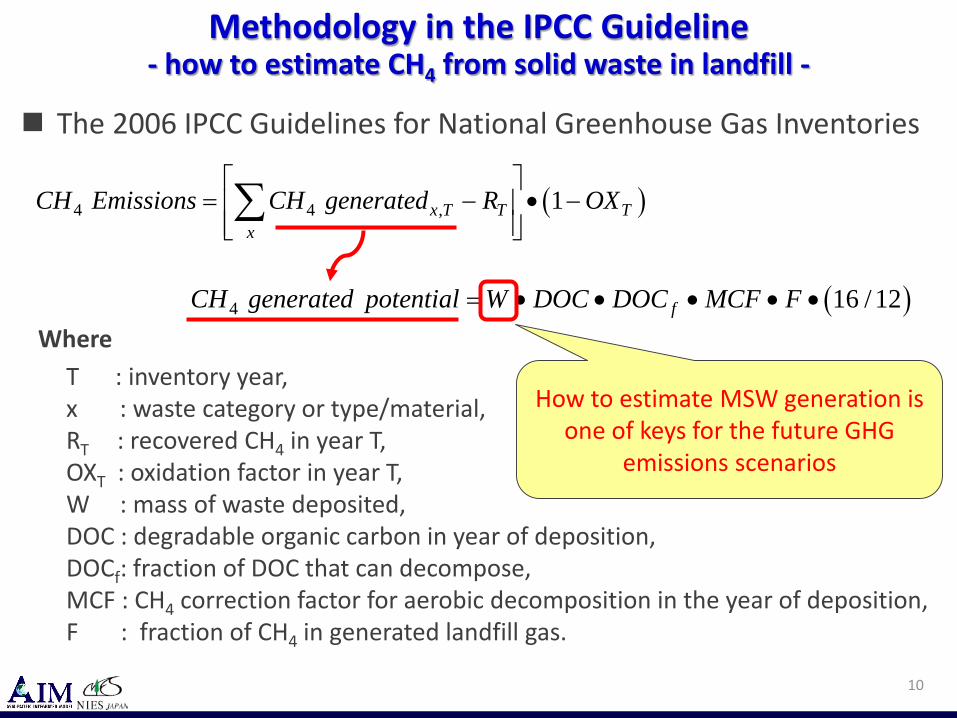
The 2006 IPCC Guidelines for National Greenhouse Gas Inventories
( )4 4 , 1x T T Tx
CH Emissions CH generated R OX
= − • − ∑
( )4 16 / 12fCH generated potential W DOC DOC MCF F= • • • • •
T : inventory year, x : waste category or type/material, RT : recovered CH4 in year T, OXT : oxidation factor in year T, W : mass of waste deposited, DOC : degradable organic carbon in year of deposition, DOCf: fraction of DOC that can decompose, MCF : CH4 correction factor for aerobic decomposition in the year of deposition, F : fraction of CH4 in generated landfill gas.
Where
How to estimate MSW generation is one of keys for the future GHG
emissions scenarios
Research Questions and Methodologies
11
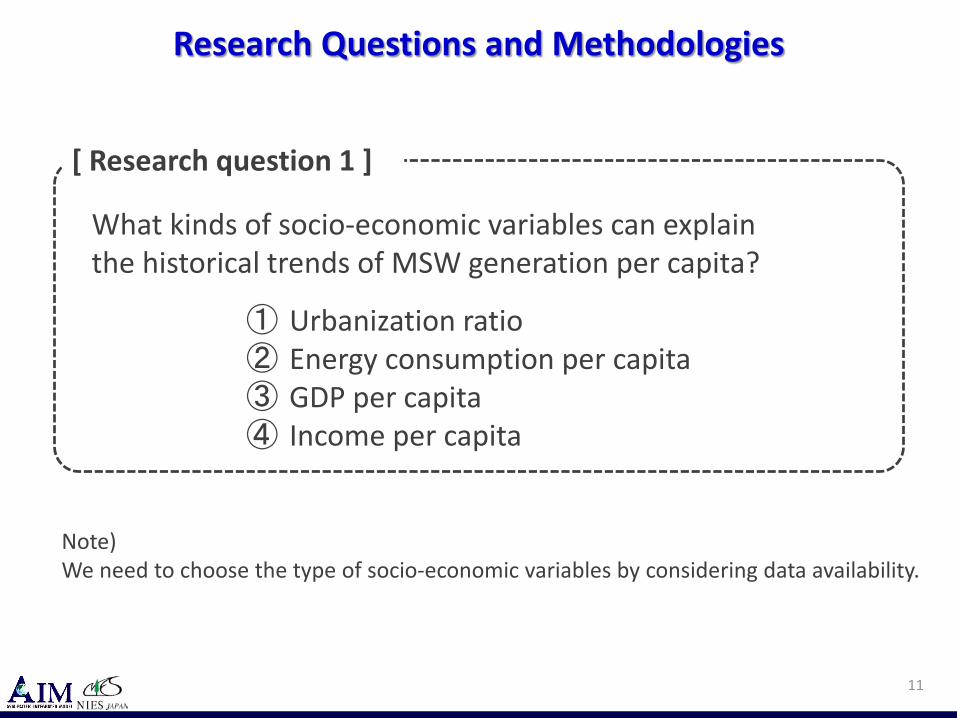
What kinds of socio-economic variables can explain the historical trends of MSW generation per capita?
① Urbanization ratio ② Energy consumption per capita③ GDP per capita④ Income per capita
[ Research question 1 ]
Note) We need to choose the type of socio-economic variables by considering data availability.

Research Questions and Methodologies
12
[Research question 2 ]
Y aX b= +ln( )Y a X b= +
2Y aX bX Z= + +
Single linear approximation
Logarithmic approximation
Quadratic approximation
Y : MSW generation per capita, X : Socio-economic variables a, b : constant value Z : intercept coefficient.
Where
Environmental Kuznets curve
What kinds of equations can be applied, in order to explain MSW generations increase?
If the linear regression is used for estimating MSW generations, it means that generated MSW amounts will keep increasing as explanatory variables increase. But, after reaching a certain level, will it be saturated and/or declined ?
Historical Municipal Solid Waste (MSW) Generation- China: rapid growing and urbanizing country -
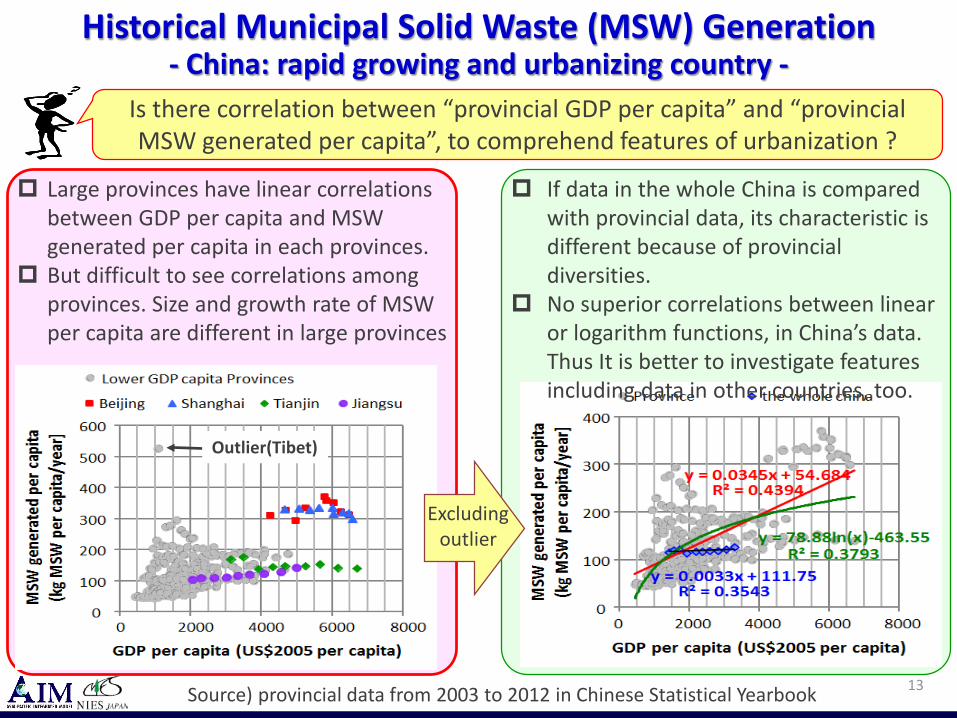
13Source) provincial data from 2003 to 2012 in Chinese Statistical Yearbook
Large provinces have linear correlations between GDP per capita and MSW generated per capita in each provinces.
But difficult to see correlations among provinces. Size and growth rate of MSW per capita are different in large provinces
Outlier(Tibet)
Is there correlation between “provincial GDP per capita” and “provincial MSW generated per capita”, to comprehend features of urbanization ?
Excludingoutlier
If data in the whole China is compared with provincial data, its characteristic is different because of provincial diversities.
No superior correlations between linear or logarithm functions, in China’s data. Thus It is better to investigate features including data in other countries, too.

[ Question ]
The more urbanization increase, the more MSW per capita are
generated ?
The more energy use per capita increase, the more MSW per
capita are generated ?
[ Question ]
Verification of Research Questions- Correlation with energy use and urbanization -
14Source ) Panel data include Japan, China, Thailand, USA, EU27
y = 31.612x + 368.11
R² = 0.12710
100 200 300 400 500 600 700 800 900
1000
0 2.0 4.0 6.0 8.0 10.0 Energy use per capita (toe per capita)
MSW
gen
erat
ed p
er c
apita
(k
g M
SW p
er c
apita
/yea
r]
Answer: there is a weak correlation.(maybe because energy consumption data
includes industries as well as residential ?)
y = 4.1215x + 185.95R² = 0.1481
0 100 200 300 400 500 600 700 800 900
1000
0 20 40 60 80 100 Urban population ratio (%)
MSW
gen
erat
ed p
er c
apita
(k
g M
SW p
er c
apita
/yea
r]
Answer: there is a weak correlation.(because urban ratio may be one element but
not a major for waste generation? )

Verification of Research Questions- Correlation with GDP per capita and income per capita -
15
The more GDP per capita increase, the more MSW per capita are generated?The more income per capita increase, the more MSW per capita are generated?
y = 128.05ln(x)-783.85
R² = 0.5406
0 100 200 300 400 500 600 700 800 900
1000
0 20000 40000 60000 80000 100000
MSW
gen
erat
ed p
er c
apita
(k
g M
SW p
er c
apita
/yea
r]
GDP per capita (US$2005 per capita)
y = 129.04ln(x) -770.54
R² = 0.567
0 100 200 300 400 500 600 700 800 900
1000
0 20000 40000 60000 80000 National income per capita (US$2005 per capita)
MSW
gen
erat
ed p
er c
apita
(k
g M
SW p
er c
apita
/yea
r]
Answer: Coefficient of determinations are almost similar between these two cases,
and it can be reasonable to use GDP per capita as an explanatory variable. However, R2 is not high enough, thus it is necessary to check outliers carefully
and also to include more reliable data especially in lower-income countries.
Source ) Panel data include Japan, China, Thailand, USA, EU27

Verification of Research Questions- Correlation with GDP per capita -
16
R2 become increased and reliable if data in the lower-income level is added. However, it is necessary to carefully discuss methodologies when GDP per
capita reaches the level beyond 5000 US$ per capita, because the increasing trends are different, which trends developing countries will follow.
Source ) Panel data include Japan, China, Thailand, USA, EU27, China provincials
0100200300400500600700800900
1000
0 20000 40000 60000 80000 100000
MSW
gen
erat
ed p
er ca
pita
(k
g M
SW p
er ca
pita
/yea
r]
GDP per capita (US$2005 per capita)
Eastern Europe Western Europe USAJapan China(Provinces)China(Country)Thailand
y = 139.7ln(x)-904.65 R² = 0.7938
Western-style trend
Developed countries average trend
y = 184.4ln(x )- 1243.3 R² = 0.8302
Asian-style trendy = 100.94ln(x)- 617.02
R² = 0.7445
Future MSW Generation per capita- Example in Asian Developing Countries -
17
0
100
200
300
400
500
19801990200020102020203020402050
MSW
gen
erat
ed p
er c
apita
(k
g M
SW p
er c
apita
/yea
r] Thailand
0
100
200
300
400
500
19801990200020102020203020402050
MSW
gen
erat
ed p
er c
apita
(k
g M
SW p
er c
apita
/yea
r] VietNam
0
100
200
300
400
500
19801990200020102020203020402050
MSW
gen
erat
ed p
er c
apita
(k
g M
SW p
er c
apita
/yea
r] India
0
100
200
300
400
500
19801990200020102020203020402050
MSW
gen
erat
ed p
er c
apita
(k
g M
SW p
er c
apita
/yea
r] China
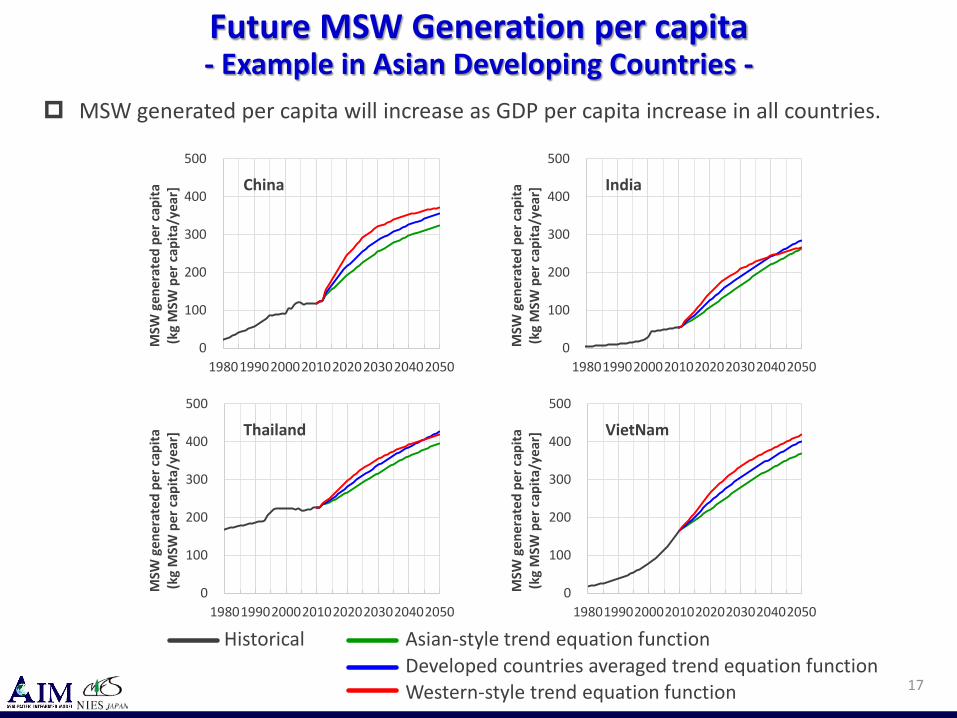
Historical Asian-style trend equation functionDeveloped countries averaged trend equation functionWestern-style trend equation function
MSW generated per capita will increase as GDP per capita increase in all countries.
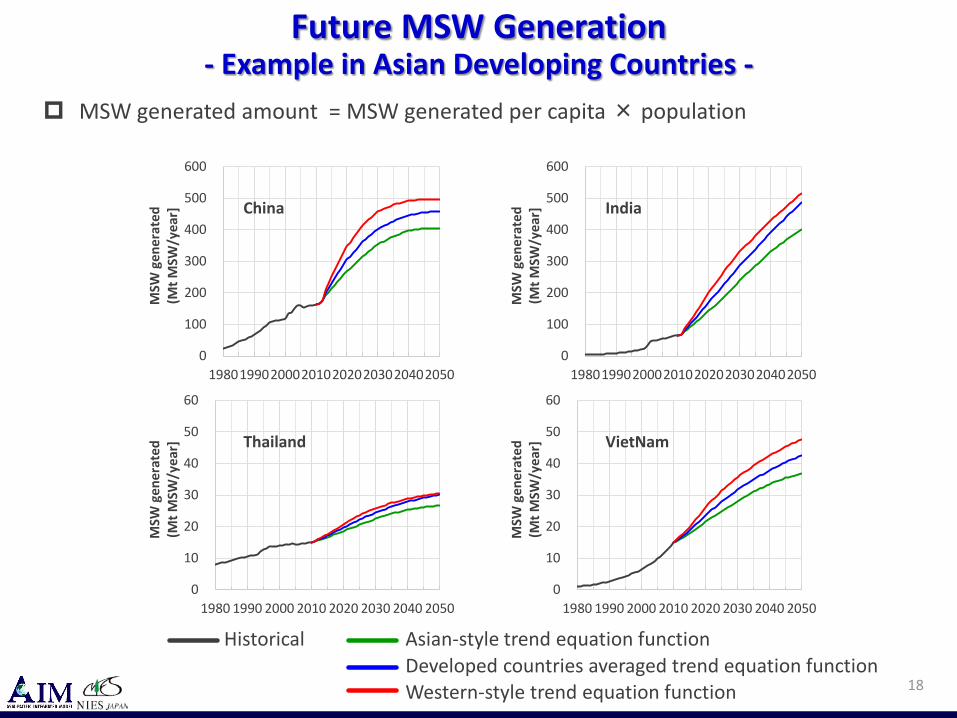
Future MSW Generation- Example in Asian Developing Countries -
0
10
20
30
40
50
60
1980 1990 2000 2010 2020 2030 2040 2050
MSW
gen
erat
ed
(Mt M
SW/y
ear] Thailand
0
10
20
30
40
50
60
1980 1990 2000 2010 2020 2030 2040 2050
MSW
gen
erat
ed
(Mt M
SW/y
ear] VietNam
0
100
200
300
400
500
600
19801990200020102020203020402050
MSW
gen
erat
ed
(Mt M
SW/y
ear] China
0
100
200
300
400
500
600
19801990200020102020203020402050
MSW
gen
erat
ed
(Mt M
SW/y
ear] India
18
Historical Asian-style trend equation functionDeveloped countries averaged trend equation functionWestern-style trend equation function
MSW generated amount = MSW generated per capita × population
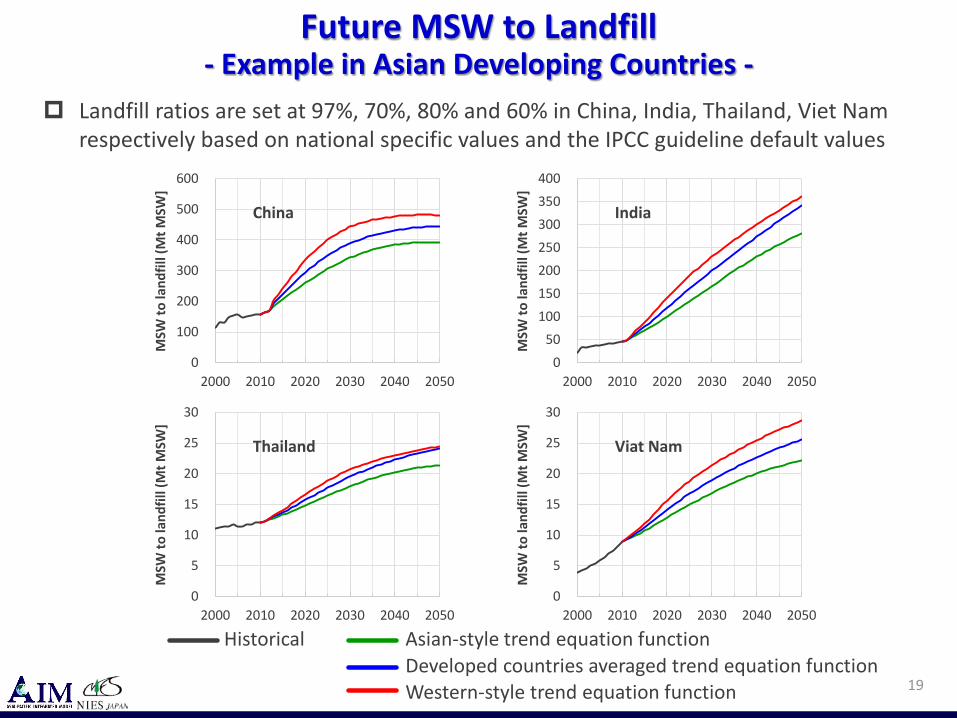
Future MSW to Landfill- Example in Asian Developing Countries -
19
0
5
10
15
20
25
30
2000 2010 2020 2030 2040 2050
MSW
to la
ndfil
l (M
t MSW
]
Thailand
0
5
10
15
20
25
30
2000 2010 2020 2030 2040 2050
MSW
to la
ndfil
l (M
t MSW
]
Viat Nam
0
100
200
300
400
500
600
2000 2010 2020 2030 2040 2050
MSW
to la
ndfil
l (M
t MSW
]
China
050
100150200250300350400
2000 2010 2020 2030 2040 2050
MSW
to la
ndfil
l (M
t MSW
]
India
Landfill ratios are set at 97%, 70%, 80% and 60% in China, India, Thailand, Viet Nam respectively based on national specific values and the IPCC guideline default values
Historical Asian-style trend equation functionDeveloped countries averaged trend equation functionWestern-style trend equation function

Future CH4 emissions from Landfill MSW- Example in Asian Developing Countries -
20
0
5
10
15
20
25
2000 2010 2020 2030 2040 2050
CH4
emis
sion
from
land
fill M
SW(M
t CO
2eq]
Thailand
0
5
10
15
20
25
30
2000 2010 2020 2030 2040 2050
CH4
emis
sion
from
land
fill M
SW(M
t CO
2eq]
Viat Nam
050
100150200250300350400
2000 2010 2020 2030 2040 2050
CH4
emis
sion
from
land
fill M
SW(M
t CO
2eq]
China
0
50
100
150
200
250
300
2000 2010 2020 2030 2040 2050
CH4
emis
sion
from
land
fill M
SW(M
t CO
2eq]
India
Parameters such as waste compositions, degradable organic carbon, aerobic decomposition, etc, are set at based on national specific values and the IPCC guideline default values
Historical Asian-style trend equation functionDeveloped countries averaged trend equation functionWestern-style trend equation function

0100200300400500600700800900
1000
2000 2010 2020 2030 2040 2050
CH4
emis
sion
from
land
fill M
SW(M
t CO
2eq]
Asia
0100200300400500600700800900
1000
2000 2010 2020 2030 2040 2050
CH4
emis
sion
from
land
fill M
SW(M
t CO
2eq]
Asia
Effects of Reducing Landfill and Introduce Incineration- Example in Asian Developing Countries -
21
Historical Asian-style trend equation functionDeveloped countries averaged trend equation functionWestern-style trend equation function
Considering a scenario if the whole Asia countries take waste policy to cut landfill ratio by half by 2030 and to increase incineration.
After 2030, keep the same landfill ratio as same as the 2030 level.
Reduction of landfill can reduce CH4 emission largely However, if the same landfill ratio continues after 2030, CH4 emission from landfill will
increase again due to waste generation growth. Thus necessary to keep accelerating landfill reduction or recovering CH4 from landfill, to peak out CH4 emission from landfill.
waste policy
120MtCO2eq
86MtCO2eq
403MtCO2qe
Note) CO2 emission in Thailand in 2010 was around 220 MtCO2
Without waste polity With waste polity
ご清聴ありがとうございました
Asia-Pacific Integrated Modelhttp://www-iam.nies.go.jp/aim/index.html

Scenario Dimensions - SSP (Shared Socioeconomic Pathways) -
23
(O’Neill, 2012)
Details quantitative data and qualitative stories:https://secure.iiasa.ac.at/web-apps/ene/SspDb/dsd?Action=htmlpage&page=aboutPeer-reviewed paper: Riahi, K. et al (2017) Global Environmental Change, 42:153-168http://www.sciencedirect.com/science/article/pii/S0959378016300681
Western-style trendequation function
Developed countries averaged trend equation function
Asian-style trendequation function
This study applied three different equation functions to the three different concepts of socio-economic scenarios.
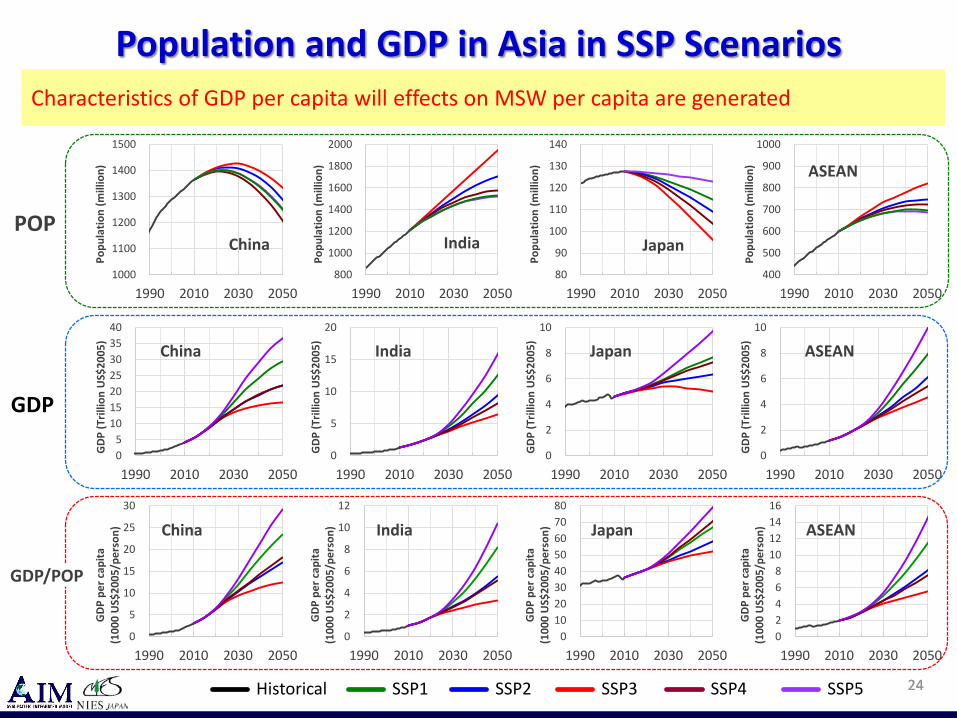
Population and GDP in Asia in SSP Scenarios
2424
01020304050607080
1990 2010 2030 2050
GDP
per
cap
ita
(100
0 U
S$20
05/p
erso
n) Japan
0
2
4
6
8
10
12
1990 2010 2030 2050
GDP
per
cap
ita
(100
0 U
S$20
05/p
erso
n) India
0
5
10
15
20
25
30
1990 2010 2030 2050
GDP
per
cap
ita
(100
0 U
S$20
05/p
erso
n) China
0
2
4
6
8
10
1990 2010 2030 2050
GDP
(Tril
lion
US$
2005
)
Japan
0
5
10
15
20
1990 2010 2030 2050
GDP
(Tril
lion
US$
2005
)
India
05
10152025303540
1990 2010 2030 2050
GDP
(Tril
lion
US$
2005
)
China
80
90
100
110
120
130
140
1990 2010 2030 2050
Popu
latio
n (m
illio
n)
Japan800
1000
1200
1400
1600
1800
2000
1990 2010 2030 2050
Popu
latio
n (m
illio
n)
India
1000
1100
1200
1300
1400
1500
1990 2010 2030 2050
Popu
latio
n (m
illio
n)
China
Historical SSP1 SSP2 SSP3 SSP4 SSP5
02468
10121416
1990 2010 2030 2050
GDP
per
cap
ita
(100
0 U
S$20
05/p
erso
n) ASEAN
0
2
4
6
8
10
1990 2010 2030 2050
GDP
(Tril
lion
US$
2005
)
ASEAN
400
500
600
700
800
900
1000
1990 2010 2030 2050
Popu
latio
n (m
illio
n) ASEAN
POP
GDP
GDP/POP
Characteristics of GDP per capita will effects on MSW per capita are generated