Embed Size (px)
Citation preview

1
Impacts of Fiber Length Distribution on Market Value and Yarn Quality: Implications for U.S. Cotton
Eric F. Hequet
M. Dean Ethridge
International Textile Center Texas Tech University Lubbock, Texas 79409
USA

2
INTRODUCTION
The shrinking U.S. textile manufacturing industry dictates
an increased reliance on the international market for
selling U.S. cotton. This process, in turn, is
transforming the requirements on fiber properties. This is
well illustrated by the existing “base levels” of fiber
properties shown in Table 1. A look at the percentage of
the U.S. cotton crop that equals or exceeds the
international base quality (Table 2) makes it clear that
progress is needed.
Table 1. Base Levels of Cotton Fiber Properties, U.S.
Versus International
Fiber Property United States International
Staple Length (in) 34 35
Tenacity (g/tex) 26 28
Micronaire 3.5-4.9 3.8-4.6
Uniformity Index (%) 80-82 82-83
Color 41 31
Leaf 4 3

3
Table 2. Percentage of U.S. Crop that Reaches or Exceeds
Base Qualities
Crop Year United States International
2003-04 54.8% 7.1%
2004-05 49.7% 7.9%
The foregoing data does not adequately reveal the emerging
emphasis (and the market premium) that is occurring for
fiber lengths that are longer and more uniform. The U.S.
industry has long been focused on the production of medium
and coarse yarns and has long emphasized open-end rotor
spinning, rather than ring spinning. But the focus of the
dominant international textile industries is on the finer
yarns and on ring spinning. Thus global textile mills
interested in sourcing cotton from the global market
emphasize those cotton growths with longer fiber lengths.
A less-appreciated fact is that the focus on fiber length
is shifting away from the traditional staple length (which
is a measure of the “dominant long fibers”) and toward
length distribution (which measures the lengths of all
fibers included in the cotton). This shift is obscured by
the lack of a high-volume measurement for length
distribution. Alternatively, it is revealed by a growing
preoccupation of international customers with the “short

4
fiber content” (SFC) of cotton; i.e., the percentage of
fibers with a length of ½ inch or less. Textile mill
operators believe – and the data prove – that higher SFCs
result in greater losses at the carding machine, reduced
spinning performance and yarn quality, and increased fabric
defects.
MEASURING FIBER LENGTH DISTRIBUTION
The only generally available instrument that can provide
fiber length distribution data is the Uster® Advanced Fiber
Information System (AFIS®). It is not a high-volume
instrument and it is not feasible to obtain reliable
market-wide measurements with it. Nevertheless, within a
carefully controlled laboratory it is feasible to get
repeatable and reliable measurements. At the International
Textile Center (ITC), standard cottons were developed and
are used every day to maintain calibrations on the two AFIS
instruments in its laboratory. These “check cottons” are
described in Table 3, which shows for each cotton the upper
quartile length (UQL), the short fiber content by weight
(SFC(w)), and the short fiber content by number (SFC(n)).
Using the ITC protocols, the precision of these instruments
over time has proven to be quite good. Furthermore,
results have proven that good repeatability of fiber length

5
Table 3. AFIS Check Cottons Used at the International
Textile Center
# 3116 # 3191 # 3212
UQL 1.01 1.16 1.30
SFC(w) 22.1 13.8 8.6
SFC(n) 43.5 33.1 24.3
distributions is obtained between the two instruments at
the ITC. (These two AFIS instruments span two generations;
the older one is called “AFIS” and the newer one is called
“AFIS Pro”.) As shown in Figure 1(a)-(c), the shapes of
the cotton fiber length distributions are repeatable for
all check cottons.
These results clearly show that fiber length distributions
vary for different cottons and that the distributions are
repeatable. Therefore, it is a strong hypothesis that
length distributions are heritable, which would mean that
varieties with superior length distributions could be
developed using traditional selection techniques of plant
breeders.

6
Figure 1. Length Distributions by Weight for Three Check
Cottons at the ITC
(a) Check Cotton 3116:
0
2
4
6
8
0.00 0.50 1.00 1.50 2.00 2.50
Length (in.)
%
AFIS Pro AFIS
(b) Check Cotton 3191:
0
2
4
6
8
0.00 0.50 1.00 1.50 2.00 2.50
Length (in.)
%
AFIS Pro AFIS

7
(c) Check Cotton 3212:
0
2
4
6
8
0.00 0.50 1.00 1.50 2.00 2.50
Length (in.)
%
AFIS Pro AFIS
ALTERATIONS OF FIBER LENGTH DISTRIBUTION
The natural, genetic length distribution of cotton fibers
on the seed is inevitably altered by fiber breakage due to
mechanical and other stresses placed on the fibers in
harvesting, ginning, and manufacturing. Indeed, even the
AFIS® instrument breaks substantial numbers of fibers in
the process of opening the cotton sample and
individualizing the fibers. (Thus, the AFIS® may be used
as an indicator of the propensity of fibers to break.)
Two factors that are critically important for predicting
the fibers’ propensity to break are maturity and fineness.
Use of the micronaire measure is frequently misleading
because it inherently measures a combination of maturity
and fineness. Thus, a coarse, immature fiber may give the

8
same micronaire value as a fine, mature fiber. Furthermore,
as illustrated by the cross-sectional images of a multitude
of cottons, there is a clear distributional behavior for
both fineness and maturity. This fact is illustrated in
Figure 2 using the bivariate distributions
between fiber perimeter (a measure of the fineness) and
“theta”, which describes the degree of thickening of the
fiber cell wall (a measure of the maturity). While the two
cotton varieties shown have the same micronaire reading
(4.28), they show divergent patterns of fineness and
maturity.
Since an immature fiber is weaker than a mature one, it is
more susceptible to being broken under stress. Therefore,
an average maturity measurement should be a better
predictor of fibers’ propensity to break than is the
micronaire. And since the stresses in mechanical
operations like ginning, cleaning, opening and carding are
being placed on individual fibers (rather than on bundles
of fibers) the distributional characteristics of maturity
should greatly impact the propensity to break.

9
Figure 2. Bivariate Distributions of Perimeter Versus Theta,
for Two Cottons with the Same Micronaire Value of 4.28
0.0
0.5
1.0
1.5
2.0
2.5
3.0%
0.00.20.40.60.81.04
44
84
Theta
Perimete
r (µ)
0.0
0.5
1.0
1.5
2.0
2.5
3.0
%
0.00.20.40.60.81.04
44
84
Theta
Perimete
r (µ)

10
Using AFIS® measurements of short fiber content by number
(SFC(n)) and by weight (SFC(w)), the distinctive behaviors
of mature versus immature of two cottons having the same
Upper Quartile Length (UQL) are illustrated in Figure 3.
This data was collected from hand-ginned cottons, in order
to ensure minimal damage to the native length distributions
of the cottons.
The SFC(w) is the more common frame of reference for the
cotton/textile industry. But the SFC(n) is often preferred
for research purposes, due to its greater sensitivity to
movements in SFC. The SFC(w) is less sensitive because the
short fibers (whether caused by native length distribution
or by the breaking of fibers) must logically comprise a
small portion of the total weight of fibers. The increased
number of short fibers for the immature cotton (Figure
3(a)) is relatively much larger than is the increased
weight of short fibers (Figure 3(b)). Nevertheless, with
the cottons used in this example, the differences in short
fibers between mature versus immature cotton are quite
clear.
It is noteworthy that Figure 3 shows the hand-ginned mature
cotton has very low amounts of short fibers. For the
immature cotton, however, the short fibers are greatly
increased. This is probably due to fiber breakage, both

11
Figure 3. Length Distributions for two cottons having an
UQL of 1.28 - Hand-Ginned Cottons
(a) Short Fiber Content by Number (SFC(n))
02468
1012
0.00 0.50 1.00 1.50 2.00 2.50
Length (in.)
%
Mature Immature
(b) Short Fiber Content by Weight (SFC(w))
02468
1012
0.00 0.50 1.00 1.50 2.00 2.50
Length (in.)
%
Mature Immature
12
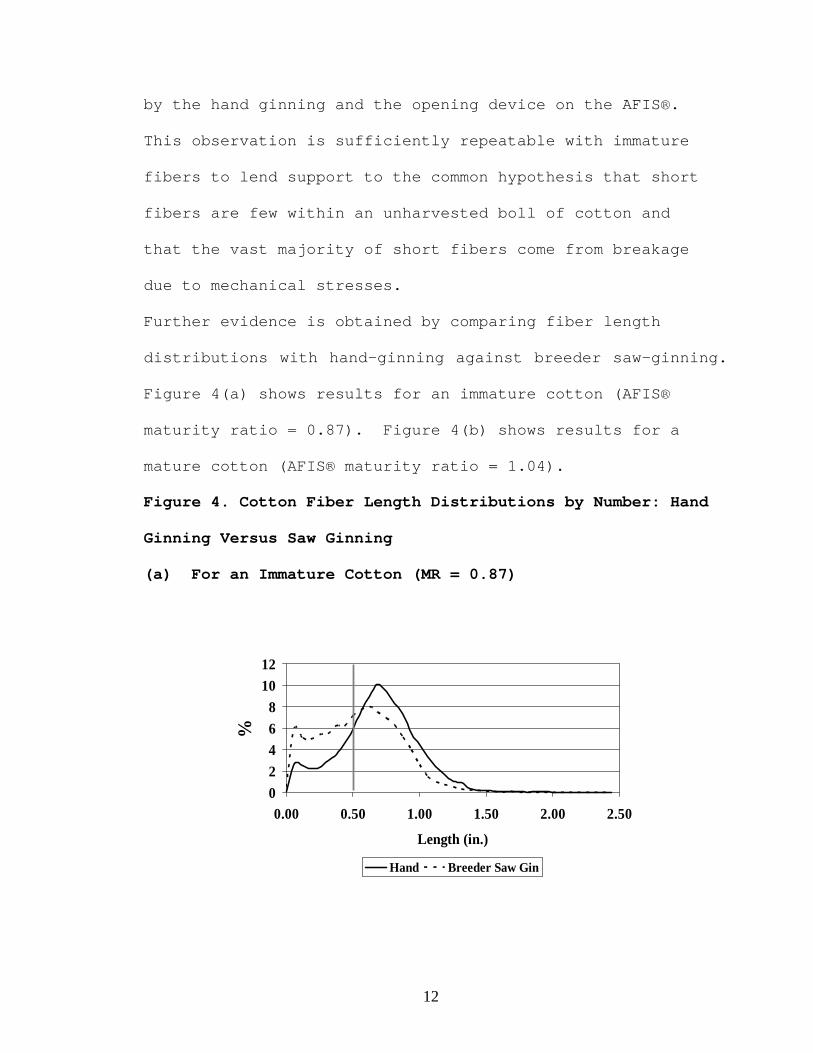
by the hand ginning and the opening device on the AFIS®.
This observation is sufficiently repeatable with immature
fibers to lend support to the common hypothesis that short
fibers are few within an unharvested boll of cotton and
that the vast majority of short fibers come from breakage
due to mechanical stresses.
Further evidence is obtained by comparing fiber length
distributions with hand-ginning against breeder saw-ginning.
Figure 4(a) shows results for an immature cotton (AFIS®
maturity ratio = 0.87). Figure 4(b) shows results for a
mature cotton (AFIS® maturity ratio = 1.04).
Figure 4. Cotton Fiber Length Distributions by Number: Hand
Ginning Versus Saw Ginning
(a) For an Immature Cotton (MR = 0.87)
02468
1012
0.00 0.50 1.00 1.50 2.00 2.50
Length (in.)
%
Hand Breeder Saw Gin

13
(b) For a Mature Cotton (MR = 1.04)
02468
1012
0.00 0.50 1.00 1.50 2.00 2.50
Length (in.)
%
Hand Breeder Saw Gin
Results show the following:
• With hand ginning the short fiber content is much
greater for the immature cotton.
• The use of a breeder saw gin increases the short fiber
content for both cottons, but the increase is much
more for the immature cotton.
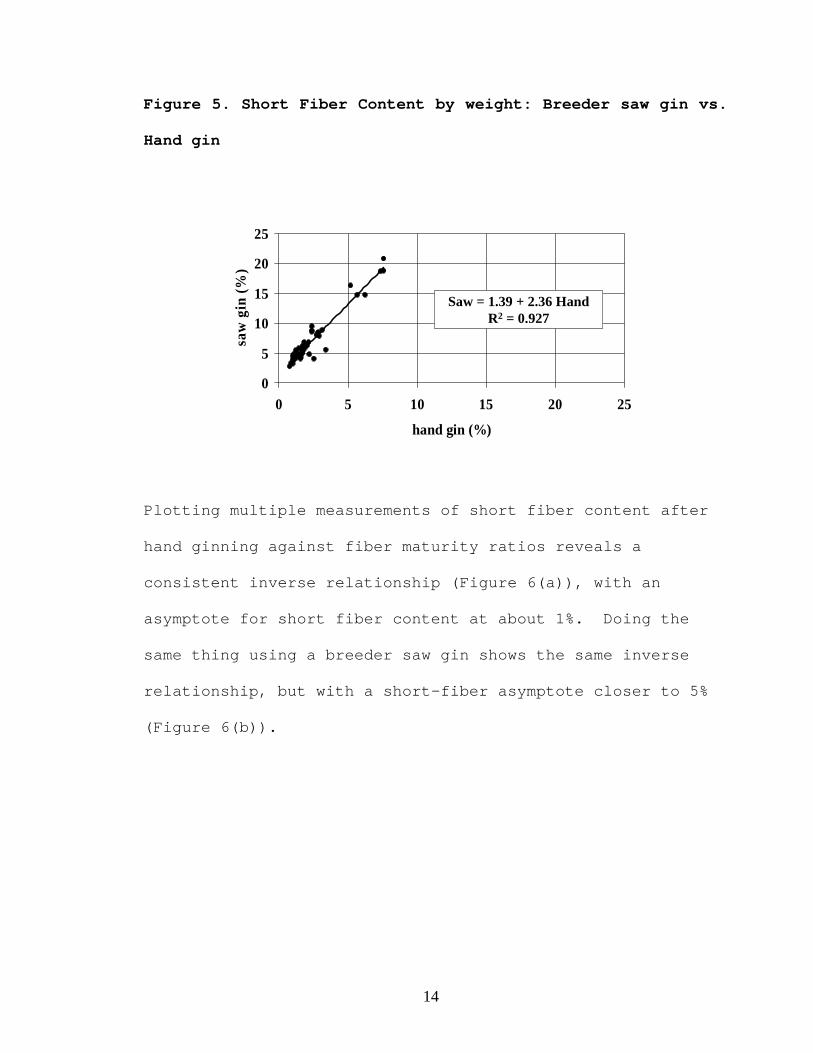
Comparing breeder saw ginning versus hand ginning over
multiple cotton samples reveals a consistent relationship
between short fiber contents and maturity (Figure 5). In
this example, a short fiber content by weight of about 5%
with hand ginning would be expected to increase to 12-13%
with the breeder saw gin.
14
Figure 5. Short Fiber Content by weight: Breeder saw gin vs.
Hand gin
0
5
10
15
20
25
0 5 10 15 20 25
hand gin (%)
saw
gin
(%)
Saw = 1.39 + 2.36 HandR2 = 0.927
Plotting multiple measurements of short fiber content after
hand ginning against fiber maturity ratios reveals a
consistent inverse relationship (Figure 6(a)), with an
asymptote for short fiber content at about 1%. Doing the
same thing using a breeder saw gin shows the same inverse
relationship, but with a short-fiber asymptote closer to 5%
(Figure 6(b)).

15
Figure 6. Short Fiber Content Versus Maturity Ratio
(a) Hand Ginning
0
2
4
6
8
10
0.85 0.90 0.95 1.00 1.05
Maturity ratio
%SFC(w) = 325.5 - 634.8 MR + 310.7 MR2
R2 = 0.878
(B) Breeder Saw Ginning
0
5
10
15
20
25
0.85 0.90 0.95 1.00 1.05
Maturity ratio
%
SFC(w) = 811.7 - 1585 MR + 778 MR2
R2 = 0.839

16
IMPACTS ON YARN QUALITY
A look at two varieties studied at the International
Textile Center illustrates how distributional properties
may determine the success or failure of cotton varieties in
yarn spinning. The spinning tests were done using ring
spinning and the yarn size was 40 Ne. Thus, the test
procedure was set to evaluate performance in higher-valued,
finer-count yarns.
Fiber Properties
The critical fiber properties are summarized in Figures 7
and 8. Figure 7 shows fiber fineness and maturity data:
micronaire, AFIS maturity ratio, and AFIS fiber perimeter
estimates. Note that both varieties have low micronaire
readings but that both are equally mature; taken together,
these results indicate that these are relatively fine
fibers, which are appropriate for making finer yarns. The
AFIS estimates of the average perimeters of the fibers
verify this. Variety 1 has the smaller perimeter, which
explains its lower micronaire value.

17
Figure 7. Fineness and Maturity Data for Two Varieties
(a) Micronaire
2.5
2.7
2.9
3.1
3.3
3.5
3.7
Var 1 Var 2
Mic
rona
ire
(b) AFIS Maturity Ratio
0.78
0.80
0.82
0.84
0.86
Var 1 Var 2
Mat
urity
rat
io

18
(c) Average Fiber Perimeter estimate (from AFIS)
48.0
49.0
50.0
51.0
52.0
53.0
54.0
Var 1 Var 2
Mic
rons
Figure 8 shows HVU upper half mean length (UHML), AFIS mean
length by number(ML), and AFIS short fiber content by
weight (SFC(w)). Variety 1 has a significantly longer
UHML; however Variety 2 has a significantly longer ML.
Furthermore, variety 1 exhibits a much higher SFC(w).
Based on measurements like these, the expectation is that
variety 2 will perform much better in ring spinning.
A look at the length distributions for each of these
varieties helps understand what is causing these length
measurements. Figure 9 clearly shows that variety 1 has no
“peak” near the mean length of the distribution and that it
has an excess of fibers in the short length categories.

19
Figure 8. Length Parameters for Two Varieties
(a) HVI Upper Half Mean Length
1.08
1.09
1.10
1.11
1.12
1.13
1.14
Var 1 Var 2
in.
(b) AFIS Mean Length by number
0.68
0.69
0.70
0.71
0.72
0.73
0.74
0.75
0.76
Var 1 Var 2
in.

20
(c) AFIS Short Fiber Content by Weight
8
9
10
11
12
13
14
Var 1 Var 2
%
Figure 9. Fiber length distribution by number for two
varieties
012345678
0.0 0.5 1.0 1.5 2.0 2.5
Length (in.)
%
Var 1 Var 2

21
Yarn Quality
A summary of key yarn quality parameters for these two
cotton varieties completes the story. Figure 10 provides
results on yarn tensile properties. The first chart
(Figure 10(a)) shows yarn breaking strength (tenacity); it
reveals that variety 1 is better in this regard. However,
variety 2 has a much better elongation (Figure 10(b)).
Therefore, the work-to-break, which is a critical indicator
of weaving performance, is greater for variety 2 (Figure
10(c)).
Figure 10. Yarn Tensile Properties for Two Varieties (Ring-
Spun, 40 Ne Yarns)
(a) Yarn Tenacity
12
13
14
15
16
Var 1 Var 2
cN/te
x

22
b) Yarn Elongation
5.5
6.0
6.5
7.0
7.5
8.0
8.5
Var 1 Var 2
%
(c) Yarn Work-to-Break
300
320
340
360
380
400
420
440
460
Var 1 Var 2
gF.c
m

23
Figure 11 shows that variety 2 exhibits better yarn
evenness, which means that it has a smaller yarn
coefficient of variation (CV%).
Figure 11. Yarn Evenness for Two Cotton Varieties (Ring-
Spun 40 Ne Yarns)
19.0
19.5
20.0
20.5
21.0
21.5
22.0
Var 1 Var 2
CV
%
Figure 12 shows that yarn imperfections are less with
variety 2. Thus, both thick places (Figure 12(a)) and thin
places (Figure 12(b)) are significantly lower for the yarn
spun with variety 2. Also, yarn neps are almost 30% less
with variety 2 (Figure 12(c)). Finally, the hairiness of
the yarn spun with variety 2 was significantly lower
(Figure 12(d)). All of these yarn properties are critical
for high-quality, ring-spun yarns.

24
Figure 12. Yarn Imperfections for Two Cotton Varieties
(Ring-Spun 40 Ne Yarns)
(a) Thick Places
1000105011001150120012501300135014001450
Var 1 Var 2
Thi
ck p
lace
s/km
(b) Thin Places
200
220
240
260
280
300
320
340
Var 1 Var 2
Thi
n pl
aces
/km

25
(c) Neps
400
450
500
550
600
650
Var 1 Var 2
Nep
s/km
(d) Hairiness
4.4
4.6
4.8
5.0
5.2
5.4
5.6
Var 1 Var 2
Hai
rine
ss

26
CONCLUSION
It is important that both the research and commercial
sectors focused on cotton and textiles realize that:
• Length distribution (as distinct from staple length)
is critically important for good spinning performance
and high yarn quality,
• Length distribution is highly correlated with strength
of individual fibers (therefore, with strength
distribution),
• Individual fiber strength is highly correlated with
fiber fineness and fiber maturity, and
• Even though the distributional characteristics of
either length or maturity are not yet candidates for
high-volume measurements, careful measurement and
evaluation of these can give indispensable guidance to
applied scientists trying to develop superior cotton
fibers.
Another implication of these results is that the process of
realizing the market potential of cotton varieties with
longer fiber lengths will likely require adjustments in
crop termination, harvesting, and ginning practices. The

27
juncture of greatest marginal gains will likely be the
ginning.