Embed Size (px)
Citation preview

HoustonKemp.com
Impact of gas powered generation on wholesale market outcomes
Final results presentation
Sam Forrest, Stuart Morrison & Adrian Kemp
May 2018
APPENDIX 8

HoustonKemp.com
Notes
• The approach to this analysis is detailed in the accompanying document –
Investigating wholesale electricity market outcomes – Methodology report.
2

HoustonKemp.com
Gas market context
3

HoustonKemp.com
Gas prices have increased over time
4

HoustonKemp.com
There has been significant variation in the electricity generation mix within states
5
Closure of Northern
Basslinkoutage
Return of Tamar Valley CCGT

HoustonKemp.com
The dispatch share of gas generation has increased in SA but remained largely flat elsewhere
6
The closure of Northern led
to a significant increase in
the dispatch share of gas

HoustonKemp.com
Gas has been increasingly setting the price in SA and Victoria
7
Generators
from the
mainland did
not set the
price in TAS
during the
Basslink
outage

HoustonKemp.com
Gas plants are generally high in the merit order –except in SA
8
Gas generators are marked
with red dots
Torrens Island B is marginal
more frequently in SA than
any other generator
Note: Generators that are marginal less than 1% of the time are excluded from the visualisation.

HoustonKemp.com
Gas plants are increasingly setting prices in VIC, SA and TAS
9

HoustonKemp.com
Wholesale electricity prices have increased over time
10

HoustonKemp.com
Assessment of generator gas supply
11
HoustonKemp.com
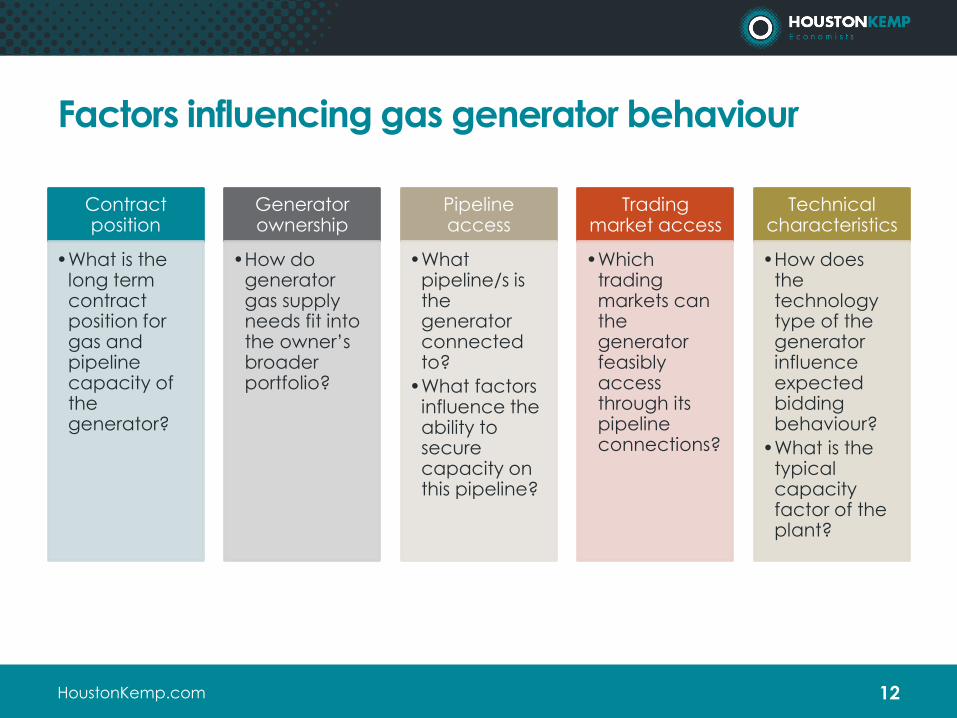
Factors influencing gas generator behaviour
12
Contract position
•What is the long term contract position for gas and pipeline capacity of the generator?
Generator ownership
•How do generator gas supply needs fit into the owner’s broader portfolio?
Pipeline access
•What pipeline/s is the generator connected to?
•What factors influence the ability to secure capacity on this pipeline?
Trading market access
•Which trading markets can the generator feasibly access through its pipeline connections?
Technical characteristics
•How does the technology type of the generator influence expected bidding behaviour?
•What is the typical capacity factor of the plant?

HoustonKemp.com
Contract position and bidding approach
• Generators typically enter into contracts for gas supply and transportation to
ensure they have access to gas when required
• Pricing approach under contracting lies between two extremes:
› Pricing at contract level – price in line with the price of the gas contract position and so bids are insensitive to short term gas prices
› Opportunity cost pricing – price gas under contract at spot prices, reflecting the opportunity cost of using the gas
• Electricity market bidding of gas generators may reflect changes in short run
gas prices due to either:
› direct exposure to the short term price, or
› opportunity cost pricing
13

HoustonKemp.com
Gas generation ownership
• The supply arrangements for gas generators are likely to be influenced by
ownership and gas portfolio positions of their operators
• A generator owned by a firm that has significant gas interests, eg, gas
production or gas retail, may have easier access to gas supply at short notice
14

HoustonKemp.com
Classification of gas generators by operational characteristics in the NEM
15
• Opportunistic bidding based on short term wholesale market outcomes
• Typically use as-available or interruptible gas supply
• Predictable output which typically varies with the level of demand
• Reliant on gas contracts to guarantee gas supply, with potential for participation in short term markets in rare circumstances

HoustonKemp.com
Locations of gas generators influence gas supply options
16

HoustonKemp.com
Summary of assessment of gas generators
• Each gas generator responds differently to changes in short term gas prices,
depending on their individual contractual positions, technical characteristics
and locations within both the gas and electricity networks
• There is no publicly available information on contractual positions of gas
generators so we have adopted an empirical approach to assess each
generators observed responsiveness to gas prices
• To facilitate this, we have categorised generators based on:
› locations within the gas network and so their supply options and ability to
access each gas trading market
› the operational profile of plants, eg, peaking or mid-merit plants
› ownership of gas generators
17

HoustonKemp.com
Analysis of gas generation
18

HoustonKemp.com
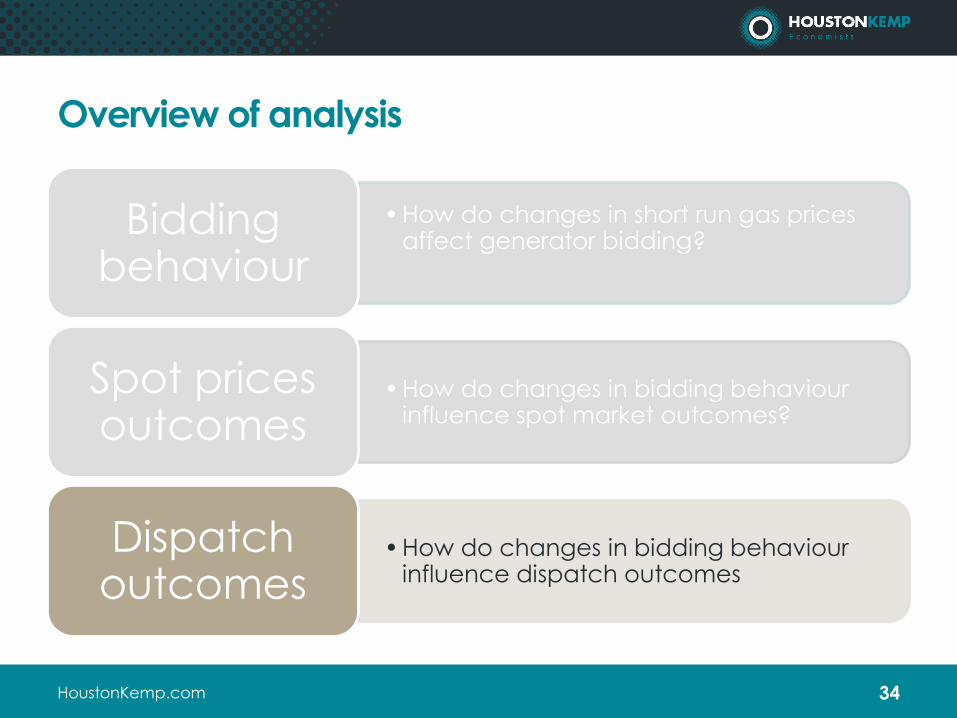
Overview of analysis
19
• How do changes in short run gas prices affect generator bidding?
Bidding behaviour
• How do changes in bidding behaviour influence spot market outcomes?
Spot prices outcomes
• How do changes in bidding behaviour influence dispatch outcomes
Dispatch outcomes

HoustonKemp.com
Overview of analysis
20
• How do changes in short run gas prices affect generator bidding?
Bidding behaviour
• How do changes in bidding behaviour influence spot market outcomes?
Spot prices outcomes
• How do changes in bidding behaviour influence dispatch outcomes
Dispatch outcomes

HoustonKemp.com
Quantity
Price
How have gas prices influenced bidding behaviour?
21
We consider two approaches:
10% 20% 30% 40% 50% 60% 70% 80% 90% 100% Quantity
Price
Approach 1: Price-setting bids only Approach 2: Entire bid function
• Only analyse bid prices when a generator is price-setting in its own region
• Price setting bids have the most direct financial impact and so reflect critical generator behaviour
• Small sample sizes• Does not consider changes on bidding behaviour for
non-price setting bids
• Analyse bid prices across entire bid functions• Bid function represents entire bid strategy of a
generator, and so represents a more comprehensive view of bid strategy
• Larger sample size but significantly more ‘noise’ in bid changes as not price setting
Price setting
bid level

HoustonKemp.com
Approach 1: Price-setting bids only
22
NSW QLD SA TAS VIC
$53 $53.5 $60 $65 $62
$53 $53.5 $61 $65 $62
$53 $53.5 $60 $65 $50
$53 $53.5 $60 $65 $50
$53 $53.5 $60 $65 $50
$51 $51.5 $54 $65 $50
$51 $51.5 $54 $65 $50
Period NSW QLD SA TAS VIC
1 BW01 BW01 TORRA1 POAT110 TORRA1
2 BW01 BW01 TORRA1 POAT110 TORRA1
3 BW01 BW01 TORRA1 POAT110 LYA1
4 BW01 BW01 TORRA1 POAT110 LYA1
5 BW01 BW01 LYA1 POAT110 LYA1
6 LYA1 LYA1 LYA1 POAT110 LYA1
7 LYA1 LYA1 LYA1 POAT110 LYA1
Marginal generator Wholesale spot price
Indicative example: Torrens Island A bid levels
• Assess pricing when marginal in its own region – costs pass-through into bid level
most likely to occur under these circumstance

HoustonKemp.com
Box 1: Econometric model specification
Approach 1: Econometric model
• Objective is to describe how gas prices feed through into bidding
behaviour of individual generators
• We estimate the regression equation described in Box 1
• Spot gas cost is determined by:
› multiplying gas price by the heat rate;
› adding variable operations and maintenance; and
› adjusting by marginal loss factors
• We truncate prices to between $0 and $1,000 per MWh to:
› reduce the significant ‘noise’ introduced through higher price events; and
› still capture the response of peaking plants to gas prices
• The coefficient of spot gas cost can be interpreted as follows:
› 𝛾 = 0: bids are insensitive to changes in price
› 0 < 𝛾 ≤ 1: a proportion of spot gas costs are passed through into bids,
either due to market exposure or opportunity cost based on opportunity cost
› 𝛾 > 1: more than the spot gas cost is passed through into bids
23
Where:• g denotes generators• t denotes time
• e denotes events• E denotes number of events

HoustonKemp.com
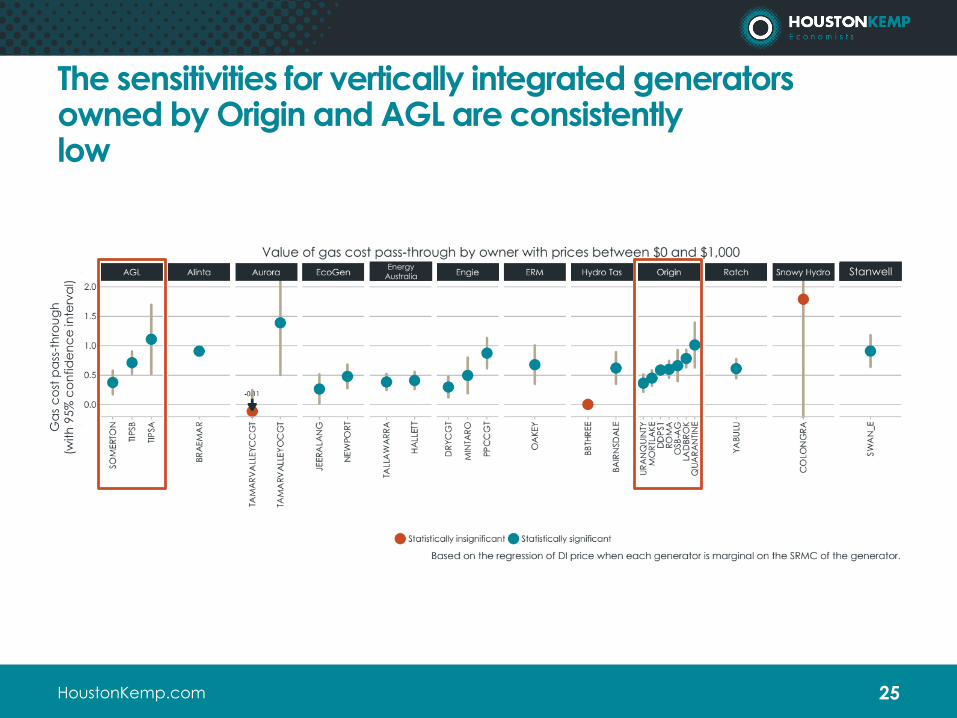
Assessment of gas impacts on price
• The gas cost coefficient shows the sensitivity of wholesale price to changes in spot
gas costs
• A coefficient value of 1.0 indicates a one-for-one relationship between changes in
gas cost and change in spot price outcomes when the generator is marginal
24
Low coefficients less than one A wider distribution of coefficient values
Ga
s c
ost
pa
ss-t
hro
ug
h
(with
95
% c
on
fid
en
ce
inte
rva
l)
HoustonKemp.com
The sensitivities for vertically integrated generators owned by Origin and AGL are consistently low
25
Energy
AustraliaStanwell
Ga
s c
ost
pa
ss-t
hro
ug
h
(with
95
% c
on
fid
en
ce
inte
rva
l)

HoustonKemp.com
Gas generators in the DWGM have consistently lower sensitivities
26
Eastern Gas
PipelineMoomba to
Adelaide
Roma to
Brisbane
Insensitivity of
TVCCGT and
BBTHREE may reflect
take or pay
contract position
Ga
s c
ost
pa
ss-t
hro
ug
h
(with
95
% c
on
fid
en
ce
inte
rva
l)
HoustonKemp.com
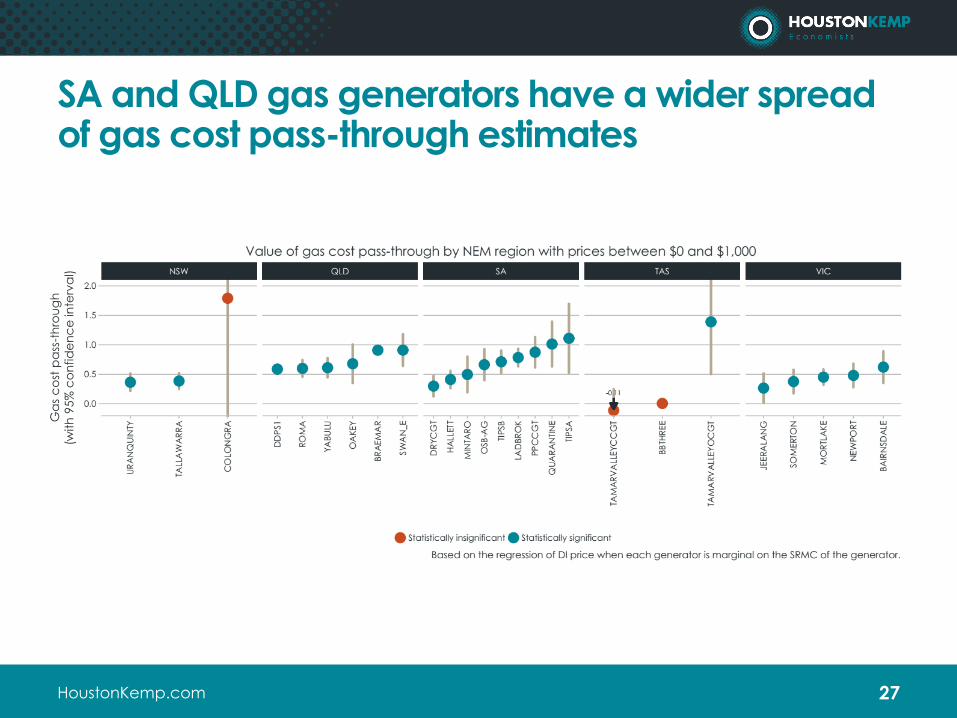
SA and QLD gas generators have a wider spread of gas cost pass-through estimates
27
Ga
s c
ost
pa
ss-t
hro
ug
h
(with
95
% c
on
fid
en
ce
inte
rva
l)

HoustonKemp.com
Approach 2: Bid function analysis regression equation• We considered a range of formulations of regression equations to explain the
sensitivity of different parts of the bid function to changes in short term gas
prices
• This approach did not yield consistent statistically robust results, likely owing to
the substantial range of unexplained factors influencing non-price setting bids,
eg, changing engineering constraints and opportunistic behaviour
28
10% 20% 30% 40% 50% 60% 70% 80% 90% 100% Quantity
Price

HoustonKemp.com
Overview of analysis
29
• How do changes in short run gas prices affect generator bidding?
Bidding behaviour
• How do changes in bidding behaviour influence spot market outcomes?
Spot prices outcomes
• How do changes in bidding behaviour influence dispatch outcomes
Dispatch outcomes

HoustonKemp.com
We estimate the impact of gas costs and prices on wholesale energy prices in two ways:
• Method 1: Estimate average generator gas cost pass-through
› for each dispatch period and region, assign a pass-through value as follows:
▪ 0 for periods where non-gas generators are marginal
▪ the regression coefficient (from Approach 1) for gas generators when they are marginal1
› for periods where a generator is marginal in a region where it is not located, we adjust the coefficient estimates by estimates of interconnector losses
› calculate the average pass-through for each region over the appropriate time period, eg, monthly
• Method 2: Calculate the pass-through of gas price to wholesale energy price
› adjust the pass-through estimates by the heat rate and marginal loss factor of the marginal generator to obtain an estimate of the pass-through of gas price to wholesale energy price
› re-calculate the average pass-through for each region over the appropriate time period, eg, monthly
We use coefficient estimates to assess the sensitivity to gas markets over time
30
1We cap the pass-through value at 3, ie, a maximum 3 per cent change in wholesale spot price in response to a 1 per
cent change in gas price

HoustonKemp.com
Method 1: Estimate average generator gas cost pass-through
31
The gas costs pass-through represents the average proportion of the changes in generator gas costs (in
$/MWh) that are passed through by the marginal generator, eg, a value of 0.2 indicates that a change in
gas cost to a generator of $1/MWh would lead to a change in the wholesale energy price of $0.2/MWh
SA’s reliance on
gas generation
makes it highly
sensitive to spot
market gas prices

HoustonKemp.com
Method 2: Calculate the pass-through of gas price to wholesale energy price
32
The gas price pass-through represents the average proportion of the changes in gas prices (in $/GJ)
that are passed through by the marginal generator, eg, a value of 20 indicates that a change in gas
price of $1/GJ would lead to change in the wholesale energy price of $20/MWh
The spot price impact estimates
are based on historical short
term market fluctuations and
do not capture potential longer
term impacts of changes in gas
prices as generators renew
contractual arrangements.

HoustonKemp.com
Method 2: Average pass-through of gas price to wholesale energy price
2014 2015 2016 2017
NSW 0.76 0.66 1.31 1.11
QLD 1.48 1.12 1.93 1.35
SA 2.41 3.16 5.09 3.38
TAS 0.55 0.39 0.43 1.14
VIC 1.06 0.74 1.31 1.90
33
This table shows the annual average expected increase in wholesale
price ($/MWh) from a $1/GJ increase in gas price for each region.
HoustonKemp.com
Overview of analysis
34
• How do changes in short run gas prices affect generator bidding?
Bidding behaviour
• How do changes in bidding behaviour influence spot market outcomes?
Spot prices outcomes
• How do changes in bidding behaviour influence dispatch outcomes
Dispatch outcomes

HoustonKemp.com
How do gas prices influence dispatch outcomes?
35
• Our econometric analysis did not find a clear relationship between gas price and gas dispatch or wholesale price and gas dispatch
› we considered demand, wind output, solar output and event indicators as potential regressors
• While a first order assessment may suggest a lower share of gas when gas prices are high, this is not clearly the case for the following reasons:
› endogeneity between gas price and gas dispatch – higher gas dispatch means higher
demand for gas, which may in turn put upward pressure of gas spot prices
› limited changes in the merit order when gas prices change – many gas plants are able to pass
through market wide gas price increases as gas plants do not compete with many other
generation technology types, eg, coal, wind, solar (hydro plants are a potential exception)
• Owing to the position of gas plants in the merit order, output from gas plants tends to increase under periods of high demand – high demand tends to be associated with higher wholesale energy prices
• Demand and market events had the biggest impact on dispatch, eg, the closure of Northern Power Station

HoustonKemp.com
Short term gas prices and gas generation dispatch outcomes
36
• The relationship between short term gas prices and gas generation dispatch outcomes varies substantially across regions reflecting:
› different generator technology types;
› different regional fuel mixes; and
› different gas market characteristics.
• The relationship between gas prices and dispatch in Queensland and New South Wales is not strong and is reasonably stable over time
› with the exception of Queensland in 2017 where the operation of Darling Downs changed substantially
• The correlation is positive in South Australia, reflecting unique market dynamics in the regions where demand for gas drives short term gas prices
• The relationships in Victoria and Tasmania are volatile reflecting the small numbers of plants in these regions and their peaking operating arrangements

HoustonKemp.com
Relationship between gas prices and gas generation dispatch - Queensland
• From 2013 to 2016, output from gas fired plants has been relatively insensitive to short term gas prices, with modestly higher gas dispatch during lower gas prices
• Decline in total gas generation between 2014 and 2017 reflects:
› mothballing of Swanbank E in October 2014; and
› decline in output from Darling Downs Power Station (owned by Origin Energy) from 2014 to 2017.
• Change in sensitivity to gas prices in 2017 reflects changes in behaviour from Darling Downs Power Station potentially due to:
› sale of Darling Downs Pipeline to Jemena in May 2017 potentially changing gas supply arrangements for the power station as it relies on the pipeline for supply;
› APLNG (part owned by Origin Energy) hit full LNG production in May 2017; and
› planned outage of Darling Downs PS from August to October 2017.
37

HoustonKemp.com
Relationship between gas prices and gas dispatch –New South Wales
• In NSW, gas dispatch is
largely insensitive to
short term gas prices
• The decline in output
in 2016 and 2017
reflects reduced
output from Tallawarra
Power Station.
38
HoustonKemp.com
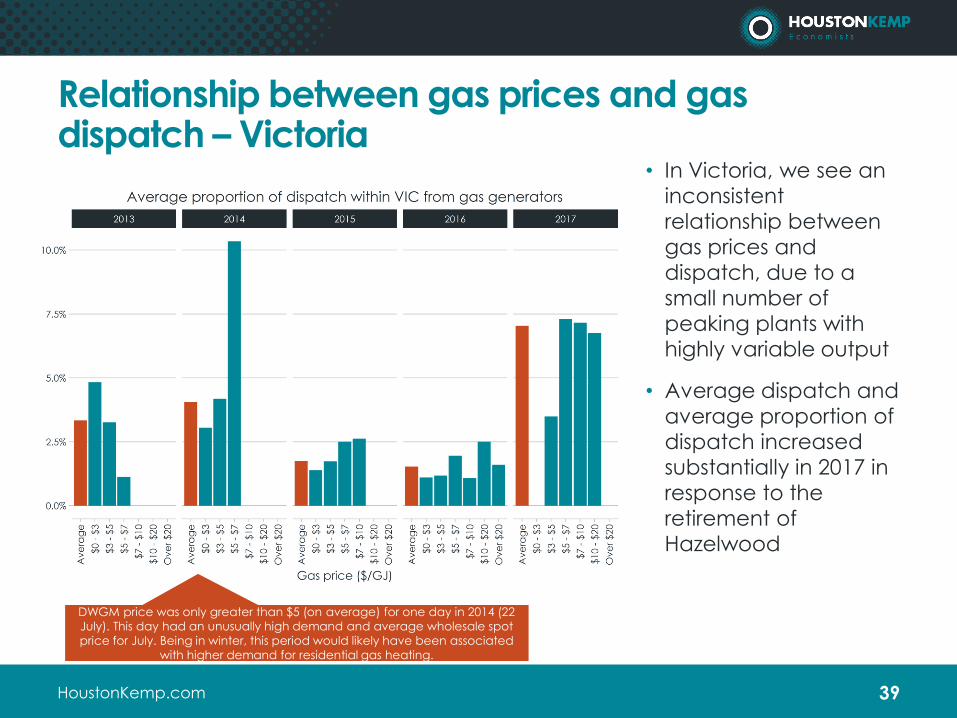
Relationship between gas prices and gas dispatch –Victoria
• In Victoria, we see an
inconsistent
relationship between
gas prices and
dispatch, due to a
small number of
peaking plants with
highly variable output
• Average dispatch and
average proportion of
dispatch increased
substantially in 2017 in
response to the
retirement of
Hazelwood
39
DWGM price was only greater than $5 (on average) for one day in 2014 (22
July). This day had an unusually high demand and average wholesale spot
price for July. Being in winter, this period would likely have been associated
with higher demand for residential gas heating.

HoustonKemp.com
Relationship between gas prices and gas dispatch – South Australia
• In SA, we see a positive relationship between short term gas prices and gas dispatch, suggesting that increased demand for gas from generators drives higher short term gas prices
• Increase in gas output in 2017 is driven by:
› retirements of Northern (May 2016) and Hazelwood (March 2017)
› Rate of Change of Frequency (RoCoF) constraint introduced in October 2016 that limits imports in to SA (Market Notices 55222 and 55358)1
› system strength constraints introduced in July 2017 involving constraints that limits the amount of wind output to as low as 1200MW depending on level of synchronous generation. (Market Notice 58845)1
40
1To locate market notices go to https://www.aemo.com.au/Market-Notices and search for market notice ID number

HoustonKemp.com
Relationship between gas prices and gas dispatch – Tasmania
• In TAS, we see a volatile relationship reflecting the small number of plants and changes in the operating arrangements for Tamar Valley Combined Cycle Gas Turbine (TV CCGT) and Open Cycle Gas Turbine (TV OCGT)
• Outage of Basslinkoccurred from December 2015 to June 2016 which led to a return to operation of TV CCGT (208MW)
• TV CCGT was subsequently returned from mothballing on an ongoing basis (as of March 2018 it is expected to return to mothballing in April 2018)1
• TV OCGT (58MW) returned to service from April 20161
41
1See AEMO Generator Information Page, March 2018 update

HoustonKemp.com
• All regions exhibit a positive correlation between wholesale spot price and gas
dispatch
› high demand periods lead to high prices as higher cost gas plants tend to be
dispatched under these conditions
• The nature of the relationship varies depending on the gas technology in each
state, eg:
› Victoria has largely high cost peaking gas plants, and so gas dispatch tends
to only occur at higher prices
› Queensland has lower cost ‘intermediate’ gas plants such as Darling Downs
Power station and Swanbank E, which operate for a larger proportion of the
time
› South Australia relies on dispatchable gas fired generation for system security
and so must have gas plants running at all times
Wholesale prices and gas generation dispatch
42

HoustonKemp.com
Relationship between wholesale prices and gas generation dispatch - Queensland
• In QLD, a strong positive relationship exists between wholesale price and gas output in all years
• The increasing sensitivity of gas dispatch to wholesale price and reduced average output over time reflects:
› changed operating behaviour of Darling Downs Power Station particularly in 2017; and
› mothballing of Swanbank E in October 2014.
• Also see discussion on slide 37
43

HoustonKemp.com
Relationship between wholesale prices and gas generation dispatch –New South Wales
• In NSW, the
relationship has
remained reasonably
consistent over time
with a strong positive
relationship between
wholesale price and
gas output
• The decline in gas
output during low
price periods reflects
changing operating
behaviour of
Tallawarra, which
reduced its overall
output over time
44

HoustonKemp.com
Relationship between wholesale prices and gas generation dispatch – Victoria
• In Victoria, we see a
strong positive
correlation between
wholesale prices and
gas dispatch
› gas plants in Victoria are typically peaking so therefore tend to only operate during periods of high demand and high prices
• Output from gas
plants increased in
2017 owing to the
closure of Hazelwood.
45

HoustonKemp.com
Relationship between wholesale prices and gas generation dispatch – South Australia
• In SA, the strong positive relationship between wholesale has remained largely constant over time
• Output of gas plants increased in 2017 owing to
› retirements of Northern (May 2016) and Hazelwood (March 2017)
› Rate of Change of Frequency (RoCoF) constraint introduced in October 2016 that limits imports in to SA (Market Notices 55222 and 55358)1
› system strength constraints introduced in July 2017 involving constraints that limits the amount of wind output to as low as 1200MW depending on level of synchronous generation. (Market Notice 58845)1
46
1To locate market notices go to https://www.aemo.com.au/Market-Notices and search for market notice ID number

HoustonKemp.com
Relationship between wholesale prices and gas generation dispatch – Tasmania
• In Tasmania, we see a volatile relationship between wholesale price and gas dispatch driven by changes in the operating status of TV CCGT and TV OCGT.
• Key events include:
› Outage of Basslink from December 2015 to June 2016 which led to a return to operation of TV CCGT
› TV CCGT was subsequently returned from mothballing on an ongoing basis (as of March 2018 it is expected to return to mothballing in April 2018)1
› TV OCGT (58MW) returned to service from April 20161
47

HoustonKemp.com
Summary of analysis
• There is a strong nexus between the wholesale price when gas generators are
marginal and the spot price of gas
› Low and mid merit gas generators show a low sensitivity between the spot
price of gas and their marginal price
› ‘Peaker’ and ‘super peaker’ plants have a wider distribution of sensitivities
between the spot price of gas and their marginal price
• South Australia’s reliance on gas generation causes it to be very sensitive to the
spot price of gas
• Our analysis indicates that, on a short term basis, a $1/GJ change in short term
gas price would lead to monthly average changes in wholesale energy price
from $0.3/MWh to $3.60/MWh in NSW, and from $0.66/MWh to $11/MWh in SA
48

HoustonKemp.com
Summary of analysis (2)
• The nexus between the spot gas price and bidding behaviour is less clear
› the spot gas price affects different generators at different percentiles to varying degrees
› bidding functions can reflect decisions relating to more than gas cost, eg, minimum generation levels, engineering constraints and opportunistic behaviour
• All regions exhibit a positive correlation between wholesale spot price and gas dispatch
› the nature of the relationship is largely driven by technology types of generators and the position of gas plants in the merit order in the region
• Regions exhibit varying relationships between short term gas prices and gas dispatch
› in South Australia, we see a positive relationship
› in Queensland and New South Wales, no strong relationship exists, with the exception being 2017 in Queensland
› in Victoria and Tasmania, the relationship is more volatile, reflecting the small numbers of plants and their peaking operating status.
49

HoustonKemp.com
SydneyLevel 40 161 Castlereagh Street Sydney NSW 2000
Phone: +61 2 8880 4800
Singapore12 Marina View #21-08 Asia Square Tower 2Singapore 018961
Phone: +65 6653 3420
Contact Us
DisclaimerThis report is for the exclusive use of the HoustonKemp client named herein. There are no third party beneficiaries with respect to this report, and HoustonKemp does not
accept any liability to any third party. Information furnished by others, upon which all or portions of this report are based, is believed to be reliable but has not been
independently verified, unless otherwise expressly indicated. Public information and industry and statistical data are from sources we deem to be reliable; however, we
make no representation as to the accuracy or completeness of such information. The opinions expressed in this report are valid only for the purpose stated herein and as
of the date of this report. No obligation is assumed to revise this report to reflect changes, events or conditions, which occur subsequent to the date hereof. All decisions
in connection with the implementation or use of advice or recommendations contained in this report are the sole responsibility of the client.