Embed Size (px)
Citation preview

Impacts of GPS-RO on Typhoon Forecasts*
Bill Kuo *Contributions from UCAR COSMIC Team
Taiwan’s TTFRI, CWB, NSPO

Outline
• Advantages and challenges of using GPS RO for typhoon prediction
• Systematic evaluation of the impact of GPS RO on typhoon forecasts
• Impact of data QC in the lower tropical troposphere
• Challenges of medium range tropical cyclone prediction
• Concluding and outlook

GPS RO observations advantages for tropical cyclone prediction
• There are considerable uncertainties in global analyses over the tropics.
• COSMIC provides globally uniform distribution of GPS RO data • GPS RO observations are of high vertical resolution and high
accuracy. • GPS RO is an active sensor, minimally affected by clouds and
precipitation • GSP RO advantages for tropical cyclone prediction:
– Water vapor: Important for convective development, genesis, intensity, track and precipitation forecast
– Temperature: Important for large-scale circulations, and affect longer range track forecast

4-Day Ernesto (2006) Forecasts with WRF-ARW Forecast with
GPS Forecast without
GPS The Actual
Storm
Liu et al. (2012, MWR)

Assimilation of GPS RO substantially reduces model dry bias
Verification of WRF/DART analysis by about 100 dropsondes during the Ernesto genesis stage.

Low-level moisture change by assimilating GPS
Assimilation of 1 GPS RO sounding in the vicinity of Hurricane Ernesto caused a 1.8g/kg increase in moisture at 1.5 km. This was enough to get the hurricane genesis going.

48h-forecast of SLP (starting at 00UTC 25 August)
August 2006 OBS: Observed storm CTRL: No GPS RO assimilation RO: Assimilation all RO data RO6km: No RO data below 6km RO2km: No RO data below 2km
Lower troposphere observations (below 6 km) most critical to hurricane prediction
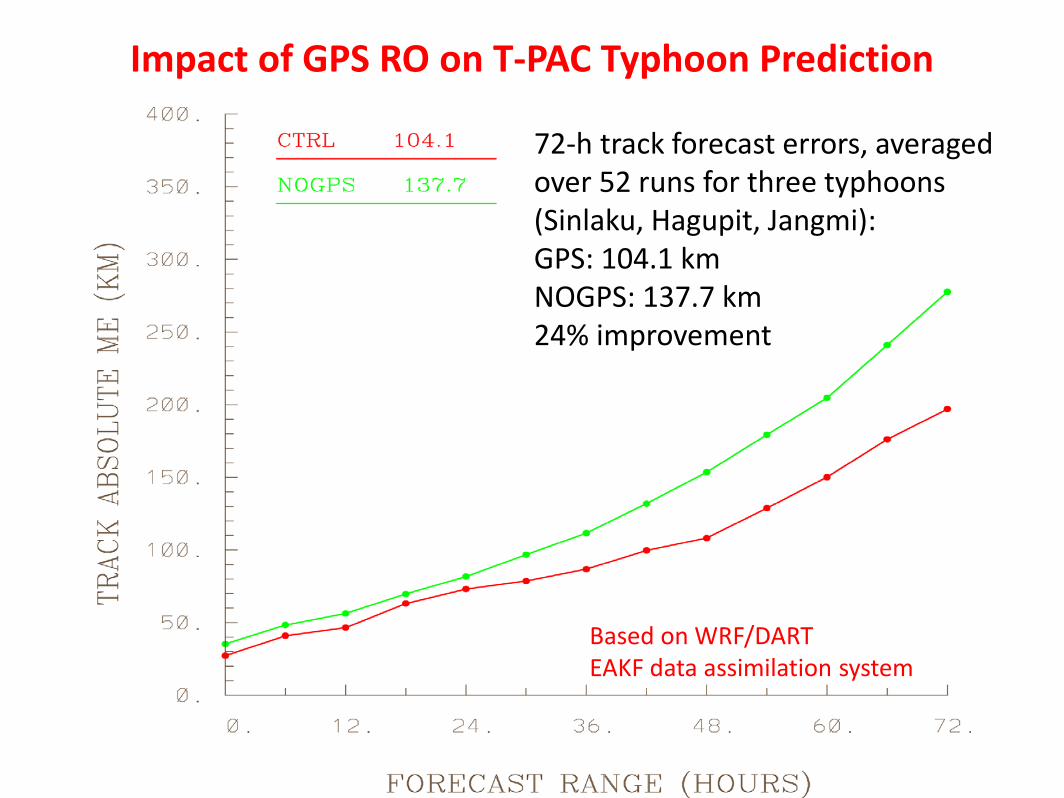
Impact of GPS RO on T-PAC Typhoon Prediction
SINLAKU
JANGMI
HAGUPIT
ALL 3 TCs
72-h track forecast errors, averaged over 52 runs for three typhoons (Sinlaku, Hagupit, Jangmi): GPS: 104.1 km NOGPS: 137.7 km 24% improvement
Based on WRF/DART EAKF data assimilation system

TTFRI performed systematic evaluation of GPS RO impact on track forecast of 11 Typhoons (2008-2010), for a total of 300 cases (analysis-forecast cycles), under sponsorship of NSPO.
Taiwan’s CWB operational Typhoon WRF model, 45 km, 45 level. Partial cycling data assimilation over a 12-h period, starting at -12h using NCEP GFS analysis.

Impacts of GPS RO on typhoon track forecasts • PNG: Assimilation of conventional observations, cloud
track winds, SATEM thickness, NO radiance, NO GPS RO • PWG: PNG + GPS RO

Impact on track forecast
Larger impact on cross-track prediction than along track prediction

Systematic impact on 500 mb height and circulation
Assimilation of GPS RO produces a stronger subtropical high over the western Pacific, which can exert significant impact on typhoon track
500hPa GeoptH &
Wind

Heights where GPS-RO is reducing
the 24hr errors
0 1 2 3 4 5 6 7 8 9 10
23456789
1011121314151617181920212223242526272829303132333435363738394041424344454647484950
FEC %
km
Lower troposphere is critical for hurricane prediction. Yet, global NWP seeing little or no contributions.
7-35 km height interval is sometimes called the GPS-RO “core region”.

Can we improve the impact of GPS RO data through better QC?

Distribution RO data with confidence parameter (Spaghetti distribution for all RO profiles in Western Pacific, Sept. 8-10, 2008)
CP1 = (P1-P2)/P1 (%), where P1 and P2 are powers of the 1st and 2nd maximum local spectral component. (See Sergey’s talk) The RO data with CP1 < 30% are most located below 4km.

Distribution RO data with confidence parameter (CP1 < 30% at 2km, Sept. 8-10, 2008)
The RO data with CP1 < 30% are most located over ocean and affected by moist convection

Distribution all available RO data (Sept. 8-10, 2008)

RO data comparison with ECMWF analyses (Sept. 2008)
Experimental RO data with Radio-holographic (RH) filtering are used. Impact of the truncations by the CP is mainly evident below 2km. This suggests that RO data above 2km are good after application of the RH filtering.
Truncate GPS RO data based on confidence parameter (CP) changes BA biases relative to ECMWF global analysis.

Assimilation experiments design WRF/DART cycling assimilation 6-hourly during September 4-28, 2008 An experimental RO data set with Radio-holographic (RH) filtering and a
relaxed truncation in lower troposphere RO bending angle data between 0-10km is assimilated RO bending angle data is customized filtered consistent with WRF vertical
grid (Liu et al., 2014a) The CDAAC local bending angle forward operator is used 6h-forecasts are verified to RO and radiosonde observations over Western
Pacific (120E – 165E, 0 -30N) over the assimilation period A set of assimilation experiments are performed: CP00 run: Radiosondes, cloud winds, aircraft data, land and ship surface
pressure data, SATEM, and RO bending angle data; No CP check CP30 run: Same as CP00 run but reject RO data with CP < 30% below 2km CP40 run: Same as CP00 run but reject RO data with CP < 40% below 2km CP50 run: Same as CP00 run but reject RO data with CP < 50% below 2km

6h-Forecasts fits to RO refractivity data (CP checks below 2km)

Radiosonde used for verification of 6h forecasts

6h-Forecasts fits to radiosonde water vapor (CP checks below 2km)
• Biases of CP30, CP40, and CP50 are closer to CP00 • RMSEs of CP30, CP40, and CP50 are all smaller than CP00

6h-Forecasts fits to radiosonde water vapor
• Biases of CP30 is largely removed by the new shallow convection scheme • GPS RO ‘negative N bias’ may be partially attributable to model errors
CP30N includes a new shallow convection scheme from YSU. Otherwise, everything is the same as CP30

Impact on track forecast of 2008 Typhoons 72-h track forecast errors, averaged over 52 forecasts for the three typhoons (Sinlaku, Hagupit, Jangmi): CP30 has the smallest track error, CP50 the largest. CP00: 119.6km; CP30: 114 km ~ 5% reduction
Data truncation using CP is useful, and there is an optimal choice (CP1 = 30%)

42
Notable Change in Trend of NCEP GFS Track Errors
2012 Atlantic Basin
HFIP goal: Extending hurricane forecast out to 7 day Little improvement found beyond Day 4

Diagnosis of GFS Forecast Error for Hurricanes Season of 2012
• GFS forecast error growth from Day 1 through Day 8: – Seasonal mean: Averaged over 92 days, 1 August –
31 October 2012 – These errors represent model systematic errors.
They depend only on forecast lead time, not the time of model initialization.
43

GFS forecast 500 hPa H (Day1 to Day8) 92-day mean: Aug.1-Oct.31, 2012
D1
D3
D2
D7
D5 D6
D4
D8
Pattern deamplifies with increasing forecast lead time 44

45
Analysis
96-h
168-h
GFS 250 hPa ζ, Vir, and 500 hPa ω: 92-day Mean 1 Aug–31 Oct 2012 • Decrease in tropical
convection overall with increasing lead; most notable over WPAC and EPAC
• Decrease in irrotational wind connecting tropics and midlatitudes
• Suggests connection
between reduced tropical convection and decreased amplitude of midlatitude waveguide
Pa s−1

Energetics: Eddy Kinetic Energy
46
GFS Forecast Northern Hemisphere Eddy Kinetic Energy
Date (mmddhh)
Compute over latitude band 20°–85°N
• Northern Hemisphere KE increases during Aug-Oct
• Systematic reduction in KE in GFS forecasts
• Reduction in KE increases with forecast lead
• Suggests synoptic-scale eddies too weak in GFS forecasts more difficult to maintain amplified (or even blocked) flow
• Consistent with time-mean DT jet/waveguide that is more zonal in GFS forecasts
Lorenz (1955):

Tropical Convection: Aug–Oct 2012
47
GFS Analysis GFS 168-h Forecast
Pa s−1
5–15°N latitude band

mm
24-h error
96-h error
168-h error
GFS PW

49
Analysis
96-h
168-h
GFS 250 hPa ζ, Vir, and 500 hPa ω: 92-day Mean 1 Aug–31 Oct 2012 • Decrease in tropical
convection overall with increasing lead; most notable over WPAC and EPAC
• Decrease in irrotational wind connecting tropics and midlatitudes
• Suggests connection
between reduced tropical convection and decreased amplitude of midlatitude waveguide
Pa s−1
Region for Model Error Diagnosis

Mean Error for August Mean Error for Aug
Temperature (k) Water Vapor (g/kg)

Equivalent Potential Temperature (k) Vertical motion (Pa s-1)
Mean Error for August Mean Error for Aug
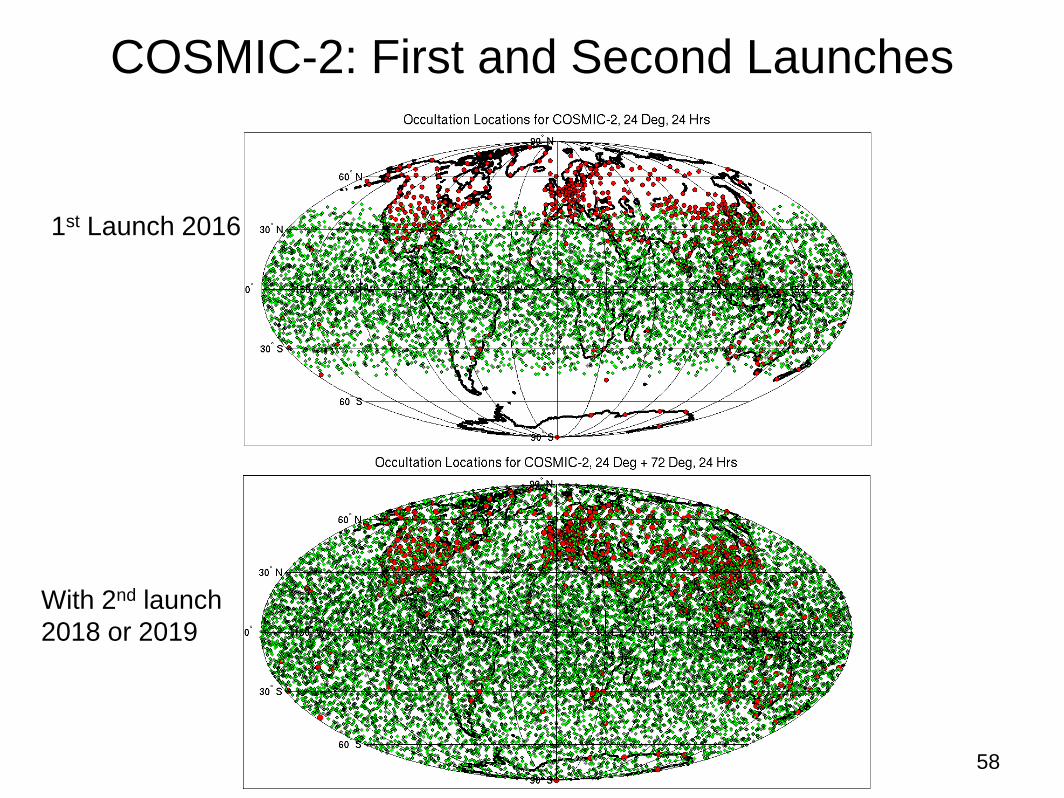
COSMIC-2: First and Second Launches
58
1st Launch 2016
With 2nd launch 2018 or 2019

Summary • GPSRO observations:
– Provide three-dimensional water vapor and temperature information over the tropics
– Improves hurricane genesis, intensity, and track forecasts – Data below 6-km is most critical
• UCAR CDAAC will provide data QC parameters in new processing (i.e., CP, Obs error) – BA assimilation experiment shows that data truncation using
CP parameter is useful – Next step: experiment with obs errors
• Improving WRF model’s shallow convection substantially reduced biases in O-B – Some of the GPS RO negative N bias below 2-km may be
attributable to model errors
Summary • NCEP GFS global model has shown only small
improvement in hurricane track forecast beyond Day 4, with notable systematic errors: – Decreased tropical convection weakened eddy kinetic
energy weakened (deamplified) synoptic scale circulations significant hurricane track errors
– GPS RO may be used to diagnose and improve model physical parameterization
• COSMIC-2 GPS RO observations over the tropics will provide an opportunity to significantly improve tropical cyclone prediction: – Improved initial conditions through data assimilation – Better understanding and diagnosis of sources of model
biases, necessary to improve medium range forecast of tropical cyclones